Article

Park Recreation Intention and Satisfaction of Blue-Collar Workers Based on the ACSI Model: A Case Study of Anning Industrial Park in Yunnan

1
Shenzhen Key Laboratory of Built Environment Optimization, Shenzhen University, Shenzhen 518060, China
2
School of Architecture and Urban Planning, Shenzhen University, Shenzhen 518060, China
3
School of Urban Design, Wuhan University, Wuhan 430072, China
*
Author to whom correspondence should be addressed.
Land 2023, 12(4), 798; https://doi.org/10.3390/land12040798
Submission received: 14 February 2023 / Revised: 27 March 2023 / Accepted: 30 March 2023 / Published: 31 March 2023
(This article belongs to the Special Issue Urban Green Space Use Behaviours and Equity)

Abstract

:
The negative effects of long working hours and shift work on the physical and mental health of blue-collar groups should not be underestimated. Under intense stress, they have limited time to access recreational green space, and their own health is thus affected. In this study, a conceptual model of recreational satisfaction among blue-collar workers was established based on the American Customer Satisfaction Index (ACSI). The model explores the factors affecting their level of satisfaction when using recreational spaces. Anning Industrial Park in Yunnan Province was used as an example. User data were collected and analyzed using a questionnaire survey and structural equation methods. The results indicate that recreation intention, perceived park quality characteristics, and perceived value all had significant and positive effects on the park recreation satisfaction of blue-collar workers. This study applied social economics theory to the field of landscape planning, identified the typical characteristics of blue-collar workers and their green space use, and strived to optimize the UGS configuration and functional facilities through the evaluation of recreation satisfaction indexes, which provided guidance and reference for improving the service quality of green spaces.

1. Introduction

An increasing number of studies indicate that contact with urban green space (UGS) is beneficial to human health. UGS is an essential part of the urban environment and can reduce the negative environmental impact on urban residents by lessening air pollution [1], mitigating the urban heat island (UHI) effect [2], and decreasing noise [3]. Several mechanisms have been proposed to explain the association between green space and health, and one of these is the restoration theory, based on the idea that it is possible to increase mental health and decrease stress by visiting a natural environment [4]. In the field of psychological health, many studies have confirmed that spending time in natural areas such as parks and green spaces can help to reduce loneliness, alleviate mental stress, and improve sleep quality, thereby lowering the risks of depression and anxiety and enhancing well-being [5,6]. Moreover, compared to the built environment, short-term visits to natural spaces are more likely to reduce mental stress and have a positive effect [7]. Studies related to physical health have also suggested that UGS can reduce the incidence of diseases such as obesity [8], cardiovascular diseases [9], and diabetes [10] to some extent. Furthermore, UGS is beneficial to social health by providing an environment for people to meet and communicate, which facilitates their participation in social activities and enhances social cohesion [11].
Recreational satisfaction (the combined degree of visitor expectations and recreation quality) is often used to assess the recreation experience. Satisfaction may vary according to individual preferences, expectations, perceptions, and motivations. Current research on recreation satisfaction takes mainly three directions: first, investigating the status quo of park recreation so as to optimize park design [12]; second, designing related tourism products based on recreation activities [13]; and third, focusing on visitor behaviors and exploring the factors influencing their recreational satisfaction, such as their psychological expectations of tourist destinations [14], park quality, and frequency of use [15]. It has been found that individual characteristics [16], sign systems [17], cultural resources, and landscapes [18] can all influence recreation satisfaction. In recent years, studies in this area have also started to consider the equity of green spaces, focusing mostly on residents [19], the elderly [20], and children [21], while paying less attention to blue-collar groups.
According to the 2021 Report on the Monitoring Survey of Migrant Workers by the National Bureau of Statistics of China [22], the total number of migrant workers in cities has reached 292 million in China (6.91 million more than that in 2020), representing a substantial increase in the total number. The proportion of migrant workers engaged in secondary industries is 48.6%, 0.5% higher than in 2020 (including 27.1% in manufacturing and 19.0% in construction). Current studies conducted based on this population mainly involve sociological, psychological, and medical fields, mainly exploring their vulnerability [23], social stress, and status [24]. Studies related to group satisfaction are also mainly about job satisfaction [25], rather than park recreation satisfaction.
The research group of this study is more in line with the classification of blue-collar workers. Blue-collar workers are those that are mainly engaged in industrial, engineering, or manual work, and are typically represented by frontline operators in factories. Most studies show that blue-collar workers often work in hazardous industries or jobs that require heavy physical labor, such as construction and agriculture. The current study group included occupational workers working in steel and chemical plants with tasks in a workshop environment (operational, mechanical, maintenance, electrical, etc.). During the questionnaire distribution process, it was established through interviews that the blue-collar group in this study were all from towns (small cities), not from rural areas, had literacy skills, and had an overall consistent level of cognition. Researchers across multiple disciplines have reported that blue-collar workers are especially likely to experience discrimination [26], marginalization [27], employment insecurity, and uncertainty [28]. They are also likely to have limited access to healthcare benefits and training [29]. In addition, as blue-collar worker groups mostly work in noisy and poorly conditioned production workshops, they often face more challenges and threats to their physical health than white-collar workers [30]. Most of the current research has focused on both comparative studies of the health status and condition of this group, and subjective perception ratings (including satisfaction, health self-assessment, etc.). In comparison to male blue-collar workers or other women, female blue-collar workers have a poorer health status [31]. A synthesis of the literature in recent years reveals that there is a large influence of environment on subjective perception ratings, while more often explored are the work environment, temperature, humidity, and noise [32]. Research on parks is inadequate and focuses more on productivity-related factors of the blue-collar group rather than on leisure and recreation indicators and park satisfaction factors. In studies on Chinese industrial parks, which are workplaces for this group, the areas of sustainable development of the parks [33], industrial product emissions [34], and pollutant management [35] are mainly covered, and less attention is paid to the internal green environment.
In recent years, research on the evaluation of satisfaction with green space parks has flourished and can be divided into two main dimensions: one is the spatial dimension, exploring the correlation of factors affecting the outdoor environment of parks, such as the site and facility configuration [36], signage system [17], hard landscape color [37], and the degree of soundscape tranquility (STD) [38], with satisfaction; the second focuses on different group characteristics, such as residents [39], tourists [40], parent-child families [41], and the elderly [42], to evaluate the factors affecting satisfaction with UGS. It can be seen that for blue-collar groups, investigations on their environmental assessment and satisfaction after use are relatively scarce, focusing mostly on exploring outdoor environmental factors and a specific group. The features of different types of people are essential aspects influencing the satisfaction and perceived environmental quality of residents with UGS and cannot be ignored. Research targeting specific groups is conducive to improving the public image of urban park systems, increasing park visitation rates, and maximizing park benefits.
“Happiness” indicates an individual’s assessment of his or her overall quality of life, and the term is often used interchangeably with “life satisfaction”. It is worth noting that happiness has been widely researched by both domestic and international scholars, including the measurement of happiness and the analysis of influencing factors. The following tools have been widely used by many scholars to study happiness in recent years (Table 1). Recently, Chen et al. used SWLS to measure the happiness of couriers, delivery workers, and online taxi drivers in Hangzhou, China, to analyze the factors affecting happiness [43]. Taking Guangzhou, China, as an example, Liu et al. concluded that SWLS can effectively assess the happiness of migrant workers and found that the absolute economic disadvantage of migrant workers was negatively related to their subjective happiness [44]. Liu et al. combined SWLS and PANAS to measure happiness and found that the happiness of the migrant population was lower [45]. Taking Zhejiang Province as an example, Xing et al. confirmed that the Multiple Happiness Questionnaire (MHQ) had good reliability and validity in assessing the happiness of migrant workers, and that the happiness of the new generation of migrant workers is significantly higher than that of the first generation [46]. Lee and Zhao concluded that the General Health Questionnaire (GHQ) had wide applicability in assessing happiness. In addition, happiness was higher among those who were married, healthy, and had high household income [47]. From the above analysis, it can be concluded that there are few studies that directly address the well-being of blue-collar workers in China.
In addition, for park satisfaction studies, some scholars [48] linked the park visitation and park satisfaction (dependent variables) measured by different data sources with seven spatial factors (independent variables) through generalized linear models (GLMs) and analyzed the similarities and differences between the influencing factors of park visitation and park satisfaction. They provided a comparative perspective by assessing the correlations between the social media data and official survey data. However, this study differs from the above studies in that it considers parks as a special product service, explores the satisfaction of blue-collar workers with this special service commodity, and collects data for evaluation through the distribution of research questionnaires. As a macro index that measures the quality of economic output, ACSI [49] is a comprehensive evaluation of customer satisfaction based on the consumption process of products and services, which has been extensively used to measure satisfaction and loyalty at the national, industry, and company levels. It is often used to explore the field of the market economy [50]. Moreover, it has been applied to transportation and daily travel [51], tourism services [52], e-services [53], public administration [54], and insurance services [55] in recent years. At the same time, the ACSI model is considered by many scholars to be a widely available tool that is useful and simple, and has been used frequently in relevant studies in China. In addition, the model has now been extended to measure customer satisfaction with various products and services, including specific public services such as green space. The study of green space use and inequality is an important research topic of global significance, irrespective of national boundaries and regions. Therefore, this study adopts a globalized customer satisfaction index model, adapting and complementing it with elements of park characteristics. Methodological innovations and empirical additions are attempted in order to build on the current study.
In general, there are abundant study results on recreation satisfaction. However, cross-sectional research using the ACSI model in this field and blue-collar worker groups still requires further exploration. This study attempts to apply the ACSI model in the field of social economics to landscape planning and build an SEM of the park recreation satisfaction level of blue-collar workers, taking into account the elements of variables to provide measures as a reference to improve the recreation satisfaction of blue-collar workers. The structure of the research in this paper is shown in Figure 1. At the same time, this study takes Anning Industrial Park as an example to summarize the typical group characteristics of blue-collar workers based on underprivileged social groups and further conducts the multi-group analysis of actual green space use behaviors to promote equity in the use of green space resources. From the perspective of users, this study proposes corresponding optimization strategies for the planning and design of green spaces in industrial parks, as well as new research ideas and optimization directions for the planning of UGS and parks.

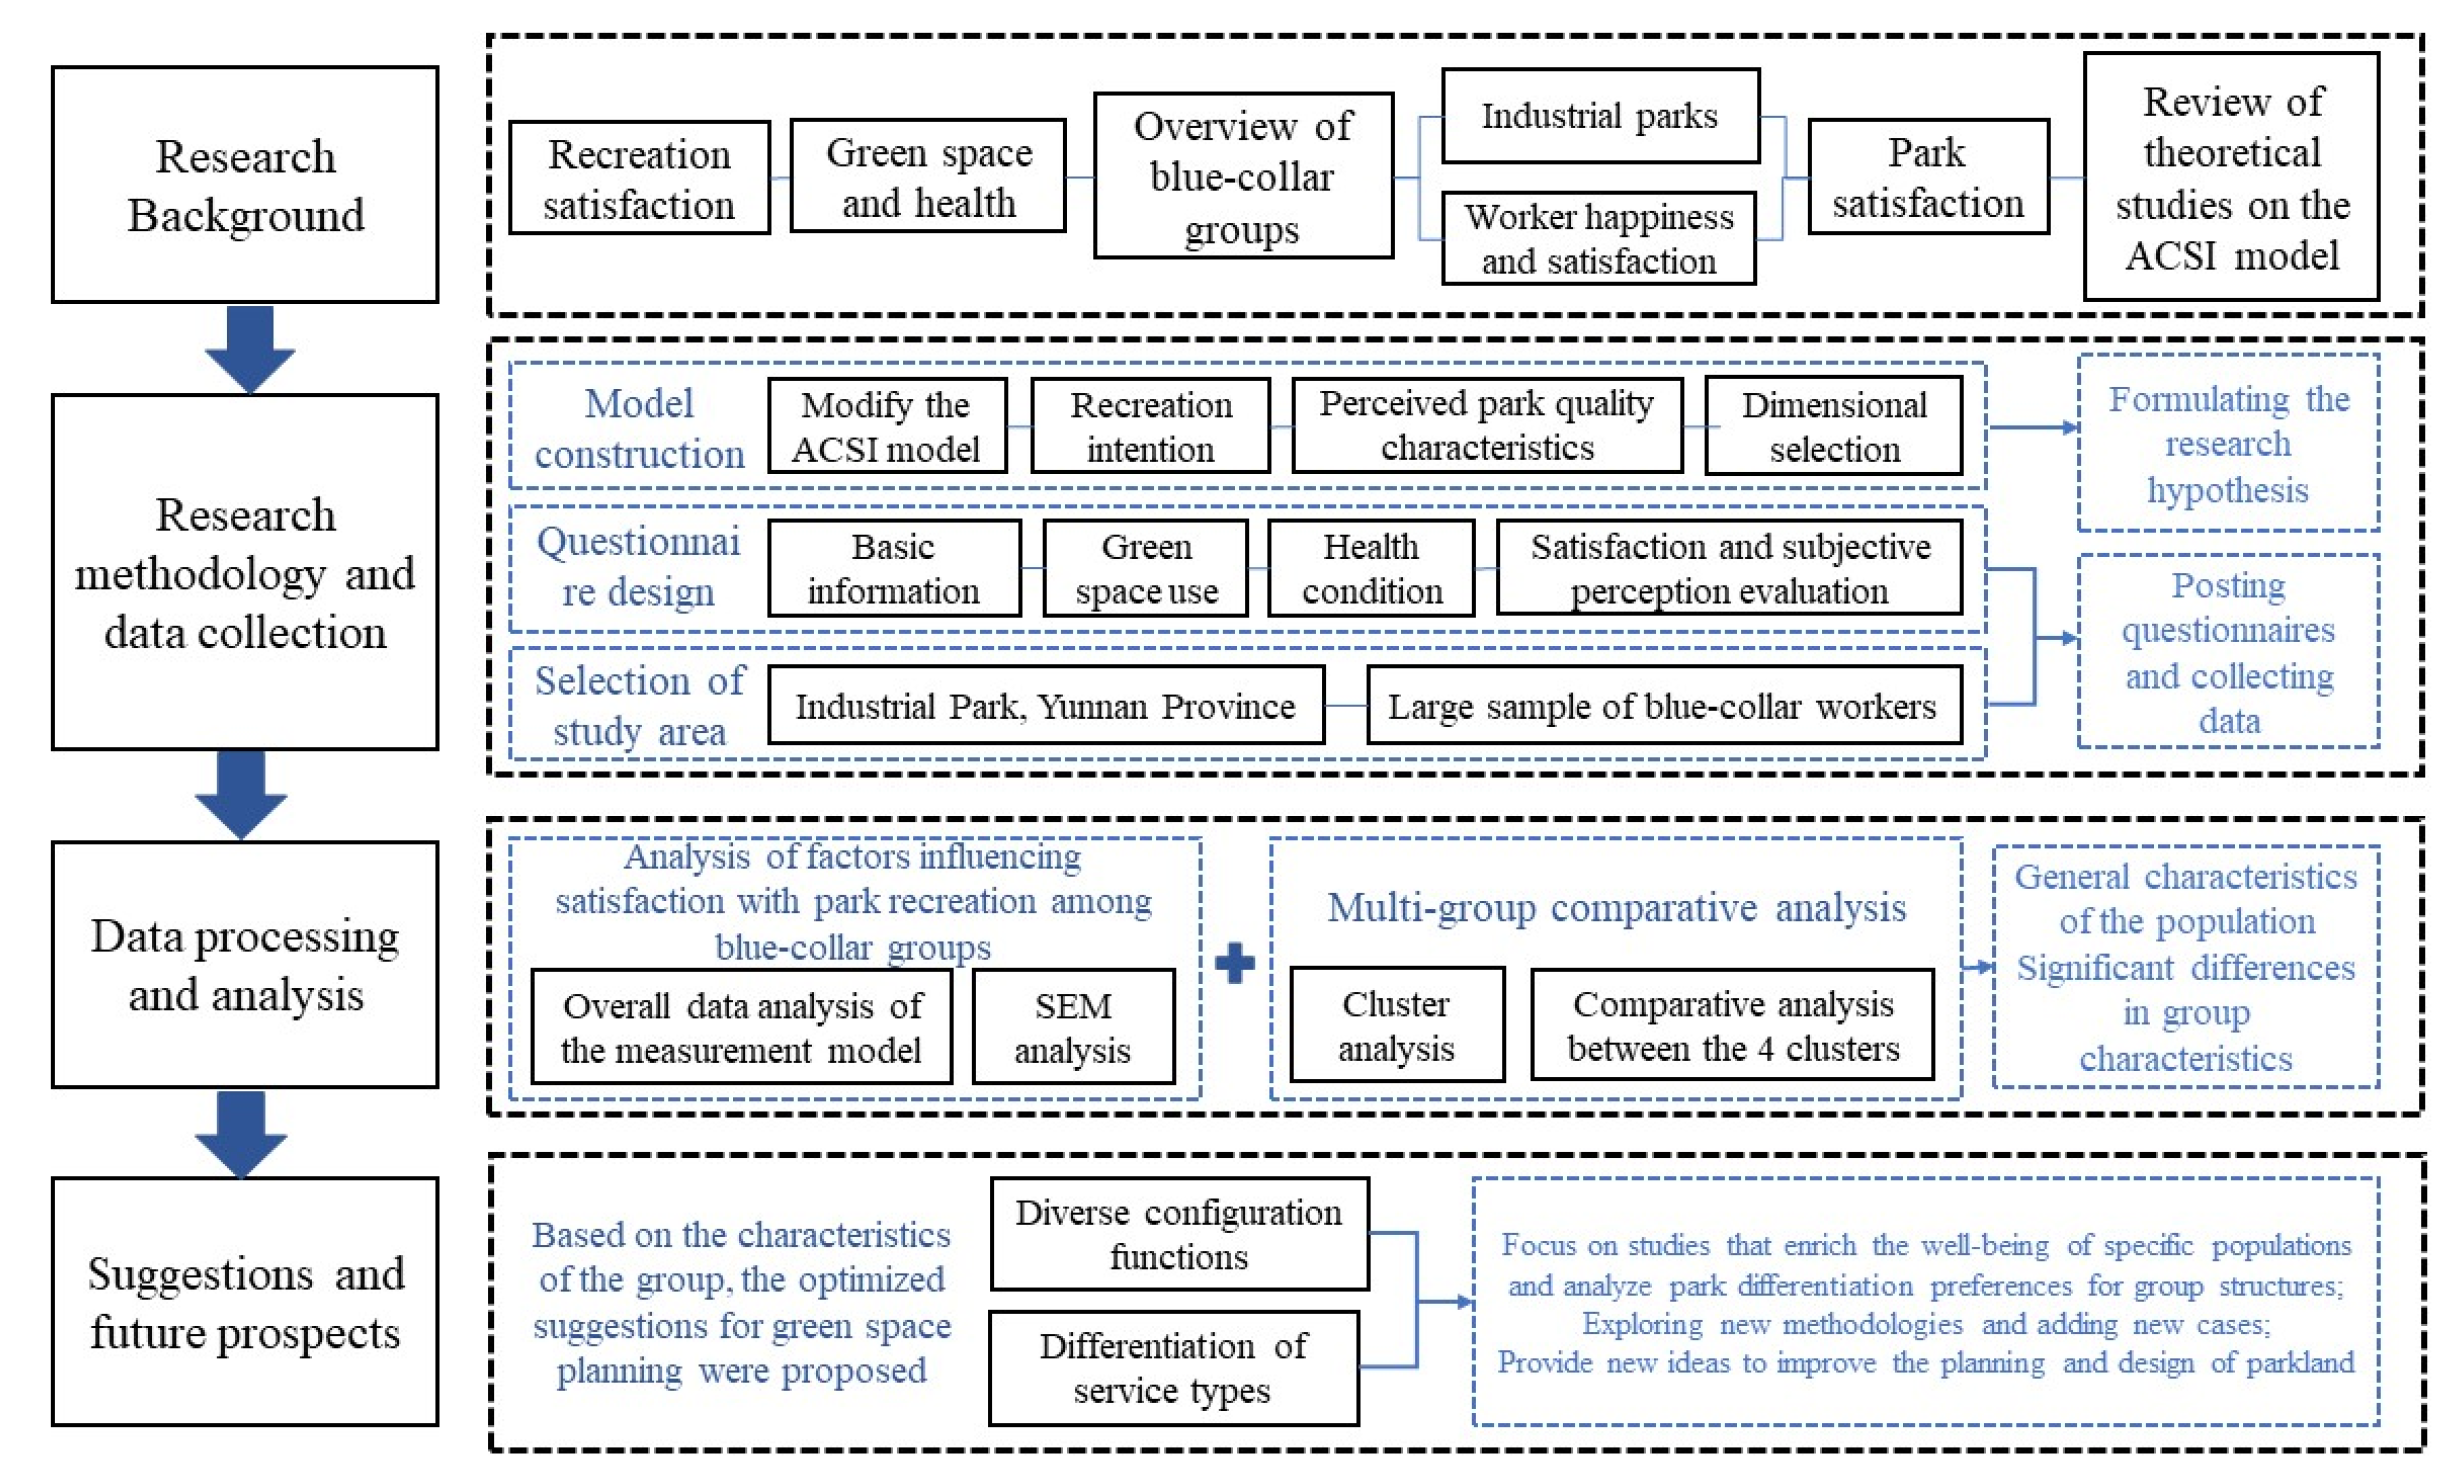
2. Research Methodology

In this study, a park recreation intention and satisfaction model based on ACSI was first constructed for blue-collar worker groups, and research hypotheses were proposed. Subsequently, the relevant questions were prepared according to the research object, i.e., blue-collar worker group; research questionnaires were distributed, and the reliability of questionnaire content and data was verified by means of statistical and structural equation analysis methods. Then, descriptive statistical analysis, analysis of variance (ANOVA), correlation analysis, and tests on reliability and validity were conducted by AMOS24, SPSS26, Excel 2016, and R Studio to explore the factors affecting the recreation satisfaction of blue-collar worker groups. The patterns of green space were then used by different groups of blue-collar workers as summarized through cluster analysis and multi-group comparison to investigate the patterns and characteristics of green space use by blue-collar workers. Finally, based on the behavioral characteristics of green space use by the four categories of blue-collar workers, their perceived quality evaluation of park green space was combined to identify their specific demand for UGS parks and put forward targeted suggestions for the optimal design of green spaces.

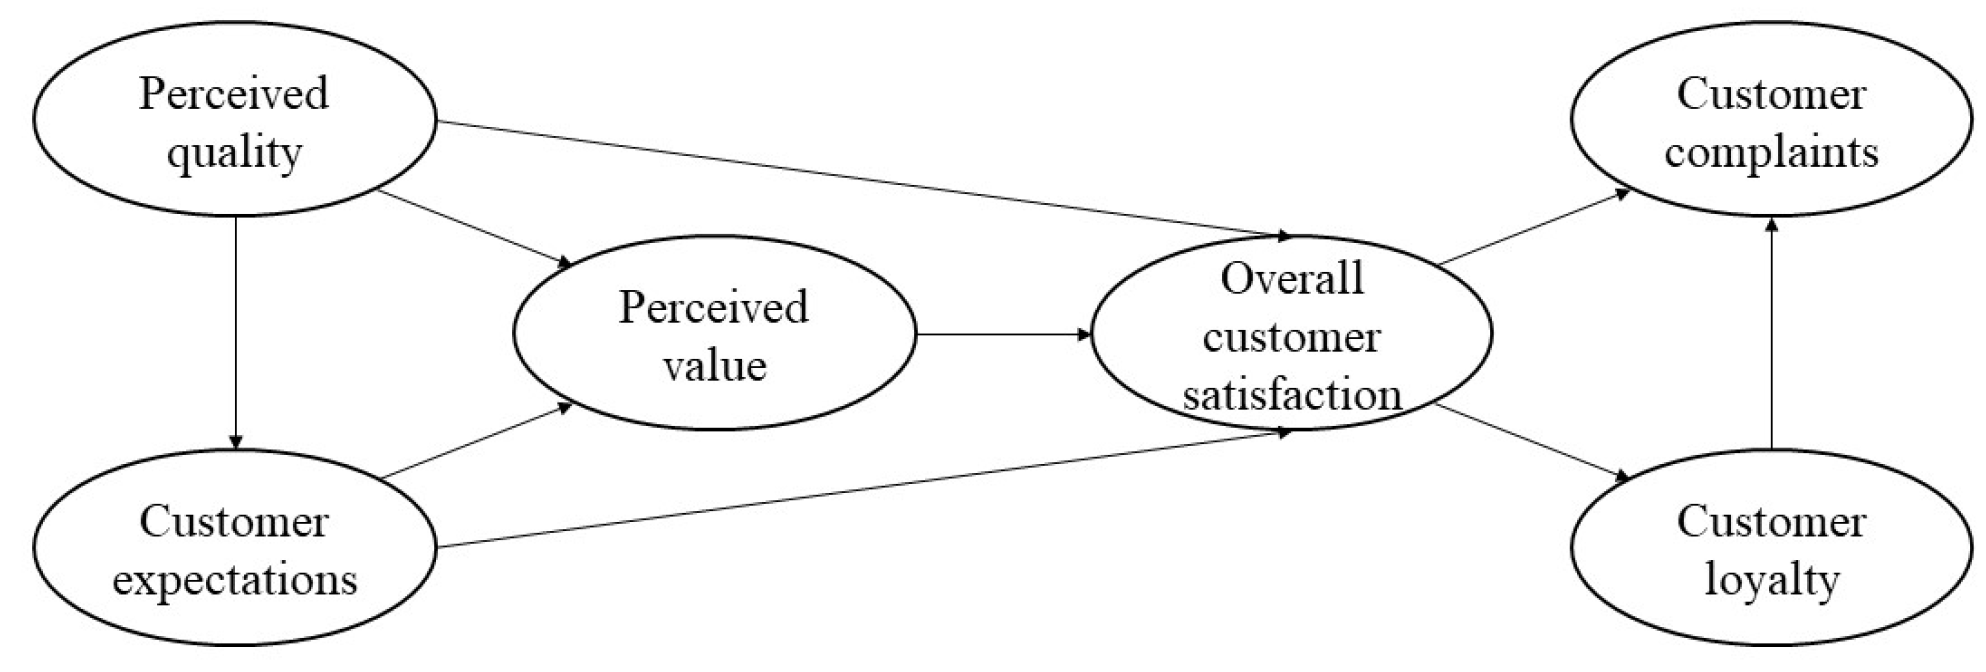
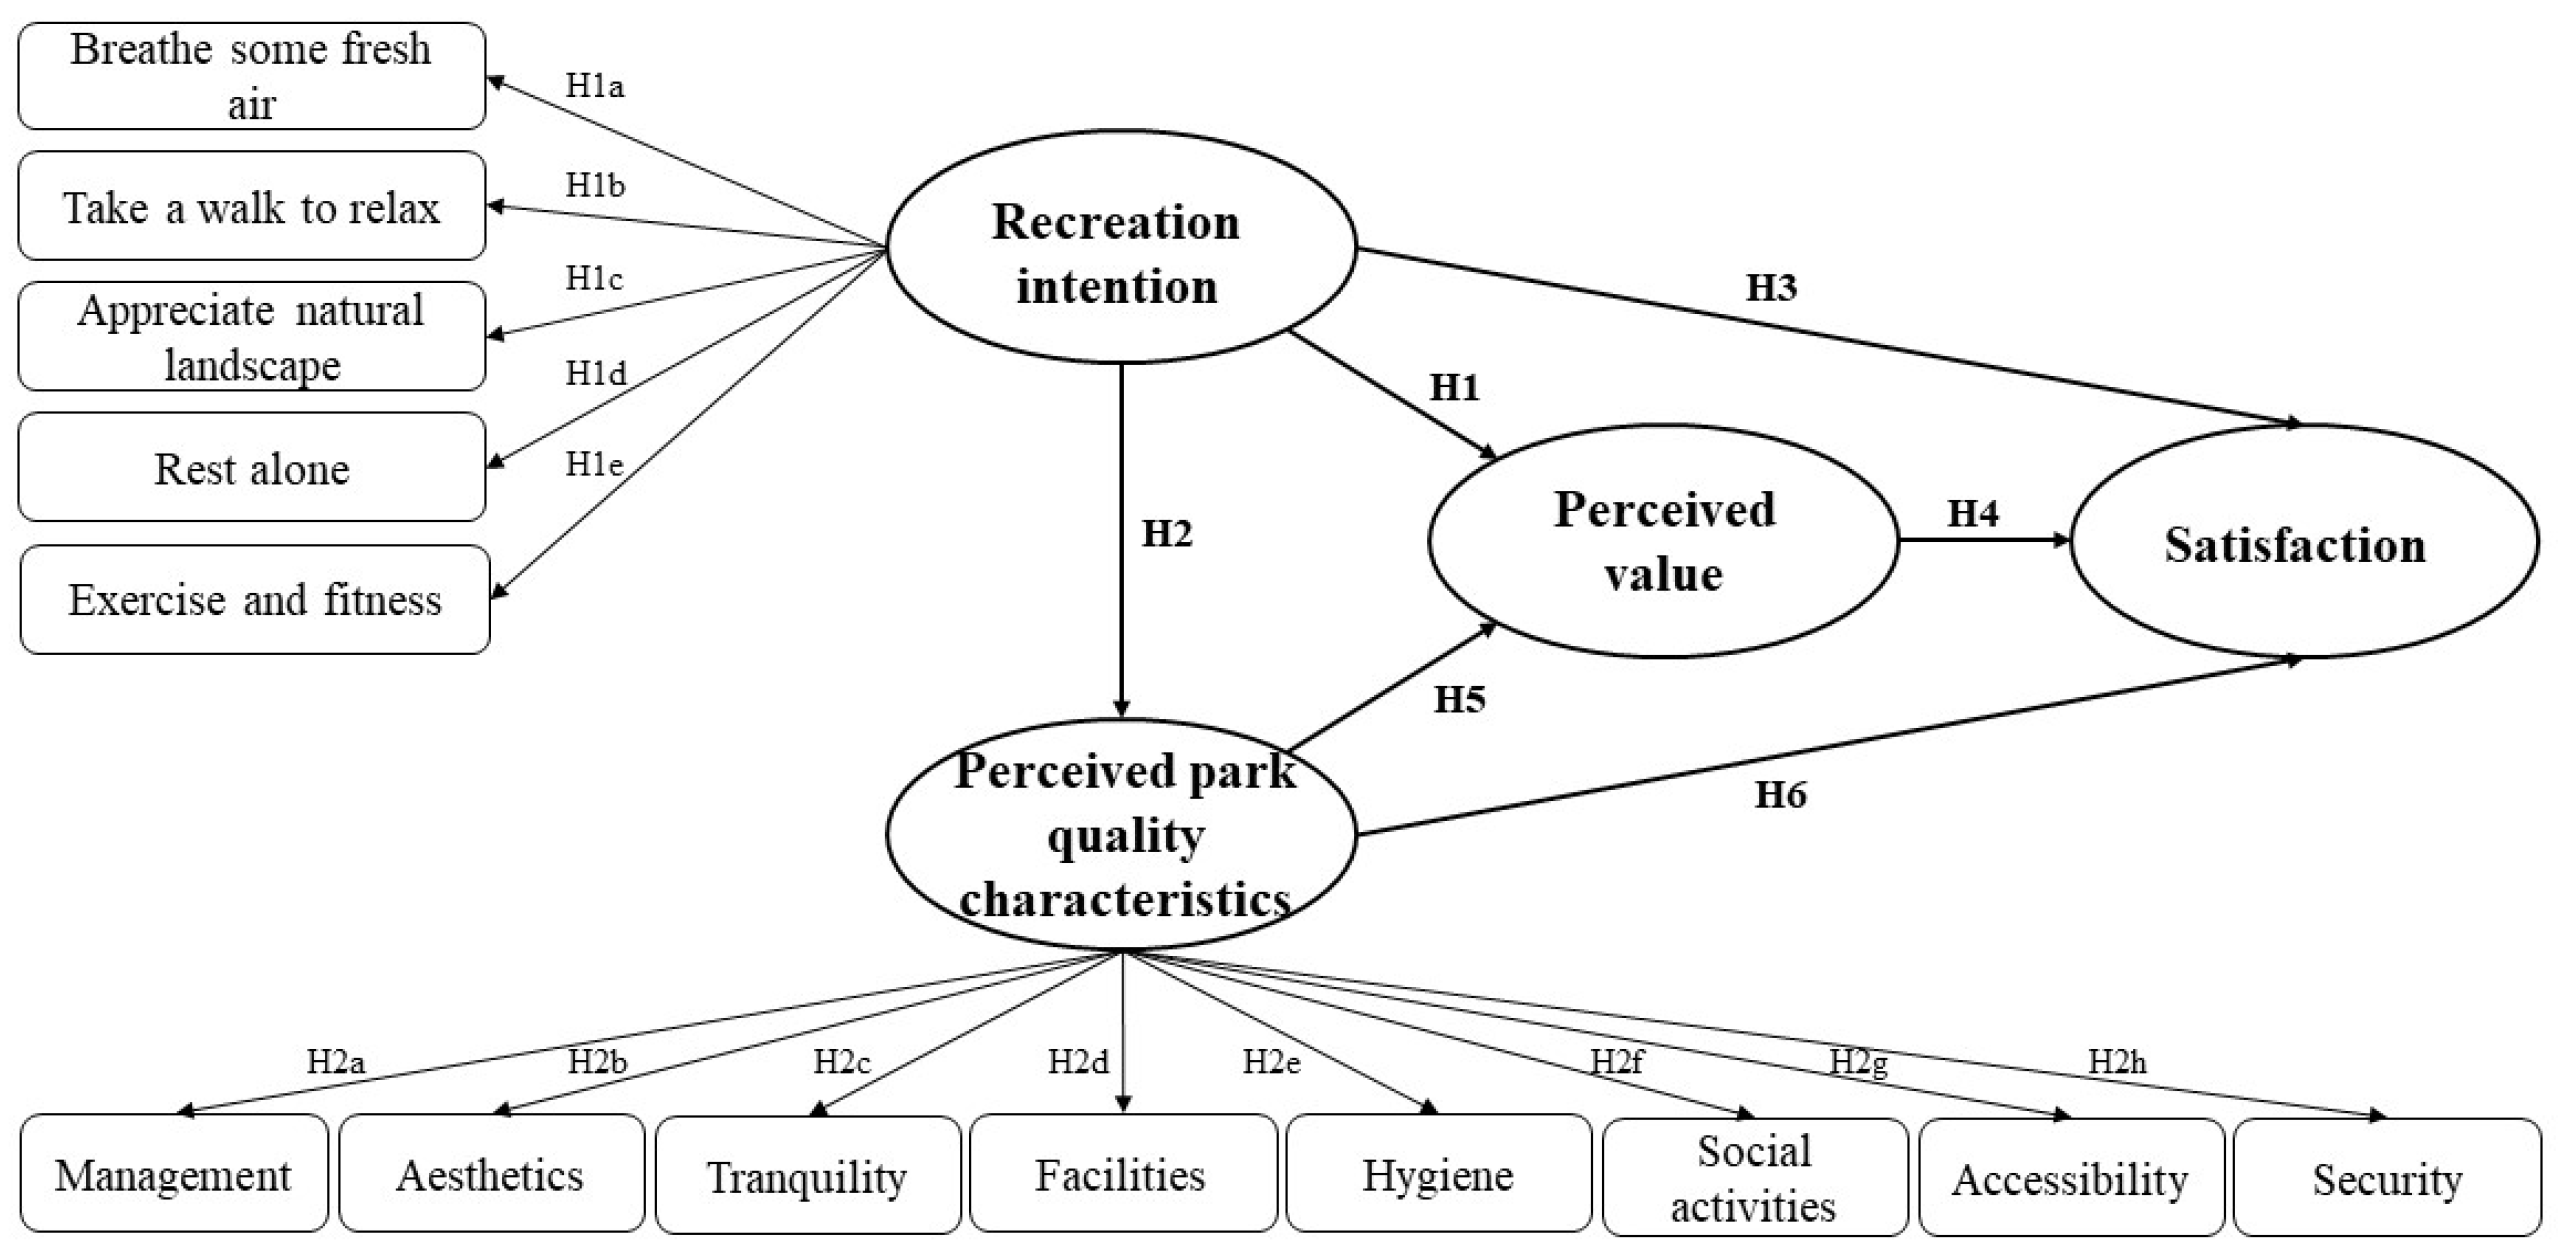
2.1. Construction of Research Model and Proposal of Research Hypotheses

The ACSI model measures the cause-and-effect relationship that runs from the antecedents of customer satisfaction level (customer expectation, perceived service quality, and perceived value) to its consequences (customer complaints and customer loyalty), as shown in Figure 2.
The ACSI model focuses more on analyzing products and services from the perspective of satisfaction, while the green spaces and parks in this study are not products or services in the general sense, but special types of public services. The variables and dimensions in the original model cannot be directly applied to the present model. Therefore, the ACSI model was adjusted according to the content and purpose of this study to build the research model with the architecture in Figure 3. Two variables (recreation intention and perceived park quality characteristics) were introduced based on the framework of the original model, and two original variables (perceived value and satisfaction) were retained.
Many tools for evaluating the micro characteristics and restorative effects of the environment have been proposed and implemented [56,57,58,59,60]. These have contributed to a more comprehensive picture of green space and its consequent psychological benefits. The most typical and widely used tools are the perceived sensory dimensions (PSDs) proposed by Grahn [61] and the perceived restorativeness scale (PRS) proposed by Hartig [62]. Grahn summarized the PSDs as the eight different sensory experiences people obtain from interacting with the natural environment, including serene, nature, rich in species, space, prospect, refuge, social, and culture. On the other hand, Hartig described PRS as the capacity of an environment to induce a restorative effect through the facilitation of the feeling of fascination, being away, extent, and compatibility. PSDs focus on the sensory attributes of the environment that contribute to an individual’s overall impression of the space, while PRS focuses on the restorative potential of the environment and its ability to promote psychological well-being. For the measurement of perceived park quality characteristics, this study drew on the PSDs proposed by Grahn to assess the quality of UGS. Based on the current literature, eight dimensions (management, aesthetics, tranquility, facilities, hygiene, social activities, accessibility, and security) were proposed through pilot research to identify the demands of blue-collar worker groups for green space use.
  • Recreation intention: Refers to the intrinsic needs and motivations of users to use green spaces, i.e., the basic characteristics of user travel intention, preferences, revisit intention, recreation frequency, and recommendation intention. It represents users’ most direct perception of their physical and mental health and affects their attitude and behavior towards green spaces.
Hypothesis 1 (H1). 
Recreation intention has a significant positive effect on perceived value.
Hypothesis 2 (H2). 
Recreation intention has a significant positive effect on the perceived quality characteristics of parks.
Hypothesis 3 (H3). 
Recreation intention has a significant positive effect on satisfaction.
2.
Perceived value: Users’ perceived value includes the assessment of functional aspects (such as quality of facilities, green space value, convenience) and emotional aspects (such as social situation and emotional state). Perceived value reflects the subjective feelings of blue-collar workers about park recreation after measuring the quality of a green space/park and the purpose of visiting the green space.
Hypothesis 4 (H4). 
Perceived value has a significant positive effect on satisfaction.
3.
Perceived park quality characteristics: High-quality parks and their facilities are essential to encourage the use of green spaces. The use frequency of green spaces depends on a range of factors, including the physical attributes and quality of green space and its context. Some studies have also highlighted a strong correlation between visitor use patterns and urban park components (such as distance, amount of vegetation, security, quality, and hygiene) [63].
Hypothesis 5 (H5). 
Park quality characteristics have a significant positive effect on perceived value.
Hypothesis 6 (H6). 
Park quality characteristics have a significant positive effect on satisfaction.
4.
Satisfaction: Satisfaction evaluation is a subjective conclusion based on users’ own recreational needs and the balance between the supply and demand of the destination. Recreation satisfaction is the evaluation result of users’ subjective perception of the environment through environmental characteristics, environmental perception, and honest feedback, which can reflect the demands of urban residents and the deficiencies of parks. The level of satisfaction can affect users’ attitudes and behavioral tendencies. The higher the satisfaction level, the more likely users are to visit the green space. If satisfaction is not high, more users perceive no positive effects of the green space.

2.2. Selection of Study Area

Anning Industrial Park, as the only industrial park in Yunnan Province and rare in China since it integrates the three major heavy industries of petroleum, iron, and steel, in addition to phosphorus chemical production, is one of the key industrial parks in the province and is the core industrial development area of the state-level Dianzhong New Area. The park is located in the western part of Anning, 28 km from Kunming, the capital city of Yunnan Province, with a wide area of jurisdiction, a planning control scope of 200 km2, and a planning construction scope of 100 km2. With a solid industrial foundation, the park has a high industrial aggregation degree and strong development strength. Presently, there are 63 industrial enterprises in the park, including a number of large and important enterprises such as PetroChina, Kunming Iron & Steel, Yuntianhua, and Xiang Feng. Therefore, there are many factories in this industrial park with a large sample size of blue-collar workers, providing a broad base of research subjects.
To ensure the reliability, accuracy, and authenticity of the research content, field interviews and questionnaire pre-surveys were carried out in the early stage to screen the green spaces frequented by blue-collar worker groups in the main urban area. According to China’s current Standard for Classification of Urban Green Space (No. CJJ/T85-2017), UGS is divided into park green space, green buffers (for environmental protection), land for squares, and attached green space. This study mainly considered the green space demand of blue-collar worker groups and the functions and service levels of different green spaces. According to the statutory plan of the area, the green parks involved in the research group are divided into three categories: comprehensive parks (G11), sorted parks (G13), and amusement parks (G1). The basic information about the selected parks is shown in Table 2.

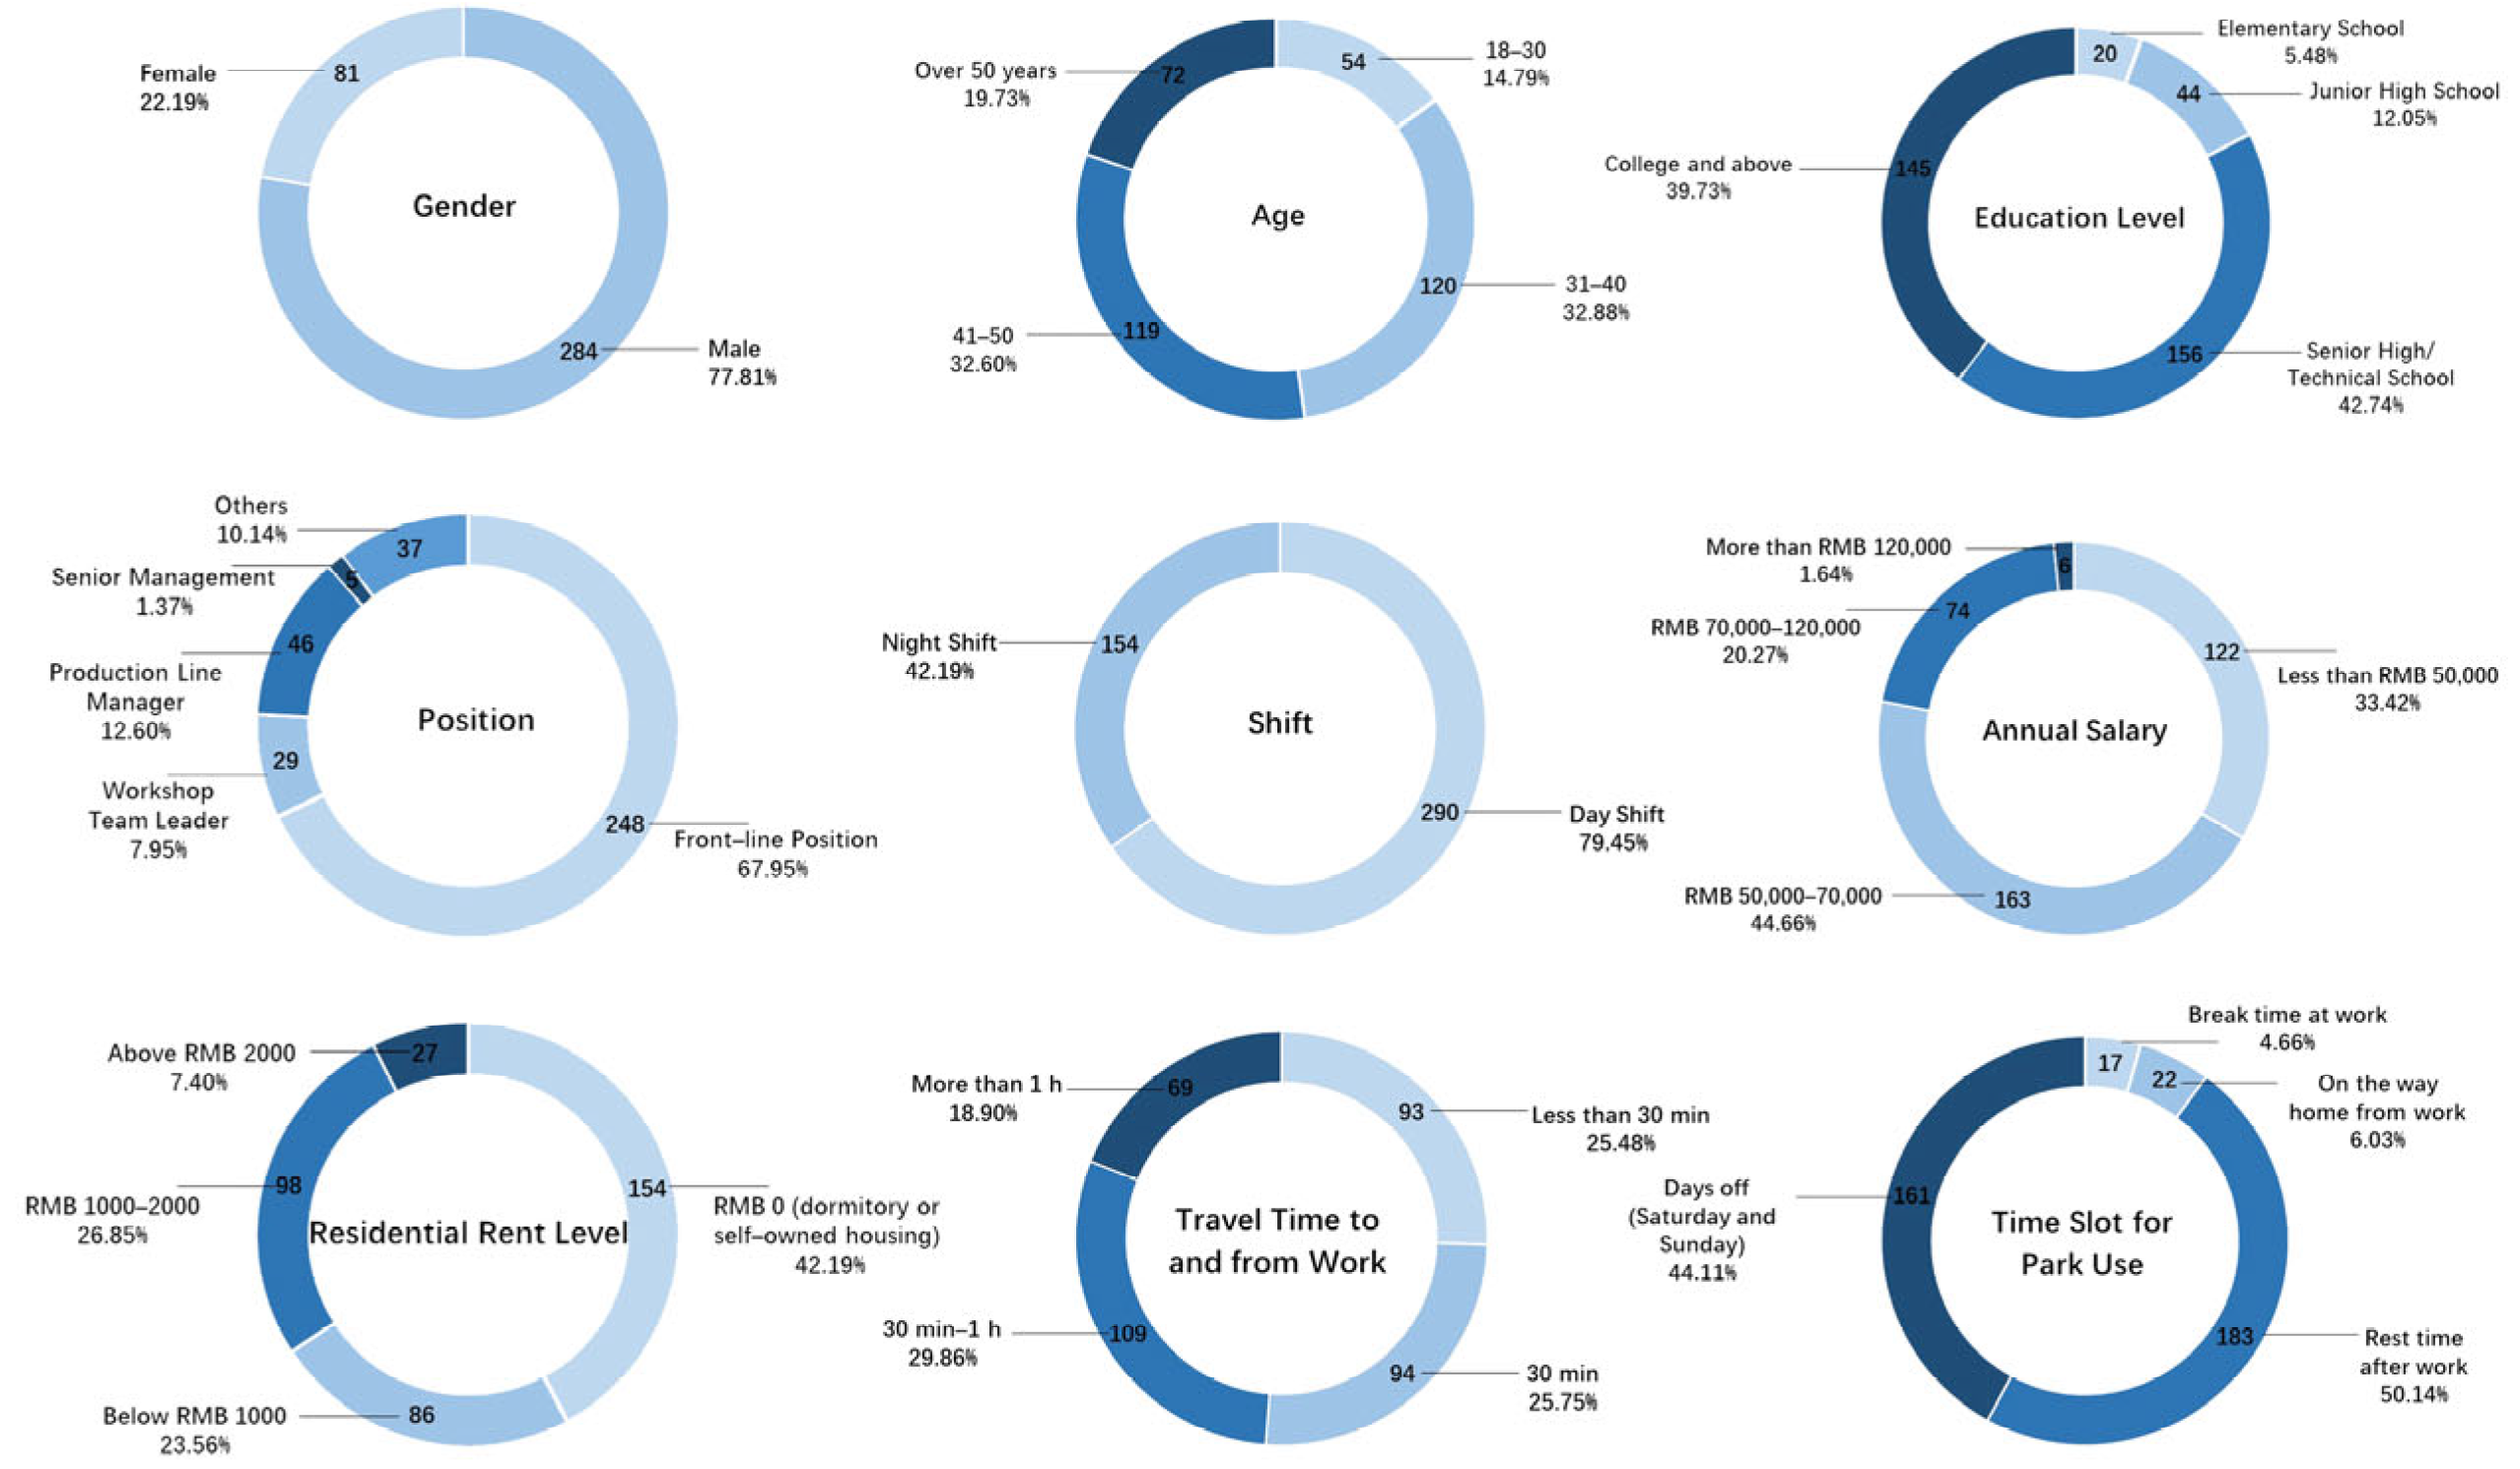
2.3. Questionnaire Setting and Data Collection

The survey questionnaire on green space use by blue-collar worker groups included four main aspects: basic information, green space use, health status, satisfaction with park recreation, and subjective perception evaluation. Part I included basic information, which was collected through a closed-ended questionnaire. Part II included green space use, including the frequency of green space use, means of transportation, leisure time budget, choice of green space type, etc. Relevant questions were set based on the research objectives of this paper and the actual situation of the survey respondents. Part III included health status, which included two categories: physical and mental health; the questions were rated on a 5-point Likert scale, and participants were required to give ratings on a quantitative scale from 1 (none) to 5 (very obvious) according to their situation. Part IV included the park recreation intention and satisfaction model scale, and was the main part of the questionnaire. It showed each model variable and its measurement questions. The scale design for this section drew on well-established scales from previous studies and was adapted for the present study subjects. All questions were rated on a 5-point Likert quantitative scale from 1 (never/very dissatisfied) to 5 (often/very satisfied). The basic composition of the user survey questionnaire and the setting of questions are detailed in Table A1.
In terms of data collection, user survey questionnaires were filled out through on-site scanning. A total of 510 questionnaires were distributed, and 365 valid ones were recovered, with an effective rate of 72%. The sample structure characteristics are shown in Figure 4. In terms of group characteristics, the study found that there were common characteristics of blue-collar worker groups, such as prolonged standing, heavy physical labor, long hours of equipment operation, stressful work, and mostly poor workplace environmental conditions. As a result, skin allergies and difficulty breathing are inevitable due to airborne irritants and dust that does not fully dissipate. In terms of green space use, the study found that the respondents used green space or parks 1–2 times in a week, most of them chose to walk, and those who walked for 20 min or less accounted for more than 61%, indicating that the distance between their residence and the green space was relatively close. The majority of respondents were relatively young and physically active, which was essentially consistent with the actual situation. Second, those who chose to use green space in public open areas accounted for the highest proportion, indicating that public green areas or parks were the main way this group used these areas. Their recreation sites were distributed in various locations.

3. Analysis

3.1. Analysis of Factors Affecting Park Recreation Satisfaction of Blue-Collar Worker Groups

3.1.1. Overall Data Analysis of the Measurement Model
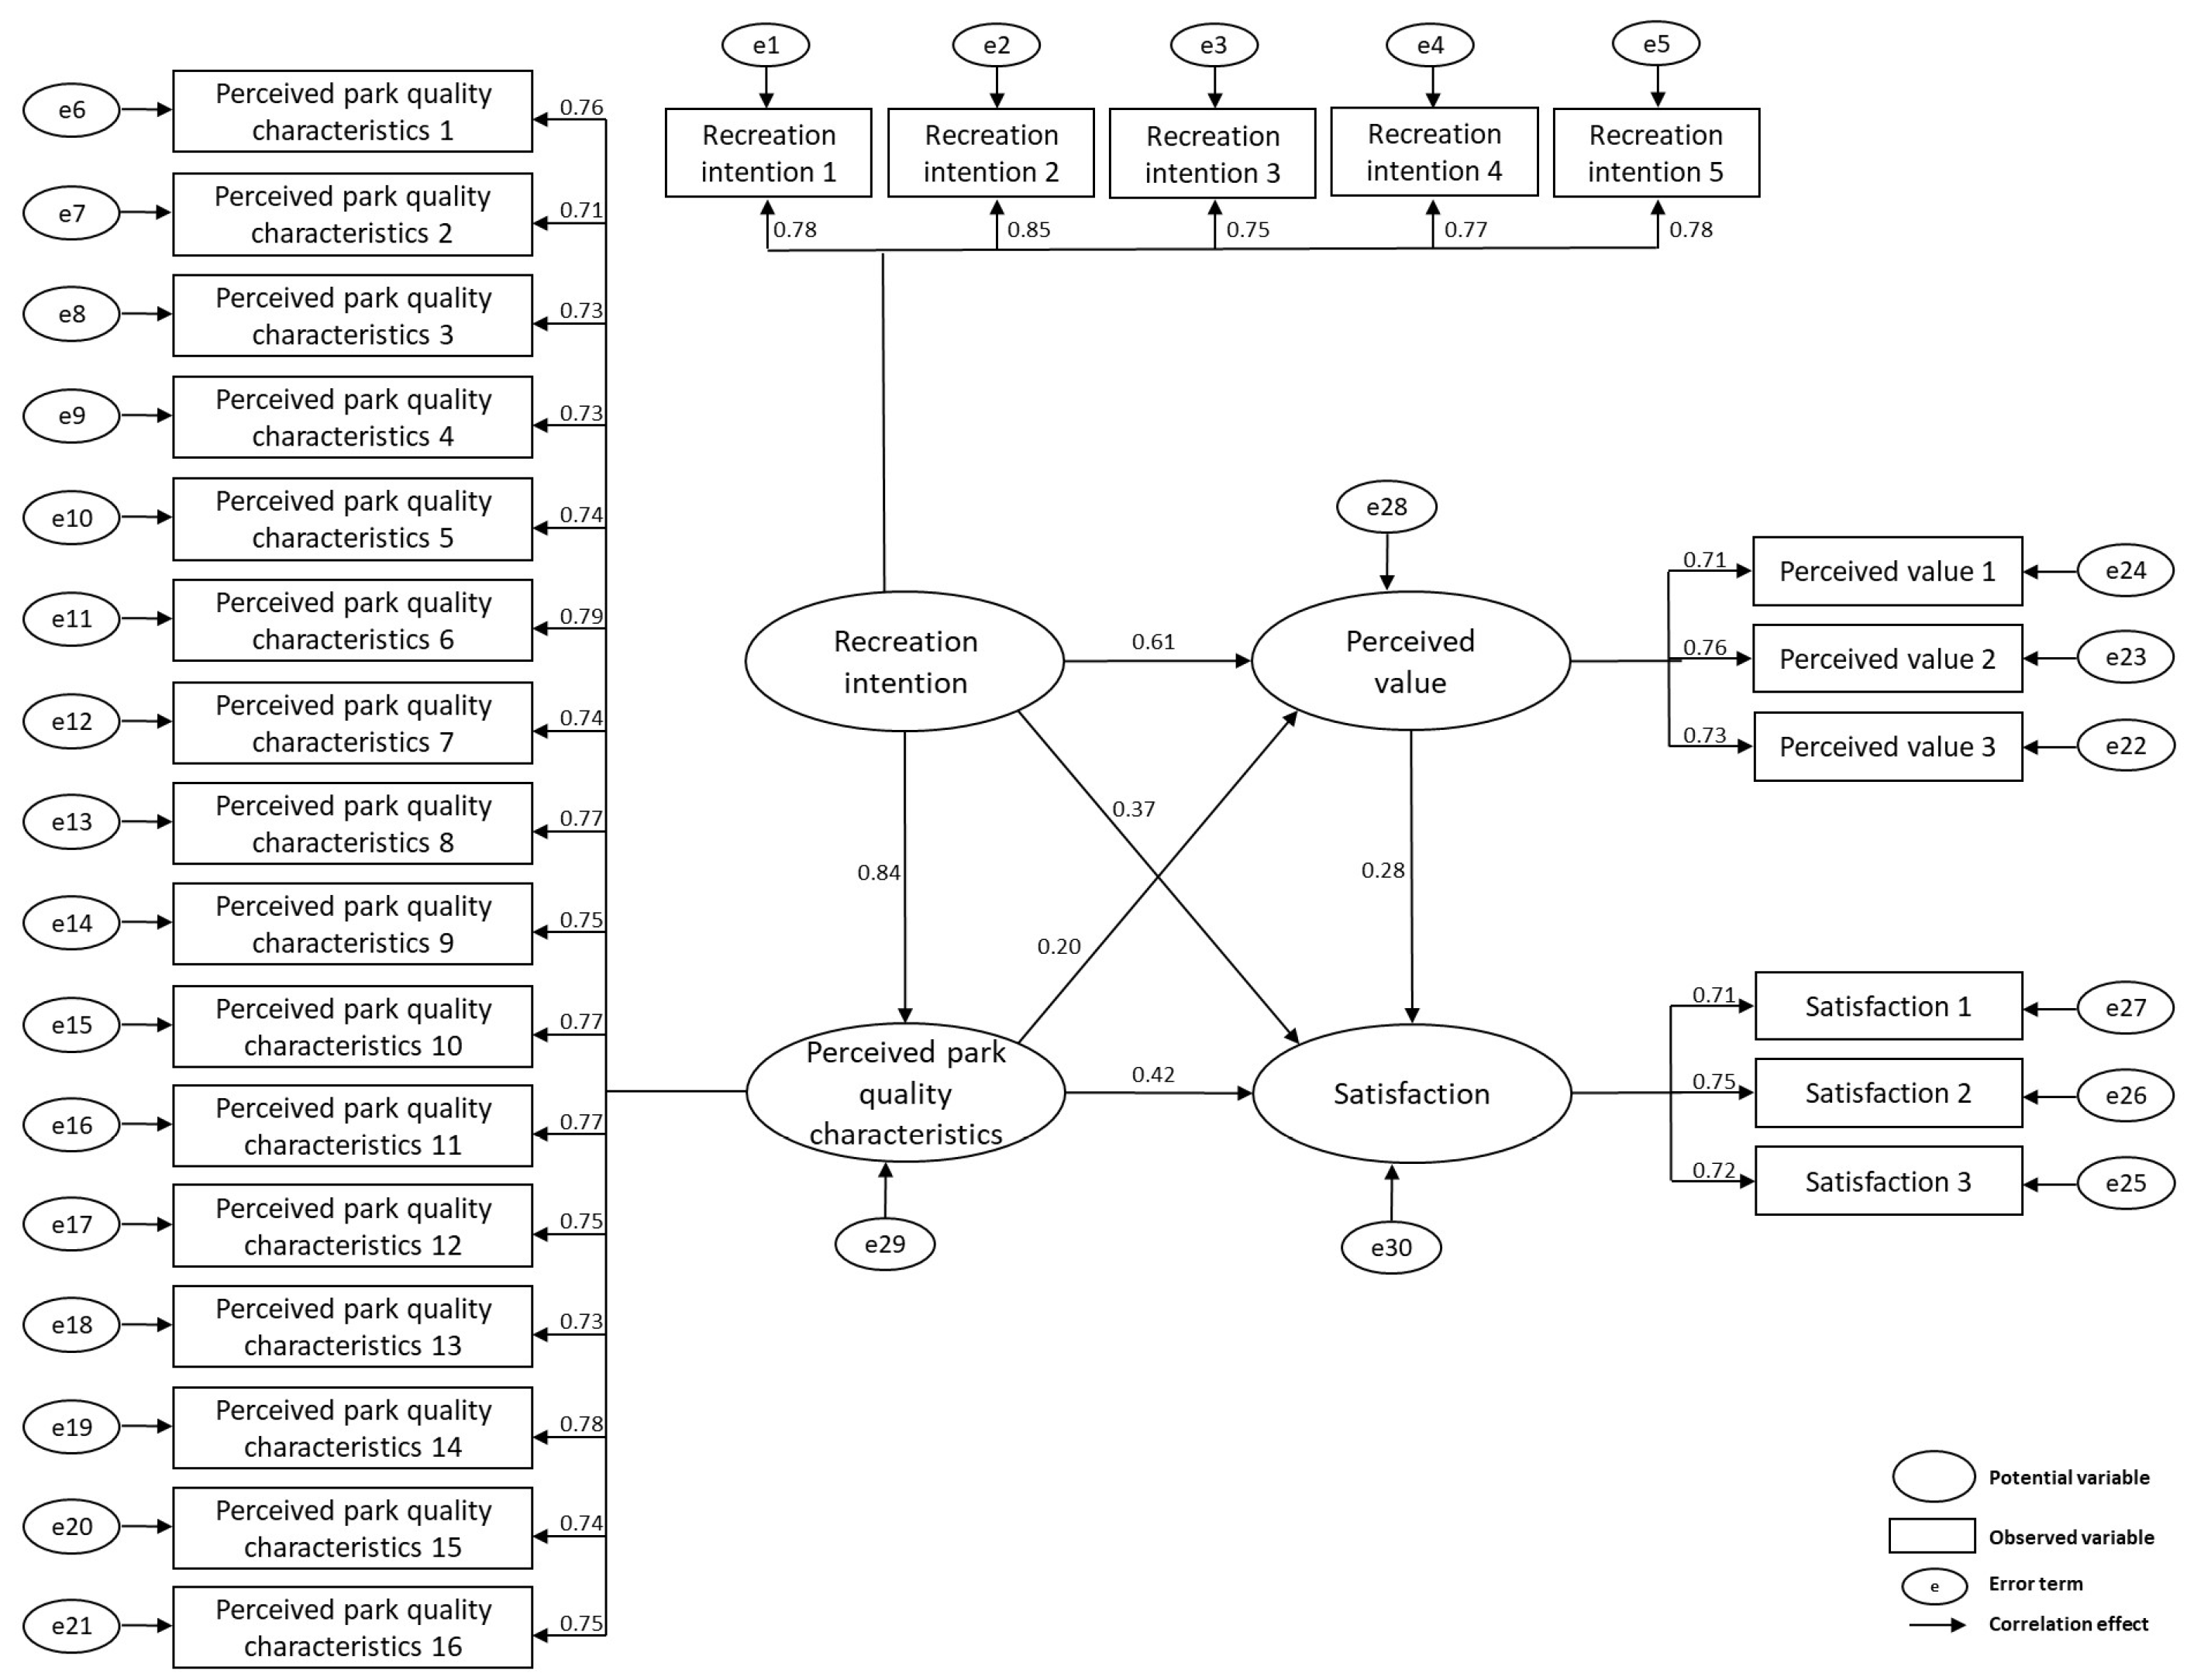
Before analysis, the reliability of data and samples was tested by means of two methods in this paper. First, the Cronbach’s α coefficient was calculated using SPSS software (see Table A2). The reliability of perceived park quality characteristics was high (Cron α = 0.954), that of recreation intention was good (Cron α = 0.888), and that of perceived value and satisfaction was average (Cron α = 0.787/0.760). The results of all statistical values were above 0.7, indicating that the scale had good internal consistency and reliability. Second, the correlation of perceived park quality characteristics was strong (KMO = 0.979); that of recreation intention was appropriate (KMO = 0.884); that of perceived value was average (KMO = 0.704), and that of satisfaction was acceptable (KMO = 0.696). The results of the validity test indicate that the collected sample data met the conditions for factor analysis.
Second, in the AMOS method reliability analysis, the confirmatory factors were analyzed through two indicators: combined reliability (CR) and average variance extracted (AVE). In the model, the questionnaire design related to perceived park quality characteristics and recreation intention, and the data had good consistency (CR = 0.954/0.890; AVE = 0.563/0.618). There was no significant difference between the two variables, which were within a relatively good interval. However, perceived value and satisfaction had average reliability compared to the other two variables (CR = 0.779/0.770; AVE = 0.541/0.527). Both CR and AVE were above 0.5, which was compliant with the minimum requirement. This may be due to the relatively small number of questions for both, and optimization can be performed for the variable and question design (see Table A3 for details). Overall, the measurement model has sufficient convergent validity as well as good reliability and validity. Therefore, this study concluded that this model could be used for subsequent analysis.
To verify the correlational relationship between different variables, correlation analysis on nine variables from the questionnaire data was also conducted in this paper (see Table 3). The results indicate that there was a significant positive correlation between the four independent variables (satisfaction, recreation intention, perceived value, and perceived park quality characteristics), with the pairwise correlation coefficients significant at the 0.01 level (two-tailed). This means that when individual users had an intrinsic need and motivation for green space/park use behavior, they would use the functions of a relatively close park to meet their needs. In terms of the relationship between the use frequency variable and other variables, it had a significant positive relationship with the perceived park quality characteristics, with a correlation coefficient of 0.103 (significant at the 0.05 level (two-tailed)). This indicates that the higher the quality and rating of the park, the higher the frequency of use, and there was a significant positive correlation. From the overall results of the correlation analysis, the model was well-constructed, and the data met the requirements of analysis with high reliability.

3.1.2. SEM Analysis

Prior to SEM analysis, model fit analysis was also conducted in this study (see Table A4). The comprehensive analysis of indexes revealed that the degree of fit was at a good level, and the analysis results were reliable and suitable for further analysis. Based on the above analysis, structural equation analysis was conducted on the research model of this paper to explore the factors affecting satisfaction, as shown in Figure 5.
The results of SEM path analysis (Table 4) indicate that: (1) recreation intention affected perceived value, perceived park quality characteristics, and satisfaction directly and significantly, i.e., H1, H2, and H3 held in the SEM model. (2) Perceived value was significantly correlated with satisfaction, i.e., H4 held in the SEM model, suggesting that the mediating variable has a significantly positive effect on the dependent variable. (3) The perceived park quality characteristics were significantly correlated with perceived value and satisfaction, i.e., H5 and H6 held in the SEM model. Based on the path relationship between variables, all paths were valid, i.e., the mediating effect held. Therefore, the double mediation model established in this study holds. In this model, both perceived park quality characteristics and perceived value play a significant positive mediating role.

3.2. Multi-Group Comparative Analysis

3.2.1. Cluster Analysis

In this study, cluster analysis was performed on samples using the k-means model. The samples were grouped into four clusters; different variables were significantly different in various clusters, indicating that this was the optimal number of clusters. Through the construction of the cluster model combined with the background of the study area and the characteristics of individual sample information, different green space users were grouped into four clusters: Cluster 1 included non-frontline employees who were relatively young and lived in dormitories or self-owned housing. Cluster 2 included non-frontline employees who were relatively older and rented housing outside. Cluster 3 included frontline employees who were relatively young and lived in dormitories or self-owned housing; Cluster 4 included frontline employees who were relatively older and rented housing outside. The cluster center table of the clustering results is shown in Table 5.
According to the cluster center table obtained, the differences in green space use among different blue-collar worker groups can be understood more accurately. The characteristics and preferences of green space use among the four clusters of blue-collar workers are discussed separately to explore their demand for green space use, as shown in Table 6. From the perspective of green space use variables, in terms of use frequency, non-frontline employees displayed a higher value than those on the frontline. In terms of transportation means, there were internal differences among frontline (non-frontline) employees. In terms of walking duration, Cluster 1 recorded the longest, mainly because blue-collar workers in this group were young, physically active, and had relatively inexpensive accommodation, and therefore they walked for the longest time, while Cluster 3 had the shortest walk. The difference between these two clusters was whether they were frontline employees, suggesting that the different types of work can have a relatively great influence on physical exertion and directly determine the walking duration. There was no significant difference in the used space and recreation sites.

3.2.2. Path Analysis among Different Groups

The overall results (Table 7) indicate that the SEM models of the four clusters had slightly poorer results than the overall samples. Only the Cluster 3 paths were significant, indicating that the SEM model established in this study was more applicable to samples in Cluster 3. The group in this cluster was characterized by frontline positions, low income, lowest rent, medium age level, and long working hours. This represents a typical middle-aged blue-collar worker group. This group accounted for the highest proportion and was the main group in this study. Second, the path analysis results of Clusters 1 and 2 were not satisfactory. The common feature of these two groups was that they worked as senior managers, indicating that the questionnaire and model of this study did not apply to blue-collar workers in senior positions, which was consistent with the original purpose of this study.
Therefore, it can be observed from the path analysis that, on the one hand, both the questionnaire and the model had their own applicable context and population, especially when there was a relatively significant difference among various groups. For example, in Clusters 1, 2 and 3 of this study, the difference in job position directly determined the working hours and income level, which further affected the rent level. As it applied to Cluster 3, it was less applicable to Clusters 1 and 2. Clusters 3 and 4 were essentially the same type of group at different stages, both of which had frontline jobs. However, with the increasing age, blue-collar workers in Cluster 4 may have started their own families and businesses, with higher rents to pay and more elderly relatives and children to take care of. Consequently, they tended to work fewer overtime hours. The overall performance of Cluster 4 was between Clusters 1, 2, and 3 and in the middle of the pack. On the other hand, even in Clusters 1 and 2, with more insignificant paths, the paths of Recreation Intention—Perceived Value and Recreation Intention—Perceived Park Quality Characteristics still held. This suggests that the mediating effect of Recreation Intention—Perceived Park Quality Characteristics—Perceived Value held. That is, the correlation path of recreation intention on satisfaction and the associated mediating effect may not have applied to samples in different clusters, but this path applied to all samples, and this mediating effect held across all samples. The mediating effect of this path was robust and did not vary due to sample differences in various clusters. Similarly, perceived value and park quality characteristics also affected satisfaction. Specifically, the differences in results across clusters were reflected in the effect of other variables on satisfaction.

3.2.3. Comparative Analysis between Different Groups

The analysis of the perceived park quality characteristics variable (detailed in Table A3) indicates that in Cluster 1, the main intention and demand were exercise and fitness. Users were engaged in a dynamic process of continuous movement, while the park fountain and statues were static and unchanging, and so they would not be pleasantly surprised. With increasing age, those in Cluster 2 were more inclined to perform sedentary activities or low-intensity exercise. There was no significant difference between the items of perceived park quality characteristics in Cluster 3. On the one hand, this may be due to the fact that the questions set in the questionnaire were beyond the comprehension and perception of this group. On the other hand, this group paid no attention to these questions during use. In Cluster 4, three items of the accessibility variable were distinct. Although the park was relatively far, this group could still go there at a relatively low cost and in a short time, which was attributed to convenient public transportation.
The analysis of the recreation intention variable (detailed in Table A3) indicates that in Cluster 1, the demand for exercise and fitness was much higher than the other demands. In Cluster 2, blue-collar workers preferred less physically demanding programs, and the two highest demands were “Take a walk to relax” and “Breathe some fresh air”, while the differences between other demands were relatively significant. In Cluster 3, the differences between different intentions and demands were relatively small, except for “Take a walk to relax”. In Cluster 4, the recreation intention was higher. This result reveals that the frontline manual worker population had a greater demand for park and green space use. This group tended to be exhausted, physically and mentally, after a day of physical labor and urgently needed ways to relax and relieve stress. Hence, the coefficients of recreation intention were all relatively high and balanced, without any particularly outstanding items.
In the analysis results of the perceived value variable (detailed in Table A3), two points should be noted: (i) the perceived value in the younger groups was smaller than that in the older ones, i.e., Cluster 1 < Cluster 2 and Cluster 3 < Cluster 4 among groups with the same job position; and (ii) the perceived value in the groups with lower job positions was smaller than that in those with higher job positions, i.e., Cluster 3 < Cluster 1 and Cluster 4 < Cluster 2, among groups at the same age level. In Cluster 3, the main sample group of this study, the perceived value had the lowest impact among the four clusters.
The analysis of the satisfaction variable (detailed in Table A3) indicates that there were no significant differences among various clusters because: (i) the study subjects were relatively concentrated and similar in biological and social attributes, without significant differences in cognitive levels and demands; and (ii) the data were collected in a small area, and thus the parks closest to their residence were often the same. Although there were some employees who rented housing outside, this proportion was relatively low; those who did rent housing outside generally chose residences close to their workplace.

4. Discussion

This study explored the factors affecting the satisfaction of blue-collar workers with park recreation by constructing a SEM model, and the results show that all paths held true and were significant. More details are discussed as follows:

4.1. Green Space Access Effectiveness of Blue-Collar Worker Groups Based on the ACSI Model

In this study, the relationship between satisfaction and latent variables was clarified from specific populations through empirical research with blue-collar worker groups as the study subjects. Recreation intention, perceived park quality characteristics, and perceived value all had a significantly positive effect on recreation satisfaction, which is consistent with previous studies. However, there are still different analytical results from other studies based on this theoretical model. There are still model variables that do not have a significant or negative effect. In a study of factors affecting satisfaction with online training for sustainable professional development of higher education teachers, expected quality was negatively correlated with perceived value. Additionally, expected and perceived quality had no significant effect on satisfaction [64]. This may be due to the difference in the study groups: in general, teachers have higher expectations of pedagogical knowledge to be acquired from online training, as this is prone to increase the gap between expected high quality and perceived actual value, while decreasing their perceived value. Moreover, they are more likely to perceive the specific experience after the actual use, taking the expected and perceived quality into comprehensive consideration, rather than judging the training satisfaction in a preconceived way. In a study of theme park festival visitor satisfaction, visitor expectations were negatively correlated with perceived value [65], which deviated from the results of this study, possibly due to differences in product and study content. Parks and green spaces are usually not as well-promoted as theme park festivals and therefore have less impact on visitor expectations and perceived value deviations.
In addition, the paths of the perceived park quality characteristics variable in this study were inconsistent with expectations. Specifically, in the analysis of Cluster 3 in this study (see Table 7), the path coefficients of perceived park quality characteristics for perceived value and satisfaction were 0.17 and 0.36, respectively. The path coefficient for satisfaction was greater, probably due to the unreasonable variable and model design. Regarding the variable design, all other variables and paths performed as expected. Therefore, the overall model is appropriate. Concerning the model design, it is probably due to the problem of the Park Quality Characteristics—Perceived Value path. Regarding blue-collar workers, they had limited judgment about perceived value. In other words, they were better able to express their level of satisfaction, but not good at making judgments about perception questions that required thinking and weighing. This was due to the overall low literacy level of this group in addition to their long-term engagement in manual work. It is not appropriate to use overcomplex models and variables for this group. It is recommended that the perceived value should be removed and a simplified model more applicable to this group be used.

4.2. Green Space Access Characteristics of Blue-Collar Workers

In terms of general characteristics, the frequency of blue-collar workers using green spaces was relatively low, at only one to two times a week, and most of them chose to walk. This group tended to visit parks in public open areas and near their place of residence. Conversely, the characteristics of green space visits differed significantly among the four clusters. In terms of use frequency, the values for non-frontline employees were higher than those for frontline employees, i.e., Cluster 1 > Cluster 3, Cluster 2 > Cluster 4; in terms of transportation means, the difference was reflected within frontline and non-frontline employees, i.e., Cluster 1 > Cluster 2, Cluster 3 > Cluster 4. In terms of walking duration, the difference in the length of time spent lay in whether they were frontline employees, with Cluster 1 being the longest and Cluster 3 being the shortest. Compared to other special groups, various groups had different patterns and characteristics of green space use. For example, most elderly people preferred walking to the park every day and lived less than 15 min from the park. They also preferred trails, paved open spaces, and other natural areas [66]. Regarding children, some research findings suggest that even if the parks closest to home have attractive features, they cannot guarantee to attract visitors. Instead, some children and families are willing to travel further to visit larger parks [67]. In addition, some studies have pointed out that most white-collar worker groups perform activities near their workplaces and prefer green pocket spaces with commercial facilities, and a few of them choose to spend their recreational time in parks [68]. Blue-collar workers are as an underprivileged group of green space users neglected in green space studies. They visit parks mostly for simple activities such as taking a walk to relax, with lower frequency of use and limited opportunities to enjoy green spaces. Multi-group analysis can help us determine how to optimize and improve the direction of green space planning and design around this group from the perspective of blue-collar workers.

5. Conclusions

In this paper, an SEM on the recreation intention and satisfaction of blue-collar worker groups was established based on ACSI theory. It was found that this model had good reliability and validity and significant correlations among variables, and the paths basically held. The results of the preliminary and exploratory evaluation of park recreation satisfaction of blue-collar workers indicate that the ACSI theory can predict and explain users’ recreation intention and satisfaction effectively. It is valid to apply this theory in the field of social economics to this landscape planning study. From the model analysis, not only were three main factors (recreation intention, perceived value, and perceived park quality characteristics affecting the recreation satisfaction of blue-collar worker groups) derived, but this paper also found general characteristics of blue-collar worker groups such as the effects of intense hard work, and common conditions such as muscle soreness, physical exhaustion, and anxiety. This influenced individual characteristic differences regarding the behavior relating to green space use, and the characteristics of green space use by different blue-collar worker groups. In general, this paper applied the ACSI theory to the green space and park use behaviors of blue-collar groups. Based on the demands of blue-collar groups, it is proposed that parks should be diversified in functions, equipped with a full range of facilities, and differentiated in service types that consider the characteristics and requirements of blue-collar groups. This could further promote more use of green spaces by blue-collar groups. In this regard, based on the characteristics of the group, the optimized suggestions for green space planning were proposed:
(1)
Park configuration functions and facilities should be complete and diverse
Take the perceived quality characteristics of parks in group 3 as an example. For this group, the park design should emphasize its practicality and functionality, and reduce design elements such as landscape and aesthetics. At the same time, the selection of facilities and equipment should also be based on durability and practicality as the first principle, instead of prioritizing high-end quality. For weekday-use green spaces, experience improvements should focus on the low-intensity use at noon and in the evening. These two periods are blue-collar workers’ day and night shift times. Besides providing sunshade cooling facilities in green space which is exposed to direct sunshine, increasing facilities, such as non-commercial tables, chairs, smoking areas, free drinking water, and so on can strengthen blue-collar workers’ experience of such a green space within a limited time span.
(2)
Differentiated configuration of park services
Creating parks near office areas or industrial areas requires considering the nature of enterprises and employees. First of all, labor-intensive enterprises have greater willingness and demand for parks or green spaces. However, their needs are diversified and complex. It is recommended to set up parks with multiple functions to provide more activity sites. For example, adding courtyards for table tennis and badminton will encourage participation in these activities. Secondly, employees who focus on office work or those with relatively high income require more health and sports activities. Therefore, sports trails and special fitness facilities next to their offices are appropriate.
There are still some limitations in this study: first, the study subjects of this paper were blue-collar worker groups, and in preparing the research questionnaire, the number of perception-type questions may have caused differences due to their perception of the questions or the differing cognitive levels of the research subjects. These cognitive differences are related to the blue-collar group’s own cultural and educational levels, which vary from one level of education to another, while the cultural level and ability to understand the questions among most of the blue-collar group are limited. The measurement of satisfaction and the improvement of specific questions are crucial for our subsequent studies. Second, as the current questionnaire and model were not applicable to most of the samples, it is necessary to improve the applicability of the questionnaire and model so that they can be applied to more cluster samples. Furthermore, subject to the limited availability of data, we chose to conduct the survey only in Yunnan Province. The extensiveness of samples and sample area distribution requires further improvement. Finally, the discussion of the effectiveness of specific design strategies was insufficient. More analysis of the relevant influencing factors of each strategy could be considered to explore the relationship between variables in depth in order to determine whether the green space use by blue-collar workers is universal so as to facilitate reasonable design and improve the utilization and satisfaction of UGS. This study suggests that future related studies can focus on enriching the happiness of specific groups of people such as blue-collar workers, deeply analyzing the different park preferences of internal group structures, further exploring new methods, adding new cases, and providing new ideas for the government, enterprises, and other relevant units to actively introduce various policies, improve the well-being of special groups, promote social equity, and improve the planning and design of parks and green spaces.

Author Contributions

Conceptualization, X.X. and Y.L.; methodology, X.X. and Y.L.; validation, X.X. and Y.L.; formal analysis, Y.L.; investigation, Y.L.; data curation, Y.L. and R.W.; writing—original draft preparation, X.X., Y.L., and Z.G.; writing—review and editing, X.X. and Z.G.; visualization, Y.L.; supervision, X.X.; funding acquisition, X.X. All authors have read and agreed to the published version of the manuscript.

Funding

This research was funded by National Natural Science Foundation of China Youth Science Fund, grant number 52208068.

Institutional Review Board Statement

Not applicable.

Informed Consent Statement

Informed consent was obtained from all subjects involved in the study.

Data Availability Statement

Not applicable.

Acknowledgments

We sincerely thank all the researchers who participated in the data collection and analysis.

Conflicts of Interest

The authors declare no conflict of interest. The funders had no role in the design of the study; in the collection, analyses, or interpretation of data; in the writing of the manuscript; or in the decision to publish the results.

Appendix A

Table A1. Scale of park recreation satisfaction model for blue-collar workers.
VariablesItemsReferences
Perceived park quality characteristicsManagementTraffic control in the park is good
The facilities in the park are well maintained
[69]
AestheticsThe green space in the park is decorated with landscape elements such as fountains and statues
The green space in the park has different water features, such as lakes and ponds
The park has high vegetation coverage and a variety of plants and flowers for viewing
[61,70]
TranquilityThe park has good privacy and some space for solitude
There is no traffic noise around the park
[61,71,72]
FacilitiesThe park has sufficient fitness facilities for my workout (jogging track, fitness equipment)
The park has sufficient recreation and leisure facilities, such as seats and benches
[61,72]
HygieneThe park has good air quality and very clean grounds[61]
Social activitiesWhether the park has space for events, such as free outdoor movies
Whether the park holds frequent events, such as flower shows and lantern fairs
[73]
AccessibilityThe park can be easily accessed
The park has an excellent location
There are ample options and frequent public transportation near the park
[70]
SecurityI feel safe spending time in the park[70]
Recreation intentionBreathe some fresh air[74,75,76]
Take a walk to relax
Appreciate natural landscape
Rest alone
Exercise and fitness
Perceived valueAre you satisfied with the cost of visiting recreational parks?[77,78,79]
Does the overall quality of the recreational parks you visited meet your requirements?
Overall, visiting recreational parks is valuable to me
SatisfactionHow did the recreational parks you visited actually perform compared to your expectations?[77,80,81]
How did the recreational parks you visited actually perform compared to your ideal ones?
The recreational parks I visited are generally satisfactory

Appendix B

Table A2. Reliability and validity analysis of main variables.
VariablesKMOCron αNo. of Items
Recreation intention0.8840.8885
Perceived value0.7040.7873
Satisfaction0.6960.7603
Perceived park quality characteristics0.9790.95416
Table A3. Reliability and validity analysis by AMOS.
ModelItemsPathVariablesEstimateCRAVE
Overall blue-collar worker groupsPerceived value 1<---Perceived value0.7120.7790.541
Perceived value 2<---Perceived value0.759
Perceived value 3<---Perceived value0.734
Security<---Perceived park quality characteristics0.7580.9540.563
Management 1<---Perceived park quality characteristics0.713
Management 2<---Perceived park quality characteristics0.731
Accessibility 1<---Perceived park quality characteristics0.729
Accessibility 2<---Perceived park quality characteristics0.743
Accessibility 3<---Perceived park quality characteristics0.791
Aesthetics 1<---Perceived park quality characteristics0.742
Aesthetics 2<---Perceived park quality characteristics0.769
Aesthetics 3<---Perceived park quality characteristics0.745
Tranquility 1<---Perceived park quality characteristics0.769
Tranquility 2<---Perceived park quality characteristics0.766
Facilities 1<---Perceived park quality characteristics0.753
Facilities 2<---Perceived park quality characteristics0.728
Social activities 1<---Perceived park quality characteristics0.783
Social activities 2<---Perceived park quality characteristics0.736
Hygiene<---Perceived park quality characteristics0.745
Satisfaction 1<---Satisfaction0.7110.7700.527
Satisfaction 2<---Satisfaction0.749
Satisfaction 3<---Satisfaction0.717
Recreation intention_ Breathe some fresh air<---Recreation intention0.7840.8900.618
Recreation intention_ Take a walk to relax<---Recreation intention0.853
Recreation intention_ Appreciate natural landscape<---Recreation intention0.746
Recreation intention_ Rest alone<---Recreation intention0.768
Recreation intention_ Exercise and fitness<---Recreation intention0.777
Cluster 1Perceived value 1<---Perceived value0.7310.7640.519
Perceived value 2<---Perceived value0.693
Perceived value 3<---Perceived value0.737
Security<---Perceived park quality characteristics0.7700.9440.514
Management 1<---Perceived park quality characteristics0.715
Management 2<---Perceived park quality characteristics0.765
Accessibility 1<---Perceived park quality characteristics0.732
Accessibility 2<---Perceived park quality characteristics0.634
Accessibility 3<---Perceived park quality characteristics0.782
Aesthetics 1<---Perceived park quality characteristics0.691
Aesthetics 2<---Perceived park quality characteristics0.818
Aesthetics 3<---Perceived park quality characteristics0.780
Tranquility 1<---Perceived park quality characteristics0.619
Tranquility 2<---Perceived park quality characteristics0.654
Facilities 1<---Perceived park quality characteristics0.709
Facilities 2<---Perceived park quality characteristics0.615
Social activities 1<---Perceived park quality characteristics0.738
Social activities 2<---Perceived park quality characteristics0.752
Hygiene<---Perceived park quality characteristics0.659
Satisfaction 1<---Satisfaction0.8170.7830.548
Satisfaction 2<---Satisfaction0.702
Satisfaction 3<---Satisfaction0.695
Recreation intention_ Breathe some fresh air<---Recreation intention0.6750.8560.546
Recreation intention_ Take a walk to relax<---Recreation intention0.779
Recreation intention_ Appreciate natural landscape<---Recreation intention0.667
Recreation intention_ Rest alone<---Recreation intention0.658
Recreation intention_ Exercise and fitness<---Recreation intention0.889
Cluster 2Perceived value 1<---Perceived value0.8490.8390.635
Perceived value 2<---Perceived value0.786
Perceived value 3<---Perceived value0.752
Security<---Perceived park quality characteristics0.8200.9570.584
Management 1<---Perceived park quality characteristics0.674
Management 2<---Perceived park quality characteristics0.729
Accessibility 1<---Perceived park quality characteristics0.729
Accessibility 2<---Perceived park quality characteristics0.745
Accessibility 3<---Perceived park quality characteristics0.832
Aesthetics 1<---Perceived park quality characteristics0.840
Aesthetics 2<---Perceived park quality characteristics0.806
Aesthetics 3<---Perceived park quality characteristics0.745
Tranquility 1<---Perceived park quality characteristics0.771
Tranquility 2<---Perceived park quality characteristics0.737
Facilities 1<---Perceived park quality characteristics0.749
Facilities 2<---Perceived park quality characteristics0.776
Social activities 1<---Perceived park quality characteristics0.762
Social activities 2<---Perceived park quality characteristics0.705
Hygiene<---Perceived park quality characteristics0.782
Satisfaction 1<---Satisfaction0.5600.7610.520
Satisfaction 2<---Satisfaction0.798
Satisfaction 3<---Satisfaction0.781
Recreation intention_ Breathe some fresh air<---Recreation intention0.8390.8710.579
Recreation intention_ Take a walk to relax<---Recreation intention0.880
Recreation intention_ Appreciate natural landscape<---Recreation intention0.709
Recreation intention_ Rest alone<---Recreation intention0.711
Recreation intention_ Exercise and fitness<---Recreation intention0.638
Cluster 3Perceived value 1<---Perceived value0.6390.7260.470
Perceived value 2<---Perceived value0.724
Perceived value 3<---Perceived value0.691
Security<---Perceived park quality characteristics0.7560.9550.572
Management 1<---Perceived park quality characteristics0.737
Management 2<---Perceived park quality characteristics0.717
Accessibility 1<---Perceived park quality characteristics0.756
Accessibility 2<---Perceived park quality characteristics0.786
Accessibility 3<---Perceived park quality characteristics0.775
Aesthetics 1<---Perceived park quality characteristics0.742
Aesthetics 2<---Perceived park quality characteristics0.739
Aesthetics 3<---Perceived park quality characteristics0.734
Tranquility 1<---Perceived park quality characteristics0.790
Tranquility 2<---Perceived park quality characteristics0.775
Facilities 1<---Perceived park quality characteristics0.771
Facilities 2<---Perceived park quality characteristics0.762
Social activities 1<---Perceived park quality characteristics0.789
Social activities 2<---Perceived park quality characteristics0.726
Hygiene<---Perceived park quality characteristics0.736
Satisfaction 1<---Satisfaction0.6870.7670.523
Satisfaction 2<---Satisfaction0.755
Satisfaction 3<---Satisfaction0.726
Recreation intention_ Breathe some fresh air<---Recreation intention0.7660.8810.597
Recreation intention_ Take a walk to relax<---Recreation intention0.859
Recreation intention_ Appreciate natural landscape<---Recreation intention0.703
Recreation intention_ Rest alone<---Recreation intention0.786
Recreation intention_ Exercise and fitness<---Recreation intention0.740
Cluster 4Perceived value 1<---Perceived value0.7380.8210.604
Perceived value 2<---Perceived value0.799
Perceived value 3<---Perceived value0.794
Security<---Perceived park quality characteristics0.7500.9540.565
Management 1<---Perceived park quality characteristics0.697
Management 2<---Perceived park quality characteristics0.728
Accessibility 1<---Perceived park quality characteristics0.696
Accessibility 2<---Perceived park quality characteristics0.731
Accessibility 3<---Perceived park quality characteristics0.804
Aesthetics 1<---Perceived park quality characteristics0.729
Aesthetics 2<---Perceived park quality characteristics0.788
Aesthetics 3<---Perceived park quality characteristics0.755
Tranquility 1<---Perceived park quality characteristics0.786
Tranquility 2<---Perceived park quality characteristics0.789
Facilities 1<---Perceived park quality characteristics0.742
Facilities 2<---Perceived park quality characteristics0.703
Social activities 1<---Perceived park quality characteristics0.796
Social activities 2<---Perceived park quality characteristics0.752
Hygiene<---Perceived park quality characteristics0.763
Satisfaction 1<---Satisfaction0.7600.7770.538
Satisfaction 2<---Satisfaction0.730
Satisfaction 3<---Satisfaction0.710
Recreation intention_ Breathe some fresh air<---Recreation intention0.8170.9090.666
Recreation intention_ Take a walk to relax<---Recreation intention0.828
Recreation intention_ Appreciate natural landscape<---Recreation intention0.823
Recreation intention_ Rest alone<---Recreation intention0.783
Recreation intention_ Exercise and fitness<---Recreation intention0.830
Note: CR refers to the critical ratio; AVE refers to the mean variance extraction value.
Table A4. Model fitting indices.
IndexIdeal CriteriaGeneral CriteriaModel ResultsConclusion
CMIN/DF1~3<102.904Good fit
RMSEA<0.08<0.10.072Good fit
RMR<0.08<0.10.06Good fit
GFI>0.9>0.80.845General fit
CFI>0.9>0.80.916Good fit
IFI>0.9>0.80.916Good fit
NFI>0.9>0.80.878General fit
TLI>0.9>0.80.907Good fit
Note: CMIN/DF (Ratio of Chi-square to Degrees of Freedom); RMSEA (Root-Mean-Square Error of Approximation); RMR (Root Mean square Residual); GFI (Goodness of Fit Index); CFI (Comparative Fit Index); IFI (Value-Added Fit Index); NFI (Normed Fit Index); TLI (Tucker-Lewis Index).

References

  1. Diener, A.; Mudu, P. How can vegetation protect us from air pollution? A critical review on green spaces’ mitigation abilities for air-borne particles from a public health perspective—With implications for urban planning. Sci. Total Environ. 2021, 796, 148605. [Google Scholar] [CrossRef]
  2. Ke, X.L.; Men, H.L.; Zhou, T.; Li, Z.Y.; Zhu, F.K. Variance of the impact of urban green space on the urban heat island effect among different urban functional zones: A case study in Wuhan. Urban For. Urban Green. 2021, 62, 127159. [Google Scholar] [CrossRef]
  3. Oquendo-Di Cosola, V.; Olivieri, F.; Ruiz-Garcia, L. A systematic review of the impact of green walls on urban comfort: Temperature reduction and noise attenuation. Renew. Sustain. Energy Rev. 2022, 162, 112463. [Google Scholar] [CrossRef]
  4. Kaplan, R.; Kaplan, S. The Experience of Nature: A Psychological Perspective; Cambridge University Press: Cambridge, UK, 1989. [Google Scholar]
  5. Corazon, S.S.; Sidenius, U.; Poulsen, D.V.; Gramkow, M.C.; Stigsdotter, U.K. Psycho-Physiological Stress Recovery in Outdoor Nature-Based Interventions: A Systematic Review of the Past Eight Years of Research. Int. J. Environ. Res. Public Health 2019, 16, 1711. [Google Scholar] [CrossRef] [Green Version]
  6. Houlden, V.; Weich, S.; de Albuquerque, J.; Jarvis, S.; Rees, K. The relationship between greenspace and the mental wellbeing of adults: A systematic review. PLoS ONE 2018, 13, e0203000. [Google Scholar] [CrossRef] [PubMed] [Green Version]
  7. Tyrväinen, L.; Ojala, A.; Korpela, K.; Lanki, T.; Tsunetsugu, Y.; Kagawa, T. The influence of urban green environments on stress relief measures: A field experiment. J. Environ. Psychol. 2014, 38, 1–9. [Google Scholar] [CrossRef]
  8. Liu, H.X.; Li, F.; Li, J.Y.; Zhang, Y.Y. The relationships between urban parks, residents’ physical activity, and mental health benefits: A case study from Beijing, China. J. Environ. Manag. 2017, 190, 223–230. [Google Scholar] [CrossRef] [PubMed]
  9. Tamosiunas, A.; Grazuleviciene, R.; Luksiene, D.; Dedele, A.; Reklaitiene, R.; Baceviciene, M.; Vencloviene, J.; Bernotiene, G.; Radisauskas, R.; Malinauskiene, V.; et al. Accessibility and use of urban green spaces, and cardiovascular health: Findings from a Kaunas cohort study. Environ. Health 2014, 13, 20. [Google Scholar] [CrossRef] [PubMed] [Green Version]
  10. Pietilä, M.; Neuvonen, M.; Borodulin, K.; Korpela, K.; Sievänen, T.; Tyrväinen, L. Relationships between exposure to urban green spaces, physical activity and self-rated health. J. Outdoor Recreat. Tour. 2015, 10, 44–54. [Google Scholar] [CrossRef]
  11. Wan, C.; Shen, G.Q.; Choi, S. Underlying relationships between public urban green spaces and social cohesion: A systematic literature review. City Cult. Soc. 2021, 24, 100383. [Google Scholar] [CrossRef]
  12. Gong, L.; Mao, B.; Qi, Y.D.; Xu, C.Y. A satisfaction analysis of the infrastructure of country parks in Beijing. Urban For. Urban Green. 2015, 14, 480–489. [Google Scholar] [CrossRef]
  13. Mul, E.; Ancin Murguzur, F.J.; Hausner, V.H. Impact of the COVID-19 pandemic on human-nature relations in a remote nature-based tourism destination. PLoS ONE 2022, 17, e0273354. [Google Scholar] [CrossRef] [PubMed]
  14. Pizam, A.; Neumann, Y.; Reichel, A. Dimentions of tourist satisfaction with a destination area. Ann. Tour. Res. 1978, 5, 314–322. [Google Scholar] [CrossRef]
  15. Van Herzele, A.; Wiedemann, T. A monitoring tool for the provision of accessible and attractive urban green spaces. Landsc. Urban Plan. 2003, 63, 109–126. [Google Scholar] [CrossRef]
  16. Chen, J.R.; van den Bosch, C.C.K.; Lin, C.H.; Liu, F.F.; Huang, Y.L.; Huang, Q.T.; Wang, M.H.; Zhou, Q.Q.; Dong, J.W. Effects of personality, health and mood on satisfaction and quality perception of urban mountain parks. Urban For. Urban Green. 2021, 63, 127210. [Google Scholar] [CrossRef]
  17. Liu, R.X.; Xiao, J. Factors Affecting Users’ Satisfaction with Urban Parks through Online Comments Data: Evidence from Shenzhen, China. Int. J. Environ. Res. Public Health 2021, 18, 253. [Google Scholar] [CrossRef] [PubMed]
  18. Chen, B.X.; Qi, X.H.; Qiu, Z.M. Recreational use of urban forest parks: A case study in Fuzhou National Forest Park, China. J. For. Res. 2018, 23, 183–189. [Google Scholar] [CrossRef]
  19. Kang, L.; Yang, Z.P.; Han, F. The Impact of Urban Recreation Environment on Residents’ Happiness-Based on a Case Study in China. Sustainability 2021, 13, 5549. [Google Scholar] [CrossRef]
  20. Lapa, T.Y. Life Satisfaction, Leisure Satisfaction and Perceived Freedom of Park Recreation Participants. Procedia-Soc. Behav. Sci. 2013, 93, 1985–1993. [Google Scholar] [CrossRef] [Green Version]
  21. Veitch, J.; Rodwell, L.; Abbott, G.; Carver, A.; Flowers, E.; Crawford, D. Are park availability and satisfaction with neighbourhood parks associated with physical activity and time spent outdoors? BMC Public Health 2021, 21, 306. [Google Scholar] [CrossRef]
  22. The Central People’s Government of the People’s Republic of China. 2021 Report on the Monitoring Survey of Migrant Workers. China Inf. News 2022, 2. [Google Scholar] [CrossRef]
  23. Yang, Y.; Chen, B.; Huang, P.; Wang, Y.; Zhang, L.; Cai, F. Prevalence and influencing factors of depressive symptoms among rural-to-urban migrant workers in China: A systematic review and meta-analysis. J. Affect. Disord. 2022, 307, 11–19. [Google Scholar] [CrossRef] [PubMed]
  24. Myrtek, M.; Fichtler, A.; Strittmatter, M.; Brugner, G. Stress and strain of blue and white collar workers during work and leisure time: Results of psychophysiological and behavioral monitoring. Appl. Ergon. 1999, 30, 341–351. [Google Scholar] [CrossRef] [PubMed]
  25. Shirmohammadi, M.; Beigi, M.; Richardson, J. Subjective well-being among blue-collar immigrant employees: A systematic literature review. Hum. Resour. Manag. Rev. 2023, 33, 100914. [Google Scholar] [CrossRef]
  26. Fernández, I.; Silván-Ferrero, P.; Molero, F.; Gaviria, E.; García-Ael, C. Perceived discrimination and well-being in Romanian immigrants: The role of social support. J. Happiness Stud. 2015, 16, 857–870. [Google Scholar] [CrossRef]
  27. Fleming, P.J.; Villa-Torres, L.; Taboada, A.; Richards, C.; Barrington, C. Marginalisation, discrimination and the health of Latino immigrant day labourers in a central North Carolina community. Health Soc. Care Community 2017, 25, 527–537. [Google Scholar] [CrossRef] [Green Version]
  28. Premji, S. “It’s Totally Destroyed Our Life” Exploring the Pathways and Mechanisms Between Precarious Employment and Health and Well-being Among Immigrant Men and Women in Toronto. Int. J. Health Serv. 2018, 48, 106–127. [Google Scholar] [CrossRef] [Green Version]
  29. Menger, L.M.; Rosecrance, J.; Stallones, L.; Roman-Muniz, I.N. A guide to the design of occupational safety and health training for immigrant, Latino/a dairy workers. Front. Public Health 2016, 4, 282. [Google Scholar] [CrossRef] [Green Version]
  30. Arias, O.E.; Caban-Martinez, A.J.; Umukoro, P.E.; Okechukwu, C.A.; Dennerlein, J.T. Physical Activity Levels at Work and Outside of Work Among Commercial Construction Workers. J. Occup. Environ. Med. 2015, 57, 73–78. [Google Scholar] [CrossRef] [Green Version]
  31. Elser, H.; Falconi, A.M.; Bass, M.; Cullen, M.R. Blue-collar work and women’s health: A systematic review of the evidence from 1990 to 2015. SSM Popul. Health 2018, 6, 195–244. [Google Scholar] [CrossRef]
  32. Su, Y.; Roberts, A.C.; Yap, H.S.; Car, J.; Kwok, K.W.; Soh, C.-K.; Christopoulos, G.I. White- and Blue- collar workers responses’ towards underground workspaces. Tunn. Undergr. Space Technol. 2020, 105, 103526. [Google Scholar] [CrossRef]
  33. Xiao, X.; Zhang, L.; Xiong, Y.; Jiang, J.; Xu, A. Influence of spatial characteristics of green spaces on microclimate in Suzhou Industrial Park of China. Sci. Rep. 2022, 12, 9121. [Google Scholar] [CrossRef] [PubMed]
  34. Meng, Q.; Hu, D.; Zhang, Y.; Chen, X.; Zhang, L.; Wang, Z. Do industrial parks generate intra-heat island effects in cities? New evidence, quantitative methods, and contributing factors from a spatiotemporal analysis of top steel plants in China. Environ. Pollut. 2022, 292, 118383. [Google Scholar] [CrossRef] [PubMed]
  35. Cong, W.; Li, X.; Qian, Y.; Shi, L. Polycentric approach of wastewater governance in textile industrial parks: Case study of local governance innovation in China. J. Environ. Manag. 2021, 280, 111730. [Google Scholar] [CrossRef] [PubMed]
  36. Zhang, L.Y.; Wu, C.L.; Hao, Y. Effect of The Development Level of Facilities for Forest Tourism on Tourists’ Willingness to Visit Urban Forest Parks. Forests 2022, 13, 1005. [Google Scholar] [CrossRef]
  37. Saeedi, I.; Dabbagh, E. Modeling the relationships between hardscape color and user satisfaction in urban parks. Environ. Dev. Sustain. 2021, 23, 6535–6552. [Google Scholar] [CrossRef]
  38. Liu, J.; Xiong, Y.C.; Wang, Y.J.; Luo, T. Soundscape effects on visiting experience in city park: A case study in Fuzhou, China. Urban For. Urban Green. 2018, 31, 38–47. [Google Scholar] [CrossRef]
  39. Maniruzzaman, K.M.; Alqahtany, A.; Abou-Korin, A.; Al-Shihri, F.S. An analysis of residents’ satisfaction with attributes of urban parks in Dammam city, Saudi Arabia. Ain Shams Eng. J. 2021, 12, 3365–3374. [Google Scholar] [CrossRef]
  40. Arabatzis, G.; Grigoroudis, E. Visitors’ satisfaction, perceptions and gap analysis: The case of Dadia–Lefkimi–Souflion National Park. For. Policy Econ. 2010, 12, 163–172. [Google Scholar] [CrossRef]
  41. Mullenbach, L.E.; Larson, L.R.; Floyd, M.F.; Marquet, O.; Huang, J.H.; Alberico, C.; Ogletree, S.S.; Hipp, J.A. Cultivating social capital in diverse, low-income neighborhoods: The value of parks for parents with young children. Landsc. Urban Plan. 2022, 219, 104313. [Google Scholar] [CrossRef]
  42. Yung, E.H.K.; Wang, S.; Chau, C.-k. Thermal perceptions of the elderly, use patterns and satisfaction with open space. Landsc. Urban Plan. 2019, 185, 44–60. [Google Scholar] [CrossRef]
  43. Chen, T.; Song, W.; Song, J.; Ren, Y.; Dong, Y.; Yang, J.; Zhang, S. Measuring Well-Being of Migrant Gig Workers: Exampled as Hangzhou City in China. Behav. Sci. 2022, 12, 365. [Google Scholar] [CrossRef]
  44. Liu, Y.; Zhang, F.; Liu, Y.; Li, Z.; Wu, F. Economic disadvantages and migrants’ subjective well-being in China: The mediating effects of relative deprivation and neighbourhood deprivation. Popul. Space Place 2019, 25, e2173. [Google Scholar] [CrossRef] [Green Version]
  45. Liu, Y.; Liu, Y.; Liu, Y.; Yuqi, L.; Ye, L.; Zhigang, L.; Yingzhi, Q. Impacts of neighborhood environments on migrants’ subjective wellbeing: A case study of Guangzhou. China. Prog. Geogr. 2018, 37, 986–998. [Google Scholar]
  46. Xing, H.; Yu, W.; Chen, W.; Cheng, X. Well-being and health-related quality of life in new-generation migrant workers in Zhejiang province, China. Health Qual. Life Outcomes 2019, 17, 1–7. [Google Scholar] [CrossRef] [Green Version]
  47. Lee, W.-S.; Zhao, Z. Height, weight and well-being for rural, urban and migrant workers in China. Soc. Indic. Res. 2017, 132, 117–136. [Google Scholar] [CrossRef] [Green Version]
  48. Huai, S.; Liu, S.; Zheng, T.; Van de Voorde, T. Are social media data and survey data consistent in measuring park visitation, park satisfaction, and their influencing factors? A case study in Shanghai. Urban For. Urban Green. 2023, 81, 127869. [Google Scholar] [CrossRef]
  49. Fornell, C. A National Customer Satisfaction Barometer—The Swedish Experience. J. Mark. 1992, 56, 6–21. [Google Scholar] [CrossRef]
  50. Yokoyama, N.; Azuma, N.; Kim, W. Moderating effect of customer’s retail format perception on customer satisfaction formation: An empirical study of mini-supermarkets in an urban retail market setting. J. Retail. Consum. Serv. 2022, 66, 102935. [Google Scholar] [CrossRef]
  51. Munoz, C.; Laniado, H.; Cordoba, J. Development of a robust customer satisfaction index for domestic air journeys. Res. Transp. Bus. Manag. 2020, 37, 100519. [Google Scholar] [CrossRef]
  52. Deng, W.J.; Yeh, M.L.; Sung, M.L. A customer satisfaction index model for international tourist hotels: Integrating consumption emotions into the American Customer Satisfaction Index. Int. J. Hosp. Manag. 2013, 35, 133–140. [Google Scholar] [CrossRef]
  53. Hsu, S.H. Developing an index for online customer satisfaction: Adaptation of American customer satisfaction index. Expert Syst. Appl. 2008, 34, 3033–3042. [Google Scholar] [CrossRef]
  54. Fernando Romero-Subia, J.; Antonio Jimber-del Rio, J.; Salome Ochoa-Rico, M.; Vergara-Romero, A. Analysis of Citizen Satisfaction in Municipal Services. Economies 2022, 10, 225. [Google Scholar] [CrossRef]
  55. Cheng, W.W.; Wang, S.W.; Liu, X.F.; Wu, Y.Y.; Cheng, J.; Sun, W.C.; Yan, X.F.; Wang, Q.; Peng, L.A.; Liu, X.L.; et al. Construction and validation of a revised satisfaction index model for the Chinese urban and rural resident-based basic medical insurance scheme. BMC Med. Inform. Decis. Mak. 2022, 22, 259. [Google Scholar] [CrossRef] [PubMed]
  56. Alwah, A.A.; Li, W.; Alwah, M.A.; Shahrah, S. Developing a quantitative tool to measure the extent to which public spaces meet user needs. Urban For. Urban Green. 2021, 62, 127152. [Google Scholar] [CrossRef]
  57. Knobel, P.; Dadvand, P.; Alonso, L.; Costa, L.; Español, M.; Maneja, R. Development of the urban green space quality assessment tool (RECITAL). Urban For. Urban Green. 2021, 57, 126895. [Google Scholar] [CrossRef]
  58. Knobel, P.; Dadvand, P.; Maneja-Zaragoza, R. A systematic review of multi-dimensional quality assessment tools for urban green spaces. Health Place 2019, 59, 102198. [Google Scholar] [CrossRef]
  59. Gidlow, C.; van Kempen, E.; Smith, G.; Triguero-Mas, M.; Kruize, H.; Gražulevičienė, R.; Ellis, N.; Hurst, G.; Masterson, D.; Cirach, M.; et al. Development of the natural environment scoring tool (NEST). Urban For. Urban Green. 2018, 29, 322–333. [Google Scholar] [CrossRef]
  60. Chen, S.; Sleipness, O.; Xu, Y.; Park, K.; Christensen, K. A systematic review of alternative protocols for evaluating non-spatial dimensions of urban parks. Urban For. Urban Green. 2020, 53, 126718. [Google Scholar] [CrossRef]
  61. Grahn, P.; Stigsdotter, U.K. The relation between perceived sensory dimensions of urban green space and stress restoration. Landsc. Urban Plan. 2010, 94, 264–275. [Google Scholar] [CrossRef]
  62. Hartig, T.; Korpela, K.; Evans, G.W.; Gärling, T. Validation of a Measure of Perceived Environmental Restorativeness; Göteborg Psychological Reports; Department of Psychology, Göteborg University: Gothenburg, Sweden, 1996; Volume 26. [Google Scholar]
  63. Ayala-Azcarraga, C.; Diaz, D.; Zambrano, L. Characteristics of urban parks and their relation to user well-being. Landsc. Urban Plan. 2019, 189, 27–35. [Google Scholar] [CrossRef]
  64. Wu, W.; Hu, R.; Tan, R.; Liu, H. Exploring Factors of Middle School Teachers’ Satisfaction with Online Training for Sustainable Professional Development under the Impact of COVID-19. Sustainability 2022, 14, 13244. [Google Scholar] [CrossRef]
  65. Chen, X. Research on the Satisfaction Index of Tourists of Theme Park Festival Events Based on ACSI Model. Masters’s Thesis, Shanghai Normal University, Shanghai, China, 2018. [Google Scholar]
  66. Zhai, Y.; Li, D.; Wu, C.; Wu, H. Urban park facility use and intensity of seniors’ physical activity—An examination combining accelerometer and GPS tracking. Landsc. Urban Plan. 2021, 205, 103950. [Google Scholar] [CrossRef]
  67. Flowers, E.P.; Timperio, A.; Hesketh, K.D.; Veitch, J. Comparing the features of parks that children usually visit with those that are closest to home: A brief report. Urban For. Urban Green. 2020, 48, 126560. [Google Scholar] [CrossRef]
  68. Xie, X.; Zhou, H.; Gou, Z.; Yi, M. Spatiotemporal Patterns of the Use of Green Space by White-Collar Workers in Chinese Cities: A Study in Shenzhen. Land 2021, 10, 1006. [Google Scholar] [CrossRef]
  69. Wu, X.; Li, X. Post-Occupancy Evaluation of Sports Parks during the COVID-19 Pandemic: Taking Sports Parks in Beijing as Examples. Buildings 2022, 12, 2250. [Google Scholar] [CrossRef]
  70. Gibson, S.C. "Let’s go to the park." An investigation of older adults in Australia and their motivations for park visitation. Landsc. Urban Plan. 2018, 180, 234–246. [Google Scholar] [CrossRef]
  71. Huai, S.; Van de Voorde, T. Which environmental features contribute to positive and negative perceptions of urban parks? A cross-cultural comparison using online reviews and Natural Language Processing methods. Landsc. Urban Plan. 2022, 218, 104307. [Google Scholar] [CrossRef]
  72. Stigsdotter, U.K.; Corazon, S.S.; Sidenius, U.; Refshauge, A.D.; Grahn, P. Forest design for mental health promotion—Using perceived sensory dimensions to elicit restorative responses. Landsc. Urban Plan. 2017, 160, 1–15. [Google Scholar] [CrossRef]
  73. Lau, K.K.-L.; Yung, C.C.-Y.; Tan, Z. Usage and perception of urban green space of older adults in the high-density city of Hong Kong. Urban For. Urban Green. 2021, 64, 127251. [Google Scholar] [CrossRef]
  74. Wang, P.; Zhou, B.; Han, L.; Mei, R. The motivation and factors influencing visits to small urban parks in Shanghai, China. Urban For. Urban Green. 2021, 60, 127086. [Google Scholar] [CrossRef]
  75. Wolf, I.D.; Wohlfart, T. Walking, hiking and running in parks: A multidisciplinary assessment of health and well-being benefits. Landsc. Urban Plan. 2014, 130, 89–103. [Google Scholar] [CrossRef]
  76. Halkos, G.; Leonti, A.; Sardianou, E. Activities, motivations and satisfaction of urban parks visitors: A structural equation modeling analysis. Econ. Anal. Policy 2021, 70, 502–513. [Google Scholar] [CrossRef]
  77. Jiao, H.; He, M. User satisfaction of wearable devices based on ACSI model—A case study of smartwatches. Mark. Mod. 2021, 19, 11154. [Google Scholar] [CrossRef]
  78. Shen, H. On the Testing Model of Customers’ Satisfaction in Budget-type Hotels Based on the Framework of ACSI. Tour. Trib. 2011, 26, 58–62. [Google Scholar]
  79. Tian, X. A study of customer satisfaction at Starbucks Suzhou. Co-Oper. Econ. Sci. 2019, 19, 106–111. [Google Scholar] [CrossRef]
  80. Li, H.; Luo, H.; Yao, T. The Impact of Corporate Image on Customer Attitudinal Loyalty and Behavioral Loyalty: Evidence from China’s Retail Banking Industry. Manag. Rev. 2012, 24, 88–97. [Google Scholar] [CrossRef]
  81. Wu, J.; Li, S.; Hu, X.; Wang, L. An Empirical Study of Users’ Engagement Intention on Healthy Wearable Devices. J. Inf. Resour. Manag. 2017, 7, 22–30. [Google Scholar] [CrossRef]
Figure 1. Research structure.
Land 12 00798 g001
Figure 2. American Customer Satisfaction Index (ACSI) model.
Land 12 00798 g002
Figure 3. Conceptual model of recreation satisfaction of blue-collar workers.
Land 12 00798 g003
Figure 4. Sample structure of respondents.
Land 12 00798 g004
Figure 5. Structural equation model.
Land 12 00798 g005
Table 1. Main tools for measuring well-being.
ToolsApplication FieldsApplication PopulationLimitations
Satisfaction with Life Scale (SWLS)Measures subjective well-being, including via psychology, health, and social sciencesWide range of people, including youth, adults, and elderly peopleThe SWLS has been criticized for not capturing domain-specific life satisfaction, and it may not be sensitive to changes in satisfaction over time.
Positive and Negative Affect Scale (PANAS)Measures subjective well-being, including via psychology, health, and social sciencesWide range of people, including youth, adults, and elderly peopleThe PANAS may not capture the full range of emotions and may be influenced by response biases.
World Health Organization Quality of Life Measurement Tools (WHOQOL-BREF)Measures quality of life, including via psychology, health, and social sciencesWide range of people, including youth, adults, and elderly peopleThe WHOQOL-BREF may not capture all aspects of quality of life, and some items may not be relevant or important to all individuals.
Oxford Happiness Questionnaire (OHQ)Measures subjective well-being, including via psychology, health, and social sciencesWide range of people, including youth, adults, and elderly peopleThe OHQ may not capture all aspects of subjective well-being, and some items may be influenced by cultural factors.
Table 2. Introduction to green spaces.
Park 1Park 2Park 3Park 4Park 5Park 6Park 7
LocationLand 12 00798 i001Land 12 00798 i002Land 12 00798 i003Land 12 00798 i004Land 12 00798 i005Land 12 00798 i006Land 12 00798 i007
Park NameBaihua ParkDonghu ParkNinghu ParkRiyue Lake ParkXiaotang ParkWetland ParkMountain Park
Nature of Green SpaceComprehensive ParkComprehensive ParkComprehensive ParkComprehensive ParkComprehensive ParkSorted ParkAmusement Park
Park Area68,827 m2204,437 m2494,474 m2121,672 m282,340 m262,843 m243,247 m2
Representative PhotosLand 12 00798 i008Land 12 00798 i009Land 12 00798 i010Land 12 00798 i011Land 12 00798 i012Land 12 00798 i013Land 12 00798 i014
Table 3. Correlation analysis among variables.
Variables123456789
11
20.859 **1
30.785 **0.778 **1
40.666 **0.617 **0.589 **1
50.080.0960.0960.103 *1
60.0280.0270.0840.065−0.0361
7−0.114 *−0.088−0.077−0.106 *0.014−0.0561
80.0640.0980.0490.0520.146 **−0.222 **−0.139 **1
9−0.044−0.086−0.071−0.033−0.113 *−0.196 **−0.179 **−0.758 **1
Note: * significant at the 0.05 level (two-tailed); ** significant at the 0.01 level (two-tailed). 1–9: Satisfaction, recreation intention, perceived value, perceived park quality characteristics, use behavior frequency, use during work breaks, use on the way home from work, use during rest after work, and use on days off, respectively.
Table 4. Significance analysis of the model.
Variables Being Acted UponPathActuating VariableEstimateS.E.C.R.p
Perceived Value<---Recreation Intention0.6120.0728.457***
Perceived Park Quality Characteristics<---Recreation Intention0.8440.06512.925***
Satisfaction<---Recreation Intention0.3670.0993.694***
Satisfaction<---Perceived Value0.2770.1352.0540.04
Perceived Value<---Perceived Park Quality Characteristics0.1950.0583.351***
Satisfaction<---Perceived Park Quality Characteristics0.420.0518.307***
Note: *** significant at the 0.001 level (two-tailed). S.E. refers to the standard error of the estimated parameter; C.R. refers to the critical ratio of the test statistics.
Table 5. Cluster center table (4 clusters).
VariablesCluster 1Cluster 2Cluster 3Cluster 4
Age2323
Job4411
Rent1313
Commuting hours2332
Table 6. Analysis of the differences in green space use behaviors among different clusters.
VariablesGroupNMean ± SDFp
Use behavior: frequencyCluster 144.002.30 ± 0.552.490.06
Cluster 243.002.47 ± 0.80
Cluster 3151.002.19 ± 0.51
Cluster 4127.002.33 ± 0.77
Use behavior: transportation meansCluster 144.001.73 ± 1.212.200.09
Cluster 243.001.47 ± 0.91
Cluster 3151.001.73 ± 1.11
Cluster 4127.001.43 ± 1.01
Use behavior: walking durationCluster 144.002.57 ± 1.023.330.02
Cluster 243.002.37 ± 1.18
Cluster 3151.002.13 ± 1.04
Cluster 4127.002.47 ± 1.09
Use behavior: used spaceCluster 144.002.59 ± 0.921.220.30
Cluster 243.002.35 ± 1.04
Cluster 3151.002.26 ± 1.07
Cluster 4127.002.32 ± 0.99
Use behavior: recreation siteCluster 144.002.41 ± 1.060.370.77
Cluster 243.002.23 ± 1.04
Cluster 3151.002.23 ± 1.05
Cluster 4127.002.28 ± 1.06
Table 7. Significance analysis of each variable in four clusters.
Variables Being Acted uponPathActuating VariableEstimateS.E.C.R.p
Cluster 1Perceived Value<---Recreation Intention0.5530.1513.662***
Perceived Park Quality Characteristics<---Recreation Intention0.7810.1545.081***
Satisfaction<---Recreation Intention−0.461.993−0.2310.817
Satisfaction<---Perceived Value2.2913.6790.6230.533
Perceived Value<---Perceived Park Quality Characteristics0.1760.1361.30.193
Satisfaction<---Perceived Park Quality Characteristics−0.0930.763−0.1220.903
Cluster 2Perceived Value<---Recreation Intention1.4910.5122.9120.004
Perceived Park Quality Characteristics<---Recreation Intention1.2620.2984.24***
Satisfaction<---Recreation Intention1.2371.2640.9790.328
Satisfaction<---Perceived Value−0.3530.7−0.5050.614
Perceived Value<---Perceived Park Quality Characteristics−0.2360.289−0.8170.414
Satisfaction<---Perceived Park Quality Characteristics−0.0180.31−0.0590.953
Cluster 3Perceived Value<---Recreation Intention0.5860.1244.724***
Perceived Park Quality Characteristics<---Recreation Intention0.9240.1187.834***
Satisfaction<---Recreation Intention0.2760.1541.7980.072
Satisfaction<---Perceived Value0.5390.2262.3840.017
Perceived Value<---Perceived Park Quality Characteristics0.170.0881.9410.052
Satisfaction<---Perceived Park Quality Characteristics0.360.0744.861***
Cluster 4Perceived Value<---Recreation Intention0.5570.1025.469***
Perceived Park Quality Characteristics<---Recreation Intention0.7250.0917.994***
Satisfaction<---Recreation Intention0.210.1451.4510.147
Satisfaction<---Perceived Value0.2990.2191.3680.171
Perceived Value<---Perceived Park Quality Characteristics0.2530.0982.5760.01
Satisfaction<---Perceived Park Quality Characteristics0.5950.1015.866***
Note: *** significant at the 0.001 level (two-tailed).
Disclaimer/Publisher’s Note: The statements, opinions and data contained in all publications are solely those of the individual author(s) and contributor(s) and not of MDPI and/or the editor(s). MDPI and/or the editor(s) disclaim responsibility for any injury to people or property resulting from any ideas, methods, instructions or products referred to in the content.

