
Land Use and Ecosystem Services Evolution in Danjiangkou Reservoir Area, China: Implications for Sustainable Management of National Projects
 , , , and
Abstract
:1. Introduction
2. Materials and Methods
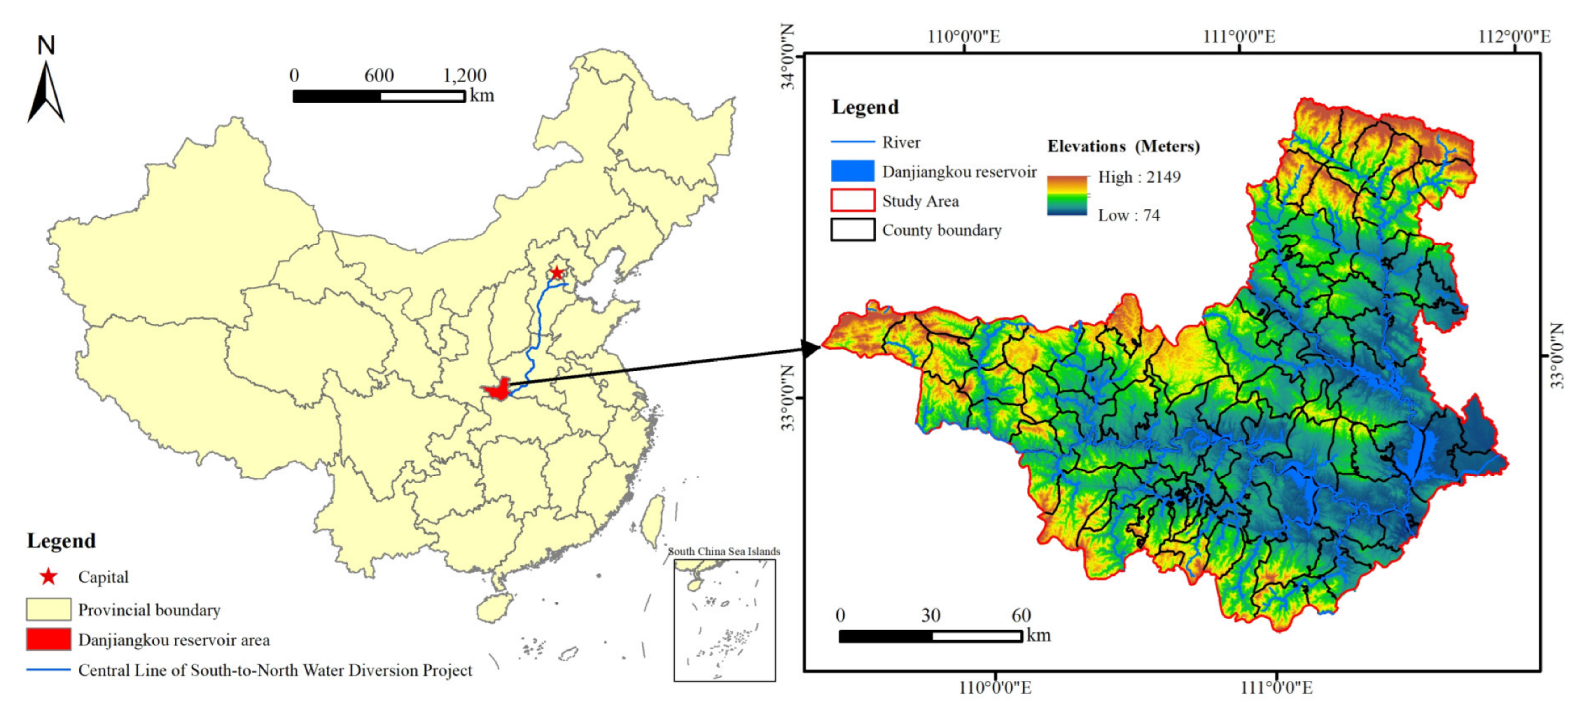
2.1. Overview of the Study Area
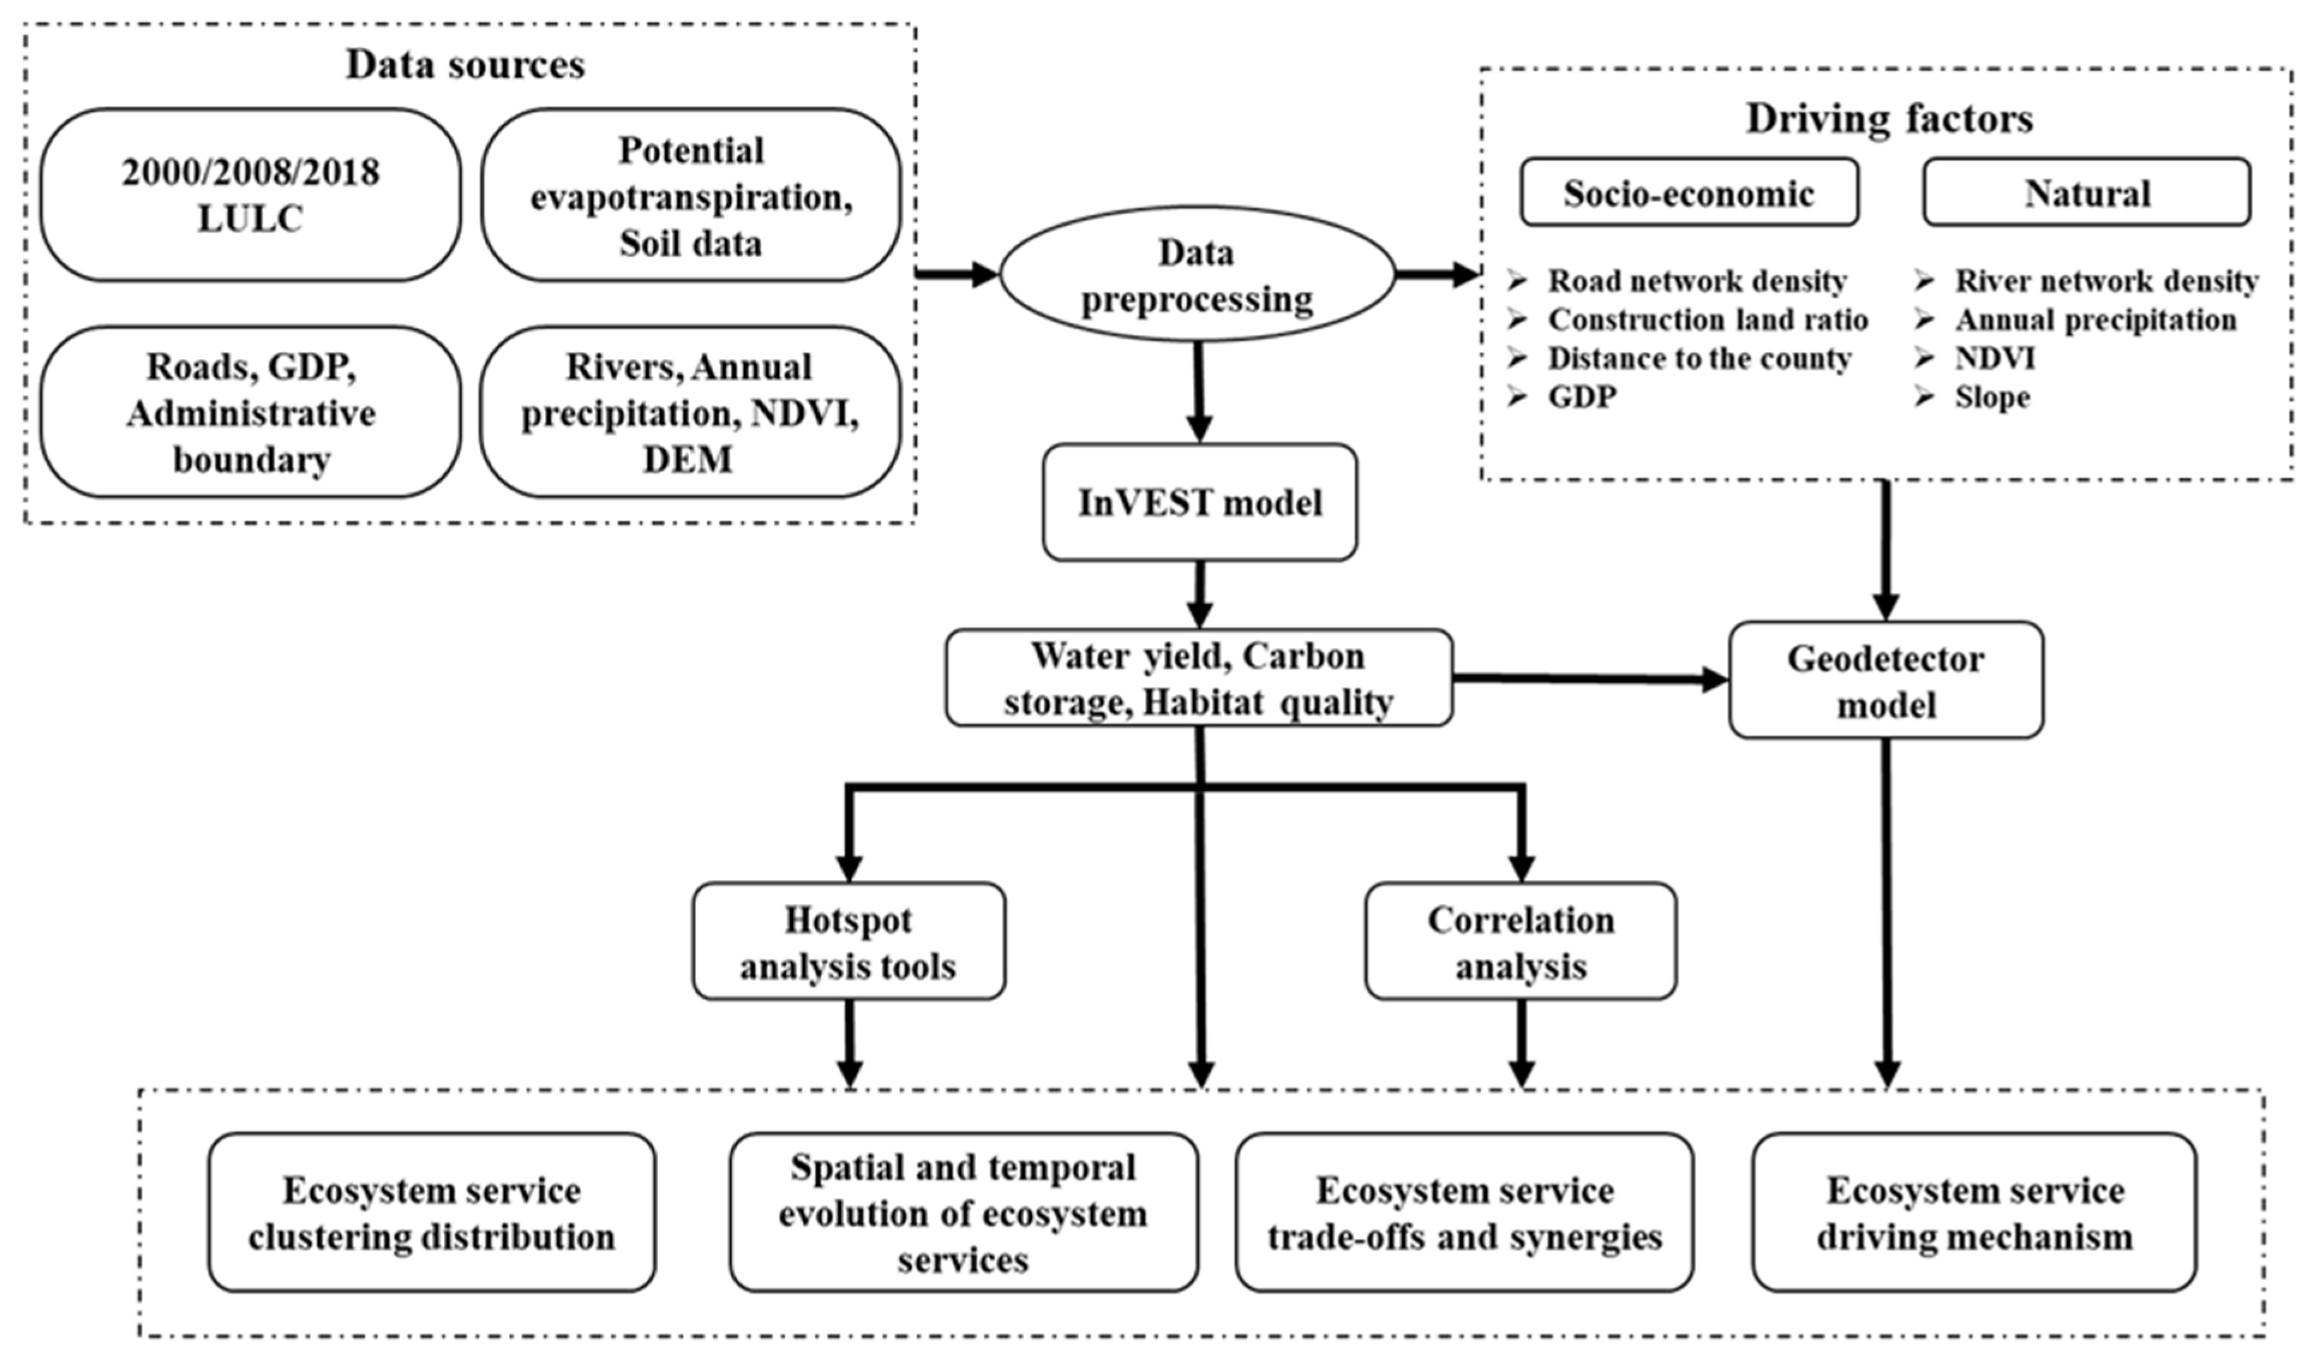
2.2. Data Sources
2.3. Methods
2.3.1. Ecosystem Services Assessment
- Water Yield (WY)
- 2.
- Carbon Storage (CS)
- 3.
- Habitat Quality (HQ)
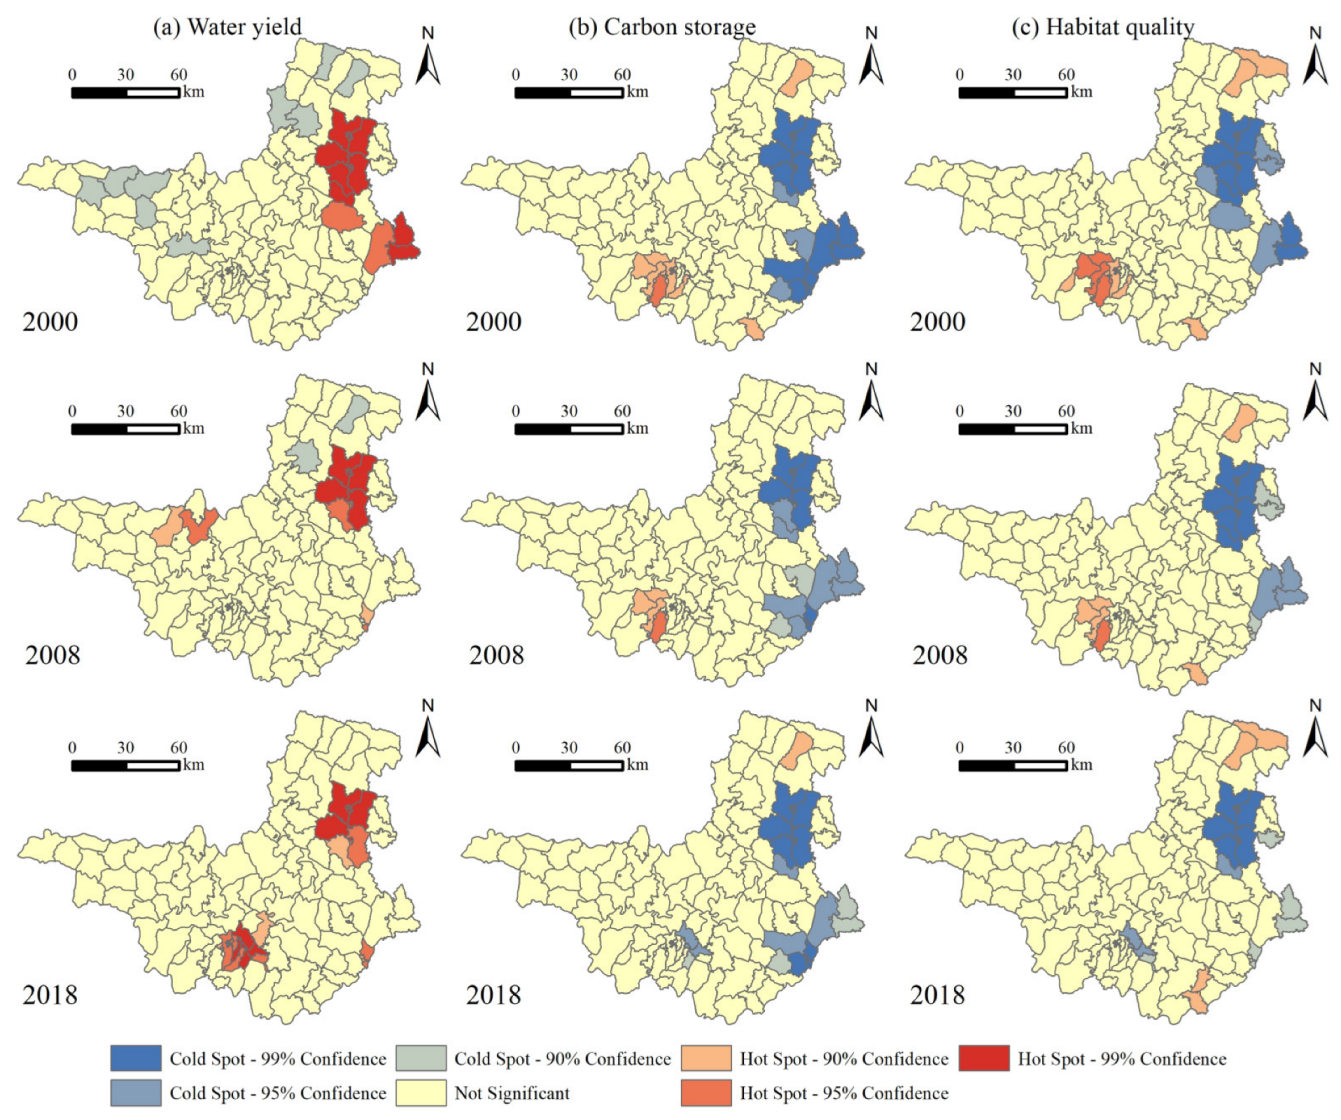
2.3.2. Hot Spot Analysis
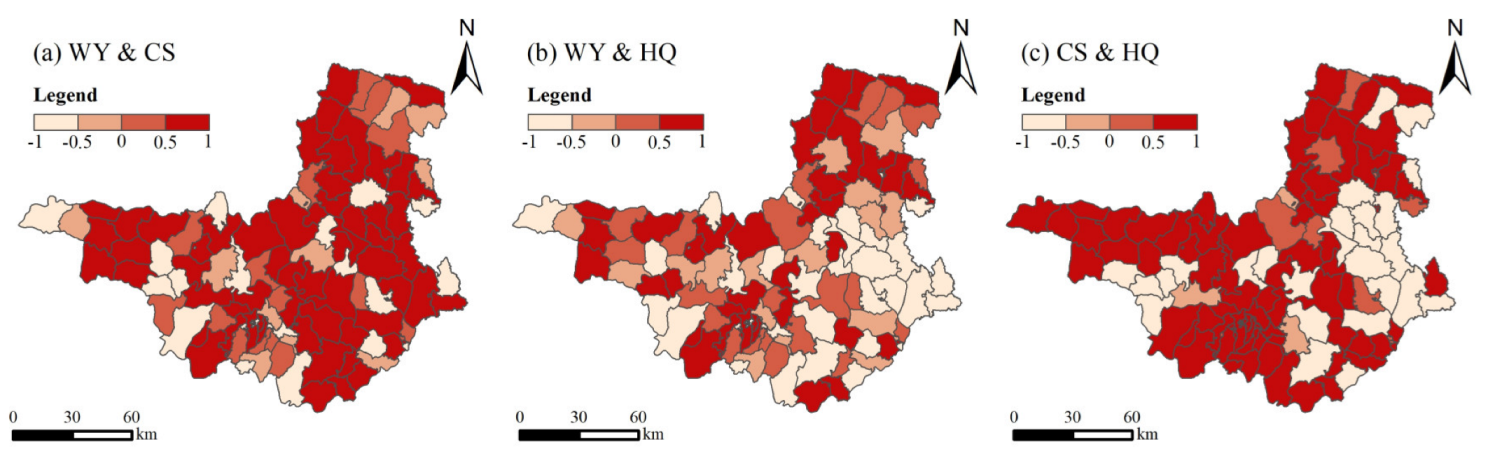
2.3.3. Tradeoff and Synergy Analysis
2.3.4. Geographical Detector Model (GDM)
3. Results
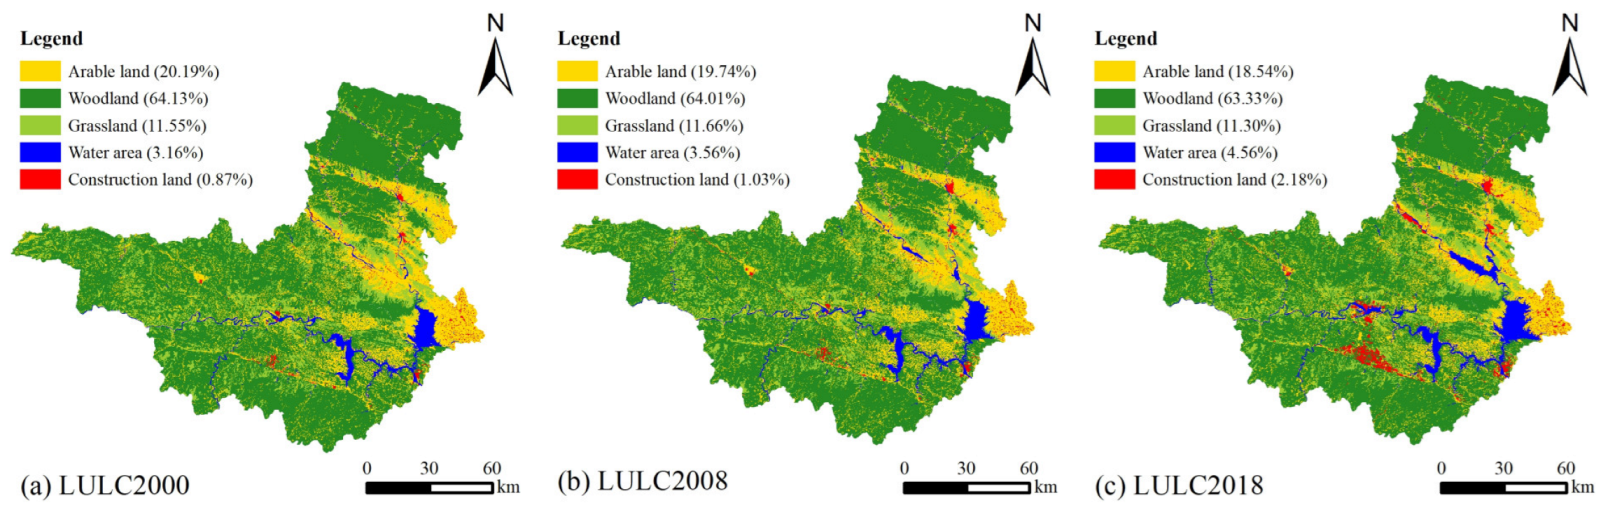
3.1. LULC Change
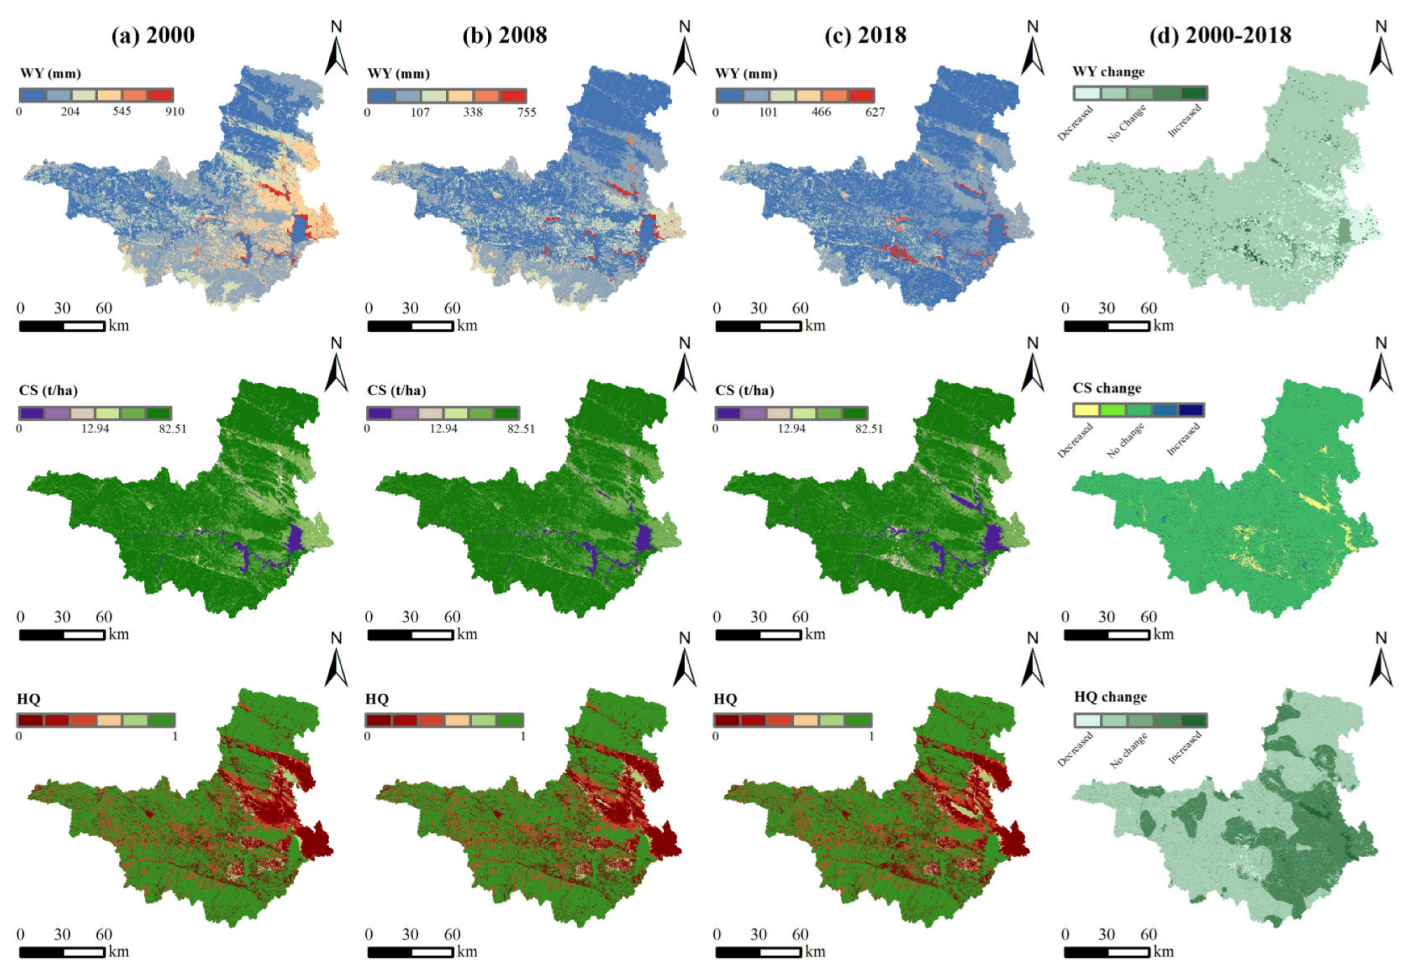
3.2. Temporal-Spatial Variations in Multiple ESs
3.2.1. Ecosystem Services Assessment
3.2.2. Ecosystem Services Assessment
3.3. ESs Tradeoffs and Synergies
3.4. Driving Factors of ESs
4. Discussion
4.1. Temporal-Spatial Evolution of LULC and ESs in the Context of the Central Line of SNWDP
4.2. ESs Tradeoffs and Synergies
4.3. Policy Implications
4.4. Limitations and Prospects
5. Conclusions
Author Contributions
Funding
Data Availability Statement
Acknowledgments
Conflicts of Interest
References
- Hasan, S.S.; Zhen, L.; Miah, M.G.; Ahamed, T.; Samie, A. Impact of land use change on ecosystem services: A review. Environ. Dev. 2020, 34, 100527. [Google Scholar] [CrossRef]
- Li, W.; Hai, X.; Han, L.; Mao, J.; Tian, M. Does urbanization intensify regional water scarcity? Evidence and implications from a megaregion of China. J. Clean. Prod. 2020, 244, 118592. [Google Scholar] [CrossRef]
- Li, X.Y.; Ma, Y.J.; Xu, H.Y.; Wang, J.H.; Zhang, D.S. Impact of land use and land cover change on environmental degradation in lake Qinghai watershed, northeast Qinghai-Tibet Plateau. Land Degrad. Dev. 2009, 20, 69–83. [Google Scholar] [CrossRef]
- Hu, M.; Li, Z.; Wang, Y.; Jiao, M.; Li, M.; Xia, B. Spatio-temporal changes in ecosystem service value in response to land-use/cover changes in the Pearl River Delta. Resour. Conserv. Recycl. 2019, 149, 106–114. [Google Scholar] [CrossRef]
- Zhang, X.; Song, W.; Lang, Y.; Feng, X.; Yuan, Q.; Wang, J. Land use changes in the coastal zone of China’s Hebei Province and the corresponding impacts on habitat quality. Land Use Policy 2020, 99, 104957. [Google Scholar] [CrossRef]
- Millennium Ecosystem Assessment. Ecosystems And Human Well-Being: Synthesis; Island Press: Washington, DC, USA, 2005. [Google Scholar]
- Wang, X.-J.; Zhang, J.-Y.; Gao, J.; Shahid, S.; Xia, X.-H.; Geng, Z.; Tang, L. The new concept of water resources management in China: Ensuring water security in changing environment. Environ. Dev. Sustain. 2017, 20, 897–909. [Google Scholar] [CrossRef]
- Liu, H.; Yin, J.; Feng, L. The Dynamic Changes in the Storage of the Danjiangkou Reservoir and the Influence of the South-North Water Transfer Project. Sci. Rep. 2018, 8, 8710. [Google Scholar] [CrossRef] [PubMed] [Green Version]
- Ma, Y.-J.; Li, X.-Y.; Wilson, M.; Wu, X.-C.; Smith, A.; Wu, J. Water loss by evaporation from China’s South-North Water Transfer Project. Ecol. Eng. 2016, 95, 206–215. [Google Scholar] [CrossRef] [Green Version]
- Shen, Z.; Zhang, Q.; Yue, C.; Zhao, J.; Hu, Z.; Lv, N.; Tang, Y. The Spatial Pattern of Land Use/Land Cover in the Water Supplying Area of the Middle-Route of the South-to-North Water Diversion (MR-SNWD) Project. Acta Geogr. Sin. 2006, 6, 633–644. (In Chinese) [Google Scholar]
- Dong, M.T.; Tang, M.F.; Li, S.Y.; Cao, H.M.; Deng, H.B.; Wu, G. Effects of water transfer project construction on vegetation patterns. Acta Ecol. Sin. 2016, 36, 6656–6663. (In Chinese) [Google Scholar]
- Wang, Y.; Zhang, Q.; Bilsborrow, R.; Tao, S.; Chen, X.; Sullivan-Wiley, K.; Huang, Q.; Li, J.; Song, C. Effects of payments for ecosystem services programs in China on rural household labor allocation and land use: Identifying complex pathways. Land Use Policy 2020, 99, 105024. [Google Scholar] [CrossRef] [PubMed]
- Costanza, R.; dArge, R.; deGroot, R.; Farber, S.; Grasso, M.; Hannon, B.; Limburg, K.; Naeem, S.; Oneill, R.V.; Paruelo, J.; et al. The value of the world’s ecosystem services and natural capital. Nature 1997, 387, 253–260. [Google Scholar] [CrossRef]
- Daily, G.C. Nature’s Services: Societal Dependence on Natural Ecosystems; Island Press: Washington, DC, USA, 1997. [Google Scholar]
- Grêt-Regamey, A.; Weibel, B. Global assessment of mountain ecosystem services using earth observation data. Ecosyst. Serv. 2020, 46, 101213. [Google Scholar] [CrossRef]
- Ahammad, R.; Stacey, N.; Sunderland, T. Analysis of forest-related policies for supporting ecosystem services-based forest management in Bangladesh. Ecosyst. Serv. 2021, 48, 101235. [Google Scholar] [CrossRef]
- Wu, J.; Wang, G.; Chen, W.; Pan, S.; Zeng, J. Terrain gradient variations in the ecosystem services value of the Qinghai-Tibet Plateau, China. Glob. Ecol. Conserv. 2022, 34, e02008. [Google Scholar] [CrossRef]
- Tao, Y.; Li, F.; Wang, R.; Zhao, D. Effects of land use and cover change on terrestrial carbon stocks in urbanized areas: A study from Changzhou, China. J. Clean. Prod. 2015, 103, 651–657. [Google Scholar] [CrossRef]
- Chen, W.; Chi, G.; Li, J. The spatial aspect of ecosystem services balance and its determinants. Land Use Policy 2020, 90, 104263. [Google Scholar] [CrossRef]
- Liang, J.; Li, S.; Li, X.; Li, X.; Liu, Q.; Meng, Q.; Lin, A.; Li, J. Trade-off analyses and optimization of water-related ecosystem services (WRESs) based on land use change in a typical agricultural watershed, southern China. J. Clean. Prod. 2021, 279, 123851. [Google Scholar] [CrossRef]
- Wu, C.; Chen, B.; Huang, X.; Dennis Wei, Y.H. Effect of land-use change and optimization on the ecosystem service values of Jiangsu province, China. Ecol. Indic. 2020, 117, 106507. [Google Scholar] [CrossRef]
- Fu, Q.; Li, B.; Hou, Y.; Bi, X.; Zhang, X. Effects of land use and climate change on ecosystem services in Central Asia’s arid regions: A case study in Altay Prefecture, China. Sci. Total Environ. 2017, 607–608, 633–646. [Google Scholar] [CrossRef]
- Dennedy-Frank, P.J.; Muenich, R.L.; Chaubey, I.; Ziv, G. Comparing two tools for ecosystem service assessments regarding water resources decisions. J. Environ. Manag. 2016, 177, 331–340. [Google Scholar] [CrossRef] [PubMed] [Green Version]
- Cong, W.; Sun, X.; Guo, H.; Shan, R. Comparison of the SWAT and InVEST models to determine hydrological ecosystem service spatial patterns, priorities and trade-offs in a complex basin. Ecol. Indic. 2020, 112, 106089. [Google Scholar] [CrossRef]
- Posner, S.; Verutes, G.; Koh, I.; Denu, D.; Ricketts, T. Global use of ecosystem service models. Ecosyst. Serv. 2016, 17, 131–141. [Google Scholar] [CrossRef]
- Sharp, R.; Chaplin-Kramer, R.; Wood, S.; Guerry, A.; Tallis, H.; Ricketts, T.; Nelson, E.; Ennaanay, D.; Wolny, S.; Olwero, N.; et al. InVEST User’s Guide; The Natural Capital Project: Stanford, CA, USA, 2018. [Google Scholar] [CrossRef]
- Ma, S.; Qiao, Y.-P.; Wang, L.-J.; Zhang, J.-C. Terrain gradient variations in ecosystem services of different vegetation types in mountainous regions: Vegetation resource conservation and sustainable development. For. Ecol. Manag. 2021, 482, 118856. [Google Scholar] [CrossRef]
- Harrison, P.A.; Berry, P.M.; Simpson, G.; Haslett, J.R.; Blicharska, M.; Bucur, M.; Dunford, R.; Egoh, B.; Garcia-Llorente, M.; Geamănă, N.; et al. Linkages between biodiversity attributes and ecosystem services: A systematic review. Ecosyst. Serv. 2014, 9, 191–203. [Google Scholar] [CrossRef] [Green Version]
- Shao, M.; Wu, L.; Li, F.; Lin, C. Spatiotemporal Dynamics of Ecosystem Services and the Driving Factors in Urban Agglomerations: Evidence From 12 National Urban Agglomerations in China. Front. Ecol. Evol. 2022, 10, 263. [Google Scholar] [CrossRef]
- Fang, L.; Wang, L.; Chen, W.; Sun, J.; Cao, Q.; Wang, S.; Wang, L. Identifying the impacts of natural and human factors on ecosystem service in the Yangtze and Yellow River Basins. J. Clean. Prod. 2021, 314, 127995. [Google Scholar] [CrossRef]
- Lee, H.; Lautenbach, S. A quantitative review of relationships between ecosystem services. Ecol. Indic. 2016, 66, 340–351. [Google Scholar] [CrossRef]
- Wang, H.; Liu, L.; Yin, L.; Shen, J.; Li, S. Exploring the complex relationships and drivers of ecosystem services across different geomorphological types in the Beijing-Tianjin-Hebei region, China (2000–2018). Ecol. Indic. 2021, 121, 107116. [Google Scholar] [CrossRef]
- Carpenter, S.R.; Mooney, H.A.; Agard, J.; Capistrano, D.; DeFries, R.S.; Diaz, S.; Dietz, T.; Duraiappah, A.K.; Oteng-Yeboah, A.; Pereira, H.M.; et al. Science for managing ecosystem services: Beyond the Millennium Ecosystem Assessment. Proc. Natl. Acad. Sci. USA 2009, 106, 1305–1312. [Google Scholar] [CrossRef] [PubMed] [Green Version]
- Rodriguez, J.P.; Beard, T.D.; Bennett, E.M.; Cumming, G.S.; Cork, S.J.; Agard, J.; Dobson, A.P.; Peterson, G.D. Trade-offs across space, time, and ecosystem services. Ecol. Soc. 2006, 11, 1–14. [Google Scholar] [CrossRef] [Green Version]
- Bennett, E.M.; Peterson, G.D.; Gordon, L.J. Understanding relationships among multiple ecosystem services. Ecol. Lett. 2009, 12, 1394–1404. [Google Scholar] [CrossRef]
- Wu, J. Landscape sustainability science: Ecosystem services and human well-being in changing landscapes. Landsc. Ecol. 2013, 28, 999–1023. [Google Scholar] [CrossRef]
- Raudsepp-Hearne, C.; Peterson, G.D.; Bennett, E.M. Ecosystem service bundles for analyzing tradeoffs in diverse landscapes. Proc. Natl. Acad. Sci. USA 2010, 107, 5242–5247. [Google Scholar] [CrossRef] [PubMed] [Green Version]
- Demestihas, C.; Plenet, D.; Genard, M.; Raynal, C.; Lescourret, F. A simulation study of synergies and tradeoffs between multiple ecosystem services in apple orchards. J. Environ. Manag. 2019, 236, 1–16. [Google Scholar] [CrossRef] [PubMed]
- Gonzalez-Redin, J.; Luque, S.; Poggio, L.; Smith, R.; Gimona, A. Spatial Bayesian belief networks as a planning decision tool for mapping ecosystem services trade-offs on forested landscapes. Environ. Res. 2016, 144 Pt B, 15–26. [Google Scholar] [CrossRef]
- Bai, Y.; Zhuang, C.; Ouyang, Z.; Zheng, H.; Jiang, B. Spatial characteristics between biodiversity and ecosystem services in a human-dominated watershed. Ecol. Complex. 2011, 8, 177–183. [Google Scholar] [CrossRef]
- Howe, C.; Suich, H.; Vira, B.; Mace, G.M. Creating win-wins from trade-offs? Ecosystem services for human well-being: A meta-analysis of ecosystem service trade-offs and synergies in the real world. Glob. Environ. Change 2014, 28, 263–275. [Google Scholar] [CrossRef] [Green Version]
- Tian, Y.; Wang, S.; Bai, X.; Luo, G.; Xu, Y. Trade-offs among ecosystem services in a typical Karst watershed, SW China. Sci. Total Environ. 2016, 566–567, 1297–1308. [Google Scholar] [CrossRef]
- Grasso, M. Ecological-economic model for optimal mangrove trade off between forestry and fishery production: Comparing a dynamic optimization and a simulation model. Ecol. Model. 1998, 112, 131–150. [Google Scholar] [CrossRef]
- Wang, Y.; Li, X.; Zhang, Q.; Li, J.; Zhou, X. Projections of future land use changes: Multiple scenarios-based impacts analysis on ecosystem services for Wuhan city, China. Ecol. Indic. 2018, 94, 430–445. [Google Scholar] [CrossRef]
- Zhao, J.; Li, C. Investigating Ecosystem Service Trade-Offs/Synergies and Their Influencing Factors in the Yangtze River Delta Region, China. Land 2022, 11, 106. [Google Scholar] [CrossRef]
- Daily, G.C.; Polasky, S.; Goldstein, J.; Kareiva, P.M.; Mooney, H.A.; Pejchar, L.; Ricketts, T.H.; Salzman, J.; Shallenberger, R. Ecosystem services in decision making: Time to deliver. Front. Ecol. Environ. 2009, 7, 21–28. [Google Scholar] [CrossRef] [Green Version]
- Jia, X.; Fu, B.; Feng, X.; Hou, G.; Liu, Y.; Wang, X. The tradeoff and synergy between ecosystem services in the Grain-for-Green areas in Northern Shaanxi, China. Ecol. Indic. 2014, 43, 103–113. [Google Scholar] [CrossRef]
- Gan, S.; Xiao, Y.; Qin, K.; Liu, J.; Xu, J.; Wang, Y.; Niu, Y.; Huang, M.; Xie, G. Analyzing the Interrelationships among Various Ecosystem Services from the Perspective of Ecosystem Service Bundles in Shenyang, China. Land 2022, 11, 515. [Google Scholar] [CrossRef]
- Yang, S.; Zhao, W.; Liu, Y.; Wang, S.; Wang, J.; Zhai, R. Influence of land use change on the ecosystem service trade-offs in the ecological restoration area: Dynamics and scenarios in the Yanhe watershed, China. Sci. Total Environ. 2018, 644, 556–566. [Google Scholar] [CrossRef]
- Geng, W.; Li, Y.; Zhang, P.; Yang, D.; Jing, W.; Rong, T. Analyzing spatio-temporal changes and trade-offs/synergies among ecosystem services in the Yellow River Basin, China. Ecol. Indic. 2022, 138, 108825. [Google Scholar] [CrossRef]
- Gao, Y.; Li, H.; Hou, R. Evolution Analysis on Trade-offs and Synergies of Ecosystem Services in Hanjiang River Basin. Resour. Environ. Yangtze Basin 2020, 29, 1619–1630. (In Chinese) [Google Scholar]
- Getis, A.; Ord, J.K. The Analysis of Spatial Association by Use of Distance Statistics. Geogr. Anal. 1992, 24, 189–206. [Google Scholar] [CrossRef]
- Wang, J.; XU, C. Geodetector: Principle and prospective. Acta Geogr. Sin. 2017, 72, 116–134. (In Chinese) [Google Scholar]
- Sun, W.; Li, D.; Wang, X.; Li, R.; Li, K.; Xie, Y. Exploring the scale effects, trade-offs and driving forces of the mismatch of ecosystem services. Ecol. Indic. 2019, 103, 617–629. [Google Scholar] [CrossRef]
- Luo, Q.; Zhou, J.; Li, Z.; Yu, B. Spatial differences of ecosystem services and their driving factors: A comparation analysis among three urban agglomerations in China’s Yangtze River Economic Belt. Sci. Total Environ. 2020, 725, 138452. [Google Scholar] [CrossRef]
- Chen, W.; Chi, G.; Li, J. Ecosystem Services and Their Driving Forces in the Middle Reaches of the Yangtze River Urban Agglomerations, China. Int. J. Environ. Res. Public Health 2020, 17, 3717. [Google Scholar] [CrossRef]
- Liu, C.; Wu, X.; Wang, L. Analysis on land ecological security change and affect factors using RS and GWR in the Danjiangkou Reservoir area, China. Appl. Geogr. 2019, 105, 1–14. [Google Scholar] [CrossRef]
- Liu, W.; Zhan, J.; Zhao, F.; Yan, H.; Zhang, F.; Wei, X. Impacts of urbanization-induced land-use changes on ecosystem services: A case study of the Pearl River Delta Metropolitan Region, China. Ecol. Indic. 2019, 98, 228–238. [Google Scholar] [CrossRef]
- Guo, C.; Gao, J.; Zhou, B.; Yang, J. Factors of the Ecosystem Service Value in Water Conservation Areas Considering the Natural Environment and Human Activities: A Case Study of Funiu Mountain, China. Int. J. Environ. Res. Public Health 2021, 18, 11074. [Google Scholar] [CrossRef] [PubMed]
- Li, G.; Zhang, F.; Jing, Y.; Liu, Y.; Sun, G. Response of evapotranspiration to changes in land use and land cover and climate in China during 2001–2013. Sci. Total Environ. 2017, 596–597, 256–265. [Google Scholar] [CrossRef] [PubMed]
- Cheng, X.L.; Yang, Y.H.; Li, M.; Dou, X.L.; Zhang, Q.F. The impact of agricultural land use changes on soil organic carbon dynamics in the Danjiangkou Reservoir area of China. Plant Soil 2013, 366, 415–424. [Google Scholar] [CrossRef]
- Ma, X.; Zhu, J.; Zhang, H.; Yan, W.; Zhao, C. Trade-offs and synergies in ecosystem service values of inland lake wetlands in Central Asia under land use/cover change: A case study on Ebinur Lake, China. Glob. Ecol. Conserv. 2020, 24, e01253. [Google Scholar] [CrossRef]
- Zhang, B.; Wang, Y.; Li, J.; Zheng, L. Degradation or Restoration? The Temporal-Spatial Evolution of Ecosystem Services and Its Determinants in the Yellow River Basin, China. Land 2022, 11, 863. [Google Scholar] [CrossRef]
- Shammi, S.A.; Meng, Q. Use time series NDVI and EVI to develop dynamic crop growth metrics for yield modeling. Ecol. Indic. 2021, 121, 107124. [Google Scholar] [CrossRef]
- French, A.N.; Hunsaker, D.J.; Sanchez, C.A.; Saber, M.; Gonzalez, J.R.; Anderson, R. Satellite-based NDVI crop coefficients and evapotranspiration with eddy covariance validation for multiple durum wheat fields in the US Southwest. Agric. Water Manag. 2020, 239, 106266. [Google Scholar] [CrossRef]
- Fu, B.; Wang, S.; Su, C.; Forsius, M. Linking ecosystem processes and ecosystem services. Curr. Opin. Environ. Sustain. 2013, 5, 4–10. [Google Scholar] [CrossRef]


| Type | Data | Source | Precision |
|---|---|---|---|
| Raster | LULC | Resources and Environmental Sciences and Data Center, Chinese Academy of Sciences (https://www.resdc.cn/ (accessed on 20 October 2022)) | 30 m |
| DEM | 30 m | ||
| Annual precipitation | 1 km | ||
| NDVI | 1 km | ||
| GDP | 1 km | ||
| China soil Database | National Tibetan Plateau Data Center (http://data.tpdc.ac.cn (accessed on 22 October 2022)) | 1 km | |
| Potential evapotranspiration | Global Aridity Index and Potential Evapotranspiration (ET0) Climate Database v2 (https://doi.org/10.6084/m9.figshare.7504448.v3 (accessed on 20 October 2022)) | 1 km | |
| Vector | Roads | Resources and Environmental Sciences and Data Center, Chinese Academy of Sciences (https://www.resdc.cn/ (accessed on 20 October 2022)) | / |
| Rivers | / | ||
| Administrative boundary | / | ||
| City location | / |
| Year | 2018 | Decreased | |||||||
|---|---|---|---|---|---|---|---|---|---|
| LULC | Arable Land | Woodland | Grass Land | Water Area | Construction Land | Unused Land | Total | ||
| 2000 | Arable land | 2805.42 | 348.92 | 78.58 | 229.42 | 155.43 | 0.00 | 3617.77 | 812.35 |
| Woodland | 377.03 | 10,811.58 | 149.63 | 51.95 | 99.57 | 0.24 | 11,490.00 | 678.42 | |
| Grassland | 84.80 | 162.13 | 1791.58 | 14.62 | 17.11 | 0.03 | 2070.27 | 278.69 | |
| Water area | 21.12 | 20.35 | 3.86 | 534.68 | 3.43 | 0.00 | 583.44 | 48.76 | |
| Construction Land | 34.48 | 4.02 | 0.59 | 1.72 | 115.62 | 0.00 | 156.43 | 40.81 | |
| Total | 3322.85 | 11,347.00 | 2024.24 | 832.39 | 391.16 | 0.27 | 17,917.91 | - | |
| Increased | 517.43 | 535.42 | 232.66 | 297.71 | 275.54 | 0.27 | - | 1859.03 | |
| Year | Water Yield (mm) | Carbon Storage (t/ha) | Habitat Quality |
|---|---|---|---|
| 2000 | 192.23 | 72.64 | 0.83 |
| 2008 | 78.59 | 72.35 | 0.83 |
| 2018 | 61.25 | 70.93 | 0.83 |
| Detection Factors | Water Yield | Carbon Storage | Habitat Quality | ||||
|---|---|---|---|---|---|---|---|
| q | p | q | p | q | p | ||
| Road network density | X1 | 0.8285 *** | 0.000 | 0.6097 *** | 0.000 | 0.5920 *** | 0.000 |
| Construction land ratio | X2 | 0.7636 *** | 0.000 | 0.6128 *** | 0.000 | 0.6235 *** | 0.000 |
| Distance to the county | X3 | 0.3034 *** | 0.000 | 0.2463 | 0.1330 | 0.2337 | 0.1031 |
| GDP | X4 | 0.2993 | 0.1780 | 0.4061 *** | 0.000 | 0.3309 *** | 0.000 |
| River network density | X5 | 0.2197 *** | 0.000 | 0.1184 | 0.1122 | 0.1449 * | 0.0373 |
| Annual precipitation | X6 | 0.1155 * | 0.0291 | 0.2643 * | 0.0238 | 0.2961 ** | 0.0044 |
| NDVI | X7 | 0.3939 *** | 0.000 | 0.6036 *** | 0.000 | 0.4635 *** | 0.000 |
| Slope | X8 | 0.1570 ** | 0.0034 | 0.3181 | 0.0553 | 0.2830 | 0.1079 |
Disclaimer/Publisher’s Note: The statements, opinions and data contained in all publications are solely those of the individual author(s) and contributor(s) and not of MDPI and/or the editor(s). MDPI and/or the editor(s) disclaim responsibility for any injury to people or property resulting from any ideas, methods, instructions or products referred to in the content. |
© 2023 by the authors. Licensee MDPI, Basel, Switzerland. This article is an open access article distributed under the terms and conditions of the Creative Commons Attribution (CC BY) license (https://creativecommons.org/licenses/by/4.0/).
Share and Cite
Liu, L.; Zheng, L.; Wang, Y.; Liu, C.; Zhang, B.; Bi, Y. Land Use and Ecosystem Services Evolution in Danjiangkou Reservoir Area, China: Implications for Sustainable Management of National Projects. Land 2023, 12, 788. https://doi.org/10.3390/land12040788
Liu L, Zheng L, Wang Y, Liu C, Zhang B, Bi Y. Land Use and Ecosystem Services Evolution in Danjiangkou Reservoir Area, China: Implications for Sustainable Management of National Projects. Land. 2023; 12(4):788. https://doi.org/10.3390/land12040788
Chicago/Turabian StyleLiu, Linghua, Liang Zheng, Ying Wang, Chongchong Liu, Bowen Zhang, and Yuzhe Bi. 2023. "Land Use and Ecosystem Services Evolution in Danjiangkou Reservoir Area, China: Implications for Sustainable Management of National Projects" Land 12, no. 4: 788. https://doi.org/10.3390/land12040788