Article

Can the Development of the Digital Economy Reduce Urban Carbon Emissions? Case Study of Guangdong Province

Guangdong Provincial Key Laboratory of Urbanization and Geo-Simulation, School of Geography and Planning, Sun Yat-sen University, Guangzhou 510275, China
*
Author to whom correspondence should be addressed.
Land 2023, 12(4), 787; https://doi.org/10.3390/land12040787
Submission received: 2 March 2023 / Revised: 15 March 2023 / Accepted: 28 March 2023 / Published: 30 March 2023

Abstract

:
The digital economy plays an important role in the high-quality development of cities, and low-carbon urban development is an integral part of this evolution. Therefore, it is important to explore the impact of the development of the digital economy on urban carbon emissions. By considering 21 cities in Guangdong Province as the object of the research, this study measured the levels of the digital economy from 2011 to 2019 by using an entropy weight-based TOPSIS model, analyzed the spatiotemporal changes, and used geographically and temporally weighted regression to examine the spatiotemporal heterogeneity of the impact of the digital economy on urban carbon emissions. The results showed the following: (1) The development of the digital economy in Guangdong Province in general exhibited a stable trend of growth, and the average level of its development in the 21 cities considered increased by 3.4 times during the study period. (2) The level of development of the digital economy in the Pearl River Delta was significantly higher than that in northern, western, and eastern Guangdong, with Shenzhen being the most developed city in this regard (0.8473), and Shanwei being the least developed (0.0633). (3) The impact of the development of the digital economy on carbon emissions had significant spatiotemporal heterogeneity. The benefits of the development of the digital economy in terms of a reduction in carbon emissions was the most significant in the Pearl River Delta, and regional differences were prominent. (4) The reductions in carbon emissions in cities with a highly developed digital economy were more significant than has been reported in past studies in the area. However, it had a negative effect on the urban carbon emissions in cities with a poorly developed digital economy. The results of this study can be used to guide policies related to the high-quality development of the urban digital economy.

1. Introduction

Global climate change poses a daunting threat to the survival and prosperity of humanity. Greenhouse gas emissions (mainly, carbon dioxide) generated by the activities of human production are a major contributor to climate change [1,2,3]. As the major hub of human agglomerations [4], cities are responsible for about 75% of global carbon dioxide emissions, while occupying only 2% of land on Earth [5]. The relevant research has shown that about 60% of global carbon emissions are generated by only 20% of the world’s high emitters and are mainly concentrated in large cities [6]. Thirty-five cities in China generate 40% of the country’s energy and carbon dioxide emissions [7,8]. Cities are, thus, energy-intensive areas with high levels of emissions [9,10]. We, therefore, need to attend to the role of cities in reducing global carbon emissions to achieve the goals of low-carbon, green, and high-quality development [11].
The emergence and extensive use of information and communication technology (ICT) at the turn of the century spawned the digital economy. It has since become ubiquitous because of the proliferation of the Internet and has significantly improved the scope and efficiency of enterprises in producing and providing goods and services [12]. The digital revolution and, thus, the digital economy have penetrated into all modes of social reproduction, distribution, exchange, and consumption, and are driving high-quality global economic development. The digital economy has gradually become an important part of China’s national economy as well [13]. According to data from the White Paper on the Development of China’s Digital Economy, the contribution of the digital economy to national income rose from CNY 9.5 trillion in 2011 to CNY 39.2 trillion in 2020, and its ratio of China’s GDP increased to 38.6% at a rate of 9.7% in this period. This is much higher than the nominal rate of growth of the GDP in the same period.
The development of the digital economy has led to many changes, and its effect in improving the environment has lately emerged as a focus of research. The relationship between the digital economy and carbon emissions has also attracted interest. Research has shown that the development of the digital economy can improve China’s carbon-related productivity [14], the use of ICT can reduce carbon emissions [15], and the development of the Internet has significantly improved energy efficiency and reduced carbon emissions [16]. The development of the digital economy can, thus, reduce the emission of various pollutants, drive the development of low-carbon industries, and reduce the intensity of carbon emissions [17] to reduce urban emissions [18]. On the one hand, the development of the digital economy can reduce material consumption, and such low-carbon technologies such as e-books, email, video conferencing, and paperless offices can reduce resource consumption and carbon emissions [19]. On the other hand, the use of new technologies has enriched the methods for environmental monitoring and provided the relevant data in a timely manner. The use of the Internet has also enhanced public awareness of and participation in environmental protection [20]. Moreover, the digital economy can promote technological progress as well as industrial transformation, eliminate industries that consume a large amount of energy and emit greenhouse gases, and promote green and high-quality urban development by optimizing the industrial structure of cities [21,22,23].
As the development of the digital economy can promote a reduction in urban carbon emissions [24,25,26,27], it is pertinent to ask whether its continued development will further enhance or reduce its benefits in terms of emissions reduction, and whether cities with varying levels of development of the digital economy reap these benefits. In this study, the authors measure the levels of development of the digital economy in 21 cities in the Guangdong Province of China from four perspectives, the digital infrastructure, the development of the digital industry, innovations in digital technology, and digitally inclusive finance, based on the entropy weight-based technique for order preference by similarity to an ideal solution (TOPSIS) model, and analyze the spatiotemporal changes in its structure [28]. We then use the geographically and temporally weighted regression (GTWR) model to study the effects of the digital economy in terms of reducing urban carbon emissions, to examine the spatiotemporal heterogeneity of its impact. The results verified spatiotemporal heterogeneity in its effect, such that regional differences in the development of the digital economy have led to differences in its effect on reducing carbon emissions. The carbon emissions of some of the cities considered here were even found to have significantly increased in the course of the development of the digital economy. The work here complements prevalent research in the area and aims to provide a valuable scientific basis and a theoretical reference for promoting the digital economy, as well as high-quality urban development.

2. Materials and Methods

2.1. Entropy Weight-Based TOPSIS Model

The development of the digital economy is a multi-dimensional phenomenon. In light of past work in the area [29,30,31], we use the entropy weight-based TOPSIS model to measure its development in the four dimensions described above (Table 1).
The entropy weight-based TOPSIS model is a multi-objective method for analyzing decisions that consists of the entropy weight-based method and the TOPSIS method. The entropy weight-based method is first used to determine the objective weights of the evaluation indices according to the degree of changes in them, and TOPSIS is then used to quantitatively rank the levels of development of the digital economy of 21 cities in Guangdong Province. The entropy weight-based TOPSIS method has the advantages of objectivity, accuracy, and scientificity, such that it can avoid the deviations caused by subjective factors while evaluating the advantages and disadvantages of currently available indicators to yield objective and reasonable results [32]. The specific steps are as follows:
(1) Assuming that there are m objects to be evaluated and n evaluation indicators for each, construct the original judgment matrix X :
X = x i j m × n i = 1 , 2 , , m ; j = 1 , 2 , , n
(2) Standardize the judgment matrix and construct the standardized matrix Z :
Positive   indices :   z i j = x i j min x i j max x i j min x i j
Negative   indices :   z i j = max x i j x i j max x i j min x i j
where i represents the city and j the corresponding indicator, X m a x and X m i n represent the maximum and minimum values of X i j , respectively, and Z represents the standardized values.
(3) Calculate the weight W of the index: The entropy method can use the information inherent in the evaluation index to reflect the effect of its value [33]. This compensates for the shortcomings of the subjective assignment of values. The process of calculation is as follows:
① Use the standardized value to calculate the proportion P i j of the value of the i-th object of the evaluation under item i :
P i j = Y i j / i = 1 m Y i j
② Calculate the informational entropy   e j :
e j = k i = 1 m P i j ln P i j ,   k = 1 / ln m
③ Calculate the weight of each indicator w i :
w i = 1 e i 1 m 1 e i
④ Build the weighted matrix R :
R = r i j m × n , r i j = ω j x i j   i = 1 , 2 , , m ; j = 1 , 2 , , n
⑤ Determine the optimal solution S j + and the worst solution S j :
S j + = max r 1 j , r 2 j , , r n j , S j = min r 1 j , r 2 j , , r n j
⑥ Calculate the Euclidean distance between each scheme, and the optimal and worst solutions:
s e p i + = j = 1 n s j + r i j 2   ,   s e p i = j = 1 n s j r i j 2
⑦ Calculate the relative proximity Ci of each evaluation object to the optimal solution:
C i = s e p i s e p i + + s e p i   , C i 0 , 1
In the above, the larger the value of C i is, the better is the corresponding object of evaluation. This represents a higher level of development of the digital economy.

2.2. Geographically and Temporally Weighted Regression Model (GTWR)

A geographically weighted regression model (GWR) incorporates spatial elements and is based on a global regression model with non-parametric regression [34]. Its general form is as follows:
Y i = β o u i , v i + k = 1 p β k u i , v i x i k + ε i ; k = 1 , 2 , p ; i = 1 , 2 , , n
In Equation (11), the k-th explanatory variable of the observation unit i is x i k , u i , v i are the coordinates of i , β k u i , v i is a geographic location function, and ε i is the residual term.
To overcome the problem whereby the GWR model cannot process spatiotemporal data, Huang et al. extended it by introducing time (T) to obtain a geographically weighted spatiotemporal model of regression [35,36,37]:
y i = β o u i , v i , t i + k = 1 p β k u i , v i , t i x i k + ε i ; i = 1 , 2 , , n
In Equation (12), t i is the time coordinate of the observation unit i , β k u i , v i , t i is an unknown parameter of i , and ε i is an independent and identically distributed residual term.
The GTWR model is designed to simultaneously process non-stationary spatiotemporal data [38,39]. We used it along with variables representing the level of development of the digital economy to explore the spatiotemporal heterogeneity of their impact on urban carbon emissions. Tests on significance and multiple collinearity were performed on the selected variables, and the results (Table 2) showed that the VIF value of each variable was smaller than 10 and there was a significant correlation between them. This suggests that none of the influential factors considered were multi-collinear, that is, the variables had been reasonably selected. The model measured the reduction in carbon emissions brought about by the development of the digital economy in different regions during the study period (2011–2019), where this can explain the spatiotemporal heterogeneity of its effects. The advantage of GTWR models is that each model is local with respect to time and location, and this makes the final model more representative than the global model.

2.3. Study Areas and Data Sources

As the first province in China to develop a digital economy, Guangdong has since been at the forefront of the digital revolution in the country and has ranked first in all the provinces in the country in terms of total revenue based on the digital economy from 2017 to 2021. Its digital economy was worth CNY 5.9 trillion in 2021, 47.5% of its GDP. Guangdong has the largest added value due to the digital economy and digital industrialization of all the provinces in China [40]. However, the cities of Guangdong vary considerably in terms of the natural resources, geographical location, level of development, and structure, such that a regional imbalance in the develop of the digital economy is prominent [41,42,43]. It is, thus, a suitable object for research to explore the spatiotemporal heterogeneity of the effect of the digital economy in reducing carbon emissions. We chose 21 cities from the Guangdong Province to this end (Figure 1).
All the data used in this study to measure the level of development of the digital economy were derived from the Guangdong Statistical Yearbooks (2011–2021), the Guangdong Science and Technology Yearbooks (2011–2021), and the China Digital Financial Inclusion Index (https://idf.pku.edu.cn/index.htm, accessed on 23 December 2022), measured by the Digital Finance Research Center of Peking University, in cooperation with Ant Financial Services Group. We used data on carbon emissions from the carbon emission inventory of the Chinese cities in the China Carbon Accounting Database (CEADS) (https://www.ceads.net.cn/data/city/, accessed on 23 December 2022). The very small amount of missing data was compensated for by interpolation.

3. Results and Analysis

3.1. Spatial Distributions of Digital Economy and Carbon Emissions in Guangdong Province

The results of the calculations on the digital economies of 21 cities in Guangdong Province (Figure 2) reflected a steady trend of growth. The average level of development of the digital economy increased by 3.4 times during the study period. The levels of development of the digital economy in Guangzhou, Shenzhen, Dongguan, Foshan, Zhuhai, and other cities in the Pearl River Delta were significantly higher than those of cities in the eastern, western, and northern areas of Guangdong. These cities are, thus, central to the development of the digital economy in the province. The Chaoshan region of east Guangdong formed the second echelon of development, while Jieyang, Chaozhou, and other cities, which have contributed significantly to the development of the digital economy in east Guangdong, formed the second hub of this evolution. Cities in north and west Guangdong were in the third echelon and lagged behind the other regions.
To explore the characteristics and evolution of the spatial distribution of the digital economy in Guangdong Province, we used ArcGIS 10.2 software to visualize it in the study area based on the results from 2011, 2015, and 2019, as shown in Figure 3.
The pattern of development of the digital economy in Guangdong Province generally exhibited a central aggregation, with Guangzhou and Shenzhen at the core, and a stepwise decline from the cities in the Pearl River Delta to the east, west, and north. On the one hand, the development of the digital economy in Guangdong exhibited a trend of polarization that was manifested in the spatial pattern of “high in the center and low in the surrounding areas,” with significant regional differences. Shenzhen’s digital economy was well ahead of those of the other cities in Guangdong, and this advantage was reflected in its annual expansion. Shenzhen’s level of development of the digital economy (0.79) in 2019 was 36% higher than that of Guangzhou (0.58), the second most developed city, and about 13 times higher than that of Heyuan City (0.06), which had the least developed digital economy. On the other hand, the development of the digital economy in the province exhibited a trickle-down trend that was manifested in its diffusion from the core to the surrounding cities. This is because such core cities as Guangzhou and Shenzhen influenced the development of the digital economy in neighboring cities through a spillover of digital technology. Moreover, the diffusion of digital resources from the core cities has improved the pattern and structure of urban development, due to the optimal allocation of the relevant resources [44].
To explore the spatial distribution and evolution of carbon emissions in Guangdong Province, we used ArcGIS 10.2 to map carbon emissions in the 21 cities from 2011 to 2019 (Figure 4). Carbon emissions in the study area were concentrated in cities in the Pearl River Delta, with prominent regional differences. Specifically, we found the following: (1) Carbon emissions in the Pearl River Delta were high, led by Guangzhou. (2) Although carbon emissions in West Guangdong were low, they were prominent relative to areas other than the Pearl River Delta and exhibited a trend of continuous growth. (3) The carbon emissions of the 21 cities in Guangdong Province considered here were similar to the spatial patterns in the development of their digital economies, that is, the Pearl River Delta region was prominent, while the other areas lagged behind.

3.2. Results of the GTWR Model

3.2.1. Credibility Analysis
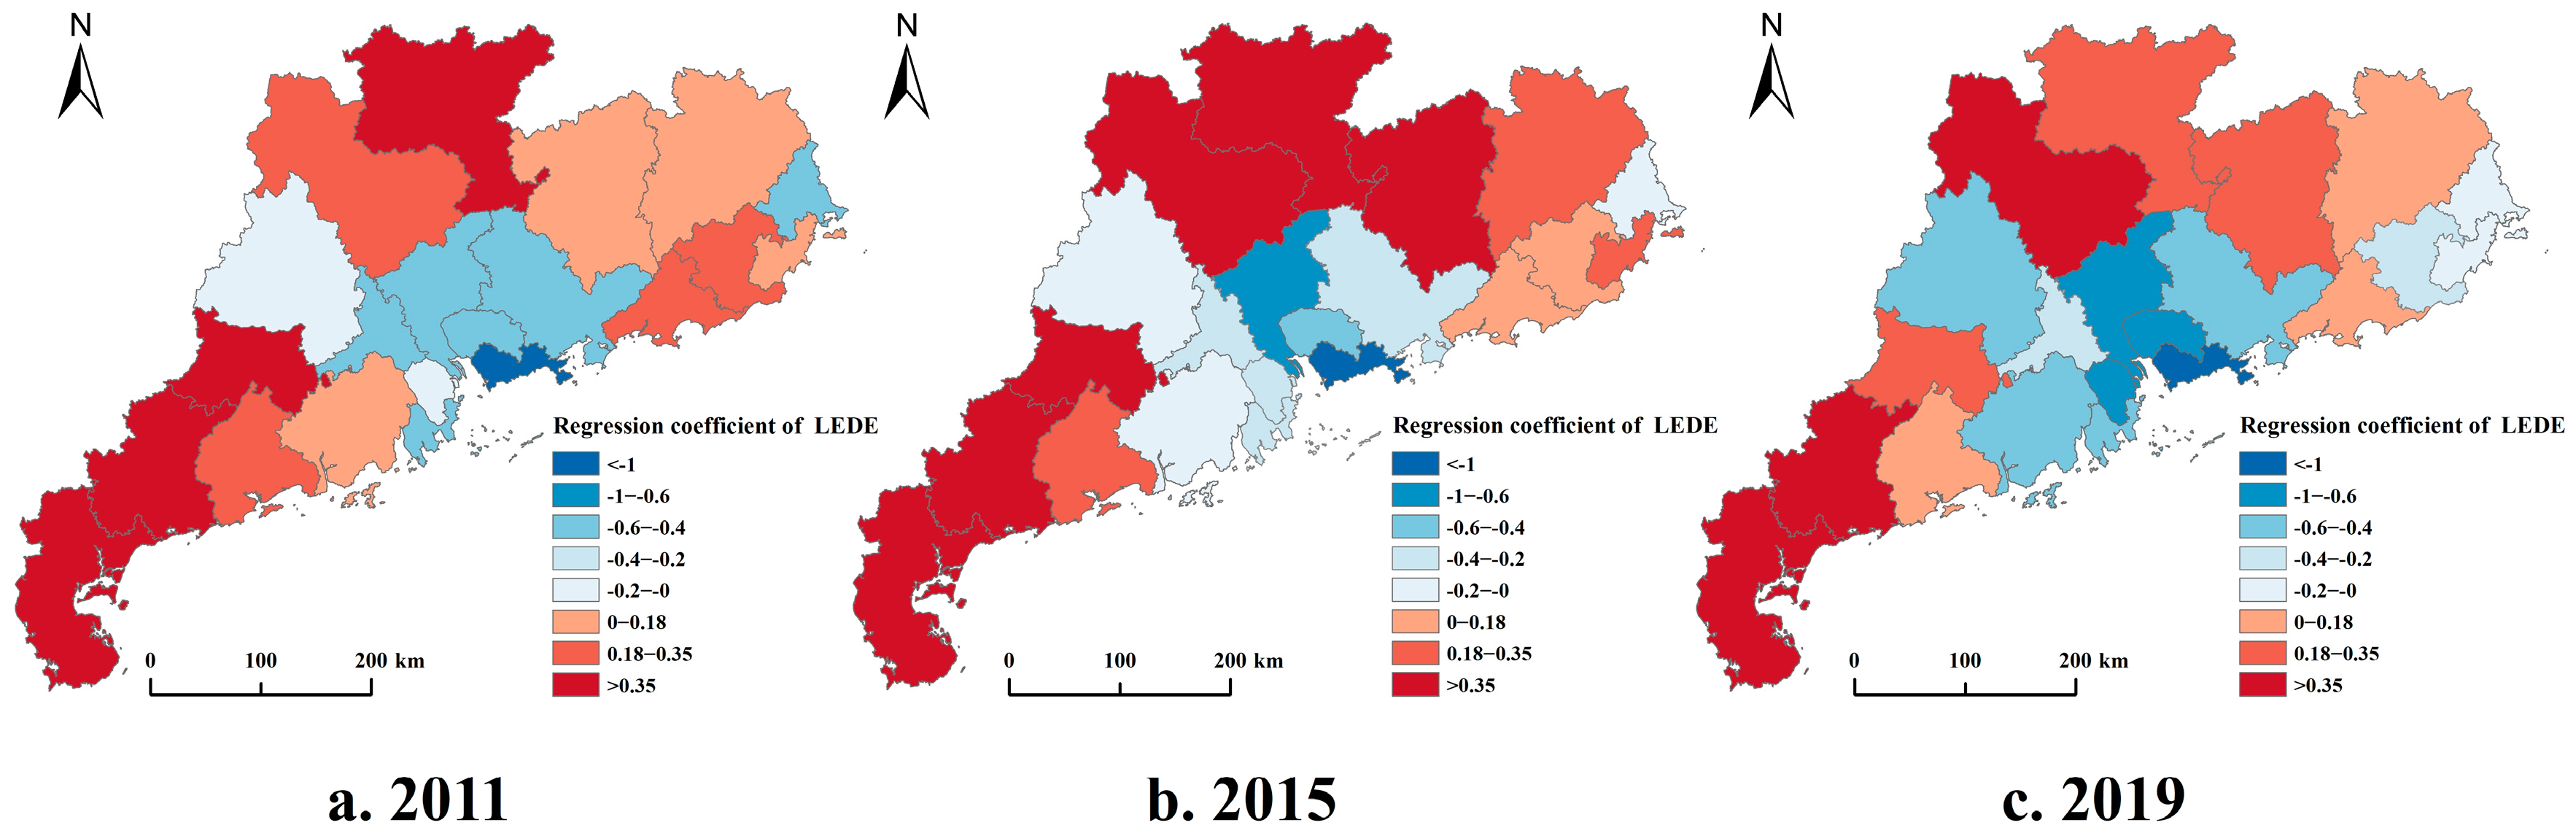
To verify the soundness of the proposed GTWR model, we compared it with the OLS regression, GWR, and TWR models in terms of variance and the degree of fit of the results by using the same variables. The results in Table 3 show that the GTWR model yielded a significantly better fit than the other three models. In addition, the values of AICc in the GTWR model were smaller than those of the other three, and a magnitude of difference of greater than three indicates that it had a higher validity.

3.2.2. Results

As shown in Table 4, the coefficients of regression of multiple variables influencing carbon emissions were estimated by using the GTWR model. The average coefficient of impact for the development of the digital economy (LEDE) on urban carbon emissions was negative (−0.03379), indicating that the former had significantly reduced the latter in Guangdong Province [45]. The coefficients of regression for the industrial structure (LNDS), the level of economic development (LEED), the level of urbanization (LEUB), and the openness to the world (LEOP) were positive, indicating that they had contributed to a significant increase in carbon emissions in Guangdong Province.
The average coefficient of regression for the level of the digital economy (LEDE) was negative in the lower quartile and positive in the upper quartile, which indicates that although the development of the digital economy in Guangdong Province as a whole led to a significant reduction in carbon emissions, it promoted carbon emissions at the local scale (mainly in cities with low levels of development of the digital economy). This indicates spatiotemporal heterogeneity in the effect of the digital economy in terms of reducing carbon emissions. Similarly, the lower quartiles as well as the minimum and mean values on the level of economic development (LEED), the level of openness to the world (LEOP), and the urbanization (LEUB) all have different positive and negative values, suggesting that the carbon reduction effect of these factors in some cities may be manifested as diametrically opposed to most cities. This result might have been obtained because higher economic development and urbanization promoted the spatial agglomeration of economic activities and factors of production [46], in turn prompting more efficient energy and resource use [47], reduced carbon emissions [48], and more openness to the world. This has led to technological progress and industrial upgrades to further reduce carbon emissions [49,50]. The industrial structure (INDS) led to an increase in carbon emissions in the study area.
There were significant spatiotemporal differences between the reductions in carbon emissions at the level of development of the digital economy, and they showed completely opposite trends in different regions and periods (Figure 5). A significant reduction in carbon emissions was observed in the Pearl River Delta, which had a highly developed digital economy. The reductions in carbon emissions have annually increased with the development of the digital economy in Shenzhen since 2014. Other cities in the Pearl River Delta have also exhibited this trend. This indicates that the development of the digital economy has led to an enhancement in its role in reducing carbon emissions over time. The corresponding coefficients of regression were mostly positive in east, west, and north Guangdong, where the digital economy is relatively underdeveloped. That is, the development of the digital economy in these regions led to an increase in urban carbon emissions to some extent. The coefficients of regression for the digital economy in most cities in Guangdong Province have gradually decreased in recent years, indicating that although the initial development of the digital economy might have increased urban carbon emissions, its effect in terms of reducing carbon emissions gradually became significant as it developed further.
We used ArcGIS 10.2 to generate a map of the spatial distribution of the coefficients of regression for the digital economy in the 21 cities in Guangdong Province from 2011 to 2019. We used 2011, 2015, and 2019 as time nodes (Figure 6). This yielded an overall pattern of central aggregation, with such cities in the Pearl River Delta as Guangzhou and Shenzhen forming the core, and gradually spreading out to the eastern, western, and northern regions of the province. The coefficients of regression for west and north Guangdong, the digital economies of which are relatively underdeveloped, were relatively high, possibly because these regions require a large investment in infrastructure to develop their digital economy, and this has led to an increase in regional carbon emissions. The coefficients of regression for Shantou and Jieyang in east Guangdong decreased significantly, from 0.03131 and 0.25326 in 2011 to −0.0697 and −0.2041 in 2019, respectively, indicating that the impact of digital economic development on carbon emissions had changed from negative to positive. This might have been related to the increasing level of development of the digital economy in these two cities during the study period. In general, the reductions in carbon emissions in cities with a highly developed digital economy were more significant than has been reported in past studies in the area. However, it had a negative effect on urban carbon emissions in cities with a poorly developed digital economy.

4. Discussion

4.1. Policy Implications

In the context of the shift in China’s economic evolution from high-speed development to high-quality development, the digital economy has become a new force driving this trend, and its impact on carbon emissions should be considered in the context of climate change [51,52]. In this study, the authors measured the level of development of the digital economy in 21 cities in Guangdong Province by combining the entropy weight-based method with the TOPSIS framework. Following this, we used the GTWR model to study the spatiotemporal heterogeneity of the impact of the digital economy on reducing carbon emissions. Previous studies have suggested that the digital economy can yield a reduction in urban carbon emissions, but the results here showed that there is significant spatiotemporal heterogeneity in the impact. The effects of the digital economy in terms of reducing carbon emissions at different levels of development were different, and it even contributed to a growth in emissions in some cases. In addition to its research-related importance, the results of this study have policy-related implications that prompt us to make the following recommendations:
(1) The government should seek to expand the advantages of reducing carbon emissions for regions with a highly developed digital economy. It should also encourage the development of smart cities, promote public participation in their governance, and accelerate the coverage and use of big data, smart devices, and communication platforms to enable the highly precise and intelligent control of carbon emissions, promote efficient energy use, and reduce resource consumption;
(2) The government should strengthen research on digital innovation and improve technical support for reducing carbon emissions. On the one hand, it needs to increase investment in R&D, promote cloud computing and the industrial Internet, and improve the application and transformation of basic and publicly applicable technologies, as well as the efficiency of production. On the other hand, it should focus on research on and the development of low-carbon energy and carbon-capturing technologies;
(3) The government needs to implement heterogeneous developmental strategies in light of the spatial heterogeneity of the role of the digital economy in reducing carbon emissions. The pace of the development of the digital economy in different regions should be adjusted to reduce the differences between them.

4.2. Research Perspectives

Although this study supplements research on the digital economy and carbon emissions and provides a theoretical reference for examining the effect of the digital economy on improving the environment, it also has certain limitations. We measured the development of the urban digital economy in Guangdong Province from four perspectives: the digital infrastructure, the development of the digital industry, innovations in digital technology, and digital inclusion. However, the limited amount of available data might have affected the measurements. Moreover, although we analyzed the spatiotemporal differences in the impact of the digital economy on carbon emissions, we did not explore the theoretical mechanism of this impact. This should be investigated in future research in the area.

5. Conclusions

Carbon emissions are often closely related to urban development, but few studies have investigated the effects of digital economic development on reductions in carbon emissions in urban areas. In the context of the high-quality development of China’s urban economy, society, and ecological environment, it is important to explore this effect. In this study, the authors measured the spatiotemporal changes in the levels of development of the digital economy in 21 cities in Guangdong Province from 2011 to 2020, based on the entropy weight-based TOPSIS model. We used the geographically and temporally weighted regression model to examine the spatiotemporal heterogeneity of the impact of the development of the digital economy in urban areas on carbon emissions. The results showed the following:
(1)
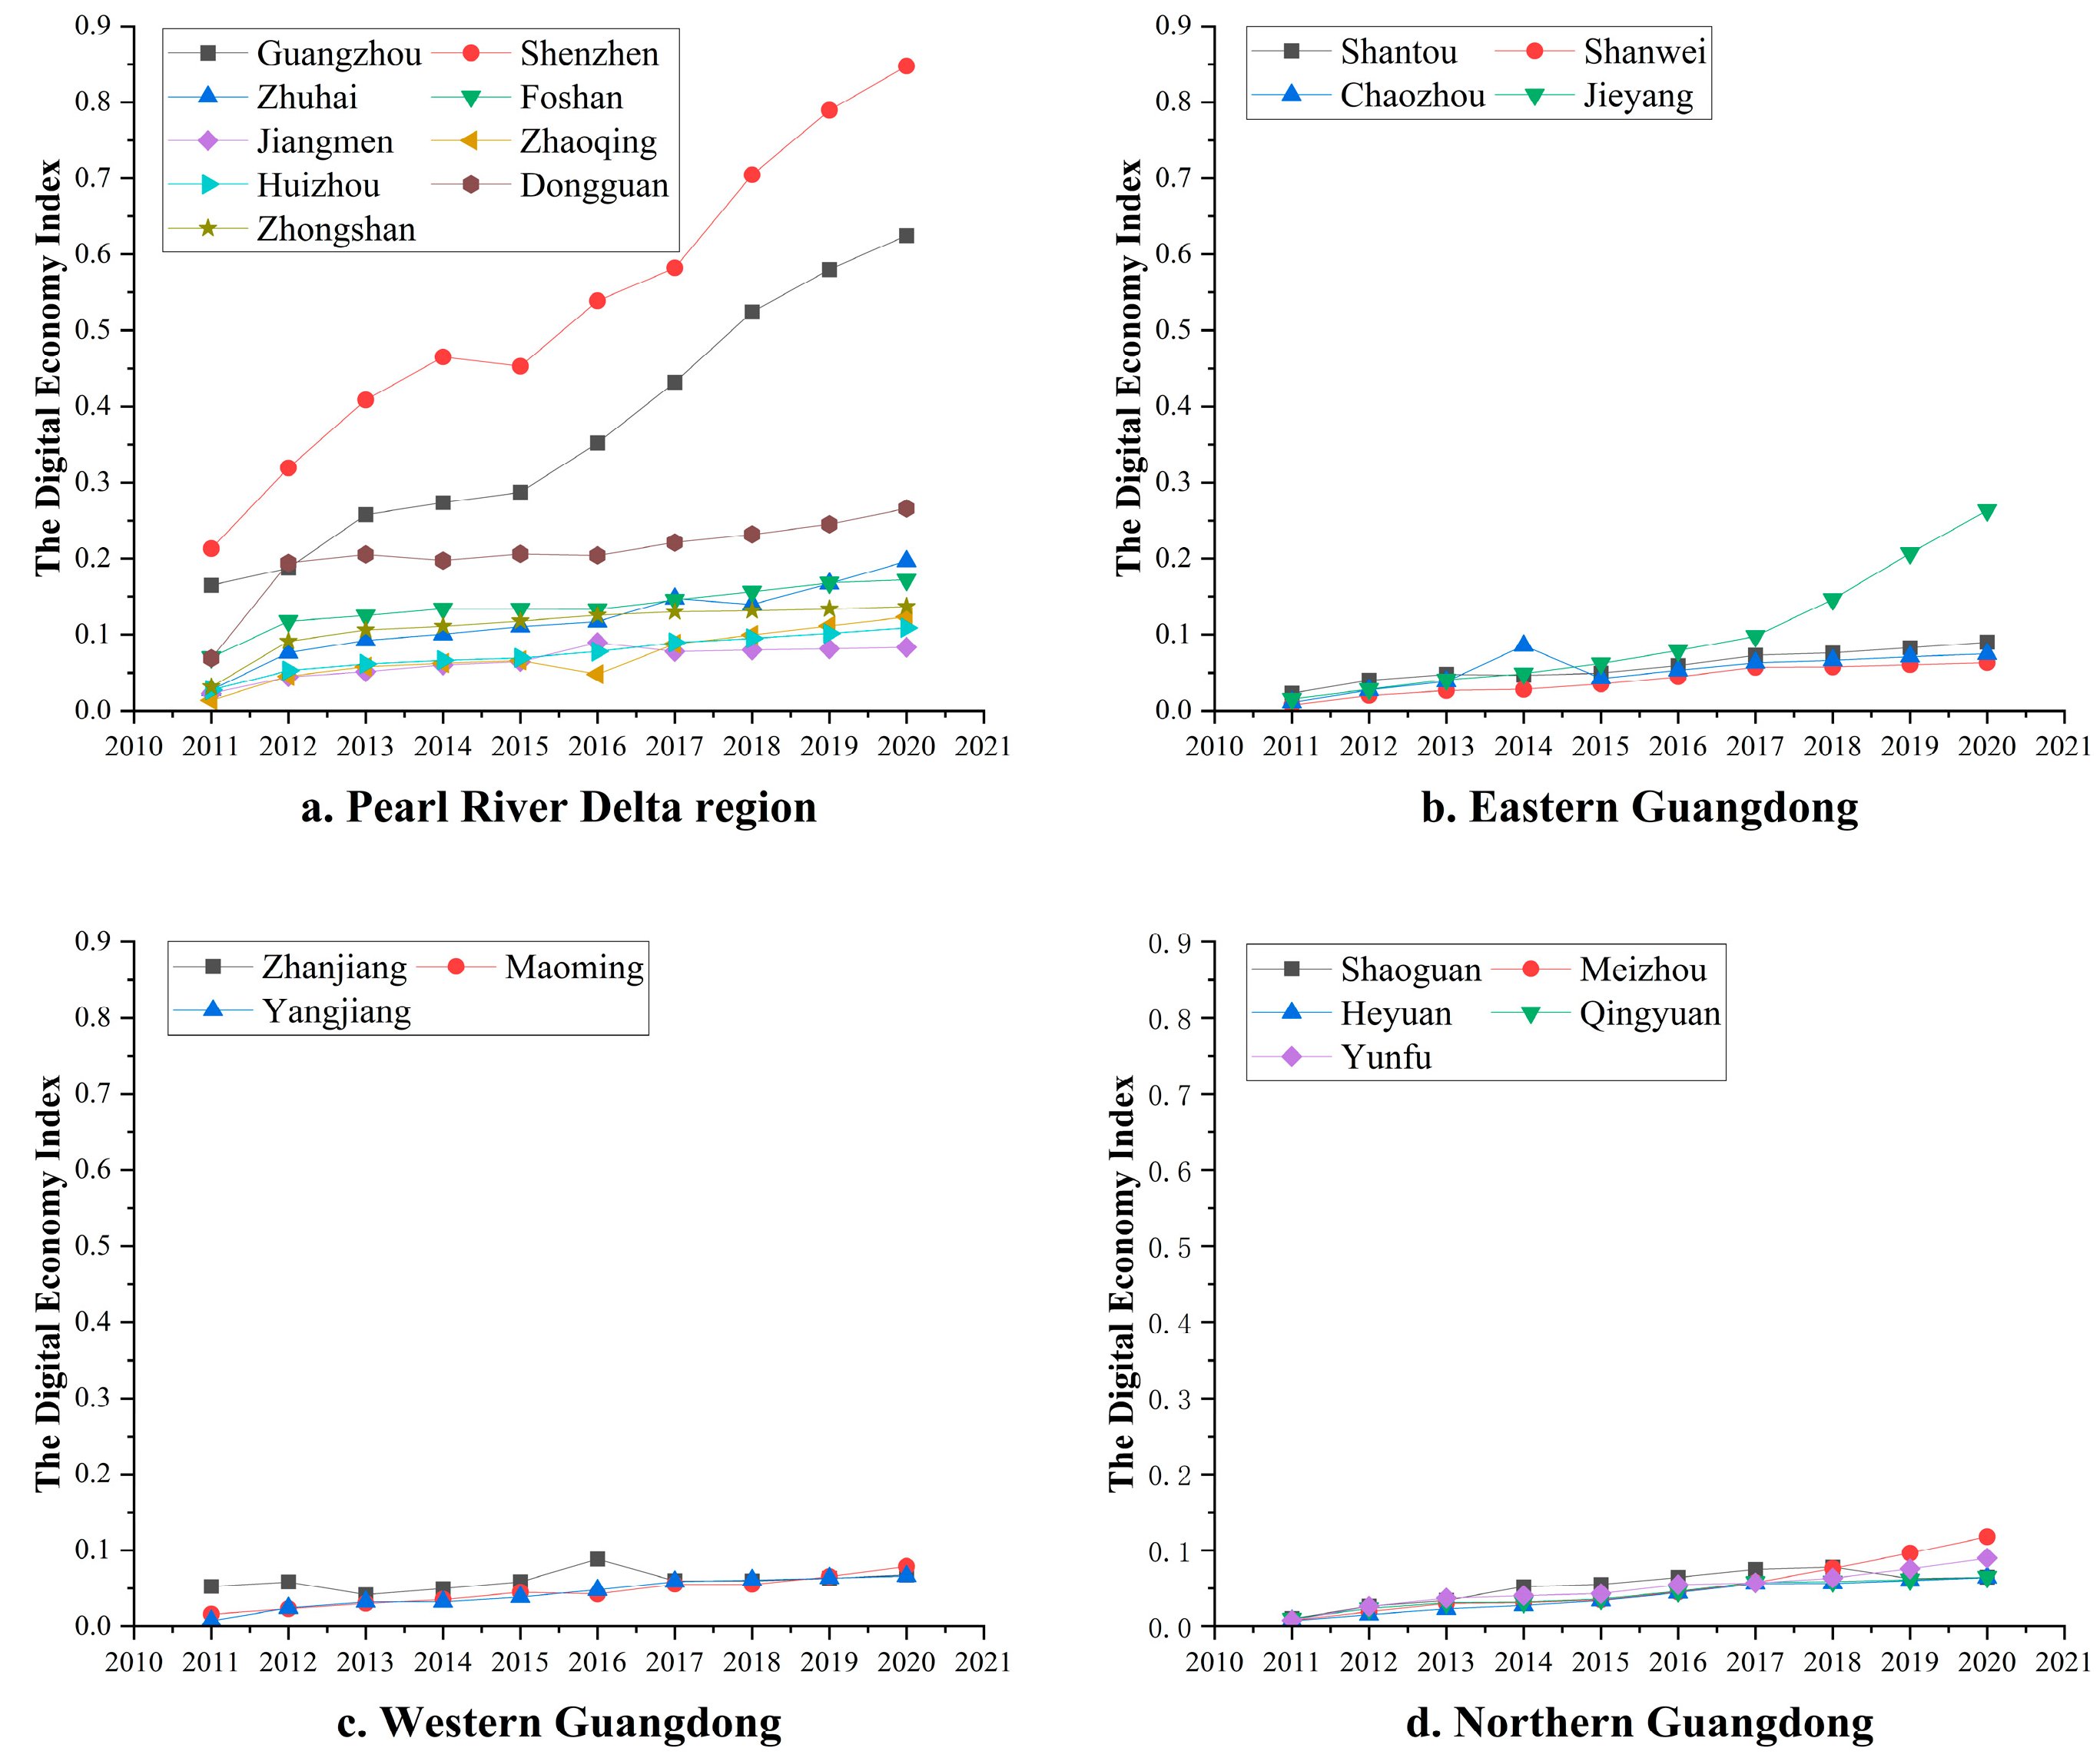
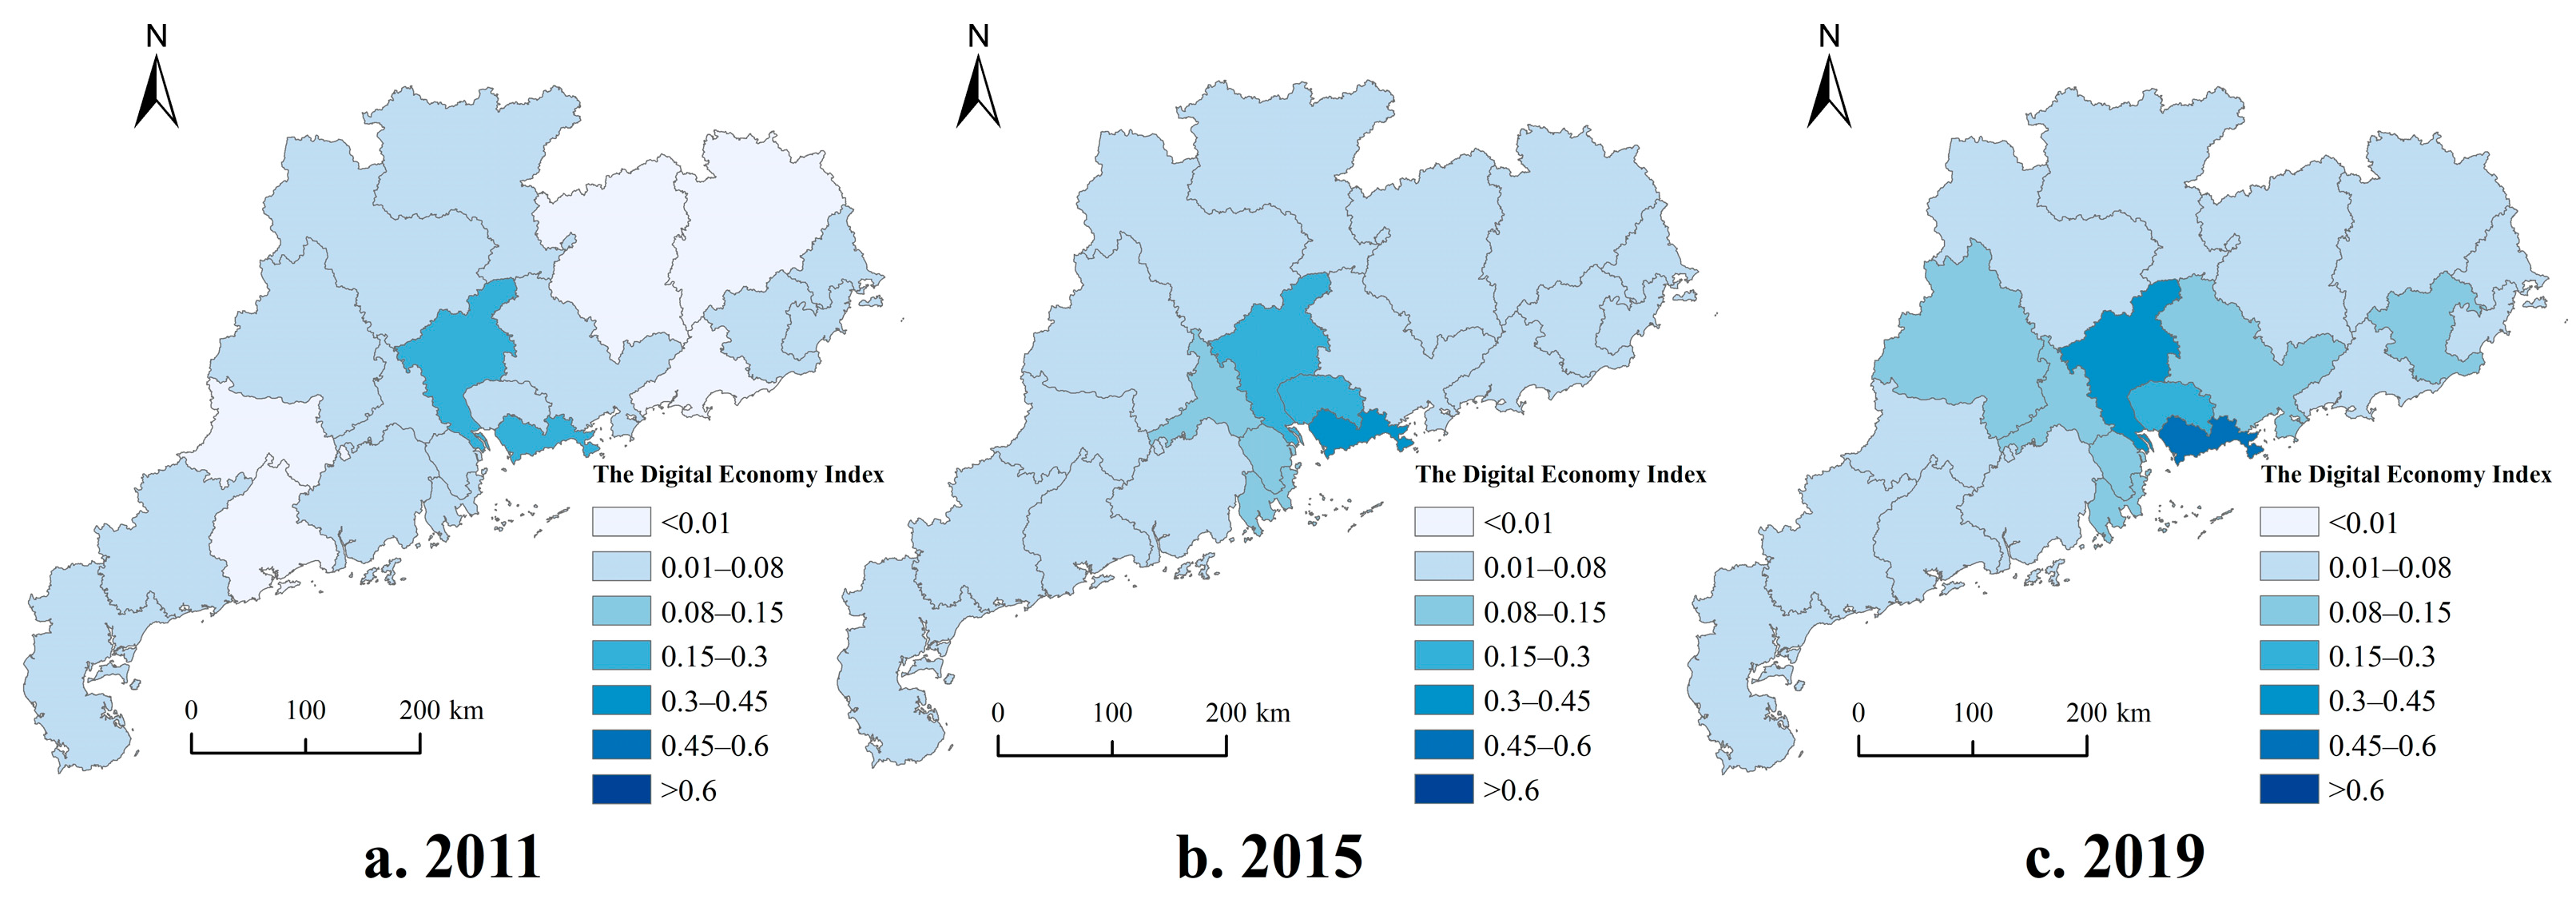
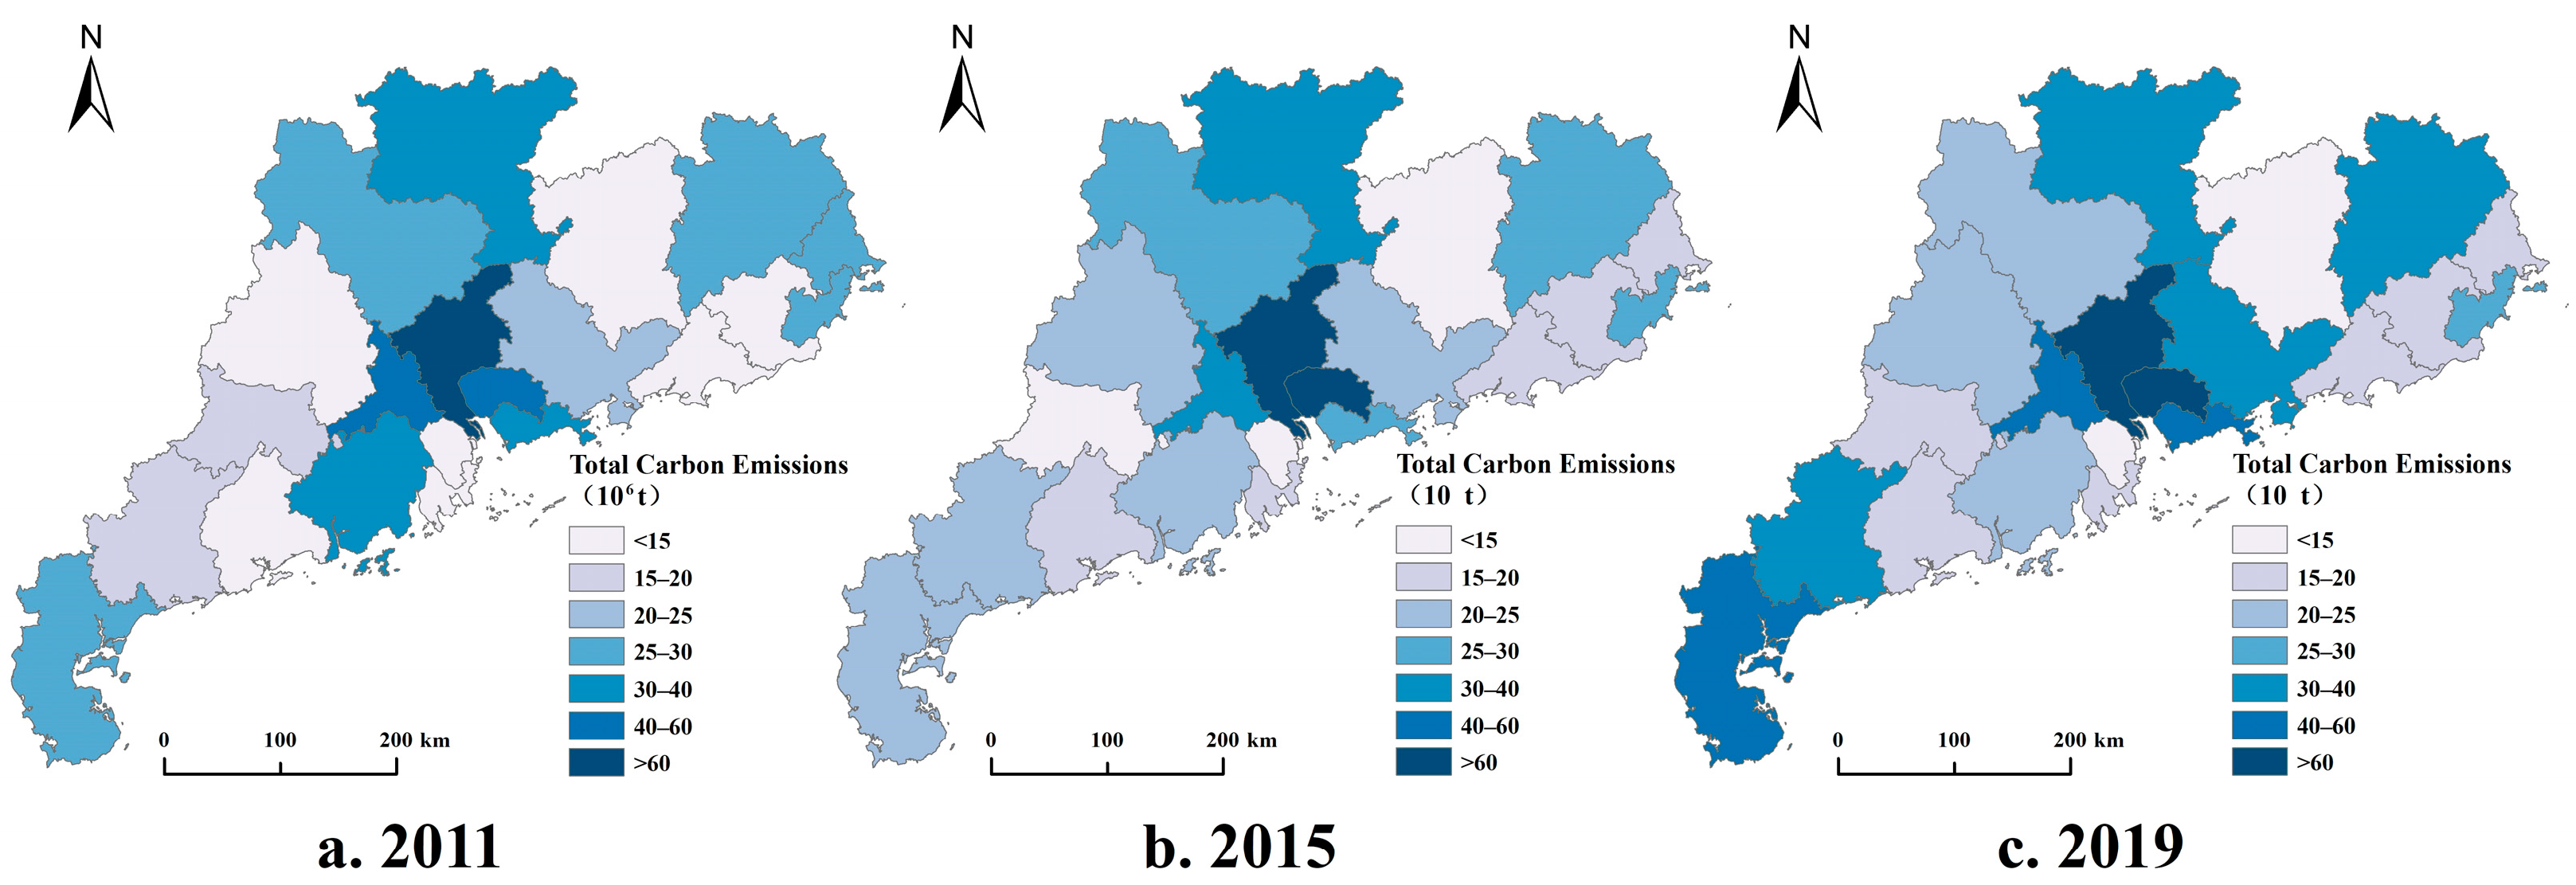
The digital economy in Guangdong Province generally exhibited a stable trend of growth, and on average increased by about 3.4 times in the study area during the study period. The digital economy in the Pearl River Delta was well ahead of those in north, west, and east Guangdong. Shenzhen had the most developed digital economy in 2020 (0.8473), while Shanwei (0.0633) had the least. This revealed a spatial pattern in the digital economy of “high in the center and low in the surrounding areas,” with significant regional differences. The overall spatial distributions of the carbon emissions in the cities in Guangdong Province were similar;
(2)
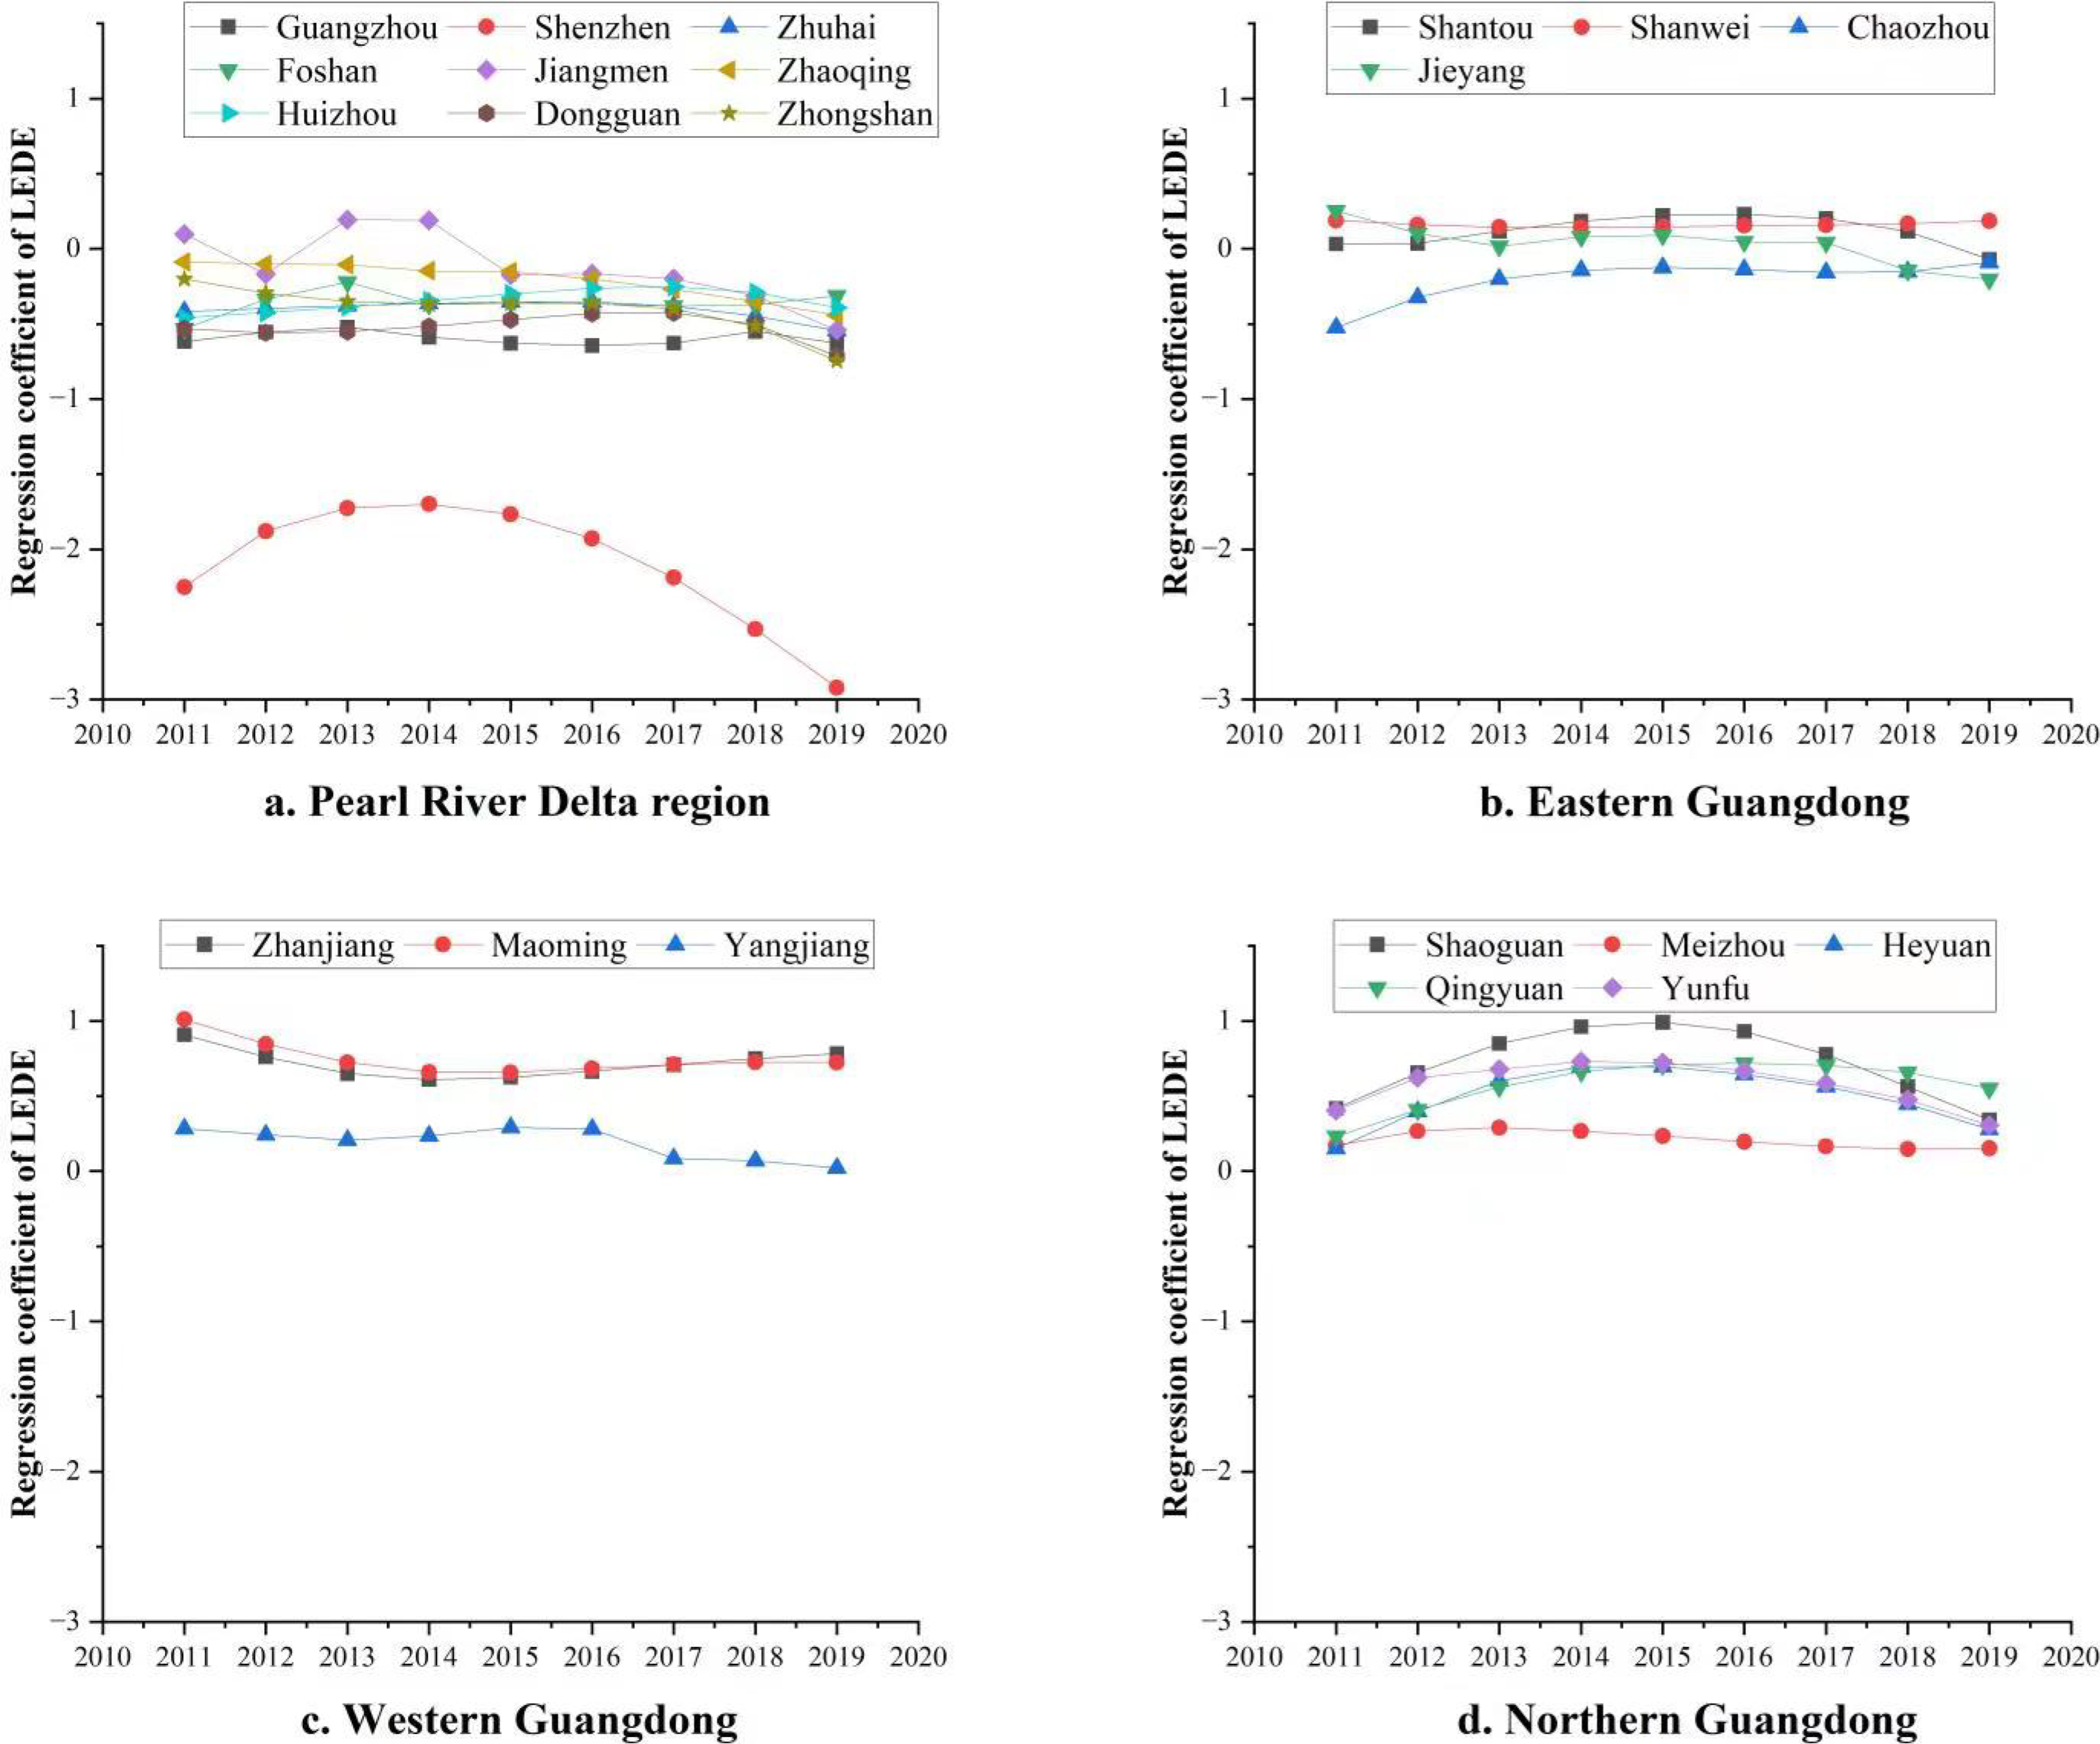
The development of the digital economy in Guangdong Province as a whole had a significant effect in terms of reducing carbon emissions. However, it showed the completely opposite effect at a local scale, which indicates spatiotemporal heterogeneity;
(3)
The benefits of a highly developed digital economy were relatively significant in the context of reducing urban carbon emissions, but its initial stage of development led to an increase in carbon emissions.
This study adds to the literature by investigating the impact of the digital economy on urban carbon emissions reduction. Our study provides a scientific basis for urban carbon emissions reduction in Guangdong based on environmental, economic geography, and digital economy development theory. Furthermore, relevant policies help increase the diversity and synergy in digital economy governance among regions, ensuring the high-quality development of the urban digital economy.

Author Contributions

Conceptualization, S.W.; Investigation, Y.M.; Writing—original draft, Y.M.; Visualization, Y.M. and C.Z. All authors have read and agreed to the published version of the manuscript.

Funding

This work was supported by the Humanities and Social Sciences Planning Fund of the Ministry of Education of China (Grant No. 21YJAZH087).

Institutional Review Board Statement

Not applicable.

Informed Consent Statement

Not applicable.

Data Availability Statement

All the data used are reflected in the article. If you need other relevant data, please contact the authors.

Conflicts of Interest

The authors declare no conflict of interest.

References

  1. Azomahou, T.; Laisney, F.; Nguyen Van, P. Economic development and CO2 emissions: A nonparametric panel approach. J. Public Econ. 2006, 90, 1347–1363. [Google Scholar] [CrossRef] [Green Version]
  2. Duan, H.; Zhou, S.; Jiang, K.; Bertram, C.; Harmsen, M.; Kriegler, E.; van Vuuren, D.P.; Wang, S.; Fujimori, S.; Tavoni, M.; et al. Assessing China’s efforts to pursue the 1.5 °C warming limit. Science 2021, 372, 378–385. [Google Scholar] [CrossRef] [PubMed]
  3. Van Houtan, K.S.; Tanaka, K.R.; Gagne, T.O.; Becker, S.L. The geographic disparity of historical greenhouse emissions and projected climate change. Sci. Adv. 2021, 7, eabe4342. [Google Scholar] [CrossRef] [PubMed]
  4. Ürge-Vorsatz, D.; Rosenzweig, C.; Dawson, R.J.; Sanchez Rodriguez, R.; Bai, X.; Barau, A.S.; Seto, K.C.; Dhakal, S. Locking in positive climate responses in cities. Nat. Clim. Chang. 2018, 8, 174–177. [Google Scholar] [CrossRef] [Green Version]
  5. Muneer, T.; Celik, A.N.; Caliskan, N. Sustainable transport solution for a medium-sized town in Turkey—A case study. Sustain. Cities Soc. 2011, 1, 29–37. [Google Scholar] [CrossRef]
  6. Brand, C.; Preston, J.M. ‘60-20 emission’—The unequal distribution of greenhouse gas emissions from personal, non-business travel in the UK. Transp. Policy 2010, 17, 9–19. [Google Scholar] [CrossRef]
  7. Dhakal, S. Urban energy use and carbon emissions from cities in China and policy implications. Energy Policy 2009, 37, 4208–4219. [Google Scholar] [CrossRef]
  8. Bi, X.; Sheng, G.; Peng, P.A.; Zhang, Z.; Fu, J. Extractable organic matter in PM 10 from LiWan district of Guangzhou City, PR China. Sci. Total Environ. 2002, 300, 213–228. [Google Scholar] [CrossRef]
  9. Wang, S.; Xie, Z.; Wu, R.; Feng, K. How does urbanization affect the carbon intensity of human well-being? A global assessment. Appl. Energy 2022, 312, 118798. [Google Scholar] [CrossRef]
  10. Wang, S.; Li, G.; Fang, C. Urbanization, economic growth, energy consumption, and CO2 emissions: Empirical evidence from countries with different income levels. Renew. Sustain. Energy Rev. 2018, 81, 2144–2159. [Google Scholar] [CrossRef]
  11. Wang, S.; Wang, Z.; Fang, C. Evolutionary characteristics and driving factors of carbon emission performance at the city level in China. Sci. China Earth Sci. 2022, 65, 1292–1307. [Google Scholar] [CrossRef]
  12. Cardona, M.; Kretschmer, T.; Strobel, T. ICT and productivity: Conclusions from the empirical literature. Inf. Econ. Policy 2013, 25, 109–125. [Google Scholar] [CrossRef]
  13. Jiang, Q.; Li, Y.; Si, H. Digital Economy Development and the Urban–Rural Income Gap: Intensifying or Reducing. Land 2022, 11, 1980. [Google Scholar] [CrossRef]
  14. Han, D.; Ding, Y.; Shi, Z.; He, Y. The impact of digital economy on total factor carbon productivity: The threshold effect of technology accumulation. Environ. Sci. Pollut. Res. 2022, 29, 55691–55706. [Google Scholar] [CrossRef]
  15. Lu, W. The impacts of information and communication technology, energy consumption, financial development, and economic growth on carbon dioxide emissions in 12 Asian countries. Mitig. Adapt. Strateg. Glob. Chang. 2018, 23, 1351–1365. [Google Scholar] [CrossRef]
  16. Lin, B.; Zhou, Y. Does the Internet development affect energy and carbon emission performance? Sustain. Prod. Consum. 2021, 28, 1–10. [Google Scholar] [CrossRef]
  17. Zhang, W.; Liu, X.; Wang, D.; Zhou, J. Digital economy and carbon emission performance: Evidence at China’s city level. Energy Policy 2022, 165, 112927. [Google Scholar] [CrossRef]
  18. Li, Z.; Wang, J. The Dynamic Impact of Digital Economy on Carbon Emission Reduction: Evidence City-level Empirical Data in China. J. Clean. Prod. 2022, 351, 131570. [Google Scholar] [CrossRef]
  19. Wang, F.; Wang, M.; Yuan, S. Spatial Diffusion of E-Commerce in China’s Counties: Based on the Perspective of Regional Inequality. Land 2021, 10, 1141. [Google Scholar] [CrossRef]
  20. Chandrasekhar, C.P. World Development Report 2016: Digital Dividends. Dev. Chang. 2017, 48, 1196–1209. [Google Scholar] [CrossRef]
  21. Du, M.; Feng, R.; Chen, Z. Blue sky defense in low-carbon pilot cities: A spatial spillover perspective of carbon emission efficiency. Sci. Total Environ. 2022, 846, 157509. [Google Scholar] [CrossRef] [PubMed]
  22. Xie, Z.; Wu, R.; Wang, S. How technological progress affects the carbon emission efficiency? Evidence from national panel quantile regression. J. Clean. Prod. 2021, 307, 127133. [Google Scholar] [CrossRef]
  23. Wang, S.; Zeng, J.; Liu, X. Examining the multiple impacts of technological progress on CO2 emissions in China: A panel quantile regression approach. Renew. Sustain. Energy Rev. 2019, 103, 140–150. [Google Scholar] [CrossRef]
  24. Wang, J.; Dong, X.; Dong, K. How digital industries affect China’s carbon emissions? Analysis of the direct and indirect structural effects. Technol. Soc. 2022, 68, 101911. [Google Scholar] [CrossRef]
  25. Yi, M.; Liu, Y.; Sheng, M.S.; Wen, L. Effects of digital economy on carbon emission reduction: New evidence from China. Energy Policy 2022, 171, 113271. [Google Scholar] [CrossRef]
  26. Yu, Z.; Liu, S.; Zhu, Z. Has the Digital Economy Reduced Carbon Emissions?: Analysis Based on Panel Data of 278 Cities in China. Int. J. Environ. Res. Public Health 2022, 19, 11814. [Google Scholar] [CrossRef] [PubMed]
  27. Jing, S.; Wu, F.; Shi, E.; Wu, X.; Du, M. Does the Digital Economy Promote the Reduction of Urban Carbon Emission Intensity? Int. J. Environ. Res. Public Health 2023, 20, 3680. [Google Scholar] [CrossRef]
  28. Xu, S.; Yang, C.; Huang, Z.; Failler, P. Interaction between Digital Economy and Environmental Pollution: New Evidence from a Spatial Perspective. Int. J. Environ. Res. Public Health 2022, 19, 5074. [Google Scholar] [CrossRef]
  29. Ding, C.; Liu, C.; Zheng, C.; Li, F. Digital Economy, Technological Innovation and High-Quality Economic Development: Based on Spatial Effect and Mediation Effect. Sustainability 2022, 14, 216. [Google Scholar] [CrossRef]
  30. Li, R.; Rao, J.; Wan, L. The digital economy, enterprise digital transformation, and enterprise innovation. Manag. Decis. Econ. 2022, 43, 2875–2886. [Google Scholar] [CrossRef]
  31. Chen, X.; Teng, L.; Chen, W. How does FinTech affect the development of the digital economy? Evidence from China. N. Am. J. Econ. Financ. 2022, 61, 101697. [Google Scholar] [CrossRef]
  32. Zavadskas, E.K.; Mardani, A.; Turskis, Z.; Jusoh, A.; Nor, K.M. Development of TOPSIS Method to Solve Complicated Decision-Making Problems—An Overview on Developments from 2000 to 2015. Int. J. Inf. Technol. Decis. Mak. 2016, 15, 645–682. [Google Scholar] [CrossRef]
  33. Girardin, V.; Limnios, N. Entropy Rate and Maximum Entropy Methods for Countable Semi-Markov Chains. Commun. Stat. Theory Methods 2004, 33, 609–622. [Google Scholar] [CrossRef]
  34. Wang, S.; Shi, C.; Fang, C.; Feng, K. Examining the spatial variations of determinants of energy-related CO2 emissions in China at the city level using Geographically Weighted Regression Model. Appl. Energy 2019, 235, 95–105. [Google Scholar] [CrossRef]
  35. Huang, B.; Wu, B.; Barry, M. Geographically and temporally weighted regression for modeling spatio-temporal variation in house prices. Int. J. Geogr. Inf. Sci. 2010, 24, 383–401. [Google Scholar] [CrossRef]
  36. He, Q.; Huang, B. Satellite-based mapping of daily high-resolution ground PM2.5 in China via space-time regression modeling. Remote Sens. Environ. 2018, 206, 72–83. [Google Scholar] [CrossRef]
  37. Wu, B.; Li, R.R.; Huang, B. A geographically and temporally weighted autoregressive model with application to housing prices. Int. J. Geogr. Inf. Sci. 2014, 28, 1186–1204. [Google Scholar] [CrossRef]
  38. Fotheringham, A.S.; Crespo, R.; Yao, J. Geographical and Temporal Weighted Regression (GTWR). Geogr. Anal. 2015, 47, 431–452. [Google Scholar] [CrossRef] [Green Version]
  39. Shi, T.; Yang, S.; Zhang, W.; Zhou, Q. Coupling coordination degree measurement and spatiotemporal heterogeneity between economic development and ecological environment—Empirical evidence from tropical and subtropical regions of China. J. Clean. Prod. 2020, 244, 118739. [Google Scholar] [CrossRef]
  40. Deng, X.; Liu, Y.; Xiong, Y. Analysis on the Development of Digital Economy in Guangdong Province Based on Improved Entropy Method and Multivariate Statistical Analysis. Entropy 2020, 22, 1441. [Google Scholar] [CrossRef]
  41. Liao, L.; Du, M.; Wang, B.; Yu, Y. The Impact of Educational Investment on Sustainable Economic Growth in Guangdong, China: A Cointegration and Causality Analysis. Sustainability 2019, 11, 766. [Google Scholar] [CrossRef] [Green Version]
  42. Wang, S.; Cui, Z.; Lin, J.; Xie, J.; Su, K. The coupling relationship between urbanization and ecological resilience in the Pearl River Delta. J. Geogr. Sci. 2022, 32, 44–64. [Google Scholar] [CrossRef]
  43. Wang, S.; Wang, J.; Fang, C.; Li, S. Estimating the impacts of urban form on CO2 emission efficiency in the Pearl River Delta, China. Cities 2019, 85, 117–129. [Google Scholar] [CrossRef]
  44. Neirotti, P.; De Marco, A.; Cagliano, A.C.; Mangano, G.; Scorrano, F. Current trends in Smart City initiatives: Some stylised facts. Cities 2014, 38, 25–36. [Google Scholar] [CrossRef] [Green Version]
  45. He, Q.; Huang, B. Satellite-based high-resolution PM2.5 estimation over the Beijing-Tianjin-Hebei region of China using an improved geographically and temporally weighted regression model. Environ. Pollut. 2018, 236, 1027–1037. [Google Scholar] [CrossRef]
  46. Pang, Q.; Zhou, W.; Zhao, T.; Zhang, L. Impact of Urbanization and Industrial Structure on Carbon Emissions: Evidence from Huaihe River Eco-Economic Zone. Land 2021, 10, 1130. [Google Scholar] [CrossRef]
  47. Beloglazov, A.; Buyya, R. Optimal online deterministic algorithms and adaptive heuristics for energy and performance efficient dynamic consolidation of virtual machines in Cloud data centers. Concurr. Comput. Pract. Exp. 2012, 24, 1397–1420. [Google Scholar] [CrossRef]
  48. Chen, L.; Honsho, Y.; Seki, S.; Jiang, D. Light-Harvesting Conjugated Microporous Polymers: Rapid and Highly Efficient Flow of Light Energy with a Porous Polyphenylene Framework as Antenna. J. Am. Chem. Soc. 2010, 132, 6742–6748. [Google Scholar] [CrossRef]
  49. Han, Y.; Zhang, F.; Huang, L.; Peng, K.; Wang, X. Does industrial upgrading promote eco-efficiency?—A panel space estimation based on Chinese evidence. Energy Policy 2021, 154, 112286. [Google Scholar] [CrossRef]
  50. Wu, L.; Sun, L.; Qi, P.; Ren, X.; Sun, X. Energy endowment, industrial structure upgrading, and CO2 emissions in China: Revisiting resource curse in the context of carbon emissions. Resour. Policy 2021, 74, 102329. [Google Scholar] [CrossRef]
  51. Hao, J.L.; Cheng, B.; Lu, W.; Xu, J.; Wang, J.; Bu, W.; Guo, Z. Carbon emission reduction in prefabrication construction during materialization stage: A BIM-based life-cycle assessment approach. Sci. Total Environ. 2020, 723, 137870. [Google Scholar] [CrossRef] [PubMed]
  52. Ma, Q.; Tariq, M.; Mahmood, H.; Khan, Z. The nexus between digital economy and carbon dioxide emissions in China: The moderating role of investments in research and development. Technol. Soc. 2022, 68, 101910. [Google Scholar] [CrossRef]
Figure 1. Administrative map of the study region.
Land 12 00787 g001
Figure 2. Timeline of the levels of development of the digital economy for cities in the Pearl River Delta, east Guangdong, west Guangdong, and north Guangdong.
Land 12 00787 g002
Figure 3. The spatiotemporal evolution in the level of development of the digital economy in Guangdong Province.
Land 12 00787 g003
Figure 4. Spatiotemporal evolution of urban carbon emissions in Guangdong Province from 2011 to 2019.
Land 12 00787 g004
Figure 5. Time series of the coefficient for the reduction in carbon emissions with the development of the digital economy in cities in the Pearl River Delta, and east, west, and north Guangdong.
Land 12 00787 g005
Figure 6. The spatiotemporal evolution of the coefficients of regression for the digital economy.
Land 12 00787 g006
Table 1. Comprehensive system to measure the development of the digital economy.
Target LayerGuidelines’ LayerIndicator LayerIndicator Description (Unit)Efficacy
Digital economyDigital infrastructureBroadband Internet basicsNumber of Internet users per 100 people (households)+
Mobile Internet basicsNumber of mobile phone subscribers per 100 people (households)+
Development of the digital industry Internet business outputTotal telecommunications business (million yuan)+
Postal business outputTotal postal business (million yuan)+
Digital technological innovationInvestment in science and technologyScience and technology research and development funds (million yuan)+
Digital industry foundationNumber of workers in information transmission, computer services, and software (tens of thousands)+
Digital financial inclusionBreadth of digital financial inclusionDigital financial inclusion coverage breadth index+
Depth of use of digital financial inclusionIndex of the depth of digital financial inclusion+
Table 2. Description of the variables.
Influential FactorsExplanatory VariablesVariable Descriptions (Units)VIF
Digital economyLEDEMeasure of the level of development of the digital economy3.2609
Industrial structureINDSRatio of secondary industry (%)1.8354
Level of economic developmentLEEDGDP per capita (million yuan)5.8713
Level of urbanizationLEUBRatio of urban population (%)5.3295
Level of openness to the worldLEOPTotal import and export ratio (%)2.2553
Table 3. The performance of the OLS, GWR, TWR, and GTWR models.
ModelGTWRGWRTWROLS
R20.9086560.8777760.4154370.410668
AICc1401.371413.791630.601627.09
Table 4. Coefficients of regression of the variables according to the GTWR model.
VariablesAverage ValueMaximum ValueMinimum ValueLower QuartileUpper Quartile
LEDE−0.033791.01005−2.92102−0.367610.40488
INDS1.988233.270380.064791.093712.66535
LEED0.000200.00069−0.000260.000090.00029
LEUB0.715172.72832−1.597410.399551.08081
LEOP0.017272.91245−0.97382−0.253920.11743
Disclaimer/Publisher’s Note: The statements, opinions and data contained in all publications are solely those of the individual author(s) and contributor(s) and not of MDPI and/or the editor(s). MDPI and/or the editor(s) disclaim responsibility for any injury to people or property resulting from any ideas, methods, instructions or products referred to in the content.

