
The Value of Ecosystem Traffic Noise Reduction Service Provided by Urban Green Belts: A Case Study of Shenzhen

1
Solux College of Architecture and Design, University of South China, Hengyang 421009, China
2
State Key Laboratory of Urban and Regional Ecology, Research Center for Eco-Environmental Sciences, Chinese Academy of Sciences, Beijing 100085, China
3
School of Economics, Management and Law, University of South China, Hengyang 421001, China
4
University of Chinese Academy of Sciences, Beijing 100049, China
*
Author to whom correspondence should be addressed.
Land 2023, 12(4), 786; https://doi.org/10.3390/land12040786
Submission received: 25 February 2023
/
Revised: 20 March 2023
/
Accepted: 22 March 2023
/
Published: 30 March 2023
Abstract
:With increasing urbanization in China, the traffic-induced urban environmental noise pollution problem is becoming more and more serious, and it has become a common urban malady that cannot be ignored. Traffic green belts are an important part of the urban ecosystem and play a role in traffic noise reduction, and simultaneously provide ecosystem services, such as creating a natural landscape and retaining dust. Therefore, they are a category of Nature-based Solutions (NbSs) that have multiple ecosystem service provisions. The relationship between NbSs and urban ecosystem services is one of the current research hot spots. However, regarding the assessment of ecosystem services on the urban scale, the role of vegetation in reducing noise pollution as a service has rarely been studied. Taking Shenzhen City as an example, through monitoring 217 sample plots in the city, this paper analyzes the relationship between vegetation coverage and the ability of green belts to reduce noise by using the IUEMS platform combined with the high-resolution spatial distribution data of green spaces. Then, we evaluated the product amount and the value of the roadside green belts in Shenzhen when acting as a noise reduction service. The work of this study, to a certain extent, improves the problems related to the inadequate consideration of vegetation characteristics in current urban-scale noise assessment models. The results show the following: (i) In the respective analysis buffer zones of the Grade I to Grade IV roads in Shenzhen, on average, for every 1% increase in the vegetation coverage of green belts, noise can be reduced by 0.4 dB, 1.0 dB, 0.2 dB, and 0.6 dB, respectively. (ii) The product value of the noise reduction service provided by roadside green belts is CNY 1.16 billion in Shenzhen. (iii) The road traffic noise greatly exceeds the standard in Shenzhen, but traffic noise can be decreased by increasing the vegetation coverage of green belts. This is not only beneficial to the scientific understanding of the ecological service value of green spaces by evaluating the noise reduction service of traffic green belts, as well as its influencing factors, but is also beneficial to making improvements in construction and management ideas for urban green spaces.
1. Introduction
As an important part of the urban living environment, the quality of an urban acoustic environment is closely related to the physical and mental health of urban residents [1,2], as well as to the sustainable development of the city [3]. However, the problem of urban noise pollution has become increasingly prominent, and it has become a common urban malady with the continuous progress of urbanization in China. Among them, traffic noise is an important part of urban environmental noise. It accounts for 23.5% of urban noise sources, only second to the noise of social life [4]. In view of this situation, mitigating traffic noise pollution is one of the most important ways to improve urban living environments.
The usage of sound barriers is the most commonly used means of solving urban traffic noise pollution. Vegetation barriers (i.e., roadside green belts) are one of the main types of sound barrier, and are often used to create natural landscapes [5,6,7,8], provide dust retention [9,10,11], and regulate floods in the city [12,13,14]. Given this, roadside green belts belong to a category of Nature based Solutions (NbSs) that have multiple ecosystem service provisions [15]. The relationship between NbSs and urban ecosystem services is one of the current research hot spots. However, compared to other ecosystem services, studies on urban noise reduction services in green spaces are lacking, and most of them still focus on traditional ecosystem services such as climate regulation (mitigating heat island effect), carbon storage, flood regulation, and urban recreation. The only research that exists on the evaluation of traffic noise reduction services in roadside green belts notes two characteristics.
First, research on the mechanisms of noise reduction in green belts is based on a few measured sections. Most researchers selected representative road sections in order to explore the effect of using green belts for noise reduction and the influencing factors, and then found the optimal configuration of green belts through the combination of field measurements and statistical analysis. For example, Wang et al. [16] explored the distance attenuation and gradient attenuation mechanism of noise reduction using typical highway green belts in Shanxi Province by setting gradient measuring points and performing fitting analysis; then, they studied the relationship between the characteristic factors of green belts, such as their width, structure, canopy density, and their noise reduction effect. Sun et al. [17] selected representative green belts in the urban and suburban areas of Beijing for monitoring, and obtained data on the impact of the seasons, the forest belt type, and each belt’s distance from the sound source on the noise reduction effect; then, they compared the noise reduction effect of different forest belt types on different frequencies of noise. Li et al. [18] took 11 counties in the Yangtze River Delta region as the research object, evaluated the vegetation composition and noise reduction capacity of some green belts beside main roads, analyzed the impact of various vegetation indexes, including width, tridimensional green biomass, and the clear length of noise reduction capacity, and put forward suggestions for improvement. Schäffer et al. [19] studied the impact of residential green spaces on noise interference generated by road, railway, and aircraft sound sources under different degrees of urbanization and different green space conditions (NDVI, etc.). With the help of multiple models, Ow and Ghosh [20] analyzed the influence of roadside vegetation on reducing traffic noise under the conditions of different planting intensities, backoff distances, and trunk sizes, by measuring noise values in different locations. Pathak et al. [21] monitored the noise level and noise reduction status of forest belts of different widths and heights in Varanasi, India, and studied the noise reduction effects of four plant varieties at different noise frequencies; they additionally constructed a noise reduction model with vegetation using multiple regression analysis. Fang and Ling [22] investigated and measured the noise reduction effect of 35 evergreen forest belts, then analyzed the relationship between different factors, including visibility, belt width, height, and length, and the noise reduction effect through stepwise regression analysis; then, they drew a chart showing the relative attenuation of noise between visibility and width, in order to provide suggestions for the design of road forest belts. Hosseini et al. [23] investigated the impact of road design parameters (including the longitudinal gradient, radius of horizontal curve, change in road surface types) and roadside forest belt parameters (including density of trees, forest type, distance between trees and road) on reducing noise pollution; this was in order to obtain an appropriate solution to traffic noise pollution, taking Darabkola Forests in Sari, Iran, as an example. This kind of research analyzes the impact of several physiological traits in plants on noise reduction through field monitoring and comparative tests, which make their results more authentic. However, this research only monitors specific sections of a green belt, such as a few selected road sections [16,18], one designated forest [23], or a type of green space used for a certain purpose [19]. This is because it is difficult to evaluate noise reduction services in large areas such as a city. In addition, this research describes the principle of noise reduction using vegetation, but the ecological characteristics they selected are different, thus lacking uniform standards.
Second, researchers are concerned with creating urban noise maps that are based on empirical formula models and data such as local traffic flow. For example, Fu et al. [24], based on the theory of spatial distribution and intensity change in noise, and on Bertin’s symbol variables analysis, designed a dynamic noise map using square columns with variable height and varying colors as symbols, then simulated the noise particular to a certain area of Huangpu District in Shanghai over a given period of time, based on a traffic noise model and GPS tracking data. Cai et al. [25] developed an urban environmental noise simulation and evaluation system combined with GIS software, based on the urban environmental noise emission model and noise propagation model, according to the law of the impact of buildings and forest belts on noise reduction; then, they applied the system in order to map Guangzhou’s traffic noise status to verify the accuracy of the system’s algorithm. Building on the improvements made in the existing static noise models and in spatial data mining, which is monitored by mobile sensors, Peng [26] used neural networks, spatial similarity analysis, support vector machines, and other big data modeling methods in order to realize the modeling and visualization of dynamic noise by introducing noise monitoring, real-time traffic status, and spatially interesting point data. Finally, taking Dalian and Beijing as examples, the model was used to explore the impact of physical parameters, such as road length and congestion level, on the noise level. Le [27] took a range of urban areas and specific roads in Ningbo as the research object, analyzed the characteristics of urban traffic noise and its relationship with traffic flow through field observation, and then compared and verified the accuracy of the current general noise prediction model. On this basis, they established an information system for urban noise mapping for the selected experimental areas in order to achieve the mapping of regional noise. Picaut et al. [28] collected the physical and perceptual data of the acoustic environment with the help of smart phones; then, taking the hexagon as the symbol unit, analyzed the noise value of a single symbol and expressed it by filling the symbol, thus proposing a method to evaluate the noise environment. Lan and Cai [29] used real-time monitoring data to dynamically update the sound source intensity of the entire road network, and used the traffic flow rate as a non-acoustic road-related parameter to predict the noise emissions produced by the entire road network. Thus, they proposed a new method for dynamically updating the traffic noise map in a large area based on noise monitoring and traffic flow rate data. Kluijver and Stoter [30] expounded the essence of standardized noise mapping tools and described the key points when developing these tools at first; these included accuracy, cost–benefit criteria for noise measurement, and the expression of uncertainty in results. Then, combined with GIS, they proposed a set process of noise mapping in order to optimize and improve the quality and efficiency of noise mapping. Their study results provide a useful method for subsequent research in measuring the impact of noise and proposing policies for noise reduction. Das et al. [31] conducted a detailed analysis of the main sources of noise pollution, of day–night patterns, of cycles, of spatial distribution, and of the disturbance caused by noise to the population in English Bazar Municipality (EBM) of India; this was achieved by collecting data from sampling noise monitoring, questionnaire surveys, and spatial mapping. Finally, they also carried out a vulnerability assessment by using the multi-criteria decision-making method to identify the areas of the town most susceptible to noise. Most of this research realizes the modeling and visualization of noise reduction, which are easily accessed by users. Furthermore, this kind of research can analyze noise reduction across the entire city, because it is less limited by human and material resources. However, these models are based on existing theories or models, which are far from perfect. Additionally, in some of them, the heterogeneity in the characteristics of vegetation between different cities was not considered due to the lack of sufficient measured noise-related data for model calibration. They not only ignore the important factors in the noise reduction model, but also reduce the credibility of the results.
In conclusion, as a type of NbS used in urban areas, roadside green belts, and the noise reduction service provided by them, are both important for cities. Therefore, focusing on them in research is of very significant value. However, existing research often only focuses on the ability of vegetation to provide a noise reduction service in local urban areas, and does not conduct field monitoring. In order to carry out research on the ability of roadside traffic green belts to provide a noise reduction service on the overall scale of a city, this paper innovatively balances and connects field measurements and simulation.
2. Materials and Methods
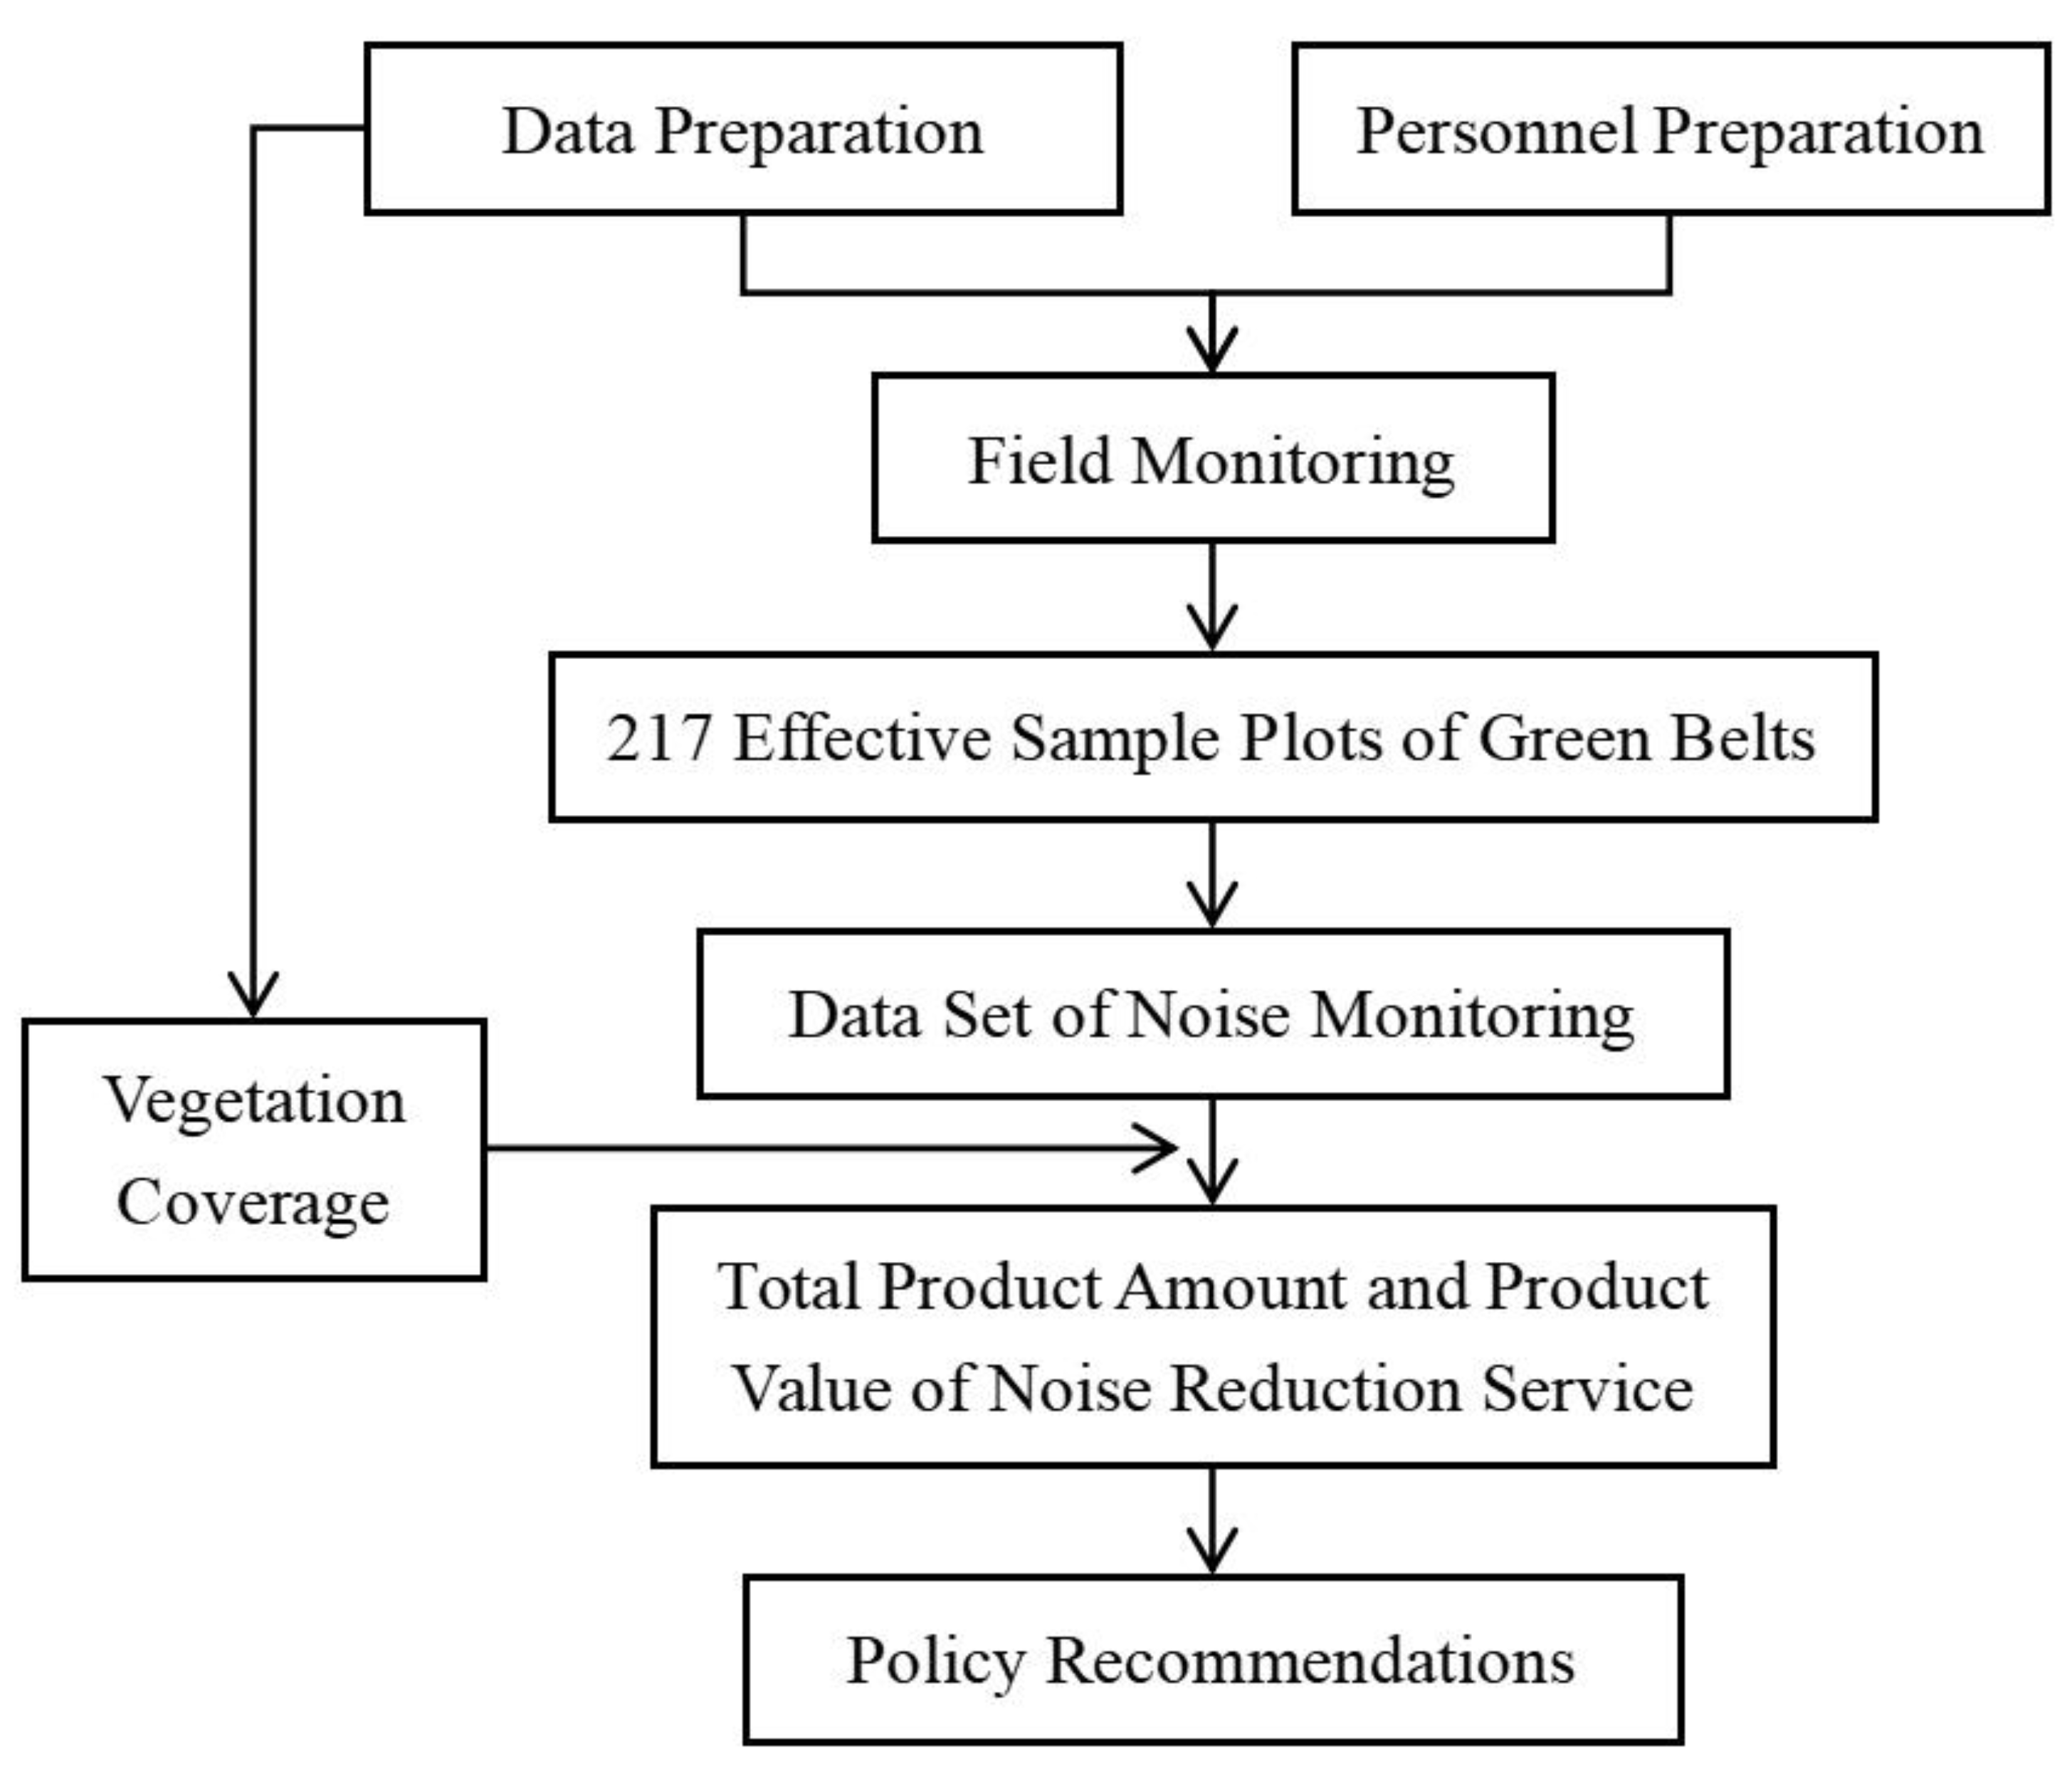
2.1. Workflow
The workflow of our study is shown in Figure 1. First of all, Shenzhen City, China, is used as a case study in order to explore the impact of the coverage of green belts on noise reduction at all road classification levels within a range of roadside environments, using a large number of field noise reduction measurements (217 effective sample plots of green belts). Furthermore, combined with high-resolution spatial distribution data for urban vegetation (two meters), we obtain the vegetation coverage rate for each road section, and then we evaluate the noise reduction service and its value provided by the roadside green belts in the city. Finally, based on the main results of our research, we put forward corresponding suggestions for optimizing the green belts in Shenzhen, in order for the traffic noise status to reach this standard.
2.2. Study Area
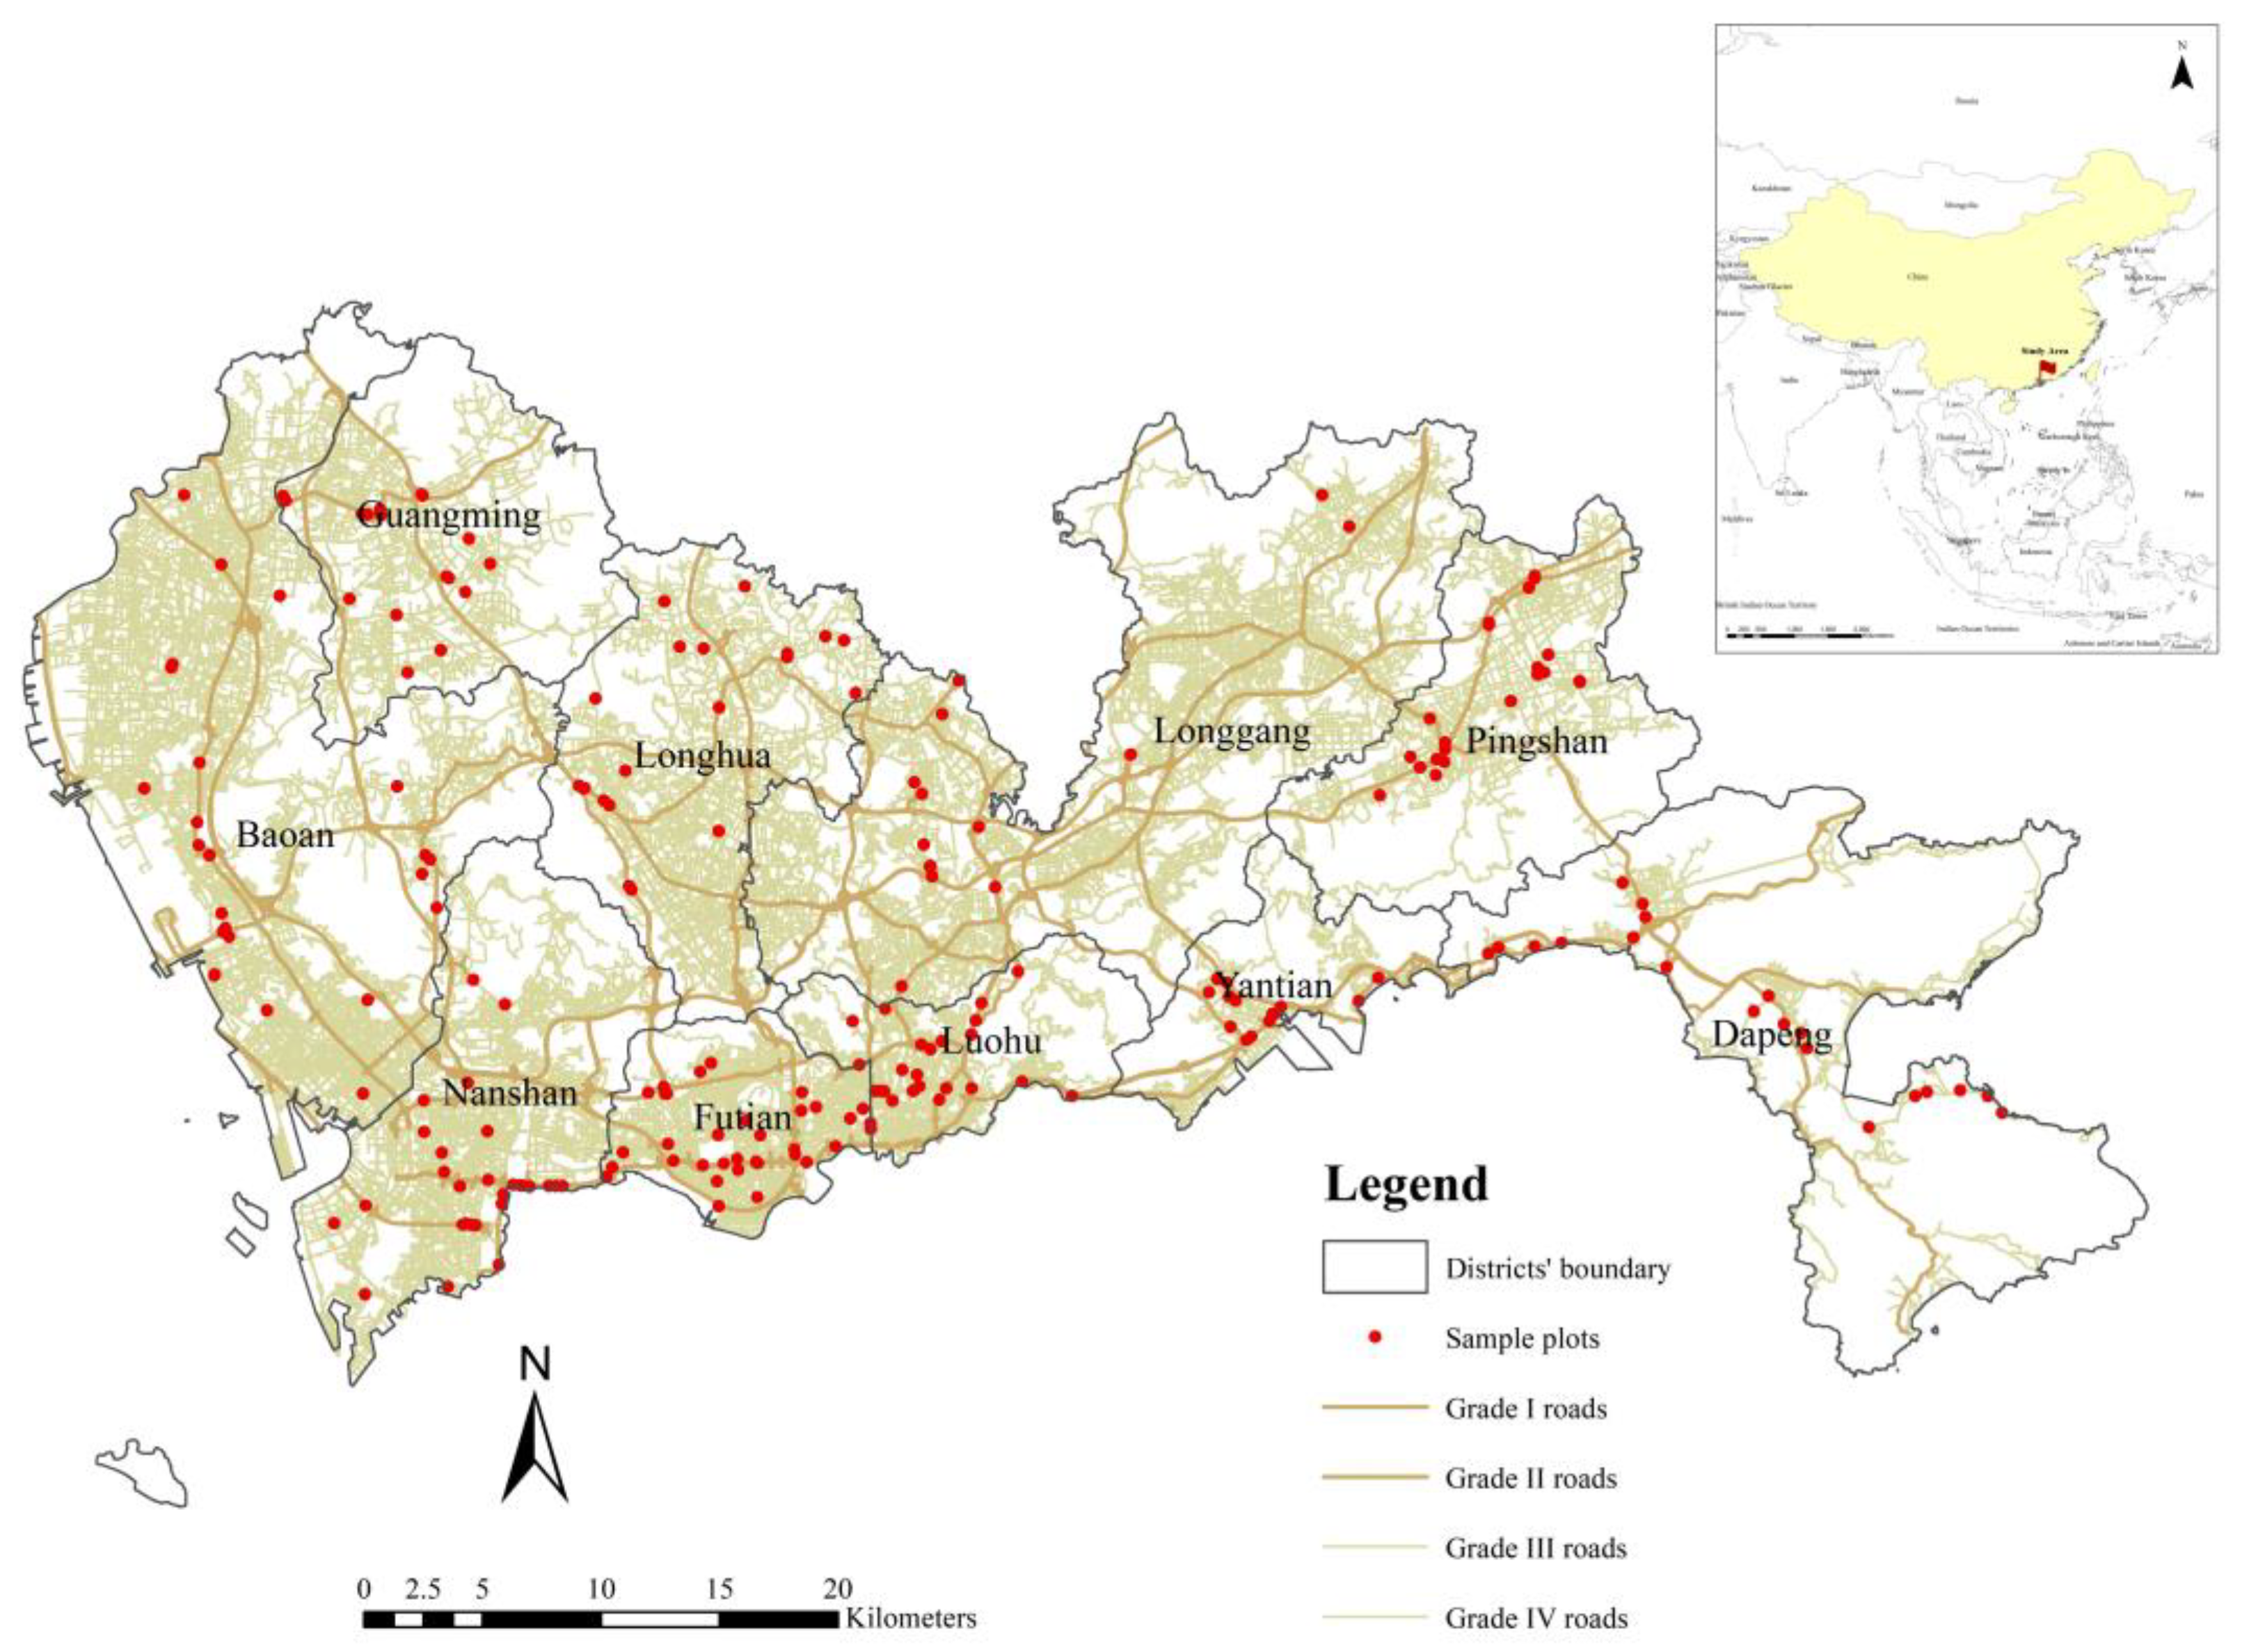
Shenzhen City, a coastal city, is located in the southern section of Guangdong Province, China, and is on the east bank of the Pearl River Estuary (Figure 2). It is connected with Hong Kong in the south and Dongguan and Huizhou in the north. Shenzhen is one of the four central cities in the Guangdong–Hong Kong–Macao Greater Bay Area. The city has nine administrative districts and a new district, with a total area of 1997.47 km2, including 927.96 km2 of built-up area. As a city with a highly developed social economy, the population and number of vehicles in Shenzhen are also considerable. Relevant data show that by the end of 2021, Shenzhen had a permanent population of 17.68 million, a total of 3.79 million civil vehicles, and a total of 37.38 thousand public bus (electric) vehicles. Faced with a huge population and vehicle base, when some residents choose to travel by car, it causes serious traffic noise pollution and interferes with the daily life of other residents. In this regard, various government departments in Shenzhen are also actively looking for response and mitigation measures. In July 2020, the Transport Bureau of Shenzhen Municipality, together with several other departments, issued a notice on the Administrative Measures of Shenzhen Municipality for the Prevention and Control of Noise Pollution from Traffic Public Facilities; this proposed specific pollution prevention measures to be implemented in order to decrease the interference of noise generated by the operation and use of urban roads and other traffic public facilities, and clarify the division of responsibilities between each unit. The notice also points to the implementation of an ecological isolation zone as one of the measures aimed at preventing and controlling noise pollution.
In addition to the high population, high number of vehicles and the severe traffic noise situation, Shenzhen City also has a relatively green environment, and it has reached the national standard for being categorized alongside forest cities and ecological garden cities. In 2021, the total green coverage area of Shenzhen reached 100.90 thousand hectares and the green space area reached 96.90 thousand hectares, accounting for 43.0% and 37.1% of urban built-up areas, respectively.
2.3. Noise Monitoring
From 26 July to 17 August 2021, our research team carried out roadside noise monitoring in the entirety of Shenzhen. There are 10 administrative districts and 4 road grades in Shenzhen. We used Create Random Points tool in ESRI ArcMap 10.6 to randomly generate 10 points under each grade of road in each district, generating 400 points in the whole city. Subsequently, we inspected all points generated by the software to select effective monitoring points. The exclusion criteria were as follows: (i) points with crossroads within 20 m; (ii) points that are close to ramps; (iii) points that may have high levels of pedestrian flow within 20 m after the field surveys. Finally, we obtained 217 effective points, and their distribution positions are shown in Figure 2.
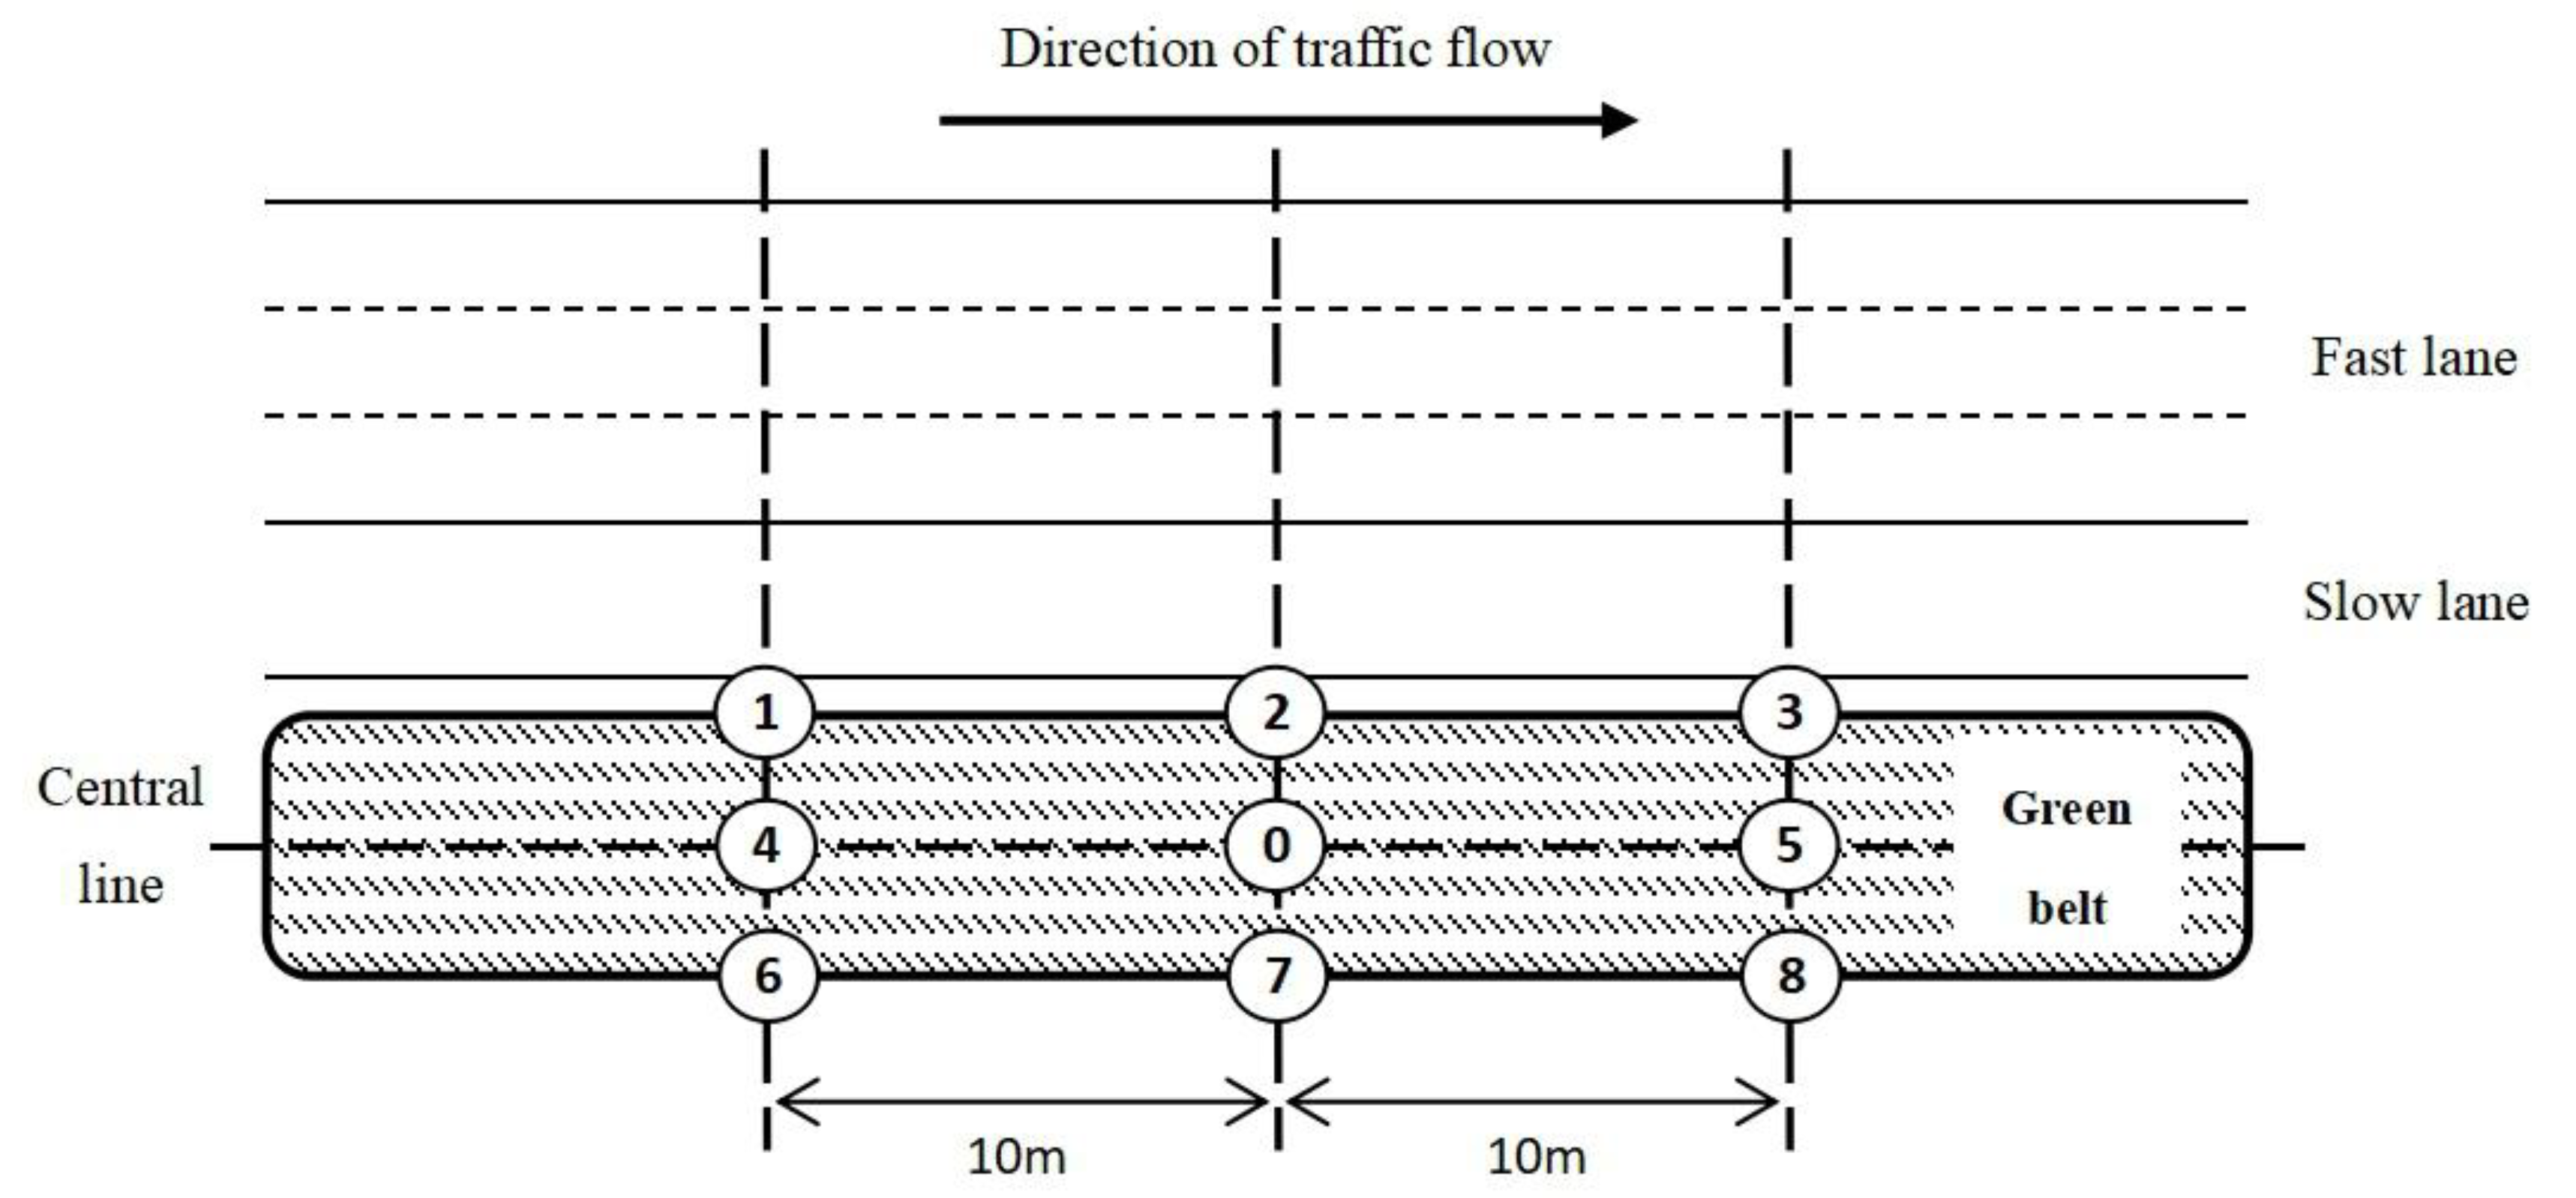
Our research team carried out noise monitoring on the road sections marked by the above monitoring points. In this survey, we used the handheld digital sound level meter from the SNDWAY brand (SW-524) for measurement. The frequency weight characteristic of each sound meter was set as “A” weight, which is applicable to measuring ambient noise. Response time was set as “fast” (125 ms) so that the instrument could record the real-time noise value once every second. Before the measurement was taken, we selected a 20 m long representative section of roadside green belt near the marker point. This section was our monitoring sample plot and we ensured that the green belt in the sample plot was in the form of “arbor–bush–grass” or “arbor–grass”. Then, we assigned each selected monitoring sample plot its own number and placed the sound meter at No. 1 to No. 8 positions (shown in Figure 3). The placement height of the sound meter was 1.5 m, according to the height of the human ear when an adult stands upright. The measurement period for all sample plots was between 8 a.m. and 6 p.m. during the day. During the measurement process, we set up one hour for the sound meters to monitor and record, and all eight sound meters in every plot would record noise values during the selected period. Finally, with the help of a mobile phone app, we mapped the boundary of the monitored green belt and recorded the average height and width of the green belt in each sample plot. In addition, after the noise monitoring was completed, the sample plot and its surrounding areas were also photographed and scanned to permanently retain the sample plot’s characteristics for other research work later.
2.4. Evaluation of Noise Reduction Service
After obtaining various noise monitoring data through the above methods, it was necessary to preprocess the original data for subsequent research. For the monitoring data obtained from each sound meter in each sample plot, the noise values in the measurement period were arranged from high to low, and then the 5% highest and lowest values were removed to eliminate the impact of abnormal data values. Next, we calculated the average value of the remaining values to be used as the noise monitoring value of the corresponding position for the sound meter, and then obtained the noise values of the No. 1–8 positions for each sample plot. Finally, we calculated the average noise value of the No. 1–3 positions for each sample plot as the noise value of the sound source point near the roadside, and calculated the average noise value of the No. 6–8 positions for each sample plot as the noise value of the receiving point behind the green belt.
The roads in the city are divided into four categories according to grade marks in the road classification vector map. Using the measured field data, the product amount and the value of the noise reduction service provided by the roadside green belts in Shenzhen City were calculated using the following methods.
Step 1, calculate the product amount of the noise reduction service provided by green belts near all grade i roads with 1% vegetation coverage.
where is the noise reduction amount of the jth sample plot near grade i road (decibel, dB); is the noise value of the sound source point in front of the green belt in plot i, j (dB); and is the noise value of the receiving point behind the green belt in plot i, j (dB).
where is the vegetation coverage of jth sample plot near grade i road (%), is the total area of the analysis buffer zone of the roadside green belt nearest to plot i, j (m2); and is the area of green space in this buffer zone (m2).
where is the noise reduction amount per 1% of vegetation coverage of the whole green belt where plot i, j is located in (dB); is the product amount of the noise reduction service provided by green belts near all grade i roads with 1% vegetation coverage (dB); and is the number of plots near grade i roads.
Step 2, calculate the total product amount of the noise reduction service provided by green belts near all grade i roads.
where is the total product amount of the noise reduction service provided by green belts near all grade i roads (dB·m); is the vegetation coverage of the green belt of the kth road belonging to grade i roads (%); is the length of the kth road belonging to grade i roads (m); and is the number of grade i roads.
Step 3, calculate the total product value of the noise reduction service provided by green belts near all grade i roads.
where is the total product value of the noise reduction service provided by green belts near all grade i roads (CNY); and is the construction cost of an artificial sound insulation wall for grade i roads (CNY/dB/m).
Step 4, calculate the total product amount and the value of the noise reduction service provided by green belts near all roads in the city.
where is the total product amount of the noise reduction service provided by green belts near all roads in the city (dB·m); is the total product value of the noise reduction service provide by green belts near all roads in the city (CNY), considering that there are four road grades in the city.
This paper calculates the product amount and the value of the noise reduction service provided by roadside green belts in Shenzhen, using the noise reduction model from the ecosystem evaluation module on the Intelligent Urban Ecosystem Management System (IUEMS) platform (www.iuems.com, accessed on 20 March 2023) [32]. We input the noise monitoring data, road information data, and spatial distribution data of ecosystems, as well as the analysis radius of the green belts alongside each road grade and the construction cost of an artificial sound insulation wall, then ran the model. We obtained the calculation results instantaneously.
In addition, the IUEMS platform provides spatial mapping services. Its principle is to evenly share the noise reduction amount and value placed on each green belt of each road. The unit of the noise reduction amount map (raster form) is dB·m per m2, and the unit of the noise reduction value map (raster form) is CNY per m2.
2.5. Data Sources
In addition to the data of 217 sample plots measured in this project, the main data used in our study also included the following: (i) the vector map of the administrative boundary of Shenzhen; (ii) the vector map of each administrative district’s boundary in Shenzhen; and (iii) the spatial distribution map of Shenzhen’s ecosystem types in 2020 (with a spatial resolution of 2 m). These data were mainly obtained from the project of Accounting for Shenzhen’s Gross Ecosystem Product (GEP).
The road classification vector map used in the study was from a commercial electronic map. We divided the roads into four categories, of which Grade I roads were 1215.83 km in length in total, Grade II roads were 822.94 km in length in total, Grade III roads were 715.98 km in length in total, and Grade IV roads were 1.29 × 10⁷ m in length in total. In this study, here were about 199.42 thousand sections of road in Shenzhen City.
The main parameters used in our study included the following: (i) The construction cost of an artificial sound insulation wall alongside each road, which is 7.5 CNY/dB/m. This parameter is from the technical specification for accounting the gross ecosystem product of Shenzhen. (ii) The analysis radii of the green belts alongside each road grade are as follows: 44.72 m for Grade I roads, 30.62 m for Grade II roads, 31.87 m for Grade III roads, and 25.40 m for Grade IV roads. This data were obtained by calculating the average distance at each grade from the receiving point of the effective sample plots to the center line of the road where the plot is located.
3. Results
3.1. Current Situation of Roadside Noise in Shenzhen
We analyzed the monitoring results of the current acoustic environment in Shenzhen City, according to the Environmental Quality Standard for Noise. Then, we obtained the traffic noise status and determined whether the noise standard was met for the entire city and each administrative district.
The average value for the traffic noise source in Shenzhen is 68.7 dB. Yantian District has the highest average noise source value (70.7 dB), and Dapeng New District has the lowest average value (63.7 dB) (see Figure 4).
Taking the daytime traffic noise standard limit (70 dB) of the 4a noise environment functional area as the threshold value, the noise standard for the city and all its administrative districts is as follows: 126 sample plots in the whole city reach the standard, accounting for 58.1% of the total effective sample plots. The highest rate up to the standard for each district is Dapeng New District, which is 95.0%, and the lowest is Futian District, which is 41.2% (see Figure 5).
3.2. Evaluation Results of Noise Reduction Service of Roadside Green Belts in Shenzhen City and All Road Grades
According to the calculation results, the total product amount of the noise reduction service provided by roadside green belts in Shenzhen City is 1.54 × 10⁵ dB·km, the total product value is CNY 1.16 billion, the average product amount is 9.87 dB, and the average product value is 73.99 CNY/m (see Table 1).
Among the roadside green belts alongside all the road grades, Grade IV roads have the highest total product amount and value, with a product amount of 1.19 × 10⁵ dB·km and a product value of CNY 889.85 million. The lowest values are for Grade III roads, with a product amount of 2886.49 dB·km and a product value of CNY 21.65 million. Grade II roads have the highest average product amount and value, with a product amount of 19.01 dB and a value of 142.58 CNY/m. The lowest values are for Grade III roads, with a product amount of 4.03 dB and a value of 30.24 CNY/m (Table 1).
3.3. Evaluation Results for Noise Reduction Service of Roadside Green Belts in Each Administrative District of Shenzhen
Among the roadside green belts in all districts, the roads in Baoan District have the highest total product amount and value in terms of their noise reduction service, with a product amount of 3.30 × 10⁴ dB·km and a product value of CNY 247.74 million. The lowest values are for roads in Guangming District, with a product amount of 6.84 × 10³ dB·km and a value of CNY 51.25 million. The roads in Dapeng New District have the highest average product amount and value, with a product amount of 20.50 dB and a value of 153.75 CNY/m. The lowest values are for roads in Longhua District, with a product amount of 6.65 dB and a value of 49.87 CNY/m (see Table 2).
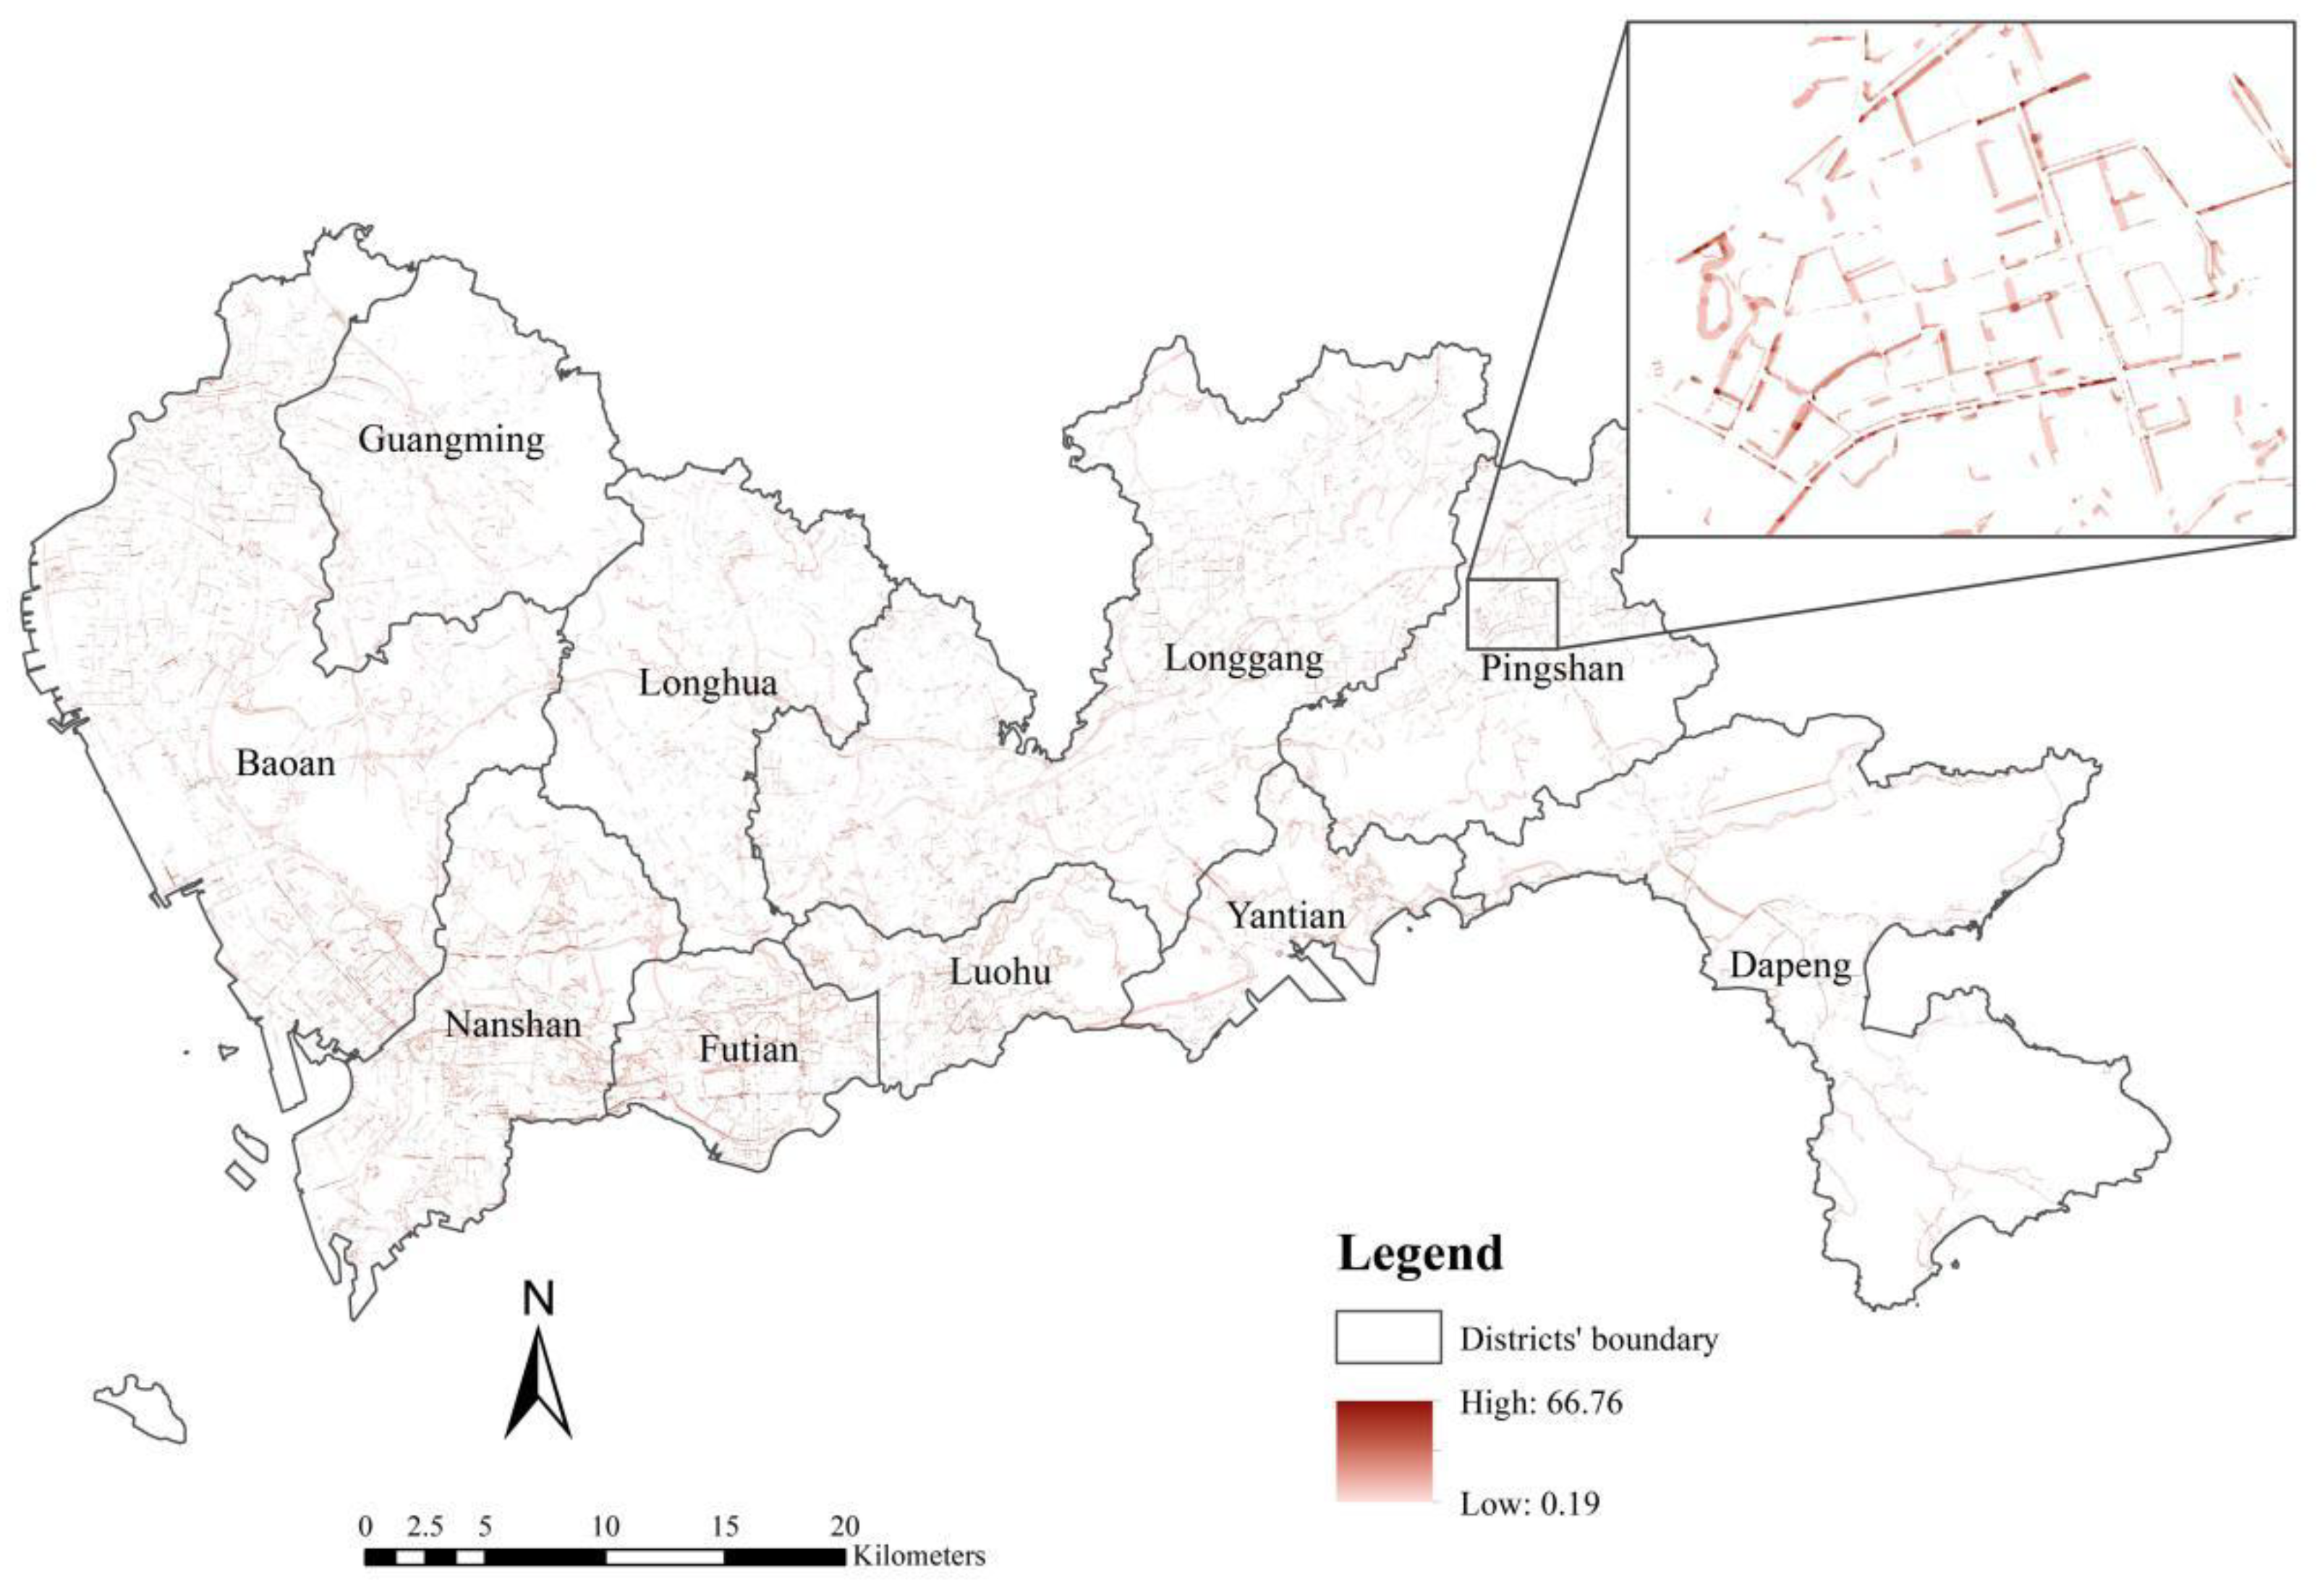
3.4. Map of Noise Reduction Service Value of Roadside Green Belt in Shenzhen
We used the IUEMS platform to generate the noise reduction service value map for roadside green belts in Shenzhen (Figure 6). According to the information in the map, the maximum noise reduction value found for roadside green belts in Shenzhen is 66.76 CNY/m2, and the minimum is 0.19 CNY/m2 in terms of per unit area. The darker the raster color in the figure, the higher the noise reduction value of the green belts in these places. On the contrary, the lighter the raster color, the lower the noise reduction value.
4. Discussion
4.1. Traffic Noise Can Meet Standards by Increasing Vegetation Coverage of Green Belts
It can be seen from the above results that when the traffic noise status of the city cannot reach the national standard, traffic noise can be reduced by adding roadside vegetation to improve the livability of the city.
According to our calculation, the average noise source values for all road grades in Shenzhen are 71.9 dB for Grade I roads, 70.2 dB for Grade II roads, 68.8 dB for Grade III roads, and 65.5 dB for Grade IV roads. It can be seen from the calculation results that the average noise source value of the Grade I and Grade II roads is higher than the national standard limit (70 dB), and therefore local government needs to take certain measures to reduce traffic noise. The previous research results above show that traffic noise can be reduced by 0.4 dB and 1.0 dB, respectively, for every 1% of vegetation coverage provided by green belts for Grade I and Grade II roads. Therefore, the traffic noise can be reduced to meet national standards by adding a 4.75% vegetation coverage within 44.72 m on both sides of the central line of Grade I roads and a 0.20% vegetation coverage within 30.62 m of Grade II roads. However, when studying whether the traffic noise is up to standard or not, we need to pay attention not only to the overall status of the city, but also to the actual status of each road section. Researchers and planners need to carry out work in specific sections that exceed the standard. Take the section of Beihuan Avenue in Futian District as an example, this section exceeds 4.7 dB. Therefore, an 11.75% vegetation coverage needs to be added to the original basis.
4.2. Impact of Vegetation Coverage Heterogeneity of Green Belts on Calculation Results
When calculating the product amount of the noise reduction services, some researchers only consider the value of noise reduction, road grade, and road length, and do not use the vegetation coverage of the roadside green belts in the formula for calculation [33,34,35]. This paper used this method to evaluate the service value of noise reduction in Shenzhen and its districts, then compared the results with our studies (Table 3). We found that there is a huge difference. The difference between the two methods in the value of the city is CNY 789.05 million, and the largest difference is seen in the Baoan District, with a value of CNY 196.32 million.
We hold that the former method ignores the difference in vegetation coverage between different roadside green belts, and regards the coverage of each road under all grades as the same value. In fact, even for roads with the same grade, the vegetation coverage is different. This factor needs to be taken into account when calculating the product amount and the value of noise reduction services. Therefore, our research method is an effective improvement upon the research methods that have been previously used, and there is a significant difference between the before and after improvement results. The research method of this paper considers the difference in the vegetation coverage between different roadside green belts, so that the calculation results are closer to the real value.
4.3. Impact of Significant Field Measurement Work on Calculation Results
Some previous studies are based on the existing noise mapping software to evaluate the noise reduction service of green belts. Although these researchers considered the spatial distribution characteristics of green belts, they did not carry out field measurements for traffic noise, resulting in a large deviation in the results. In this paper, we used the NOISESYSTEM V3 software, developed by Huanan Technology (developed according to Technical Guidelines for Noise Impact Assessment), to input road classification data and the spatial distribution information of green belts, and then obtained the simulated noise value at each receiving point in the green belts. We found that there is a certain deviation between the simulated and measured noise values at the receiving points. The average error, which is significant between the two, is 3.6 dB. It is 6% of the measured average noise value.
Because each city has a different climatic zone, the species and community structure of vegetation are also greatly different. To predict traffic noise values at roadsides and their surrounding areas in different cities, traditional methods need to be calibrated through field measurements. Therefore, the amount of field measurement work carried out in our studies is of great significance in order to improve the accuracy of the results.
4.4. Validation and Limitations
Using the same method as this paper, we calculated the value of the noise reduction service in other cities. According to our calculation results, the values of the noise reduction service of Beijing in 2015, 2020 and 2021 were CNY 1.58 billion, CNY 1.61 billion and CNY 1.54 billion, respectively. In another research project, researchers calculated the annual value provided by urban road green spaces in 2010 and found that it was 713 million CNY·a−1 [35]; this was by using a method that was similar to ours, but not the same. These results are not much different to our calculation results in order of magnitude. Our results are different because of the difference between the monitoring process and equations used. By comparing the above results, it can be proven that the research results of this paper have certain credibility, and that our methods can be extended to other research areas.
There are also some deficiencies in this study, including the fact that only the different impacts of vegetation coverage on the noise reduction effect were considered. This is because this paper focuses on the noise reduction effects provided by vegetation on the urban scale, and it is difficult to carry out a comprehensive survey of vegetation characteristics on such a scale. In small-scale measurement research, some scholars analyzed the impact of other vegetation characteristics on noise reduction, such as porosity [36], leaf area index [37], vegetation structures [16], tree species collocation patterns [17,38], etc. Although it is difficult to fully measure these vegetation community structure indicators in urban environments, it is still worth exploring. In the future, relevant research could explore the methods used to rapid evaluate these indicators in urban environments and integrate them into noise reduction models. When we carried out noise monitoring in Shenzhen, we used lidar to scan some plots (about one hundred) and obtained the three-dimensional point cloud data of these plots. Based on these data, we can calculate some vegetation characteristic parameters, and use these parameters to explore their concrete impact on noise reduction at a local scale, including which characteristics have an impact on noise reduction and how much they affect it.
5. Conclusions
Through the combination of field monitoring and software analysis, this paper analyzes the current situation of traffic noise in Shenzhen City and its administrative districts. We found that the problem of traffic noise pollution in Shenzhen and its districts is serious. We also evaluated the product amount and value of the noise reduction service provided by roadside green belts both in urban and district scales, then used software tools to obtain the spatial distribution map of the product value. The results showed that the product amount of the noise reduction service provided by roadside green belts in Shenzhen was 1.54 × 10⁵ dB·km, and the product value was CNY 1.16 billion. Finally, according to the traffic noise reduction capacity per 1% of the vegetation coverage of green belts and the noise status up to the standard of each road, this paper explains how to reach the standard overall. Grade I roads need to increase the vegetation coverage of green belts by 4.75%, and Grade II roads need to increase this by 0.20%.
In addition, by comparing these results with the results of traditional research methods, it is clearly necessary to improve the research methods. This paper did this, and significantly improved the accuracy of the calculation results. The calculated results might remind people that urban green spaces have a higher ecological service value. In addition, this paper has certain guiding significance for urban green space planning. For example, administrators and planners could take different measurements by identifying road sections with different values. For sections with a higher value, green spaces need to be protected and maintained; for sections with a lower value, green spaces need to be reconstructed, by improving vegetation coverage.
Author Contributions
Conceptualization, L.L., B.H. and D.T.; methodology, L.L. and B.H.; formal analysis, L.L.; investigation, L.L., D.W. and C.S.; resources, B.H.; data curation, L.L.; writing—original draft preparation, L.L.; writing—review and editing, L.L. and B.H.; visualization, L.L.; supervision, B.H. and D.T.; project administration, L.L. and B.H. All authors have read and agreed to the published version of the manuscript.
Funding
This research was funded by the Strategic Priority Research Program of the Chinese Academy of Sciences, grant number XDA230301 and the Youth Innovation Promotion Association Program of the Chinese Academy of Sciences, grant number 2020042.
Data Availability Statement
The data are not publicly available due to privacy restrictions.
Acknowledgments
We thank our investigators for assistance in monitoring urban traffic noise.
Conflicts of Interest
The authors declare no conflict of interest. The funders had no role in the design of the study; in the collection, analyses, or interpretation of data; in the writing of the manuscript; or in the decision to publish the results.
References
- Guha, A.K.; Gokhale, S. Urban workers’ cardiovascular health due to exposure to traffic-originated PM2.5 and noise pollution in different microenvironments. Sci. Total Environ. 2023, 859, 160268. [Google Scholar] [CrossRef] [PubMed]
- Guo, S.; Zhou, Y.; Yu, J.; Yang, L. Effects of the Combination of Audio and Visual Factors on Mental Restoration in a Large-Scale Urban Greenway: Perspectives from Wuhan, China. Land 2022, 11, 2017. [Google Scholar] [CrossRef]
- Nieuwenhuijsen, M.J. New urban models for more sustainable, liveable and healthier cities post covid19; reducing air pollution, noise and heat island effects and increasing green space and physical activity. Environ. Int. 2021, 157, 106850. [Google Scholar] [CrossRef] [PubMed]
- Liu, Y.; Cao, Q.; Gao, X. The urban sound environmental quality condition and analysis of China. Environ. Monit. China 2005, 3, 71–72. [Google Scholar] [CrossRef]
- Dang, H.; Li, J. The integration of urban streetscapes provides the possibility to fully quantify the ecological landscape of urban green spaces: A case study of Xi’an city. Ecol. Indic. 2021, 133, 108388. [Google Scholar] [CrossRef]
- Ma, B.; Hauer, R.J.; Xu, C.; Li, W. Visualizing evaluation model of human perceptions and characteristic indicators of landscape visual quality in urban green spaces by using nomograms. Urban For. Urban Green. 2021, 65, 127314. [Google Scholar] [CrossRef]
- Huang, H.; Zhang, M.; Yu, K.; Gao, Y.; Liu, J. Construction of complex network of green infrastructure in smart city under spatial differentiation of landscape. Comput. Commun. 2020, 154, 380–389. [Google Scholar] [CrossRef]
- Chan, K.M.; Vu, T.T. A landscape ecological perspective of the impacts of urbanization on urban green spaces in the Klang Valley. Appl. Geogr. 2017, 85, 89–100. [Google Scholar] [CrossRef]
- Wang, A.; Guo, Y.; Fang, Y.; Lu, K. Research on the horizontal reduction effect of urban roadside green belt on atmospheric particulate matter in a semi-arid area. Urban For. Urban Green. 2022, 68, 127449. [Google Scholar] [CrossRef]
- Tomson, M.; Kumar, P.; Barwise, Y.; Perez, P.; Forehead, H.; French, K.; Morawska, L.; Watts, J.F. Green infrastructure for air quality improvement in street canyons. Environ. Int. 2021, 146, 106288. [Google Scholar] [CrossRef]
- Nowak, D.J.; Hirabayashi, S.; Bodine, A.; Hoehn, R. Modeled PM2.5 removal by trees in ten U.S. cities and associated health effects. Environ. Pollut. 2013, 178, 395–402. [Google Scholar] [CrossRef] [PubMed]
- Junqueira, J.R.; Serrao-Neumann, S.; White, I. Using green infrastructure as a social equity approach to reduce flood risks and address climate change impacts: A comparison of performance between cities and towns. Cities 2022, 131, 104051. [Google Scholar] [CrossRef]
- Li, L.; Uyttenhove, P.; Eetvelde, V.V. Planning green infrastructure to mitigate urban surface water flooding risk—A methodology to identify priority areas applied in the city of Ghent. Landsc. Urban Plan. 2020, 194, 103703. [Google Scholar] [CrossRef]
- Gill, S.E.; Handley, J.; Ennos, A.R.; Pauleit, S. Adapting cities for climate change: The role of the green infrastructure. Built Environ. 2007, 33, 115–133. [Google Scholar] [CrossRef] [Green Version]
- Cohen-Shacham, E.; Janzen, C.; Maginnis, S.; Walters, G. Nature-Based Solutions to Address Global Societal Challenges; IUCN: Gland, Switzerland, 2016; pp. 2–32. [Google Scholar] [CrossRef] [Green Version]
- Wang, H.; Guo, J.; Zhang, Y.; Wei, H.; Feng, L. Study on noise attenuation impact of roadside tree-belts and related influence factors. Ecol. Environ. Sci. 2010, 19, 1403–1408. [Google Scholar] [CrossRef]
- Sun, W.; Wang, W.; Guo, X.; Peng, H. Comparison on attenuation effect of green belts with different types on traffic noise. J. Plant Resour. Environ. 2014, 23, 87–93. [Google Scholar]
- Li, Y.; Huang, S.; Yan, L. Noise attenuation ability and its affecting factors of green belts of 11 areas in the Yangtze River Delta. J. Zhejiang A F Univ. 2020, 37, 251–258. [Google Scholar] [CrossRef]
- Schäffer, B.; Brink, M.; Schlatter, F.; Vienneau, D.; Wunderli, J.M. Residential green is associated with reduced annoyance to road traffic and railway noise but increased annoyance to aircraft noise exposure. Environ. Int. 2020, 143, 105885. [Google Scholar] [CrossRef] [PubMed]
- Ow, L.F.; Ghosh, S. Urban cities and road traffic noise: Reduction through vegetation. Appl. Acoust. 2017, 120, 15–20. [Google Scholar] [CrossRef]
- Pathak, V.; Tripathi, B.D.; Mishra, V.K. Dynamics of traffic noise in a tropical city Varanasi and its abatement through vegetation. Environ. Monit. Assess. 2008, 146, 67–75. [Google Scholar] [CrossRef]
- Fang, C.; Ling, D. Investigation of the noise reduction provided by tree belts. Landsc. Urban Plan. 2003, 63, 187–195. [Google Scholar] [CrossRef]
- Hosseini, S.A.; Zandi, S.K.; Fallah, A.; Nasiri, M. Effects of geometric design of forest road and roadside vegetation on traffic noise reduction. J. For. Res. 2016, 27, 463–468. [Google Scholar] [CrossRef]
- Fu, L.; Ai, T.; Huang, L.; Xin, R. Three-dimensional dynamic noise map based on traffic trajectory data. J. Geo-Inf. Sci. 2020, 22, 1789–1798. [Google Scholar]
- Cai, M.; Zou, J.; Li, F.; Luo, W.; Wang, D.; Chen, Z. Research and application of the urban environment noise simulation and evaluation system named “Zhong Da Sheng Tu”. Acta Sci. Nat. Univ. Sunyatseni 2012, 51, 39–44. [Google Scholar]
- Peng, F. Methods and Case Study of Mapping Urban Noise via Big Data Analysis. Master’s Thesis, Tsinghua University, Beijing, China, 2016. [Google Scholar]
- Le, X. Study on Noise Characteristics of Urban Road and Construction of Noise Map Information System. Master’s Thesis, Zhejiang University, Hangzhou, China, 2015. [Google Scholar]
- Picaut, J.; Fortin, N.; Bocher, E.; Petit, G.; Aumond, P.; Guillaume, G. An open-science crowdsourcing approach for producing community noise maps using smartphones. Build. Environ. 2019, 148, 20–33. [Google Scholar] [CrossRef]
- Lan, Z.; Cai, M. Dynamic traffic noise maps based on noise monitoring and traffic speed data. Transp. Res. Part D Transp. Environ. 2021, 94, 102796. [Google Scholar] [CrossRef]
- Kluijver, H.D.; Stoter, J.E. Noise mapping and GIS: Optimising quality and efficiency of noise effect studies. Comput. Environ. Urban Syst. 2003, 27, 85–102. [Google Scholar] [CrossRef] [Green Version]
- Das, P.; Talukdar, S.; Ziaul, S.; Das, S.; Pal, S. Noise mapping and assessing vulnerability in meso level urban environment of Eastern India. Sustain. Cities Soc. 2019, 46, 101416. [Google Scholar] [CrossRef]
- Han, B.; Ouyang, Z. The comparing and applying Intelligent Urban Ecosystem Management System (IUEMS) on ecosystem services assessment. Acta Ecol. Sin. 2021, 41, 8697–8708. [Google Scholar]
- Chen, L.; Yang, S.; Zhang, L.; Wu, Q.; Huang, L.; He, H.; Zhu, L. Research on service function and value of greenbelt noise-reduction of suburban road. Guangxi For. Sci. 2020, 49, 410–414. [Google Scholar] [CrossRef]
- Chen, L.; Zhang, L.; Yang, S.; Chen, F. Research on noise-reduction service function by green belts along the urban trunk roads in Liuzhou City. J. Guangxi Minzu Univ. 2018, 24, 93–97. [Google Scholar] [CrossRef]
- Chen, L.; Xie, G.; Ge, L.; Pei, X.; Zhang, C.; Zhang, B.; Xiao, Y. Research on noise reduction service of road green spaces—A case study of Beijing. J. Nat. Resour. 2011, 26, 1526–1534. [Google Scholar]
- Hu, X.; Zhen, Y.; Chen, M.; Wei, H.; Ye, L.; Qiu, R. Effects of street trees porosity on traffic noise reduction. J. Chongqing Jiaotong Univ. 2015, 34, 95–98+160. [Google Scholar]
- Zhang, Q.; Zheng, S.; Xia, L.; Wu, H.; Zhang, M.; Li, M. Noise reduction function and its affecting factors of urban plant communities in Shanghai. Chin. J. Appl. Ecol. 2007, 10, 2295–2300. [Google Scholar]
- Nasiri, M.; Fallah, A.; Nasiri, B. The effects of tree species on reduction of the rate of noise pollution at the edge of hyrcanian forest roads. Environ. Eng. Manag. J. 2015, 14, 1021–1026. [Google Scholar] [CrossRef]
Figure 1.
The workflow of this study.

Figure 2.
The location of Shenzhen City and the distribution of noise monitoring points in it.

Figure 3.
The schematic map of sound meter’s positions. The numbers 1–8 represent the positions of noise meters, and the number 0 represent the geometric center of the plot.
Figure 3.
The schematic map of sound meter’s positions. The numbers 1–8 represent the positions of noise meters, and the number 0 represent the geometric center of the plot.

Figure 4.
Current situation of traffic noise in Shenzhen and each district.

Figure 5.
Situation of traffic noise up to the standard in Shenzhen and each district.

Figure 6.
Product value of the noise reduction service of roadside green belts in Shenzhen (Mapping by IUEMS).
Figure 6.
Product value of the noise reduction service of roadside green belts in Shenzhen (Mapping by IUEMS).


Table 1.
Product amount and value of the noise reduction service provided by roadside green belts in Shenzhen and at each road grade.
Table 1.
Product amount and value of the noise reduction service provided by roadside green belts in Shenzhen and at each road grade.
| Road Grade | Total Product Amount of Noise Reduction Service (dB·km) | Average Product Amount of Noise Reduction Service (dB) | Total Product Value of Noise Reduction Service (Million CNY) | Average Product Value of Noise Reduction Service (CNY/m) |
|---|---|---|---|---|
| Grade I | 16,912.40 | 13.91 | 126.84 | 104.33 |
| Grade II | 15,644.70 | 19.01 | 117.34 | 142.58 |
| Grade III | 2886.49 | 4.03 | 21.65 | 30.24 |
| Grade IV | 11,8647.32 | 9.22 | 889.85 | 69.17 |
| Shenzhen City | 154,090.91 | 9.87 | 1155.68 | 73.99 |
Table 2.
Product amount and value of the noise reduction service of roadside green belts in each district of Shenzhen.
Table 2.
Product amount and value of the noise reduction service of roadside green belts in each district of Shenzhen.
| District Name | Total Product Amount of Noise Reduction Service (dB·km) * | Average Product Amount of Noise Reduction Service (dB) | Total Product Value of Noise Reduction Service (Million CNY) * | Average Product Value of Noise Reduction Service (CNY/m) |
|---|---|---|---|---|
| Baoan | 33,032.61 | 8.83 | 247.74 | 66.19 |
| Dapeng | 11,300.90 | 20.50 | 84.76 | 153.75 |
| Futian | 14,833.20 | 11.47 | 111.25 | 86.06 |
| Guangming | 6833.76 | 6.87 | 51.25 | 51.49 |
| Longgang | 27,964.81 | 8.17 | 209.74 | 61.24 |
| Longhua | 10,320.58 | 6.65 | 77.40 | 49.87 |
| Luohu | 9680.21 | 12.45 | 72.60 | 93.34 |
| Nanshan | 22,687.23 | 11.72 | 170.15 | 87.89 |
| Pingshan | 10,062.61 | 11.19 | 75.47 | 83.94 |
| Yantian | 7111.01 | 17.33 | 53.33 | 129.99 |
* The sum value of all districts is slightly lower than the whole city due to boundary cutting.
Table 3.
Comparison of product value calculated by the two methods for the whole city and each district.
Table 3.
Comparison of product value calculated by the two methods for the whole city and each district.
| District Name | The Value by Green Belts without Considering Their Coverage (Million CNY) | The Value by Green Belts with Considering Their Coverage (Million CNY) |
|---|---|---|
| Baoan | 51.42 | 247.74 |
| Dapeng | 9.85 | 84.76 |
| Futian | 36.96 | 111.25 |
| Guangming | 31.68 | 51.25 |
| Longgang | 97.91 | 209.74 |
| Longhua | 43.59 | 77.40 |
| Luohu | 19.37 | 72.60 |
| Nanshan | 55.77 | 170.15 |
| Pingshan | 11.37 | 75.47 |
| Yantian | 3.42 | 53.33 |
| Shenzhen City | 366.63 | 1155.68 |
Disclaimer/Publisher’s Note: The statements, opinions and data contained in all publications are solely those of the individual author(s) and contributor(s) and not of MDPI and/or the editor(s). MDPI and/or the editor(s) disclaim responsibility for any injury to people or property resulting from any ideas, methods, instructions or products referred to in the content. |
© 2023 by the authors. Licensee MDPI, Basel, Switzerland. This article is an open access article distributed under the terms and conditions of the Creative Commons Attribution (CC BY) license (https://creativecommons.org/licenses/by/4.0/).
Share and Cite
MDPI and ACS Style
Liu, L.; Han, B.; Tan, D.; Wu, D.; Shu, C. The Value of Ecosystem Traffic Noise Reduction Service Provided by Urban Green Belts: A Case Study of Shenzhen. Land 2023, 12, 786. https://doi.org/10.3390/land12040786
AMA Style
Liu L, Han B, Tan D, Wu D, Shu C. The Value of Ecosystem Traffic Noise Reduction Service Provided by Urban Green Belts: A Case Study of Shenzhen. Land. 2023; 12(4):786. https://doi.org/10.3390/land12040786
Chicago/Turabian StyleLiu, Li, Baolong Han, Deming Tan, Dawei Wu, and Chengji Shu. 2023. "The Value of Ecosystem Traffic Noise Reduction Service Provided by Urban Green Belts: A Case Study of Shenzhen" Land 12, no. 4: 786. https://doi.org/10.3390/land12040786
Note that from the first issue of 2016, this journal uses article numbers instead of page numbers. See further details here.