

A Connectivity Approach to Agricultural Diffuse Pollution in Tropical Montane Catchments Dominated by Swidden Landscapes


1
Laboratoire de Géographie Physique CNRS LGP-UMR 8591, Université Paris Est-Créteil, 94320 Thiais, France
2
Laboratoire IDEES-Caen CNRS UMR 6266, Université Caen Normandie, 14032 Caen, France
*
Author to whom correspondence should be addressed.
Land 2023, 12(4), 784; https://doi.org/10.3390/land12040784
Submission received: 4 March 2023
/
Revised: 21 March 2023
/
Accepted: 28 March 2023
/
Published: 30 March 2023
(This article belongs to the Special Issue Landscape Connectivity: A Comprehensive View from Different Perspectives)
Abstract
:Shifting cultivation is widely practiced in many tropical mountainous watersheds. Agricultural practices are changing with the intensification of activities and the development of industrial monocultures associated with increasing land use and the use of pesticides and fertilisers. These changes have consequences for the evolution of sediment transfers in watersheds, resulting in new vulnerabilities for the inhabitants. This article shows the evolution of structural connectivity over 5 years in the village of Houaylack-Vangven, located in northern Laos, and its potential links with agricultural diffuse pollution. To develop a structural source-to-sink model to understand sediment transfers, our method was based on open-access data and various geographical tools. Field surveys were conducted to identify areas vulnerable to erosion and sediment transfers. The sources and sinks were then located using remote sensing techniques and image interpretation to then characterise connectivity rates. Finally, the relationship between the sources and sinks was analysed by graph theory to explore the potentialities for assessing the connectivity and exposure of sediment sinks. The main results are twofold: sinks coincide with areas at risk of contamination by pesticides and fertilisers, and the structural connectivity increases with the increasing of the source surfaces (swidden plots) due to the ongoing agricultural transition.
1. Introduction
Over the last decades, the uplands of south-east Asia have experienced a transition from an extensive shifting cultivation for subsistence towards an export-oriented commercial agricultural system [1]. This has been well described in the northern region of Lao People’s Democratic Republic (PDR) [2,3,4]. The goal of the transition to commercial crops, guided by the government, is to transform cultivated land into capital to protect forested areas [5,6,7,8]. This has intensified the agricultural activity in the upland areas, using numerous pesticides and herbicides, while traditional agricultural models, characterised by swidden agriculture relying on shifting practices with long fallow periods, preserve the soil from erosion and fertility depletion [9,10,11]. In this context, diffuse pollution is likely to become a major threat to the environment and rural livelihoods. Indeed, these new practices result in the pollution of food and sediments [12], cause diseases among farmers as well as spraying accidents [13], and have become a growing concern for the government, which promoted pesticides decrees in 2010 and 2017. The development of a crop boom and the plantation of commercial trees such as maize, Job’s tears, cassava, bananas, rubber, and teak [3,4] increase soil pressure [5,14,15,16] with shorter rotations [5] and thus lead farmers to rely on herbicides [17]. The upland transition relies on two aspects; on the one hand, the development of pluriannual cash crops leads to the end of swidden agriculture. On the other hand, annual cropping areas increase, while rotation length decreases.
In the uplands, studies focusing on erosion issues have been conducted at the plot scale through interrill erosion [18,19] and at the small catchment scale up to 0.5–3 km2 [17]. They show that tillage, plant litter cleaning, and short fallow periods strongly increase the erosion and runoff processes [19,20]. Occurring on steep slopes, this explains a greater propensity to generate concentrate surface runoff, which contributes to rill erosion and to the development of gullies [1,17,21], thus increasing connectivity and sediment transfers [22]. Consequently, the roles of landscape mosaics or riparian forests in filtration, sediment trapping, and run-off are becoming less efficient on the steep slopes that characterise the uplands [17,20,23,24]. Under intensive cash cropping, these regions are identified as critical sources of sediments [17,21]. Furthermore, on the plots that have been cultivated over several years with short fallow periods, the villagers have come to develop new strategies to secure their livelihoods. Hoeing [21,25] and chemical inputs [26] are often needed to counteract soil fertility depletion. At the same time, the development of cash crop plots involves a chain process that increases the risk of pollution. Pesticides and herbicides are used to increase yields and reduce the time spent on hand-weeding [26,27], and feedback would enable the multiplication of cultivated plots to improve the agricultural work of households [28,29], especially on maize crops [3,4,7,27,30,31]. Moreover, on maize plots located in the uplands of northern Laos, herbicides (e.g., atrazine, glyphosate, paraquat, and Annexe1) are mostly used on bare soil at the beginning of the rainy season. Therefore, upland plots have become a potential source of pesticides resulting from diffuse agriculture pollution, soil erosion, and sediment transfers [32,33]. For example, recent studies conducted in Lao PDR have demonstrated that land use and erosion play a key role in the dissemination of microbiological pollutants linked with sediment flows [34,35]. They play a major role in bacterial contamination issues [34] in lowland paddy rice fields, especially during rice plantation by the villagers, who are potentially exposed to pollution. Many herbicides such as atrazine or paraquat are highly persistent in the environment. For instance, atrazine is not absorbed by soils, which leads to a high risk of ground and surface water pollution [36], while paraquat is strongly bent to soil particles, thus decreasing its bioavailability for degradation [37]. In both cases, these widely used herbicides are subjected to transfers in water (atrazine) or sediments (paraquat). This affects the soil as well as groundwater resources for a period ranging from a few days to several years, which explains the long-lasting release into certain river systems [38]. It also depends on environmental factors [39], and must have an impact on water quality and associated wetlands over the course of the spraying season, possibly even on a multi-year basis. Therefore, paddy rice fields and other wetlands such as ponds and rivers appear to be very sensitive to sediment and pesticide flows and represent a meeting point between the population and the pollution generated upstream.
While erosion processes are well documented in Laotian swidden landscapes, e.g., [18,22,34], the role of transfer modalities and the identification of successive sediment sinks is less studied. Most of the previous studies on sediment transfers have been conducted in small experimental watersheds. In these studies, an outlet sediment signal is used to quantify upstream erosion processes, with a focus on source areas and especially the role of land use [34]. In larger basins, downstream sediment and pollutant spreading analyses are rare, and the spatial terms of these transfers are even more rarely mentioned. In the absence of previous studies dedicated to sediment and/or pesticide transfers from source to sink, this paper proposes a simple and reproducible method based on free data to quantify connectivity rates through time and space in Laotian upland landscapes. It analyses the potential sediment transfers at the village scale, which constitutes the living and working environment of the populations. These populations mainly constitute farmers, who are therefore directly concerned by pesticides and the consequences of their use. The connectivity conceptual framework provides a key for understanding hydro-sedimentary transfer through watersheds [40]. Sediment connectivity can be either structural or functional [41,42,43]. Functional connectivity can be considered as the linkage of landscape elements by a process [41,42,44] or various geomorphic processes [45], while structural connectivity mainly catches a static picture of connectivity without considering the dynamic aspects of connectivity changes during rainfall events. Nonetheless, it allows us to decipher the link between sources and sinks of sediments and pollutants and to understand the potential path of water and sediments without requiring the installation of costly and time-consuming measuring equipment. The challenge is to develop a robust method that can be used in other swidden landscape contexts. Based on the identification of potential sources, sinks, and connections, this study assumed that structural connectivity could provide an interesting approach to evaluate the potential transfer and trapping within a catchment by delineating connectivity factors [46,47]. Furthermore, the organisation of the spatial spread of sediments and their associated pollutants through time is an element of understanding which can lead to mitigation measures [32]. As the transition from traditional extensive swidden agriculture to mono-cropping seasonal cash crop agriculture and permanent crops is likely to transform connectivity patterns, we chose to develop a diachronic analysis in an area subjected to rapid land use changes over the last years. Five consecutive rainy seasons from 2016 to 2020 have been considered to compare the evolution of structural connectivity through time in the village of Houaylack-Vangven in northern Lao PDR.
2. Study Area
Houaylack-Vangven is a Khmu village in the northern part of the province of Oudomxay. The landscape is characterised by mountains whose summits are 730 to 1250 m high. The sector is characterised by steep slopes (18.5° in average) caused by watercourses cut to the detriment of schists and sandstone basements and fed by heavy rainfall during the rainy season. According to the FAO-UNESCO soil classification for Lao PDR, the soils in the study area are mainly acrisols with low levels of plant nutrients, excess aluminium and high erodibility, which are traditionally valued by shifting cultivation. The region is characterised by its monsoon climate, with an average annual precipitation of 1600 mm (Luang Namtha data, NOAA), and by its rainy season (April to September), during which more than 80% of the annual precipitation falls with a mean annual temperature of 27 °C. Exceptional rainfall events play a key role in sediment transfer, as they do everywhere in the uplands of SE Asia [17]. The dry season (October to March) is characterised by much lower precipitation rates and cooler temperatures of around 23 °C.
During the rainy season, the village is, for the most part, dedicated to shifting cultivation. In this study, shifting cultivation, previously called “slash and burn” agriculture, refers to the cultivation of swidden with crops followed by several years of fallow. Upland plots refer to plots under cultivation in the swidden landscape while slash and burn practices are used by villagers to prepare the plots for the seedlings. Due to the fragmented spatial distribution of the upland plots within the village boundaries, an extensive watershed approach is required to enclose the entire cultivated area of the village concerned by shifting agriculture. Therefore, the study site covers three small tributary watersheds of the upstream part of the Nam Pak River. They cover 52 km2 (Figure 1). Upland cultivation has gradually shifted from traditional mixed cultivation based on upland rice to cash crops, initially maize from 2012, and sugar cane from 2020. This rapid evolution from an extensive, shifting cultivation system towards cash crops (maize) and finally to the establishment of a permanent crop (sugar cane) is emblematic of the evolution of many villages in northern Lao PDR [2,4]. A field survey conducted with local farmers showed that herbicides are used on maize at the beginning of the rainy season, during pre-emergence with non-selective herbicides, e.g., paraquat and glyphosate, and during post-emergence, mainly with atrazine but also using glyphosate between the maize stalks. The use of herbicides in the uplands, and particularly in irrigated rice fields, is not generalised but it is diverse and must be considered in all types of plots. It is of special importance to note that the villagers mention cases of paddy rice fields’ destruction by upstream herbicide flows during the spraying period. The use of herbicides on sugar cane has not yet been identified, and the spraying calendar in Houaylack-Vangven sugar cane fields remains unknown. However, for this crop, the information collected amongst farmers of a neighbouring village (Teuka) relates to a first non-selective herbicide application in June or July followed by other applications in the late rainy season, depending on the weed pressure [48]. Reports from field observations indicate a reliance on fertilisers (NPK) for sugar cane cultivation.
3. Materials and Methods
To define the evolution of pesticides and sediment transfers induced by the development of commercial crops, we conducted two phases of research. First, field work was carried out to identify the swidden landscape connectivity patterns through the identification of sediment sources, sinks, and their associated delivery pathways. Then, this empirical analysis was tested and generalised using remote sensing and geographic information system (GIS) software.
3.1. A Connectivity Approach
To understand sediment transfers in a catchment, the common methodological thread relies on a “source to sink” approach with, on the one hand, the identification of the sediment sources, and the identification of potential sinks on the other hand. In our case study, sediment transfers can threaten the health and livelihood of the villagers because of the spreading of pollution. In this context, and due to the specificities of agricultural practices based on shifting cultivation, our approach to define sediment transfers covered 5 rainy seasons (from 2016 to 2020). Houaylack-Vangven is a traditional Khmu village with a long rotation system of about 5 years. The traditional long fallow period, of around 15 years [9], has been reduced and the selected period may help to capture the picture of connectivity considering the rotation of sediment sources associated with swidden agriculture in the context of cash crop development.
With a view to understanding the organisation of sediment flux and formalising it, we focused our study on sediment structural connectivity (Figure 2). To define the structural connectivity and spatialise it, we developed a landscape pattern analysis. The potential sediment sources and sinks were identified and characterised through time to determine the impact of the changes in farming systems on connectivity patterns [47]. While a field-based approach allows limited mapping extension, remote sensing techniques can be performed to identify connectivity changes through time at larger scales. We used remote sensing data and field observations to spatialise the sediment connectivity by delineation of the sediment production areas and the transfer pathways to sinks over time. The aim was to identify the most sensitive sinks to sediment and pollutant transfers and to quantify sediment connectivity changes within catchments that come along with land use changes. Forested slopes which also produce and transfer sediments, as well as the role of fallow lands as sediment sinks [21], were excluded since this study focused on the sensitivity to pollutants transfer.
Numerous processes can induce sediment transfers through the watershed by sediment fluxes, but connectivity is mainly controlled by hydro-meteorological forcing, as well as by the intrinsic properties of the system [49]. Our method relies on sediment connectivity identification and spatialisation using a morphological and network analysis approach. The network structure between specific sediment sources and sinks within a catchment can be abstracted by graph theory applied to geomorphology [45,50,51,52,53]. To analyse the spatial distribution of sediments and their pathways, the graph theory such as that used by Heckman and Schwanghart, 2013 [51], considers a succession of nodes (sediment sources, sinks, and outlet) and edges (sediment pathway) into the watershed to understand their spatial interactions linked to geomorphic processes. Sediment storage and remobilisation can be formalised by graph theory (Figure 2) to highlight the connection between upslope compartments considered as contributing areas and downslope sinks. This formalisation seems to be well adapted to our study area, in that it helps identify changes in sediment connectivity in relation to the landscape dynamics of swidden agriculture. Therefore, the contribution of a connectivity framework is twofold: (1) the identification of various components of the landscape such as sediment sources, compartments, or geomorphic units [54,55] and their physical linkages; and (2) the identification of sediment transfer modalities.
3.2. Sediment Sources and Sink Detection, from Field Survey to Remote Sensing Data Analysis
3.2.1. Field Survey
The identification of sediment sources, sinks (nodes), and edges involved field surveys to empirically identify the connection modalities between sediment contributing areas through delivery pathways and their changes in time. Following the methods developed for erosion studies [21], we aimed to identify forms and landscape patterns prone to produce sediment sources and facilitate their transfer downstream, and their links (e.g., erosion landforms and gullies, but also anthropogenic networks comprising roads and irrigation ditches (Figure 2)). To consider the temporal evolution of structural connectivity, a field investigation was planned in two phases at the beginning of the rainy season (May and June) in 2017 and 2019. This period is considered the best to observe swidden landscapes since it happens just after slash-and-burn activities and during spraying activities. The rainy season also offers the opportunity to observe an active hydrological connection between sediment sources and sediment sinks during the first precipitations of the rainy season and to validate the efficiency of the connections deduced from the remote sensing analyses. Thus, a first typology of the connections between sediment sources (e.g., upland plots) and the initial hydrographic system likely to export sediments and pollutants can be defined. Field surveys have also allowed us to identify spraying practices and collect precious testimonies on pesticide flow issues. Several interviews with farmers have highlighted the homogeneity of agricultural practices and the use of herbicides at the village level in various areas.
3.2.2. Remote Sensing Data Pre-Processing
To detect sediment sources and sinks in large and/or inaccessible areas, and for very dynamic landscapes (e.g., bare soils in plots recently slashed and burned), remote sensing techniques can be useful (Figure 3). High temporal frequency satellite imagery provides essential information on the crop rotation trajectories and hydro-sedimentary connection over time (several years). In our case, a dataset of various ESA/Copernicus satellites Sentinel-2 images were used to identify and characterise sediment sources and connectivity over a 5 years period. In swidden agriculture, a multi-temporal landscape analysis is essential and finding a transposable methodology to understand sediment connectivity in very dynamic landscapes is a major issue [14,15]. For an accurate mapping of the sediment sources, we had to restrict our collection of satellite images to the beginning of the rainy season. Using optical satellite imagery for land use analysis during this season entails a significant risk of having very cloudy data [14,56,57]. The recent development of numerous open-source remote sensing data techniques gives access to heterogeneous spatial and spectral resolution data. The Sentinel-2 constellation provides data of 10, 20 and 60 m resolution. We focused our study on Sentinel-2 imagery because of its free access, its multispectral resolution with special Vegetation Red Edge bands, and its possibility of improving spatial resolution from 20 m up to 10 m [58]. Spectral information with 10 bands was sufficient to achieve an efficient classification [59]. The images were collected over five years from 2016 to 2020 at the beginning of the rainy season (from April to May), when herbicides are widely used and sediment transfers are initiated. Nevertheless, it is important to note that the choice of this period leads to limitations in the study because cloud extension is likely to mask a few hectares of upland plots; i.e., in 2017, 15% of the study area. For each satellite image, an atmospheric correction was performed using the SEN2COR plugin. Sentinel-2 Level-2A (Bottom of Atmosphere—BOA) reflectance images were derived from Level-1C (Top of Atmosphere—TOA) reflectance images. Then, to improve the spatial resolution of the B5, 6, 7, 8A, 11, and B12 bands, an image fusion was performed by using B2, 3, 4, and 8 bands to increase the resolution of the 20 m and 60 m bands to 10 m. There was no panchromatic image to improve image resolution. Nevertheless, some tools such as Sen2Res can be employed for data fusion [60] to preserve the spectral content of each low-resolution band independently from the geometry and combine both to solve the super-resolution problem. To gain information about the vegetation cover, a usual radiometric analysis can be useful—such as the calculation of the Normalized Difference Vegetation Index (NDVI). In our study context, the use of the NDVI aims to discriminate uplands’ bare soil to vegetated areas, based on the assumption that areas without vegetation cover can be considered as sediment sources in the catchment. Indeed, NDVI highlights absolute differences between burnt areas and areas with fallow vegetation [14,61].
To complete the information from Sentinel-2 images, a Digital Elevation Model (DEM) to differentiate sediment sources, located upstream of the slopes, and sediment sinks, located on floodplains, relying on the slope gradient was used. ALOS PALSAR RTC (Radiometric Terrain Correction) DEM (Digital Elevation Model) was integrated into the dataset for topography analysis and drainage extraction. The 12.5 m ALOS DEM was resampled to 10 m to fit with the Sentinel-2 image resolution. To identify the slope threshold, the DEM was reclassified to differentiate the cells above and below 7 degrees. This threshold could be obtained through empirical field analysis, and provides a limit between lowlands and uplands, as we could not find rice terraces with a slope greater than 7 degrees in the region. Finally, the dataset employed for image classification was composed of 12 raster images integrating several spectral bands, DEM, and vegetation index values.
3.2.3. Image Classification for Land Use Mapping and Sediment Source/Sink Detection
The classification was tested on an area of 500 km2 around the study area (Figure 1) by using multi-temporal Sentinel-2 images (5 years). This sample area contains many lowlands, in consideration of most of the topographic settings available in the uplands of northern Laos, while the study area comprising narrow valleys is almost devoid of them. Therefore, we evaluated the transposable robustness of our method in areas where lowland extension largely exceeds the Houaylack-Vangven context.
A pixel-oriented approach was used in this study to keep the spectral information of images. The selected methodological protocol integrated a supervised classification procedure by decision trees. After testing several algorithms, we chose a supervised classification mode with a Random Forest (RF) algorithm, which is a powerful supervised learning technique [62] based on a set of training samples for image classification and regression analysis [59]. To classify the images and identify the sediment sources (bare soil, plots) and sinks (lowlands), various libraries in R software were used: ‘SP’, ‘Raster’, and ‘Caret’. To supervise the classification, 240 training samples (polygons) representing the diversity of the land use features (with an average of 8400 pixels for the class Uplands plots, 8500 pixels for the class Lowlands fields, 850 pixels for Open Water, 39,000 pixels for Forest and 9900 pixels for Fallows) were collected based on fieldwork and visual interpretation of Sentinel-2 images. Five types of land use or hydrographic components were considered to help the spectral discrimination of sources and sinks: upland plots (bare soils), fallow plots (mainly 1 to 3 years fallow), forest areas, lowland areas, mainly characterised by terraced rice fields, and open water. Villages and dirt roads were excluded from the classification as their reflectance appeared to be too close to upland plots (dirt roads/bare soil), tin roofing or plastics for soil cover under sugar cane, pumpkins, long-bean, or tobacco, which are common to the studied area. The evaluation of the classification was based on a confusion matrix that compares the pixel value obtained by the Random Forest classification with reference points whose characteristics are known. A total of 240 points/image samples were used for the validation.
3.2.4. Image Interpretation for Sediment Sink/Source Detection in Limited Areas
Due to the limited resolution of Sentinel-2 images (10 m) and the variability in the size and type of sediment sinks, several lowland areas and small roads (whose size is smaller than the resolution of the Sentinel-2 image) were delineated using the combination of free datasets in addition to Sentinel-2 images (e.g., Esri world imagery, Google Earth imagery, Bing imagery). Multi-temporal land use mapping is essential to identify and locate through time the sediment sources from where pollution arises (burnt upland plots,) and sinks where pollution accumulates. In our study case, most sediment sinks were supposed to be located in the lowlands, where sediment silting processes can occur in the alluvial floodplain and in paddy rice fields through irrigation processes. Lowlands are supposed to be sinks for pesticides, too. Nevertheless, ponds, because of their small extension, are difficult to identify by image classification, and swamps are not specifically covered by the method as they are, most of the time, related to the proximity of rivers, but they have been delineated from the field survey. In the end, each sink of the study area was adjusted through digitisation.
3.3. Sediment Sources and Sink Connectivity Modelling
Once sediment sources and sinks had been located by image analysis (§ 3.2), we were able to identify their connection to understand and model the sediment cascade of our study area by using the structural connectivity concept (Figure 4). To assess structural connectivity and understand the spatial organisation of sediment delivery in a catchment, rivers and their upstream extensions are essential elements [63,64]. In graph theory [52], the spatial organisation of the sediment cascade highly depends on the spatial organisation of the nodes (sediment sources or sinks) bound together by various sediment pathways, corresponding to the edge of the network. Sediment pathways interfere with sediment connectivity at the catchment scale. Hydrological networks are considered to be the most efficient sediment pathways, but several studies have also highlighted the importance of roads and irrigation ditches in the modification of hydrological pathways’ efficiency [65,66,67].
For our study, the drainage network, as the most efficient sediment pathway, was extracted from ALOS DEM using ArcHydro tools (Figure 5). Obviously, the results depend on the DEM quality and the valley landform [68]. As the research aims to exploit free data, ALOS DEM was considered as a good alternative dataset for network extraction in the catchment. Following field observations, it has been considered as an efficient tool to identify headwater incisions. However, for more consistency, the lowland meander, escaping from the network extraction, has been manually digitised from satellite imagery (Maxar, Esri world imagery). Irrigation networks were also considered as efficient pathways, but they could not be identified by image analysis because of their size. These elements are not visible on any image supports. Consequently, they are excluded from the analysis despite the role they play in the dissemination of pollutants [69,70]. However, field observations confirm that irrigation ditches follow the valley bottom in the studied area and reinforce the contribution of valley bottom flows rather than creating new patterns of drainage networks.
Considering sediment sources/sinks locations and pathways, structural connectivity can be mapped by using the geoprocessing chain in ArcGIS (Figure 4). By the successive use of intersect tools and watershed tools, nodes and edges can be spatially linked. Intersect tools are used here to connect different kinds of edges to nodes (i.e., headwater incision, gullies, streams, and rivers to sinks). Upland plots are considered to be the main sediment sources of the catchment. Field surveys demonstrated that the entire surface of the plots cannot be considered as being connected to the drainage network (Figure 5).
To identify the pixels connected to the network and to define the potential contributory areas, GIS watershed tools have been used to delineate the compartments that are structurally connected to downstream intersected edges within upland plots. These successive steps of GIS analysis and mapping must consider the accuracy and resolution of the dataset used. With 10 m resolution images and DEM, our delineation had to include a buffer margin around sources, sinks, and pathways. The threshold was defined to 15 m based on the empiric knowledge acquired through field observation, which helps to estimate the disconnection distance between a potential sediment source and the pathway as illustrated by Figure 6. This buffer zone goes beyond the unresolved issues regarding the ability of water and runoffs to overcome obstacles, such as a riparian zone [23], and the presence of rills and gullies in the plots, which easily overcome the presence of vegetation border protections around upland plots [22].
4. Results
4.1. Landscape and Structural Connectivity Analysis
The field observation highlighted the role of the slope direction of upland plots in the repartition of the run-off. The drained area was fully hydrologically functional when structurally connected to the downstream edges or sinks, as illustrated in Figure 7. Because of the strong incision of headwater flows and streams in slash and burn plots (Figure 7, picture 4), these plots appear to be the most important source in terms of structural connectivity in the study area. Field work also brought a better appreciation of the sink’s areas. As mentioned above, paddy rice fields appear to be the most common sinks in terms of sediment and pesticides/herbicides storage (Figure 7, picture 6). However, several other areas can be considered potential sinks, such as river floodplains and wetlands, sometimes corresponding to an abandoned channel, but also fishponds, even though they are less common (Figure 7, picture 2). All these areas are at the very heart of the villages. They are visited daily for Non-Timber-Forest-Product (NTFP) collection, fishing, recreational activities, and daily cleansing (bathing), and constitute a major source of pollutant spreading and accumulation.
The second step of the fieldwork focused on delivery pathways (edges) between sources and sinks (nodes). As expected, gullies and streams appear to be the main delivery pathways for sediment sinks and highly connect the source to the system outputs. Direct connections between sources and sinks are common each time the sources come close to lowlands areas (Figure 7, picture 1). Then, secondary edges have been identified which bring complex kinds of connections with link nodes. These delivery pathways involve roads and irrigation channels (Figure 7, pictures 3 and 5).
An oriented graph used to schematise these interactions (Figure 8) helps to distinguish sediment sinks and sediment outflow in the study area. Black edges refer to structural connections between sources and sinks. The red edge refers to a functional floodplain interaction between the river network and temporary sinks. Table 1 summarises the different types of connections deduced from the fieldwork (Figure 7) and their graphic formalisation (Figure 8). The connection classes are then used for connection mapping.
4.2. Multi-Temporal Mapping of Sediment Sources and Sinks: A Sharp Increase in Swidden Cultivation
The identification and mapping of sediment sources has been realised over 5 years between 2016 and 2020 based on a Sentinel-2 image classification (Figure 9). Upland plots reached an accuracy of about 90% in every year surveyed, and often more (Table 2 and Table 3). Other classes identified by the Random Forest algorithm help to discriminate upland plots (class 1) and present lower accuracy rates (Table 3). Unfortunately, the Sentinel-2 resolution is too low to accurately detect rice paddy fields in a narrow-incised valley, i.e., with a 71.9% accuracy in the Houaylack-Vangven (with a global Fscore value 0.78) area, while it reached 88.4% for the full scene scale.
As a result, the area under swidden cultivation strongly increased from 130 in 2016 to 320 hectares in 2020 (Table 4 and Table 5). It corresponds, respectively, to 2.6 to 6.2% of the total area of the village. It seems to be small enough to carry on traditional shifting agriculture without losing too much fertility. The restricted forested areas where slash-and-burn cultivation is forbidden were not considered in this estimation [5]. However, these protected areas are often not clearly identified on site, and their boundaries are often subject to debate. Therefore, we calculated the rotation frequency, which is more relevant to estimate the pressure on the cultivable areas (Table 5).
A total of 19% of the upland plots were cultivated under rotation over a period of 5 years (Table 5). The analyses confirmed the maize crop boom from 2016 to 2019 (Table 4), with a slightly shorter rotation period (Figure 10). It remains difficult to establish a statistical baseline for each crop, as upland rice and maize can be planted within a single plot. We observed a slow development of perennial plots which reach 17 ha in the studied area in 2019, but the development of sugar cane in 2020 changed the situation. Indeed, in 2019, sugar cane was often cultivated on lands that had previously been cleared for upland rice culture on the rounded ridge of the catchment. This explains why 65 hectares were cultivated both in 2019 and 2020, i.e., 20% of the total area cultivated (Figure 10). This transition, linked to the development of sugar cane, initiates a larger perennial use of uplands.
4.3. Very High and Increasing Structural Connectivity
The structural connectivity rates are presented in Figure 11 for maize expansion (2016 to 2019), and in Figure 12 for sugar cane in 2020. For reasons of clarity, the rates are converted based on 100 m grid cells. Table 5 presents the raw results for each connection class and for every year surveyed.
The structural connectivity (Figure 11) of upland plots was high, from 65.7% to 80.7%, and globally increased from 2016 onwards, with a peak in 2019, but it had an annual variability of around 20% of the total connected surface. The third connection class (Table 1), linking sources to outlets through rivers and gullies, appears to play a key role and reached almost 94% of the whole connected sources areas every year, with the exception of the year 2020 (Table 5). This dominance can be explained by the low extension of lowland sensitive areas and the low development of the road network, at least until 2019. Therefore, the potential diffuse pollution is mainly concentrated at the outlet of the system. The mean size of the plots seems to impact the connectivity rates. On the one hand, in 2016 and 2018 the mean size of the plots was about one hectare and the structural connectivity was dispatched in small plots, thus reducing the connectivity rate. On the other hand, in 2017 and 2019 the mean size of the plots increased largely, and the structural connectivity followed the same trend. In both cases, large plots, i.e., of more than 20 hectares, were present and often completely connected to downstream sediment sinks. In these cases, functional connectivity was probably higher as most of these plots reached structural connectivity rates of up to 90% (Figure 11).
Structural connectivity did not increase in 2020 compared to 2019, while the upland area under cultivation increased by 11 hectares. The transition to sugar cane appeared to slightly diminish the connection rate. This might be due to the localisation of sugar cane plots on rounded ridges, while maize plots are located on lower slopes and rarely reach ridges. According to the villagers, this might be explained by the higher yields obtained downhill for this water- and deep-soils-demanding crop. As a result, maize plots appear to be more connected downstream. For sugar cane, it is mainly the proximity to the roads and the development of interfluve gentler slopes that determines the presence of cultures and explains the weaker connectivity rate. Regardless of this, structural connectivity rates concerning roads increased much faster than the length deployed, i.e., more than 100% in each of the three classes concerned (Table 6, classes 4, 5, and 6), for less than 50% of the road length increase. Consequently, it also appears that the development of the roads does not compensate for the total decrease in structural connectivity. In 2020, only 9.7% of the structural connectivity concerning roads was not linked to any other kind of connection (Table 6, classes 1, 2, and 3), which demonstrates the key role played by rivers and headwater incisions in structural connectivity rates.
4.4. Sinks and the Identification of Potential Areas at Risk of Pollution: Extension of Source Areas
Finally, sinks’ exposure to potential sediments and pollutants transfers can be identified, on the one hand, by graph theory (Figure 13). Sinks are ordered according to the number of sources they drain, whatever the type of connection considered, so on the other hand they can be analysed through sink connections by class (Table 5) considering the different types of connections (Table 1). We have provided a graph with four different kinds of nodes, sources (one per source), links (for graphic purposes), outlets (points where no more sediment trapping can occur within the study area), and sinks, classified by a number of upstream sources (Figure 13). Nodes are linked by edges without specific attributes. Sinks are linked to downstream sinks and in what can be called a “sink chain”. This graphic representation reminds us of the presence of connections between these sinks, although the transfer modalities are very different from those applied to the sources and sinks (Figure 8).
Our graphical analysis illustrates that 50% of the sinks are not directly connected to an upland plot, especially when no upland activities are conducted in the sub-catchments concerned. However, most sinks, i.e., between 94% (2017) and 85% (2016 and 2020), are connected to upstream rivers and gully networks for irrigation purposes and to upstream sources, if any. It is important to take this into account concerning the accumulation of pollutants, as irrigation occurs all along valleys where paddy rice fields are present [34,48]. The graph also highlights the sinks connected to a huge number of sources (>9 sources). These sinks are often at the outlet of a small head catchment, subject to shifting cultivation. Most of them are concerned year after year by an important number of connected sources, increasing their potential vulnerability to pollutants and sediment accumulation.
The connectivity rates appeared to be very high in 2017 and 2019. Connectivity through rivers and hydrographic networks seems to be the most significant kind (Table 7, class 2), although the direct connection (intersection) between sources and sinks plays a large role (Table 7, Table 8). There were about 50–70.8% (Table 7, class 1) potential connections, depending on the year. Figure 12 and Figure 13 highlight upstream sinks’ exposure connected to important sources both in terms of surfaces and number. It is important to note that most sources are located close to sinks, i.e., only 5% of the sinks are located more than 25 m away from a sediment source. These sinks are mostly involved in river and hydrographic network connectivity (Table 8). This results in a high structural degree of vulnerability to pollutants in the sink areas dedicated to the most sensitive activities of subsistence. We can notice different kinds of connectivity, resulting in different types of exposure: a first one with large source surfaces connected through hydrographic networks, and a second one with direct exposure (intersection) between sources and sinks. The trend is homogeneous over the five years studied, and the exposure of sinks to potential transfers of sediments and pollutants relies more on the extension of source areas from 85.4 hectares in 2016 to 249.3 hectares in 2019 (Table 5) on the maize phase than on an increase in connectivity rates of, respectively, 65.5% in 2016 and 80.7% in 2017.
5. Discussion
Whereas most research on soil erosion and sediment transfer in upland swidden landscapes of SE Asia has focused on rill, interill erosion, and gullying, few studies have tried to analyse the role of connectivity in sediment transfer. Conducted in a small, monitored catchment and based on intensive field surveys, they have mainly focused on the way plots are affected by linear flows and are connected to the hydrographic network by different configurations; as demonstrated, for example, by [21] in the Dze Donglo catchment in northern Thailand. This kind of investigation is not feasible for watersheds that are 15 to 30 times larger. Therefore, we implemented a new method to analyse sediment transfer at the village scale. The multi-temporal analysis of the connectivity in swidden landscapes is a first step to understanding the physical transfers of sediments and of their related pollutants [46]. We focused on the spatial patterns of connectivity with various types of networks (drainage, dirt roads) to estimate the role of (i) upland plots extension and their spatial mobility within the catchment, (ii) the potential pesticide transfers and the trappings which are linked to the landscape structure and the overall shifting cultivation transition. In countries where few monitoring data are available, the use of open-access earth observation data and machine learning tools opens new perspectives for landscape/environmental studies. Nevertheless, this approach still has some limitations.
5.1. How to Improve the Robustness of Connectivity Analysis in Swidden Areas
The results presented, of a large-scale and diachronic analysis of crop rotation, have limitations. Earth Observation data with Sentinel-2 imagery provide high temporal resolution data for the yearly analysis of landscape changes and rotation plots with greater accuracy than in the studies conducted so far [14,15,56,61]. The combination of open access remote sensing data and machine learning algorithms simplifies land use analysis and mapping with an acceptable margin of error (e.g., 7% to 9% on upland plots’ identification). These tools and techniques can help to obtain knowledge on shifting cultivation in uplands where data are difficult to gather. The combination of field observation, geomatics, and remote sensing analysis makes it possible to establish a spatial definition of the areas contributing to pollutant transfers. The results provide good information about the yearly rotation plots and the growing increase of cultivated areas in the uplands of Lao PDR, induced by recent changes in agricultural practices, and consequently the effective catchment area. Remote sensing tools seem to be the most efficient alternative for highlighting the impact of the recent agricultural practices and the associated network construction (roads, hydrological) on the evolution of structural connectivity. Nevertheless, while the identification of sediment sources by remote sensing techniques gives good results, the identification of sediment sinks is limited for small or elongated objects (i.e., ponds or paddy rice fields). The use of Sentinel-2 images only allows the detection of the largest paddy rice plots located in alluvial floodplains (88.4% of accuracy, Table 4), and the smallest plots located in the narrowest floodplains were not detected. Another limitation concerns forested areas and fallow vegetation, particularly along streams and gullies which do not act as simple barriers, and their effect should be investigated further through additional field analyses during flow periods. Indeed, connectivity sometimes remains effective, as has been demonstrated in a catchment of central Laos [23], while it may also have contributed to substantial sediment trapping locally [21]. Uplands can alternately be a source and a sink of sediments and pollutants, and the crossing versus non-crossing often remains a dilemma [21]. Another limitation emerges from DEM accuracy, which should be lower than the definition of buffer zones defined for rivers and gullies (15 m). The use of a high-resolution DEM (<10 m) would bring substantial improvement in the understanding of connectivity and would enable an analysis of functional connectivity. These data would be useful to assess structural connectivity in catchments by considering inter-rill erosion, gully erosion, or even superficial landslides, common in upland plots but also in lowlands’ silting processes, and often ignored by connectivity studies despite the major role they play. Finally, a high-resolution DEM would provide information on dirt roads, allowing us to integrate them into our model as a susceptible surface for erosion and not only as sediment/pollutant pathways [67].
Finally, in Houaylack-Vangven, most sinks that have been identified correspond to lowland areas and are covered by paddy rice fields and ponds. However, these types of sinks correspond to a restrictive overview of sink diversity in the studied area, even if they are the most significant in the case of sensitivity to pollutants. The binary source to sink approach using graph theory is a first step toward the understanding of sink exposure to sediments and pollutant flows in these landscapes. However, the use of an algebra, as proposed by [53], would allow a better structural understanding of our sediment transfers, but we certainly lack information about buffer and barrier effects, as described by [71], or sinks’ discharge over years. On the other hand, sinks are most frequented by the inhabitants in the framework of their agricultural activities and NTFP collection. The role of fallow lands was not considered here, even though they have a significant impact on subsistence activities, since they are also used for NTFP collection. In northern Thailand, [21] measured 57% of the sediment flux trapped within the catchment head, suggesting a role of trapping efficiency of the mosaic of plots, forest, and fallow. We propose here a first step to understand sediment and pollutant transfers within swidden landscapes at the catchment scale, but the role of fallows needs to be more precisely analysed and the method would need to be used at a larger scale and in a different geographical context (e.g., large lowland areas) to test the robustness of connectivity classification resulting from landscape analysis.
5.2. Shifting Cultivation in Uplands and Structural Connectivity
The static picture offered by structural connectivity analysis has been mainly used to characterise the influence of the landscape structure in sediment transfers [41,42,44,46,47]. To consider the agricultural transition, i.e., the increase of cultivated areas, commercial crops cultivation, and rotation time reduction in uplands, we developed a diachronic analysis of the evolution of the land use structure. The area under swidden cultivation strongly increased (doubled) within 5 years. This confirms the general trends observed in northern Laos, and more generally in the uplands of SE Asia [1,29]. Locally, this increase is directly linked to the cash crop boom. This situation has been largely observed even if the cash crops vary greatly from one village to another. Indeed, while upland commercial agriculture mostly relies on maize and sugar cane in this area, lowlands concentrate other kinds of cash crops such as tobacco, pumpkins, and long bean, often using a large range of pesticides. As the structural connectivity analysis demonstrates, the increase of the size of the plots remains the main factor of connectivity development and of the potential transfer of sediments and pollutants downstream. Despite a patchwork of land use with less than 7% of cultivated plots, the landscape mosaic appears insufficient to limit potential connections in a 52 km² catchment since more than 65% of the cultivated areas are connected to the hydrographic network. This confirms former observations made on smaller catchments, which highlights the role of the very high connectivity in uplands resulting from the development of linear erosion and gullies [17].
These results need to be balanced depending on the type of culture. For instance, maize plots appear to be more connected than rainfed upland rice and sugar cane plots, which are more often located on a ridge. Therefore, the general trend of increasing connectivity is probably responsible for the acceleration of the sediment and pollutant transfers to lowland sinks and outlets. The current increase in erosion and connectivity is not due to shifting cultivation as a system, but to the development of commercial agriculture, the rise of pluriannual cropping, and the complexity of delivery pathways (development of recent dirt roads and irrigation systems). It suggests an increase in sediment discharge and pollutant transfer, upstream of larger river systems, which could involve serious consequences for the quality of hydrosystems in Northern Lao PDR, as evidenced in the Houay Xon catchment [23,35,72], and the quality of water and sediments retained in the numerous dam reservoirs that characterise the Mekong watershed [57].
The results obtained demonstrate that sediment sources and sinks are mainly connected by hydrographic networks. Studies carried out in similar tropical landscapes also show the importance of rills and gullies to initiate the transfer of sediments [17,22]. For example, in the Houay Pano catchment (Luang Prabang province, Lao PDR), gullies can account for up to 85% of the sediment delivery downstream [64]. The role of paths and dirt roads is also an emergent issue in the Uplands of Southeast Asia. In the village of Houaylack-Vangven, the structural connectivity involving roads strongly increased in 2020 (Table 5). Water sometimes crosses the road, but most of the time the flow load is collected with fine sedimentary material. While the role played by roads in structural connectivity remains low in Houaylack-Vangven, previous studies have demonstrated the significant role of footpaths in the acceleration of erosion and sediment transfer [17,67,73]. Moreover, the expansion of the road network is parallel to the development of commercial crops in SE Asia [7,30,74], with a view to improving trade networks between and inside villages. This undoubtedly increases the connection of plots and/or the pathways of transfer downstream [74], but also road erosion in mountainous areas of SE Asia [67]. As such, it complicates the analysis of connectivity when only based on land use and slope organisation, and thus highlights the need to develop spatial analysis to decipher their role in sediment and pollutant transfer.
5.3. Tools for Local Populations: Mapping Exposure to Pollution Risks
With the development of commercial agriculture and the use of herbicides, pesticides, fertilisers, and the growth of annual cropping surfaces, the risk of diffuse pollution is increasing in Northern Laos. So far, the risk of spraying has been addressed to the local population to alert them [12,13,75]. A policy for the moderation of uses has also been implemented Nevertheless, there exists no prevention policy for vulnerable areas and the exposure or risks for local populations remains uncertain [13]. Main pollution accidents are reported in some villages due to the daily exposure to herbicides/pesticides in a very large scope of activities [12], while riparian zones along streams and rivers are not equipped to protect water quality. Therefore, the study of potential connectivity, if it does not measure risk exposure, makes it possible to identify potential sources, pathways, and areas sensitive to pollutant flux and accumulation. A structural connectivity analysis based on empirical knowledge is a well-suited tool to implement prevention policies with the identification of areas at risk. Furthermore, on-field interviews with farmers showed that the connectivity concept is only partly understood by villagers, who are on the front line when pollution occurs in their rivers or when herbicides kill their just-planted paddies. This empirical knowledge and embodied experience could be used for landscape analysis purposes and to avoid the creation of connections during the slashing period. It adds arguments to develop sustainable and resilient management of the swidden landscapes. The measures that seem most obvious are the protection of sinks [23] and the interruption of transfers on slopes. Thus, the fight against diffuse pollution from agricultural origins concurs closely with the practices of the fight against erosion [17] via the implantation of buffer zones along the headwater gullies and dirt roads which allows most of the sediment transfer.
6. Conclusions and Perspectives
This research opens new perspectives for understanding pollution and erosion hazards in tropical mountain landscapes characterised by shifting cultivation. The framework offered by structural connectivity can help establish a spatial and temporal mapping of the sediment and pollutant flows in dynamic swidden landscapes. The identification of the sources provides the conditions to reduce structural connectivity rates and avoid massive plots and isolate upland plots from hillslope hollows during the slashing phase.
New methodological developments should be implemented. Indeed, the graph theory used to spatialise structural connectivity is a promising framework which is probably well adapted to the spatial and temporal shift of swidden landscapes. It proposes, through an algebraic description, a formalisation of the geomorphic expertise, either systematically for each cell of an area [53], or specifically for each geomorphic process [51]. The use of the algebraic description of an oriented graph can also solve sink mapping issues, with the identification of congested nodes where silting processes can occur, and therefore allows going beyond the graphic analysis of this work. Sediment transfers and associated pollutants are not quantified in our study. Some difficulties remain to establish a model of sediment transfers, considering the functional aspects of siltation processes and floodplain interaction. Although our results underline a strong potential connectivity between sources and sinks, the functional translation of these tendencies is certainly lower. Indeed, a small sink positioned at the exit of the system cannot concentrate all the production of sediments and pollutants produced within the 52 km2 upstream, and a new issue would be to test the efficiency of the connectivity networks via selected measurements [47]. Therefore, the role of sinks should be more precisely defined in future research.
Author Contributions
Conceptualisation, L.L., C.L. and L.S.; methodology, C.L., L.L. and L.S.; software, C.L. and L.S.; validation, C.L. and L.S.; formal analysis, C.L. and L.S.; field investigation, L.L. and L.S.; resources, L.L.; data curation, L.L.; writing—original draft preparation, L.S.; writing—review and editing, L.L. and C.L.; supervision, L.L. and C.L.; project administration, L.L.; funding acquisition, L.L. All authors have read and agreed to the published version of the manuscript.
Funding
This research was funded by Committee for Cooperation with Laos (CCL) in the framework of its participation to the agricultural development aid project for the mountainous La and Namor Districts (Oudomxay Province) of the Provincial Agriculture and Forest Office (PAFO), the ABBAA “Trajectoire et controverses des paysages d’ABattis-Brûlis en Asie et Afrique” research program (PEPS “Paysage” of the CNRS-INEE; dir. L. Lespez) CNRS, PEPS INEE and the Institut Universitaire de France Project of L. Lespez (Changing trajectories of fluvial systems from the Neolithic to the Anthropocene: climate change, regulation and restoration).
Institutional Review Board Statement
Not applicable.
Informed Consent Statement
Informed consent was obtained from all subjects involved in the study.
Data Availability Statement
Data have been collected for the CCL and the PAFO and can be obtained from these organizations.
Acknowledgments
This work was made possible thanks to our collaboration with CCL (https://ccl-laos.org/about-ccl/ accessed on 29 March 2023), a Franco-Lao non-governmental organisation that has been working in Oudomxay Province since 2012 at the invitation of the Provincial Department of Agriculture and Forestry (PAFO). In May 2018, the project to support agricultural development in the mountainous areas of La and Namor districts, Oudomxay Province, second phase (PDPO2) began. As part of this collaboration, fieldwork permits were obtained. A comprehensive report of our work was submitted at the end of our mission to the CCL and the PAFO. We would like to thank the various project teams (CCL and DAFO, District Agriculture and Forest Office) and institutional (PAFO) and technical (SAEDA, Sustainable Agriculture and Environment Development Association) partners who allowed and facilitated the accomplishment of this study. In particular, the authors would like to thank Vincent Couderc for their support in this work.
Conflicts of Interest
The authors declare no conflict of interest. The funders had no role in the design of the study; in the collection, analyses, or interpretation of data; in the writing of the manuscript; or in the decision to publish the results.
References
- Ziegler, A.D.; Bruun, T.B.; Guardiola-Claramonte, M.; Giambelluca, T.W.; Lawrence, D.; Thanh Lam, N. Environmental consequences of the demise in swidden cultivation in montane mainland Southeast Asia: Hydrology and geomorphology. Hum. Ecol. 2009, 37, 361–373. [Google Scholar] [CrossRef]
- Castella, J.-C. Agrarian transition and farming system dynamics in the uplands of south-east Asia. In Third International Conference on Conservation Agriculture in Southeast Asia; CIRAD: Montpellier, France, 2012; pp. 4–20. [Google Scholar]
- Ornetsmüller, C.; Castella, J.-C.; Verburg, P.H. A multiscale gaming approach to understand farmer’s decision making in the boom of maize cultivation in Laos. Ecol. Soc. 2018, 23, 35. [Google Scholar] [CrossRef] [Green Version]
- Ornetsmüller, C.; Castella, J.-C.; Thanichanon, P.; Lestrelin, G.; Verburg, P.H. Modelling the location and spatial pattern of a crop boom. A case study from Laos. Environmental. Sci. Policy 2019, 99, 58–71. [Google Scholar] [CrossRef]
- Ducourtieux, O.; Laffort, J.-R.; Sacklokham, S. Land Policy and Farming Practices in Laos. Dev. Chang. 2005, 36, 499–526. [Google Scholar] [CrossRef]
- Kenney-Lazar, M.; Dwyer, M.; Hett, C. Turning Land into Capital: Assessing A Decade of Policy in Practice; A Report Commissioned by the Land Information Working Group (LIWG); Land Information Working Group (LIWG): Vientiane, Laos, 2018; p. 42. [Google Scholar]
- Kallio, M.H.; Hogarth, N.J.; Moeliono, M.; Brockhaus, M.; Cole, R.; Waty Bong, I.; Wong, G.Y. The colour of maize: Visions of green growth and farmers perceptions in northern Laos. Land Use Policy 2019, 80, 185–194. [Google Scholar] [CrossRef]
- Suhardiman, D.; Keovilignavong, O.; Kenney-Lazar, M. The territorial politics of land use planning in Laos. Land Use Policy 2019, 83, 346–356. [Google Scholar] [CrossRef]
- Dufumier, M.; Weigel, J.Y. Minorités ethniques et agriculture d’abattis-brûlis au Laos. Cah. Sci. Hum. 1996, 32, 195–208. [Google Scholar]
- Ducourtieux, O. Is the Diversity of Shifting Cultivation Held in High Enough Esteem in Lao PDR? Moussons. Rech. Sci. Hum. Sur l’Asie Du Sud-Est 2006, 9–10, 61–86. [Google Scholar] [CrossRef]
- Huon, S.; de Rouw, A.; Bonté, P.; Robain, H.; Valentin, C.; Lefèvre, I.; Girardin, C.; Le Troquer, Y.; Podwojewski, P.; Sengtaheuanghoung, O. Long-term soil carbon loss and accumulation in a catchment following the conversion of forest to arable land in northern Laos. Agric. Ecosyst. Environ. 2013, 169, 43–57. [Google Scholar] [CrossRef]
- Rassapong, S.; Syfongxay, C.; Phanthanivong, L.; Bounlue, S.; Phimmahthut, S.; Manyvong, T.; Keothongkham, B.; Hongsibsong, S.; Shattuck, A.; Bartlett, A. Pesticide Use in Lao PDR: Health and Environmental Impacts; Lao Upland Rural Advisory Service (LURAS): Vientiane, Laos, 2018. [Google Scholar]
- Shattuck, A. Risky subjects: Embodiment and partial knowledges in the safe use of pesticide. Geoforum 2019, 123, 153–161. [Google Scholar] [CrossRef]
- Yamamoto, Y.; Oberthür, T.; Lefroy, R. Spatial identification by satellite imagery of the crop–fallow rotation cycle in northern Laos. Environ. Dev. Sustain. 2009, 11, 639–654. [Google Scholar] [CrossRef]
- Hett, C.; Castella, J.-C.; Heinimann, A.; Messerli, P.; Pfund, J.-L. A landscape mosaics approach for characterizing swidden systems from a REDD+ perspective. Appl. Geogr. 2012, 32, 608–618. [Google Scholar] [CrossRef]
- Castella, J.-C.; Lestrelin, G.; Hett, C.; Bourgoin, J.; Fitriana, Y.R.; Heinimann, A.; Pfund, J.-L. Effects of Landscape Segregation on Livelihood Vulnerability: Moving from Extensive Shifting Cultivation to Rotational Agriculture and Natural Forests in Northern Laos. Hum. Ecol. 2013, 41, 63–76. [Google Scholar] [CrossRef]
- Valentin, C.; Agus, F.; Alamban, R.; Boosaner, A.; Bricquet, J.P.; Chaplot, V.; de Guzman, T.; de Rouw, A.; Janeau, J.L.; Orange, D.; et al. Runoff and sediment losses from 27 upland catchments in Southeast Asia: Impact of rapid land use changes and conservation practices. Agric. Ecosyst. Environ. 2008, 128, 225–238. [Google Scholar] [CrossRef]
- Chaplot, V.; Khampaseuth, X.; Valentin, C.; Bissonnais, Y.L. Interrill erosion in the sloping lands of northern Laos subjected to shifting cultivation. Earth Surf. Process. Landf. 2007, 32, 415–428. [Google Scholar] [CrossRef]
- Patin, J.; Mouche, E.; Ribolzi, O.; Sengtahevanghoung, O.; Latsachak, K.O.; Soulileuth, B.; Chaplot, V.; Valentin, C. Effect of land use on interrill erosion in a montane catchment of Northern Laos: An analysis based on a pluri-annual runoff and soil loss database. J. Hydrol. 2018, 563, 480–494. [Google Scholar] [CrossRef]
- Lacombe, G.; Valentin, C.; Sounyafong, P.; de Rouw, A.; Soulileuth, B.; Silvera, N.; Pierret, A.; Sengtaheuanghoung, O.; Ribolzi, O. Linking crop structure, throughfall, soil surface conditions, runoff and soil detachment: 10 land uses analyzed in Northern Laos. Sci. Total Environ. 2018, 616, 1330–1338. [Google Scholar] [CrossRef]
- Turkelboom, F.; Poesen, J.; Trébuil, G. The multiple land degradation effects caused by land-use intensification in tropical steeplands: A catchment study from northern Thailand. Catena 2008, 75, 102–116. [Google Scholar] [CrossRef]
- Chaplot, V.; Coadou le Brozec, E.; Silvera, N.; Valentin, C. Spatial and temporal assessment of linear erosion in catchments under sloping lands of northern Laos. Catena 2005, 63, 167–184. [Google Scholar] [CrossRef]
- Vigiak, O.; Ribolzi, O.; Pierret, A.; Sengtaheuanghoung, O.; Valentin, C. Trapping Efficiencies of Cultivated and Natural Riparian Vegetation of Northern Laos. J. Environ. Qual. 2008, 37, 889–897. [Google Scholar] [CrossRef]
- Ribolzi, O.; Patin, J.; Bresson, L.M.; Latsachack, K.O.; Mouche, E.; Sengtaheuanghoung, O.; Silvera, N.; Thiébaux, J.P.; Valentin, C. Impact of slope gradient on soil surface features and infiltration on steep slopes in northern Laos. Geomorphology 2011, 127, 53–63. [Google Scholar] [CrossRef]
- Dupin, B.; de Rouw, A.; Phantahvong, K.B.; Valentin, C. Assessment of tillage erosion rates on steep slopes in northern Laos. Soil Tillage Res. 2009, 103, 119–126. [Google Scholar] [CrossRef]
- Lestrelin, G.; Castella, J.-C.; Li, Q.; Vongvisouk, T.; Tien, N.D.; Mertz, O. A Nested Land Uses–Landscapes–Livelihoods Approach to Assess the Real Costs of Land-Use Transitions: Insights from Southeast Asia. Land 2019, 8, 11. [Google Scholar] [CrossRef] [Green Version]
- Castella, J.-C.; Jobard, E.; Lestrelin, G.; Nanthavong, K.; Lienhard, P. Maize expansion in Xieng Khouang province, Laos: What prospects for conservation agriculture? In Proceedings of the 3rd International Conference on Conservation Agriculture in Southeast Asia, Hanoi, Vietnam, 10–15 December 2012; pp. 300–305. [Google Scholar]
- Cramb, R.A.; Colfer, C.J.P.; Dressler, W.; Laungaramsri, P.; Le, Q.T.; Mulyoutami, E.; Wadley, R.L. Swidden transformations and rural livelihoods in Southeast Asia. Hum. Ecol. 2009, 37, 323–346. [Google Scholar] [CrossRef] [Green Version]
- Dressler, W.H.; Wilson, D.; Clendenning, J.; Cramb, R.; Keenan, R.; Mahanty, S.; Lasco, R.D. The impact of swidden decline on livelihoods and ecosystem services in Southeast Asia: A review of the evidence from 1990 to 2015. Ambio 2017, 46, 291–310. [Google Scholar] [CrossRef] [Green Version]
- Vongvisouk, T.; Mertz, O.; Thongmanivong, S.; Heinimann, A.; Phanvilay, K. Shifting cultivation stability and change: Contrasting pathways of land use and livelihood change in Laos. Appl. Geogr. 2014, 46, 1–10. [Google Scholar] [CrossRef]
- Bruun, T.B.; de Neergaard, A.; Burup, M.L.; Hepp, C.M.; Larsen, M.N.; Abel, C.; Aumtong, S.; Magid, J.; Mertz, O. Intensification of Upland Agriculture in Thailand: Development or Degradation? Land Degrad. Dev. 2017, 28, 83–94. [Google Scholar] [CrossRef] [Green Version]
- Rickson, R.J. Can control of soil erosion mitigate water pollution by sediments? Sci. Total Environ. 2014, 468–469, 1187–1197. [Google Scholar] [CrossRef]
- Wilkinson, M.E.; Quinn, P.F.; Barber, N.J.; Jonczyk, J. A framework for managing runoff and pollution in the rural landscape using a Catchment Systems Engineering approach. Sci. Total Environ. 2014, 468, 1245–1254. [Google Scholar] [CrossRef]
- Ribolzi, O.; Rochelle-Newall, E.; Dittrich, S.; Auda, Y.; Newton, P.N.; Rattanavong, S.; Knappik, M.; Soulileuth, B.; Sengtaheuanghoung, O.; Dance, D.A.B.; et al. Land use and soil type determine the presence of the pathogen Burkholderia pseudomallei in tropical rivers. Environ. Sci. Pollut. Res. 2016, 23, 7828–7839. [Google Scholar] [CrossRef] [Green Version]
- Rochelle-Newall, E.; Ribolzi, O.; Viguier, M.; Thammahacksa, C.; Silvera, N.; Latsachack, K.; Pham Dinh, R.; Naporn, P.; Tran, H.; Soulileuth, B.; et al. Effect of land use and hydrological processes on Escherichia coli concentrations in streams of tropical, humid headwater catchments. Sci. Rep. 2016, 6, 32974. [Google Scholar] [CrossRef] [PubMed] [Green Version]
- Liu, Y.; Dai, Q.; Liu, J.; Liu, S.; Yang, J. Study of burn scar extraction automatically based on level set method using remote sensing data. PLoS ONE 2014, 9, e87480. [Google Scholar] [CrossRef] [PubMed]
- Roberts, T.R.; Dyson, J.S.; Lane, M.C. Deactivation of the biological activity of paraquat in the soil environment: A review of long-term environmental fate. J. Agric. Food Chem. 2002, 50, 3623–3631. [Google Scholar] [CrossRef] [PubMed]
- Blanchoud, H.; Schott, C.; Tallec, G.; Queyrel, W.; Gallois, N.; Habets, F.; Puech, T. How should agricultural practices be integrated to understand and simulate long-term pesticide contamination in the Seine River basin? In The Seine River Basin; The Handbook of Environmental Chemistry; Flipo, N., Labadie, P., Lestel, L., Eds.; Springer: Berlin/Heidelberg, Germany, 2020; Volume 90, pp. 141–162. [Google Scholar] [CrossRef]
- Chowdhury, I.F.; Rohan, M.; Stodart, B.J.; Chen, C.; Wu, H.; Doran, G.S. Persistence of atrazine and trifluralin in a clay loam soil undergoing different temperature and moisture conditions. Environ. Pollut. 2021, 276, 116687. [Google Scholar] [CrossRef]
- Thomas, I.A.; Jordan, P.; Mellander, P.-E.; Fenton, O.; Shine, O.; Ó hUallacháin, D.; Creamer, R.; McDonald, N.T.; Dunlop, P.; Murphy, P.N.C. Improving the identification of hydrologically sensitive areas using LiDAR DEMs for the delineation and mitigation of critical source areas of diffuse pollution. Sci. Total Environ. 2016, 556, 276–290. [Google Scholar] [CrossRef] [Green Version]
- Wainwright, J.; Turnbull, L.; Ibrahim, T.G.; Lexartza-Artza, I.; Thornton, S.F.; Brazier, R.E. Linking environmental régimes, space and time: Interpretations of structural and functional connectivity. Geomorphology 2011, 126, 387–404. [Google Scholar] [CrossRef]
- Najafi, S.; Dragovich, D.; Heckmann, T.; Sadeghi, S.H. Sediment connectivity concepts and approaches. Catena 2021, 196, 104880. [Google Scholar] [CrossRef]
- Turnbull, L.; Wainwright, J.; Brazier, R.E. A conceptual framework for understanding semi-arid land degradation: Ecohydrological interactions across multiple-space and time scales. Ecohydrology 2008, 1, 23–34. [Google Scholar] [CrossRef] [Green Version]
- Bracken, L.J.; Wainwright, J.; Ali, G.A.; Tetzlaff, D.; Smith, M.W.; Reaney, S.M.; Roy, A.G. Concepts of hydrological connectivity: Research approaches, pathways and future agendas. Earth-Sci. Rev. 2013, 119, 17–34. [Google Scholar] [CrossRef] [Green Version]
- Cossart, E.; Viel, V.; Lissak, C.; Reulier, R.; Fressard, M.; Delahaye, D. How might sediment connectivity change in space and time? Land Degrad. Dev. 2018, 29, 2595–2613. [Google Scholar] [CrossRef]
- Bracken, L.J.; Croke, J. The concept of hydrological connectivity and its contribution to understanding runoff-dominated geomorphic systems. Hydrol. Process. 2007, 21, 1749–1763. [Google Scholar] [CrossRef]
- Reulier, R.; Delahaye, D.; Viel, V. Agricultural landscape evolution and structural connectivity to the river for matter flux, a multi-agents simulation approach. Catena 2019, 174, 524–535. [Google Scholar] [CrossRef]
- Sandevoir, L. Pesticides flows in northern Lao PDR, a geographical approach of vulnerabilities. In CCL Study Report; CCL: Vientiane, Laos, 2019. [Google Scholar]
- Harvey, A.M. Geomorphic instability and change–Introduction: Implications of temporal and spatial scales. Geomorphology 2007, 84, 153–158. [Google Scholar] [CrossRef]
- Gascuel-Odoux, C.; Aurousseau, P.; Doray, T.; Squividant, H.; Macary, F.; Uny, D.; Grimaldi, C. Incorporating landscape features to obtain an object-oriented landscape drainage network representing the connectivity of surface flow pathways over rural catchments. Hydrol. Process. 2011, 25, 3625–3636. [Google Scholar] [CrossRef]
- Heckmann, T.; Schwanghart, W. Geomorphic coupling and sediment connectivity in an alpine catchment—Exploring sediment cascades using graph theory. Geomorphology 2013, 182, 89–103. [Google Scholar] [CrossRef]
- Heckmann, T.; Schwanghart, W.; Phillips, J.D. Graph theory—Recent developments of its application in geomorphology. Geomorphology 2015, 243, 130–146. [Google Scholar] [CrossRef]
- Cossart, E.; Fressard, M. Assessment of structural sediment connectivity within catchments: Insights from graph theory. Earth Surf. Dyn. 2017, 5, 253–268. [Google Scholar] [CrossRef] [Green Version]
- Theler, D. Contribution à la Cartographie Géomorphologique de la Dynamique Sédimentaire des Petits Bassins Versants Torrentiels. Ph.D. Thesis, Université de Lausanne, Faculté des Géosciences et de L’environnement, Écublens, Switzerland, 2010. Available online: https://serval.unil.ch/notice/serval:BIB_9F47F46E0DD4 (accessed on 29 March 2023).
- Cavalli, M.; Trevisani, S.; Comiti, F.; Marchi, L. Geomorphometric assessment of spatial sediment connectivity in small Alpine catchments. Geomorphology 2013, 188, 31–41. [Google Scholar] [CrossRef]
- Hurni, K.; Hett, C.; Heinimann, A.; Messerli, P.; Wiesmann, U. Dynamics of Shifting Cultivation Landscapes in Northern Lao PDR Between 2000 and 2009 Based on an Analysis of MODIS Time Series and Landsat Images. Hum. Ecol. 2013, 41, 21–36. [Google Scholar] [CrossRef] [Green Version]
- Beveridge, C.; Hossain, F.; Bonnema, M. Estimating Impacts of Dam Development and Landscape Changes on Suspended Sediment Concentrations in the Mekong River Basin’s 3S Tributaries. J. Hydrol. Eng. 2020, 25, 05020014. [Google Scholar] [CrossRef]
- Kaplan, G.; Avdan, U. Sentinel-2 Pan Sharpening—Comparative Analysis. Proceedings 2018, 2, 345. [Google Scholar] [CrossRef] [Green Version]
- Abdi, A.M. Land cover and land use classification performance of machine learning algorithms in a boreal landscape using Sentinel-2 data. GISci. Remote Sens. 2019, 57, 1–20. [Google Scholar] [CrossRef] [Green Version]
- Armannsson, S.E.; Ulfarsson, M.O.; Sigurdsson, J.; Nguyen, H.V.; Sveinsson, J.R. A Comparison of Optimized Sentinel-2 Super-Resolution Methods Using Wald’s Protocol and Bayesian Optimization. Remote Sens. 2021, 13, 2192. [Google Scholar] [CrossRef]
- Inoue, Y.; Qi, J.; Olioso, A.; Kiyono, Y.; Horie, T.; Asai, H.; Saito, K.; Ochiai, Y.; Shiraiwa, T.; Douangsavanh, L. Reflectance characteristics of major land surfaces in slash-and-burn ecosystems in Laos. Int. J. Remote Sens. 2008, 29, 2011–2019. [Google Scholar] [CrossRef]
- Pal, M. Random Forest classifier for remote sensing classification. Int. J. Remote Sens. 2005, 26, 217–222. [Google Scholar] [CrossRef]
- Poesen, J.; Nachtergaele, J.; Verstraeten, G.; Valentin, C. Gully erosion and environmental change: Importance and research needs. Catena 2003, 50, 91–133. [Google Scholar] [CrossRef]
- Pierret, A.; de Rouw, A.; Chaplot, V.; Valentin, C.; Noble, A.; Suhardiman, D.; Drechsel, P. Reshaping Upland Farming Policies to Support Nature and Livelihoods: Lessons from Soil Erosion in Southeast Asia with Emphasis on Lao PDR; Institut de Recherche Pour le Développement (IRD): Marseille, France; International Water Management Institute (IWMI): Colombo, Sri Lanka, 2011; 40p. [Google Scholar] [CrossRef]
- Viel, V.; Delahaye, D.; Reulier, R. Impact de l’organisation des structures paysagères sur les dynamiques de ruissellement de surface en domaine bocager. Etude comparée de 3 petits bassins versants bas-normands. Géomorphologie Relief Process. Environ. 2014, 20, 175–188. [Google Scholar] [CrossRef] [Green Version]
- Reulier, R.; Delahaye, D.; Viel, V.; Davidson, R. Connectivité hydro-sédimentaire dans un petit bassin versant agricole du nord-ouest de la France: De l’expertise de terrain à la modélisation par Système Multi-Agent. Géomorphologie Relief Process. Environ. 2017, 23, 327–340. [Google Scholar] [CrossRef]
- Cao, L.; Elliot, W.; Long, J.W. Spatial simulation of forest road effects on hydrology and soil erosion after a wildfire. Hydrol. Process. 2021, 35, e14139. [Google Scholar] [CrossRef]
- Lindsay, J.B.; Yang, W.; Hornby, D.D. Drainage Network Analysis and Structuring of Topologically Noisy Vector Stream Data. International Journal of Geo-Information ISPRS 2019, 8, 422. [Google Scholar] [CrossRef] [Green Version]
- Pingali, P.L.; Roger, P.A. (Eds.) Impact of pesticides on farmer health and the rice environment: An overview of results from a multidisciplinary study in the Philippines. In Impact of Pesticides on Farmer Health and the Rice Environment; International Rice Research Institute: Los Baños, Philippines, 1995; pp. 3–21. [Google Scholar]
- Matamoros, V.; Caiola, N.; Rosales, V.; Hernández, O.; Ibáñez, C. The role of rice fields and constructed wetlands as a source and a sink of pesticides and contaminants of emerging concern: Full-scale evaluation. Ecol. Eng. 2020, 156, 105971. [Google Scholar] [CrossRef]
- Fryirs, K.A.; Brierley, G.J.; Preston, N.J.; Kasai, M. Buffers, barriers and blankets: The (dis) connectivity of catchment-scale sediment cascades. CATENA 2007, 70, 49–67. [Google Scholar] [CrossRef]
- Huon, S.; Evrard, O.; Gourdin, E.; Lefèvre, I.; Bariac, T.; Reyss, J.L.; des Tureaux, T.H.; Sengtaheuanghoung, O.; Ayrault, S.; Ribolzi, O. Suspended sediment source and propagation during monsoon events across nested sub-catchments with contrasted land uses in Laos. J. Hydrol. Reg. Stud. 2017, 9, 69–84. [Google Scholar] [CrossRef]
- Rijsdijk, A.; Bruijnzeel, L.S.; Sutoto, C.K. Runoff and sediment yield from rural roads, trails and settlements in the upper Konto catchment, East Java, Indonesia. Geomorphology 2007, 87, 28–37. [Google Scholar] [CrossRef]
- Kong, R.; Diepart, J.C.; Castella, J.C.; Lestrelin, G.; Tivet, F.; Belmain, E.; Bégué, A. Understanding the drivers of deforestation and agricultural transformations in the Northwestern uplands of Cambodia. Appl. Geogr. 2019, 102, 84–98. [Google Scholar] [CrossRef] [Green Version]
- Escalada, M.M.; Heong, K.L.; Sengsoulivong, V.; Schiller, J.M. Determinants of insecticide-use decisions of lowland rice farmers in Laos. In Rice in Laos; International Rice Research Institute: Los Baños, Philippines, 2006; pp. 283–290. [Google Scholar]
Figure 1.
Study area (Houaylack-Vangven village and surrounding areas).

Figure 2.
Principle of structural connectivity transposed to graph theory with: (a) potential sediment sources; (a’) disconnected potential sources; (b) connected potential sources; (c) sinks; (c’) outflow (channel network).
Figure 2.
Principle of structural connectivity transposed to graph theory with: (a) potential sediment sources; (a’) disconnected potential sources; (b) connected potential sources; (c) sinks; (c’) outflow (channel network).

Figure 3.
Image classification flowchart.

Figure 4.
Flowchart to define the structural connectivity model.

Figure 5.
Example of sediment source connection mapping using a watershed geoprocessing tool.

Figure 6.
Example of an effective connection between an upland plot and the river through a steep slope covered by a riparian forest (Houaylack-Vangven, 2017) and location map of the observation.
Figure 6.
Example of an effective connection between an upland plot and the river through a steep slope covered by a riparian forest (Houaylack-Vangven, 2017) and location map of the observation.

Figure 7.
Example of the structural connectivity (blue arrows) with various connection types: (1) direct connection from plot to river; (2) hillslope hollow to ponds; (3) rills indicating a connection from a dirt road to the background upland plot; (4) gully connection in a steep upland; (5) irrigation ditch connection; (6) direct connection from upland grown with maize and a paddy field recently planted.

Figure 8.
Oriented graph detailing sediment connections from source to sink.

Figure 9.
Map showing land use transition from 2016 to 2020.

Figure 10.
Growth of cultivated areas (swidden or permanent in ha) for two successive years since 2016.
Figure 10.
Growth of cultivated areas (swidden or permanent in ha) for two successive years since 2016.

Figure 11.
Structural connectivity modelling, linked to the maize cultivation expansion.

Figure 12.
Hydrographic and road connectivity patterns in 2020 linked to sugar cane development.

Figure 13.
Structural connectivity and graph modelling for sediment and pesticide transfers since 2016.
Figure 13.
Structural connectivity and graph modelling for sediment and pesticide transfers since 2016.


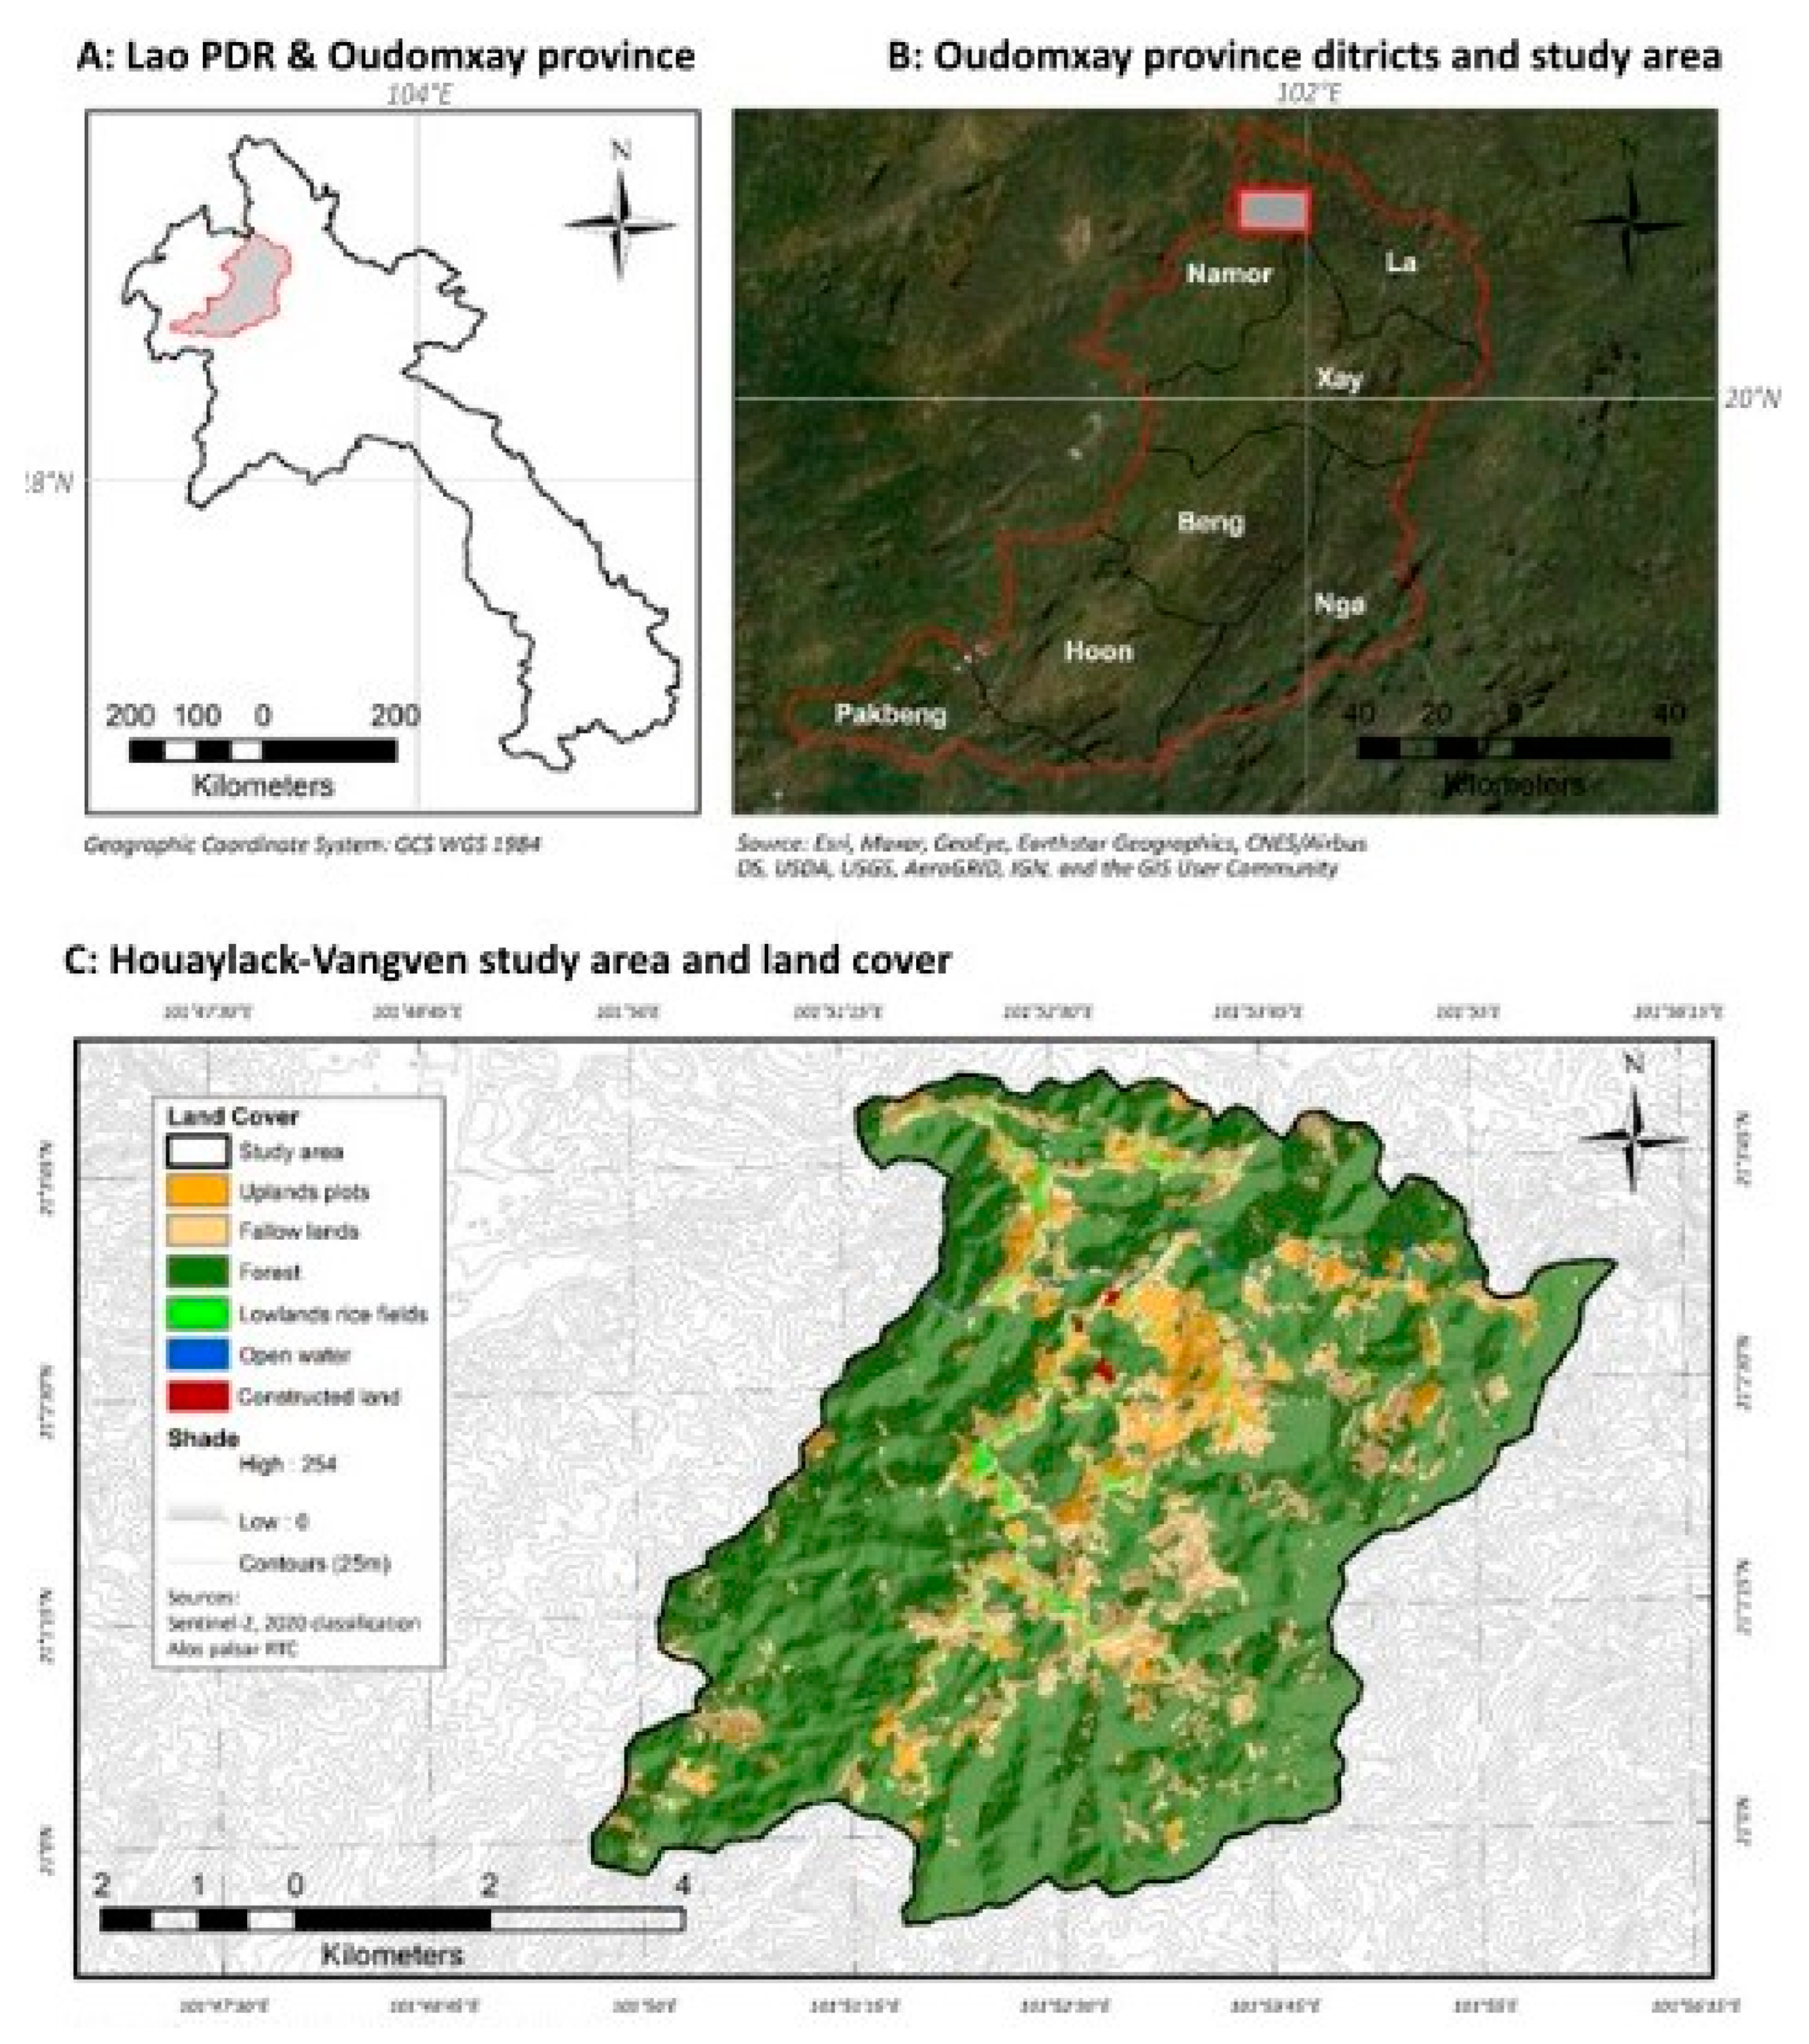
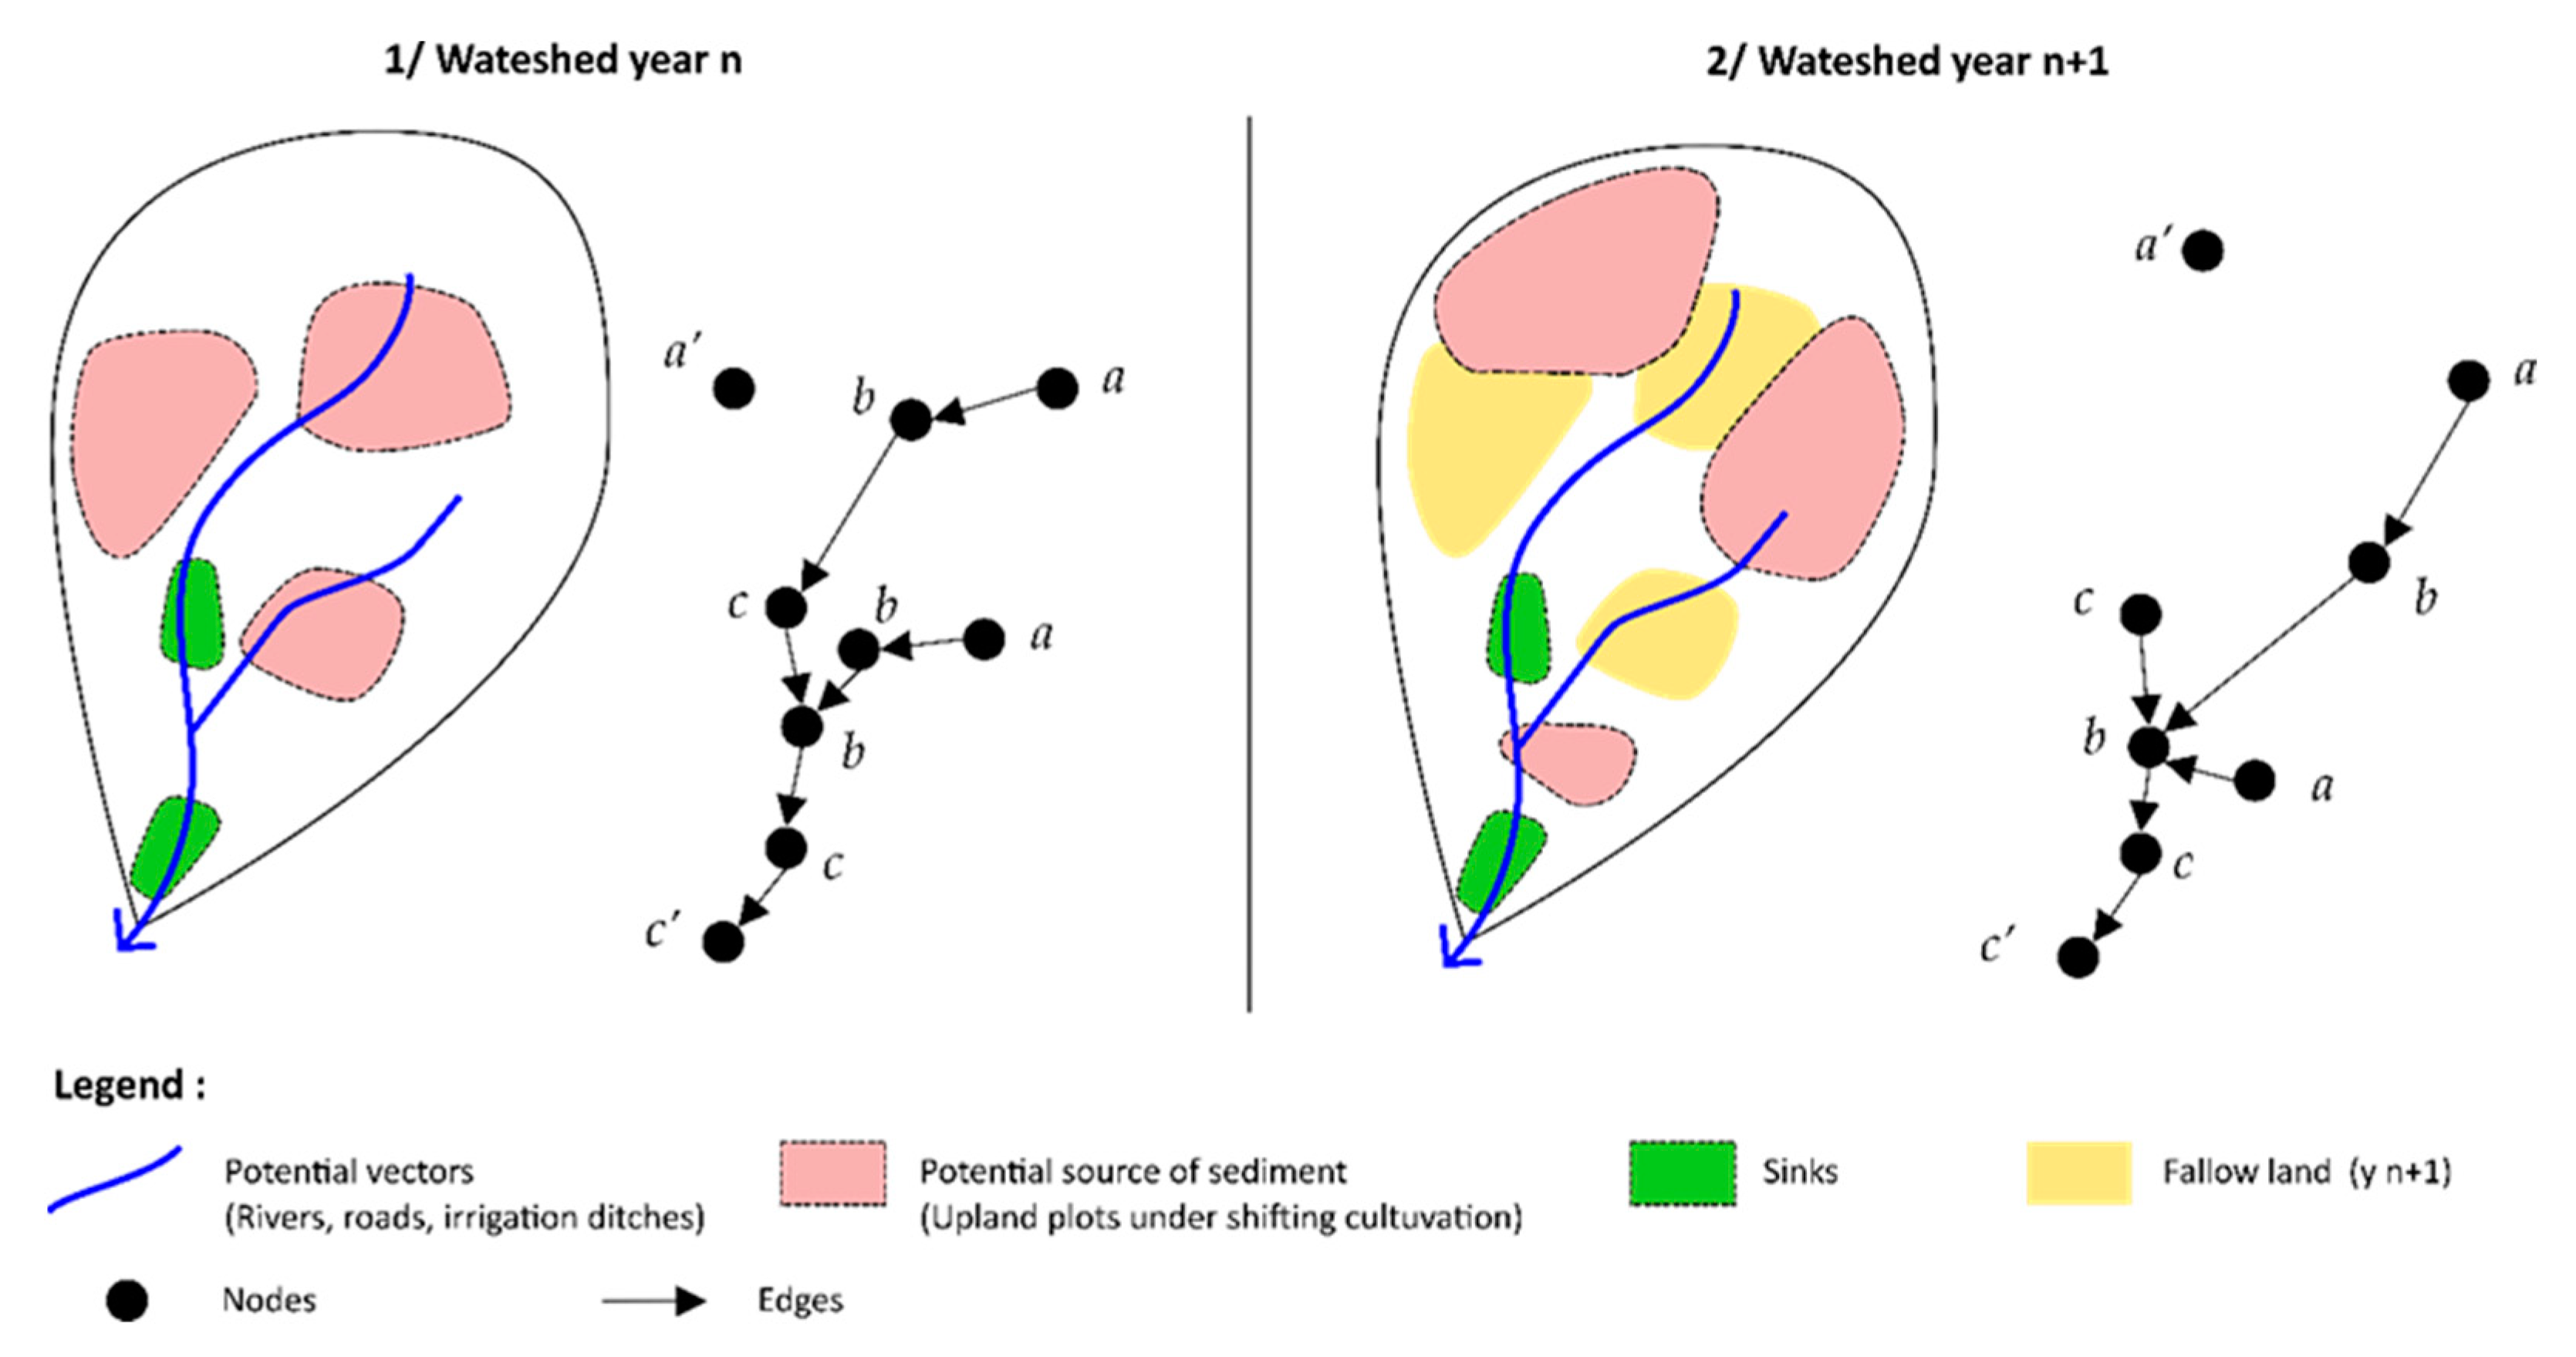
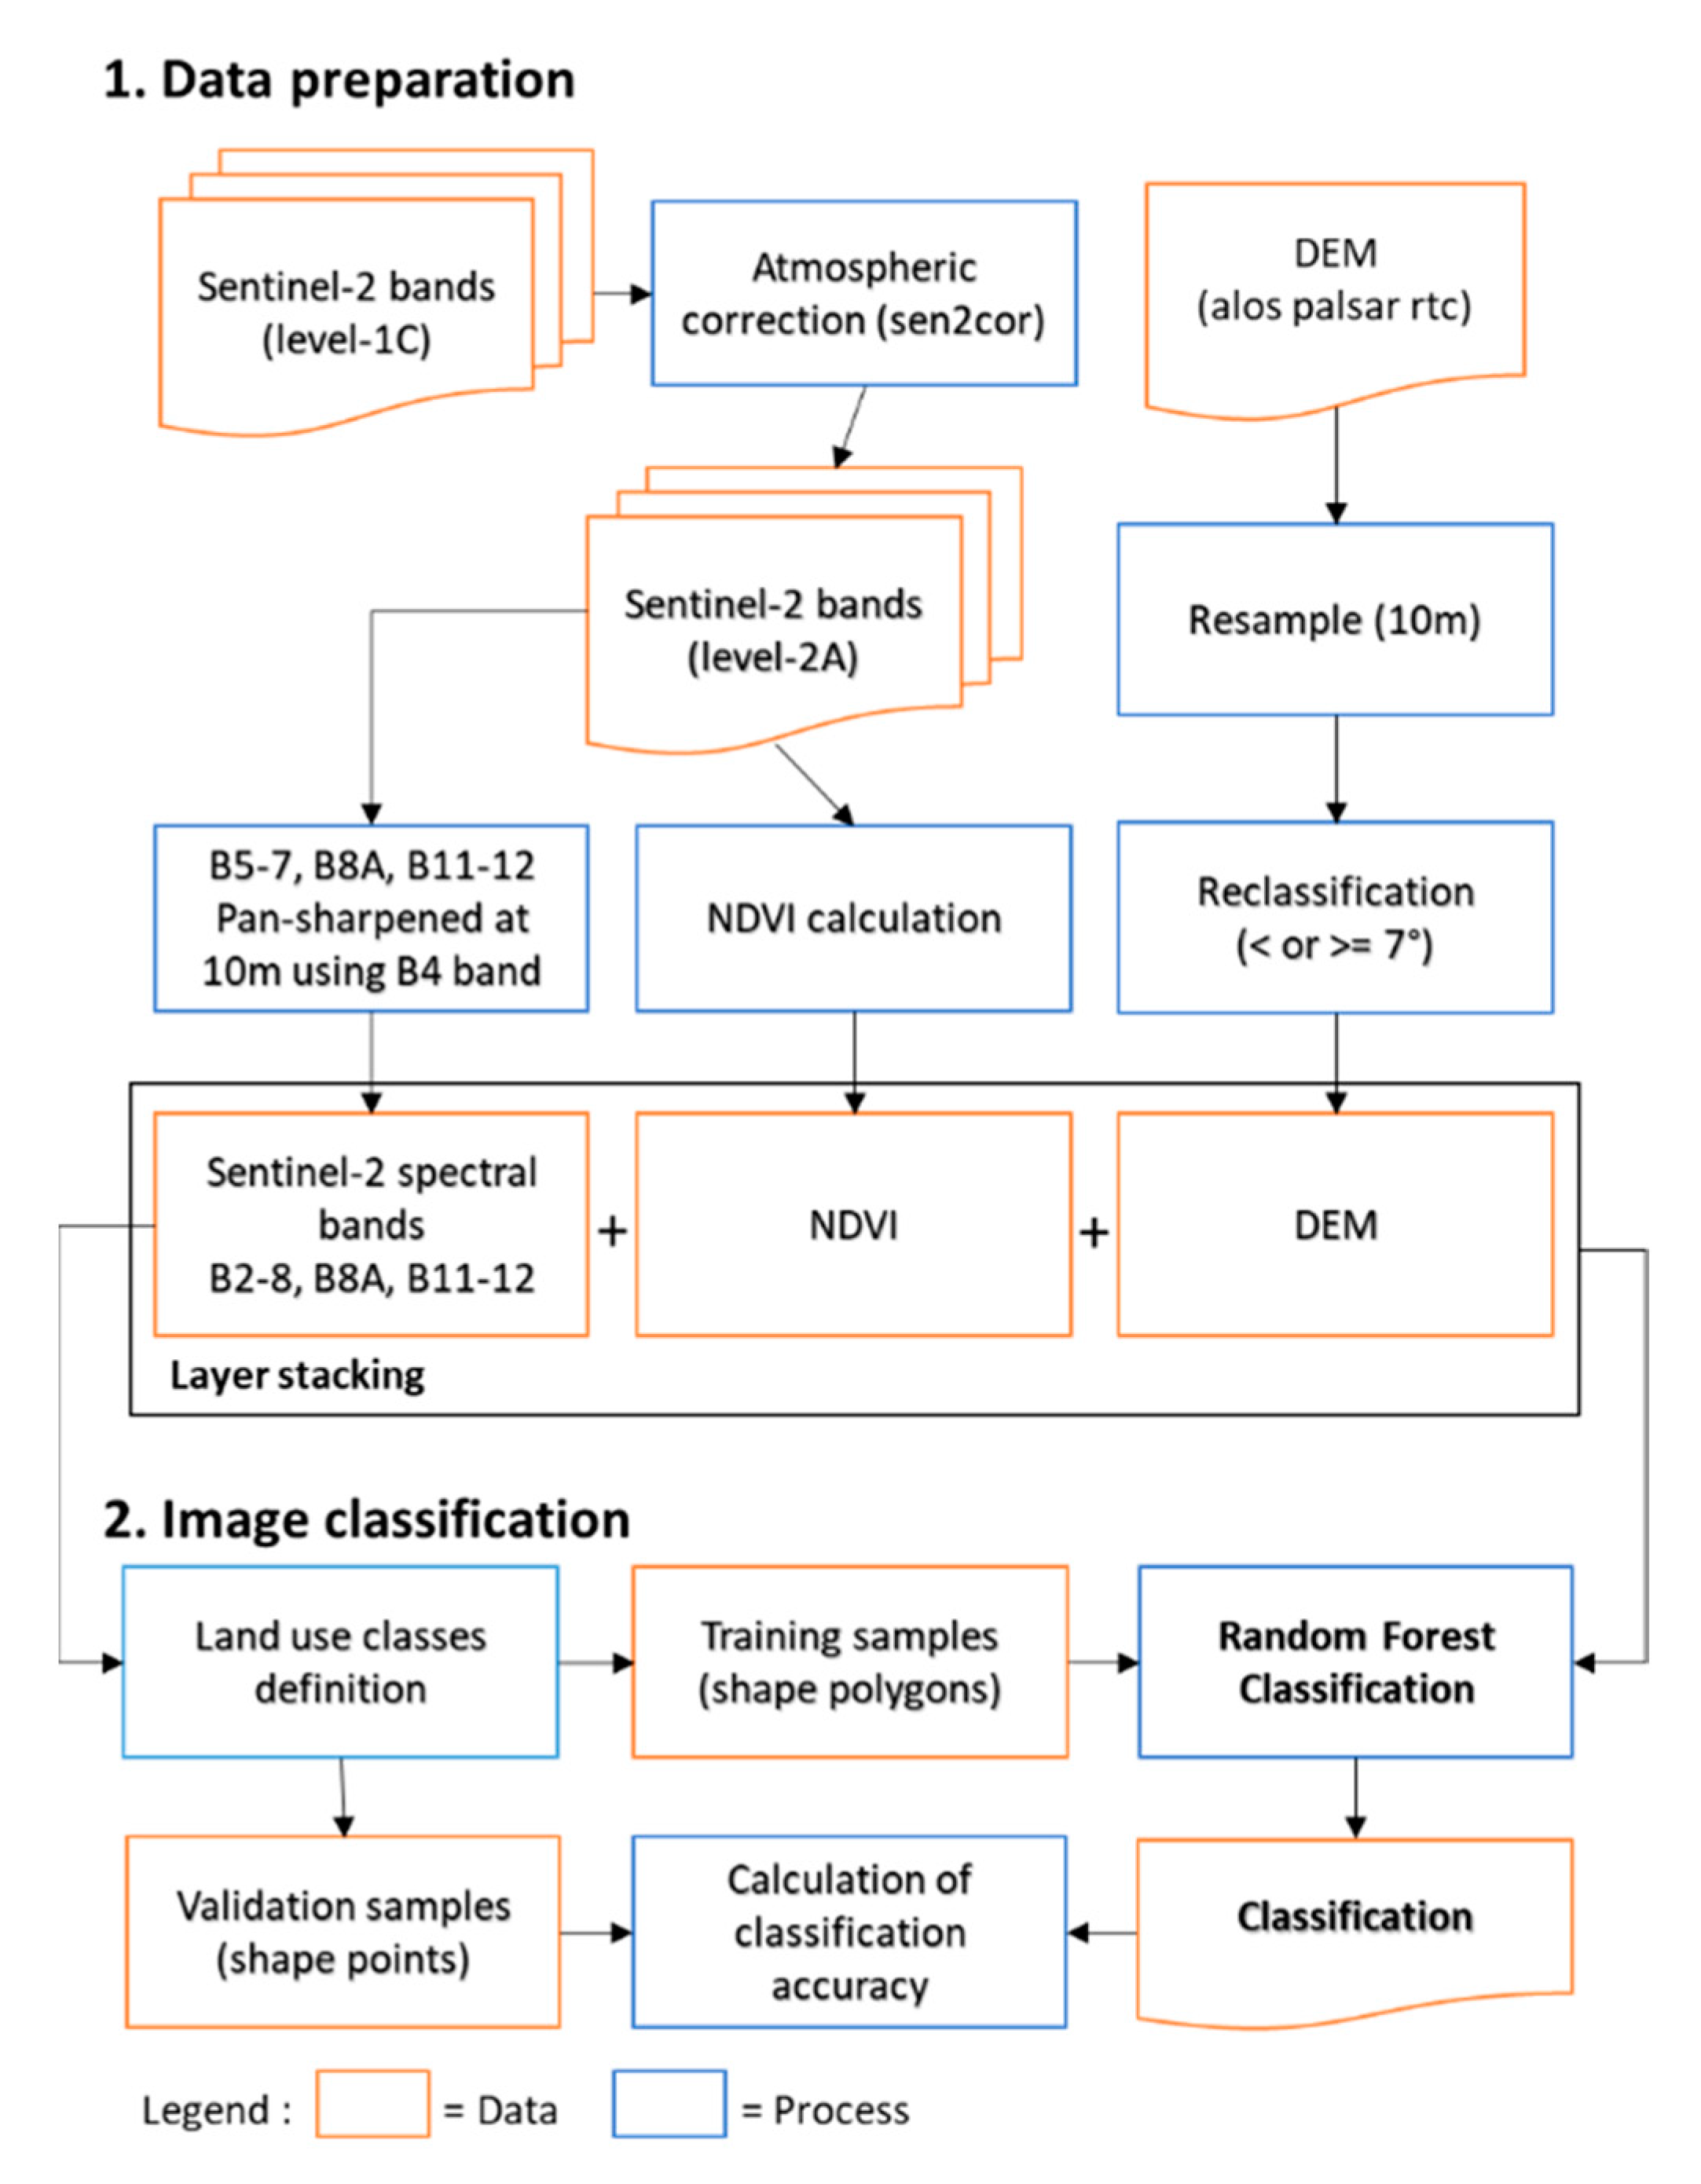
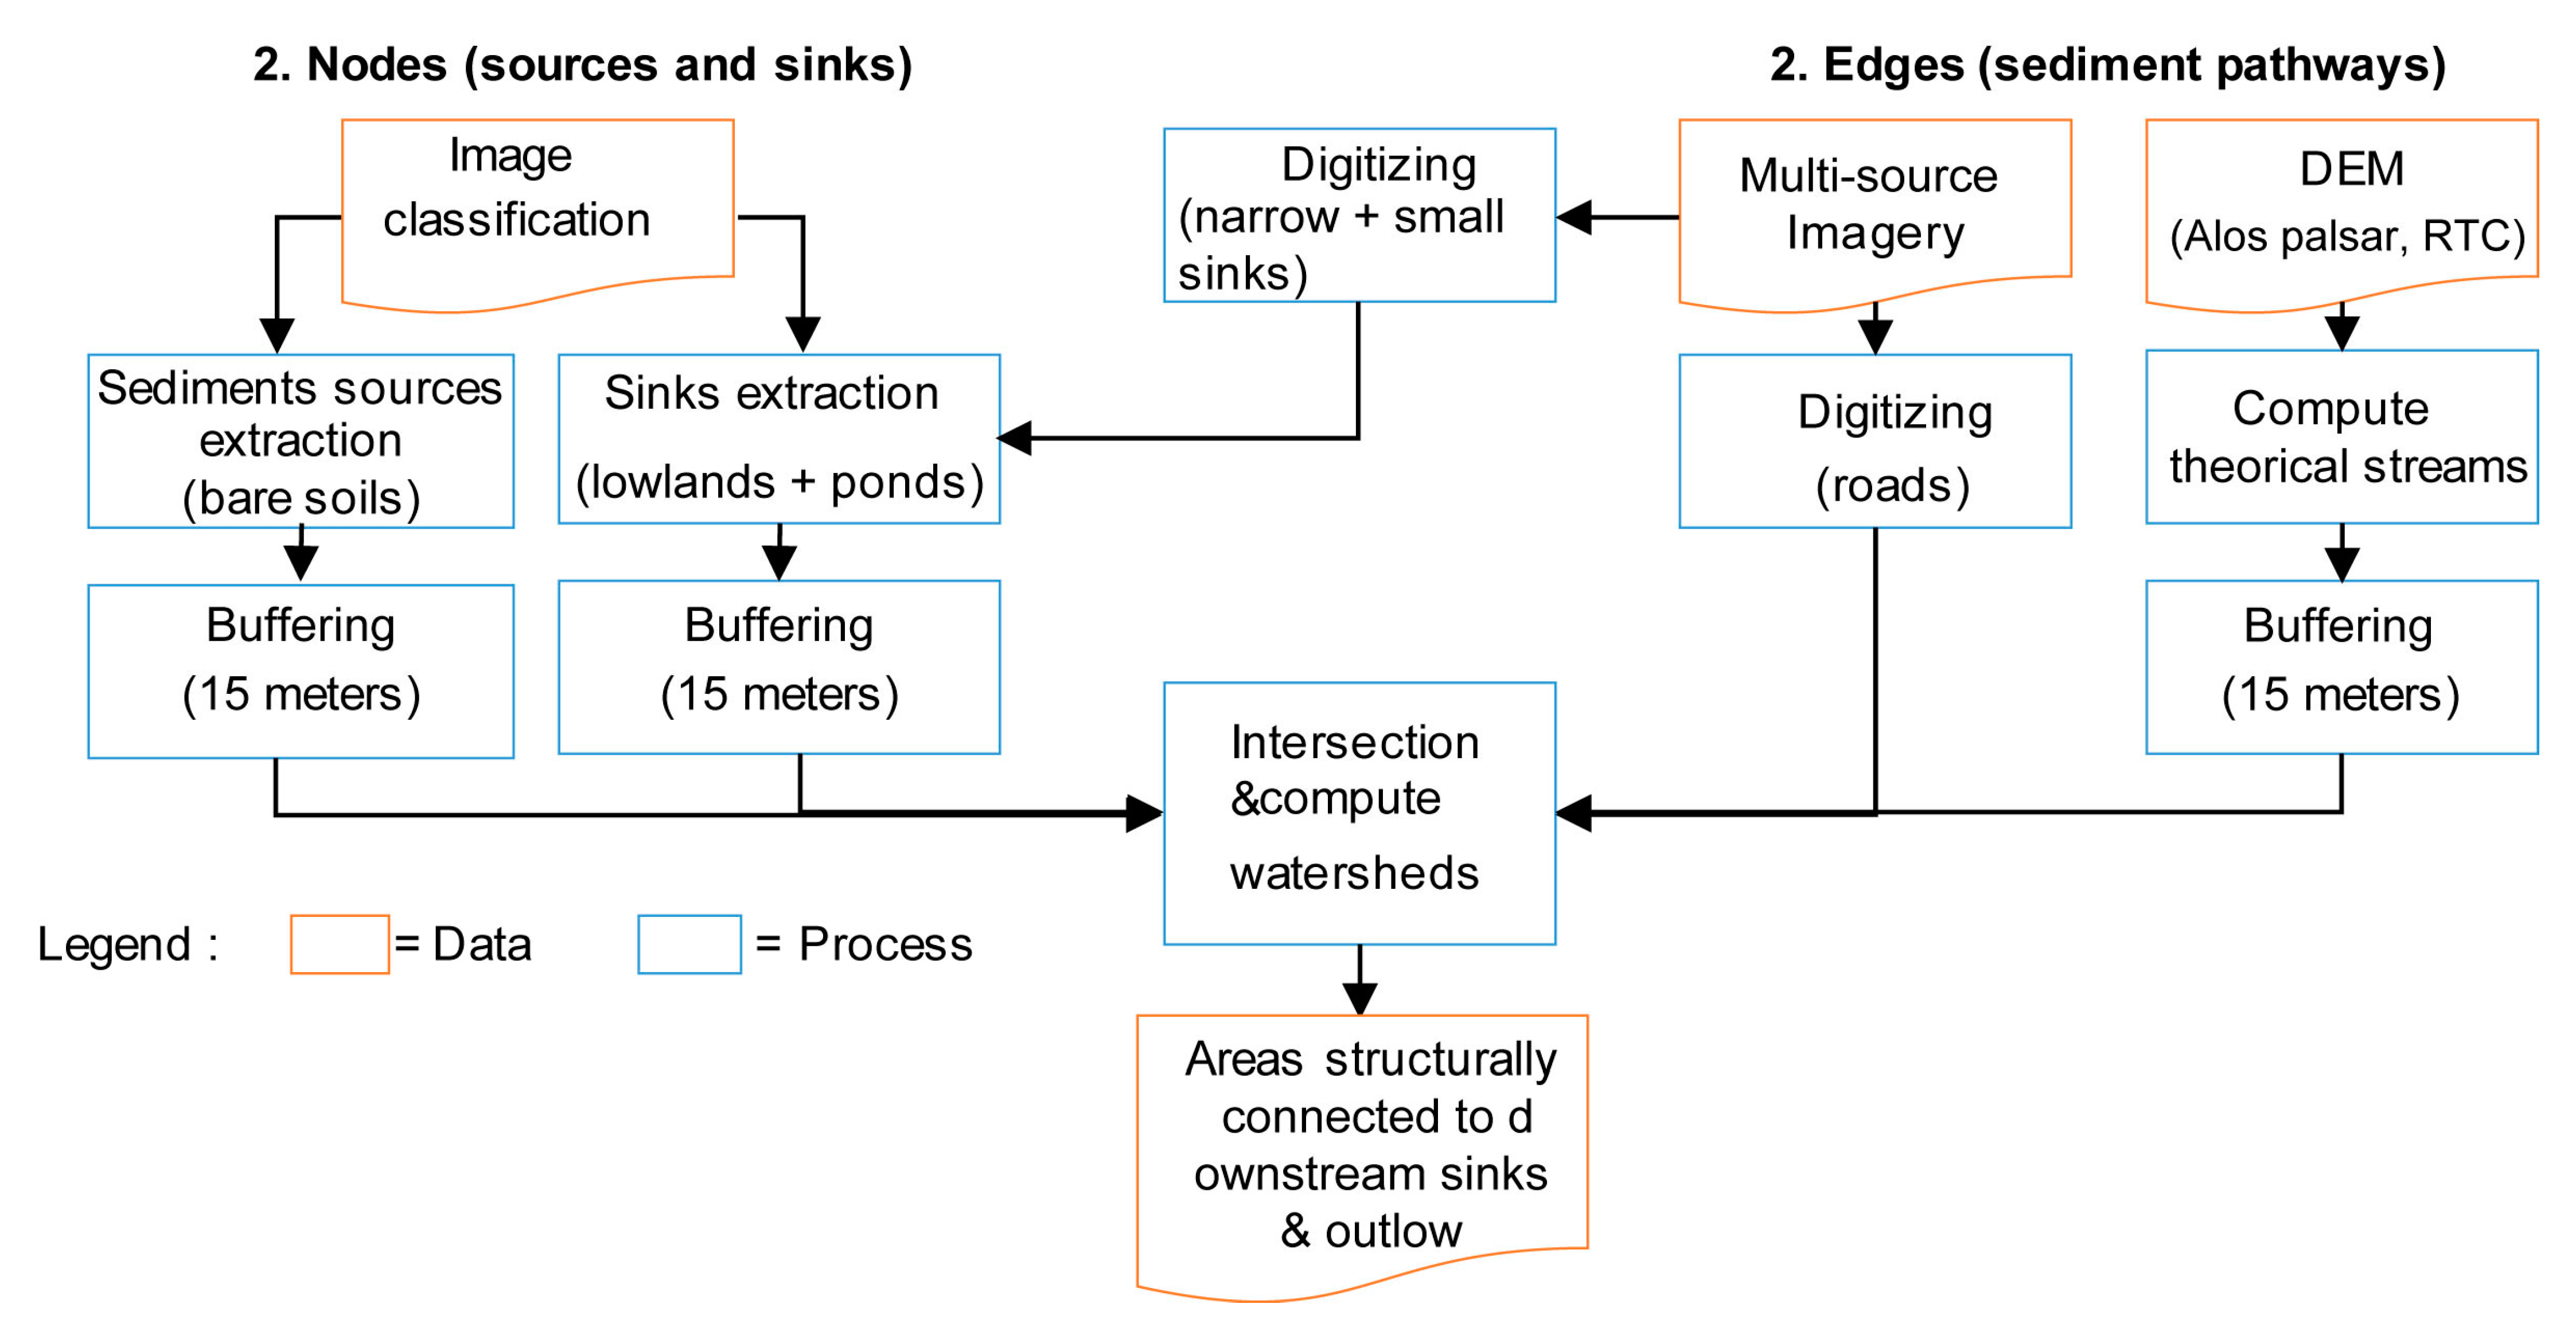
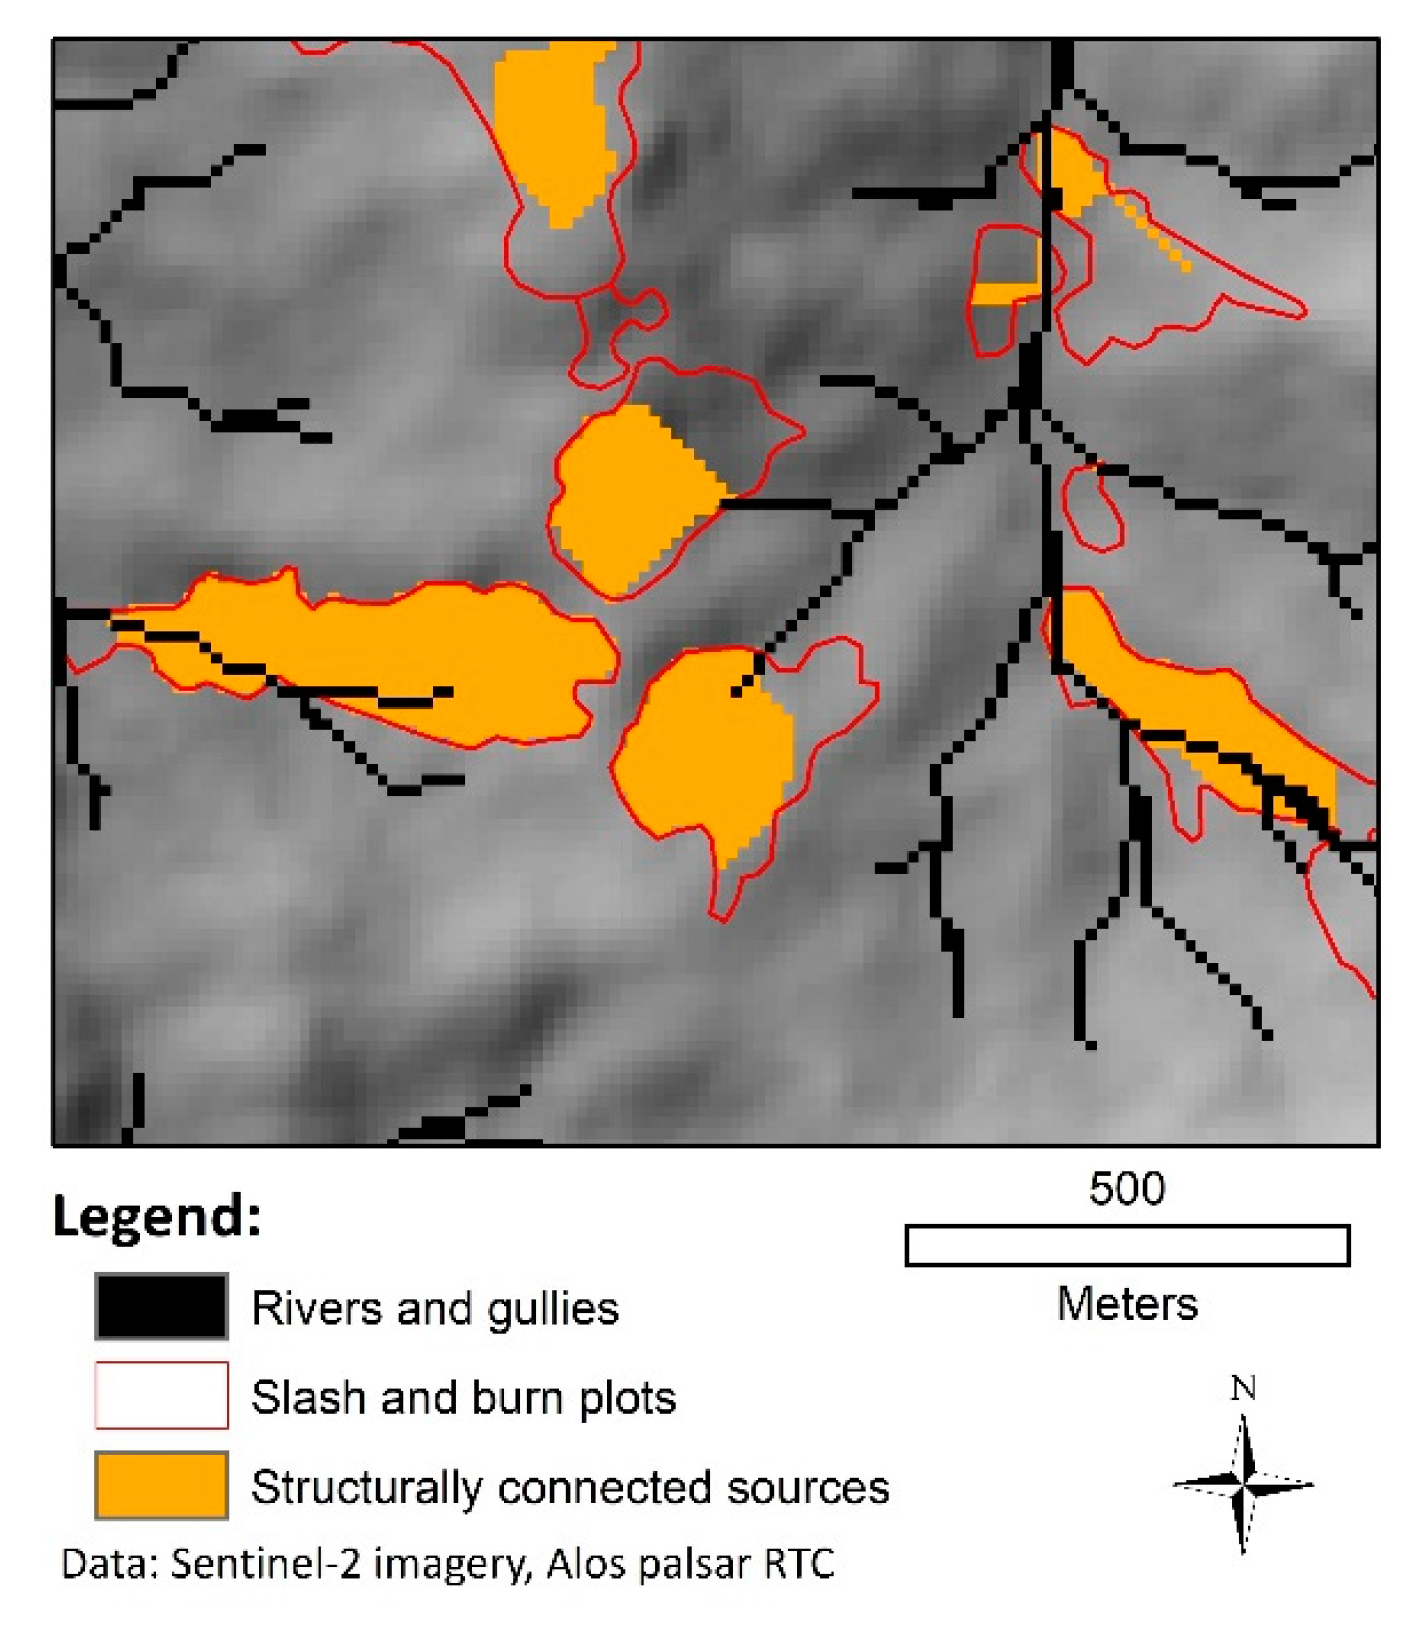
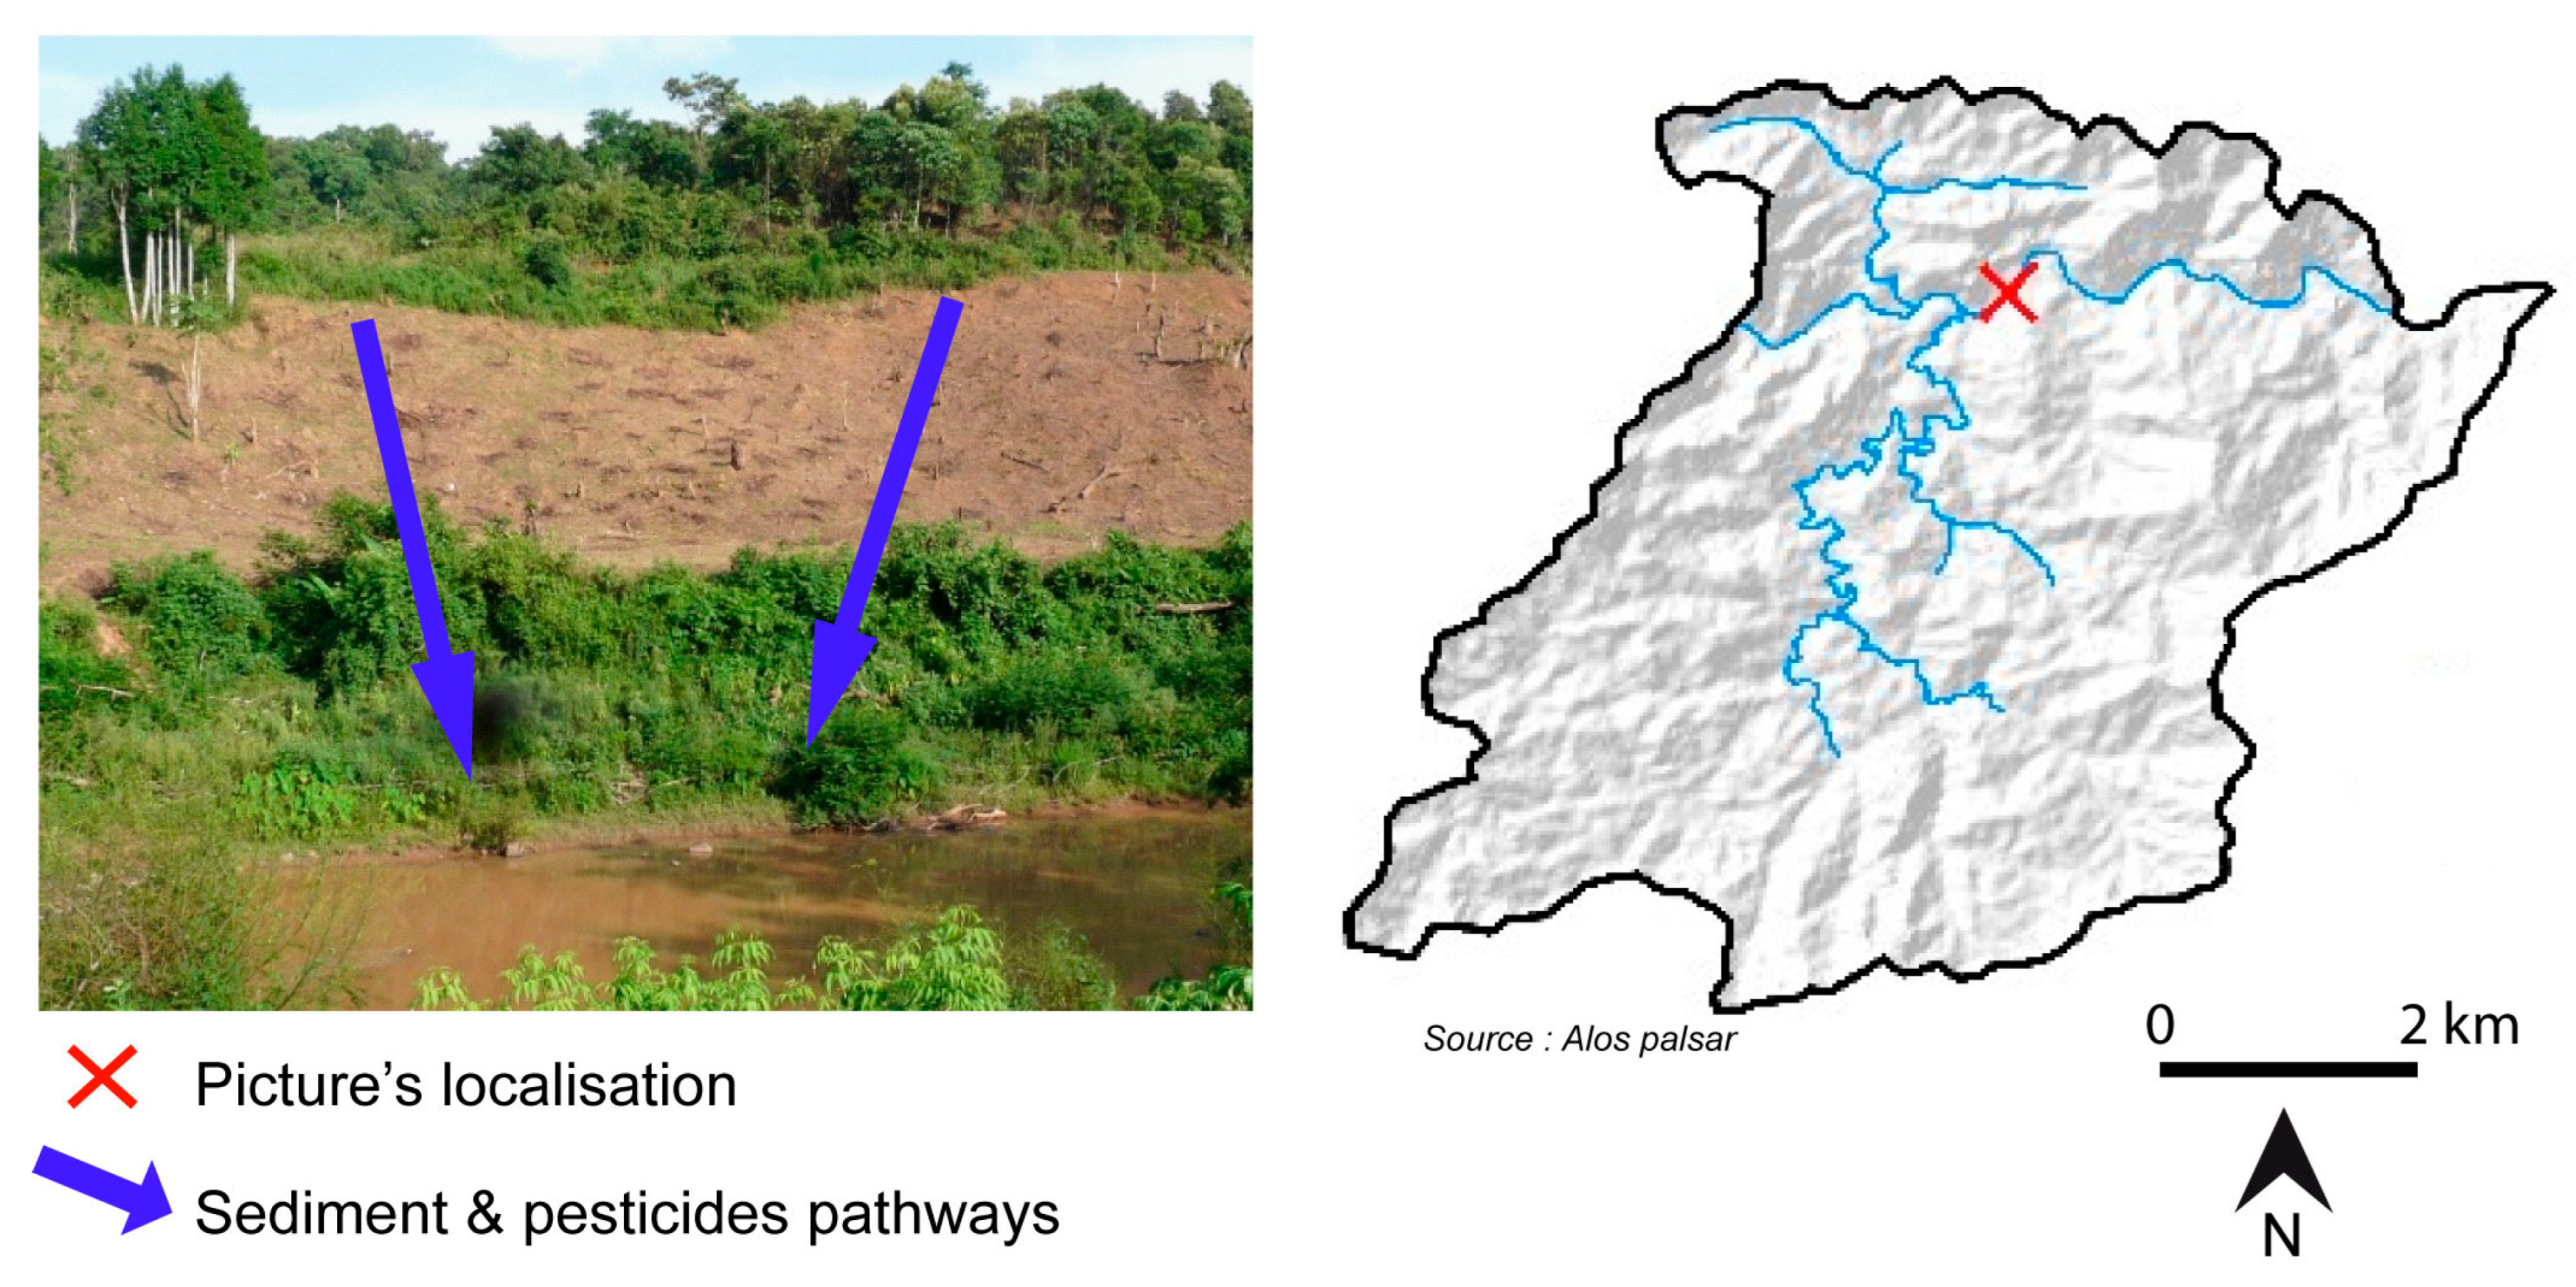
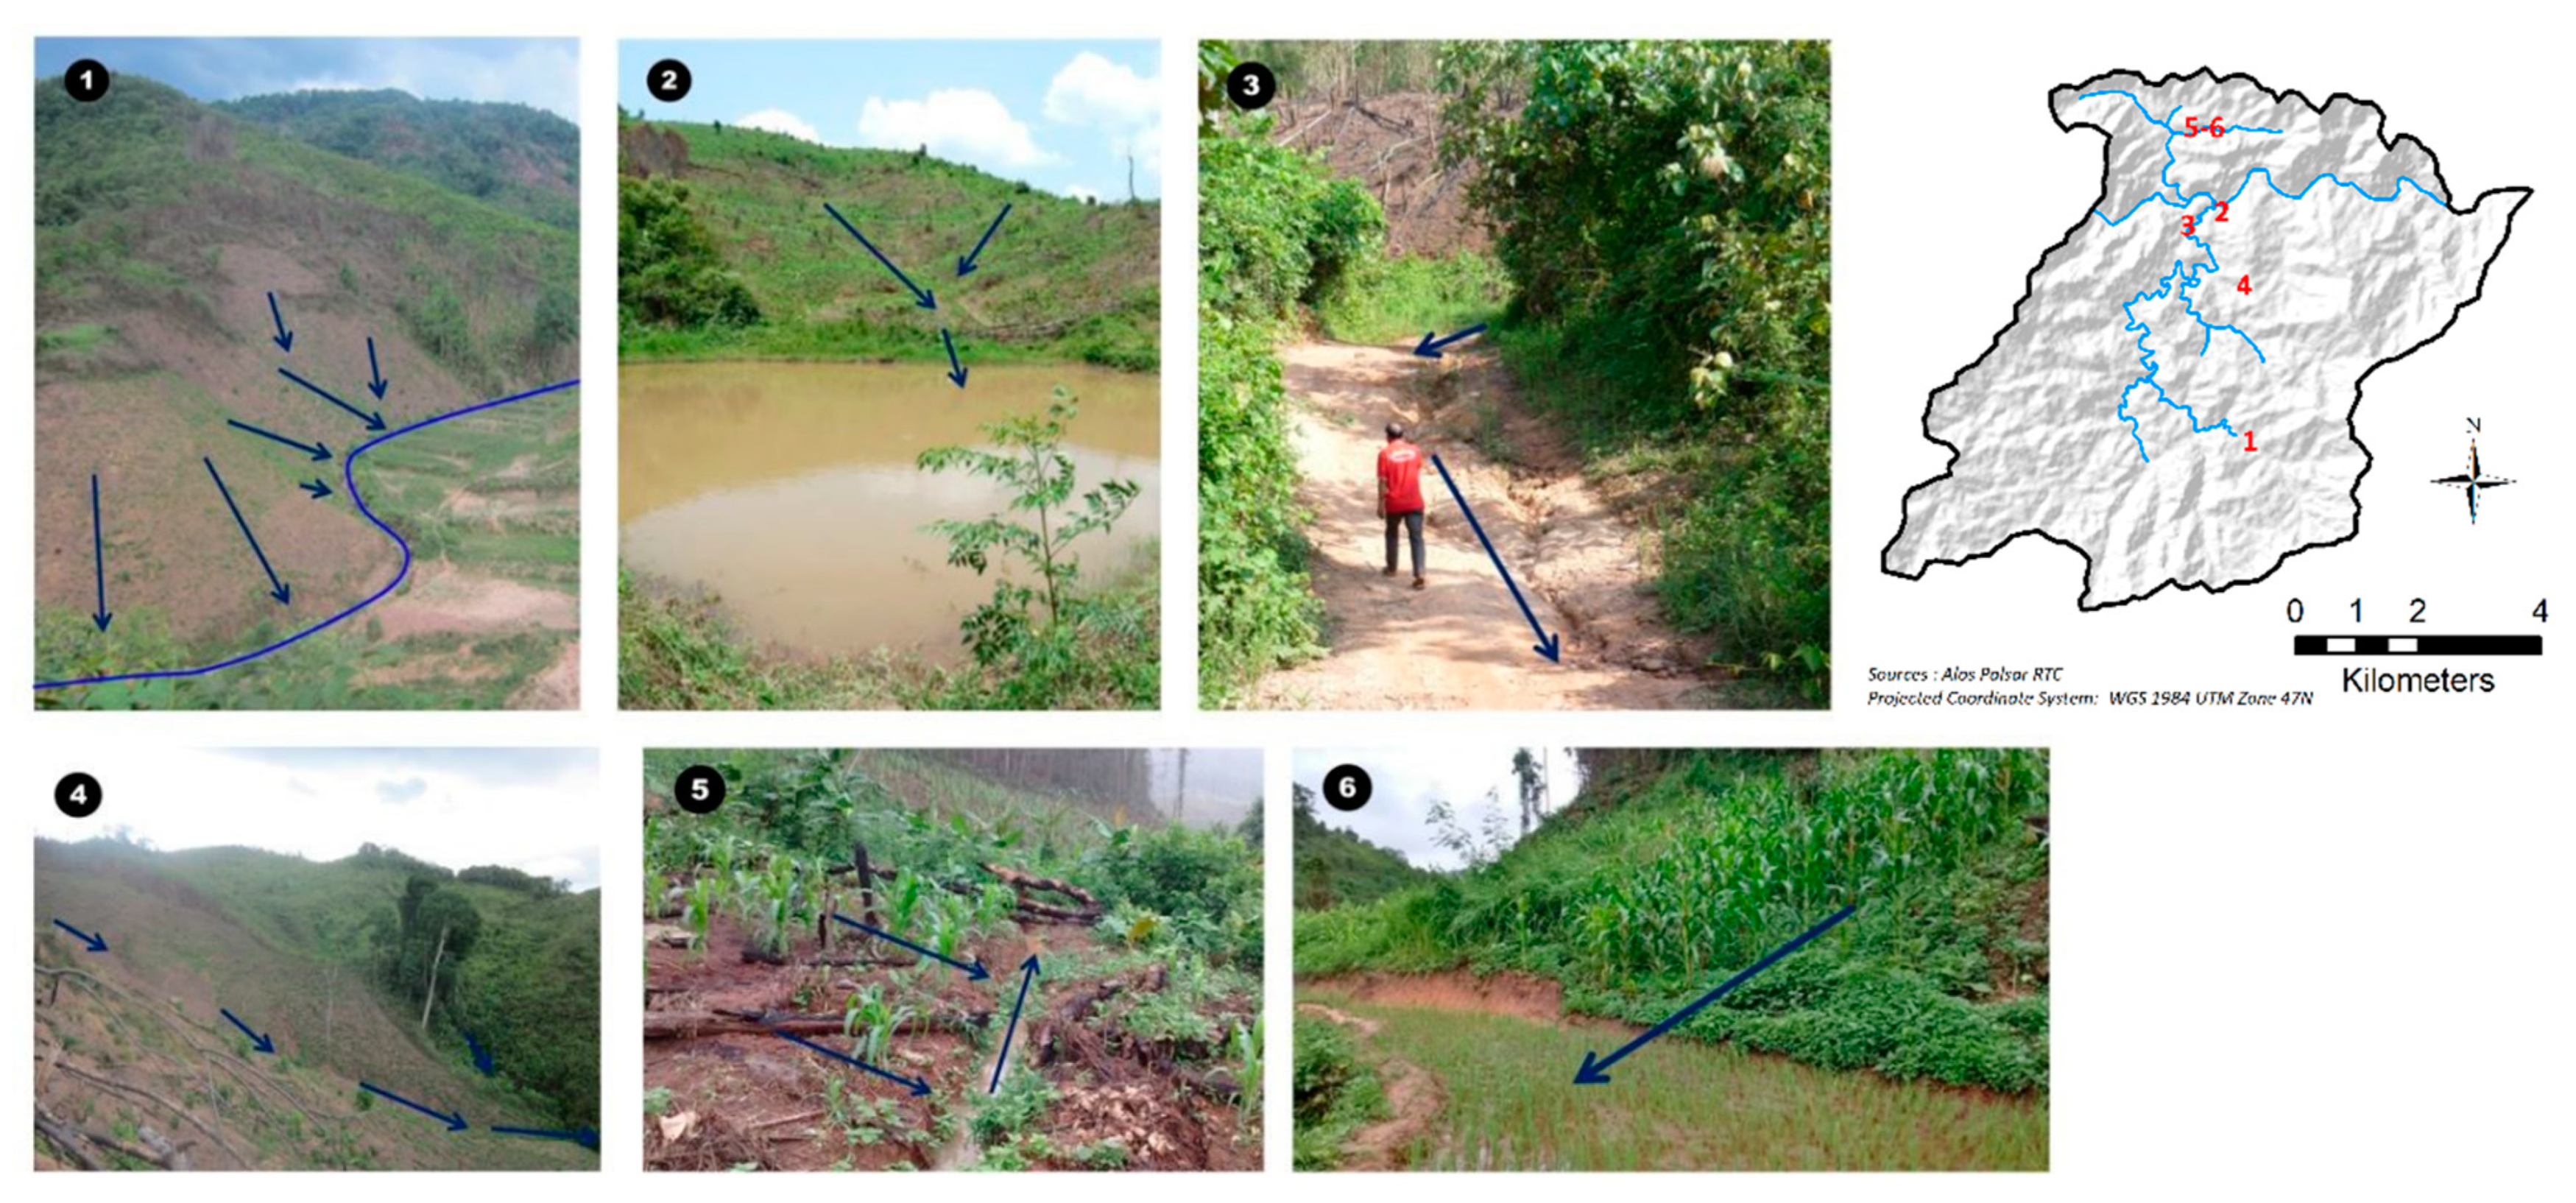
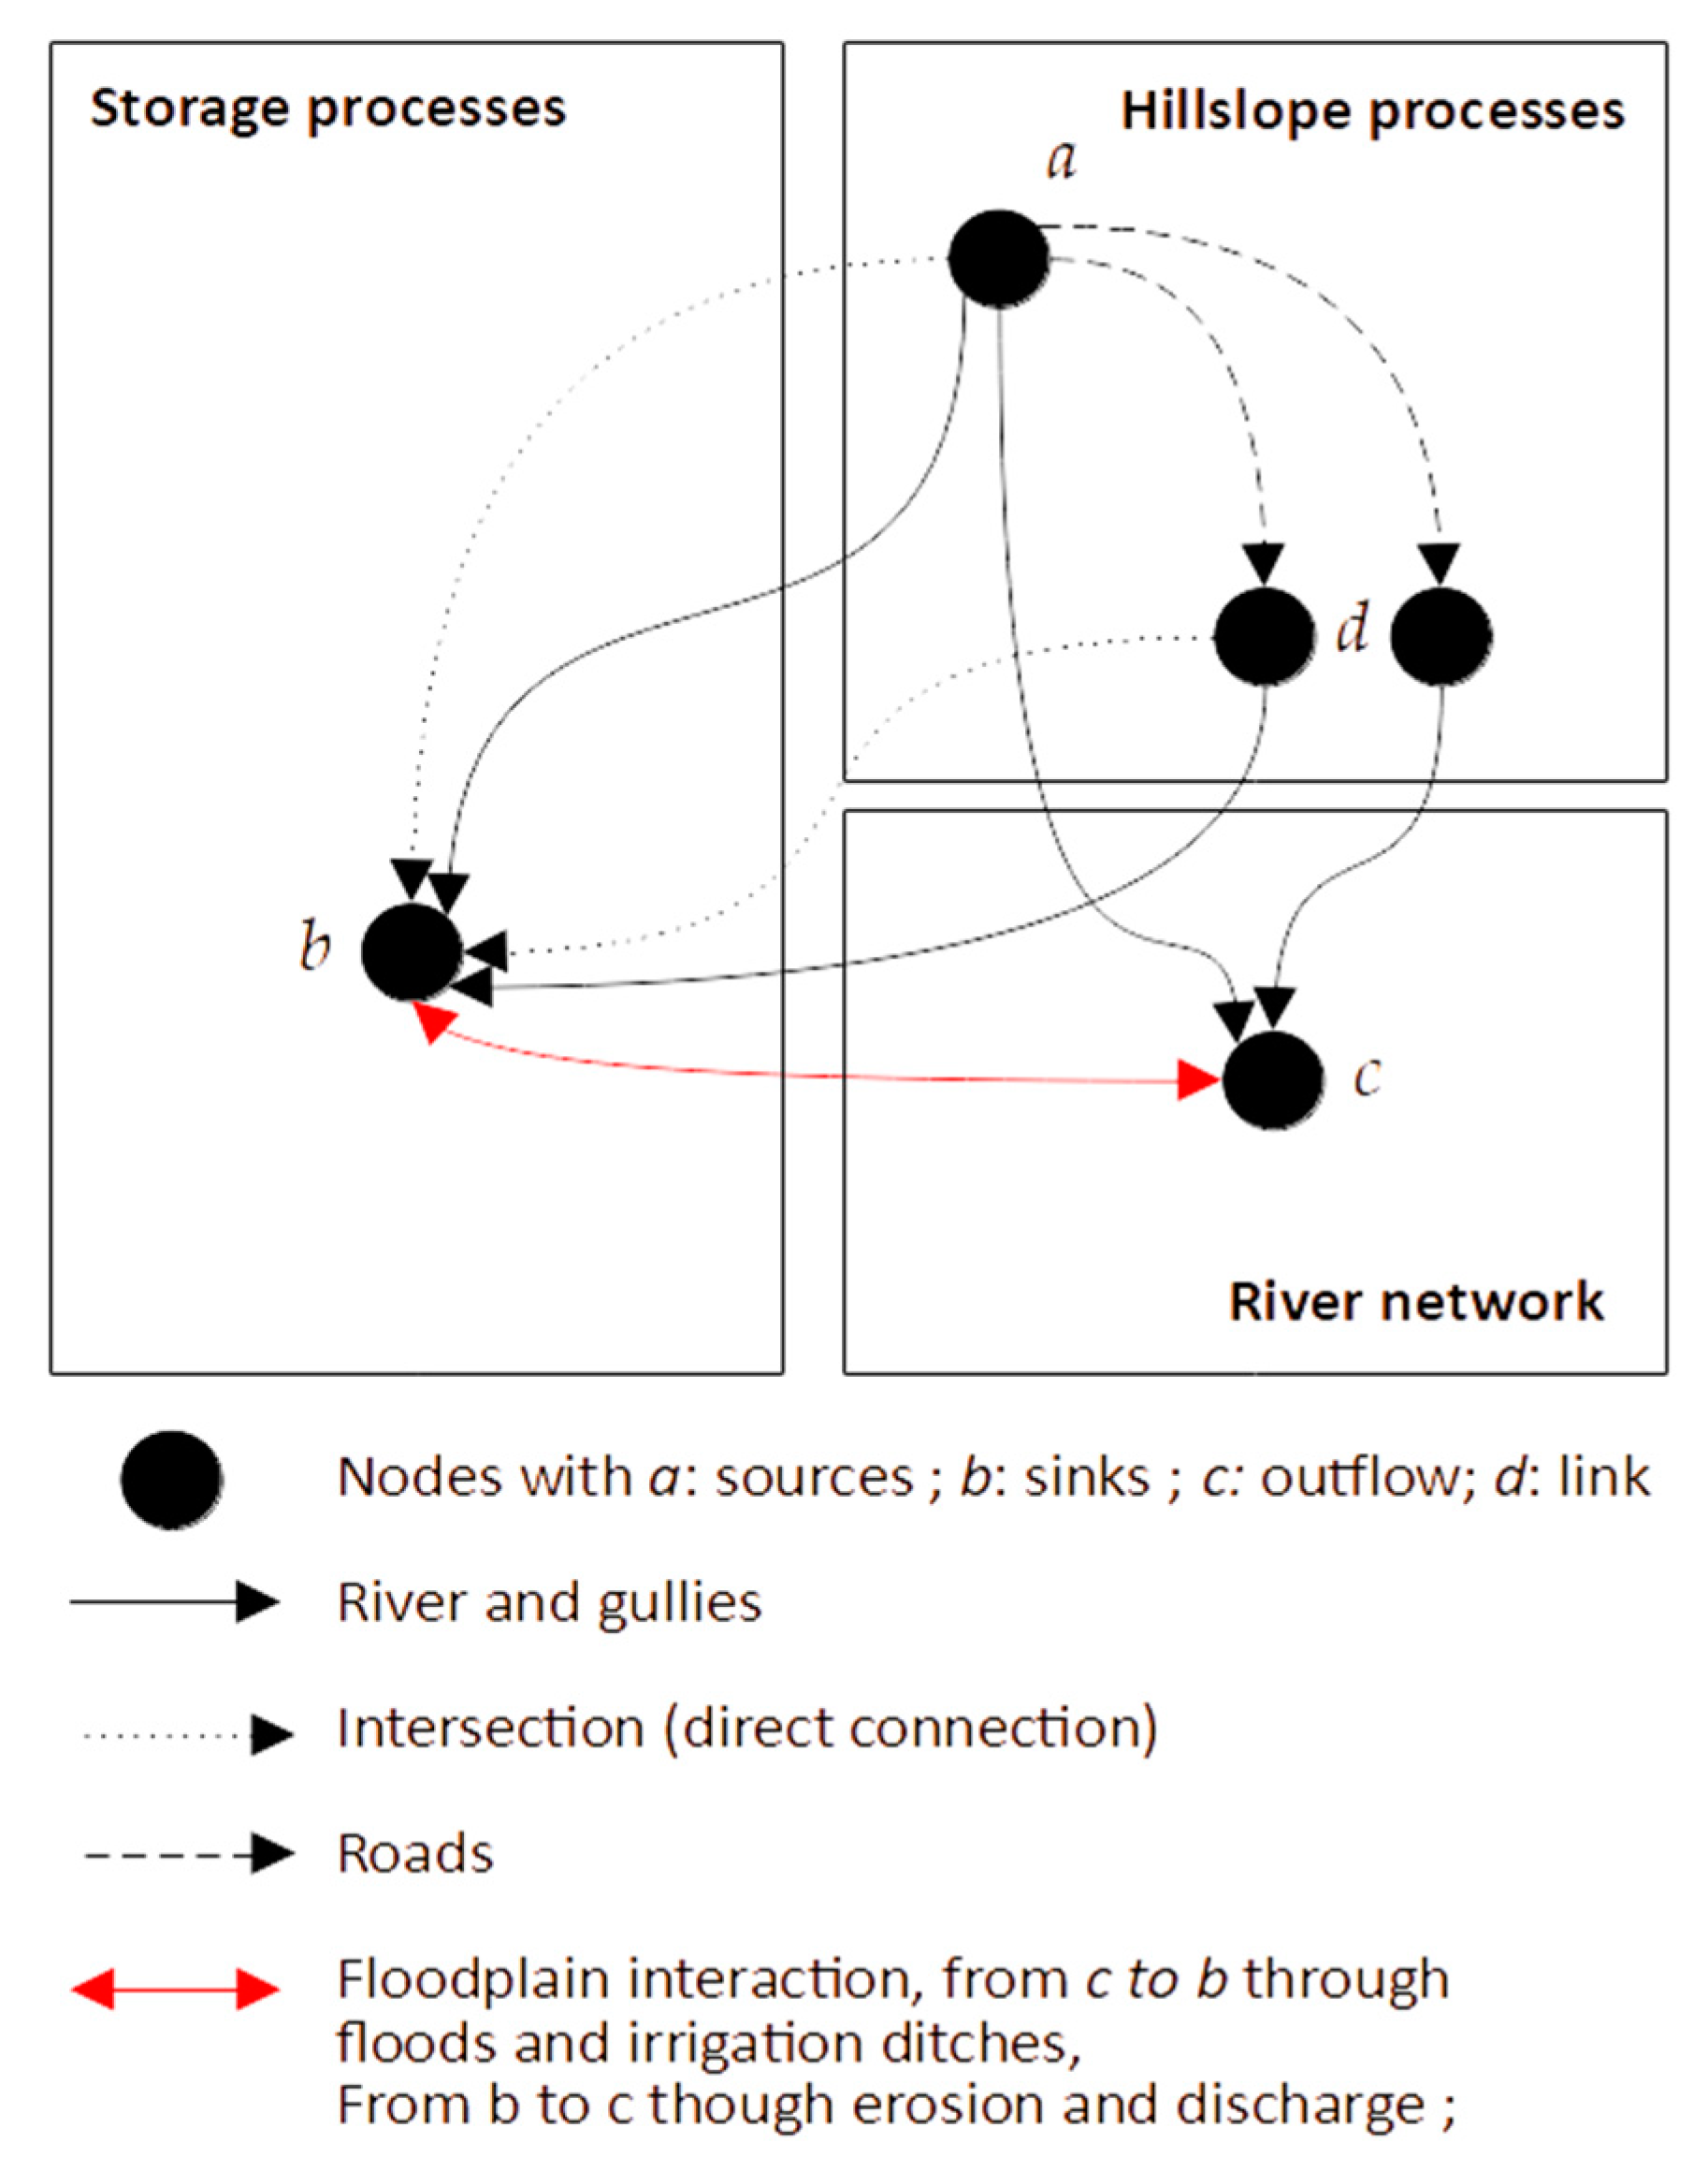
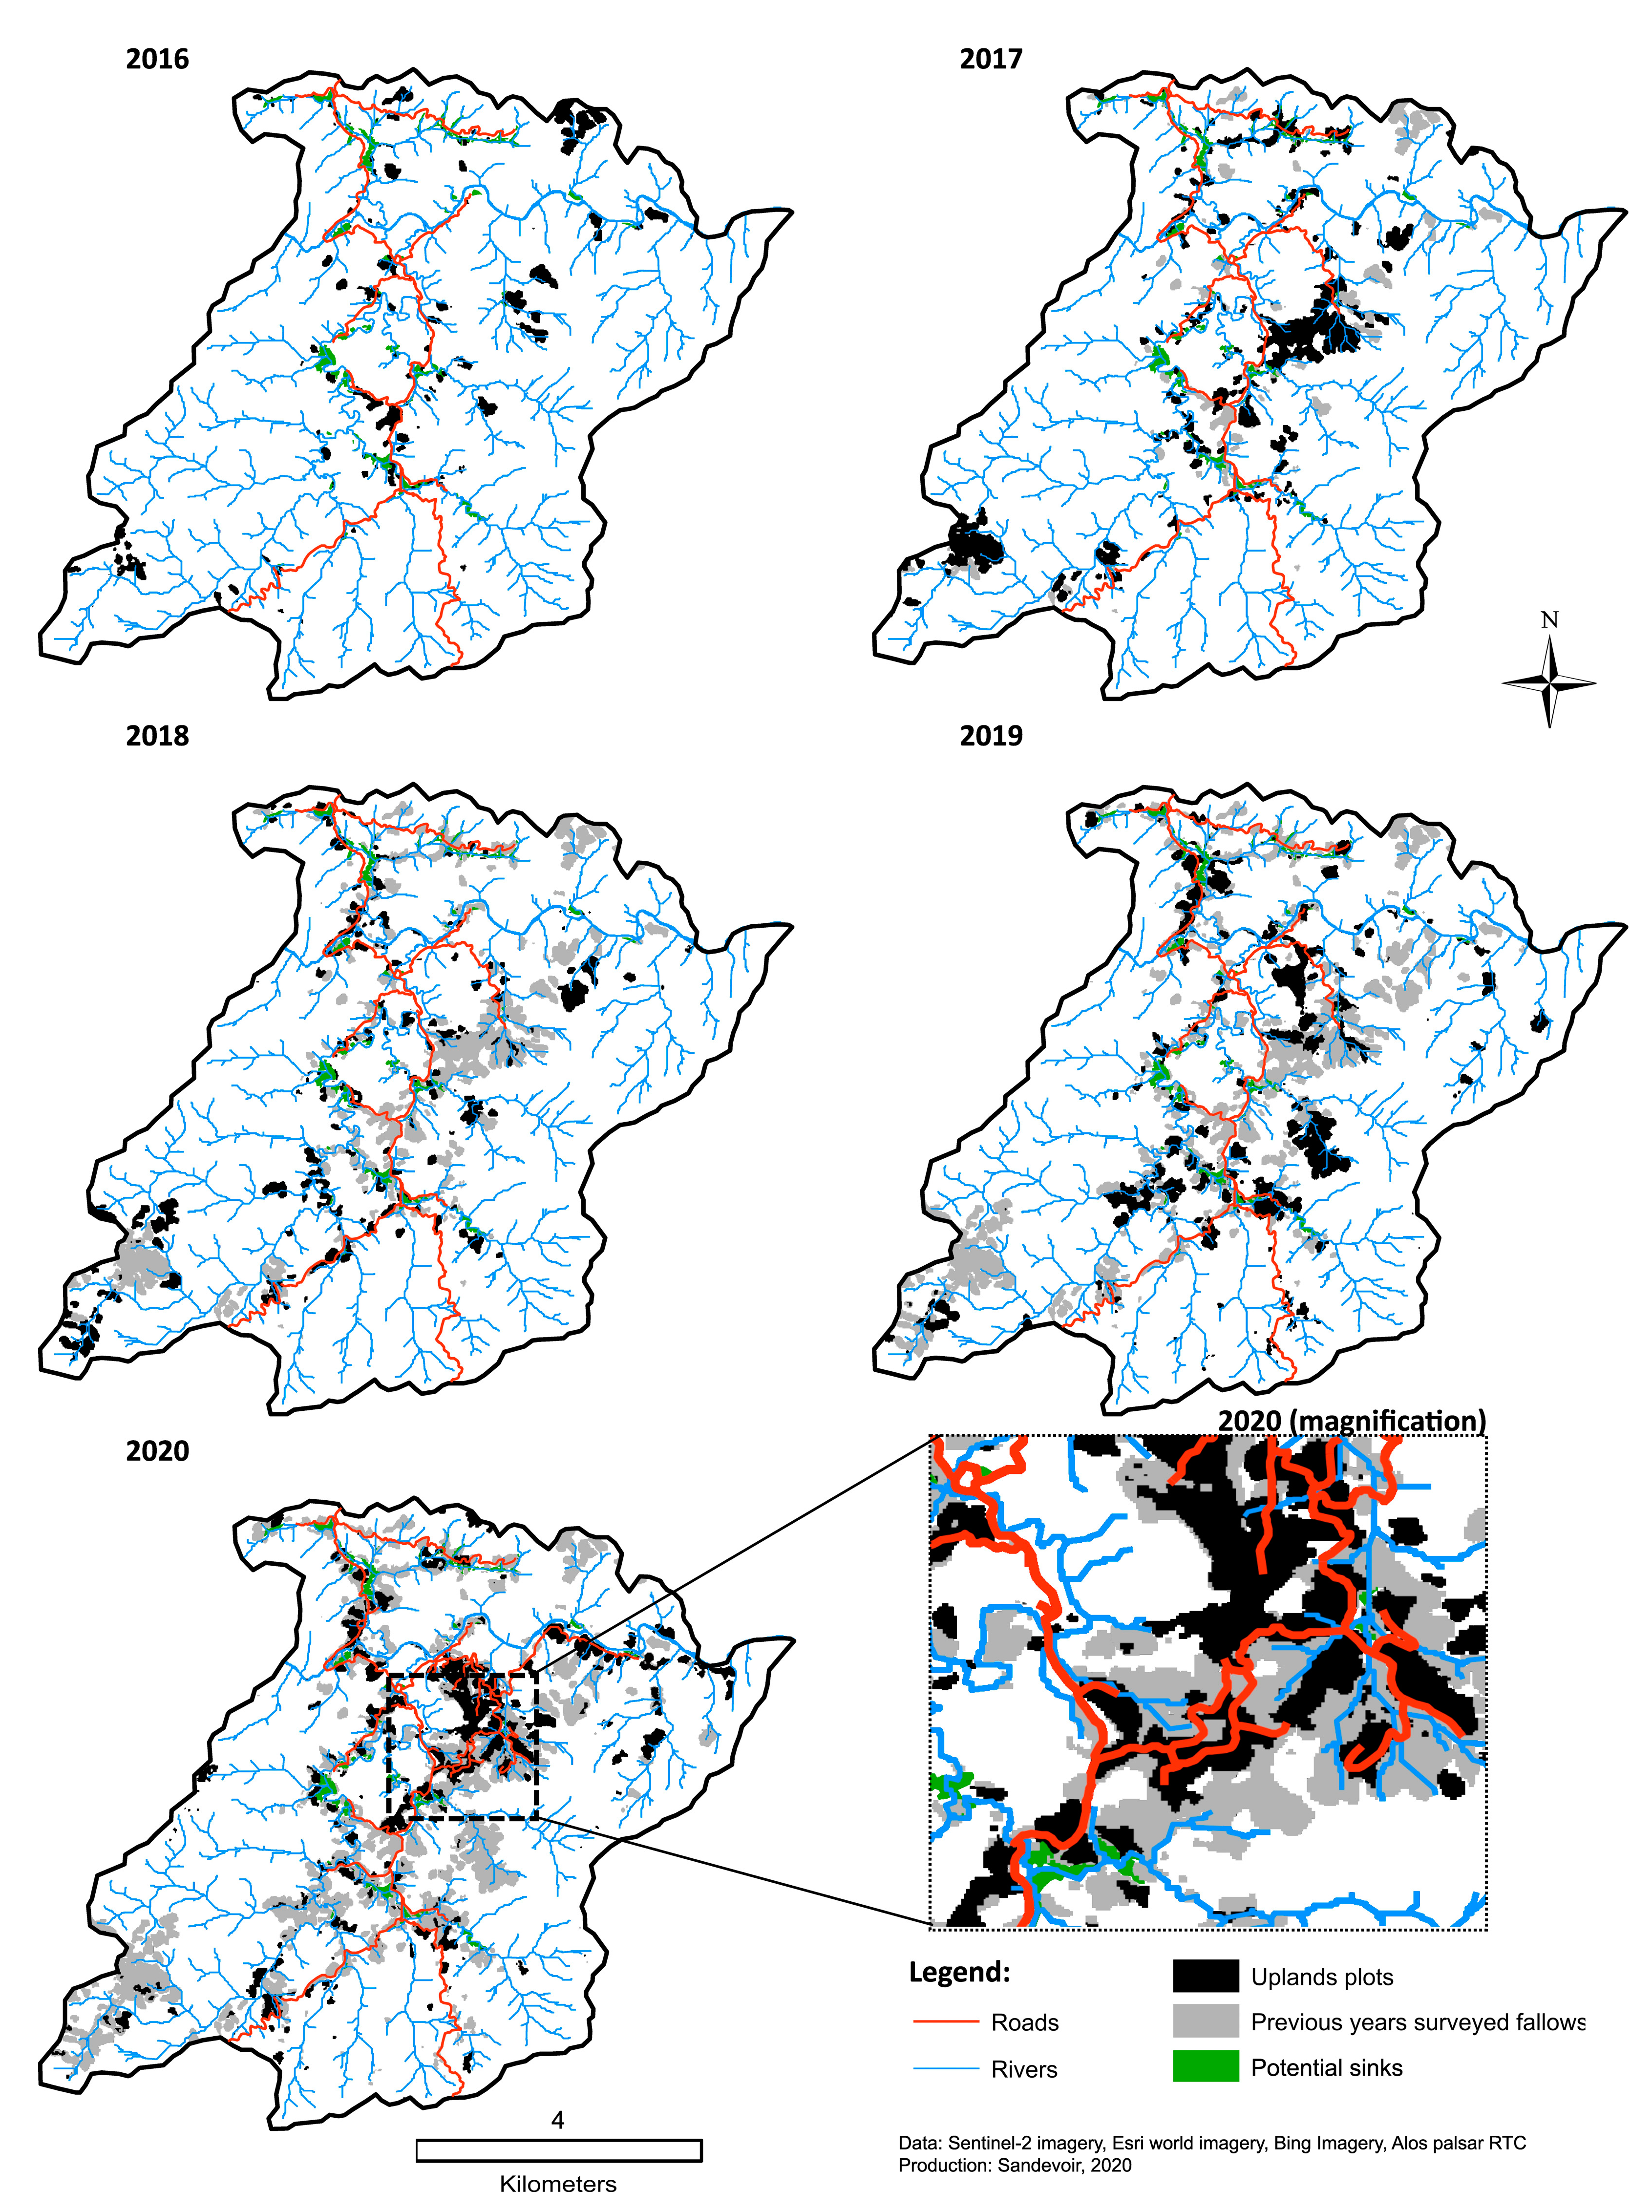
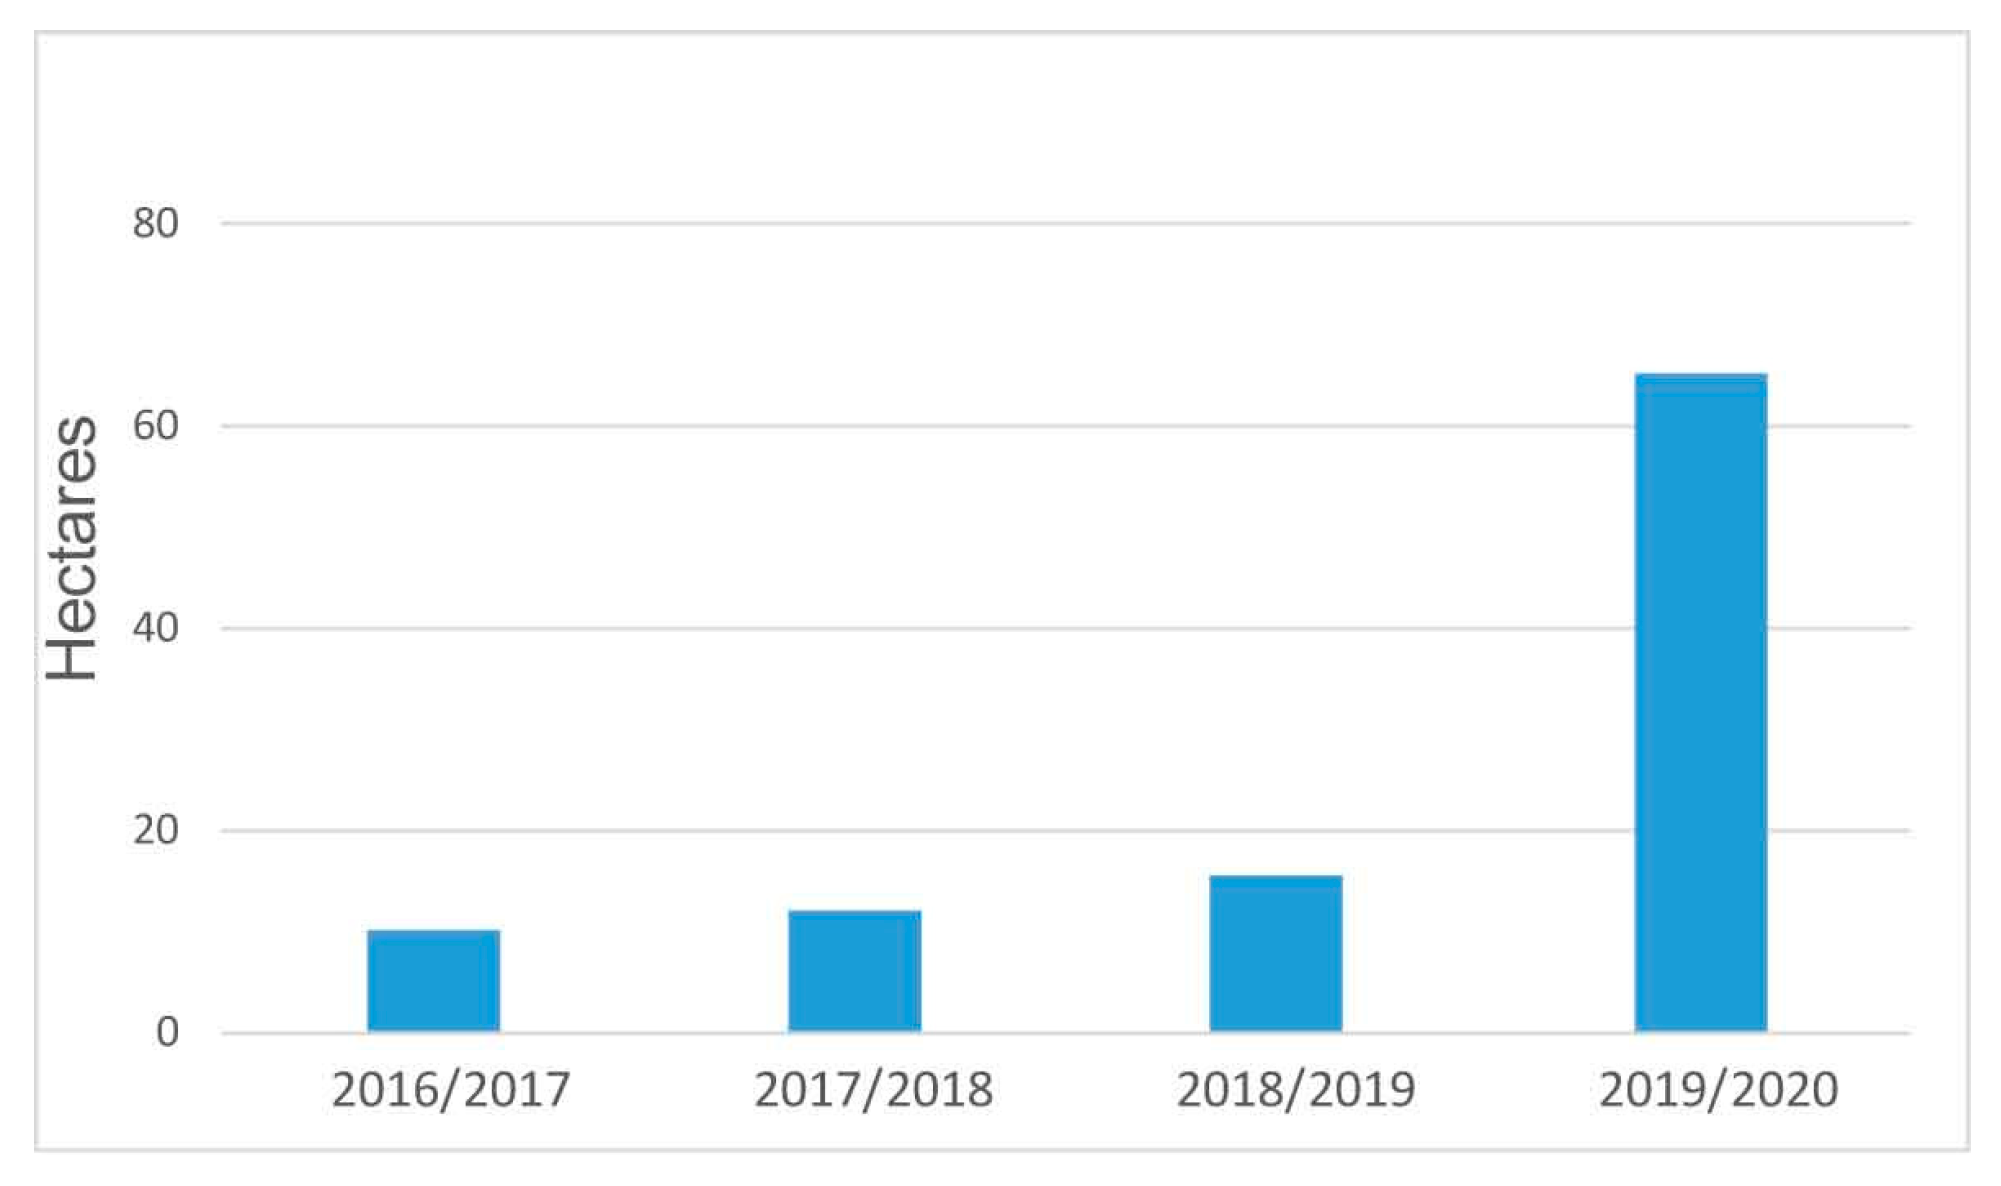
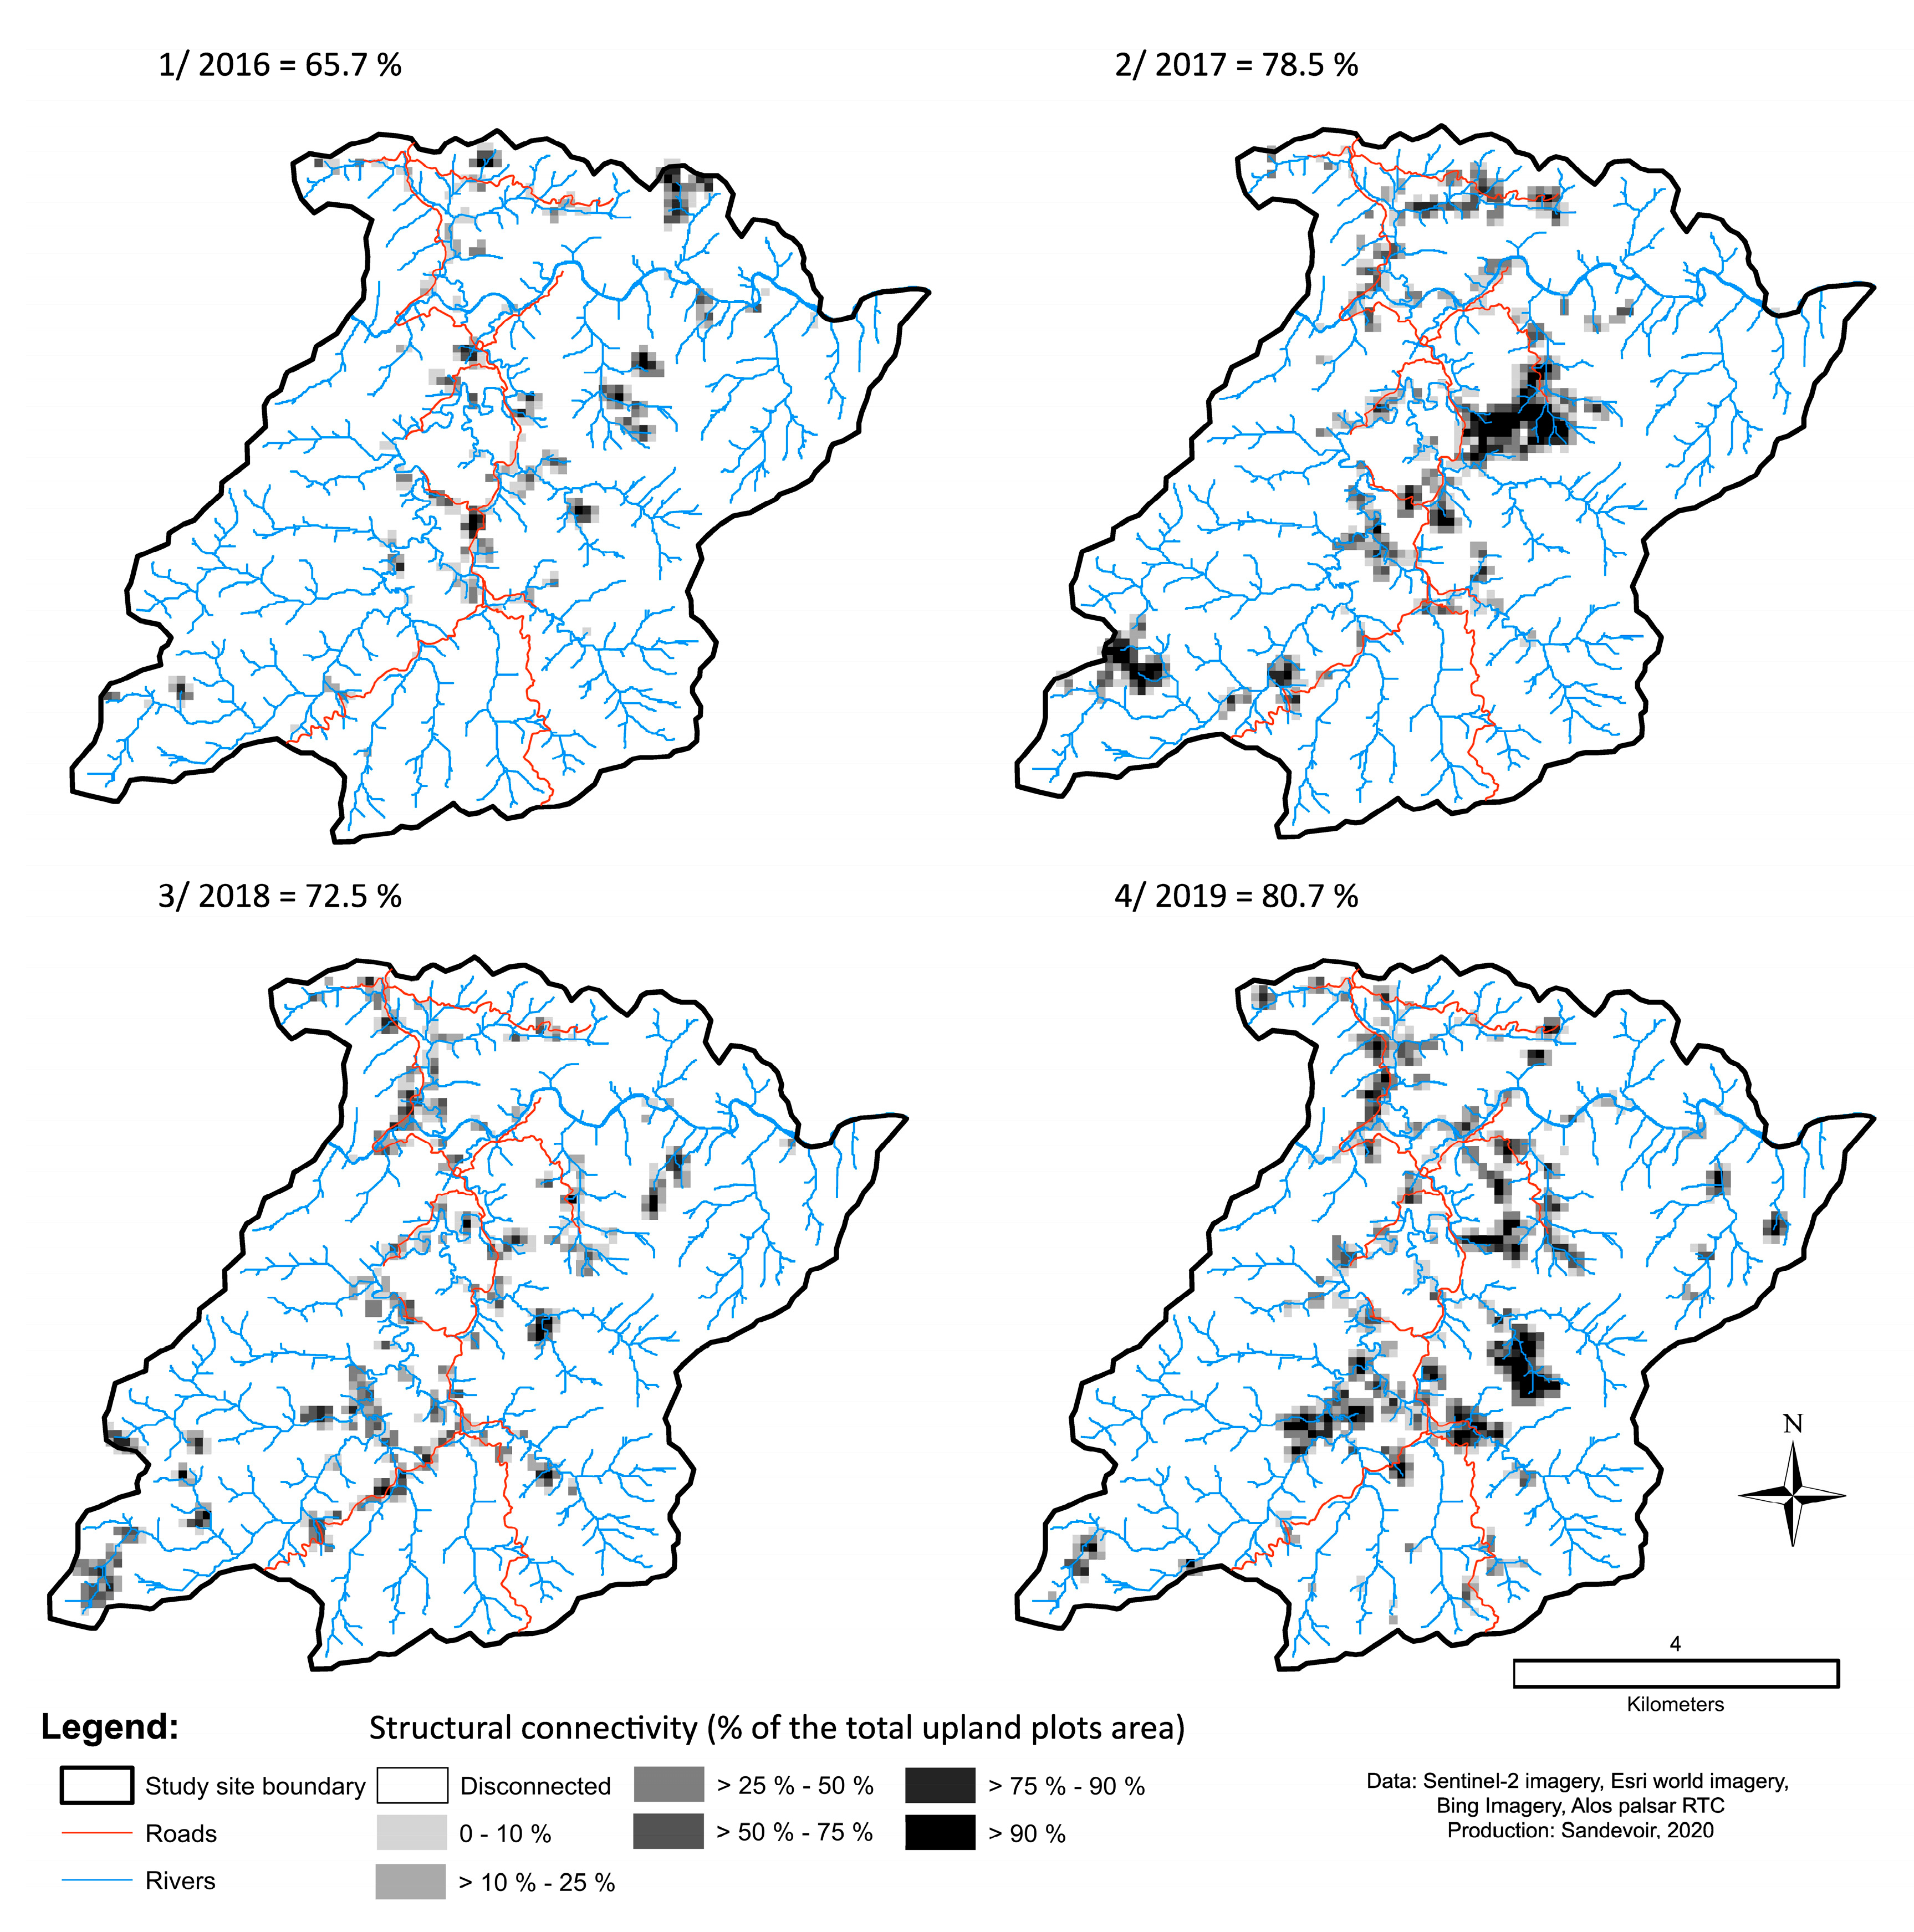
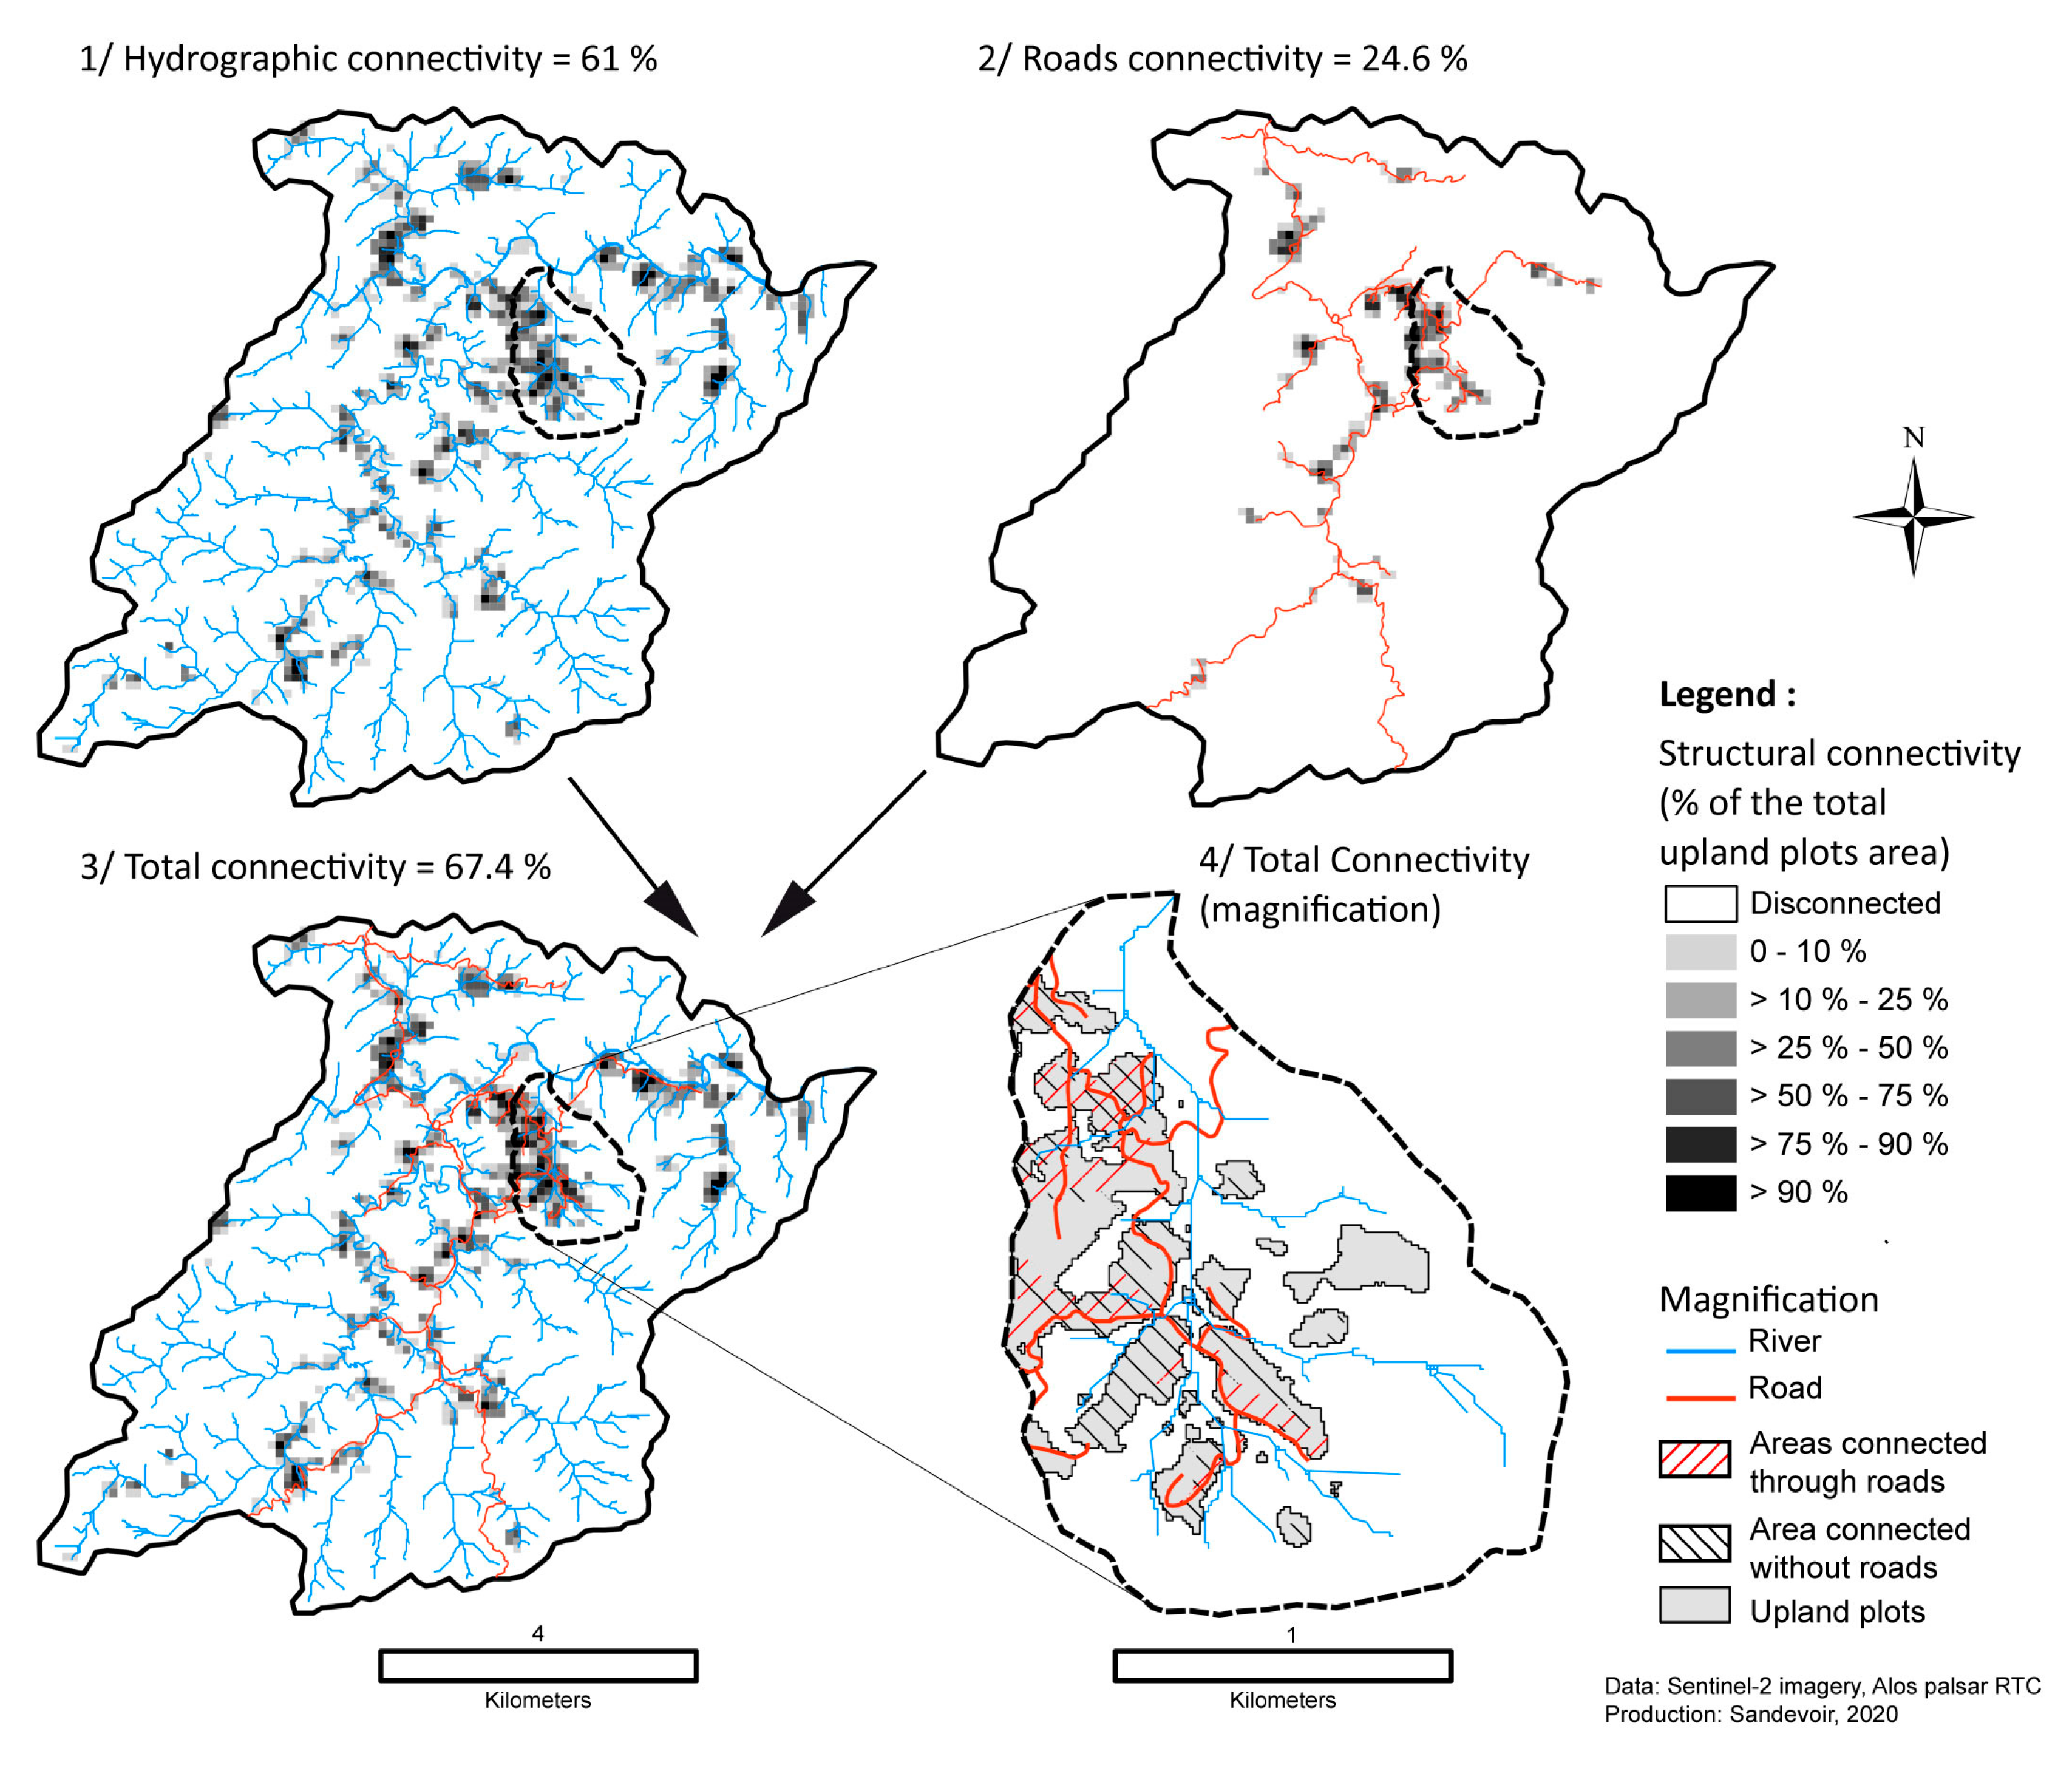
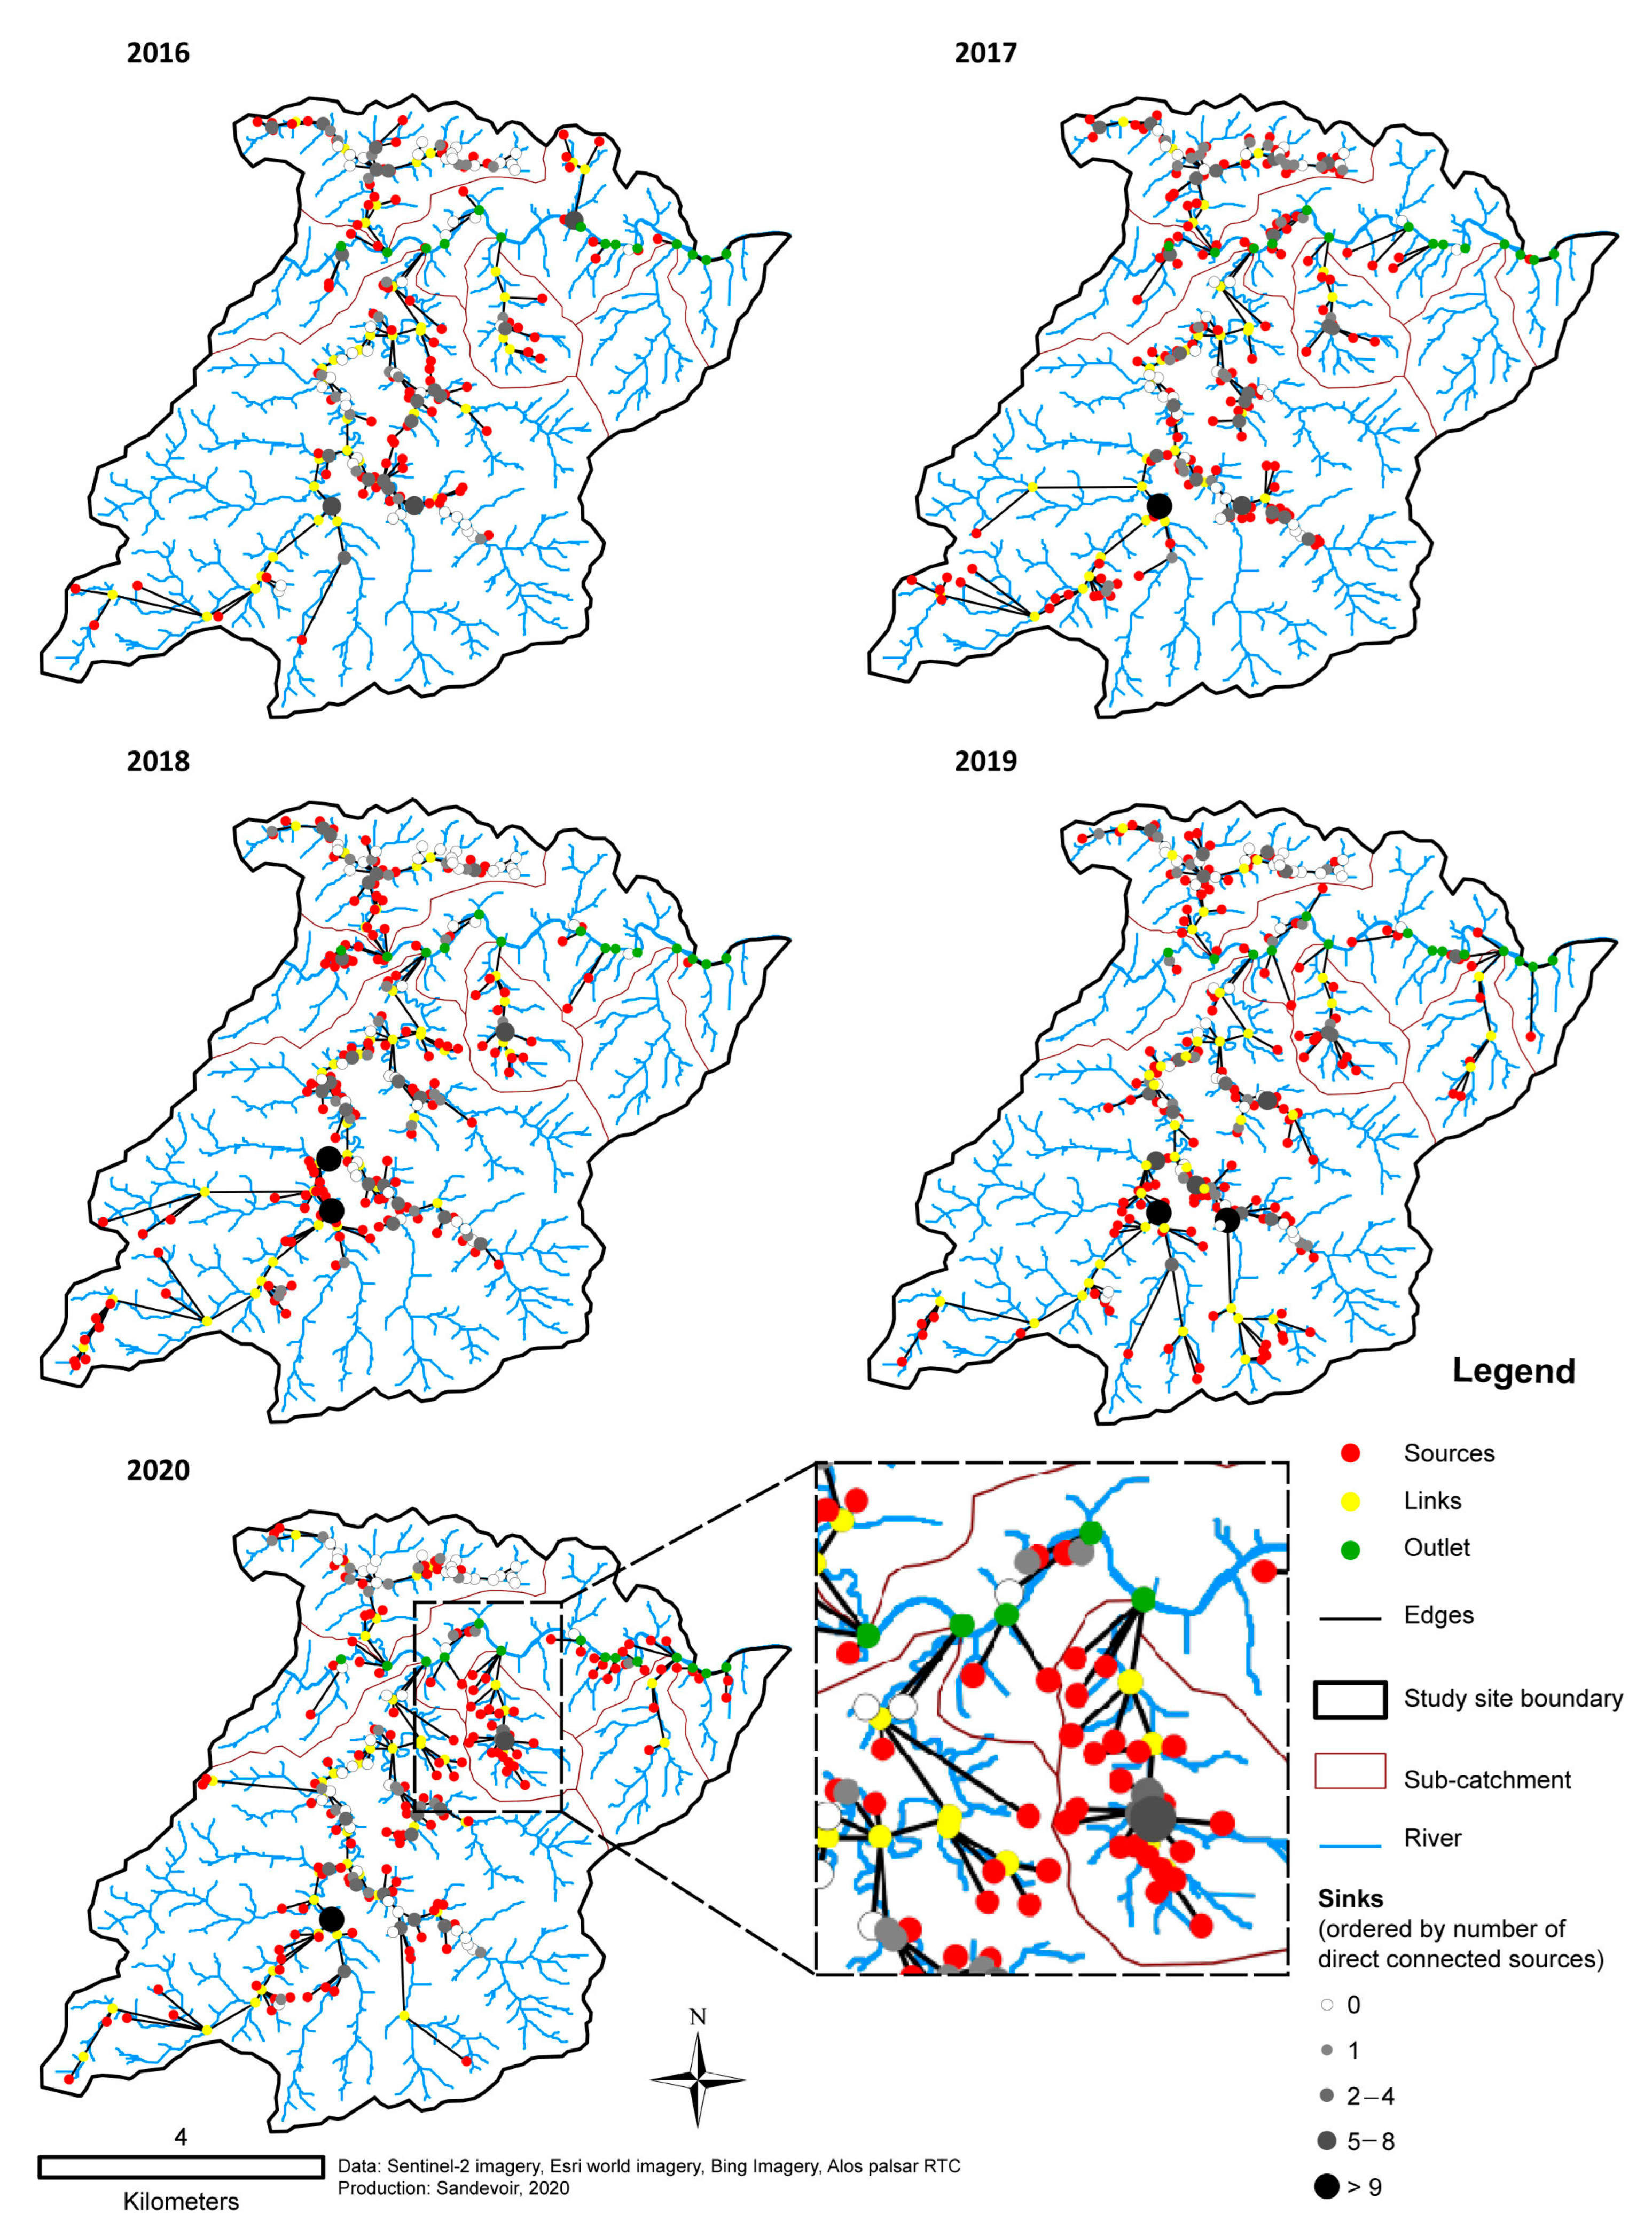
Table 1.
Connection types in the study area.
| Type No. | Connection Type (Picture No. in Figure 7) | Position in Graph (Figure 8) |
|---|---|---|
| 1 | Upland plot → Lowlands sinks (6) | Nodes a to b (intersect) |
| 2 | Upland plot → Gully and rivers → Lowlands sinks (5) | Nodes a to b (rivers and gullies) |
| 3 | Upland plot → Gully and rivers → Outlet (1,4) | Nodes a to c (rivers and gullies) |
| 4 | Upland plot → Roads (slope > 0°) → Lowlands sinks | Nodes a, d, b (intersect) |
| 5 | Upland plot → Roads (slope > 0°) → Gully and rivers → Lowlands sinks | Nodes a, d, b (rivers and gullies) |
| 6 | Upland plot → Roads (slope > 0°) → Gully and rivers → Outlet (3) | Nodes a, d, c (rivers and gullies) |
Table 2.
RF image classification average accuracy matrix in the Houaylack-Vangven area.
| Class No. | Class Name | Validation 1 | Validation 2 | Validation 3 | Validation 4 | Validation 5 | Validation 6 |
|---|---|---|---|---|---|---|---|
| 1 | Upland plots | 92.88 | 2.13 | 5.82 | 0.26 | 3.05 | 0.00 * |
| 2 | Paddy rice plots | 3.28 | 71.91 | 6.19 | 0.00 | 5.22 | 0.00 * |
| 3 | Water | 0.00 | 0.00 | 49.58 | 0.00 | 0.00 | 3.75 * |
| 4 | Forest | 1.29 | 0.50 | 17.34 | 90.35 | 25.59 | 1.25 * |
| 5 | Fallow | 1.91 | 22.87 | 19.63 | 9.39 | 65.47 | 0.00 * |
| 6 | Clouds | 0.63 | 2.60 | 1.43 | 0.00 | 0.67 | 95.00 * |
Table 3.
RF image classification average accuracy matrix for the full scene.
| Class No. | Class Name | Validation 1 | Validation 2 | Validation 3 | Validation 4 | Validation 5 | Validation 6 |
|---|---|---|---|---|---|---|---|
| 1 | Upland plots | 91.22 | 0.49 | 5.83 | 1.34 | 5.23 | 0.74 * |
| 2 | Paddy rice plots | 2.35 | 88.40 | 4.33 | 1.87 | 9.76 | 1.43 * |
| 3 | Water | 1.03 | 0.00 | 63.43 | 2.44 | 0.00 | 6.12 * |
| 4 | Forest | 0.93 | 0.49 | 11.40 | 78.96 | 21.50 | 5.95 * |
| 5 | Fallow | 3.11 | 8.57 | 0.00 | 14.29 | 62.48 | 4.77 * |
| 6 | Clouds | 1.36 | 2.05 | 15.00 | 1.09 | 1.02 | 81.00 * |
* Average calculated over years with clouds, 2016 and 2017 for Houaylack-Vangven area, 2016, 2017, 2018, and 2019 for the full scene; 2020 imagery was cloudless.
Table 4.
Houaylack-Vangven shifting cultivation extension, 2016–2020.
| Y | Uplands Plots (ha) | % of the Study Area |
|---|---|---|
| 2016 | 130.0 | 2.6 |
| 2017 | 271.8 | 5.3 |
| 2018 | 202.6 | 3.9 |
| 2019 | 309.1 | 6 |
| 2020 | 320.2 | 6.2 |
Table 5.
Houaylack-Vangven rotation features, 2016–2020.
| Successive Years under Cultivation | Area (ha) | Share (%) |
|---|---|---|
| 1 | 901.4 | 89.9 |
| 2 | 92.9 | 9.3 |
| 3 | 6.3 | 0.6 |
| 4 | 2.1 | 0.2 |
| 5 | 0.2 | 0 |
| Total | 1002.9 | 100 |
Table 6.
Area by structural connectivity growth type since 2016.
| Connections (All Classes) | 2016 | 2017 | 2018 | 2019 | 2020 |
|---|---|---|---|---|---|
| Uplands plots total area (ha) | 130.0 | 271.8 | 202.6 | 309.1 | 320.2 |
| Sources connections (ha) | 85.4 | 213.5 | 146.8 | 249.3 | 215.9 |
| Sources connections (%) | 65.7 | 78.5 | 72.5 | 80.7 | 67.4 |
| Sinks total area (ha) * | 51.7 | 51.7 | 51.7 | 51.7 | 51.7 |
| Sinks connections (ha) | 43.1 | 51.0 | 45.7 | 48.9 | 44.6 |
| Sinks connections (%) | 83.4 | 98.7 | 88.5 | 94.6 | 86.2 |
| Mean plots size (ha) | 1.02 | 1.87 | 1.12 | 1.28 | 1.1 |
* Sinks identified; we presuppose constant sink surfaces.
Table 7.
Area.
| Sources’ Connections by Class ** (% of the Total Connected Sources) | 2016 | 2017 | 2018 | 2019 | 2020 |
|---|---|---|---|---|---|
| Class 1 | 7.3 | 13.6 | 9.8 | 9.2 | 11.3 |
| Class 2 | 87.6 | 91.7 | 85.5 | 88.4 | 68.4 |
| Class 3 | 93.5 | 93.3 | 93.7 | 93.7 | 83.9 |
| Class 4 | 1.1 | 1.1 | 0.4 | 0.9 | 2.6 |
| Class 5 | 14.8 | 17.2 | 14.5 | 16.8 | 34.5 |
| Class 6 | 14.8 | 17.2 | 14.5 | 16.8 | 36.4 |
** all classes are listed in Table 1, only classes 1, 2, 4, and 5 refer to sink connections.
Table 8.
Area.
| Sinks’ Connections by Class (% of the Total Identified Sinks) | 2016 | 2017 | 2018 | 2019 | 2020 |
|---|---|---|---|---|---|
| Class 1 | 54.3 | 51.9 | 50.1 | 70.8 | 60.2 |
| Class 2 | 80.9 | 97.2 | 86.8 | 93.8 | 87.2 |
| Class 4 | 9.0 | 6.9 | 2.5 | 5.8 | 3.9 |
| Class 5 | 62.4 | 80.3 | 55.8 | 73.9 | 65.8 |
Disclaimer/Publisher’s Note: The statements, opinions and data contained in all publications are solely those of the individual author(s) and contributor(s) and not of MDPI and/or the editor(s). MDPI and/or the editor(s) disclaim responsibility for any injury to people or property resulting from any ideas, methods, instructions or products referred to in the content. |
© 2023 by the authors. Licensee MDPI, Basel, Switzerland. This article is an open access article distributed under the terms and conditions of the Creative Commons Attribution (CC BY) license (https://creativecommons.org/licenses/by/4.0/).
Share and Cite
MDPI and ACS Style
Sandevoir, L.; Lespez, L.; Lissak, C. A Connectivity Approach to Agricultural Diffuse Pollution in Tropical Montane Catchments Dominated by Swidden Landscapes. Land 2023, 12, 784. https://doi.org/10.3390/land12040784
AMA Style
Sandevoir L, Lespez L, Lissak C. A Connectivity Approach to Agricultural Diffuse Pollution in Tropical Montane Catchments Dominated by Swidden Landscapes. Land. 2023; 12(4):784. https://doi.org/10.3390/land12040784
Chicago/Turabian StyleSandevoir, Luc, Laurent Lespez, and Candide Lissak. 2023. "A Connectivity Approach to Agricultural Diffuse Pollution in Tropical Montane Catchments Dominated by Swidden Landscapes" Land 12, no. 4: 784. https://doi.org/10.3390/land12040784
Note that from the first issue of 2016, this journal uses article numbers instead of page numbers. See further details here.