Article

The Evolution of the Waterfront Utilization and Sustainable Development of the Container Ports in the Yangtze River: A Case Study of the Yangtze River Delta

1
Nanjing Institute of Geography and Limnology, Chinese Academy of Sciences, Nanjing 210008, China
2
Key Laboratory of Watershed Geographic Sciences, Nanjing Institute of Geography and Limnology, Chinese Academy of Sciences, Nanjing 210008, China
*
Author to whom correspondence should be addressed.
Land 2023, 12(4), 778; https://doi.org/10.3390/land12040778
Submission received: 15 February 2023 / Revised: 22 March 2023 / Accepted: 27 March 2023 / Published: 29 March 2023
(This article belongs to the Special Issue Regional Sustainable Development of Yangtze River Delta, China)

Abstract

:
Waterfront resources are an important support system for the social and economic development within the region along the Yangtze River. Container ports are an important component of the Yangtze River port system, as well as for the growth point of waterfront utilization. Based on the summary of remote sensing images and relevant data, this paper calculates the waterfront utilization of the container ports along the Yangtze River in the Yangtze River Delta (YRD), analyzes the waterfront organization pattern and change characteristics, and puts forward the enlightenment and countermeasures for the sustainable development of the port waterfronts. Extending the study of port resources from coastal areas to inland areas is an academic contribution of this paper. At the same time, it has practical significance for the high-quality development of port and shipping and the development and protection of land resources along the Yangtze River. In the YRD, the waterfront utilization of container ports has increased along the Yangtze River, showing a decrease from downstream to upwards, and it has formed dense zones attached to the central cities and major manufacturing bases. The ports with higher length of waterfront are mostly located in the shipping central cities and the Yangtze River estuary. The development direction of container ports is large-scale and specialized. The utilization of the container port waterfront is approaching the periphery of the city and areas with convenient transportation. The utilization of container port shorelines will be close to the periphery of the city and convenient transportation areas. The container port waterfronts occupy the ecological reserve, and the conflicts are expanding with the development of shipping, mainly distributed in the Yangtze River estuary. Based on the empirical analysis, this paper puts forward four enlightenments. First, the exploitation and utilization of the port waterfront has experienced multiple stages of “exploitation—conflict—mitigation”. With the transformation of productive waterfront utilization, the pattern of sustainable development along the Yangtze River has changed. Secondly, the conflict between waterfront utilization and protection is inevitable. Additionally, it is necessary to face up to the temporary rapid rise of encroachment on the reserve. Third, through the horizontal coordination of the port system along the river, the original focus on the hub cities will be transferred to the comprehensive consideration of the port cities in the whole region, and the waterfront load of different types of container ports can be balanced. Fourth, the Yangtze River Delta integration mechanism can solve the barriers between higher and lower levels or between different departments and cities.

1. Introduction

Ports are gateways for countries and regions to access international trade, and more than 90% of goods in transnational transportation are transported by shipping. As the global trading system changes and the vertical integration of production and distribution continues to improve, the form of international trade has shifted from traditional cargo transportation to cross-border flow and allocation of multiple production factors, such as capital, technology, information, and talent. By participating in global production and circulation, the scale and function of the port system have changed, resulting in new freight modes and port divisions [1,2]. Ports are not only transshipment sites for transporting goods between land and water, but they are also important nodes in the global logistics system where a large number of derivative services gather [3,4]. By establishing a unified transportation and service network between countries and regions [5,6], nowadays, the global supply chain based on ports is seen as an undeniable force in changing the world political and economic order [7]. In this process, the widespread use of containers has driven suppliers to use standardized modules for transportation [8,9]. After the 1980s, new container ports have been built, or existing ports have been renovated around the world to enable them to operate containers, gradually forming a multi-level container port system covering all regions of the world [10,11].
As the intersection and overlap between ports and hinterlands intensify, inland waterway transport generates more economic activities, and it stimulates the agglomeration of derivative services through the contact advantage of multiple inland nodes. A new stage of regionalization has emerged in the evolution of the port system [12], with the starting point of container shipping extending from coastal areas to inland areas [13,14]. Coastal and inland transportation networks jointly drive the evolution of port systems [15,16]. As the inland transportation service system becomes complex and the proportion of inland logistics costs in total costs continues to rise [17], the focus of the logistics industry development has shifted to inland regions. In this process, container transportation utilizes its cost advantage of convenient transshipment among various transportation modes to connect different types of ports along the river [18], promoting the economies of scale and economies of scope that integrate coastal areas and inland areas. Inland ports change the regional pattern of single external shipping exports by connecting to container liners and undertaking hinterland cargo flows [19,20], There are multi-level hub ports in the inland areas, which has promoted the rapid growth of container ports along the river.
The Yangtze River is an important part of the “T” layout of China’s territorial development [21], making it play an important role in the national transportation pattern. By combining the huge container throughput of seaports, especially Shanghai and Ningbo, with inland waterway corridors, the layout of transshipment hubs along the river expands to the hinterland range and achieves logistic accessibility [22,23]. In 2020, the container freight volume along the Yangtze River accounted for more than 60% of the national inland rivers. The development of inland waterway transport means the restructuring of the scale and functions of ports along the Yangtze River, the navigation capacity of the Yangtze waterway, and the industrial layout along the river, leading to changes in the relationship between the development and protection of various resources [24,25,26], and the issue of sustainable development of ports is becoming important. Resource and environmental issues may arise when port shipping reaches a certain stage of development [27], which also caused various stakeholders to gradually move from conflict to collaboration [28]. Through academic research and practical processes, it is recognized that ecological regulation is a prerequisite for the construction and operation of logistics infrastructure, which can effectively reduce negative environmental externalities [29,30].
As a crucial space carrier of port, port construction is inseparable from the waterfront resource, which is the essential productive factor and most basic component of the port [31], and it has been used as a potential resource for people and developing for hundreds of years for its abundant natural resources that support human life and certain industries [32,33,34]. For a long time, the waterfront was not mentioned or studied as an independent resource, but it is contained in a large number of coastal zone studies and the protection of resources. With the utilization of marine resources and coastal problems, such as pollution, overexploitation, habitat degradation, and erosion [35,36,37], integrated coastal zone management (ICZM) was issued as a response. It was implemented through the US Coastal Zone Management Act, which was promulgated in 1972, and coastal management was given general and worldwide consideration following the publication of UNCED Agenda 21, adopted at the United Nations Conference on Environment and Development in 1992 [38,39]. A large and growing proportion of international studies have been made mainly using the “3S” technology for the extraction and precision evaluation of coastline, the protection and management of waterfronts [40,41,42], as well as the utilization and revitalization of urban waterfronts [43,44]. As for China, remarkable achievement has been made in developing along the coast and the Yangtze River under the “T”-shaped spatial pattern development policy, making waterfront resources receive ever-higher attention for the vital role which is played in supporting the development of economic axis, especially the Yangtze River Economic Belt [45,46]. The waterfront of the Yangtze River becomes an indispensable part of domestic studies, focusing on the spatial and temporal change, waterfront evaluation, and resource management.
There has been a long-term trend for cities along coasts and rivers to rely on the port to proceed communication globally and bring local economic growth and prosperity [47]. As the vital position of ports is pushing forward the national economy and promoting circulation, the settlement and development of ports are some of the most important socio-economic activities in coastal and riverside zones [48,49,50]. The utilization of port waterfronts has effectively promoted the economic development of cities and areas, which stimulated the demand of scale expansion, on the contrary, and even promoted the emergence of new ports in the region. In pursuit of transport efficiency and scale economy, many port cities decided to add more terminal capacity and explored more waterfront resources for construction [51], and container ports have become an important support for the development of economy and foreign trade of port cities due to the particularity of the container transportation mode [52]. The ever-larger ships [53], growing shipping traffic [54], and port expansions call for more and more port waterfronts continuously, while the total amount of which are suitable for port utilization is limited and highlighted constantly for their scarcity, as well as their notable value; in the meantime, the land-use and land-cover change in waterfronts can be greatly changed once the port is constructed for the utilization of waterfront resources as carriers, and a high density of anthropogenic activities and land use changes can have significant impacts on the dynamics of both the ecosystem services value and ecosystem functions of the primordial waterfront resource [55,56,57], while the effectiveness of anthropic interventions for reducing adverse environmental impacts caused by port utilization are considered to be a great challenge [58]. Furthermore, since the 2000s, many initiatives, including “sustainable port”, “ecoport”, and “green port”, have been proposed due to pressure from sustainability issues, port authorities, and organizations, and research institutes have actively undertaken efforts to coordinate the relationship between the development and protection of port waterfront resources. Yet, the studies on the port waterfront take specific ports as research regions in general, and researchers take port waterfronts as research subjects, mainly consisting of the evaluation of suitability [59,60], evaluation of port waterfront utilization patterns [61,62,63], and valuation [64,65].
Therefore, as the combination and transition zone between water and land, the coastal and riverside zone are considered among the most exploited, inhabited, and threatened areas in the world [66,67] due to the geographic location, making its management a challenge [68]. Effective planning and management are the preconditions for sustainable development [69]. The waterfront is an important part of coastal and riverside regions and resources; scientific management can promote whole area development.
With the wide waterway of the Yangtze River, the Yangtze River Delta (YRD) has an inland port group of the most densely distributed and largest throughputs nationwide. The 12.5 m deep waterway from Nanjing to the Yangtze estuary is completed, meeting the navigation requirements of 50,000-ton seagoing vessels. In 2020, except for Shanghai, the container throughput of inland ports, such as Suzhou, Nantong, Nanjing, and Wuhu, all exceeded 1 million TEU, and the container throughput of the Yangtze mainstream ports in the Yangtze River Delta accounted for nearly 80% of the total container throughput of the Yangtze mainstream. The rapid development of container shipping began in 2000, and the revitalization of the “golden waterway” and the development of water transportation have become important strategies for national transportation development. After 2010, with the industrial transfer, container transportation has entered more inland areas. In 2015, the Chinese government stepped up conservation of the Yangtze River and stopped its over-development. Reasonable development and protection have become the core issues that various economic activities in the Yangtze River need to explore at present [70]. The port waterfront is the key area for strict management and control to achieve sustainable development. Under the above background, it is urgent to carry out investigation and research on container ports. This paper calculates the waterfront utilization and development trend of container ports in the YRD since 2010 by using high-resolution remote sensing image data and combining relevant information, and it discusses the sustainable development countermeasures of container ports, with a view of providing case support for optimizing the Yangtze River port system and improving the ecological environment protection of the Yangtze River. The first section is the introduction, the second section is the research preparation, the third section is the analysis of the container port waterfront patterns, the fourth section is the enlightenment and countermeasures for the sustainable development of the port waterfront, and the fifth section is the conclusion.

2. Research Preparation

2.1. Research Objectives

This study’s core objectives are as follows. First, this paper selects the ports that have participated in container shipping since 2010 by combining high-definition remote sensing images and industrial and commercial information data of port enterprises, and it collects their geographical location, waterfront utilization, and land area width. Secondly, it analyzes the quantity and spatial distribution characteristics of waterfront utilization of container ports since 2010, the relationship between container port and cities, the changes of port external traffic convenience, and the occupation of container port waterfront to ecological reserve. Finally, the paper discusses the enlightenment and countermeasures for the sustainable development of the Yangtze River container port, explains the utilization stage of the port waterfront, judges the changes in the exploitation and protection relationship at different stages, analyses the main causes of the increasing of port waterfront, and puts forward the way to realize the integration of the supply of the container ports and the sustainable utilization of waterfront resources in the Yangtze River (Figure 1).

2.2. Methods

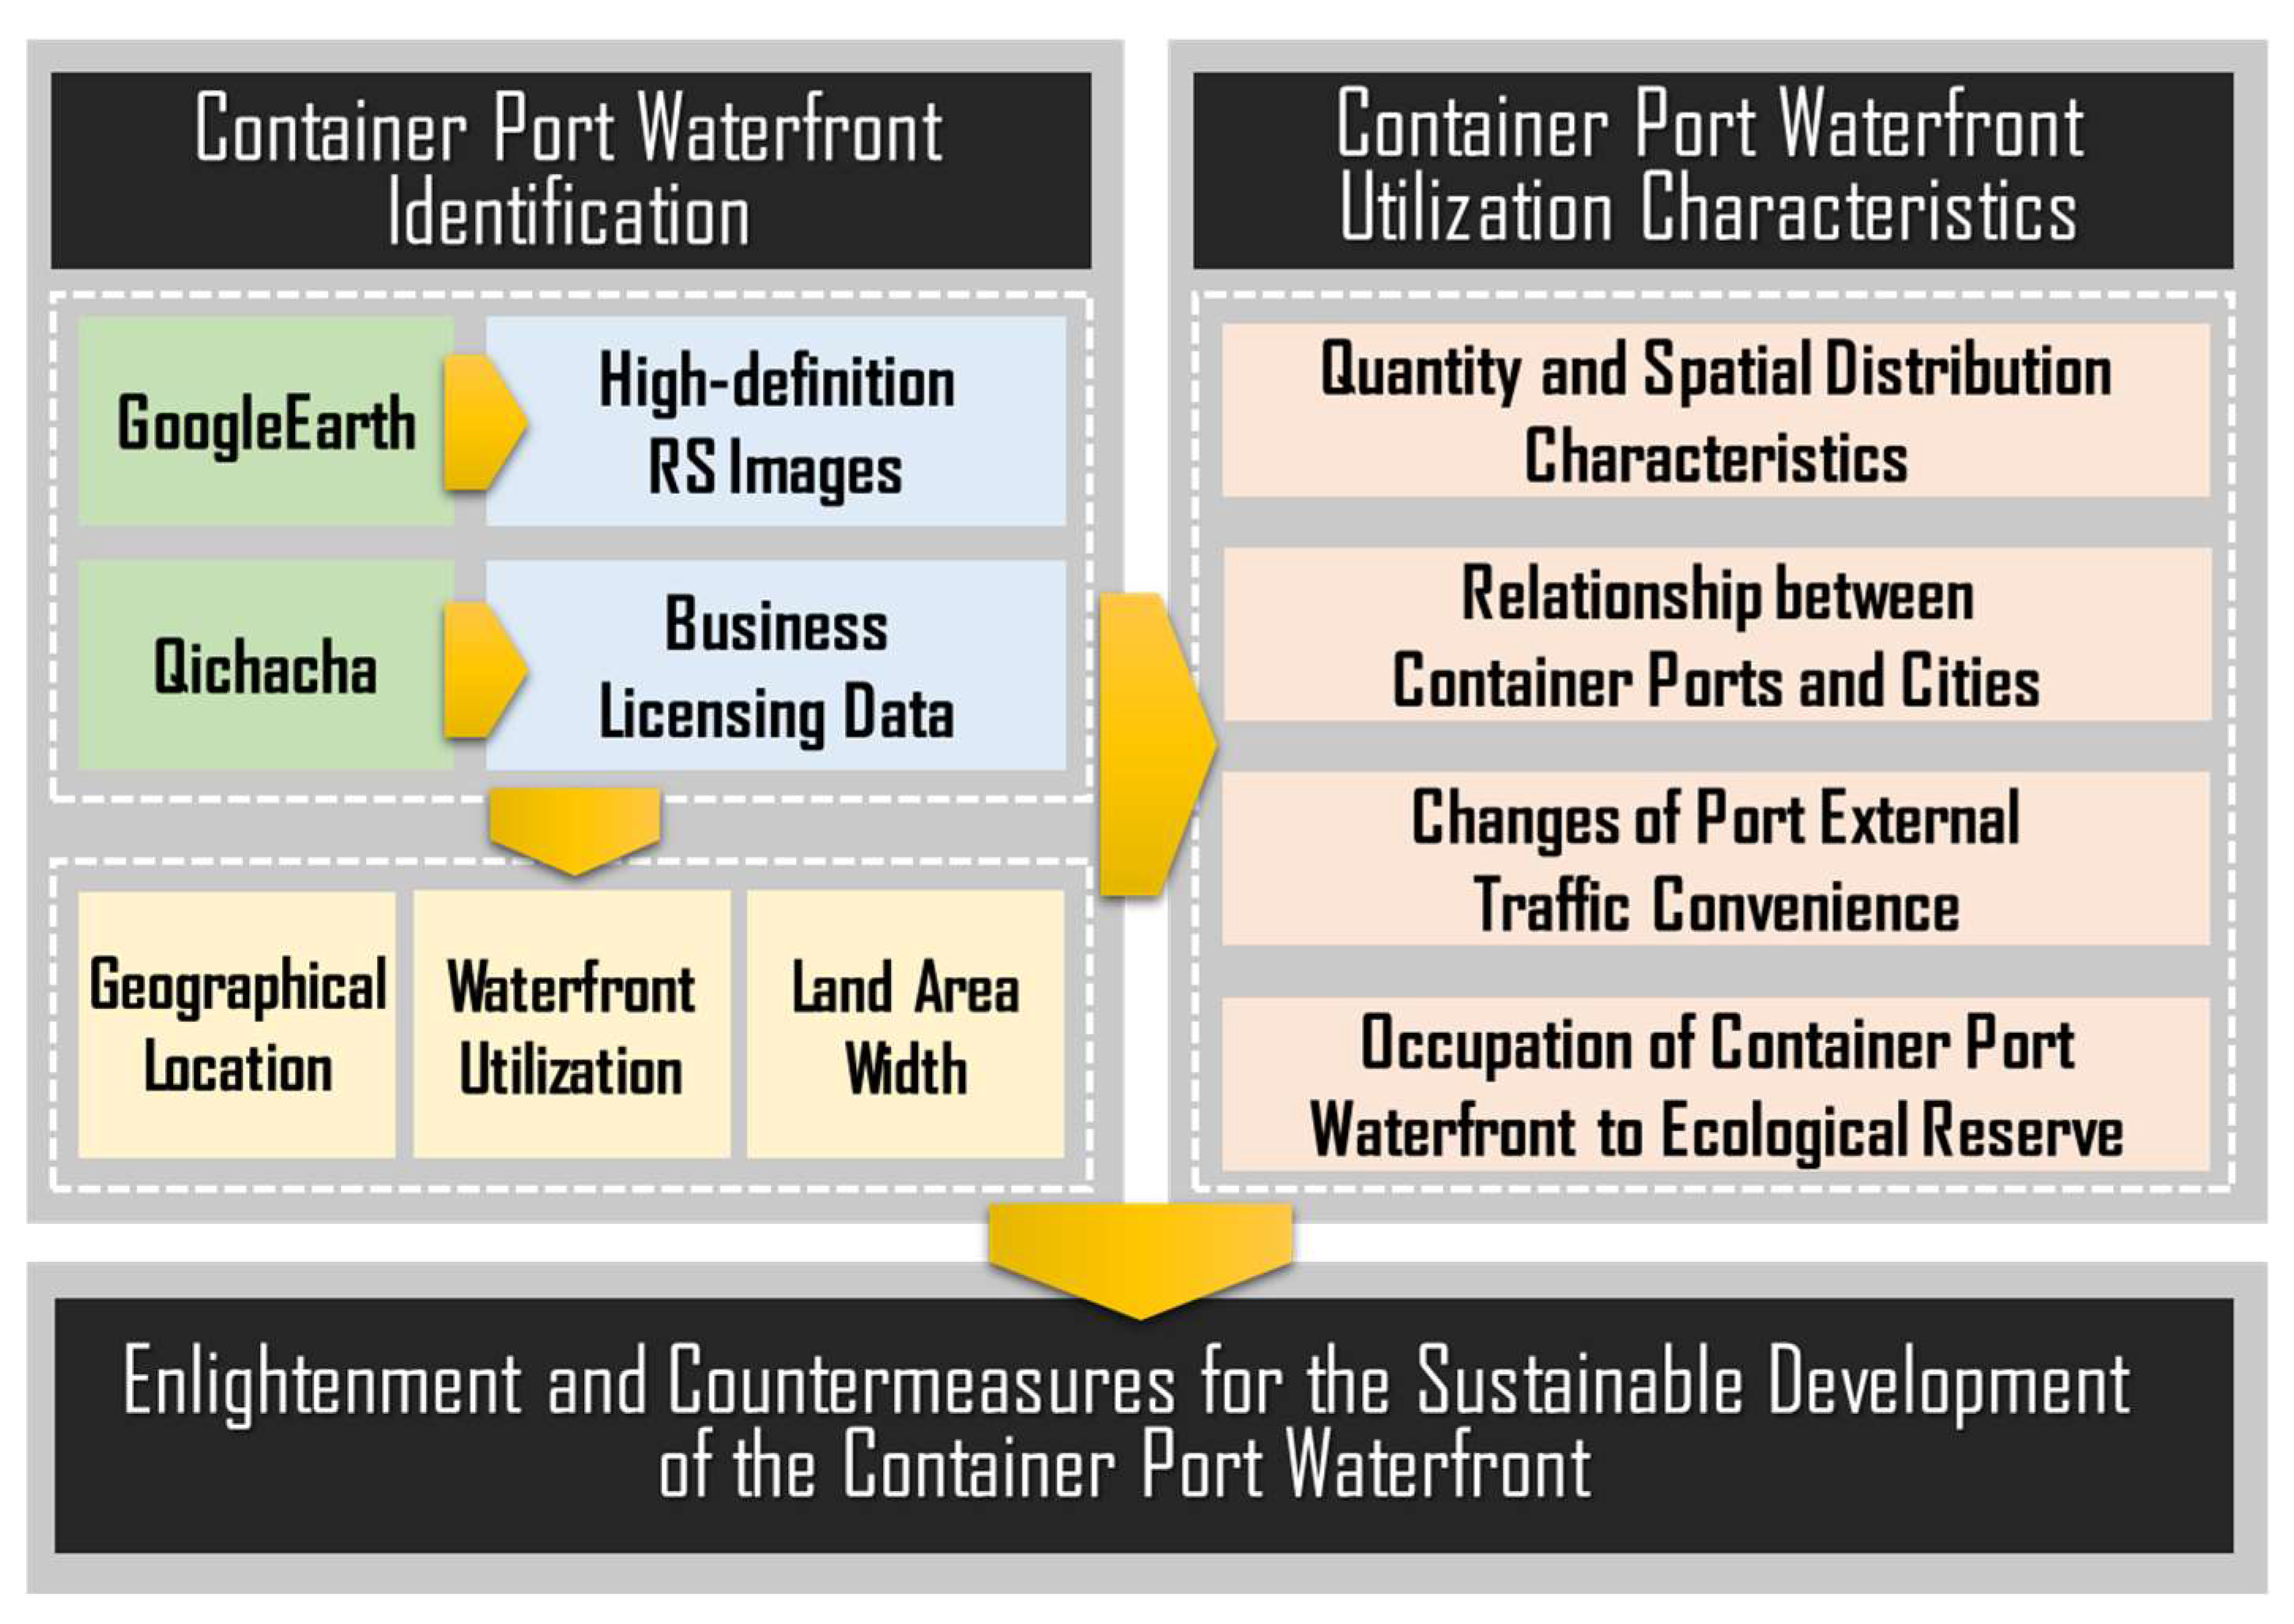
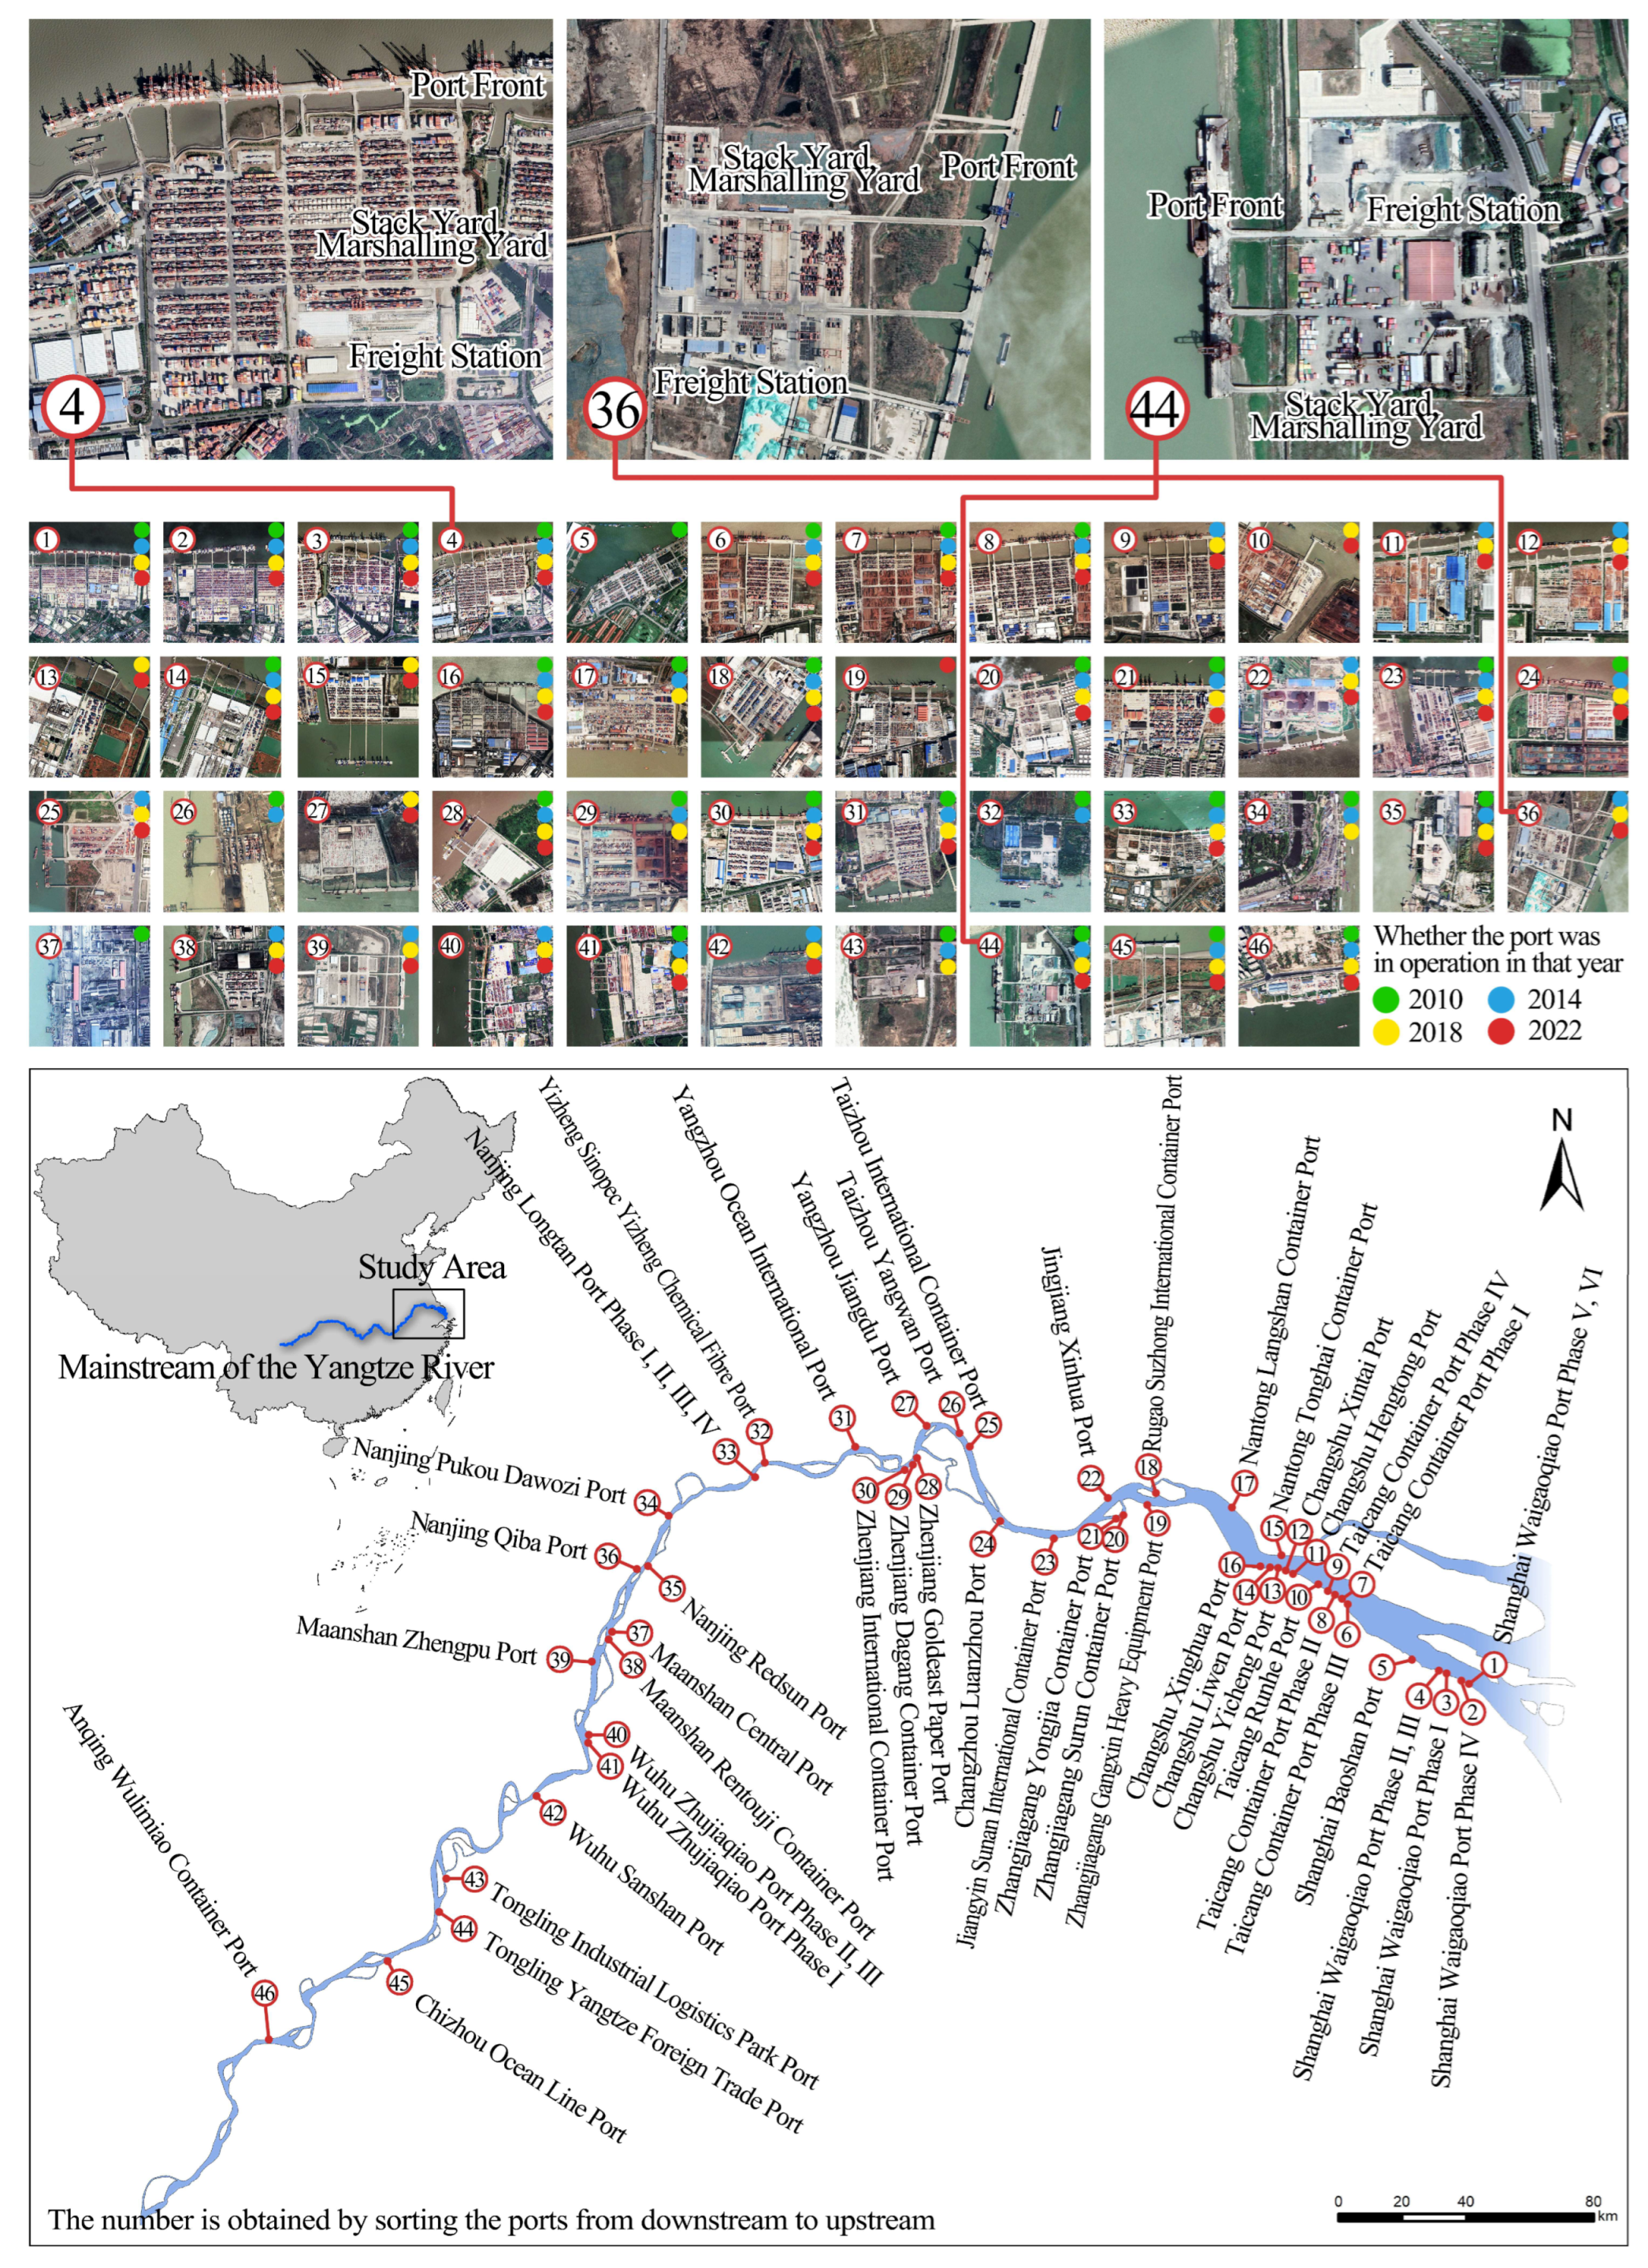
2.2.1. Identification of Container Port Waterfront in the Yangtze River

The container port is the general name of the land and water scope of the complete operation of container arrival, loading and unloading to departure, collection, and distribution. Firstly, this paper selects the riverside port enterprises whose business scope includes container operations through the Qichacha (https://www.qcc.com/ accessed on 31 December 2022) enterprise information query system, and it determines the enterprise location through the industrial and commercial registration address and the latest annual report address. On this basis, whether the container operation is actually carried out during the research period is analyzed through high-definition remote sensing images.
In remote sensing images, the port front is a port facility at the junction of land and water, with ship berths and container cranes, mostly designed in a trestle type. The stack yard and the marshalling yard are orderly discharge areas for a large number of containers, with container cranes and on-site transportation vehicles. The freight station also stacks a large number of containers, but unlike the stack yard and the marshalling yard, the loading and unloading of machinery in the freight station is mostly small. Some warehouses are built, and the container stacking is not as neat as the stack yard and the marshalling yard. The specialized container port has a large and tidy container stacking area and a large number of container cranes. The general port is also responsible for the operation of other types of cargo while carrying container transportation. Other cargo can be seen, except containers.
In this paper, 46 ports are selected. For ports that continuously use the waterfront, if they are operated by different owners or different types (specialized or general), we identify them as multiple ports, and the remote sensing image is shown in Figure 2 (sorted from upstream to downstream).

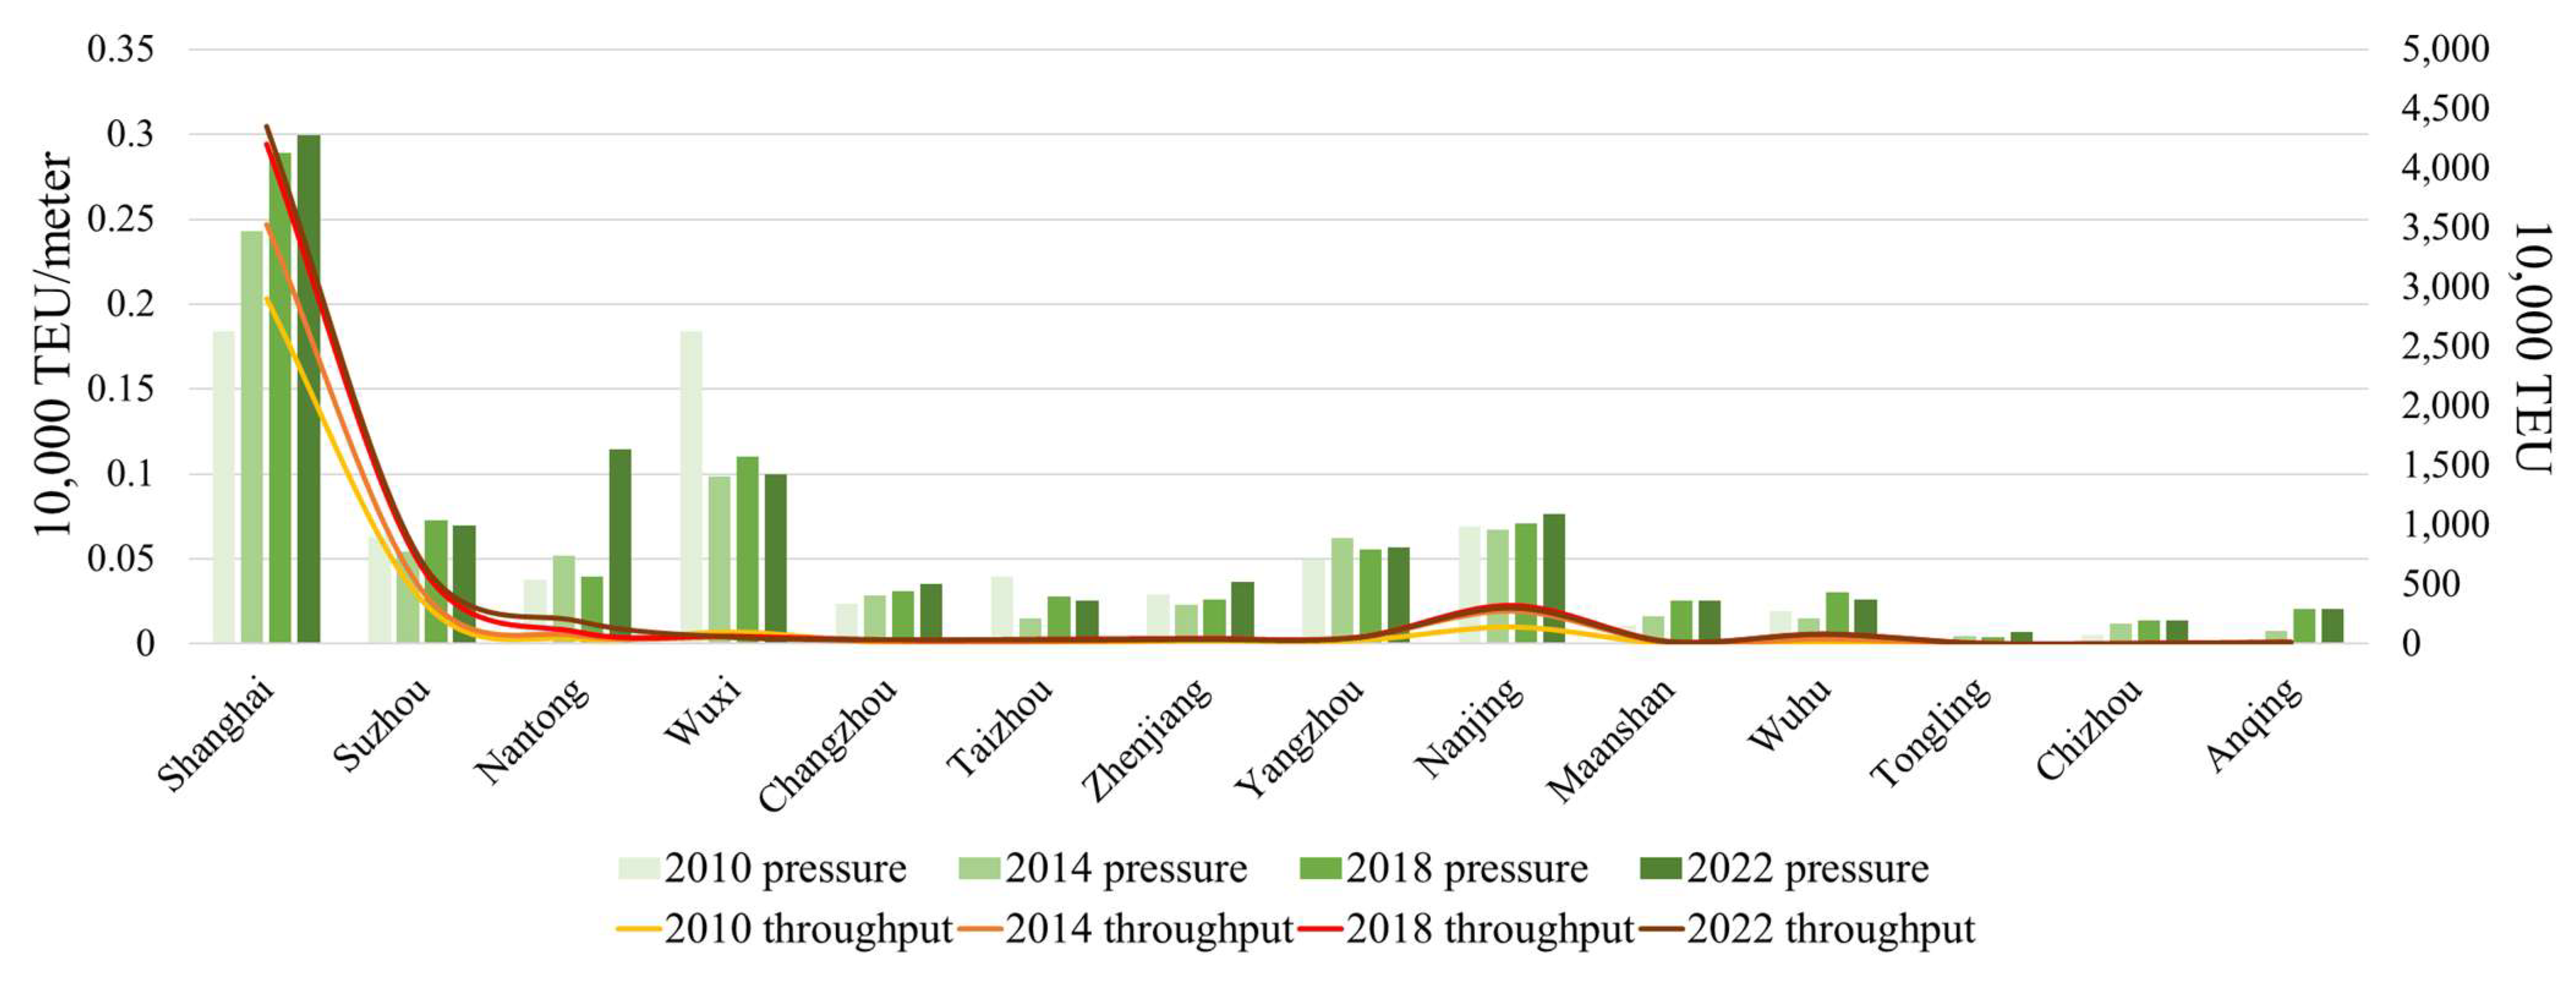
2.2.2. Estimation of Waterfront Pressure in Container Ports

To estimate the container throughput Tab of container port b in city a, take the container operation capacity of each port in one city as the same level, and divide the container throughput of the city according to the proportion of each port to the length of total container port waterfronts of the city.
T a b = T a · w a b w a
where Ta is the total port container throughput of city a, wab is the length of waterfront of container port b in city a, and wa is the total length of the city’s container port waterfront.

2.3. Data Sources

This paper selects 14 port cities in the Yangtze River Delta, including Shanghai, Suzhou, Nantong, Wuxi, Taizhou, Changzhou, Yangzhou, Zhenjiang, Nanjing, Maanshan, Wuhu, Tongling, Chizhou, and Anqing, which have port container operations and liner routes in the mainstream of the Yangtze River, as seen in the research samples.
The waterfront utilization data were extracted from the high-resolution remote sensing images of the mainstream of the Yangtze River in 2010, 2014, 2018, and 2022 using the method of 2.2. Enterprise. Business data come from Qchacha (https://www.qcc.com/), an official enterprise credit inquiry system registered by the national enterprise credit inquiry system, which can provide enterprise addresses and business scope. The high-definition remote sensing image data of the mainstream of the Yangtze River are obtained through Google Earth Pro. We download and import the data into ArcGIS software for further operations, collecting the geographical location of container ports, waterfront utilization, and land area width. Ports where container operations are included in the business scope, but cannot be reflected in remote sensing images, are not included in the study. The data of ecological reserves are derived from the General Plan for the Protection and Utilization of the Waterfront of the Yangtze River Economic Belt, prepared by the Yangtze River Water Conservancy Commission in 2016.

3. Characteristics and Patterns of Container Port Waterfronts Utilization

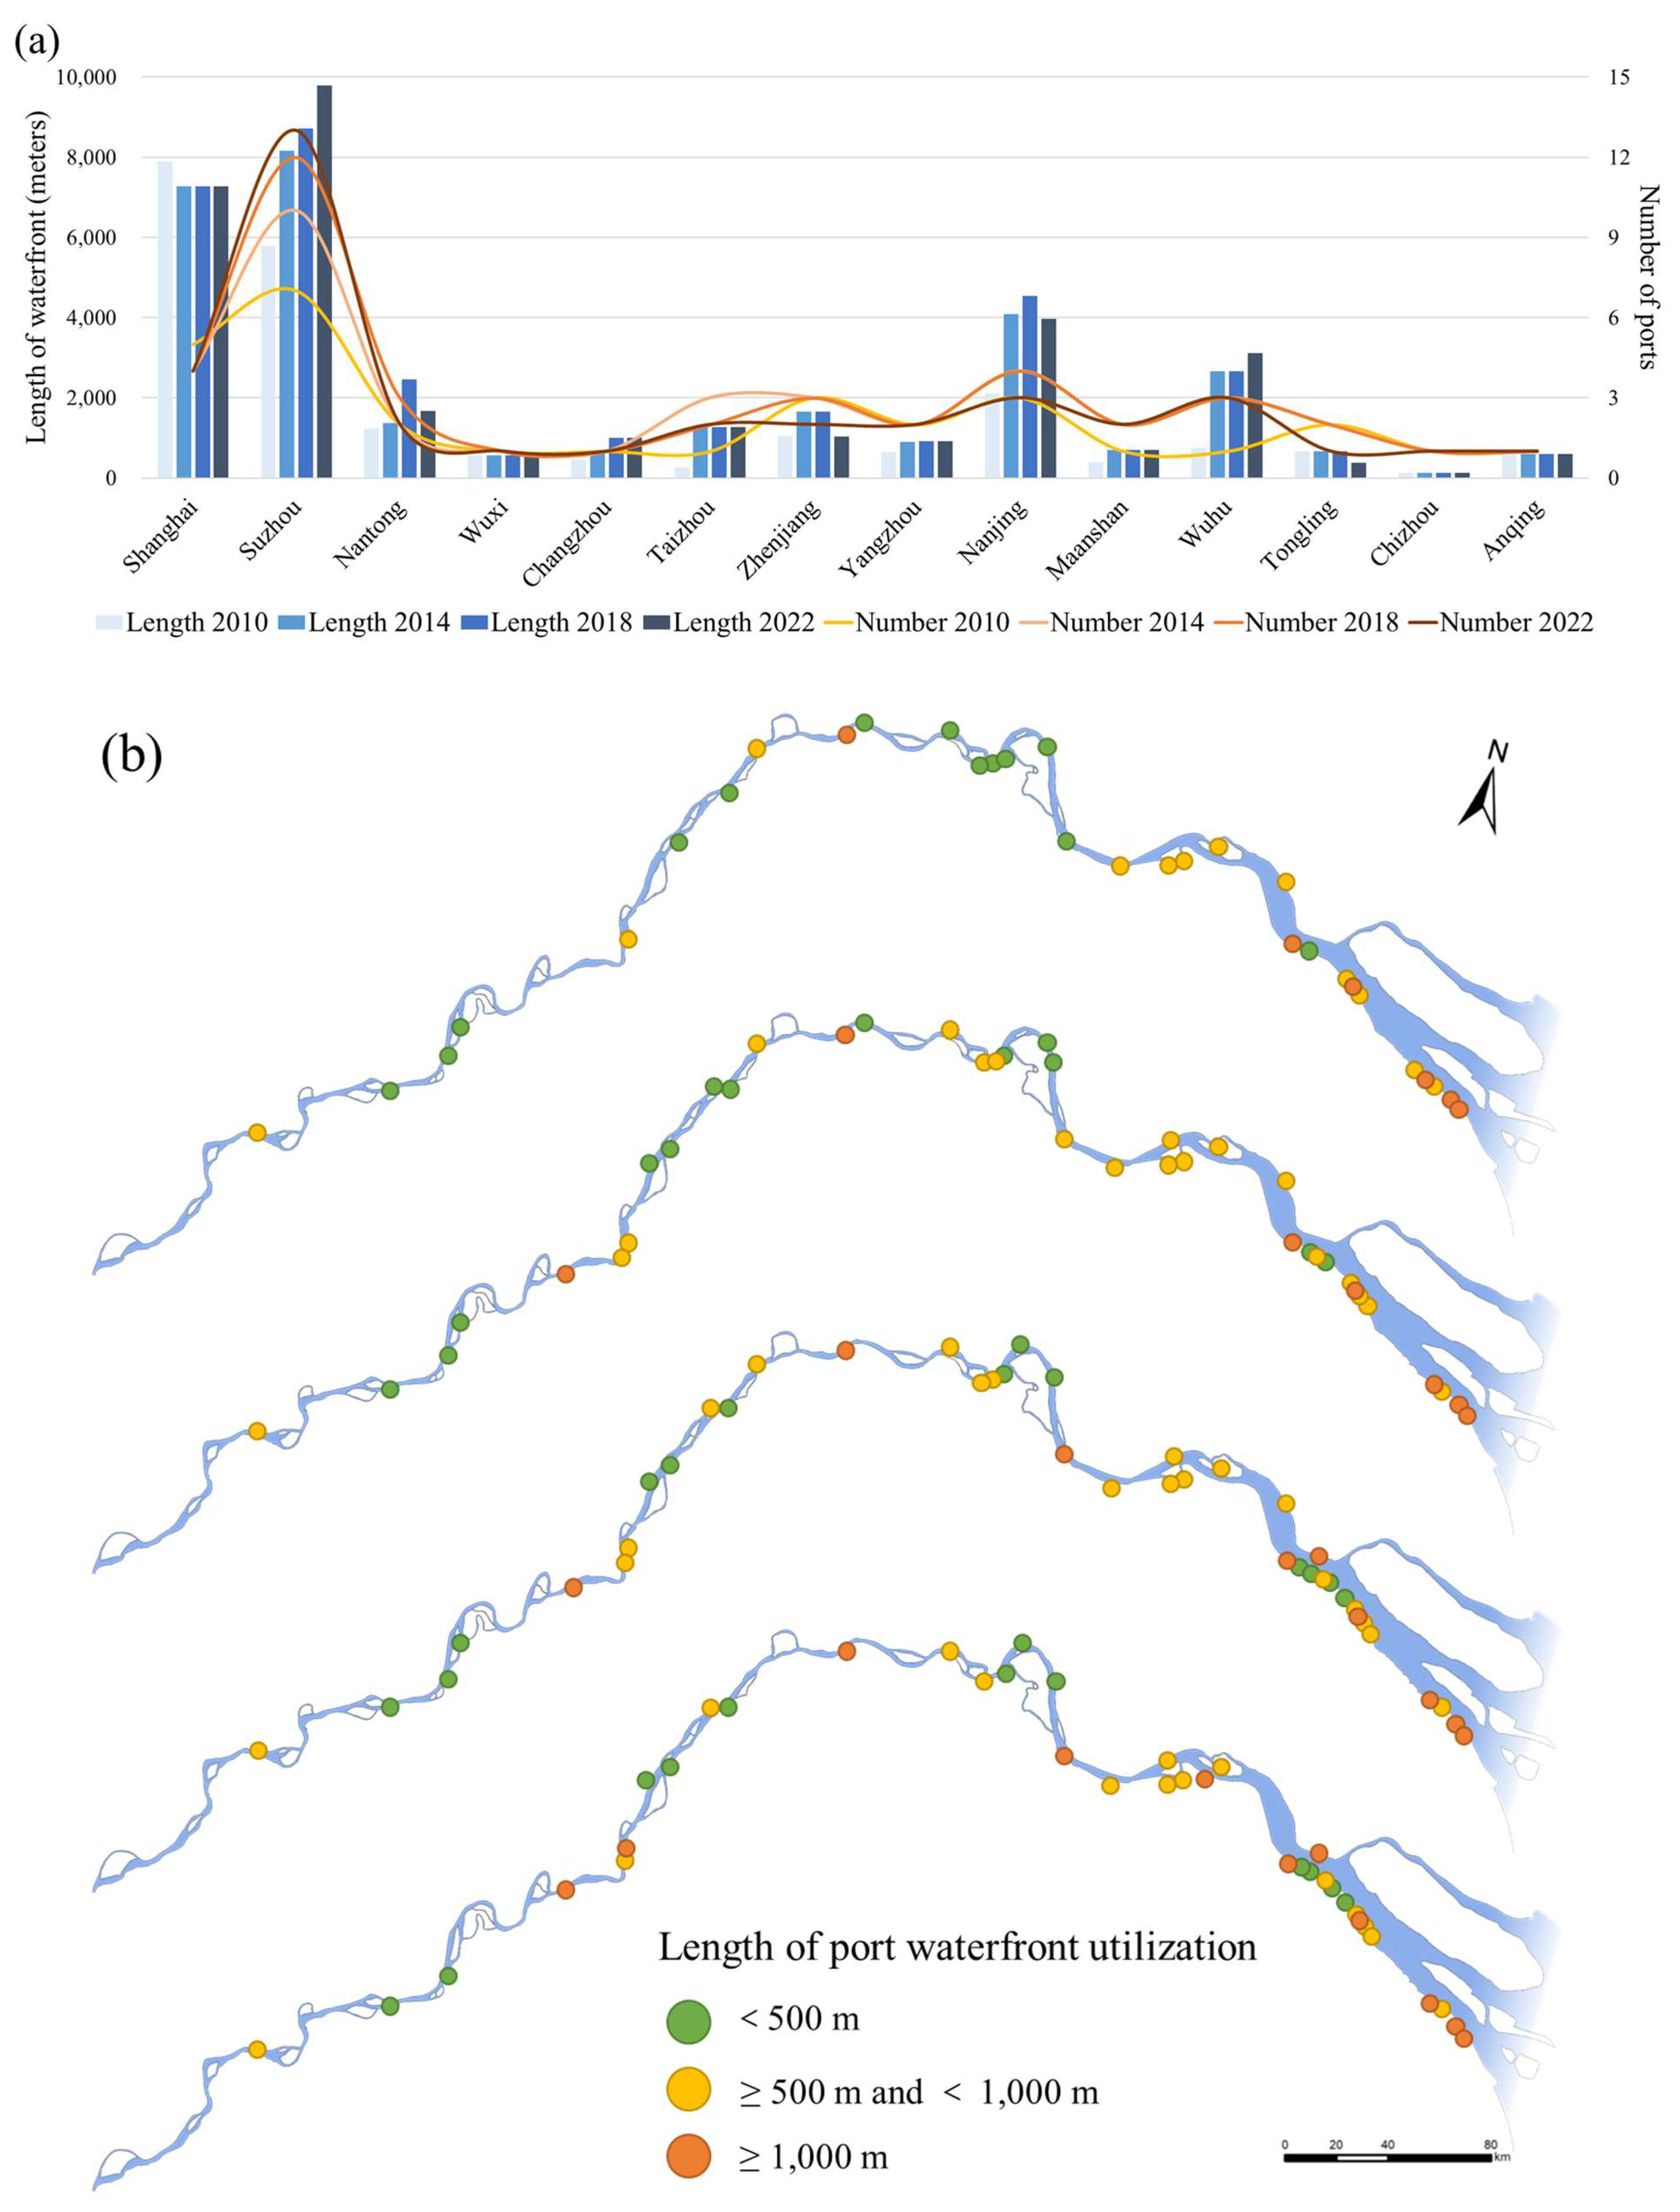
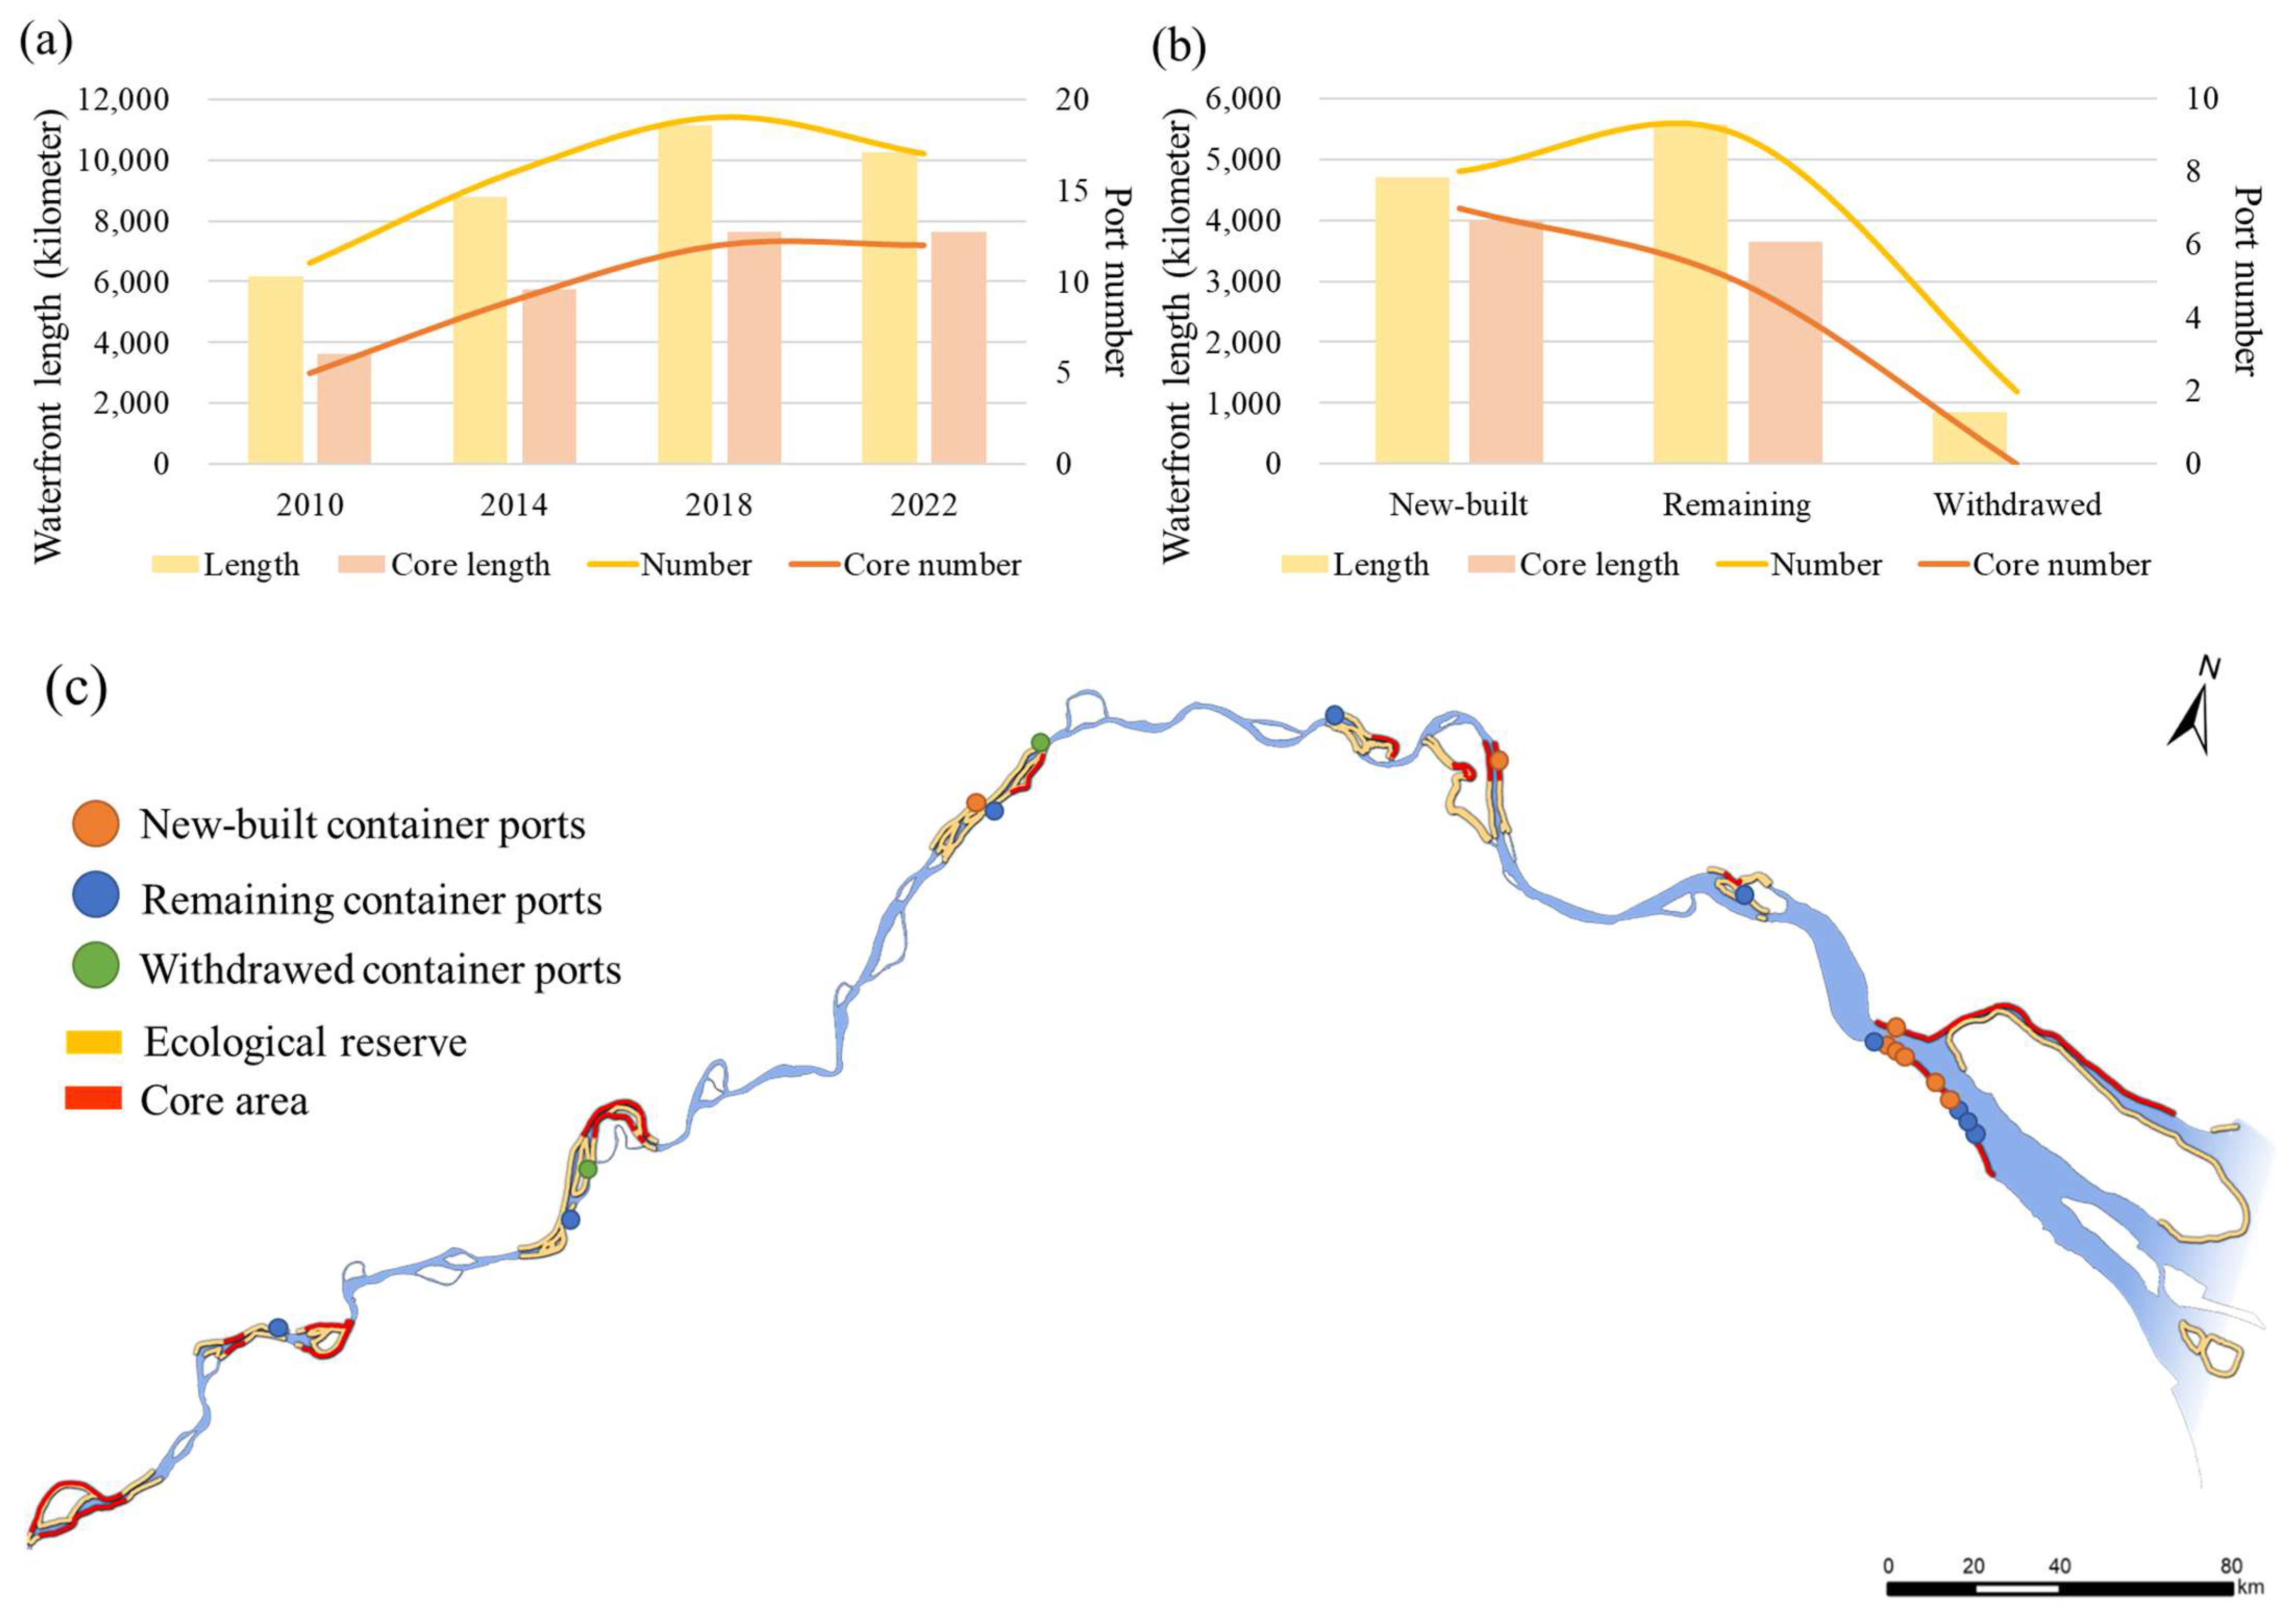
3.1. The Length of Container Port Waterfronts Increases, and There Are Dense Areas Attached to Big Cities

In the Yangtze River Delta, the number of container ports and the utilization of the waterfronts have increased significantly along the Yangtze River (Figure 3a). The total length of container port waterfronts has increased from 22.5 km in 2010 to 33.1 km in 2018, and it decreased to 32.4 km in 2022. The number of container ports has increased from 31 in 2010 to 41 in 2018, and it decreased to 38 in 2022. Due to differences in economic development and port and shipping infrastructures, the exploitation and utilization of container port waterfronts are different between provinces and cities. The utilization of container port waterfronts in Jiangsu is the highest in the YRD, from 12.1 km in 2010 to more than 20 km in 2018, accounting for more than 60% of the total since 2014. The utilization of container port waterfronts in Anhui is small, but the growth rate is fast, from 2.5 km in 2010 to 4.9 km in 2022. Even if the average annual growth rate is 5.8%, it is still less than 1/4 of Jiangsu.
At the urban level, the utilization of container port waterfronts is generally decreasing from downstream to upstream, and it forms a dense zone attached to central cities and major manufacturing bases (Figure 2) to match the expansion of the global production-sale network and to serve trade circulation. Shanghai and Suzhou, located in the Yangtze River estuary, have a large scale of container port waterfronts utilization, of which Suzhou has continued to grow, and it has surpassed Shanghai. In Shanghai, there are strict restrictions on the total amount of productive waterfronts and port construction land and the environmental protection of the Yangtze River estuary, and the hydrological and geological suitability of port construction in the estuary areas is poor. It is popular to use Suzhou as a port of release for Shanghai to alleviate the burden of regional container shipping. A dense zone of container ports is formed between Shanghai Waigaoqiao and Suzhou Changshu (Sutong Bridge), which is a hub area for international liner docking and river–sea intermodal transportation. In the middle of the lower reaches of the Yangtze River, Nanjing is the shipping center of the lower reaches, and Wuhu is the shipping center of Anhui. They undertake regional container distribution and intermodal transport functions. The number of container ports and the scale of waterfront utilization are high, forming another relatively small, dense zone. Nanjing is the largest container port waterfront utilization, except Shanghai and Suzhou, reaching 4.5 km in 2018, and the container port waterfronts utilization in Wuhu has exceeded 3 km in 2022, 1.7 times the total number of other four port cities along the Yangtze River in Anhui.
Ports with higher waterfronts utilization are mostly located in the shipping center cities and the lower reaches, mostly in the dense zones (Figure 3b). The waterfront length of the main container ports in Shanghai, Suzhou (Zhangjiagang, Taicang, Changshu), and Nanjing, is more than 1000 m. In Anhui, only in Wuhu, there is a trend of large-scale ports. The demand for Anhui’s own container shipping is low, and the high cost of opening up the port and the rear land area has a restraining effect. Suzhou Taicang Container Port (Phase I, II, III, IV), Shanghai Waigaoqiao Port (Phase I, II, III, and Phase IV, V, VI), Nanjing Longtan Port (Phase I, II, III, IV), and Wuhu Zhujiaqiao Port (Phase I, II, III), which cumulatively utilize the waterfronts, all exceed 2000 m.

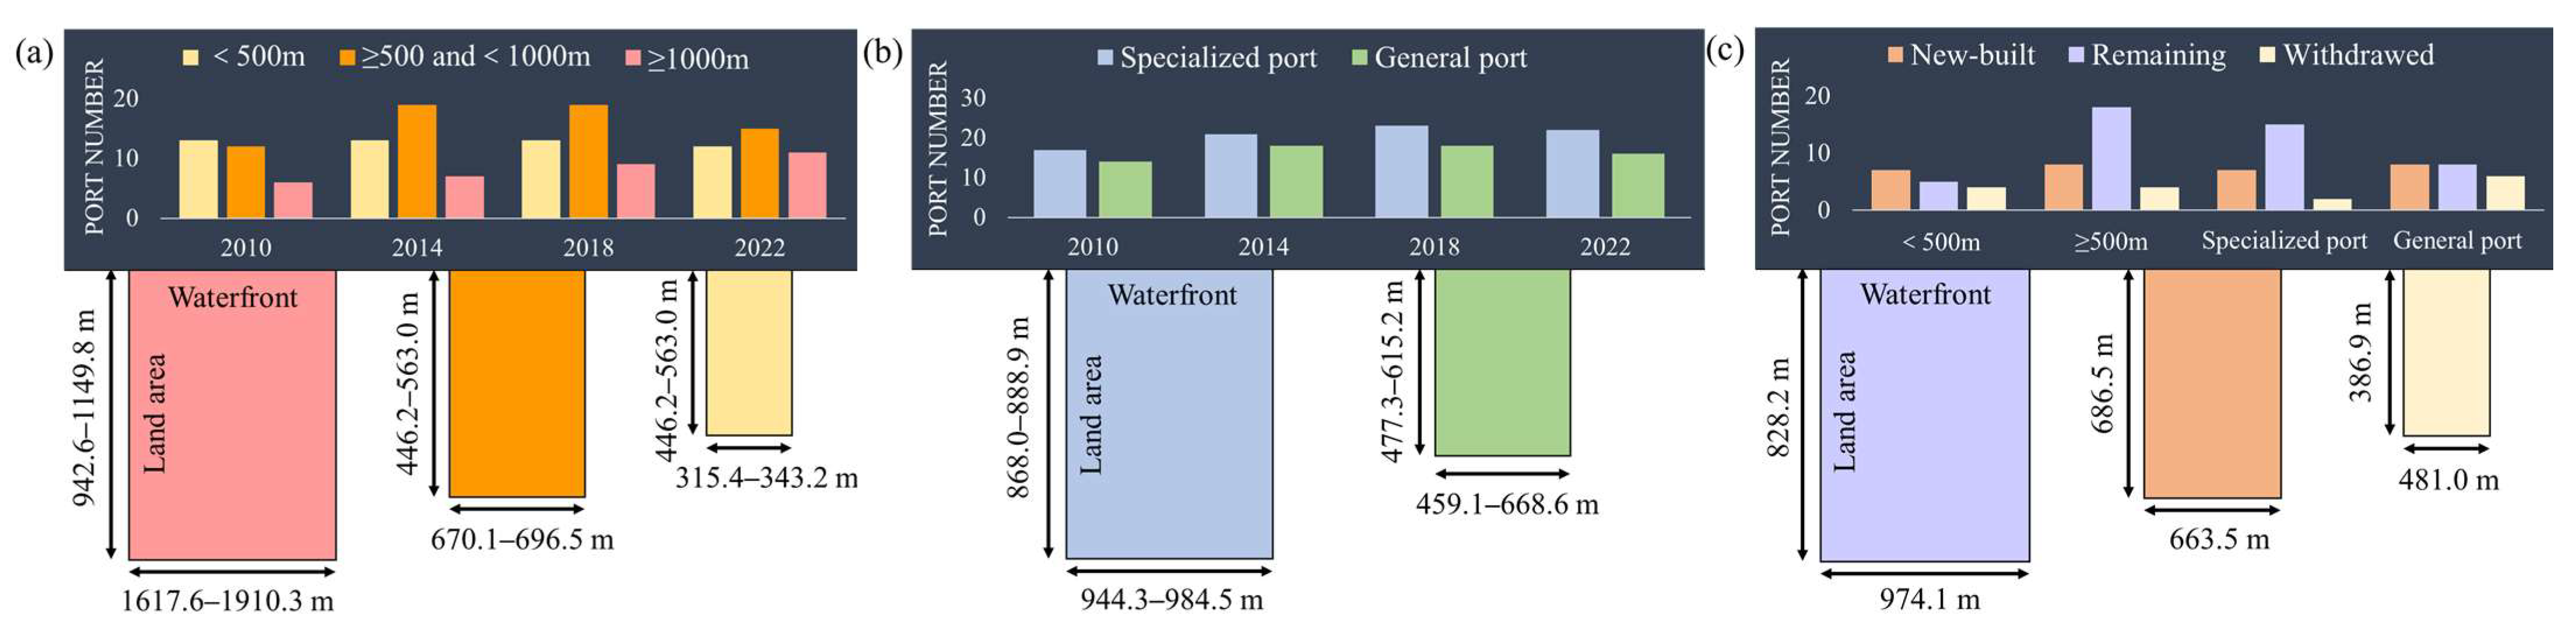
3.2. The Development Direction of Container Ports Is Large-Scale and Specialized

Large and specialized container ports can use supporting facilities to improve the transport efficiency to centralize the cargo receipt and delivery and transform the traditional port from the extension of the upstream and downstream of the waterfront to the extension of the rear land area behind the waterfront, so as to realize the intensive use of the waterfront and reduce the fragmentation of the riverside landscape. The length of the waterfront used by one port has grown rapidly. The average length has increased from 725.2 m in 2010 to 851.5 m in 2022, and the average width of the land area used has increased from 702.8 m to 772.3 m. Compare the ports according to the three types of using waterfront below 500 m, 500–1000 m (excluding 1000 m), 1000 m, and above. The proportion of ports using higher waterfronts continues to increase, and the proportion of ports using 500 m and above increases by 10%. The number of smaller container ports with waterfronts of less than 500 m decreased from 13 in 2010 to 12 in 2022. The average width of land area they use is small. The number of medium-sized ports with waterfronts of 500–1000 m increased from 12 in 2010 to 19 in 2014, and it decreased to 15 in 2022. The average width of land area they use is medium. The number of large ports with waterfronts of 1000 m and above increased from six in 2010 to 11 in 2022. The average width of land area they use is the largest, with an average of 942.6 m–1149.8 m in four years (Figure 4a).
The construction cost and site selection requirements of specialized container ports are high, so some general ports participate. In the early stage, due to the small scale of container transportation, some port cities did not build specialized ports. The number of specialized ports increased from 17 in 2010 to 23 in 2018, and it decreased to 22 in 2022. The number of general ports increased from 14 in 2010 to 18 in 2014 and 2018, and it decreased to 16 in 2022. The main port areas and public ports in various cities are mostly specialized ones, while some non-core peripheral ports and cargo owners’ ports are mostly general ones. The average length of specialized ports is close to 1000 m, between 953.5 m–984.5 m in four years, and its land area width is used between 868.0 m–886.5 m. Compared with that, the average length of general ports in 2022 is only 668.6 m, and the land area width is 615.2 m (Figure 4b).
The container ports are divided into new-built, withdrawn, and remaining. The remaining ports carried out container operations during the study period, the new-built ports joined the container operations during the study period, and the withdrawn ports are no longer carrying out container operations during the study period due to various reasons. The decrease in ports is mainly small, and the increase is mainly large and medium-sized. After the optimization and adjustment of the port system, eight ports, including four small and four medium ones, have been removed or changed for container operation, which cannot meet the modern transportation standards. The average waterfront utilization is 481.0 m, and the average land area width is 386.9 m. Among them, two specialized ports are Nantong Langshan Container Port and Shanghai Baoshan Port. There are 15 new-built ports, including seven small and eight large- or medium-sized ones. The average waterfront utilization is 663.5 m, and the average land area width is 686.5 m. Among them, there are seven specialized ports. High-standard construction of specialized ports has become an important step for cities to develop container shipping, and this is supplemented by some small and medium-sized ports to improve the availability of transportation and to relieve the pressure of large port areas. There are 23 remaining ports, including five small ones and 18 large- or medium-sized ones. The average waterfront utilization is 974.1 m, and the average land area width is 828.2 m. Some ports can meet the needs of waterway shipping development and the environmental protection requirements of the Yangtze River. Most of them are the main port areas of each city, and the waterfront utilization increases gradually due to the phased planning and construction. Through the reservation, it will be extended after the upgrading of the logistics services and popularization of containerization. The Changzhou Luanzhou port increased from 450 m to 1000 m, and the Wuhu Zhujiaqiao port Phase II and III increased from 800 m to 1265 m (Figure 4c).

3.3. The Utilization of Container Port Waterfront Is Approaching the Periphery of the City and Areas with Convenient Transportation

The development of container ports and the utilization of waterfronts are gradually moving away from urban areas to expand. During the study period, the average straight-line distance from the container ports to the city center increased from 16.5 km to 19.4 km, the average driving distance increased from 21.8 km to 25.7 km, and the average driving time increased from 35.9 min to 39.7 min. The number of ports with straight-line distance of no less than 20 km has increased from 12 to 20, and the average length of a waterfront is 902.2–948.8 m, while the average length of a waterfront with a straight-line distance of less than 20 km is 613.4–750.7 m. The number of ports with driving distance of no less than 20 km has increased from 18 to 26, and the average length of waterfront is 903.4–949.8 m, while the average length of a waterfront with a driving distance of less than 20 km is 478.3–638.4 m (Figure 5a, Table 1). External transportation is an important link in port construction, matching each port with the nearest expressway entrance. The average driving distance between the two reduced from 10.6 km in 2010 to 7.0 km in 2022, the average driving time reduced from 17.5 min to 12.3 min, and the number of ports less than 10 km from the entrance increased from 16 to 28, accounting for 51.6% to 73.7% of the total. Many ports have opened entrances through new dedicated lines or expressways passing through the port area to reduce the complexity of the main entrance of expressways connecting with urban internal and external passenger transport. The number of ports sharing the entrance with the urban area decreased from 16 to 5, and the proportion decreased from 51.6% to 13.2% (Figure 5b,c, Table 1).
Many cities have built ports in peripheral areas to reduce the use of ports in urban areas. The average distance and driving time from the new-built ports to the city center is relatively long, while the average distance and driving time from the withdrawn ports is relatively short. Newly built ports with straight-line distance and driving distance of no less than 20 km accounted for 66.7% and 73.3% respectively, compared to 25.0% and 37.5% of the withdrawn ones and 43.5% and 65.2% of the remaining ones (Figure 4a). The average distance and driving time from newly built and remaining ports to the nearest expressway entrance is relatively short, while the average distance and driving time from withdrawn ports is relatively long. The average driving distance from the newly built and remaining ports to the nearest expressway entrance is 7.8 km and 6.5 km, respectively, and the average driving time is 13.9 min and 11.3 min, respectively, which is far lower than the 12.15 km and 20.3 min from the withdrawn port. The proportion of the withdrawn ports and the urban traffic flow sharing the entrance are 87.5%, The newly built and remaining ones are only 6.7% and 17.4%, respectively (Figure 5b,c, Table 1).
The relationship between the ports and the cities is gradually expanding, and the convenience of the port external transportation is improving. There is incompatibility between the utilization of port waterfront and urban leisure and recreation as the main functional types of waterfronts. Transport pollution limits the improvement of urban quality and the living environment, and it cuts the landscape along the river in the city. At the same time, the waterfront utilization that focuses on urban living limits the expansion of the port area and the construction of collection and distribution channels, which promotes the outward migration of some ports. During the study period, the waterfront utilization of newly built ports is generally far from the urban area, but there are still a few ports, such as Tongling, Anqing, and Wuxi (Jiangyin), close to the main city.

3.4. The Container Port Waterfronts Occupy the Ecological Reserve and Is Highly Concentrated

According to the General Plan for the Protection and Utilization of the Waterfront of the Yangtze River Economic Belt, the container port waterfronts occupy the ecological reserve in the YRD, and the occupation length is expanding with the development of the inland waterway transport. The length of the ecological reserve section occupied by ports increased from 6167 m in 2010 to 11,125 m in 2018, and then it decreased to 10,265 m in 2022. The total proportion increased from 27.4% to 33.6%, and then it decreased to 31.7%. The number of ports increased from 11 in 2010 to 19 in 2018, and then it decreased to 17 in 2022, and the total proportion increased from 35.5% to 46.3%, and then it decreased to 44.7%. The annual growth of the conflict length in 2010–2014 was 9.3%, From 2015 to 2018, the annual growth rate was 6.1%. After 2018, the relationship between the container ports and the protection reserve eased, and the scale of conflict decreased. The core area of the reserve is an important area to play the protection function, and the occupied length has increased from 3637 m to 7630 m, and the proportion has increased from 59.0% to 74.3% (Figure 6a).
The conflicts are mainly distributed in the Yangtze River estuary, Nanjing, and Tongling. Almost all waterfronts in the Yangtze River estuary area are within the scope of protection. This section is the core area of the National Aquatic Germplasm Resources Protection Area of Yangtze Coilia, which has led to a large number of ports in Suzhou (Taicang, Changshu) and Nantong, falling within the protection area, forming a large-scale occupation. The number of ports in this area has increased from 4 to 10, accounting for 36.4% to 58.8% of all conflict ports, and the occupied waterfront has increased from 3059 m to 6572 m. The proportion increased from 49.6% to 64.0%. The main city of Nanjing and its upstream areas are all in the National Aquatic Germplasm Resources Protection Zone of Leiocassis longirostris in Dashengguan, and a large number of waterfronts of Tongling are in the National Nature Reserve of Freshwater Dolphin (Figure 6c).
Different from the traditional cognition of the newly built and remaining ports evading reserve, the scale and proportion of the reserve are high. There are eight newly built ports in the reserve, occupying 4703 m of the protected waterfront, accounting for 53.3% and 47.3% of the number of ports and the length of waterfront utilization. There are nine remaining ports in the reserve, occupying 22,404 m of the protected waterfront, accounting for 39.1% and 24.8% of the number of ports and the length of waterfront utilization. The core area of the reserve is occupied by seven newly built and five remaining ports, with the occupied length of 3993 m and 3637 m, respectively, accounting for 84.9% and 65.4% of the total occupation of each type. The average length of conflicting ports is small, and the proportion of specialized and large ports is low. Their impact on the environment is large, so the site selection is more cautious (Figure 6b).

4. Enlightenments and Countermeasures for the Sustainable Development

4.1. Transformation of Productive Waterfront Utilization Has Reshaped the Sustainable Development Pattern along the Yangtze River

Development activities can directly change the natural background of the waterfront and its surroundings, as the waterfront is a disposable one-time, non-renewable resource. Ports’ site selection, which is the joint result of the hinterland economy, waterfront ecological environment, distribution facilities, etc., relates to the economic development stages and resource development mode. For most of the Yangtze River ports, waterfront utilization develops in three periods, exploitation, conflict, and mitigation, as it relates to their long history and intensive human activities.
Inland container shipping develops with the expansion of global product sales in inland regions. This speed-developing mode and traditional shipping both work. Waterfront utilization of traditional shipping is horizontal expansion-based, in which the capacity relates to the length of the shoreline. It results in the heavy utilization of the waterfront and threats to ecological preservation areas and drinking water sources. In contrast, inland container shipping reduces unit transport costs and pollutant emissions by transferring the land transport and increasing the proportion of multimodal transport to river–ocean combined transport. Container shipping is away from heavy waterfront utilization, as it possesses high operational efficiency with the standardized transport and centralized feeder ports distributed in the YRD, which are the logistic nodes sited in the inland region during the port regionalization process. Hence, for the Yangtze valley, the container shipping need of a whole city can be realized in hundreds of meters of waterfront, and the same is the case in the Rhine Valley. It has only been decades since container shipping developed in the Yangtze River. In the 1980s, Shanghai began to develop container shipping and gradually expanded to Suzhou (Taicang, Changshu, and Zhangjiagang) in the Yangtze River estuary. In the 1990s, it became popular in the Jiangsu Province. Later, in 2000, large-scale container operations began in Anhui Province. With the construction of −12.5 m and −10.5 m deep waterway in the lower reaches of the Yangtze River, container throughput has the fastest growth among all kinds of cargo.
The development of container ports is closely related to China’s foreign trade growth and the Yangtze River’s resources and environmental management. In 2010, the period wherein China was the “world factory”, container shipping developed rapidly in the entire region, with the fastest-growing foreign trade. To alleviate the pressure of collection and distribution, some existing wharves were altered for larger transport capacity and the most use of the waterfront. During the conflict period, many container ports were located in the old port area, and lack of pollutant collection and material supplements caused many environmental problems.
“Mitigation” is considered to begin after 2015. We believe that there are two reasons. One is regulation. The decades of urbanization and industrialization along the Yangtze River have accumulated a series of resource and environmental issues [21,71]. The Chinese government has proposed a national strategy of “Yangtze River Protection” to guide the sustainable use of the waterfront of ports. After meeting current and future transportation needs, ports are not allowed to be constructed excessively. Scholars have reviewed the challenges faced by current inland port and shipping [72] and believe that sustainable development requires social, economic, and environmental aspects, such as environmental measures, setting up emission control zones, using clean energy [73,74], and more efficient ship scheduling systems [75].
On the other hand, by establishing a modern transportation and supply chain covering the Yangtze River basin, one can integrate logistic links to reduce the resource and environmental impact of unit transportation and to internalize external costs. Specialized public container ports have been built in various regions, and intensive utilization of waterfront resources is taking shape. With the continuous improvement of environmental control requirements, the external costs of various modes of transportation, especially roads and railways, continue to rise. Under the same environmental control standards, inland waterway transport has the smallest cost consumption [76,77]. Inland ports can alleviate traffic congestion and reduce transportation costs in seaport cities [18,78]. When ships stay in the seaport for a long time, it can cause environmental impact on residents of seaport cities. In this process, intermodal transport plays an important role. Through the optimization and improvement of the logistics system in infrastructure docking, regulatory procedures, as well as other aspects, as well as various transportation links, have formed service models that can integrate regional logistics [79,80], significantly reducing the social marginal cost of transportation. For the additional economic burden caused by ecological measures, suppliers provide cost compensation through cooperation and various technologies.

4.2. Conflicts between Waterfront Utilization and Protection Are Inevitable, and It Is Necessary to Face Up to the Rise in the Occupation of Protected Areas

Although the container ports in the Yangtze River Delta account for only 1% of the total waterfront, some protected waterfront covers nearly 100 km. Many waterfronts in some cities are in protected areas due to highly unevenly distributed protection needs. For Suzhou, Nanjing, Tongling, and other cities, a large number of waterfronts is within the protection reserve. Besides, many cities along the Yangtze River, including Nantong, Nanjing, and Wuhu, try to amplify the riverside economic and social benefits by constructing urban corridors with location advantages. Local governments tend to construct gardens to exert the multi-function of the riverside landscape, as the Yangtze River is attractive to residents. Hence, many waterfronts are used for leisure and recreation. The dilemma in container ports’ site selection makes the local stakeholders develop waterfronts for economic development pressure in the game between economic development and resource protection. The productive activities of the waterfront cannot be prohibited, so there will be conflicts between port development and waterfront protection.
Inland waterway container transport is an important means to solve China’s logistic development dilemma. The proportion of national total logistic expenses in relation to GDP has decreased from 17.37% in 2010 to 16.00% in 2015, but it is still higher than that of developed countries, and there is still a certain distance from the world average of 10–15%. Assuming that logistics efficiency can be raised to a level close to that of the United States (5–7%), it can save nearly 5 trillion yuan per year. Most of the logistics costs come from the process of transporting goods from inland regions to coastal ports. Although the length of domestic transportation is shorter than that of international section, the cost accounts for a high proportion of the total freight. This has provided a huge market capacity and development space for inland water transportation. The cost of inland container transportation with shipping as the core is 50% of road transportation. It is marked by standardized transportation units, achieving high efficiency and informatization, as well as changing traditional cargo source organization and transportation processes. “Door to door” transportation [81,82] can reduce the turnaround time of various links in the transportation process [83], accelerating the diversification of the relationship between ports and hinterland and the process of port regionalization.
The shift from land transportation to water transportation occurs under environmental control. Among the main transportation modes, the energy consumption and pollutant emissions per unit of cargo transportation by waterways are far lower than those by highways, which can reduce costs by nearly 10% and greenhouse gas emissions by more than 15% [84]. The European Commission proposed the Marco Polo Plan at the beginning of the 21st century, aiming to transform land freight into other greener modes. The two phases of the Marco Polo plan ultimately reduced carbon dioxide emissions by 4.36 million tons, reduce land freight turnover by 64 billion kilometers, and reduce truck queuing by 64,000 km. After 2010, the EU further promoted the development of sustainable transport modes, with the goal of reducing greenhouse gas emissions by more than 60% by 2050.
The volume of container ports that conflict with the protection reserve is considerable, increasing from 2.99 million TEU in 2010 to 7.16 million TEU in 2020. Considering the unit waterfront container handling capacity of each container port in the city at the same level, it is calculated according to the method in Section 2.1. and accounting for 8.2% of the inland river container throughput in the Yangtze River Delta to 12.2%. In 2022, all of the container operations of Maanshan, Anqing, and Nantong, and 60% of Suzhou and Yangzhou, were in protected areas. In the Yangtze River estuary, Suzhou and Nantong have become the two most critical relocating regions of Shanghai, and Taicang Port Area has the largest container port group on the Yangtze River, except Shanghai. These are all related to Shanghai’s lacking waterfront, scarce land resources, and continuous increase in collecting and distributing pressure. Although protection is essential, the considerable container operation over several millions will conflict with the protection zone no matter where they are distributed, as all of the waterfronts of this section are in the protection zone. If there is no room for container shipping, it will seriously affect the construction of the integrated logistics system and social-economic development, locally, or even in a larger region. At this stage, the best time to adopt the most stringent protection measures and overall relocation has yet to be noticed. Considering many large-scale hub ports exist in the protection reserve, the primary way is to develop these ports and carry out ecological compensation and restoration through other methods simultaneously.
The sustainable use of the port waterfront is a dynamic process. By improving the entry and exit mechanism of the port waterfront, the utilization efficiency of the port waterfront can be improved, and the supply of the waterfront can be shifted to large-scale public ports with high throughput capacity per unit waterfront. Besides, it is also helpful in promoting the gradual withdrawal of ports with low unit waterfront handling capacity or long waterfronts occupied by ports. These ports are relatively expensive due to modernization. In port construction, many methods are beneficial, following the green concept from the whole life cycle of design, construction, and operation, including restoring the intertidal zone, establishing ecological corridors, setting up aquatic animal and plant habitats, building ecological security barriers and water exchange spaces, and providing environmental compensation and pollution control fees for nearby residents.

4.3. Through the Horizontal Coordination of the Port Groups along the River, Balance the Waterfront Load of All Container Ports

In the sustainable utilization of the waterfront, the increase in terminals gradually slows down while the demand for container transport continuously grows. To share the pressure of partial urban ports on waterfront, it is necessary to build a cross-city and cross-province integrated port logistics system in the YRD port group through operation and management, cargo source organization, barge calls, and multimodal transport. Considering the unit container handling capacity of the waterfront within a city at the same level, the waterfront loads of ports vary significantly between cities. On the one hand, the pressure on the waterfront of hub cities is relatively high. The Shanghai International Shipping Center ranks the highest in the YRD, reaching 3000 TEU/m in 2022, while the neighboring Suzhou is relatively less stressful. Therefore, the port cooperation between Shanghai and Suzhou can effectively reduce the pressure of container handling and the resources and environmental burden. It can also optimize the security and connectivity of the shipping network through the new port hub. The SIPG (Shanghai International Port (Group)) has invested in the SZP (Suzhou Port) and many container enterprises in Suzhou. Nanjing, Yangtze River Shipping Center, is under high pressure in the middle of the YRD, and Wuhu, Anhui Shipping Center, is stressful in Anhui Province. On the other hand, non-hub cities are transited to specialized ports of the new port area, from small/medium-sized and general ports. The change in waterfront suppliant is slower than the spurting growth of container transport capacity. The waterfront pressure of container ports in Nantong and Wuxi is 1100 TEU/m and 1000 TEU/m in 2022, respectively. Tongling, Maanshan, Chizhou, and Anqing in 2022 are twice that of 2010, of which Anqing is 8.22 times compared with 2010 (Figure 7).
Hub cities are the core of container port waterfront supply. Although urban expansion and resource and environmental constraints have further squeezed the living space of the port waterfront, the limited waterfront and land use will be inclined at the national and provincial levels. It will also take inland waterway shipping and container intermodal transport as an important part of future development. Shanghai Waigaoqiao, Nanjing Longtan, and Wuhu Zhujiaqiao are still in expansion. Non-hub cities are not major in shipping. The pressure on the shipping volume and routes increased considerably during the study period. The excessive development of the port waterfront leads to resource waste, and inactive development puts serious pressure on collection and distribution. Some local governments and practitioners need to pay more attention to the planning of the container port system and investment in specialized and large-scale ports.
Therefore, researchers and governments should focus on integrated port cities, shifting from hub ones. A cross-city comprehensive port and shipping logistics system is expected when there is a bottleneck in the hub area, using the resources of the surrounding cities. Some practices on co-construction and sharing transport infrastructure that break administrative boundaries are shown. The non-hub port areas’ container transport pressure is relatively high, especially as more cities join the container shipping system. Shipping will transfer the original non-container transport to container transport and the original overland transport to inland waterway transport. Practitioners in these cities must adapt to container shipping, including proficiency in operating rules and procedures and matching infrastructure. The waterfront supply of container ports can help these cities form shipping interfaces for the inland container and close the gap with the first-mover cities.

4.4. There Are Barriers between Higher and Lower Levels or between Different Departments and Cities, Which Can Be Solved by the Yangtze River Delta Integration Mechanism

After going through the process from “conflict” to “mitigation”, the relationship between the development and utilization of port waterfront and people’s life, resource management, and environmental protection will eventually move towards “coordination”. At present, container port waterfront management involves many government departments, such as development and reform, water conservancy, natural resources, transportation, agriculture, ecological environment, etc. As the corresponding performance assessment is divided into various departments, relevant departments have issued policies and institutions from their respective functions, with weak connectivity and relevance, as well as a lack of cross-department overall management at the Yangtze River Delta level, and many problems of waterfront resource development and protection are difficult to coordinate in a unified manner. The development, reform, water conservancy, and natural resource departments play prominent roles. The development and reform departments pay attention to the layout of industries and infrastructure along the river and hold the right of approval. The water conservancy departments have the right of waterfront, river management, and related approval. The natural resources departments pay attention to the standardization of natural resources protection and land use along the river and constrain the port construction and operation process through land space planning and ecological red line protection.
The change in the status of departments in the government has affected the direction of shoreline development and protection. The waterfront and industrial transportation planning along the Yangtze River were led by the development and reform department. After 2020, the management of the Yangtze River waterfront was transferred to the water conservancy department. This department focused on water intake protection, flood control, and drainage facilities’ layout while weakening the rationality and predictability of the port layout. At the same time, the natural resources department mastered the dominant power of the national spatial planning, and the red line control thinking was enlarged, and the strong position of the department requires other plans and policies to match it, and some waterfronts cannot be fully utilized. The management and approval of the use of land and water areas are not in the same department, and some of the water areas behind the port are planned for other use types, and vice versa. With the further release of the shipping potential of the Yangtze River, the demand for port waterfront resources is still relatively strong. Some deep-water waterfronts are located within the scope of the reserve and cannot carry out production activities, and some of the rear land areas are not suitable for large-scale exploitation and construction, or the cost is high, which makes the high-quality waterfront resources increasingly tense, especially in Nanjing, Suzhou, and Zhenjiang.
With the implementation of the Yangtze River protection strategy, the riverside industries have gradually withdrawn from the waterfronts, and ports have become one of the few productive waterfront types on the Yangtze River that are still in continuous supply. It is necessary to improve the comprehensive management system of the waterfront with multiple departments and administrative regions to ensure the waterfront supply of key projects. On the basis of total amount control of waterfront utilization, and to strengthen the connection between waterfront planning and other plans, use the hinterland of the waterfront to reduce the occupation of riverside space, releasing it for port use.

5. Conclusions

Based on the summary of remote sensing images and relevant data, this paper calculates the waterfront utilization of the container ports along the Yangtze River in the YRD, analyzes the waterfront organization pattern and change characteristics, and puts forward the enlightenment and countermeasures for the sustainable development of the port waterfronts. The academic contribution of this paper was to analyze the waterfront utilization of inland container ports by combining remote sensing image data and enterprise data, as well as to expand the research of port resources from coastal to inland areas. In addition, this paper puts forward suggestions for sustainable development in view of problems existing in the Yangtze River, which has practical significance for the development of Yangtze River Shipping, exploitation, and protection of land resources along the Yangtze River.
In the YRD, the waterfront utilization of container ports has increased along the Yangtze River, showing a decreasing from downstream to upward, and it has formed dense zones attached to the central cities and major manufacturing bases. The ports with higher length of waterfront are mostly located in the shipping central cities and the Yangtze River estuary. The development direction of container ports is large-scale and specialized. The number of large ports with waterfront utilization of 1000 m and above has increased from six to eleven, and the number of specialized ports has increased from 17 to 23. The utilization of container port waterfront is approaching the periphery of the city and areas with convenient transportation. The utilization of container port shoreline will be close to the periphery of the city and convenient transportation areas. The number of ports with driving distance of no less than 20 km from the city center increased from 18 to 26, and the number of ports with driving distance of less than 10 km from the nearest expressway entrance increased from 16 to 28. The container port waterfronts occupy the ecological reserve, and the conflicts are expanding with the development of shipping, mainly distributed in the Yangtze River estuary, Nanjing, and Tongling.
Based on the empirical analysis, this paper puts forward four enlightenments. First, the exploitation and utilization of the port waterfront has experienced multiple stages of “utilization—conflict—mitigation”. With the transformation of productive waterfront utilization, the pattern of sustainable development along the Yangtze River has changed. Secondly, the conflict between waterfront utilization and protection is inevitable. The traffic volume of ports in conflict with the reserve has reached a considerable scale. It is necessary to face up to the temporary rapid rise of encroachment on the reserve. Third, through the horizontal coordination of the port system along the river, the original focus on the hub cities will be transferred to the comprehensive consideration of the port cities in the whole region, and the waterfront load of different types of container ports can be balanced. Fourth, use the Yangtze River Delta integration system and mechanism to solve the barriers between higher and lower levels or between different departments and regions.
In further research, on the one hand, by collecting more remote sensing images and historical documents, the research time can be extended to the 1990s, and the research area can be extended to the middle and upper reaches of the Yangtze River to build a more complete waterfront and land use database of ports. On the other hand, through surveys of some waterfront sections and port enterprises, it is possible to further study the relationship between waterfront utilization and protection and its driving mechanisms, especially the challenges faced by ecological service functions, the impact of port and shipping technology changes on waterfront resources and environment [2], to comb the evolution of the interactive relationship between waterfront development, to explore the port carrying capacity, to explore economic development, and to explore the issue of the transfer of externalities of inland port shipping [72].

Author Contributions

Conceptualization, W.L. and Y.C.; methodology, W.L.; software, W.L. and W.C.; formal analysis, W.L.; investigation, W.L. and W.C.; resources, Y.C.; data curation, W.L.; writing original draft preparation, W.L. and W.C.; writing review and editing, W.L. and Y.C.; visualization, W.L.; supervision, Y.C.; funding acquisition, Y.C. All authors have read and agreed to the published version of the manuscript.

Funding

This research was funded by National Natural Science Foundation of China, grant number 42101177, 41771139, 42071163.

Data Availability Statement

No new data were created or analyzed in this study. Data sharing is not applicable to this article.

Conflicts of Interest

The authors declare no conflict of interest.

References

  1. UNCTAD. Port Marketing and Challenge of the Third Generation Port; UNCTAD: Geneva, Switzerland, 1992. [Google Scholar]
  2. Witte, P.; Wiegmans, B.; Ng AK, Y. A critical review on the evolution and development of inland port research. J. Transp. Geogr. 2019, 74, 53–61. [Google Scholar] [CrossRef]
  3. Ducruet, C.; Lee, S.W. Frontline soldiers of globalisation: Port–city evolution and regional competition. Geojournal 2006, 67, 107–122. [Google Scholar] [CrossRef]
  4. Monios, J.; Wilmsmeier, G. Between path dependency and contingency: New challenges for the geography of port system evolution. J. Transp. Geogr. 2016, 51, 247–251. [Google Scholar] [CrossRef] [Green Version]
  5. Notteboom, T.E. Spatial dynamics in the container load centers of the Le Havre-Hamburg range. Z. Wirtsch. 2007, 51, 108–123. [Google Scholar] [CrossRef]
  6. Wang, J.J.; Cheng MC, B. From a hub port city to a global supply chain management center: A case study of Hong Kong. J. Transp. Geogr. 2010, 18, 104–115. [Google Scholar] [CrossRef]
  7. Khanna, P. Connectography: Mapping the Future of Global Civilization; Random House: New York, NY, USA, 2016. [Google Scholar]
  8. Woodburn, A. Effects of rail network enhancement on port hinterland container activity: A United Kingdom case study. J. Transp. Geogr. 2013, 33, 162–169. [Google Scholar] [CrossRef]
  9. Frémont, A.; Franc, P.; Slack, B. Inland barge services and container transport: The case of the ports of Le Havre and Marseille in the European context. Cybergeo Espace Société Territ. 2009, 437. [Google Scholar] [CrossRef]
  10. Hayuth, Y. Containerization and the load center concept. Econ. Geogr. 1981, 57, 160–176. [Google Scholar] [CrossRef]
  11. Wang, J.J.; Slack, B. The Evolution of a regional container port system: The Pearl River Delta. J. Transp. Geogr. 2000, 8, 263–275. [Google Scholar] [CrossRef]
  12. Notteboom, T.E.; Rodrigue, J.P. Port regionalization: Towards a new phase in port development. Marit. Policy Manag. 2005, 32, 297–313. [Google Scholar] [CrossRef]
  13. Notteboom, T.E. An Economic Analysis of the European Seaport System; Report Prepared for the European Sea Ports Organisation (ESPO); ITMMA: Antwerp, Belgium, 2009. [Google Scholar]
  14. Wilmsmeier, G.; Monios, J.; Rodrigue, J.P. Drivers for Outside-In port hinterland integration in Latin America: The case of Veracruz, Mexico. Res. Transp. Bus. Manag. 2015, 14, 34–43. [Google Scholar] [CrossRef] [Green Version]
  15. Meisel, F.; Thomas, K.; Bierwirth, C. Integrated production and intermodal transportation planning in large scale production-distribution-networks. Transp. Res. Part E Logist. Transp. Rev. 2013, 60, 62–78. [Google Scholar] [CrossRef]
  16. Ng AK, Y.; Gujar, G. The spatial characteristics of inland transport hubs: Evidences from Southern India. J. Transp. Geogr. 2009, 17, 346–356. [Google Scholar]
  17. Carruthers, R.; Bajpai, J.N. Trends in Trade and Logistics: An East Asian Perspective; Working Paper No. 2; Transport Sector Unit; World Bank: Washington, DC, USA, 2002. [Google Scholar]
  18. Roso, V. The emergence and significance of dry ports: The case of the Port of Goteborg. World Rev. Intermodal Transp. Res. 2009, 2, 296–310. [Google Scholar] [CrossRef]
  19. Notteboom, T.E.; Konings, R. Network dynamics in container transport by barge. BELGEO 2004, 4, 461–478. [Google Scholar] [CrossRef] [Green Version]
  20. Pan, K.; Cao, Y.; Liu, K.; Liang, S.; Wei, H. Evolution and spatial structure of container liner network in the Yangtze River Delta. Sci. Geogr. Sin. 2017, 37, 682–690. [Google Scholar]
  21. Lu, D. The “T”- shaped structure of land development and economic arrangements and the sustainable development of the Yangtze Economic Belt. Macroecon. Manag. 2018, 11, 43–47+55. [Google Scholar]
  22. Veenstra, A.; Notteboom, T.E. The development of the Yangtze River container port system. J. Transp. Geogr. 2011, 19, 772–781. [Google Scholar] [CrossRef]
  23. Cao, Y.; Jiang, Z.; Chen, H.; Wu, W.; Liang, S. The evolution course and mechanism of the port system along the Yangtze River. Prog. Geogr. 2015, 34, 1430–1440. [Google Scholar]
  24. Zou, H.; Duan, X.; Zhao, H.; Wang, L. Spatial evolution of pollution-intensive industries and its effects on pollution emissions in Yangtze River Delta. J. Univ. Chin. Acad. Sci. 2016, 33, 703–710. [Google Scholar]
  25. Chen, C.; Zhen, Y. Analysis on the waterfront resources utilization change and reasonableness along the Yangtze River in Jiangsu Province. J. Nat. Resour. 2014, 29, 633–642. [Google Scholar]
  26. Liang, S.; Liu, W.; Cao, Y.; Wu, W. Exploitation of port coastline resources and its spatial effects along the Yangtze River. Resour. Environ. Yangtze Basin 2019, 28, 2672–2680. [Google Scholar]
  27. Styhre, L.; Winnes, H.; Black, J.; Lee, J.; Le-Griffin, H. Greenhouse gas emissions from ships in ports—Case studies in four continents. Transp. Res. Part D Transp. Environ. 2017, 54, 212–224. [Google Scholar] [CrossRef]
  28. Hayuth, Y. The Port-urban Interface: An Area in Transition. Area 1982, 14, 219–224. [Google Scholar]
  29. Ierland, E.V.; Graveland, C.; Huiberts, R. An environmental economic analysis of the new rail link to European main port Rotterdam. Transp. Res. Part D 2000, 5, 197–209. [Google Scholar] [CrossRef]
  30. Bouman, E.A.; Lindstad, E.; Rialland, A.I.; Strømman, A.H. State-of-the-art technologies, measures, and potential for reducing GHG emissions from shipping—A review. Transp. Res. Part D Transp. Environ. 2017, 52, 408–421. [Google Scholar] [CrossRef]
  31. Liu, L.; Xu, W.; Yue, Q.; Teng, X.; Hu, H. Problems and countermeasures of coastline protection and utilization in China. Ocean Coast. Manag. 2018, 153, 124–130. [Google Scholar] [CrossRef]
  32. Airoldi, L.; Abbiati, M.; Beck, M.W.; Hawkins, S.J.; Jonsson, P.R.; Martin, D.; Moschella, P.S.; Sundelo, A.; Thompson, R.C.; Aberg, P. An ecological perspective on the deployment and design of low crested and other hard coastal defence structures. Coast. Eng. 2005, 52, 1073–1087. [Google Scholar] [CrossRef] [Green Version]
  33. Ghosh, M.K.; Kumar, L.; Roy, C. Monitoring the coastline change of Hatiya Island in Bangladesh using remote sensing techniques. ISPRS J. Photogramm. Remote Sens. 2015, 101, 137–144. [Google Scholar] [CrossRef]
  34. Lin, L.; Pussella, P. Assessment of vulnerability for coastal erosion with GIS and AHP techniques case study: Southern coastline of Sri Lanka. Nat. Resour. Model. 2017, 30, e12146. [Google Scholar] [CrossRef]
  35. Shi, C.; Hutchinson, S.; Xu, S. Evaluation of coastal zone sustainability: An integrated approach applied in Shanghai Municipality and Chong Ming Island. J. Environ. Manag. 2004, 71, 335–344. [Google Scholar] [CrossRef] [PubMed]
  36. Xue, X.; Hong, H.; Charles, A.T. Cumulative environmental impacts and integrated coastal management: The case of Xiamen, China. J. Environ. Manag. 2004, 71, 271–283. [Google Scholar] [CrossRef] [PubMed]
  37. Lau, M. Integrated coastal zone management in the People’s Republic of China—An assessment of structural impacts on decision-making processes. Ocean Coast. Manag. 2005, 48, 115–159. [Google Scholar] [CrossRef]
  38. Kenchington, R.; Crawford, D. On the meaning of integration in coastal zone management. Ocean Coast. Manag. 1993, 21, 109–127. [Google Scholar] [CrossRef]
  39. Portman, M.E.; Esteves, L.S.; Le, X.Q.; Khan, A.Z. Improving integration for integrated coastal zone management: An eight country study. Sci. Total Environ. 2012, 439, 194–201. [Google Scholar] [CrossRef] [Green Version]
  40. Zhai, G.; Suzki, T. International Benefit Transfer Related to Coastal Zones: Evidence from Northeast Asia. Mar. Resour. Econ. 2009, 24, 171–186. [Google Scholar] [CrossRef]
  41. Li, F.; Ding, D.; Chen, Z.; Chen, H.; Shen, T.; Wu, Q.; Zhang, C. Change of sea reclamation and the sea-use management policy system in China. Mar. Policy 2020, 115, 103861. [Google Scholar] [CrossRef]
  42. Liu, Y.; Li, J.; Sun, C.; Wang, X.; Tian, P.; Chen, L.; Zhang, H.; Yang, X.; He, G. Thirty-year changes of the coastlines, wetlands, and ecosystem services in the Asia major deltas. J. Environ. Manag. 2023, 326, 116675. [Google Scholar] [CrossRef]
  43. Hoyle, B. Global and Local Change on the Port-City Waterfront. Geogr. Rev. 2000, 90, 395. [Google Scholar] [CrossRef]
  44. Jones, A.L. Regenerating urban waterfronts—Creating better futures—From commercial and leisure market places to cultural quarters and innovation districts. Plan. Pract. Res. 2017, 32, 333–344. [Google Scholar] [CrossRef]
  45. Yu, X. Research on the Construction and Development of the Yangtze River Industrial Belt; Science Press: Beijing, China, 1997. [Google Scholar]
  46. Yang, G.; Shi, S.; Wang, C.; An, N. Problems in the river bank use and harbour layout along Jiangsu reaches of the Changjiang River and countermeasures for their solution. Resour. Environ. Yangtze Basin 1999, 8, 17–22. [Google Scholar]
  47. Zhang, N.; Gao, J.; Xu, S.; Tang, S.; Guo, M. Establishing an evaluation index system of Coastal Port shoreline resources utilization by objective indicators. Ocean Coast. Manag. 2022, 217, 106003. [Google Scholar] [CrossRef]
  48. Mann, R.B. Ten trends in the continuing renaissance of urban waterfronts. Landsc. Urban Plan. 1988, 16, 177–199. [Google Scholar] [CrossRef]
  49. Suchanek, T.H. Temperate coastal marine communities: Biodiversity and threats. Am. Zool. 1994, 34, 110–114. [Google Scholar] [CrossRef]
  50. Franzen, M.O.; Fernandes EH, L.; Siegle, E. Impacts of coastal structures on hydro-morphodynamic patterns and guidelines towards sustainable coastal development: A case studies review. Reg. Stud. Mar. Sci. 2021, 44, 101800. [Google Scholar] [CrossRef]
  51. Xu, L.; Xie, F.; Wang, C. Passive or Proactive Capacity Sharing? A Perspective of Cooperation and Competition between Two Regional Ports. Marit. Policy Manag. 2022, 49, 492–509. [Google Scholar] [CrossRef]
  52. Wan, S.Y.; Yang, X.H.; Chen, X.Y.; Qu, Z.N.; An, C.J.; Zhang, B.Y.; Lee, K.; Bi, H.F. Emerging marine pollution from container ship accidents: Risk characteristics, response strategies, and regulation advancements. J. Clean. Prod. 2022, 376, 134266. [Google Scholar] [CrossRef]
  53. Veloso-Gomes, F.; Taveira-Pinto, F. Portuguese coastal zones and the new coastal management plans. J. Coast. Conserv. 2003, 9, 25. [Google Scholar] [CrossRef]
  54. Finkl, C.W.; Kruempfel, C. Threats, obstacles and barriers to coastal environmental conservation: Societal perceptions and managerial positionalities that defeat sustainable development. In Proceedings of the 1st International Conference on Coastal Conservation and Management in the Atlantic and Mediterranean Seas, Tavira, Portugal, 17–21 April 2005; Veloso-Gomez, F., Taveira Pinto, F., Da Neves, L., Sena, A., Ferreira, O., Eds.; University of Porto: Porto, Portugal, 2005; pp. 3–28. [Google Scholar]
  55. Magoon, O.T.; Edge, B.L.; Stone, K.E. The impact of anthropogenic activities on coastal erosion. In Proceedings of the 27th International Conference on Coastal Engineering (ICCE), Sydney, Australia, 16–21 July 2000; pp. 3934–3940. [Google Scholar]
  56. Kudale, M.D. Impact of port development on the coastline and the need for protection. Indian J. Geo-Mar. Sci. 2010, 39, 597–604. [Google Scholar]
  57. Pupienis, D.; Jonuškaite, S.; Jarmalavičius, D.; Žilinskas, G. Klaipeda port jetties impact on the Baltic Sea shoreline dynamics, Lithuania. J. Coast. Res. 2013, 165, 2167–2172. [Google Scholar] [CrossRef]
  58. Prumm, M.; Iglesias, G. Impacts of port development on estuarine morphodynamics: Ribadeo (Spain). Ocean Coast. Manag. 2016, 130, 58–72. [Google Scholar] [CrossRef] [Green Version]
  59. Zhu, H.; Yang, G.; Wan, R.; Ma, R.; Duan, X. Waterfront resources evaluation and Eco-sensitivity analysis in distributing ports along the Yangtze River mainstream in Nanjing. Resour. Environ. Yangtze Basin 2005, 14, 404–408. [Google Scholar]
  60. Chen, P.; Gu, H.; Wu, J.; Liao, L. Zoning assessment of suitability for port development and protection of islands—An example of Dayawan bay. Mar. Environ. Sci. 2013, 32, 614–618. [Google Scholar]
  61. Aiello, A.; Canora, F.; Pasquariello, G.; Spilotro, G. Shoreline variations and coastal dynamics: A space–time data analysis of the Jonian littoral, Italy. Estuar. Coast. Shelf Sci. 2013, 129, 124–135. [Google Scholar] [CrossRef]
  62. Kuleli, T. Quantitative analysis of shoreline changes at the Mediterranean Coast in Turkey. Environ. Monit. Assess. 2010, 167, 387–397. [Google Scholar] [CrossRef]
  63. Valderrama-Landeros, L.H.; Martell-Dubois, R.; Ressl, R.; Silva-Casarin, R.; CruzRamirez, C.J.; Munoz-Perez, J.J. Dynamics of coastline changes in Mexico. J. Geogr. Sci. 2019, 29, 1637–1654. [Google Scholar] [CrossRef] [Green Version]
  64. Cao, W.; Cao, Y.; Wu, W.; Liang, S. Water-front resource evaluation and port development along Chaohu reaches of Changjiang River. Hum. Geogr. 2008, 101, 64–68. [Google Scholar]
  65. Xu, C.; Shi, C. Research into valuation index system of port shoreline resource. J. Hohai Univ. (Philos. Soc. Sci.) 2010, 12, 55–58+92. [Google Scholar]
  66. Kiousopoulos, J. Methodological approach of coastal areas concerning typology and spatial indicators, in the context of integrated management and environmental assessment. J. Coast Conserv. 2008, 12, 19–25. [Google Scholar] [CrossRef]
  67. Yan, F.; Wang, X.; Su, F. Ecosystem service changes in response to mainland coastline movements in China: Process, pattern, and trade-off. Ecol. Indic. 2020, 116, 106337. [Google Scholar] [CrossRef]
  68. Lotze, H.K. Depletion, degradation, and recovery potential of estuaries and coastal seas. Science 2005, 312, 1806–1809. [Google Scholar] [CrossRef]
  69. Kumar, L.; Ghosh, M.K. Land cover change detection of Hatiya Island, Bangladesh, using remote sensing techniques. J. Appl. Remote Sens. 2012, 6, 063608. [Google Scholar] [CrossRef]
  70. Liu, Y.; Zhou, C.; Wang, C.; Sun, G.; Kang, L.; Fang, M. Issues and suggestions on the construction of the Yangtze River Economic Belt. Prog. Geogr. 2015, 34, 1345–1355. [Google Scholar]
  71. Duan, X.; Wang, X.; Xu, X.; Huang, Q.; Xiao, F.; Liang, S.; Zhang, J.; Zou, H. Major problems and countermeasures of ecological protection on the waterfront resources along the Yangtze River. Resour. Environ. Yangtze Basin 2019, 28, 2641–2648. [Google Scholar]
  72. Caris, A.; Limbourg, S.; Macharis, C.; van Lier, T.; Cools, M. Integration of inland waterway transport in the intermodal supply chain: A taxonomy of research challenges. J. Transp. Geogr. 2014, 41, 126–136. [Google Scholar] [CrossRef] [Green Version]
  73. Adland, R.; Fonnes, G.; Jia, H.; Lampe, O.D.; Strandenes, S.P. The impact of regional environmental regulations on empirical vessel speeds. Transp. Res. Part D Transp. Environ. 2017, 53, 37–49. [Google Scholar] [CrossRef]
  74. Panagakos, G.P.; Stamatopoulou, E.V.; Psaraftis, H.N. The possible designation of the Mediterranean Sea as a SECA: A case study. Transp. Res. 2014, 28, 74–90. [Google Scholar] [CrossRef]
  75. Kontovas, C.A. The green ship routing and scheduling problem (GSRSP): A conceptual approach. Transp. Res. 2014, 31, 61–69. [Google Scholar] [CrossRef]
  76. Lupi, M.; Farina, A.; Orsi, D.; Pratelli, A. The capability of motorways of the sea of being competitive against road transport. The case of the Italian mainland and Sicily. J. Transp. Geogr. 2017, 58, 9–21. [Google Scholar]
  77. Ghaderi, H.; Cahoon, S.; Nguyen, H. The role of intermodal terminals in the development of non-bulk rail freight market in Australia. Case Stud. Transp. Policy 2016, 4, 294–305. [Google Scholar] [CrossRef]
  78. Bask, A.; Roso, V.; Andersson, D.; Hämäläinen, E. Development of seaport–dry port dyads: Two cases from Northern Europe. J. Transp. Geogr. 2014, 39, 85–95. [Google Scholar] [CrossRef]
  79. Iannone, F. The private and social cost efficiency of port hinterland container distribution through a regional logistics system. Transp. Res. 2012, 46, 1424–1448. [Google Scholar] [CrossRef]
  80. Irannezhad, E.; Prato, C.G.; Hickman, M. An intelligent decision support system prototype for hinterland port logistics. Decis. Support Syst. 2020, 130, 113227. [Google Scholar] [CrossRef]
  81. Yang, D.; Notteboom, T.E.; Zhou, X. Spatial, temporal and institutional characteristics of entry strategies in inland container terminals: A comparison between Yangtze River and Rhine River. J. Transp. Geogr. 2020, 90, 102928. [Google Scholar] [CrossRef]
  82. Roso, V.; Lumsden, K. A review of dry ports. Marit. Econ. Logist. 2010, 12, 196–213. [Google Scholar] [CrossRef]
  83. Thill, J.C.; Lim, H. Intermodal containerized shipping in foreign trade and regional accessibility advantages. J. Transp. Geogr. 2010, 18, 530–547. [Google Scholar] [CrossRef]
  84. Rodrigues, V.S.; Beresford, A.; Pettit, S.; Bhattacharya, S.; Harris, I. Assessing the cost and CO2e impacts of rerouting UK import containers. Transp. Res. Part A Policy Pract. 2014, 61, 53–67. [Google Scholar] [CrossRef]
Figure 1. Study framework.
Land 12 00778 g001
Figure 2. Identification of the container port waterfront.
Land 12 00778 g002
Figure 3. Distribution of Yangtze container ports and length of their waterfronts’ utilization in the Yangtze River Delta. (a) the number of container ports and the length of waterfront utilization in cities, (b) distribution of container port waterfronts.
Land 12 00778 g003
Figure 4. Difference in waterfront length and land area width in different ports. (a) number of ports with different waterfront length level and average waterfront length and land area width, (b) number of ports with different port function type and average waterfront length and land area width, (c) number of ports with different port operation states and average waterfront length and land area width.
Land 12 00778 g004
Figure 5. The proportion of ports more than 20 km away from the city center, less than 10 km away from nearest expressway entrance, and the nearest expressway entrance shared with cities. (a) the proportion of ports in different years and different states more than 20 km away from the city center, (b) the proportion of ports in different years and different states less than 10 km away from nearest expressway entrance, (c) the proportion of nearest expressway entrance shared by ports and cities.
Land 12 00778 g005
Figure 6. Conflicts between container port waterfront and protection reserve. (a) length of ecological reserve occupied by container ports, (b) length of ecological reserve occupied by container ports in different states, (c) distribution of ecological reserve occupied by container ports.
Land 12 00778 g006
Figure 7. Container port waterfront pressure and container throughputs.
Land 12 00778 g007
Table 1. The distance between the container ports and the city center and the nearest expressway entrance.
2010201420182022New-BuiltRemainingWithdrawed
Average straight-line distance to the city center (km)16.517.518.619.421.518.112.1
Average driving distance to the city center (km)21.823.324.925.729.123.416.7
Average driving time to the city center (min)35.937.839.339.743.337.330.3
Average driving distance to the nearest expressway entrance (km)10.69.57.977.86.512.2
Average driving time to the nearest expressway entrance (min)17.516.414.212.313.911.320.3
Disclaimer/Publisher’s Note: The statements, opinions and data contained in all publications are solely those of the individual author(s) and contributor(s) and not of MDPI and/or the editor(s). MDPI and/or the editor(s) disclaim responsibility for any injury to people or property resulting from any ideas, methods, instructions or products referred to in the content.

