Article

Towards Land Consumption Neutrality and Natural Capital Enhancement at Urban Landscape Scale

by
Donatella Valente
1,2,
Erica Maria Lovello
1,
Cosimo Gaspare Giannuzzi
3,
Angela Maria Scardia Scardia
1,
Maria Victoria Marinelli
1,4 and
Irene Petrosillo
1,2,*
1
Laboratory of Landscape Ecology, Department of Biological and Environmental Sciences and Technologies, University of Salento, 73100 Lecce, Italy
2
NBFC, National Biodiversity Future Center, 90133 Palermo, Italy
3
Regional Agency for the Protection of the Environment of the Apulia Region, Scientific Direction U.O.C. Natural Environment Service Regional Sea Center, 70126 Bari, Italy
4
Institute of Advanced Space Studies Mario Gulich (IG), National Commission for Space Activities (CONAE), National University of Cordoba (UNC), Cordoba 5000, Argentina
*
Author to whom correspondence should be addressed.
Land 2023, 12(4), 777; https://doi.org/10.3390/land12040777
Submission received: 10 March 2023 / Revised: 23 March 2023 / Accepted: 28 March 2023 / Published: 29 March 2023

Abstract

:
Among the UNCCD SDGs 2030, there is the recognition that land consumption can strongly affect the provision of ecosystem services. From the perspective of land degradation neutrality, urban level is the right scale when planning actions against land consumption. The aims of this research are: (1) to assess land consumption at urban landscape scale and its effects on natural capital flow provision; and (2) to identify sustainable strategic planning choices for land consumption mitigation and natural capital enhancement. We propose and test an approach based on multi-temporal landscape spatial analysis (land use/land cover map, land consumption map, and landscape metrics) and ecosystem services’ flow assessment for the identification of areas at risk of loss of natural capital flow. The results have shown that from 2006 to 2019, land consumption has increased with a consequent decrease of natural capital flow. LULC dynamics has been analyzed in terms of landscape risk to lose natural capital flow, highlighting that the management of Galatone urban landscape is still far from land consumption neutrality. Landscape metrics have allowed the analysis of the aggregation among land consumption areas. The mitigation of land consumption should be based on the identification of suitable nature-based solutions towards the balance between past land consumption and future land recovery.

1. Introduction

Humans depend on land for their well-being, but at the same time, they represent a dominant driver able to modify land resources and services across the biosphere [1]. This strong and complex relationship between humankind and land makes land management challenging, requiring a new perspective of “humans-in-nature”, typical of a socio-ecological landscape approach.
Nowadays, land consumption as a form of land degradation represents a global issue [2,3,4,5] that requires global solutions towards land conservation. From this perspective, the 2030 Agenda for Sustainable Development promotes, among others, the Goal 15.3, focused on land degradation neutrality, and the Goal 11.3, focused on sustainable urbanization as crucial challenges towards sustainability [5,6,7,8,9,10,11,12,13,14,15,16,17].
Land provides soil, which produces food and biomass, absorbs, stores, and filters water, and transforms nutrients; as additionally, it represents the basis for biodiversity in terms of suitable habitats for several species [18]. Thus, land consumption can negatively affect the provision of ecosystem services (ES) [19,20] because it brings on the depletion of soil fertility, causing the loss of soil functions, such as nutrient recycling, sediment retention, and carbon sequestration (supporting ecosystems services) with the consequent reduction of food production (provisioning ecosystem services) [21,22,23,24,25].
Land consumption is a very common problem given that land is the place where all human activities take place, causing land-use and land-cover changes [13,19,26,27,28,29,30]. Among others, the rapid and intensive urban sprawl has led to land conversion, reducing forests or farmland for the spatial development of cities (land consumption) [19,26,31]. On the other side, grasslands and forests have been replaced by intensively farmed lands, causing land overexploitation in agricultural landscapes [19,29,32].
It is possible to speak about land consumption when “due to natural processes or human activity, land is no longer able to sustain properly an economic function and/or the original natural ecological function” [33]. The European Environmental Agency (1997) defined the consumption of land as due to the absolute extent of land that is subject to exploitation by agriculture, forestry, or other economic activities. However, more recently the concept of land consumption has been attributed to all lands characterized by the loss of multifunctional, fertile soils and in the deterioration of biodiversity and ecosystem services [34,35,36]. In this sense, land degradation, defined as the reduction or loss of biological productivity and ecological integrity [37], includes land consumption resulting from modified natural lands in urban structures [38]. Degradation factors can be many and include topography (i.e., slope), soil quality, and resilience, extreme events, land-use and land-cover change, and land mismanagement, which can cause environmental, social, and economic impacts [2,39,40].
In particular, intensive land-use and land-cover changes can have evident effects on land consumption [27,30] since they affect the structure and functioning of ecosystems, thus influencing the provision of many ecosystem services [29,31,39,39,41,42,43,44,45,46] and therefore, alter the way land affects human well-being [3,4,44]. In some cases, the human pressure on land can overpass its carrying capacity causing the decrease in land productivity and the incapacity of land to recover [2,47].
Areas strongly characterized by land degradation for their high susceptibility to desertification, such as southern Mediterranean areas [48,49], are particularly affected by land consumption due to human causes, such as urbanization [50,51,52]. However, recognized the natural dynamics of landscapes, the available land can be seen as a balance between land consumption and its restoration through suitable land planning strategies [2,6,14,15]. In this framework, urban planning can mitigate or increase land consumption with effects on the provision of ecosystem services and therefore, on human well-being [2,44,53,54,55]. Since the provision of ecosystem services is impacted by land-use and land-cover (LULC) change, land consumption can strongly affect the capacity of a landscape given by its urban, peri-urban, and rural components to maintain the flow of natural capital intended as bundle of all the services provided by the landscape [56]; therefore, the value of the consumed land can be different according to the natural capital that has been lost. It is recognized that the fast process of global urbanization can affect the provision of ecosystem services by modifying the structure and function of ecosystems in the short-, medium-, and long-term [57,58]. However, the effects of land consumption are very often taken into account in terms of amount (hectares or percentages) without considering the context where it develops. The spatial context can make the difference among land consumption areas with the same extent according to the amount of ecosystem service that have been lost This is the reason why the assessment of land consumption integrated with the ecosystem services flow has become a crucial research topic recently within urban planning [59]. From this perspective, the aims of this research are: (1) to assess land consumption at the urban landscape scale and its effects on natural capital flow provision in three different years; and (2) to identify sustainable strategic planning choices for land consumption mitigation and natural capital enhancement.

Land Consumption and Ecosystem Services Provision in Urban Landscape Planning

There are several typologies of assessment applied to land consumption in the scientific literature, such as approaches based on natural capital or on landscape recovery or on ecosystem services assessment, mixing biophysical and socio-economic assessments based on holistic frameworks able to catch the different features of land consumption [60]. To do so, several studies have estimated land-use change impacts on ecosystem service values [26,32,39,61,62,63,64,65,66], highlighting the importance to investigate the link between landscape planning and ecosystem services provision [67]. Therefore, ecosystem service assessments and their replies to land-use changes can effectively make known the human–land system links [68] and can have high usefulness for acknowledgment of ecological change and for promoting sustainable resource management [69,70,71].
Natural capital refers to the stock of natural resources that supplies flows of crucial goods and services. Therefore, ecosystem services, which represent the “flow” provided by natural capital, are the contributions that ecosystems make to human well-being [72]. Among the typologies of existing capitals, natural capital is rightly considered the fundamental one since it provides the basic conditions for human existence, among others represented by: fertile soil, multifunctional forests, productive land and seas, fresh water of good quality and clean air. These obviously include key ecosystem services, such as pollination, climate regulation, and protection from natural disasters [28]. However, natural capital can be vulnerable to human pressures with consequences on socio-economic systems since it sets the ecological boundaries where social and economic capital can develop simultaneously.
In this context, landscape spatial planning can strongly affect land consumption with effects on the provision of ecosystem services [73,74] through urban plans, regional and national plans, and plans for nature and biodiversity conservation. However, the urban scale is the right level where planning and managing actions against land consumption and sustainable development can be implemented. In particular, the urban multifunctional landscape can be seen as composed of an urban area (the core city, A) and surrounding peri-urban (B) and rural (C) areas (Figure 1).
Thus, urban landscape planning is not focused only on the core area A but also on peri-urban and rural areas. However, the intense development of human activities over the last century has led to a significant deterioration in the landscape because of an urban sprawl affecting not only the peri-urban areas but also the rural areas. This has required measures to protect the environment from human activity; thus, the European Commission has adopted the Directive 2001/42/CEE introducing the Strategic Environmental Assessment (SEA), focused on the quantification of the environmental effects of landscape plans at different scales. In particular, the strategic environmental assessment can be seen as a “plan-shaper” since it informs and is informed by the contents of the specific plan under evaluation and can mitigate its negative effects on socio-ecological systems [75,76]. This tool seems promising to mainstream ecosystem services into urban land-use policy and planning decisions [77,78]. Therefore, it can represent a key environmental prevention tool to make sustainable both the planning and the management step, considering the crucial role played by the environmental monitoring system before, during, and after the plan implementation.

2. Materials and Methods
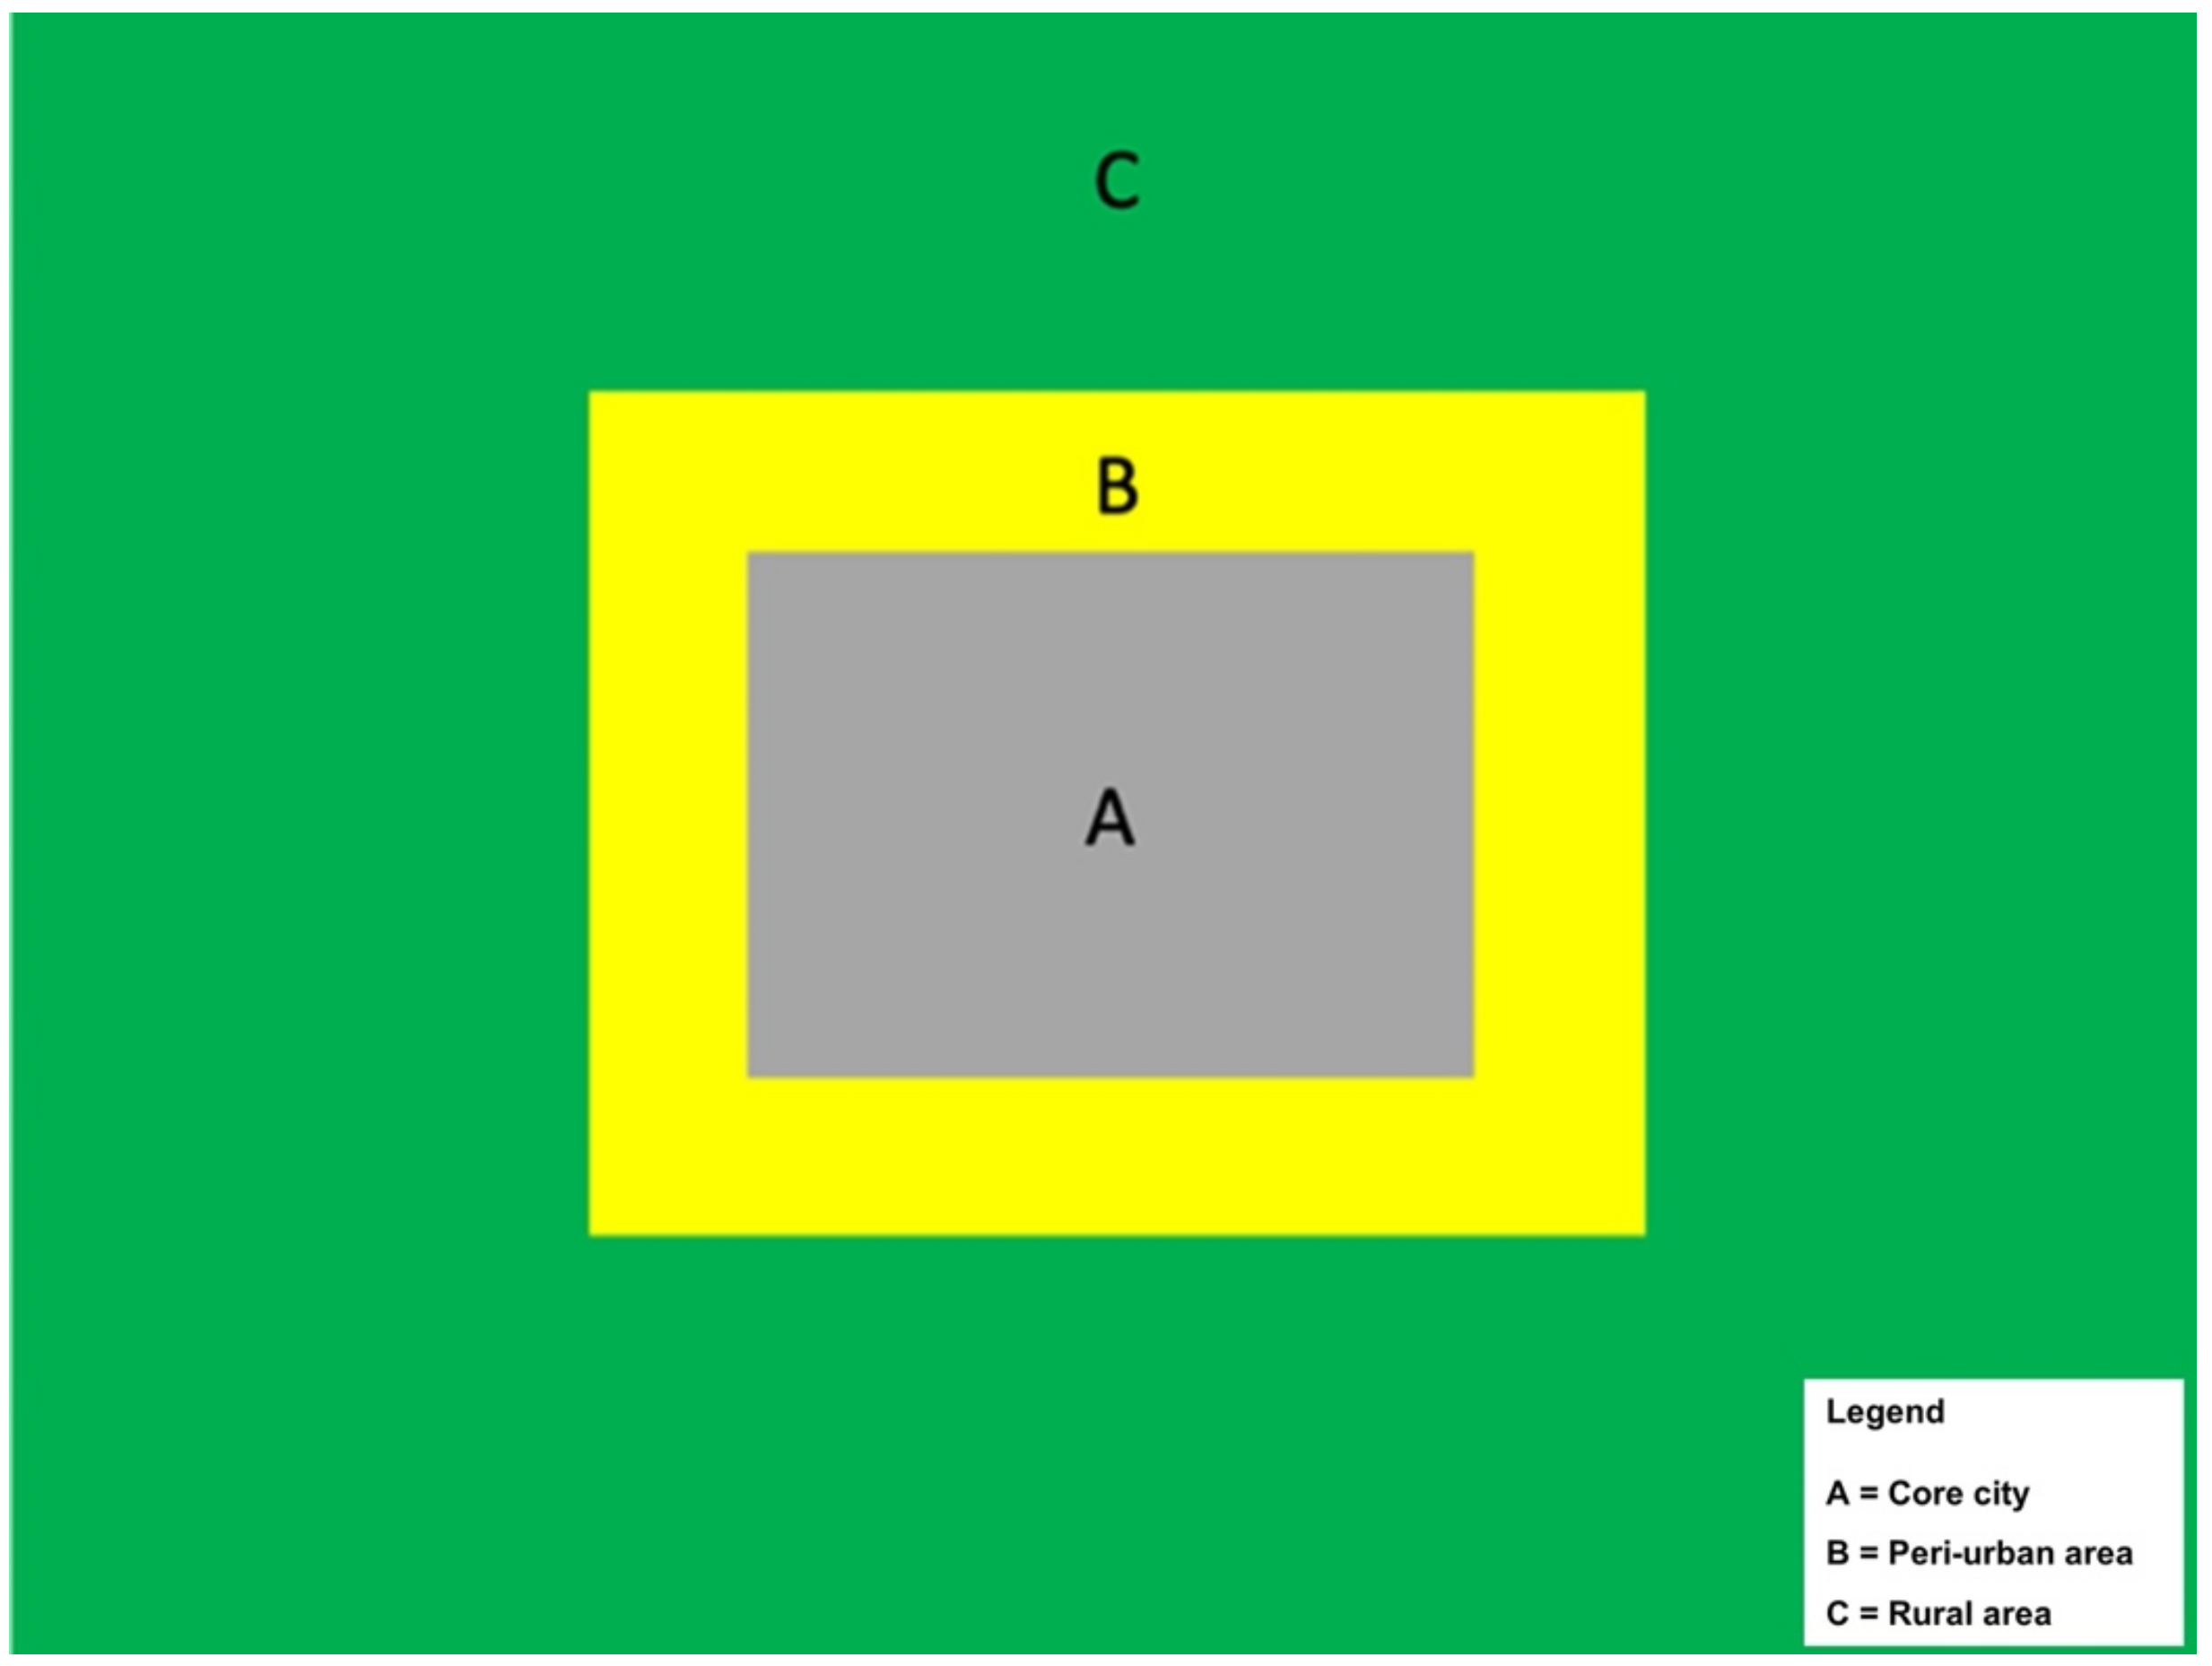
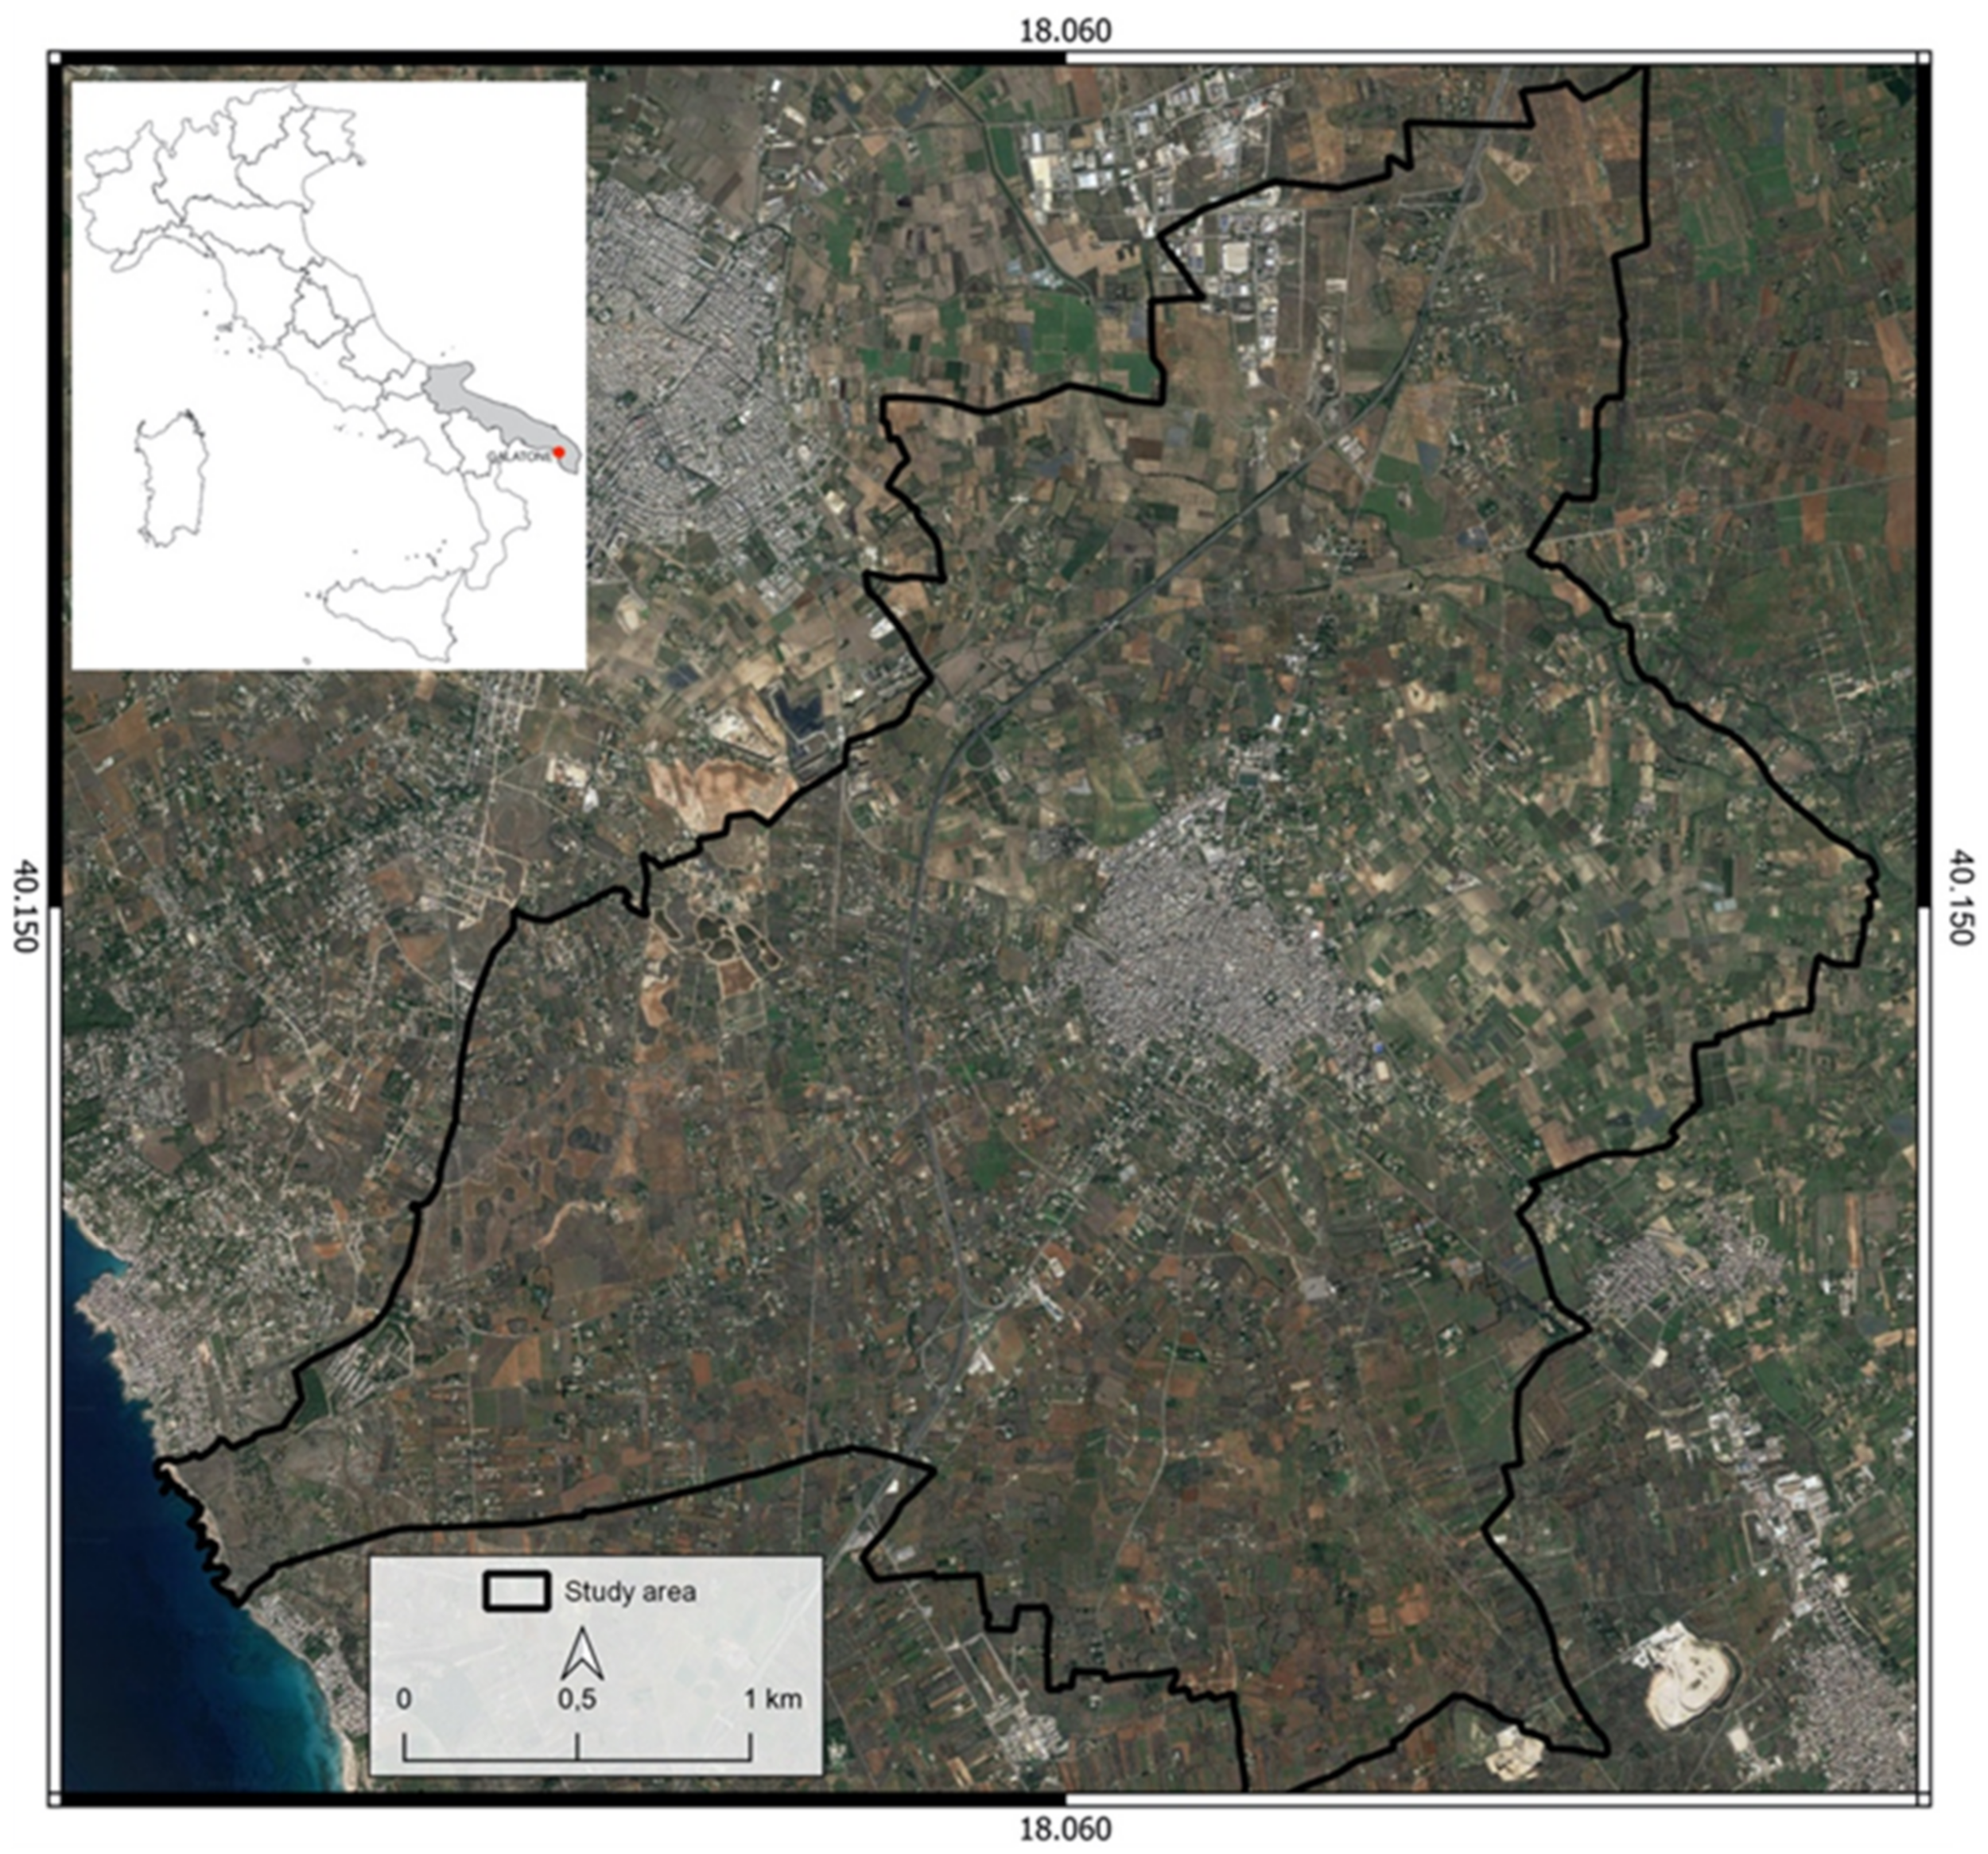
2.1. Study Area

The study area is represented by the urban landscape of Galatone, a municipality in the Apulia region of southern Italy (Figure 2), which extends for 46.54 km2 in a predominantly flat landscape.
Recently, the decision makers of the Municipality of Galatone have elaborated a new urban landscape plan that will be in force until 2030 through the design of innovative urban planning within the framework of the strategic environmental assessment and the goals of the 2030 Agenda for Sustainable Development. In particular, the challenge is to identify possible strategies to allow urban development while mitigating or compensating land consumption and maintaining the flow of natural capital.

2.2. Assessing Land Consumption at Urban Landscape Scale

The approach has been based on landscape spatial analysis, which has been divided into three steps:
(1)
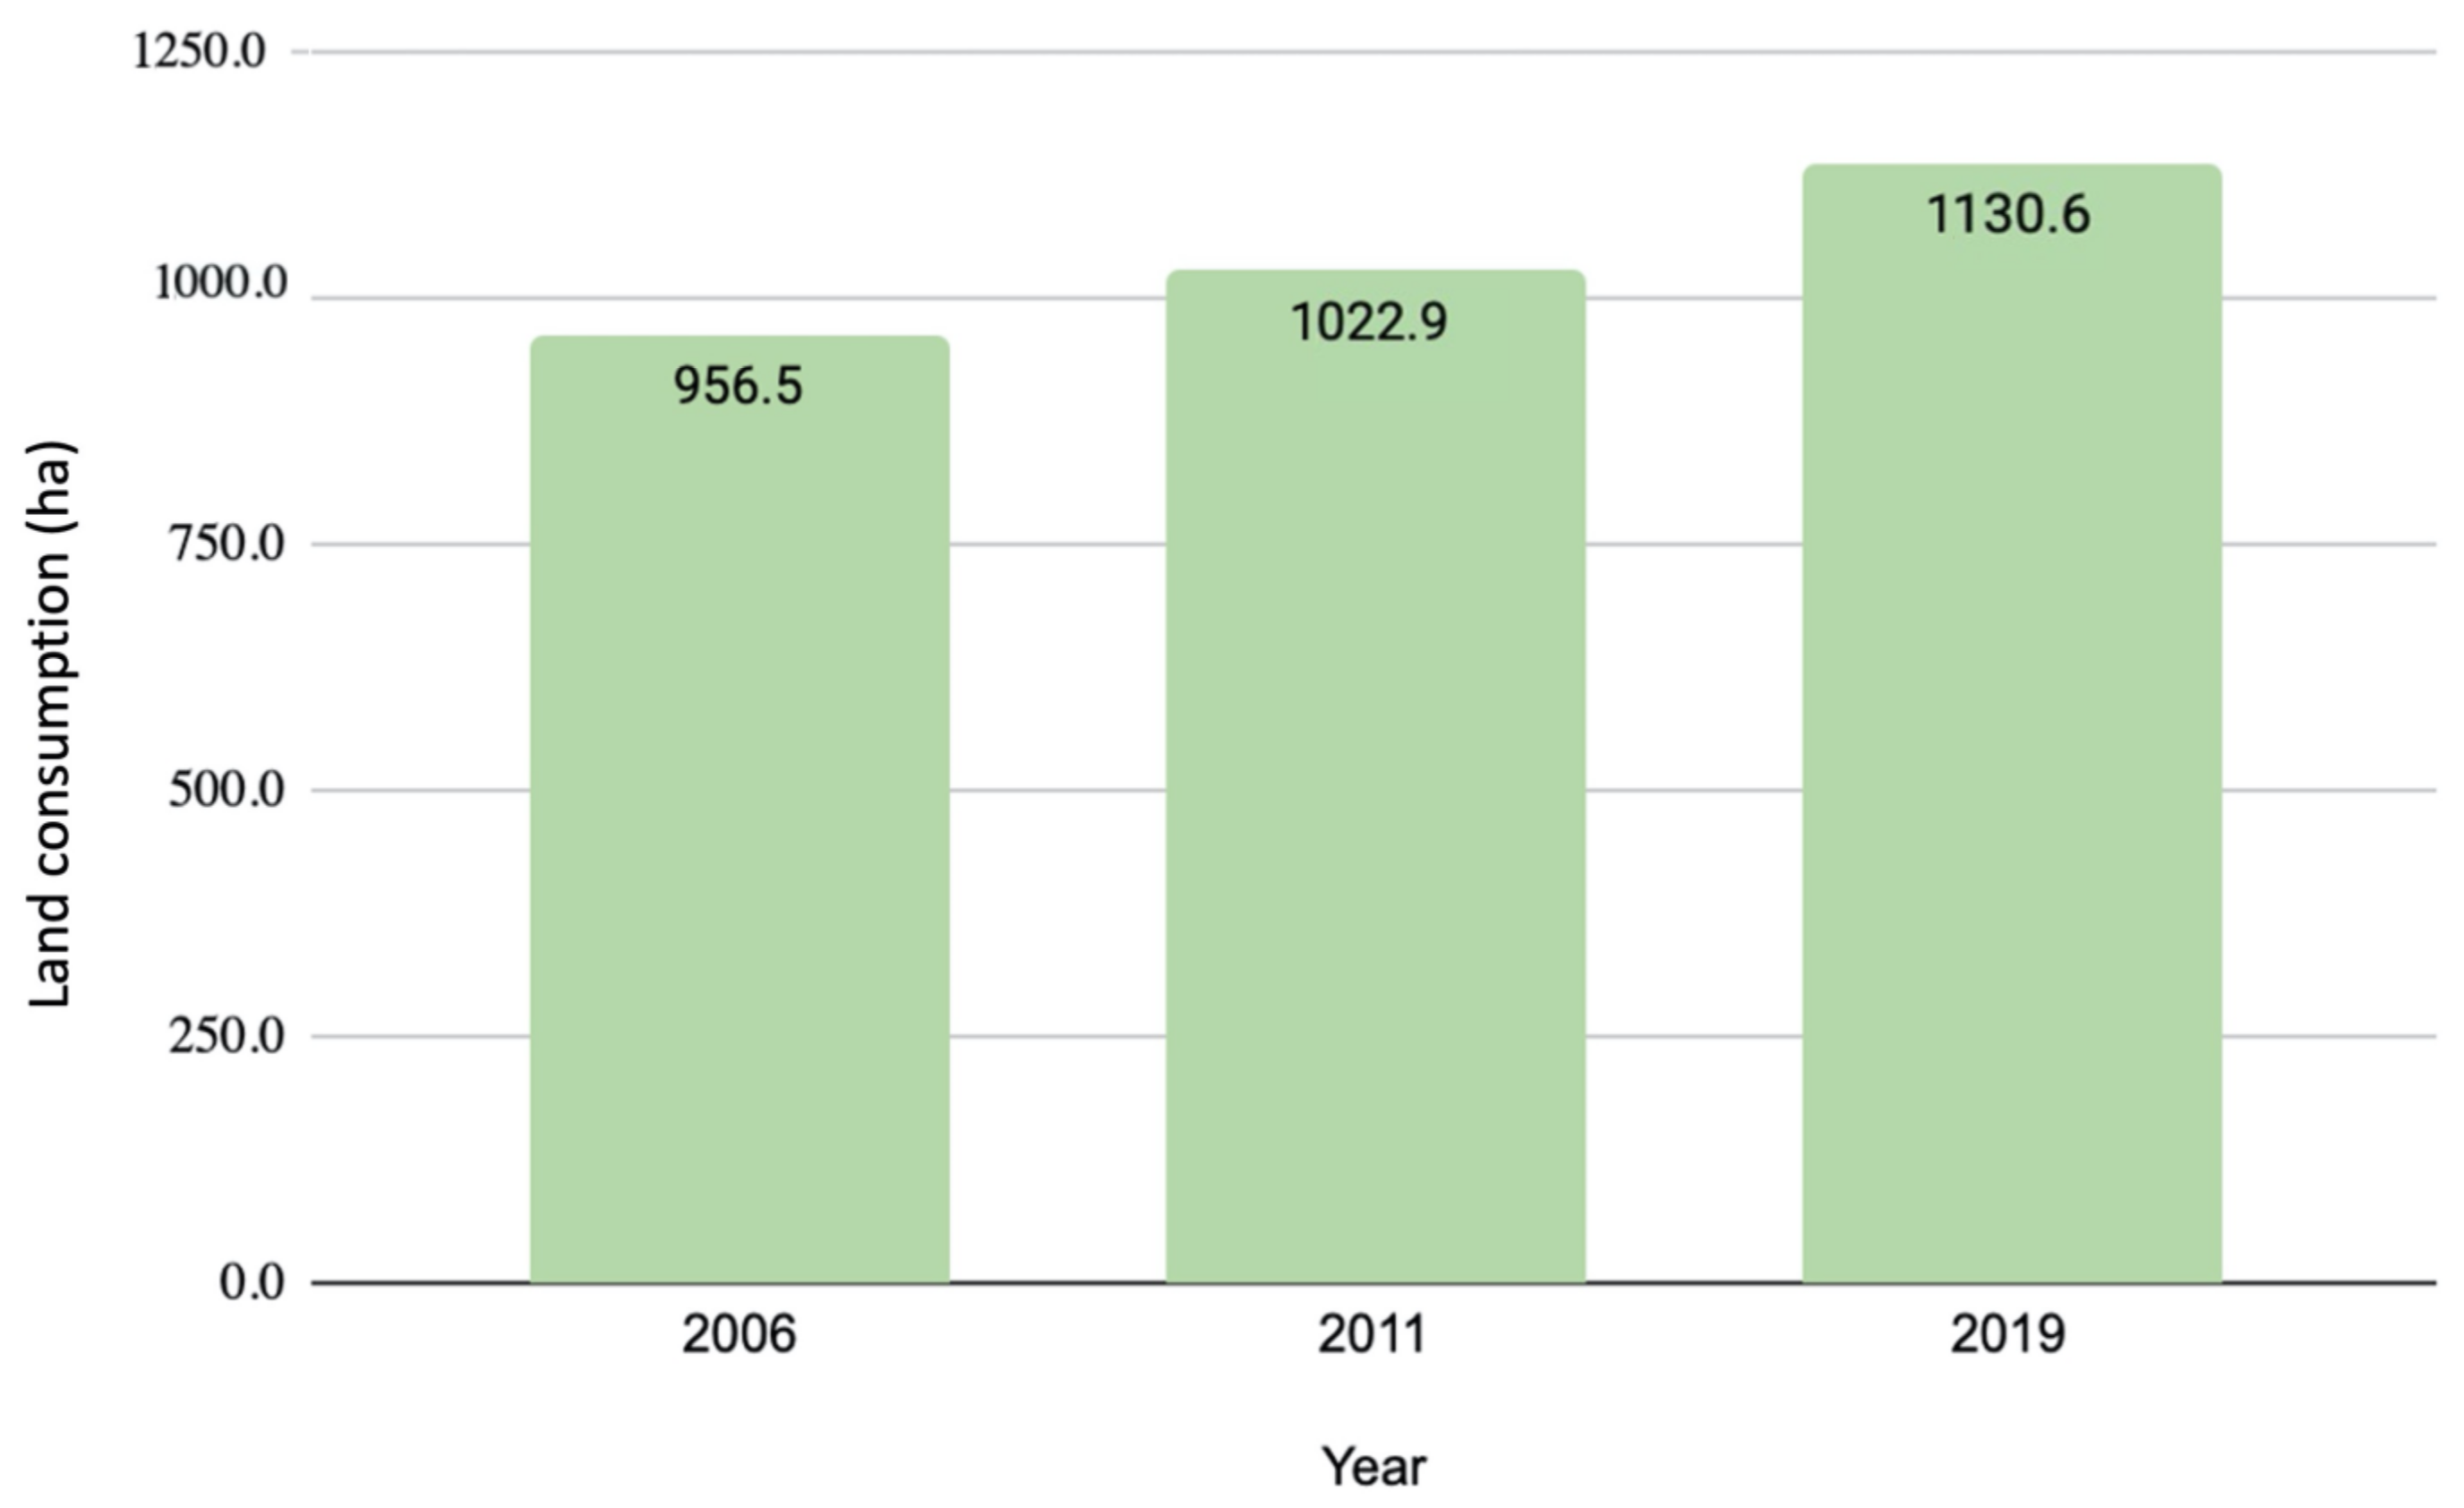
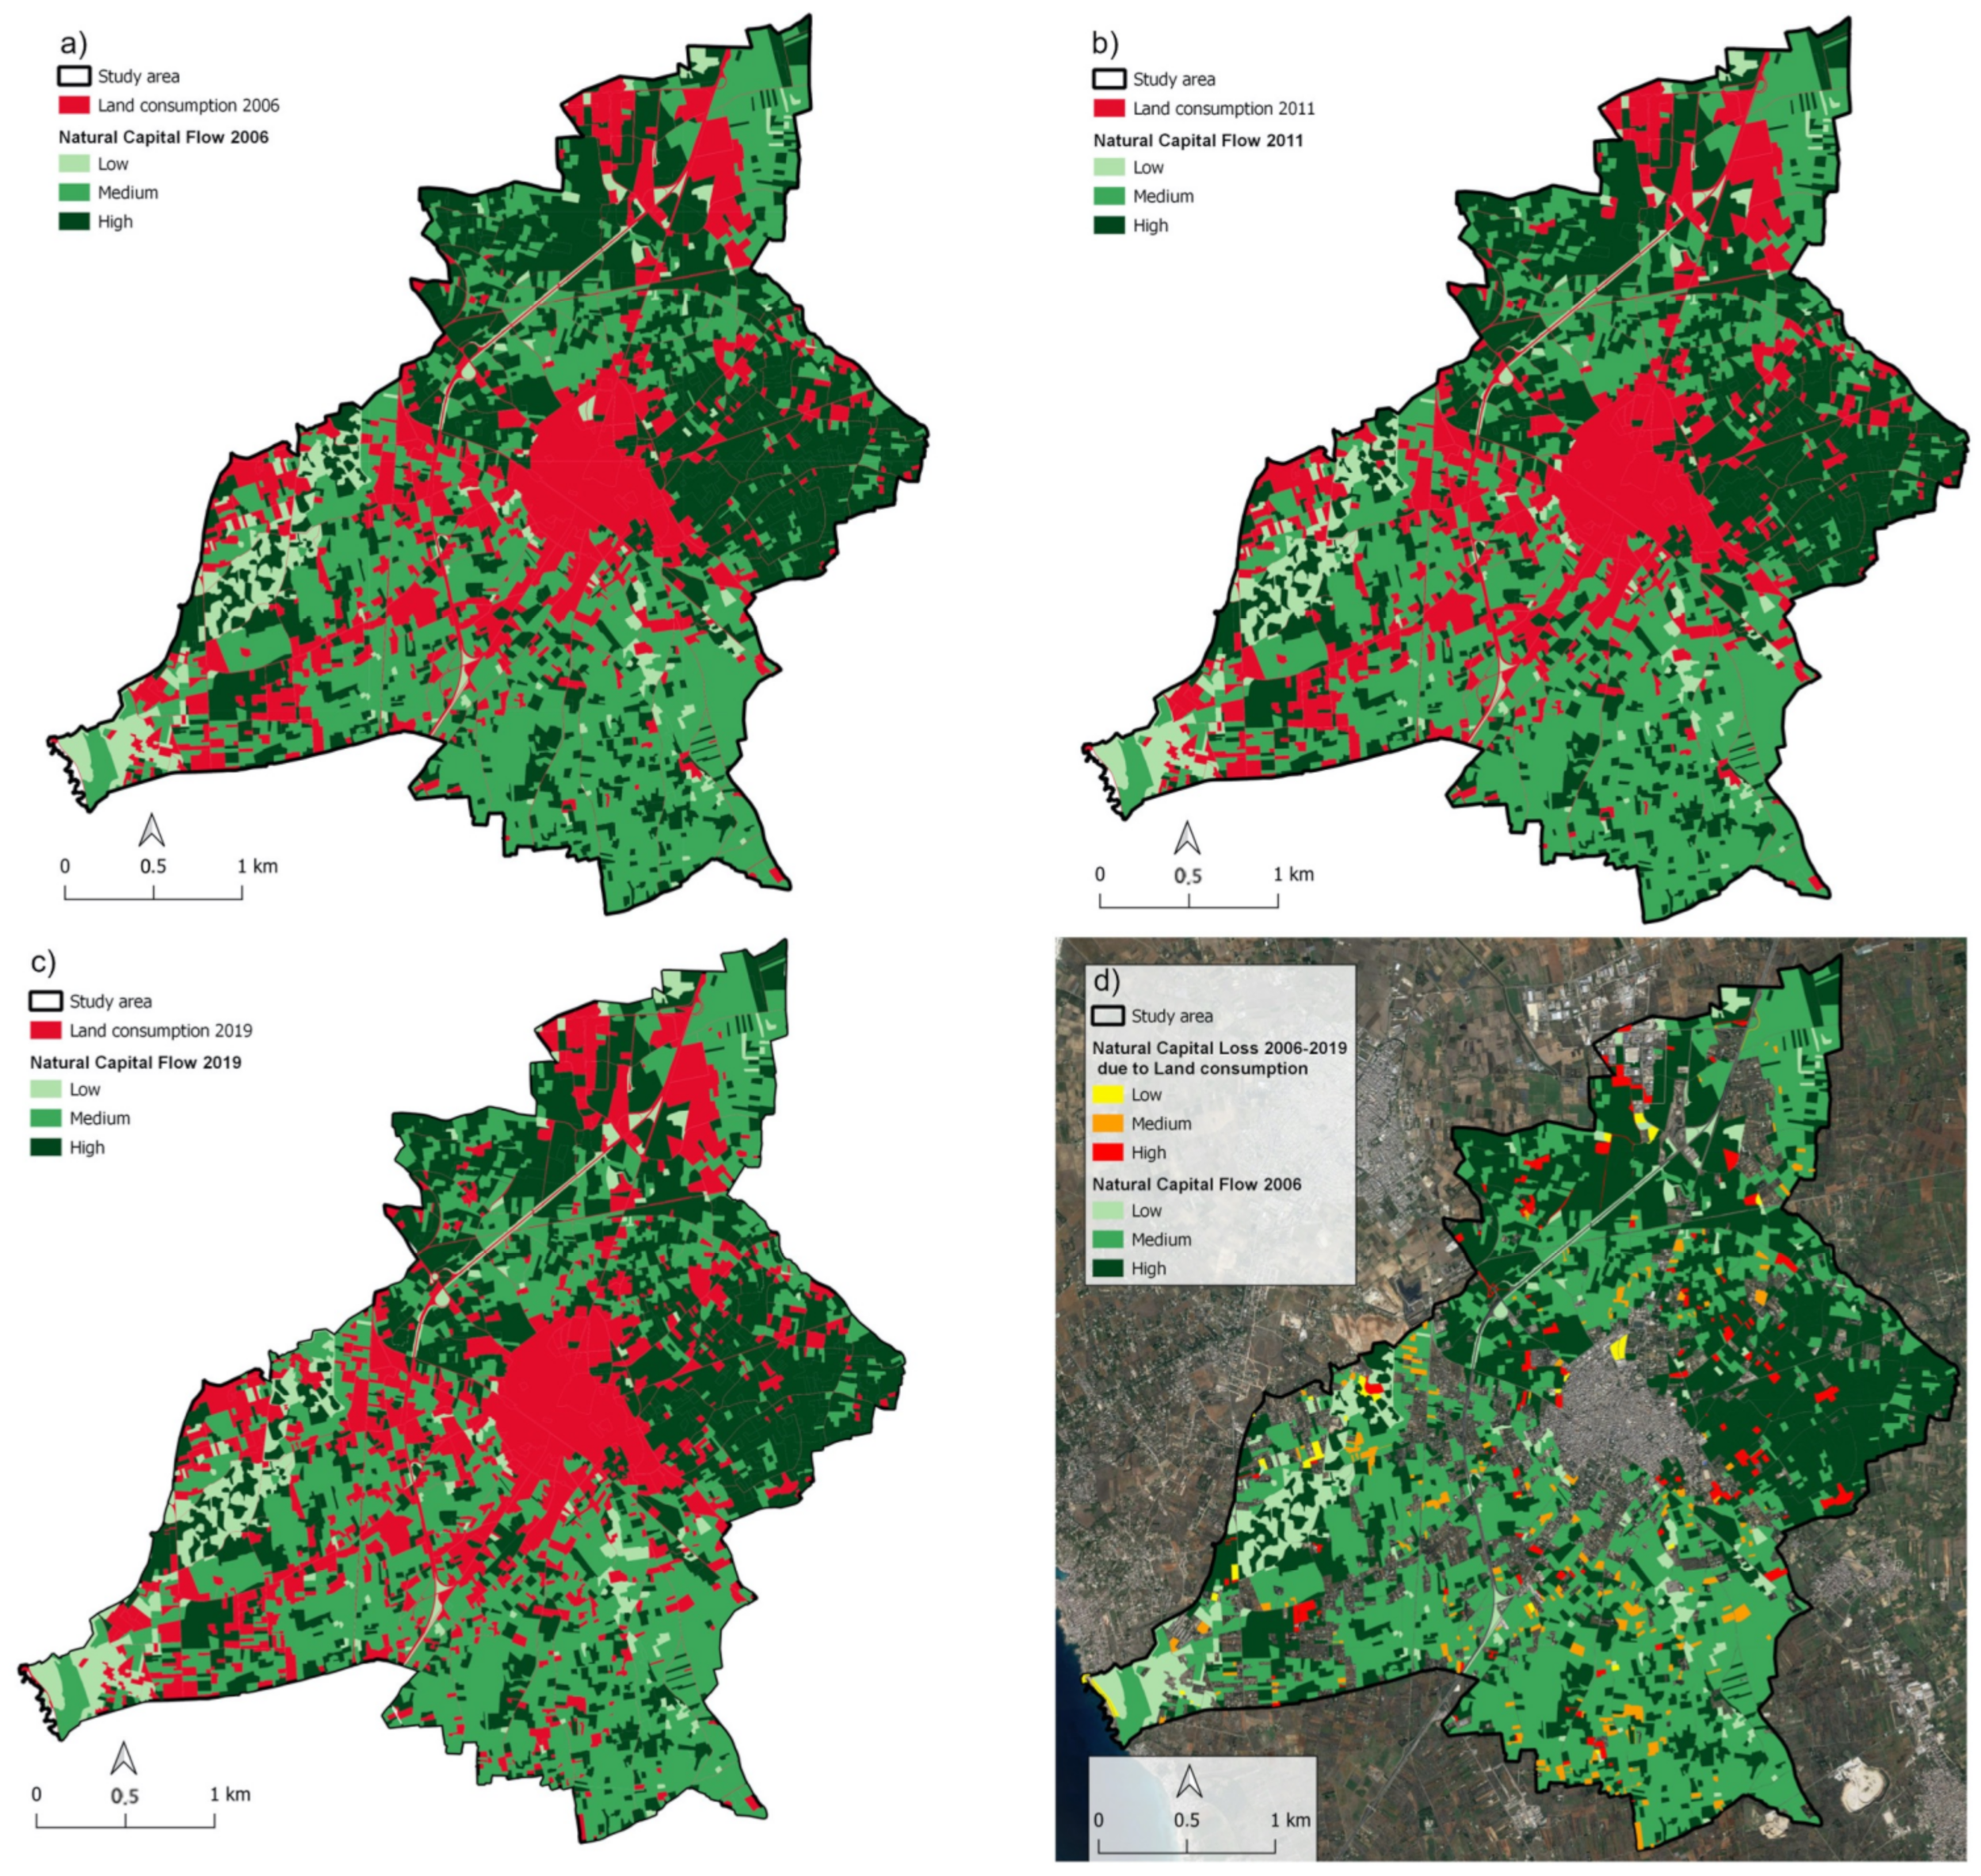
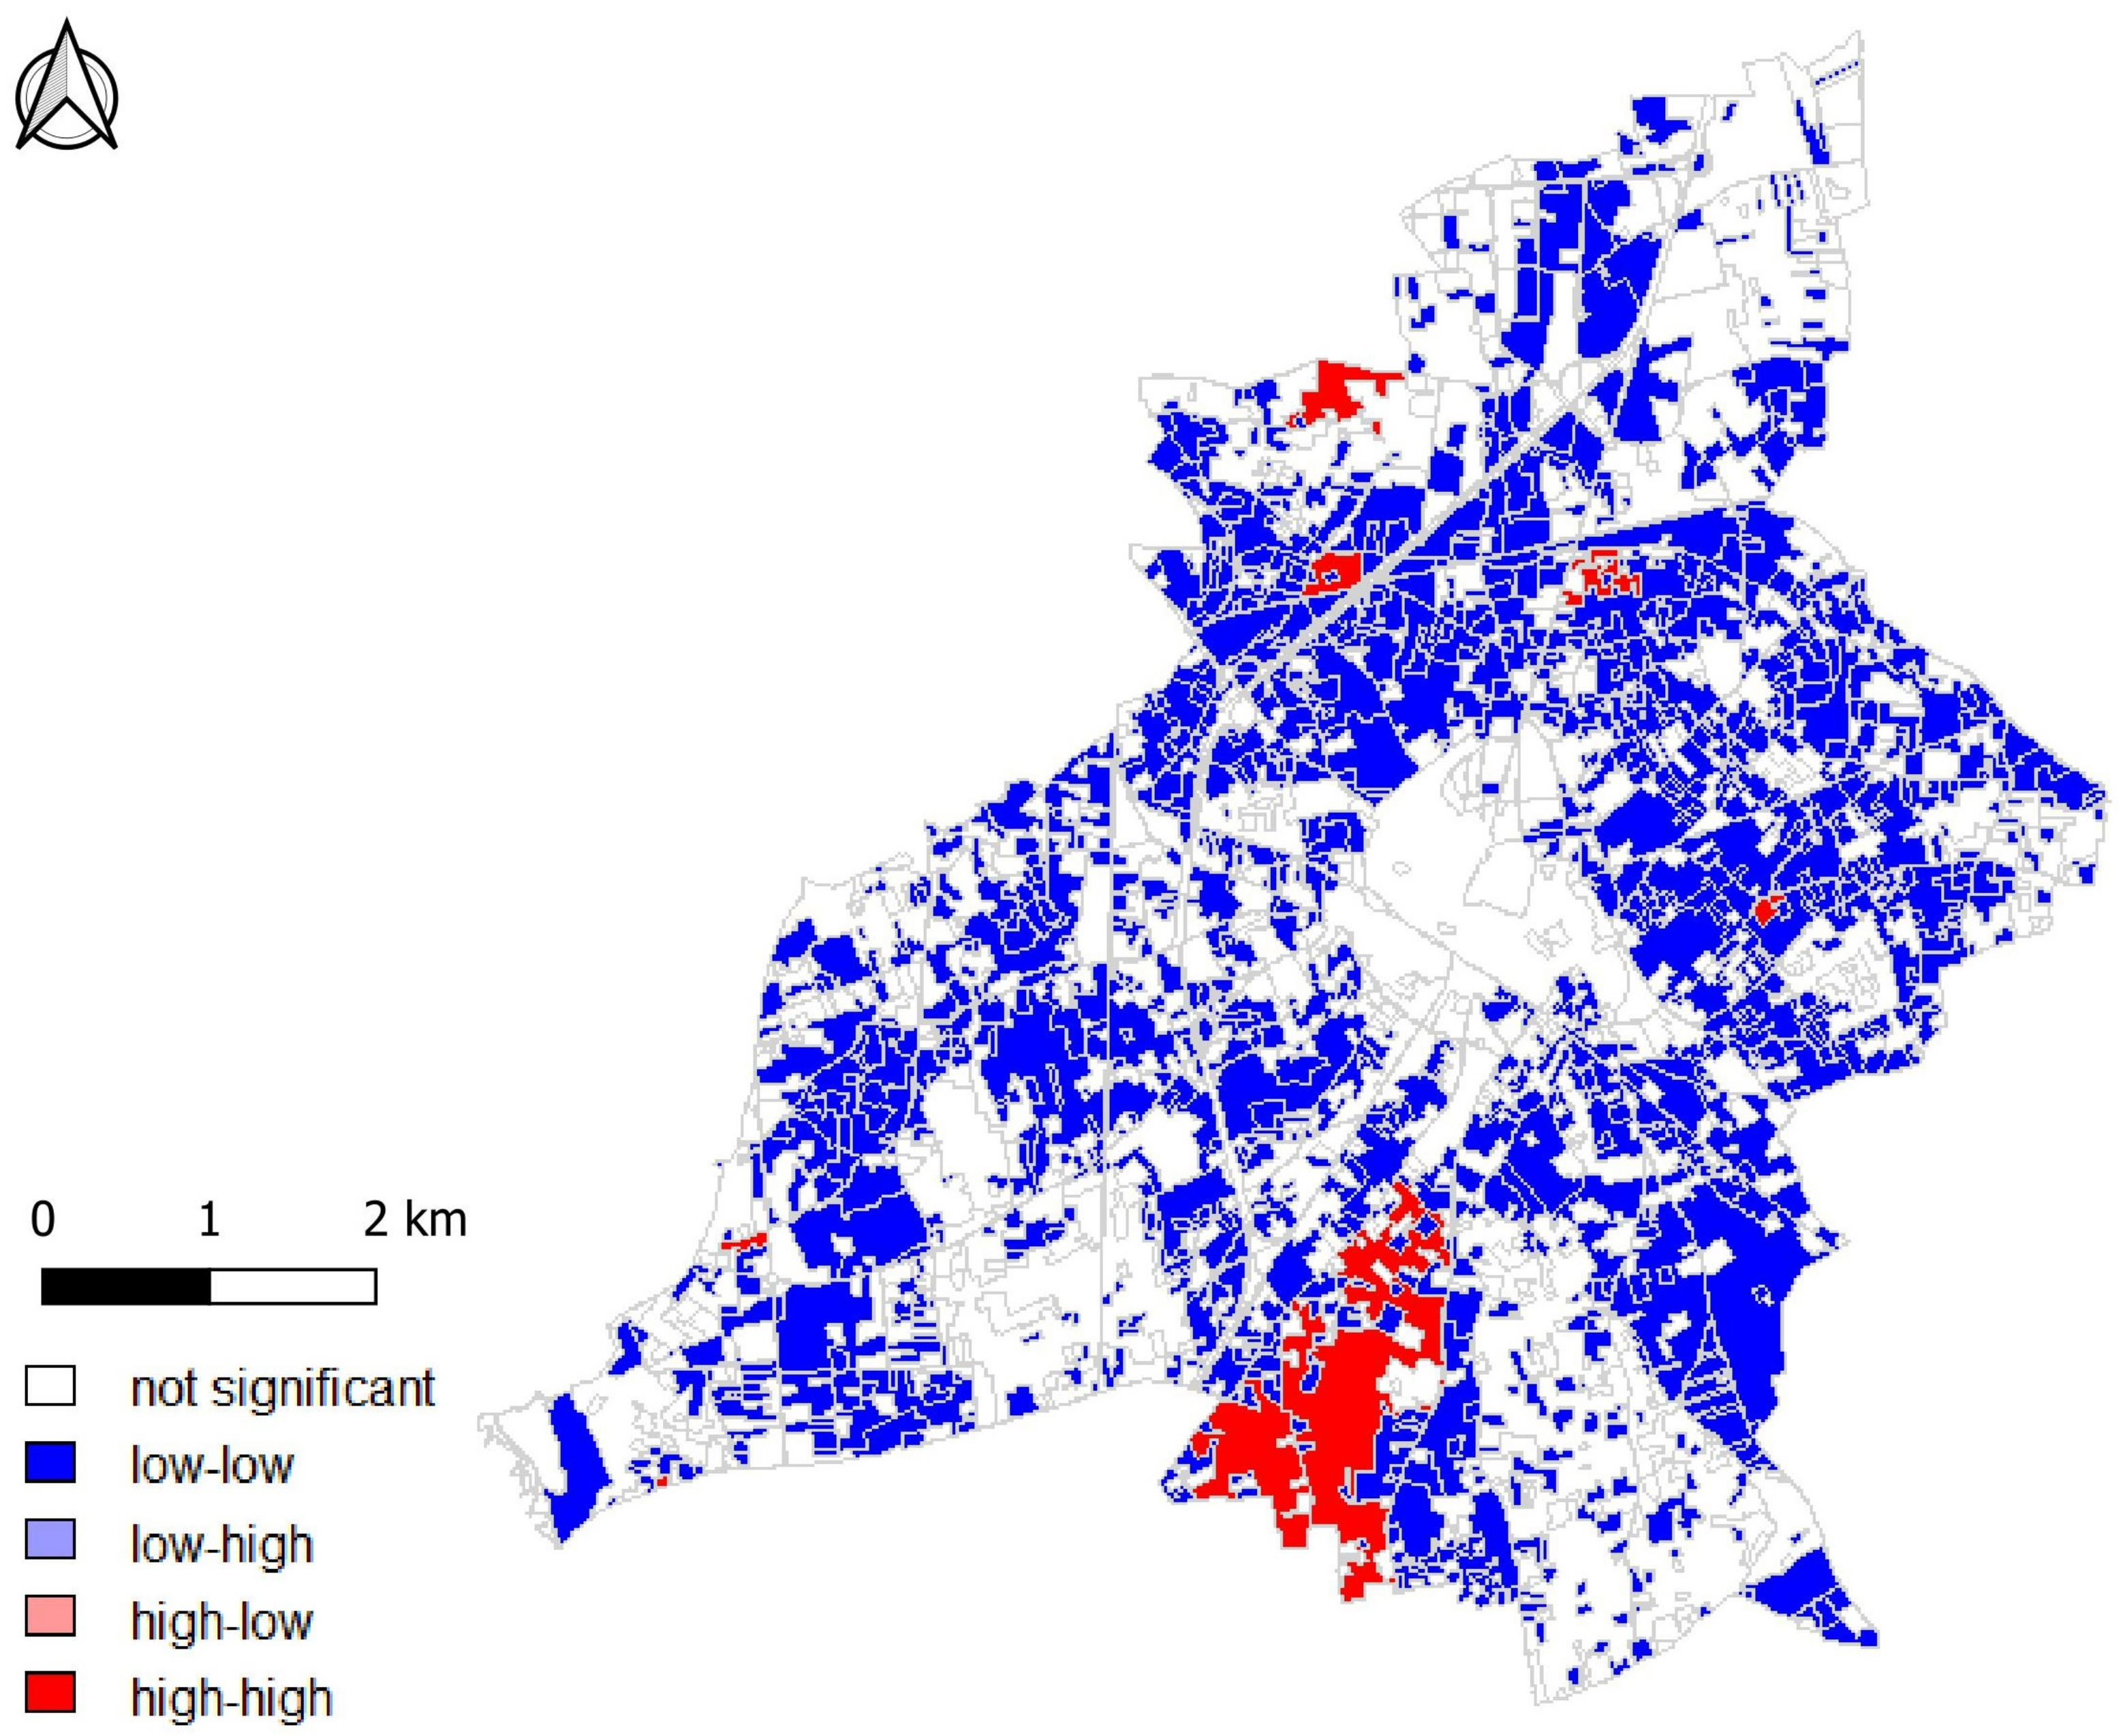
Processing of the land-use/land-cover (LULC) map, change detection analysis, and land consumption map: landscape has been classified in 2006, 2011, and 2019 according to the CORINE land-cover fourth level classification. Then, the LULC changes of 2006–2011 and 2011–2019 have been analyzed, quantifying the amount of land consumption. To this aim, all the urban classes have been aggregated into one single class, and its dynamics has been analyzed both quantitatively and spatially to assess the level of aggregation among areas characterized by land consumption. Finally, land consumption has been analyzed in terms of spatial configuration in 2006 and in 2019 through the use of landscape metrics, such as number of patches, mean patch area, and effective mesh size, which are useful for analyzing quantitively the spatial aggregation among areas characterized by land consumption; in particular, an increase in the number of patches and of the effective mesh size can denote an incremental trend of land consumption patch fragmentation, while the increasing of land consumption patch size can indicate an aggregation trend.
(2)
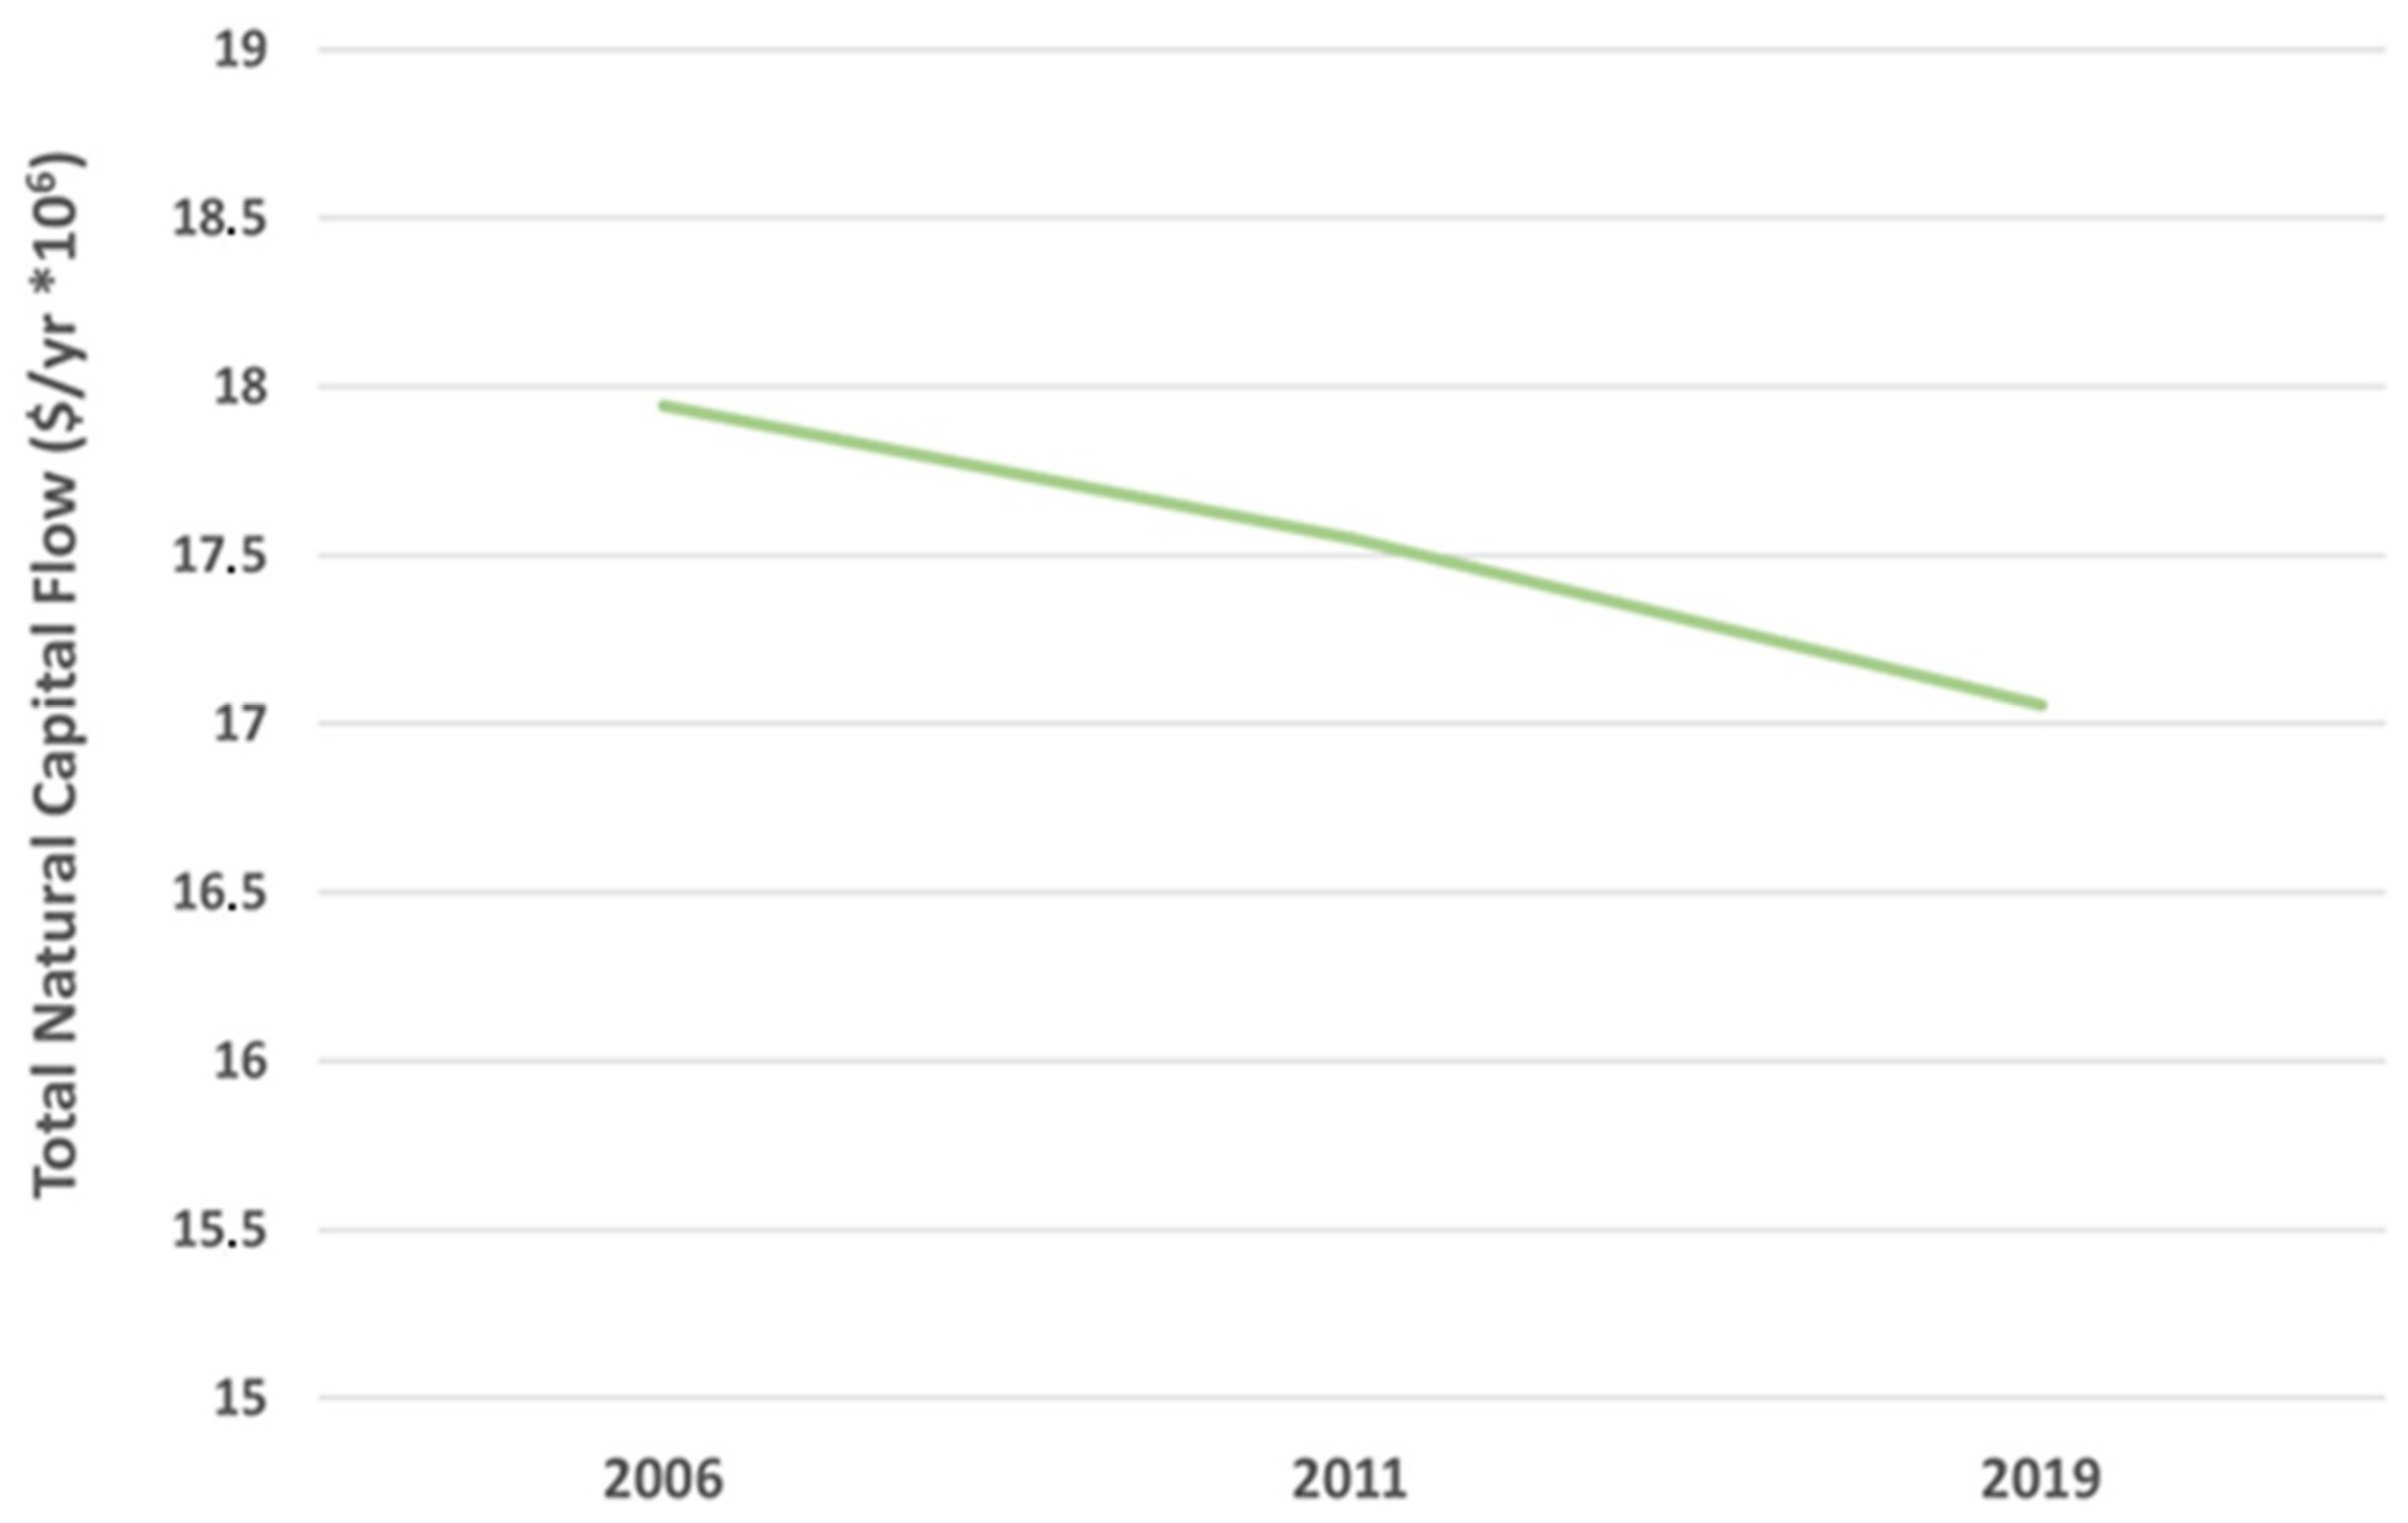
Valuation of natural capital flow (NCF): the flow of ecosystem services provided by the multifunctional landscape of Galatone have been estimated using the economic coefficients proposed by Costanza and colleagues in 2014 [79] as a surrogate allowing a first approximation of the total flow of natural capital. In particular, the LULC classification has been simplified from thirty-six classes to five classes (forests, grasslands/rangelands, croplands, urban, rock), and then, an economic coefficient has been associated with each LULC class (Table 1).
This method has made it possible to estimate the comprehensive flow of natural capital provided by the multifunctional landscape of Galatone in 2006, 2011, and 2019. The focus of the research was not the economic valuation of ecosystem services; therefore, the natural capital flow has been classified in low, medium, and high just to have an indication of the areas that contribute more to the provision of natural capital. In particular, all the values have been divided in three homogeneous intervals.
(3)
Mapping areas more at risk to lose NCF: the areas more at risk of losing natural capital flow because of land consumption threat have been mapped. In particular, the natural capital flow in 2006 has been used as a starting point (base layer) to analyze the land consumption rate along the time. The different levels of risk of losing the flow of natural capital have been based on the land consumption dynamics from 2006 to 2019.
Finally, to better identify sustainable strategic planning choices, we have used the bivariate local Moran’s I statistic to describe the correlation between the variable NCF in one location and land-consumption variable in an adjacent location in 2019. We, then, visualized the results using a local indicators of spatial autocorrelation (LISA) cluster map, which describes the association between a spatial unit that provides NCF and the surrounding spatial unit characterized by land consumption, defining four types of LISA cluster: high-high (H-H) indicates that a spatial unit with high NCF was surrounded by high-land consumption units; high-low (H-L) indicates a spatial unit with a high NCF that is surrounded by low-land consumption neighbors; low-high (L-H) indicates a spatial unit with a low NCF that is surrounded by neighboring units that have a high land consumption; and low-low (L-L) indicates a spatial unit with a low NCF that is surrounded by low-land consumption spatial units. H-H represents the most threatened relationship that requires attention from the decision makers. The spatial pattern of these areas has been used to give insights towards sustainable urban landscape planning to achieve land consumption-neutrality in terms of suitable strategic planning choices towards the land consumption mitigation and natural capital enhancement. This has been based on the analysis of alternative scenarios useful for the decision-making process.

3. Results

Spatial Analysis of Land Consumption

Land consumption has been analyzed quantitatively and spatially. The amount of land consumption is shown in Figure 3, highlighting an increase from 2006 to 2019.
More in detail, land consumption has shown an increase of 66.40 ha from 2006 to 2011 and 174.11 ha from 2006 to 2019 with an annual increase rate more or less constant from 2006 to 2019 (Table 2). The data about land consumption per capita have shown the increase of about 130 m2/capita from 2006 to 2019 due to the increase of land consumption but also to the decrease of population.
On the other hand, the assessment of ecosystem services’ flow has made it possible to analyze the trend of natural capital showing a general decrease from 2006 to 2019 as a result of the increase of land consumption (Figure 4).
Spatially, the areas characterized by land consumption have been mapped in 2006 (Figure 5a), 2011 (Figure 5b), and 2019 (Figure 5c), and a change detection analysis has been carried out to identify the hot areas in terms of land consumption (Figure 5d). On the other side, the areas providing natural capital flow have been classified in three classes (low, medium, and high) according to the amount of ecosystem services provided; then, they have been mapped in 2006 (Figure 5a), 2011 (Figure 5b), and 2019 (Figure 5c). From this perspective, Figure 5d shows the effect of land consumption in terms of natural capital flow loss, using the natural capital flow in 2006 as a base layer to make comparisons. This new perspective of land-consumption analysis has allowed us to reinterpret it in terms of risk to lose natural capital flow. Therefore, this means that the amount of land consumption is important as its spatial configuration. In this way, land consumption can have different values not only in terms of the amount of available land loss but also in terms of natural capital flow provision related to those lands. In this sense, land consumption has been re-classified and then, mapped by taking into account the level of natural capital flow loss (high, medium, and low) (Figure 5d). As it is possible to see in Figure 5d, the effect of where land consumption has been recorded in the period 2006–2019 can have a different meaning in terms of ecosystem services’ loss.
In general, it has been evident that the landscape was already characterized by a significant level of land consumption in 2006 (red areas in Figure 5a) that has increased during the time by including areas able to provide different levels of natural capital flow (Figure 5b,c). In this sense, land consumption can affect the landscape differently depending on where it spreads and how it aggregates: the number of land consumption patches have increased from 2006 to 2019, while the mean patch area has decreased (Table 3). This means that the increase in land consumption has been given by several small patches that have made the areas of land consumption more aggregated, noticed by the increase of the effective mesh size.
Finally, according to the LISA cluster maps, it has been possible to highlight the possible spatial correlation among areas with high NCF surrounded by high-land consumption units (H-H). In Figure 6 the LISA cluster map using p = 0.01 has been shown where it has been possible to notice that in 2019 the cluster H-H have resulted mainly in the southern part with some small areas in the northern part. In general, land consumption did not seem to be determined by the presence of high natural capital flow. However, in the areas where a spatial correlation of the cluster H-H has been identified, this should represent a point of attention for identifying possible landscape development strategies suitable to mitigate land consumption in areas with great ecological value.

4. Discussion

In the framework of the 2030 Agenda for Sustainable Development, this research has been focused on a better understanding of the linkages among LULC change, land consumption as a form of landscape degradation, and the provision of ecosystem services. The goal of zero net land consumption can have beneficial effects on several sustainability goals, such as climate change mitigation and adaptation actions at local scale, zero hunger, by keeping pristine the fertile lands, and biodiversity conservation, which can be strongly affected by urban sprawl with consequent landscape fragmentation.
The quantification of land consumption (in ha) for 2006, 2011, and 2019 (Figure 3) has highlighted that the management of Galatone urban landscape is still far from the zero net land consumption since it has been evident that land has been strongly consumed across the years. Hence, there is a tendency to increase soil occupation and waterproofing, causing a loss of agricultural and/or natural areas in place of artificial surfaces. More specifically, the estimations in % of artificial land-covers characterizing the urban landscape of Galatone (22.7%) in 2019 are higher than those recorded at national level (7.11%) and at European level (4.2%) for the same year [13].
On the other hand, the European Union in 2021 has promoted sustainable land management so that the land ability to provide ecosystem services is not hindered. For the quantification of ecosystem services, several studies have highlighted that it can be useful for their estimation the use of coefficients developed globally for different biomes [2,54]. Their use can help to quickly estimate the state of ecosystems in providing the necessary services and informing decision makers on the proposal of suitable policies for effective natural resources’ management [80,81]. However, the combination of LULC classes into five broad classes has strongly affected the accuracy of the evaluation results of ecosystem services value. Thus, a research future perspective is to identify methodologies to quantify the effects of land consumption on specific ecosystem services easy to be used by decision-makers.
Over time, the multifunctional landscape of Galatone has shown a continuous decreasing trend of natural capital flow (Figure 4), but to better understand the consequences and identify the right policies to invert this trend, a spatial approach is crucial [29,43,82] to analyze land consumption in terms of its amount and spatial configuration. From this perspective, the combined spatial analysis of land consumption and natural capital flow in the study area (Figure 5d) has helped in identifying areas more at risk to lose natural capital because of land consumption, supporting decision makers in finding appropriate policy solutions. From the analysis, it has emerged that artificial areas have increased at the expense of natural or agricultural areas, which can provide different levels of natural capital flow. As a result, the increase in artificial surfaces can negatively affect the flow of natural capital, with consequences on people living in urban, peri-urban, and rural spaces.
The case of Galatone is only an example to figure out a way to operationalize land consumption neutrality through its inclusion into the planning process. The urban planning process focused on the urban, peri-urban, and rural landscape of a city can represent a good starting point to test possible strategies based on sustainable land-use priorities towards the zero net land consumption [16]. At the European level, each landscape plan is accomplished by the strategic environmental assessment that, as in the case of adaptive management approach, has the aim to learn from the past management choices and improve the future environmental policies. In the case of Galatone, the recent urban planning process has been informed by the results of this research; therefore, the decision makers have identified several mitigation and compensation policies based on nature-based solutions to avoid that the new plan will negatively affect the environment. Further assessments will allow distinguishing between permanent and temporary land consumption to identify recovery areas currently at risk that can support high levels of natural capital flow, as those in the northern part of the study area (Figure 5d).
When planning for future sustainable development of urban landscapes, it could be useful to build up some development scenarios based on business as usual (negative alternative), implementation of some mitigation policies (realistic positive alternative) towards the zero net land consumption, and complete landscape recovery (ideal positive alternative). Among the mitigation policies, it is possible to consider the identification of new building sustainable standards for energy efficiency and green roofs, while among the compensation policies it is possible to list some nature-based solutions focused on the ecological recovery of some areas at risk in rural area, the design of some urban green areas in the peri-urban context, the requalification of some roads of cultural value useful to link urban, peri-urban, and rural areas through cycling routes.
These planned actions will require public and private investments for the prevention and restoration of land consumption. The land-consumption neutrality represents an important target at local scale, and it could be enhanced by data spatialization that, as in this case, can help decision makers in interpreting the possible consequences of alternative choices on landscape pattern [4].

5. Conclusions

The inclusion of natural capital valuation within the strategic landscape planning and management has been already introduced and debated in the scientific literature [67,77]. The novelty of this research has been the spatial approach allowing the identification of lands that when “consumed” can result in an important loss of ecosystem services. In comparison with previous notable studies [83,84,85,86] more focused on the amount of land consumption and its mapping, this research has allowed us to classify land consumption in terms of natural capital flow loss as well as to analyze the spatial correlation between areas with high land consumption and areas with high natural capital flow. The results of this research have demonstrated that the spatial analysis of land-use and land-cover change based on the accounting of ecosystem services can support the strategic land-use planning of urban areas from the perspective of land consumption neutrality. Managers should mitigate the risk of losing areas with high natural capital value, while they should compensate degraded lands through restoration programs and sustainable land management practices [37]. The typologies of recovery strategies can be different according to the specific landscape to be recovered but also the typology of land consumption (permanent or temporary). However, further research are needed to take into account the temporal dynamics of ecosystem services flow as well as a more detailed classification of the different land consumption typologies.
Understanding the value of natural capital can help decision makers in managing risks by avoiding unexpected and costly outcomes deriving from land use decisions that are not ecologically pondered. However, frameworks that can translate complex concepts, such as ecosystem services and natural capital, into practice are still missing [87]; therefore, it is often difficult the inclusion of these concepts into strategic landscape planning [67,88]. In this direction, the approach presented in this paper has made it possible to incorporate the valuation of natural capital into the urban planning of the urban landscape of Galatone. Furthermore, the integration among land consumption, natural capital, and urban planning can support decision makers in reaching several goals of the UN 2030 Agenda for sustainability at local scale. In this context the strategic environmental assessment can play a crucial role because it helps decision makers both during the planning phase in identifying sustainable policies and during the management phase in monitoring the effectiveness of the selected management actions in reaching the planned goals.
Finally, the strategic environmental assessment requires a strong public participation with the effect of making people aware of the sustainable planning targets regarding the places where they live. Therefore, the strategic environmental assessment represents a way to put in practice the adaptability of environmental management in a changing world by guiding the managers in the challenge of making the management more flexible and resilient to unexpected changes towards the 2030 sustainability targets.

Author Contributions

Conceptualization, D.V. and I.P.; methodology, E.M.L., C.G.G. and A.M.S.S.; software, C.G.G. and M.V.M.; validation, I.P., D.V. and C.G.G.; formal analysis, E.M.L., A.M.S.S. and M.V.M.; investigation, I.P., D.V. and E.M.L.; resources, I.P., D.V. and A.M.S.S.; data curation, E.M.L., C.G.G. and M.V.M.; writing—original draft preparation, I.P.; writing—review and editing, I.P., M.V.M. and D.V.; visualization, D.V.; supervision, I.P. Authorship has been limited to those who have contributed substantially to the work reported. All authors have read and agreed to the published version of the manuscript.

Funding

This research received no external funding.

Data Availability Statement

Data available on request.

Acknowledgments

We strongly thank all the people working at the Urban Planning Office of the Municipality of Galatone for supporting this research.

Conflicts of Interest

The authors declare no conflict of interest.

References

  1. Verburg, P.H.; Erb, K.-H.; Mertz, O.; Espindola, G. Land System Science: Between Global Challenges and Local Realities. Curr. Opin. Environ. Sustain. 2013, 5, 433–437. [Google Scholar] [CrossRef] [PubMed] [Green Version]
  2. Turner, K.G.; Anderson, S.; Gonzales-Chang, M.; Costanza, R.; Courville, S.; Dalgaard, T.; Dominati, E.; Kubiszewski, I.; Ogilvy, S.; Porfirio, L.; et al. A Review of Methods, Data, and Models to Assess Changes in the Value of Ecosystem Services from Land Degradation and Restoration. Ecol. Model. 2016, 319, 190–207. [Google Scholar] [CrossRef]
  3. Wen, Z.; Zheng, H.; Smith, J.R.; Zhao, H.; Liu, L.; Ouyang, Z. Functional Diversity Overrides Community-Weighted Mean Traits in Linking Land-Use Intensity to Hydrological Ecosystem Services. Sci. Total Environ. 2019, 682, 583–590. [Google Scholar] [CrossRef] [PubMed]
  4. Schulze, K.; Malek, Ž.; Verburg, P.H. How Will Land Degradation Neutrality Change Future Land System Patterns? A Scenario Simulation Study. Environ. Sci. Policy 2021, 124, 254–266. [Google Scholar] [CrossRef]
  5. Jiang, L.; Bao, A.; Jiapaer, G.; Liu, R.; Yuan, Y.; Yu, T. Monitoring Land Degradation and Assessing Its Drivers to Support Sustainable Development Goal 15.3 in Central Asia. Sci. Total Environ. 2022, 807, 150868. [Google Scholar] [CrossRef]
  6. Willemen, L.; Crossman, N.D.; Quatrini, S.; Egoh, B.; Kalaba, F.K.; Mbilinyi, B.; de Groot, R. Identifying Ecosystem Service Hotspots for Targeting Land Degradation Neutrality Investments in South-Eastern Africa. J. Arid. Environ. 2018, 159, 75–86. [Google Scholar] [CrossRef]
  7. Liniger, H.; Harari, N.; van Lynden, G.; Fleiner, R.; de Leeuw, J.; Bai, Z.; Critchley, W. Achieving Land Degradation Neutrality: The Role of SLM Knowledge in Evidence-Based Decision-Making. Environ. Sci. Policy 2019, 94, 123–134. [Google Scholar] [CrossRef]
  8. Van Haren, N.; Fleiner, R.; Liniger, H.; Harari, N. Contribution of Community-Based Initiatives to the Sustainable Development Goal of Land Degradation Neutrality. Environ. Sci. Policy 2019, 94, 211–219. [Google Scholar] [CrossRef]
  9. Von Maltitz, G.P.; Gambiza, J.; Kellner, K.; Rambau, T.; Lindeque, L.; Kgope, B. Experiences from the South African Land Degradation Neutrality Target Setting Process. Environ. Sci. Policy 2019, 101, 54–62. [Google Scholar] [CrossRef]
  10. Sims, N.C.; Barger, N.N.; Metternicht, G.I.; England, J.R. A Land Degradation Interpretation Matrix for Reporting on UN SDG Indicator 15.3.1 and Land Degradation Neutrality. Environ. Sci. Policy 2020, 114, 1–6. [Google Scholar] [CrossRef]
  11. Desta, G.; Tamene, L.; Abera, W.; Amede, T.; Whitbread, A. Effects of Land Management Practices and Land Cover Types on Soil Loss and Crop Productivity in Ethiopia: A Review. Int. Soil Water Conserv. Res. 2021, 9, 544–554. [Google Scholar] [CrossRef]
  12. Chotte, J.-L.; Orr, B.J. Mitigating “Displaced” Land Degradation and the Risk of Spillover through the Decommoditization of Land Products. Land Use Policy 2021, 109, 105659. [Google Scholar] [CrossRef]
  13. Munafò, M. (Ed.) Consumo di Suolo, Dinamiche Territoriali e Servizi Ecosistemici. Edizione 2021|SNPA—Sistema Nazionale Protezione Ambiente; ISPRA: Rome, Italy, 2021. [Google Scholar]
  14. Hannam, I. Soil Governance and Land Degradation Neutrality. Soil Secur. 2022, 6, 100030. [Google Scholar] [CrossRef]
  15. Meena, R.S.; Yadav, A.; Kumar, S.; Jhariya, M.K.; Jatav, S.S. Agriculture Ecosystem Models for CO2 Sequestration, Improving Soil Physicochemical Properties, and Restoring Degraded Land. Ecol. Eng. 2022, 176, 106546. [Google Scholar] [CrossRef]
  16. Gotgelf, A. Information Governance for Sustainable Development: Exploring Social Dilemmas in Data Provision for International Reporting on Land Degradation Neutrality. Environ. Sci. Policy 2022, 135, 128–136. [Google Scholar] [CrossRef]
  17. IISD’ s SDG Knowledge Hub Guest Article: 17 SDGs, but Is There a Priority SDG Target?|SDG Knowledge Hub|IISD. Available online: http://sdg.iisd.org/commentary/guest-articles/17-sdgs-but-is-there-a-priority-sdg-target/ (accessed on 10 February 2023).
  18. European Commission. Communication from the Commission to the European Parliament, the Council, the European Economic and Social Committee and the Committee of the Regions eu Soil Strategy for 2030 Reaping the Benefits of Healthy Soils for People, Food, Nature and Climate; European Commission: Brussels, Belgium, 2021; Available online: https://eur-lex.europa.eu/legal-content/EN/TXT/?uri=CELEX%3A52021DC0699 (accessed on 8 January 2023).
  19. Mengist, W.; Soromessa, T.; Feyisa, G.L. Estimating the Total Ecosystem Services Value of Eastern Afromontane Biodiversity Hotspots in Response to Landscape Dynamics. Environ. Sustain. Indic. 2022, 14, 100178. [Google Scholar] [CrossRef]
  20. Qian, Y.; Dong, Z.; Yan, Y.; Tang, L. Ecological Risk Assessment Models for Simulating Impacts of Land Use and Landscape Pattern on Ecosystem Services. Sci. Total Environ. 2022, 833, 155218. [Google Scholar] [CrossRef] [PubMed]
  21. Haileslassie, A.; Priess, J.; Veldkamp, E.; Teketay, D.; Lesschen, J.P. Assessment of Soil Nutrient Depletion and Its Spatial Variability on Smallholders’ Mixed Farming Systems in Ethiopia Using Partial versus Full Nutrient Balances. Agric. Ecosyst. Environ. 2005, 108, 1–16. [Google Scholar] [CrossRef]
  22. Lal, R. Soil Degradation as a Reason for Inadequate Human Nutrition. Food Sec. 2009, 1, 45–57. [Google Scholar] [CrossRef]
  23. Girmay, G.; Singh, B.R.; Nyssen, J.; Borrosen, T. Runoff and Sediment-Associated Nutrient Losses under Different Land Uses in Tigray, Northern Ethiopia. J. Hydrol. 2009, 376, 70–80. [Google Scholar] [CrossRef]
  24. Lal, R. Restoring Soil Quality to Mitigate Soil Degradation. Sustainability 2015, 7, 5875–5895. [Google Scholar] [CrossRef] [Green Version]
  25. Jost, E.; Schönhart, M.; Skalský, R.; Balkovič, J.; Schmid, E.; Mitter, H. Dynamic Soil Functions Assessment Employing Land Use and Climate Scenarios at Regional Scale. J. Environ. Manag. 2021, 287, 112318. [Google Scholar] [CrossRef] [PubMed]
  26. Xiaomin, G.; Chuanglin, F.; Xufang, M.; Dan, C. Coupling and Coordination Analysis of Urbanization and Ecosystem Service Value in Beijing-Tianjin-Hebei Urban Agglomeration. Ecol. Indic. 2022, 137, 108782. [Google Scholar] [CrossRef]
  27. Kumar, P.; Dobriyal, M.; Kale, A.; Pandey, A.K. Temporal Dynamics Change of Land Use/Land Cover in Jhansi District of Uttar Pradesh over Past 20 Years Using LANDSAT TM, ETM+ and OLI Sensors. Remote Sens. Appl. Soc. Environ. 2021, 23, 100579. [Google Scholar] [CrossRef]
  28. European Commission; Directorate General for the Environment. Hard Surfaces, Hidden Costs: Searching for Alternatives to Land Take and Soil Sealing; Publications Office of the European Union: Luxembourg, 2013. [Google Scholar]
  29. Baude, M.; Meyer, B.C.; Schindewolf, M. Land Use Change in an Agricultural Landscape Causing Degradation of Soil Based Ecosystem Services. Sci. Total Environ. 2019, 659, 1526–1536. [Google Scholar] [CrossRef]
  30. Gao, J.; O’Neill, B.C. Mapping Global Urban Land for the 21st Century with Data-Driven Simulations and Shared Socioeconomic Pathways. Nat. Commun. 2020, 11, 2302. [Google Scholar] [CrossRef]
  31. Bryan, B.A.; Ye, Y.; Zhang, J.; Connor, J.D. Land-Use Change Impacts on Ecosystem Services Value: Incorporating the Scarcity Effects of Supply and Demand Dynamics. Ecosyst. Serv. 2018, 32, 144–157. [Google Scholar] [CrossRef]
  32. Biratu, A.A.; Bedadi, B.; Gebrehiwot, S.G.; Melesse, A.M.; Nebi, T.H.; Abera, W.; Tamene, L.; Egeru, A. Ecosystem Service Valuation along Landscape Transformation in Central Ethiopia. Land 2022, 11, 500. [Google Scholar] [CrossRef]
  33. Choudhury, K.; Jansen, L. Terminology for Integrated Resources Planning and Management; FAO: Rome, Italy, 1999. [Google Scholar]
  34. Seto, K.C.; Güneralp, B.; Hutyra, L.R. Global Forecasts of Urban Expansion to 2030 and Direct Impacts on Biodiversity and Carbon Pools. Proc. Natl. Acad. Sci. USA 2012, 109, 16083–16088. [Google Scholar] [CrossRef] [Green Version]
  35. Yuan, Y.; Chen, D.; Wu, S.; Mo, L.; Tong, G.; Yan, D. Urban Sprawl Decreases the Value of Ecosystem Services and Intensifies the Supply Scarcity of Ecosystem Services in China. Sci. Total Environ. 2019, 697, 134170. [Google Scholar] [CrossRef]
  36. Bren d’Amour, C.; Reitsma, F.; Baiocchi, G.; Barthel, S.; Güneralp, B.; Erb, K.-H.; Haberl, H.; Creutzig, F.; Seto, K.C. Future Urban Land Expansion and Implications for Global Croplands. Proc. Natl. Acad. Sci. USA 2017, 114, 8939–8944. [Google Scholar] [CrossRef] [PubMed] [Green Version]
  37. Prăvălie, R. Exploring the Multiple Land Degradation Pathways across the Planet. Earth-Sci. Rev. 2021, 220, 103689. [Google Scholar] [CrossRef]
  38. Hu, J.; Wang, Y.; Taubenböck, H.; Zhu, X.X. Land Consumption in Cities: A Comparative Study across the Globe. Cities 2021, 113, 103163. [Google Scholar] [CrossRef]
  39. Wu, C.; Chen, B.; Huang, X.; Dennis Wei, Y.H. Effect of Land-Use Change and Optimization on the Ecosystem Service Values of Jiangsu Province, China. Ecol. Indic. 2020, 117, 106507. [Google Scholar] [CrossRef]
  40. Hussain, S.; Mubeen, M.; Karuppannan, S. Land Use and Land Cover (LULC) Change Analysis Using TM, ETM+ and OLI Landsat Images in District of Okara, Punjab, Pakistan. Phys. Chem. Earth Parts A/B/C 2022, 126, 103117. [Google Scholar] [CrossRef]
  41. Bryan, B.A. Incentives, Land Use, and Ecosystem Services: Synthesizing Complex Linkages. Environ. Sci. Policy 2013, 27, 124–134. [Google Scholar] [CrossRef] [Green Version]
  42. Qiu, H.; Hu, B.; Zhang, Z. Impacts of Land Use Change on Ecosystem Service Value Based on SDGs Report--Taking Guangxi as an Example. Ecol. Indic. 2021, 133, 108366. [Google Scholar] [CrossRef]
  43. Liu, C.; Yang, M.; Hou, Y.; Xue, X. Ecosystem Service Multifunctionality Assessment and Coupling Coordination Analysis with Land Use and Land Cover Change in China’s Coastal Zones. Sci. Total Environ. 2021, 797, 149033. [Google Scholar] [CrossRef]
  44. Raviv, O.; Zemah-Shamir, S.; Izhaki, I.; Lotan, A. The Effect of Wildfire and Land-Cover Changes on the Economic Value of Ecosystem Services in Mount Carmel Biosphere Reserve, Israel. Ecosyst. Serv. 2021, 49, 101291. [Google Scholar] [CrossRef]
  45. Ge, G.; Zhang, J.; Chen, X.; Liu, X.; Hao, Y.; Yang, X.; Kwon, S. Effects of Land Use and Land Cover Change on Ecosystem Services in an Arid Desert-Oasis Ecotone along the Yellow River of China. Ecol. Eng. 2022, 176, 106512. [Google Scholar] [CrossRef]
  46. Sun, X.; Wu, J.; Tang, H.; Yang, P. An Urban Hierarchy-Based Approach Integrating Ecosystem Services into Multiscale Sustainable Land Use Planning: The Case of China. Resour. Conserv. Recycl. 2022, 178, 106097. [Google Scholar] [CrossRef]
  47. Medeiros, P.I.S.D.; Cabral, L.C.D.S.; Carvalho, A.R. Cost to Restore and Conserve Urban Forest Fragment. Urban For. Urban Green 2019, 46, 126465. [Google Scholar] [CrossRef]
  48. Zurlini, G.; Jones, K.B.; Riitters, K.H.; Li, B.-L.; Petrosillo, I. Early Warning Signals of Regime Shifts from Cross-Scale Connectivity of Land-Cover Patterns. Ecol. Indic. 2014, 45, 549–560. [Google Scholar] [CrossRef]
  49. Petrosillo, I.; Valente, D.; Mulder, C.; Li, B.-L.; Jones, K.B.; Zurlini, G. The Resilient Recurrent Behavior of Mediterranean Semi-Arid Complex Adaptive Landscapes. Land 2021, 10, 296. [Google Scholar] [CrossRef]
  50. European Commission; Directorate-General for the Environment. Natura 2000 in the Mediterranean Region; Sundseth, K., Ed.; Office for Official Publications of the European Communities: Luxemburg, 2009. [Google Scholar]
  51. Vanmaercke, M.; Poesen, J.; Verstraeten, G.; de Vente, J.; Ocakoglu, F. Sediment Yield in Europe: Spatial Patterns and Scale Dependency. Geomorphology 2011, 130, 142–161. [Google Scholar] [CrossRef] [Green Version]
  52. Al Sayah, M.J.; Abdallah, C.; Khouri, M.; Nedjai, R.; Darwich, T. On the Use of the Land Degradation Neutrality Concept in Mediterranean Watersheds for Land Restoration and Erosion Counteraction. J. Arid. Environ. 2021, 188, 104465. [Google Scholar] [CrossRef]
  53. Abera, W.; Tamene, L.; Kassawmar, T.; Mulatu, K.; Kassa, H.; Verchot, L.; Quintero, M. Impacts of Land Use and Land Cover Dynamics on Ecosystem Services in the Yayo Coffee Forest Biosphere Reserve, Southwestern Ethiopia. Ecosyst. Serv. 2021, 50, 101338. [Google Scholar] [CrossRef]
  54. Peng, K.; Jiang, W.; Ling, Z.; Hou, P.; Deng, Y. Evaluating the Potential Impacts of Land Use Changes on Ecosystem Service Value under Multiple Scenarios in Support of SDG Reporting: A Case Study of the Wuhan Urban Agglomeration. J. Clean. Prod. 2021, 307, 127321. [Google Scholar] [CrossRef]
  55. Heinze, A.; Bongers, F.; Ramírez Marcial, N.; García Barrios, L.E.; Kuyper, T.W. Farm Diversity and Fine Scales Matter in the Assessment of Ecosystem Services and Land Use Scenarios. Agric. Syst. 2022, 196, 103329. [Google Scholar] [CrossRef]
  56. Cabral, P.; Campos, F.S.; David, J.; Caser, U. Disentangling Ecosystem Services Perception by Stakeholders: An Integrative Assessment Based on Land Cover. Ecol. Indic. 2021, 126, 107660. [Google Scholar] [CrossRef]
  57. Gomes, E.; Inácio, M.; Bogdzevič, K.; Kalinauskas, M.; Karnauskaite, D.; Pereira, P. Future Land Use Changes and Its Impacts on Terrestrial Ecosystem Services: A Review. Sci. Total Environ. 2021, 781, 146716. [Google Scholar] [CrossRef] [PubMed]
  58. Zhang, Z.; Liu, Y.; Wang, Y.; Liu, Y.; Zhang, Y.; Zhang, Y. What Factors Affect the Synergy and Tradeoff between Ecosystem Services, and How, from a Geospatial Perspective? J. Clean. Prod. 2020, 257, 120454. [Google Scholar] [CrossRef]
  59. Cortinovis, C.; Geneletti, D. A Performance-Based Planning Approach Integrating Supply and Demand of Urban Ecosystem Services. Landsc. Urban Plan. 2020, 201, 103842. [Google Scholar] [CrossRef]
  60. Reed, M.S.; Stringer, L.C.; Dougill, A.J.; Perkins, J.S.; Atlhopheng, J.R.; Mulale, K.; Favretto, N. Reorienting Land Degradation towards Sustainable Land Management: Linking Sustainable Livelihoods with Ecosystem Services in Rangeland Systems. J. Environ. Manag. 2015, 151, 472–485. [Google Scholar] [CrossRef] [Green Version]
  61. Ma, S.; Li, Y.; Zhang, Y.; Wang, L.-J.; Jiang, J.; Zhang, J. Distinguishing the Relative Contributions of Climate and Land Use/Cover Changes to Ecosystem Services from a Geospatial Perspective. Ecol. Indic. 2022, 136, 108645. [Google Scholar] [CrossRef]
  62. Petrosillo, I.; Zaccarelli, N.; Semeraro, T.; Zurlini, G. The Effectiveness of Different Conservation Policies on the Security of Natural Capital. Landsc. Urban Plan. 2009, 89, 49–56. [Google Scholar] [CrossRef]
  63. Petrosillo, I.; Semeraro, T.; Zurlini, G. Detecting the ‘Conservation Effect’ on the Maintenance of Natural Capital Flow in Different Natural Parks. Ecol. Econ. 2010, 69, 1115–1123. [Google Scholar] [CrossRef]
  64. Marinelli, M.V.; Valente, D.; Scavuzzo, C.M.; Petrosillo, I. Landscape Service Flow Dynamics in the Metropolitan Area of Córdoba (Argentina). J. Environ. Manag. 2021, 280, 111714. [Google Scholar] [CrossRef]
  65. Zurlini, G.; Petrosillo, I.; Aretano, R.; Castorini, I.; D’Arpa, S.; Marco, A.D.; Pasimeni, M.R.; Semeraro, T.; Zaccarelli, N. Key Fundamental Aspects for Mapping and Assessing Ecosystem Services: Predictability of Ecosystem Service Providers at Scales from Local to Global. Ann. Bot. 2014, 4, 53–63. [Google Scholar] [CrossRef]
  66. Wang, W.; Guo, H.; Chuai, X.; Dai, C.; Lai, L.; Zhang, M. The Impact of Land Use Change on the Temporospatial Variations of Ecosystems Services Value in China and an Optimized Land Use Solution. Environ. Sci. Policy 2014, 44, 62–72. [Google Scholar] [CrossRef]
  67. Nijhum, F.; Westbrook, C.; Noble, B.; Belcher, K.; Lloyd-Smith, P. Evaluation of Alternative Land-Use Scenarios Using an Ecosystem Services-Based Strategic Environmental Assessment Approach. Land Use Policy 2021, 108, 105540. [Google Scholar] [CrossRef]
  68. Qu, W.; Shi, W.; Zhang, J.; Liu, T. T21 China 2050: A Tool for National Sustainable Development Planning. Geogr. Sustain. 2020, 1, 33–46. [Google Scholar] [CrossRef]
  69. Cui, F.; Wang, B.; Zhang, Q.; Tang, H.; De Maeyer, P.; Hamdi, R.; Dai, L. Climate Change versus Land-Use Change—What Affects the Ecosystem Services More in the Forest-Steppe Ecotone? Sci. Total Environ. 2021, 759, 143525. [Google Scholar] [CrossRef] [PubMed]
  70. Gogoi, B.; Borah, N.; Baishya, A.; Nath, D.J.; Dutta, S.; Das, R.; Bhattacharyya, D.; Sharma, K.K.; Valente, D.; Petrosillo, I. Enhancing Soil Ecosystem Services through Sustainable Integrated Nutrient Management in Double Rice-Cropping System of North-East India. Ecol. Indic. 2021, 132, 108262. [Google Scholar] [CrossRef]
  71. Li, J.; Dong, S.; Li, Y.; Wang, Y.; Li, Z.; Li, F. Effects of Land Use Change on Ecosystem Services in the China–Mongolia–Russia Economic Corridor. J. Clean. Prod. 2022, 360, 132175. [Google Scholar] [CrossRef]
  72. Orr, B.J.; Cowie, A.L.; Castillo Sanchez, V.M.; Chasek, P.; Crossman, N.D.; Erlewein, A.; Lowagie, G.; Maron, M.; Metternicht, G.I.; Minelli, S.; et al. Scientific Conceptual Framework for Land Degradation Neutrality. A Report of the Science-Policy Interface; United Nations Convention to Combat Desertification (UNCCD): Bonn, Germany, 2017; Available online: https://www.unccd.int/resources/reports/scientific-conceptual-framework-land-degradation-neutrality-report-science-policy (accessed on 8 March 2023).
  73. Cortinovis, C.; Geneletti, D. A Framework to Explore the Effects of Urban Planning Decisions on Regulating Ecosystem Services in Cities. Ecosyst. Serv. 2019, 38, 100946. [Google Scholar] [CrossRef]
  74. Valente, D.; Marinelli, M.V.; Lovello, E.M.; Giannuzzi, C.G.; Petrosillo, I. Fostering the Resiliency of Urban Landscape through the Sustainable Spatial Planning of Green Spaces. Land 2022, 11, 367. [Google Scholar] [CrossRef]
  75. Gilbey, B.; Davies, J.; Metternicht, G.; Magero, C. Taking Land Degradation Neutrality from Concept to Practice: Early Reflections on LDN Target Setting and Planning. Environ. Sci. Policy 2019, 100, 230–237. [Google Scholar] [CrossRef]
  76. Albert, C.; Fürst, C.; Ring, I.; Sandström, C. Research Note: Spatial Planning in Europe and Central Asia—Enhancing the Consideration of Biodiversity and Ecosystem Services. Landsc. Urban Plan. 2020, 196, 103741. [Google Scholar] [CrossRef]
  77. Geneletti, D. Assessing the Impact of Alternative Land-Use Zoning Policies on Future Ecosystem Services. Environ. Impact Assess. Rev. 2013, 40, 25–35. [Google Scholar] [CrossRef]
  78. Grêt-Regamey, A.; Altwegg, J.; Sirén, E.A.; van Strien, M.J.; Weibel, B. Integrating Ecosystem Services into Spatial Planning—A Spatial Decision Support Tool. Landsc. Urban Plan. 2017, 165, 206–219. [Google Scholar] [CrossRef] [Green Version]
  79. Costanza, R.; de Groot, R.; Sutton, P.; van der Ploeg, S.; Anderson, S.J.; Kubiszewski, I.; Farber, S.; Turner, R.K. Changes in the Global Value of Ecosystem Services. Glob. Environ. Chang. 2014, 26, 152–158. [Google Scholar] [CrossRef]
  80. Anley, M.A.; Minale, A.S.; Haregeweyn, N.; Gashaw, T. Assessing the Impacts of Land Use/Cover Changes on Ecosystem Service Values in Rib Watershed, Upper Blue Nile Basin, Ethiopia. Trees For. People 2022, 7, 100212. [Google Scholar] [CrossRef]
  81. Tolessa, T.; Kidane, M.; Bezie, A. Assessment of the Linkages between Ecosystem Service Provision and Land Use/Land Cover Change in Fincha Watershed, North-Western Ethiopia. Heliyon 2021, 7, e07673. [Google Scholar] [CrossRef] [PubMed]
  82. Ma, S.; Wen, Z. Optimization of Land Use Structure to Balance Economic Benefits and Ecosystem Services under Uncertainties: A Case Study in Wuhan, China. J. Clean. Prod. 2021, 311, 127537. [Google Scholar] [CrossRef]
  83. Cimini, A.; De Fioravante, P.; Riitano, N.; Dichicco, P.; Calò, A.; Scarascia Mugnozza, G.; Marchetti, M.; Munafò, M. Land Consumption Dynamics and Urban–Rural Continuum Mapping in Italy for SDG 11.3.1 Indicator Assessment. Land 2023, 12, 155. [Google Scholar] [CrossRef]
  84. Rienow, A.; Kantakumar, L.N.; Ghazaryan, G.; Dröge-Rothaar, A.; Sticksel, S.; Trampnau, B.; Thonfeld, F. Modelling the Spatial Impact of Regional Planning and Climate Change Prevention Strategies on Land Consumption in the Rhine-Ruhr Metropolitan Area 2017–2030. Landsc. Urban Plan. 2022, 217, 104284. [Google Scholar] [CrossRef]
  85. Calka, B.; Orych, A.; Bielecka, E.; Mozuriunaite, S. The Ratio of the Land Consumption Rate to the Population Growth Rate: A Framework for the Achievement of the Spatiotemporal Pattern in Poland and Lithuania. Remote Sens. 2022, 14, 1074. [Google Scholar] [CrossRef]
  86. Lu, L.; Qureshi, S.; Li, Q.; Chen, F.; Shu, L. Monitoring and Projecting Sustainable Transitions in Urban Land Use Using Remote Sensing and Scenario-Based Modelling in a Coastal Megacity. Ocean. Coast. Manag. 2022, 224, 106201. [Google Scholar] [CrossRef]
  87. Thompson, K.; Sherren, K.; Duinker, P.N. The Use of Ecosystem Services Concepts in Canadian Municipal Plans. Ecosyst. Serv. 2019, 38, 100950. [Google Scholar] [CrossRef]
  88. BenDor, T.K.; Spurlock, D.; Woodruff, S.C.; Olander, L. A Research Agenda for Ecosystem Services in American Environmental and Land Use Planning. Cities 2017, 60, 260–271. [Google Scholar] [CrossRef]
Figure 1. A schematic view of the urban multifunctional landscape where A indicates the core city, B represents the peri-urban area, and C is the rural area.
Land 12 00777 g001
Figure 2. Study area: urban landscape of Galatone Municipality.
Land 12 00777 g002
Figure 3. Estimated annual land consumption (ha) for the years 2006, 2011, and 2019.
Land 12 00777 g003
Figure 4. Trend of natural capital flow in ($/year) for the years 2006, 2011, 2019.
Land 12 00777 g004
Figure 5. Land consumption and natural capital flow in 2006 (a), 2011 (b), and 2019 (c). In (d) land consumption 2006–2019 has been classified in terms of the lost capacity shown by consumed patches to provide natural capital flow.
Land 12 00777 g005
Figure 6. LISA cluster maps (p = 0.01). H-H cluster indicates that a spatial unit with high NCF is surrounded by high-land consumption units; H-L cluster indicates a spatial unit with a high NCF that is surrounded by low-land consumption neighbors; L-H cluster indicates a spatial unit with a low NCF that is surrounded by neighboring units that have a high land consumption; and L-L cluster indicates a spatial unit with a low NCF that is surrounded by low-land consumption spatial units.
Land 12 00777 g006
Table 1. Coefficients associated with the LULC classes (source of data [79]).
LULC ClassTotal Value
$/ha/yr
Forest3800
Grasslands/Rangelands2974
Croplands5567
Urban921
Rock0
Table 2. The total land consumption (ha) in 2006, 2011, and 2019, the land consumption increase (ha) in 2011 and in 2019 compared to 2006, the land consumption annual rate in 2011 and in 2019 compared to 2011, and the land consumption per capita (m2/capita) in 2006, 2011, and 2019.
200620112019
Land consumption (ha)956.501022.901130.61
Land consumption increase compared to 2006 (ha) 66.40174.11
Land consumption annual rate (ha/year) 13.2813.39
Land consumption per capita (m2/capita)602.17649.29732.73
Table 3. Landscape metrics to analyze the spatial configuration of the areas characterized by land consumption. In the range 2006–2019 ↑ indicates increasing trend while ↓ decreasing trend.
Land Consumption Class20062019Trend 2006–2019
Number of patches79149
Mean patch area (ha)13.437.37
Effective mesh size (ha)993.921027.78
Disclaimer/Publisher’s Note: The statements, opinions and data contained in all publications are solely those of the individual author(s) and contributor(s) and not of MDPI and/or the editor(s). MDPI and/or the editor(s) disclaim responsibility for any injury to people or property resulting from any ideas, methods, instructions or products referred to in the content.

