Article

Spatial-Temporal Evolution Patterns and Influencing Factors of Hotels in Yellow River Basin from 2012 to 2022

1
School of Urban Design, Wuhan University, Wuhan 430072, China
2
College of Geography and Environmental Science, Henan University, Kaifeng 475004, China
3
School of Resource and Environmental Sciences, Wuhan University, Wuhan 430079, China
*
Author to whom correspondence should be addressed.
Land 2023, 12(4), 770; https://doi.org/10.3390/land12040770
Submission received: 27 February 2023 / Revised: 25 March 2023 / Accepted: 25 March 2023 / Published: 28 March 2023
(This article belongs to the Section Land Socio-Economic and Political Issues)

Abstract

:
Governmental attention towards the high-quality development of the Yellow River basin has brought new development opportunities for the hotel industry. This study aims to reveal the spatial-temporal evolution patterns and influencing factors of hotels in the Yellow River Basin from 2012 to 2022, based on economic, social, and physical geographic data of 190,000 hotels in the Yellow River flowing. With the help of a GIS technology system, the spatial-temporal evolution patterns of all hotels, star hotels, and ordinary hotels were explored, respectively. Then, the significant influencing factors of these patterns were revealed by using geographic detector and Person correlation analysis. The following conclusions were drawn: (1) the overall scale of the hotel industry in the Yellow River Basin expanded year by year, achieving rapid growth from 2016, and fluctuating around 2020 due to the impact of the novel coronavirus epidemic; the overall spatial distribution had significant regional differences, showing the structural characteristics of “southeast more, northwest less”; (2) there was a great difference in the degree of spatial autocorrelation agglomeration among prefecture-level cities, and the degree of agglomeration of both the hotel industry as a whole and general hotels decreased year by year, showing a random distribution in 2022; star hotels were always distributed randomly. Additionally, a strong synergistic correlation was shown between the number of ordinary hotels and the number of star hotels in local space; (3) overall, the development of the hotel industry was significantly affected by seven factors: structural force, macro force, ecological force, internal power, consumption power, intermediary power, and external power. There were differences in the forces acting on different types of hotels, which gives a pattern recognition in-depth.

1. Introduction

The Yellow River has always been the mother river of China, feeding hundreds of millions of people [1]. Since the reform and opening up, the economy in the Yellow River Basin has been developed rapidly and has become an important economic belt in China, which arouses the governmental and the public attention on its sustainable development [2,3]. In 2021, the Chinese government issued the “Outline of the Yellow River Basin Ecological Protection and High-Quality Development Plan”, aimed to maintain the integrity of ecosystem in the Yellow River Basin, the rational resource allocation, and the relevance of cultural protection, inheritance, and promotion [4,5]. With the policies support of government, the protection and high-quality development of the Yellow River Basin is bound to achieve good rationality of resource allocation in various industries [6,7]. As one of the three pillar industries of tourism, the hotel industry provides accommodation services for people. The development level of the hotel industry is one of the important factors in measuring the regional reception of the service industry [8,9]. In addition to providing accommodation and reception services, the hotel industry also plays a role in promoting local culture [10,11,12]. At present, the hotel industry in the Yellow River Basin is characterized by large quantity and scale, a wide range of service objects, and multiple hotel types. The increase of residents’ income raises the demand for better tourism experience and promotes a shift of the regional service industries from the expansion in scale and quantity to the improvement of quality [13]. However, the lack of reasonable planning and guidance for future development also leads to the situation of disordered development. Especially in the period of corona-virus disease (COVID-19) pandemic, the hotel industry suffered a huge negative impact [14,15,16]. In this situation, there are many challenges to achieve the sustainable development of the hotel industry [17].
With the implementation of ecological protection and high-quality development strategies in the Yellow River Basin, the construction projects of national cultural parks were implemented, and various prefecture-level cities promoted the development of the industry through the implementation of supply-side reform policies [18,19,20]. With the support of various policies, more than 2.3 billion trips were made in the Yellow River Basin in 2022. Based on the consolidation of tourism development, tourism industry development planning is becoming more and more important, which puts forward higher requirements for the hotel industry. The service objects of the hotel industry are mainly tourists and businessmen, and the demand for service level is the main reason for accelerating the differentiation of hotel types [21,22,23]. The degree of hotel agglomeration is different among different cities. In particular, the development degree of high-end hotel industry is one of the manifestations of the level of urban modernization [24,25,26]. Therefore, the location characteristics of the hotel industry can be further revealed by studying the overall spatial evolution of different types of hotels and their correlations.
In terms of the research areas, scholars mostly studied the spatial distribution characteristics of the hotel industry from the national, provincial, city, and county scales [27,28,29,30,31,32,33,34,35]. However, with the increasing importance of the protection and development of water system basins, there are more and more demands of the study on a complete single water system basin as the research area. Some scholars mostly took the hotel industry as a whole or one or two types of star-rated hotels and chain hotels as research objects [36,37,38,39], which needed the spatial heterogeneity of different hotels in-depth. In terms of research methods, scholars mostly used a single method for research [27,28,40], where the use of comprehensive methods was more effective to reveal the spatial-temporal evolution. As for the influencing factors, scholars conducted a large number of researches on selected factors such as tourism demands [4,29,41], consumer market [42,43], regional economic conditions [16,44,45], infrastructure conditions [46,47,48], tourism resource endowment [49,50,51], environmental quality [52,53,54], and government investment [55,56,57]. However, at present, there is a lack of systematic screening of many data. Thus, it is possible to systematically explore the factors about the distribution of the hotel industry based on multiple sources of public data and to adopt multiple measurement methods.
Based on existing information, it is found that governments around the world increasingly attach importance to the river basins [58,59,60,
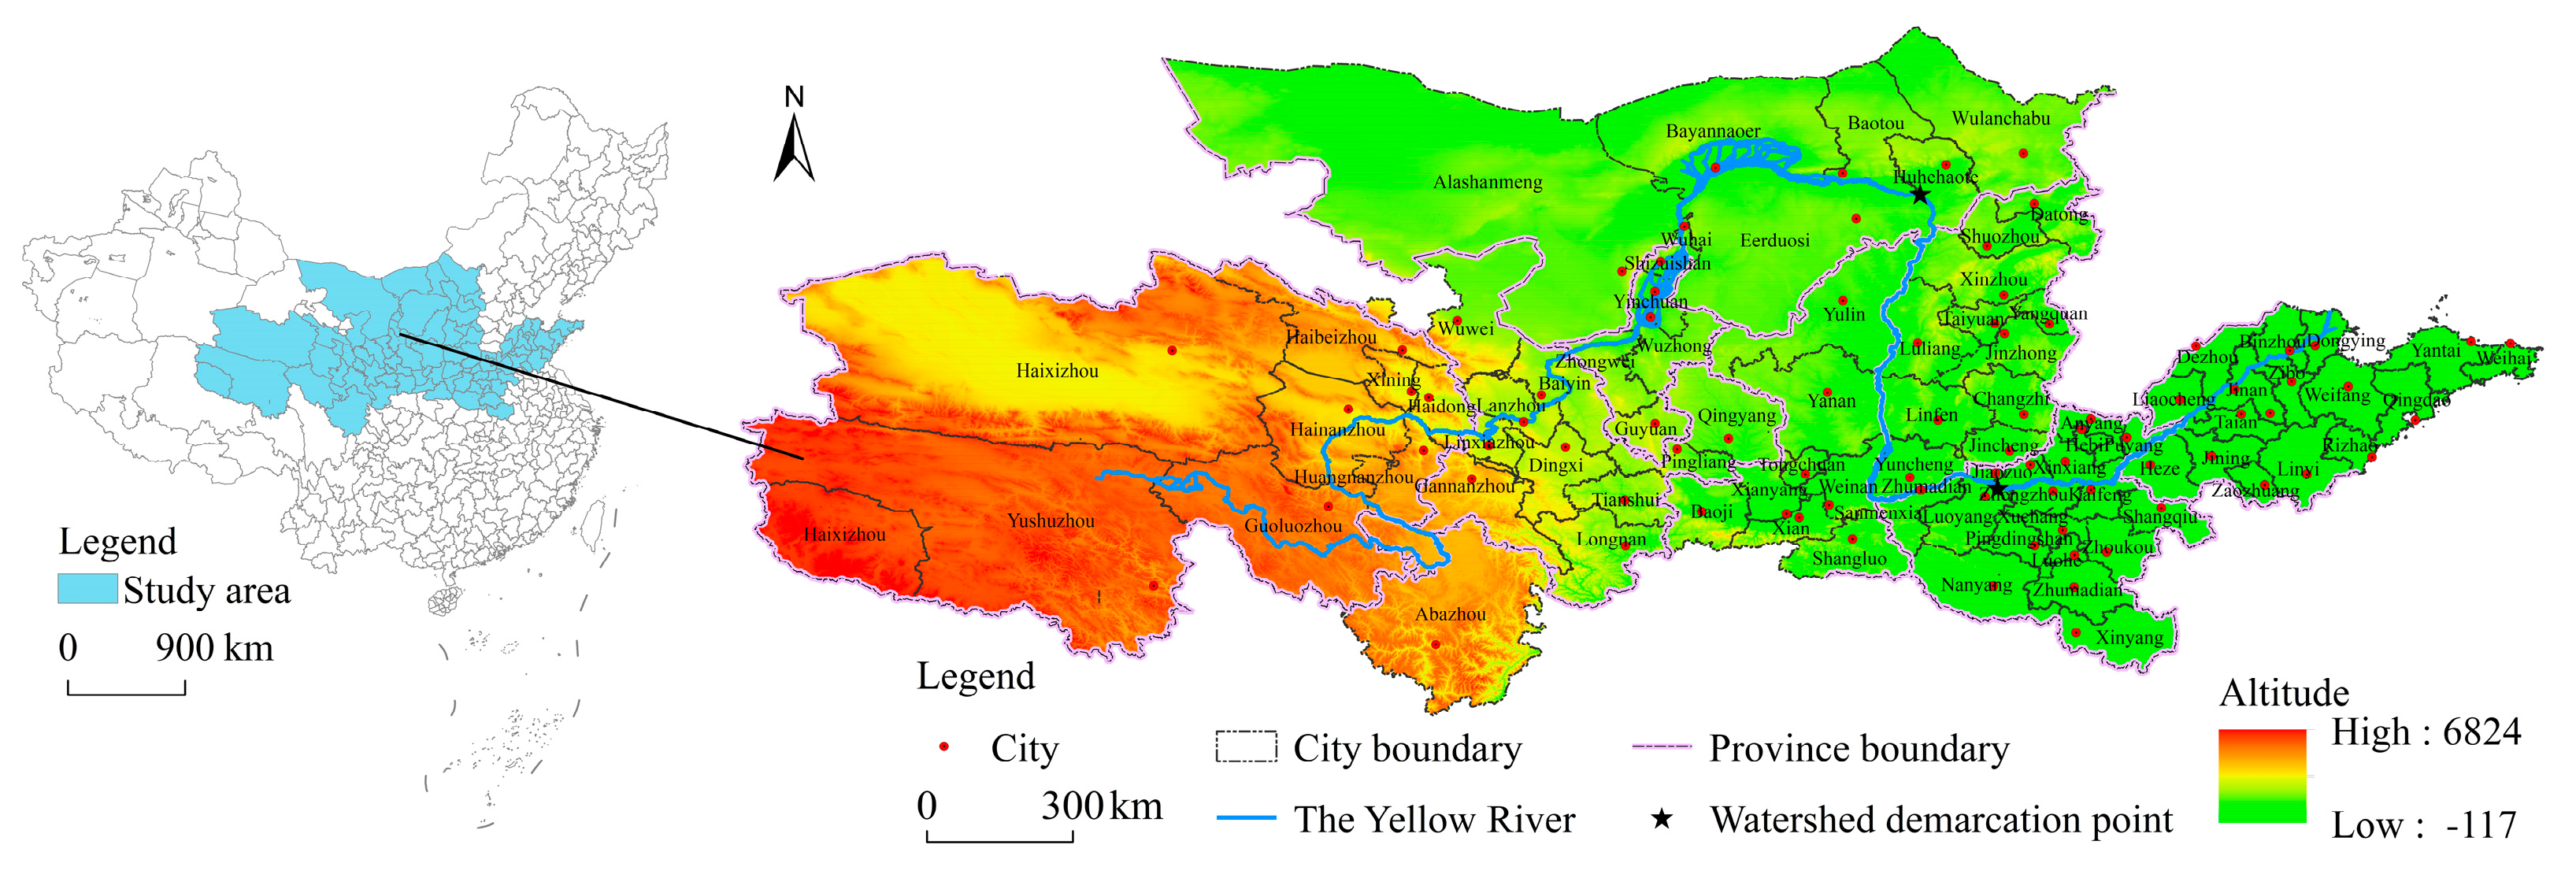
61]. In China, the government will make a serious of development planning for the hotel industry in the Yellow River Basin. There are several urgent questions to be addressed, such as the following: What are the overall development and changes in the spatial layout of the hotel industry in the Yellow River Basin over the past 11 years? Furthermore, what are the factors that affect the macro level layout of the hotel industry? Therefore, this paper took prefecture-level cities in the Yellow River Basin as the basic research unit. Based on the POI data of all categories of hotel industry from 2012 to 2022, the hotel industry was divided into star hotels and ordinary hotels (non-star hotels). Based on the vector data, the spatial analysis function of GIS software was used to systematically explore the spatial temporal pattern of hotel industry, star hotels, general hotels, and spatial autocorrelation agglomeration situation. Based on the official data, SPSS24.0 software and excel software were used to carry out data analysis by Geographical detector and Pearson correlation analysis. The experimental results fully verified the driving effects and systematically revealed modes of the influencing factors.
The combination of spatial analysis and measurement methods in this study can enrich the research methods and technical routes for the spatial structure relationship of the hotel industry in the river basin, and also contributed to enriching the spatial layout theory of the service industry and the tourism spatial structure theory. Secondly, this study can help the government understand the characteristics of hotel location better by revealing the evolution characteristics and influencing factors of hotel location at the macro level, which could mainly provide an important scientific reference for the government in formulating industry development planning. Finally, it provides a unique reference path for planners when carrying out planning work in local areas.

2. Materials and Methods

2.1. Research Area and Object

The Yellow River in the shape of “几” in Chinese, originated in the northern foothills of Bayankara Mountain on the Qinghai-Tibet Plateau, flows through Qinghai, Sichuan, Gansu, Ningxia, Inner Mongolia, Shanxi, Shaanxi, Henan, Shandong 9 provinces and regions involving 84 prefecture-level cities. With a total length of 5464 km, The Yellow River is the second longest river in Asia [1,2,3,4,5]. It contains a variety of terrains, such as plateaus, hills, basins, and plains, with obvious differences in topography and geomorphology and an elevation range of more than 4000 m. The boundary point between the upper and middle reaches of the Yellow River is in Hekou Town of Inner Mongolia; the middle and lower reaches is in the Taohua Valley of Henan Province. The Yellow River Basin connects Kunlun Mountain in the west, Yin Mountain in the north, Qin Mountain in the south, Bohai Sea in the east, and central and western parts of China. The Yellow River Basin is an important ecological security barrier in China, as well as an important area for population activity and economic development, and has a pivotal strategic position in the national development and socialist modernization construction. A total of 84 prefecture-level cities that the Yellow River System flows through were taken as the research areas (Figure 1).

2.2. Research Data

The data used in this study mainly contains the following aspects: (1) panel data of prefecture-level cities in the Yellow River Basin during 2012–2022 are from statistical yearbooks and government communiques; (2) the location information of the hotel industry was mainly obtained from a map using Python technology; (3) vector data of the Yellow River Basin were obtained from the scientific data center of the lower Yellow River, and topographic and geo-data were downloaded from the spatial cloud platform.

2.3. Research Methods

The research methods are mainly divided into two parts. (1) Using the data processing, image visualization functions, and spatial analysis of GIS software, the spatial-temporal evolution characteristics of the hotel industry and the spatial correlation of different types of hotels are revealed. Firstly, the data processing function is used to convert spatial coordinate point data into vector data, and according to research needs, the natural breaks method is used to divide into five levels for comparative analysis of differences between cities. Secondly, the image visualization function is used to visually display the quantity and density of the hotel industry in chronological order, and the overall distribution characteristics are analyzed. Finally, the spatial analysis function is used to estimate the elliptical distribution of the hotel industry to determine the spatiotemporal migration trend of the hotel industry, calculate the Moran index to determine the spatial agglomeration characteristics of the hotel industry, and conduct spatial correlation analysis to determine the spatial correlation of single or dual variables. (2) With the help of data management, statistical analysis, factor analysis, output management, and other functions of Excel and SPSS software, statistical and standardized processing of data is conducted, and the advantages of comparing multiple measurement methods in the two software to data processing are finally selected. Lastly, Geographic Detector and Pearson correlation coefficients were selected to systematically explore the driving factors affecting the distribution of the hotel industry and to obtain the driving force magnitude and action mode of each factor.

2.3.1. Standard Deviation Ellipse

Standard deviation ellipse (SDE) is a spatial statistical method used to quantitatively describe the overall characteristics of spatial distribution of geographic elements. This method takes the average distribution center of geographical elements as the center, the main trend direction of the distribution of geographical elements as the azimuth Angle, and the standard deviation of factors in the X and Y directions as the elliptic axis. By constructing the spatial distribution ellipse of geographical elements, the centrality, directivity, and spatial distribution form of geographical elements were described and explained. In this paper, ArcGIS software is used to construct the spatial distribution ellipse of the hotel industry from 2012 to 2022, which can be used to analyze the spatial and temporal migration trend of the hotel industry, ordinary hotels, and star hotels. SDE is shown as:
S D E x = i = 1 n ( x i Y ¯ ) 2 n   S D E y = i = 1 n ( y i Y ¯ ) 2 n
where SDEx and SDEy are the axis lengths in the x and y directions of the standard deviation ellipse, respectively. The long axis is the direction with the most spatial distribution, while the short axis is the direction with the least spatial distribution. xi and yi are the coordinates of the hotel location; ( X ¯ , Y ¯ ) is the average center of hotel spatial distribution; n is the total number of hotels.

2.3.2. Density Computing

Density computing is an important algorithm to calculate the properties of a substance. The significance of different densities of a substance can indicate the differentiated properties. This paper uses ArcGIS software to calculate the distribution density of the hotel industry, which can be used to analyze the difference of the hotel industry density between cities. The calculation formula is as follows:
ρ = N i S i
where ρ is the hotel density. The higher the density in prefecture-level cities, the more hotels per unit area are distributed. N is the number of hotels and S is the area of all cities.

2.3.3. Spatial Autocorrelation

Spatial autocorrelation reflects the potential interdependence of one or more variables in the same observation area and reveals the spatial distribution characteristics of the research object in the observation area. To reveal the spatial distribution characteristics of the hotel industry in the research area and the combination of global autocorrelation and local autocorrelation with the number of hotels or one or more indicators of the number of different types of hotels is more intuitive and significant. The method of combining global and local autocorrelations with single or multiple indicators is more intuitive and significant. Using a single value to reveal the autocorrelation degree of the whole observation area, the single indicator spatial autocorrelation is measured by Global Moran’s I as follows:
I = n i = 1 n j = 1 n w i j ( x i x ) ( x j x ) i = 1 n j = 1 n w i j ( x i x ) ( x j x )
where xi and xj represent the observed values of unit i and unit j respectively; x ¯ is the average of the observed values of each unit; Wij is the distance weight matrix; N is the total number of units studied; the value range of Moran’s I index is [–1, 1]. The larger the value, the stronger the correlation between the number of hotels in the prefecture-level cities; I > 0, positive correlation, I = 1, complete correlation; if I < 0, it shows negative correlation; if I = 0, it shows no correlation, that is, random distribution. Local spatial autocorrelation is to further explore the aggregation relationship between high and low values of indicators in space, and the formula is as follows:
I i = x i x s 2 i j ( x j x )
where Ii represents the degree of local correlation between adjacent geographical units. The greater the value, the stronger the degree of correlation; when Ii > 0, it indicates that there is a positive correlation between the indicators of the prefecture-level city and the adjacent city in the observation area, and on the contrary, when Ii < 0, there is a negative correlation. S represents the sum of all elements of spatial weight matrix.

2.3.4. Geographical Detector

As a common statistical method, Geographical Detector aims to reveal a statistical method to explore the driving force behind the influence of multiple factors. This method can not only test the spatial difference of single variable, but also detect the possible causal relationship between the two variables by checking the consistency of the spatial distribution of the two variables. Among them, the factor detector is used to detect the explanatory power of a geographical factor on the spatial distribution difference of a certain index value p, and the interactive detection can effectively identify the interaction between different factors. Therefore, it is effective to explore the influencing factors of the spatial pattern of the hotel industry by geographical detectors. The formula is as follows:
q = 1 h = 1 L N h σ h 2 N σ 2 = 1 S S W S S T S S W = h = 1 L N h σ 2 ,   S S W = N σ 2
where q represents the degree to which factors explain the phenomenon of hotel quantity differentiation; H = 1, 2…, L, is the stratification of variables or factors, i.e., classification or partition; Nh and N are the unit number of layer h and the whole area respectively; σh and σ2 are the variances of the number of hotels in floor h and the whole area; SSW and SST are the sum of intra-layer variance and the total variance of the whole region. The value range of q is [0, 1]. The larger the value, the more obvious the spatial differentiation of the number of hotels. If the stratification is generated by P itself, the larger the q value is, the stronger the explanatory power of xi to P is, and vice versa. Q = 1 means that the differentiation of dependent variable P is completely controlled by the independent variable x, and q = 0 means that x has no effect on the differentiation of P.

2.3.5. Pearson Correlation Coefficient

Pearson correlation coefficient is used to measure the linear relationship between fixed distance variables and the correlation between independent variables x and Y. It is widely used in the research of industrial development, urbanization construction, social welfare, rural settlements and other aspects to explore the correlation between independent variables and dependent variables in the same spatial region.
R = i n ( x i x ) ( x j x ) i n ( x i x ) 2 i n ( x j x ) 2
where R is Pearson coefficient, and the range is [–1, 1]; xi and xj represent the observed values of i variable and j variable respectively; x ¯ is the average value of each variable; N is the number of observations.

3. Characteristics of Spatial-Temporal Evolution of Hotels in the Yellow River Basin

3.1. Characteristics of Spatial-Temporal Changes in Hotel Industry

3.1.1. Temporal Evolving Characteristics

In the past 11 years, the overall change trend of the total hotel numbers in the Yellow River basin has been relatively consistent with that of ordinary hotels, which had increased significantly since 2016 and fluctuated in 2018–2020 due to the impact of the COVID-19. The overall number of star hotels shows a trend of rising first and then declining (Figure 2). In different periods, the total number of hotels in the Yellow River Basin has increased from more than 50,000 in 2012 to more than 180,000 in 2022. The number of ordinary hotels has increased from more than 50,000 to more than 180,000 in the ten years. The number of star-rated hotels has increased to more than 5000 from 2012 to 2018, but gradually decreased from 2018. Therefore, during the period of 2012–2022, the overall scale of the hotel industry in the Yellow River Basin has showed a trend of expansion, while the change of ordinary hotels and star hotels were significantly different.

3.1.2. Spatial Evolving Characteristics

According to the statistics of the hotel industry from 2012 to 2022, the total number of hotels, the number of ordinary hotels and the number of star-level hotels are visualized in Figure 3, Figure 4 and Figure 5, which reflect the differences in the spatial pattern of the hotel industry. In order to facilitate the description of the visualization results, Level I and Level II are divided into low values, Level III is divided into median values, and Level IV and V are divided into high values.
The visualization results showed (Figure 3) that in 2012, the high-value areas were mainly located in the downstream areas, with Shandong Province as the main gathering area; the median areas were relatively scattered; low-value areas were mainly located in the upstream and midstream areas. Since then, high-value areas had gradually emerged in the upstream areas, the number of middle and high value areas increased, and the middle value areas gradually gathered towards the middle reach. By 2022, the middle value areas were mainly concentrated in the middle reach, and the low value areas were mainly located in the upper reach. The ratio of the first place to the last place changed from 42.28 times in 2012 to 102.75 times in 2022, indicating that the scale gap of the hotel industry in prefecture-level was wider gradually. To sum up, the hotel industry scale in the Yellow River Basin had large differences between the north and the south, and between the east and the west. The overall spatial distribution characteristics appear that “high in the east and low in the west, high in the south and low in the north”.
The visualization result of ordinary hotels showed (Figure 4) that in 2012, the high-value areas were mainly located in the downstream areas; the median area was relatively scattered; low-value areas were mainly the upstream and midstream areas. Since then, the number of high-value zones had gradually degraded in the original region, and the median zone first gathered in the middle areas and then dispersed, while the number of low-value zones increased. As of 2022, only nine geographical units had high values, mainly distributed in the south of the middle and the lower areas of Shandong; the median area was scattered throughout the basin; low-value areas basically covered the upstream and midstream areas. Compared with the number of ordinary hotels in the geographical unit, it was found that the ratio of the first place to the last place changed from 42.57 times in 2012 to 102.67 times in 2022, indicating that the gap in the number of ordinary hotels in local prefecture-level cities was also gradually widening. To sum up, the spatial change characteristics of the ordinary hotels in the Yellow River basin had the similar number with the total hotels, maybe due to the small difference between the two values.
The visualization result of star hotels showed (Figure 5) that in 2012, the high-value areas were scattered throughout the basin, mainly in the provincial capitals or their near cities; the median area was mainly concentrated in the downstream area; the low value area mainly concentrated on the upstream area and the junction of the middle and downstream. Since then, the number of high-value zones fluctuated, the number of median zones increased, and new clusters emerged in the middle reach, while the number of low-value zones decreased. By 2022, the high value areas showed a fragmented distribution, the low value areas decreased significantly, and the median areas increased significantly. Compared with the number of star hotels in geographical units, the ratio of the first to the last place changed from 319 times in 2012 to 106.67 times in 2022, indicating that the gap in the star hotels gradually decreased. To sum up, with the passage of time, the number of star hotels in the Yellow River Basin had the characteristics of large differences between the east and the west, and the overall spatial distribution characteristics of “high in the east and low in the west”.

3.1.3. Spatial-Temporal Evolving Trend

Using the Direct Distribution tool, the ArcGIS drew a SDE with the number of different types of hotels in each city of the Yellow River basin as the weight, displayed the main regional changes of the spatial distribution of the hotel industry (Figure 6), and calculated the elliptical range and center of gravity coordinates of the spatial distribution of the hotel industry (Table 1).
(1) The focus of the hotel industry moved significantly. The center of the standard deviation ellipse reflects the center of gravity of the hotel industry in space. On the whole, the moving track of the center of gravity of the hotel industry’s spatial distribution showed that it moved first to the southwest and then to the southeast. In 2012, the distribution center of the hotel industry was located in Changzhi City, Shanxi Province. In 2014, the center of gravity moved to Jincheng City. In 2016, the center of gravity continued to move to the southwest to Linfen City. In 2018–2022, the distribution center shifted to the southeast and all were located in Jincheng City. In terms of classification, the ordinary hotels and the hotel industry had the same overall changes; the center of gravity of star hotels showed a trend of moving to the southeast and then to the west, and the center of gravity position changed significantly. In 2012 and 2014, the distribution centers of star hotels were located in Changzhi City, Shanxi Province, with a trend of moving to the southeast. In 2016–2022, the center of gravity moved to the west on the basis of 2014, all located in Linfen City, Shanxi Province. The shift of all spatial distribution centers reflected their quantitative changes in the spatial pattern.
(2) The spatial distribution area of the hotel fluctuated. The area of the standard deviation ellipse reflected the range of hotel spatial distribution, and the interior area of the ellipse was the main area of hotel distribution. On the whole, the overall spatial distribution area of the hotel industry in the Yellow River Basin was declining, with an area decrease of 7.86% in 2022 compared with 2012. In terms of classification, the spatial distribution area of ordinary hotels decreased by 8.07%; the spatial distribution area of star-rated hotels was fluctuating and rising, with an increase of 2.54% in 2022 compared with 2012. From the perspective of change trend, the elliptical space distribution range of different types of hotels presented different change trends, and the distribution area was significantly different.
(3) The spatial distribution of the hotel had been slightly adjusted. On the whole, from 2012 to 2022, the ellipse azimuth of the hotel industry in the Yellow River Basin showed a continuous downward trend, from 89.34° to 88.03°, and the ellipse azimuth of ordinary hotels decreased from 89.87° to 88.00°, all of which showed a small counterclockwise rotation, indicating that the number of hotels located in the northeast or southwest of the interior of the ellipse increased; however, the azimuth of the elliptical spatial distribution of star-rated hotels fluctuated, with little change in general.
In summary, the changes in the elliptical gravity, spatial area, and azimuth indicate the overall expansion of the industry had undergone dynamic changes. Combining the characteristics of time change (Figure 2) and spatial evolution (Figure 5), the scale and center of gravity of the hotel industry and ordinary hotels showed a trend of moving towards the southwest, indicating that the number of hotels in the western and southern regions increased higher; the reason why the elliptical gravity of star hotels moved westward was due to a decreasing number of eastern hotels and an increasing number of western hotels.

3.2. Characteristics of Hotel Industry Density Change

The density value could reveal the difference in the number of hotels per unit area in the Yellow River basin (Figure 7, Figure 8 and Figure 9). The area with high density value in the total number of hotels gradually shrunk and gradually concentrated in Henan Province and Shandong Province. From Figure 7 (in 2012), the maximum density value of the total number of hotels in the Yellow River basin was 0.326/km2, which appeared in Qingdao, Shandong, and the minimum density value of the total number of hotels in the city was only 0.0003/km2 in Yushu, Qinghai. The difference between the total area density of the two hotels was 988 times. Since then, the hotel density value had fluctuated and increased. By 2022, the maximum value of hotel area density increased to 1.5 hotels/km2 in Xi’an, Shaanxi. The minimum value of total hotel area density was only 0.001 hotels/km2, still in Yushu, Qinghai. The difference between the total area density of the two hotels was 2063 times, and the difference between the total area density of hotels further expanded. From the perspective of regional distribution, in 2012, 2014, and 2020, the medium-high value areas of the total area density of hotels widely distributed in Shaanxi, Shanxi, Henan and Shandong, with small regional differences. However, in 2016, 2018, and 2022, the areas with high and medium density of hotels were relatively concentrated, mainly in Shandong and Henan. There were also areas with high density in other provincial capital cities, and most other cities had a low density.
Ordinary hotels had the similar spatial distribution density with the total hotels. The fluctuation of the high-density distribution area was reduced and gradually concentrated. Figure 8 showed that in 2012, the maximum density of total hotels was 0.305/km2 in Qingdao, Shandong, and the minimum density of total hotels was only 0.0003/km2 in Yushu, Qinghai. The difference between the above densities was 947 times; since then, the density value of hotels in various cities fluctuated and increased, and the density difference between cities gradually expanded. By 2022, the max hotel density increased to 1.47 hotels/km2 in Xi’an, Shaanxi. The min hotel density was only 0.001 hotels/km2 still in Yushu, Qinghai. The further expanded density difference was 2054 times. From the perspective of regional distribution, in 2012, 2014 and 2020, the areas with the middle and high total hotel density were widely distributed in Shaanxi, Shanxi, Henan and Shandong; however, in 2016, 2018 and 2022, the areas with high and medium total hotel density relatively concentrated, mainly in Shandong and Henan. There were also areas with high total density in other capitals, and most other cities had low total density. In general, the ordinary hotel density in the Yellow River Basin and the total density maintained the same trend.
The regional difference of star hotels fluctuated slightly, and the city density increased first and then decreased. Figure 9 indicated that during 2012–2022, the high-density areas of star hotels were mainly in the provincial capitals, while the sub-high-density and medium-density areas were around these capitals. In addition, Henan in the lower reach had a large population density and relatively developed economy, and the star hotel density was relatively high. However, in the Qinghai-Tibet Plateau and the north-central Loess Plateau, the star hotel density was lower due to the low population density and economy. The star hotel density in 2012 was 0.03/km2 in Zhengzhou City, Henan. Since then, the star hotel density had gradually increased in 2014 and 2016. By 2016, the maximum star hotel density was 0.056/km2 in Xi’an, Shaanxi. After 2016, the star hotel density had gradually decreased in the whole. By 2022, the maximum density of star hotels reduced to 0.031/km2. Thus, the star hotel density and the total density had the same trend.
To sum up, through the above comparative analysis, it was found that the areas with high and sub-high densities were mainly in Henan, Shandong, and other provincial capitals, the areas with medium-density and lower-density were mainly in the northern part of the Loess Plateau in the middle reach, and the lowest-density areas were mainly in the areas with high altitude and small population in the upper reach. The city-level units with higher areal density clustered.

4. Spatial Correlation Analysis of Hotel Industry

In order to further explore the spatial and temporal distribution correlation, this paper used the spatial autocorrelation analysis function of ArcGIS software and GeoDa software, to discover differences of the hotel industry, the cold and hot areas, the global and local spatial correlation of various types of hotels, with the weight of the number of hotels.

4.1. Characteristics of Spatial-Temporal Changes in Hotel Industry

According to the Moran’s I index of global spatial autocorrelation (Table 2), there were significant differences in the global spatial autocorrelation characteristics. From 2012 to 2022, the global Moran’s I value of the total hotels and ordinary hotels showed a fluctuating downward trend, and the global spatial autocorrelation Z value of the total hotels and ordinary hotels in 2022 was less than 1.65, indicating that the aggregation degree of the total hotels and ordinary hotels between geographical units gradually declined and showed a random distribution trend in 2022. The Z values of the global spatial autocorrelation of star hotels were between [−1.65, 1.65]. The Moran’s I had positive and negative values in different years, which indicated the weak degree of spatial agglomeration of star hotels and a random distribution state. The star hotel discretization had a spatial negative autocorrelation and the star hotel agglomeration had a positive spatial correlation.

4.2. Local Spatial Autocorrelation Analysis

4.2.1. Analysis on the Difference of LISA Spatial Agglomeration

The same type of agglomeration areas was concentrated, and the different types of agglomeration in different regions were significantly different. Figure 10 showed that in 2012, the total number of hotels was nine cities with high-high concentration areas, all of which were distributed in Shandong at the lower reach. Four low-high concentration cities were distributed surround high-high areas, where the current city had few hotels but the surrounding had many hotels. There were three high-low concentration cities as provincial capitals, Zhengzhou, Lanzhou and Xining. There were 13 low-low agglomeration cities mainly in the upper reach. In the middle and lower reaches, only Jinzhong, Shanxi, was a low-low agglomeration city. In total, there were 55 cities with the most non-significant agglomeration types. In the following years, the number of high-high agglomeration areas fluctuated and decreased and the number of non-significant agglomeration areas increased gradually. By 2022, there were only three cities with high-high concentration, Weifang, Rizhao and Yantai in Shandong. High-low concentration cities were only Lanzhou and Xining. Low-high concentration cities changed to Zibo, Dongying and Weihai in Shandong, Sanmenxia in Henan and Shangluo in Shaanxi. The number of low-low concentration areas were stable, but the distribution area changed slightly the fluctuation of insignificant cities increased to 62.
Total hotels and ordinary hotels had the similar spatial distribution relatively, which meant that the same type of agglomeration in the same region, and different regions had the significant different agglomeration. Figure 11 implied that in 2012, 9 cities in Shandong had high-high concentration of ordinary hotels in the lower reach. Four cities in Shandong of low-high concentration were in the periphery areas, which meant that the current city had few hotels but the surrounding cities had more hotels. The three cities with high-low agglomeration were provincial capitals and 12 low-low agglomeration cities mainly concentrated in the upper reach, where only Jinzhong with a low-low agglomeration in the middle reach. 56 cities had the most non-significant agglomerations in total. In the following years, the number of high-high agglomeration areas decreased, while the number of non-significant agglomeration areas increased gradually. By 2022, only three cities in Shandong had high-high concentration. High-low concentration cities were only Lanzhou and Xining. Low-high concentration cities changed to Zibo, Dongying and Weihai in Shandong, Sanmenxia in Henan, and Shangluo in Shaanxi. The distribution of low-low concentration areas changed slightly. The fluctuation of insignificant cities increased to 62, and the spatial distribution of different agglomeration changed greatly.
The clustering of star hotels was different and more dispersed. Compared with other types, star hotels had more different distribution in different years and regions, where the low-low areas were further narrow. Figure 12 showed that in 2022, 73 cities had an insignificant clustering and only 11 cities had significant clustering. Four cities with high-high concentration all located in Shandong Peninsula and three cities had high-low agglomeration, such as Xi’an and Lanzhou. Shangluo, closed to Xi’an, was the only city with low-high concentration is City. Xi’an had many star hotels while Shangluo had few star hotels, so it was a low-high concentration area. There were also three low-low concentration areas. Since then, the number of cities had fluctuated, but the distribution areas of different agglomeration types changed significantly. By 2022, there were 74 cities with insignificant agglomeration. High-high concentration cities all in Shandong were reduced to 2. There were still three cities with high-low concentration, but the distribution area changed to three provincial capitals. Cities with low-high agglomeration added Rizhao and Weihai in Shandong. There were only two low-low agglomeration cities.

4.2.2. Cold and Hot Spot Analysis

The total number of cold spots decreased first and then increased, the number of non-significant areas increased first and then decreased, the total number of hot spots remained stable, and the number of hot spots at different levels changed significantly. Figure 13 presented that in terms of regional distribution, the cold spots were mainly concentrated in the transition zone from the first ladder to the second ladder of China’s terrain, the hot spots were mainly concentrated in the downstream Shandong Peninsula, with the most inconspicuous cities and the widest area distribution. There was no first-level cold spot in the total number of hot spots and cold spots. The number of level II cold spots was only 1 In 2012, which disappeared in 2014 and 2016, and appeared 3 in 2018–2022. The number of level III cold spots was 9, 7, 5, 7 in 2014, 2016, 2012, and 2018–2022 respectively. The number of non-significant cities increased gradually in 2012–2016, and then kept the similar level in 2018–2022. The number of level III hot spots increased slightly in the past decade; the number of secondary hot spots increased from 2 in 2012 to 6 in 2022. The trend of the first-level hot spots was opposite to that of the second-level hot spots, from 10 in 2012 to 4 in 2022. Based on the above analysis, the number of hot spots basically remained stable in the past decade, but the number of primary and secondary hot spots increased and decreased significantly.
Figure 14 indicated that the cold spots of ordinary hotels are highly consistent with the distribution of total hotels. The number of cold spots decreased first and then increased. The number of non-significant areas and cold spots kept the opposite change trend, while the total number of hot spots remained stable. However, the number of hot spots in different grades changed significantly. The distribution of primary cold spots and primary hot spots was most concentrated, and there were secondary and tertiary cold spots around the primary cold spots.
The cold spot area and non-significant area of star hotels and the total number of hot spots remained stable. The number of hot spots of different grades fluctuated greatly. Figure 15 showed only one third-level cold spot area in Dingxi, Gansu in 2014 and no cold spot in other years. The number of non-significant regions also remained stable, with 76 in 2012 and 75 in 2014–2022; in 2012 and 2014, the hot spots were all concentrated in the Shandong Peninsula, and in other years, the hot spots were also mainly concentrated in the Shandong Peninsula. Only in 2016, Sanmenxia in Henan, Shangluo in Shaanxi, and Shangluo in Shaanxi, from 2018 to 2022, were the third-level hot spots. There was only one third-level hot spot in 2012 and 2014, rising to five in 2016, and remaining at two in 2018–2022. The number of secondary hot spots increased from 4 to 6 in the decade from 2012 to 2022. Contrary to the change trend of secondary hotspots, the number of primary hotspots decreased from three to only one in the last decade.

4.3. Bivariate Spatial Correlation Analysis

4.3.1. Bivariate Global Spatial Autocorrelation Analysis

In order to further explore the spatial-temporal distribution correlation of the hotel industry in the Yellow River basin, a bivariate global spatial correlation analysis was carried out for two types of hotels to obtain the global spatial correlation characteristics (Table 3). The results showed that, except for the results in 2016, the p value was greater than 0.05, the other results were less than 0.05, indicating that the confidence of the calculated results of bivariate spatial correlation in 2012–2022 was greater than 90%. Moran’s I is greater than 0, 1.96 > Z > 1.65, indicating that the two variables have strong positive spatial correlation.

4.3.2. Bivariate Local Spatial Autocorrelation Analysis

The results of bivariate local spatial correlation analysis showed (Figure 16) that the distribution of ordinary hotels and star hotels in the Yellow River basin had different degrees of correlation, among which the number of units with significant synergy accounts for 14.3%, 14.3%, 13.1%, 10.7%, 13.1%, and 8.3%, respectively. The distribution of regions with significant relationship was relatively fixed in the Yellow River basin. High-high significant areas were mainly distributed in Shandong, and low-low significant areas were mainly distributed in Qinghai and surrounding prefecture-level cities at the upper reach. High-low significant areas were mainly concentrated in Gansu and Sichuan. Shangluo, Shanxi, always was a low-high significant area. In significant regions, the distribution of the number and scale of the two hotels shows a cooperative development relationship, with a trend of common growth or extinction, while in non-significant regions, the relationship between the growth and extinction of the number and scale of the two hotels was not obvious.

5. Quantitative Analysis of Influencing Factors of Hotel Industry

5.1. Construction of Influencing Factor Indicator System

The formation of the development and distribution pattern of the hotel industry in the Yellow River basin resulted from a joint action of many factors. Based on 120 attribute data and spatial vector data related to urban social, economic, and natural records, the database required for this study was constructed. Based on the existing literatures, 38 related factors, excluding 12 unimportant factors were analyzed by using econometrics and geography related methods. Based on the number of total hotels, ordinary hotels, and star hotels, some factors were selected such as GDP, total tourism income, total fixed asset investment, the number of national scenic spots, the annual average concentration of PM 2.5, population density, per capita GDP, total retail sales of social consumer goods, the number of students in colleges and universities, the proportion of the tertiary industry, passenger transport volume, road density, the number of inbound tourists, the actual use of foreign capital, and 16 other indicator factors, to build an indicator system that affects the distribution and development of the hotel industry. The index factors that affect the development of the hotel industry were divided into seven major influencing factors: structural force, macro force, ecological force, internal power, consumption power, intermediary force, and external power (Table 4). The geographical detector and Pearson correlation analysis method were selected to combine the advantages of the two methods in data processing, which can also mutually verify the experimental results.

5.2. Comparison of Driving Forces of Influencing Factors

The results of single-factor explanatory power and double-factor interaction output by the geographical detector showed that (Table 5): the single-factor explanatory power from high to low was x1 > x2 > x10 > x3 > x4 > x5 > x11 > x15 > x16 > x13 > x8 > x6 > x14 > x9 > x7 > x12, and both were significant at the level of 1%. The comprehensive explanatory power of the interaction of two factors are higher than that of a single factor. Compared with single factor alone, the q value of double factor interaction was improved to some extent. In the two-factor interaction results, the number of ordinary hotels (x1) had the strongest impact on other factors, and the interaction q value had increased compared with the single-factor effect. The interaction between the number of star hotels (x2) and other factors was second only to the number of ordinary hotels (x1), which comprehensively explained that the result was multiple times higher than that of other single factors. The results showed that: (1) the hotel industry in the Yellow River basin was affected by many factors, and the comprehensive detection results of single factor detection and double factor interaction can better explain the change of the total number of hotel industry; (2) after the interaction of each influencing factor, it mainly presented the type of interaction enhanced by two factors, and the interaction value was higher than any single factor; (3) after the interaction of a small influence factors, the interaction type showed nonlinear enhancement. The interaction value was greater than the sum of the two factors, and the interaction result produced a “1 + 1 > 2” effect.

5.3. Correlation of Influencing Factors

Pearson correlation analysis method was used to explore the effect of influencing factors on the number of total hotels, ordinary hotels, and star hotels. The significance probability test and correlation degree division were conducted according to Pearson correlation coefficient standard (Table 6). Among them, the correlation coefficient of each factor was greater than 0 and significant at the 1% level, so the zero hypothesis was rejected. Therefore, the relationship between 16 independent variables and dependent variables is positive correlation. The results showed that:
  • Structural force factors. The hotel industry is composed of various types of hotels, and it cooperatively develops and improves the urban service industry chain. In order to meet the needs of different consumer groups, the hotel industry has developed a variety of service products, thus gradually forming different types of hotels [62]. The development of all kinds of hotels in the hotel industry in the Yellow River basin is significantly and positively driven by indicator factors.
  • The correlation strength of the influencing factors on the three dependent variables is different. On the whole, the intensity level of the influence factors on the total number of hotels and the number of ordinary hotels is similar, but compared with star hotels, the correlation intensity is significantly different; for the same factors, the development of different types of hotels is affected differently. For example, population density (x8) has a moderate correlation with ordinary hotels (0.470), but a weak correlation with star hotels (0.369).
  • In the process of rapid development of the hotel industry, the correlation coefficient between the number of ordinary hotels and the number of star hotels is 0.813, indicating that there is a strong correlation between the dynamic changes of the numbers, indicating that there is a promotion relationship between the development of different types of hotels. All figures and tables should be cited in the main text as Figure 1, Table 1, etc.

6. Discussion

As the pillar industry of China’s tertiary industry, the hotel industry is an important reception service industry. The spatial-temporal evolution patterns of the hotel industry in the Yellow River basin show that there are great differences in the development of the scale of the hotel industry in different cities. The research results enrich the research methods and technical routes of the structural relationship of the hotel industry in large regions. For the government, it can provide a scientific reference for the formulation of the spatial development planning of the hotel industry and also provide a reference for the spatial planning and layout of the hotel industry in other regions. It is helpful to enrich the spatial layout theory of service industry and the spatial structure theory of tourism. Combined with the quantitative analysis results, the seven factors identified were analyzed.
  • Structural force factors. The hotel industry is composed of various types of hotels, and it cooperatively develops and improves the urban service industry chain. In order to meet the needs of different consumer groups, the hotel industry has developed a variety of service products, thus gradually forming different types of hotels [62].
  • Macro factors. The relatively high GDP level of the city indicates that the industrial development environment is good, and business activities are frequent. Foreign businessmen provide a stable consumer group for the development of the hotel industry. Fixed asset investment can improve the production and service capacity of the city and provide basic means of production for the development of the hotel industry. Tourism revenue is an important source of regional economic growth [63]. Affected directly by the number of inbound tourists, the increasing in the number of tourists forces the scale of the hotel industry to continue to expanding.
  • Ecological factors. The hotel industry is an important supporting industry for the construction of national scenic spots, which are also the most popular tourist destinations. The number of national scenic spots owned by the region represents the main competitiveness of the regional tourism industry, and is the key factor to attract tourists, thus driving the development of the hotel industry. The annual average concentration of PM 2.5 reflects the urban ecological environment and is an important consideration factor for attracting foreign people to live or travel temporarily.
  • Internal dynamic factors. Population is the main service body of the hotel industry. The increase of population density provides the possibility for the hotel industry to expand market space and create market opportunities. The higher the urban population density, the greater the market demand capacity of the hotel industry. GDP per capita reflects the purchasing power of regional residents, which can effectively build the supply-demand relationship of “consumer-hotel industry” and is the internal driving force for the development of regional hotel industry.
  • Consumption power factor. The proportion of the gross output value of the tertiary industry represents the overall scale expansion of the regional service industry. The reception provided by the hotel industry is the key link for various entities to carry out official business, business, tourism, and other service activities. The retail sales of social consumer goods reflect the material input of local residents in their daily life, as well as the cost of some companies, enterprises and social organizations to hold commercial and social activities. The larger the total amount, the faster the circulation of goods in the region, and the market demand for high-quality reception services.
  • Intermediary factors. The passenger traffic volume and road density respectively reflect the regional traffic capacity and the improvement level of road facilities. This provides convenient transportation for people to go out and carry out life and entertainment activities, and also provides intermediary conditions for consumers to go to hotels.
  • External power factor. The cross-regional tourism consumption of tourists involves clothing, food, accommodation and transportation. The accommodation services provided by the hotel industry can meet the short-term accommodation needs of foreign tourists [64], which is also an important reason why the development of the hotel industry in various cities is driven by tourism. The amount of foreign capital actually utilized can reflect the regional investment environment, as a catalyst for regional economic development, accelerate economic growth and promote the development of the hotel industry.
In order to solve the research problems of the space structure of hotels at the prefecture-level cities, promote the coordinated development of the hotel industry in the Yellow River Basin in practice, and achieve the ultimate goal of high-quality and sustainable development of the industry, the following suggestions are put forward, through exploring the space-time evolution characteristics and influencing factors of the hotel industry from the perspective of the space of prefecture-level cities:
  • Under the governmental leadership, industries can optimize the allocation of resources in the accommodation industry in combination with major regional development strategies and undertake the upper planning. The development of the accommodation industry reflects the image and function of the city. It should be closely combined with the ecological protection and high-quality development strategy of the Yellow River basin, the construction project of the Yellow River Cultural Park, and the regional tourism development plan. It should integrate the scale, quantity, service quality, spatial layout, and urban functions, and actively integrate into the “one blueprint” of the land and space planning, and make reasonable planning, make all types of hotels in the accommodation industry develop harmoniously within the regional space.
  • Under the governmental leadership, the number of different types of hotels should be reasonably allocated, the product menu should be optimized for consumers, the needs of different consumer groups should be met, and the reception services such as tourism, business and trade should be carried out well to avoid homogeneous competition. The spatial layout of the future planning and construction of the accommodation industry in the Yellow River basin should adhere to the principle of “market-oriented and people-oriented” in terms of location selection, capital investment, land use index division, infrastructure and supporting facilities construction, fully consider market demand, standardize market prices, improve service levels, and avoid resource waste caused by homogeneous competition within the region.

7. Conclusions

Based on the POI data of the hotel industry in the Yellow River Basin from 2012 to 2022 and the panel data of prefecture-level cities, this paper took 84 cities as the basic research unit, by using GIS software, SPSS24.0 software and Excel software, and computer visualization technology, geographic detector and Pearson correlation analysis method to systematically explore the spatial-temporal distribution pattern and spatial auto-correlation concentration trend of the hotel industry, star hotels and ordinary hotels. The study also revealed the driving force and action mode of the influencing factors. The conclusions are as follows:
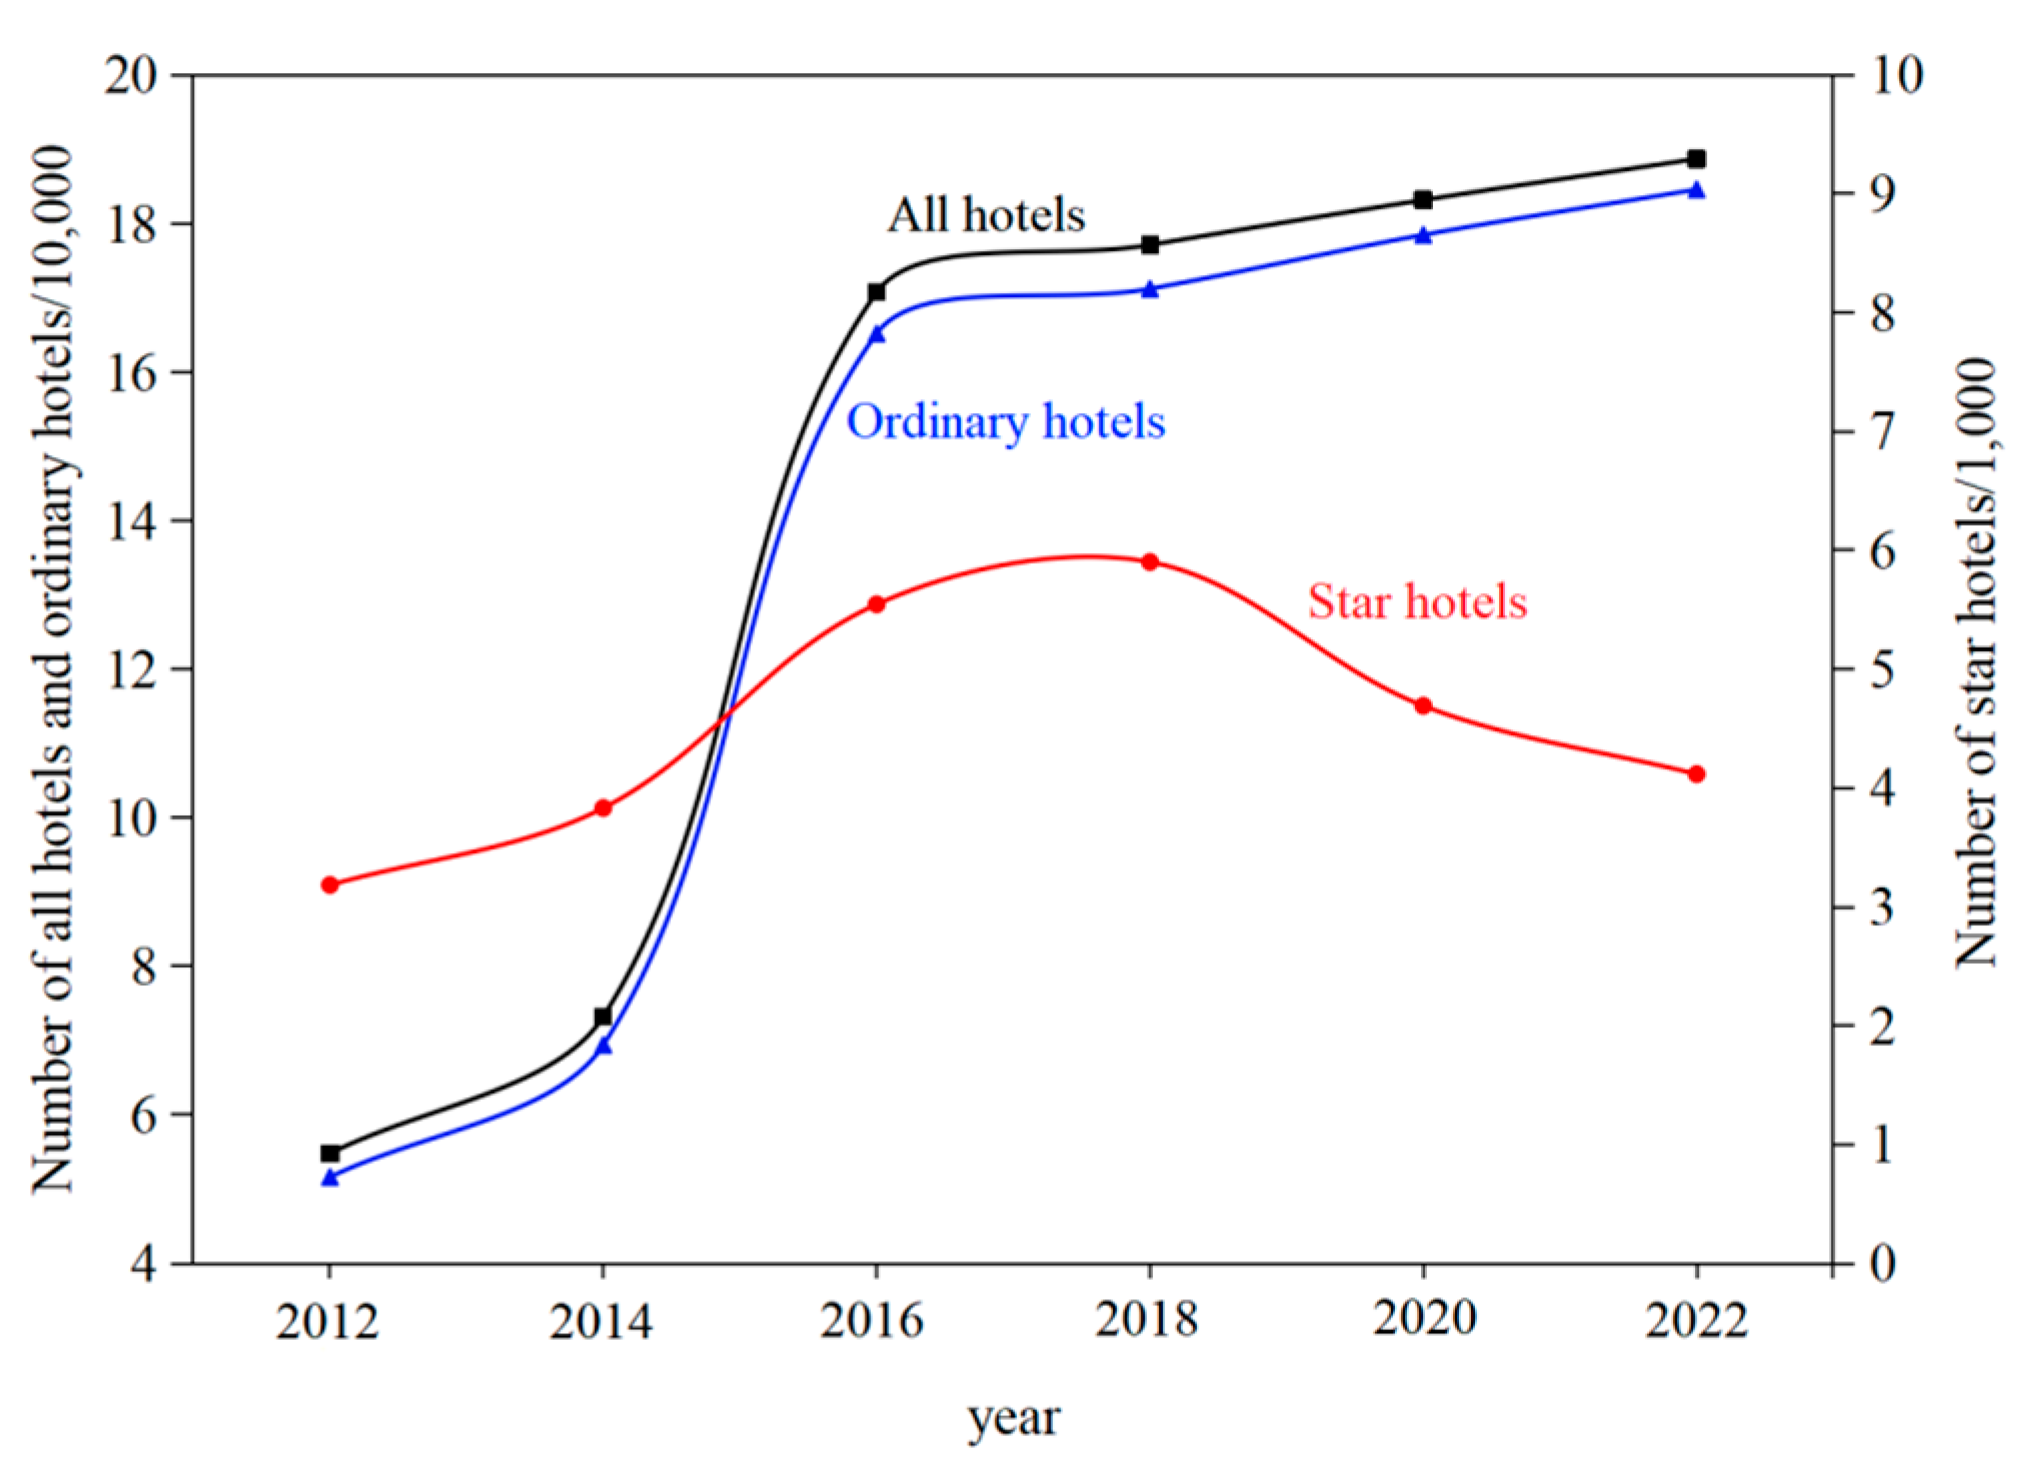
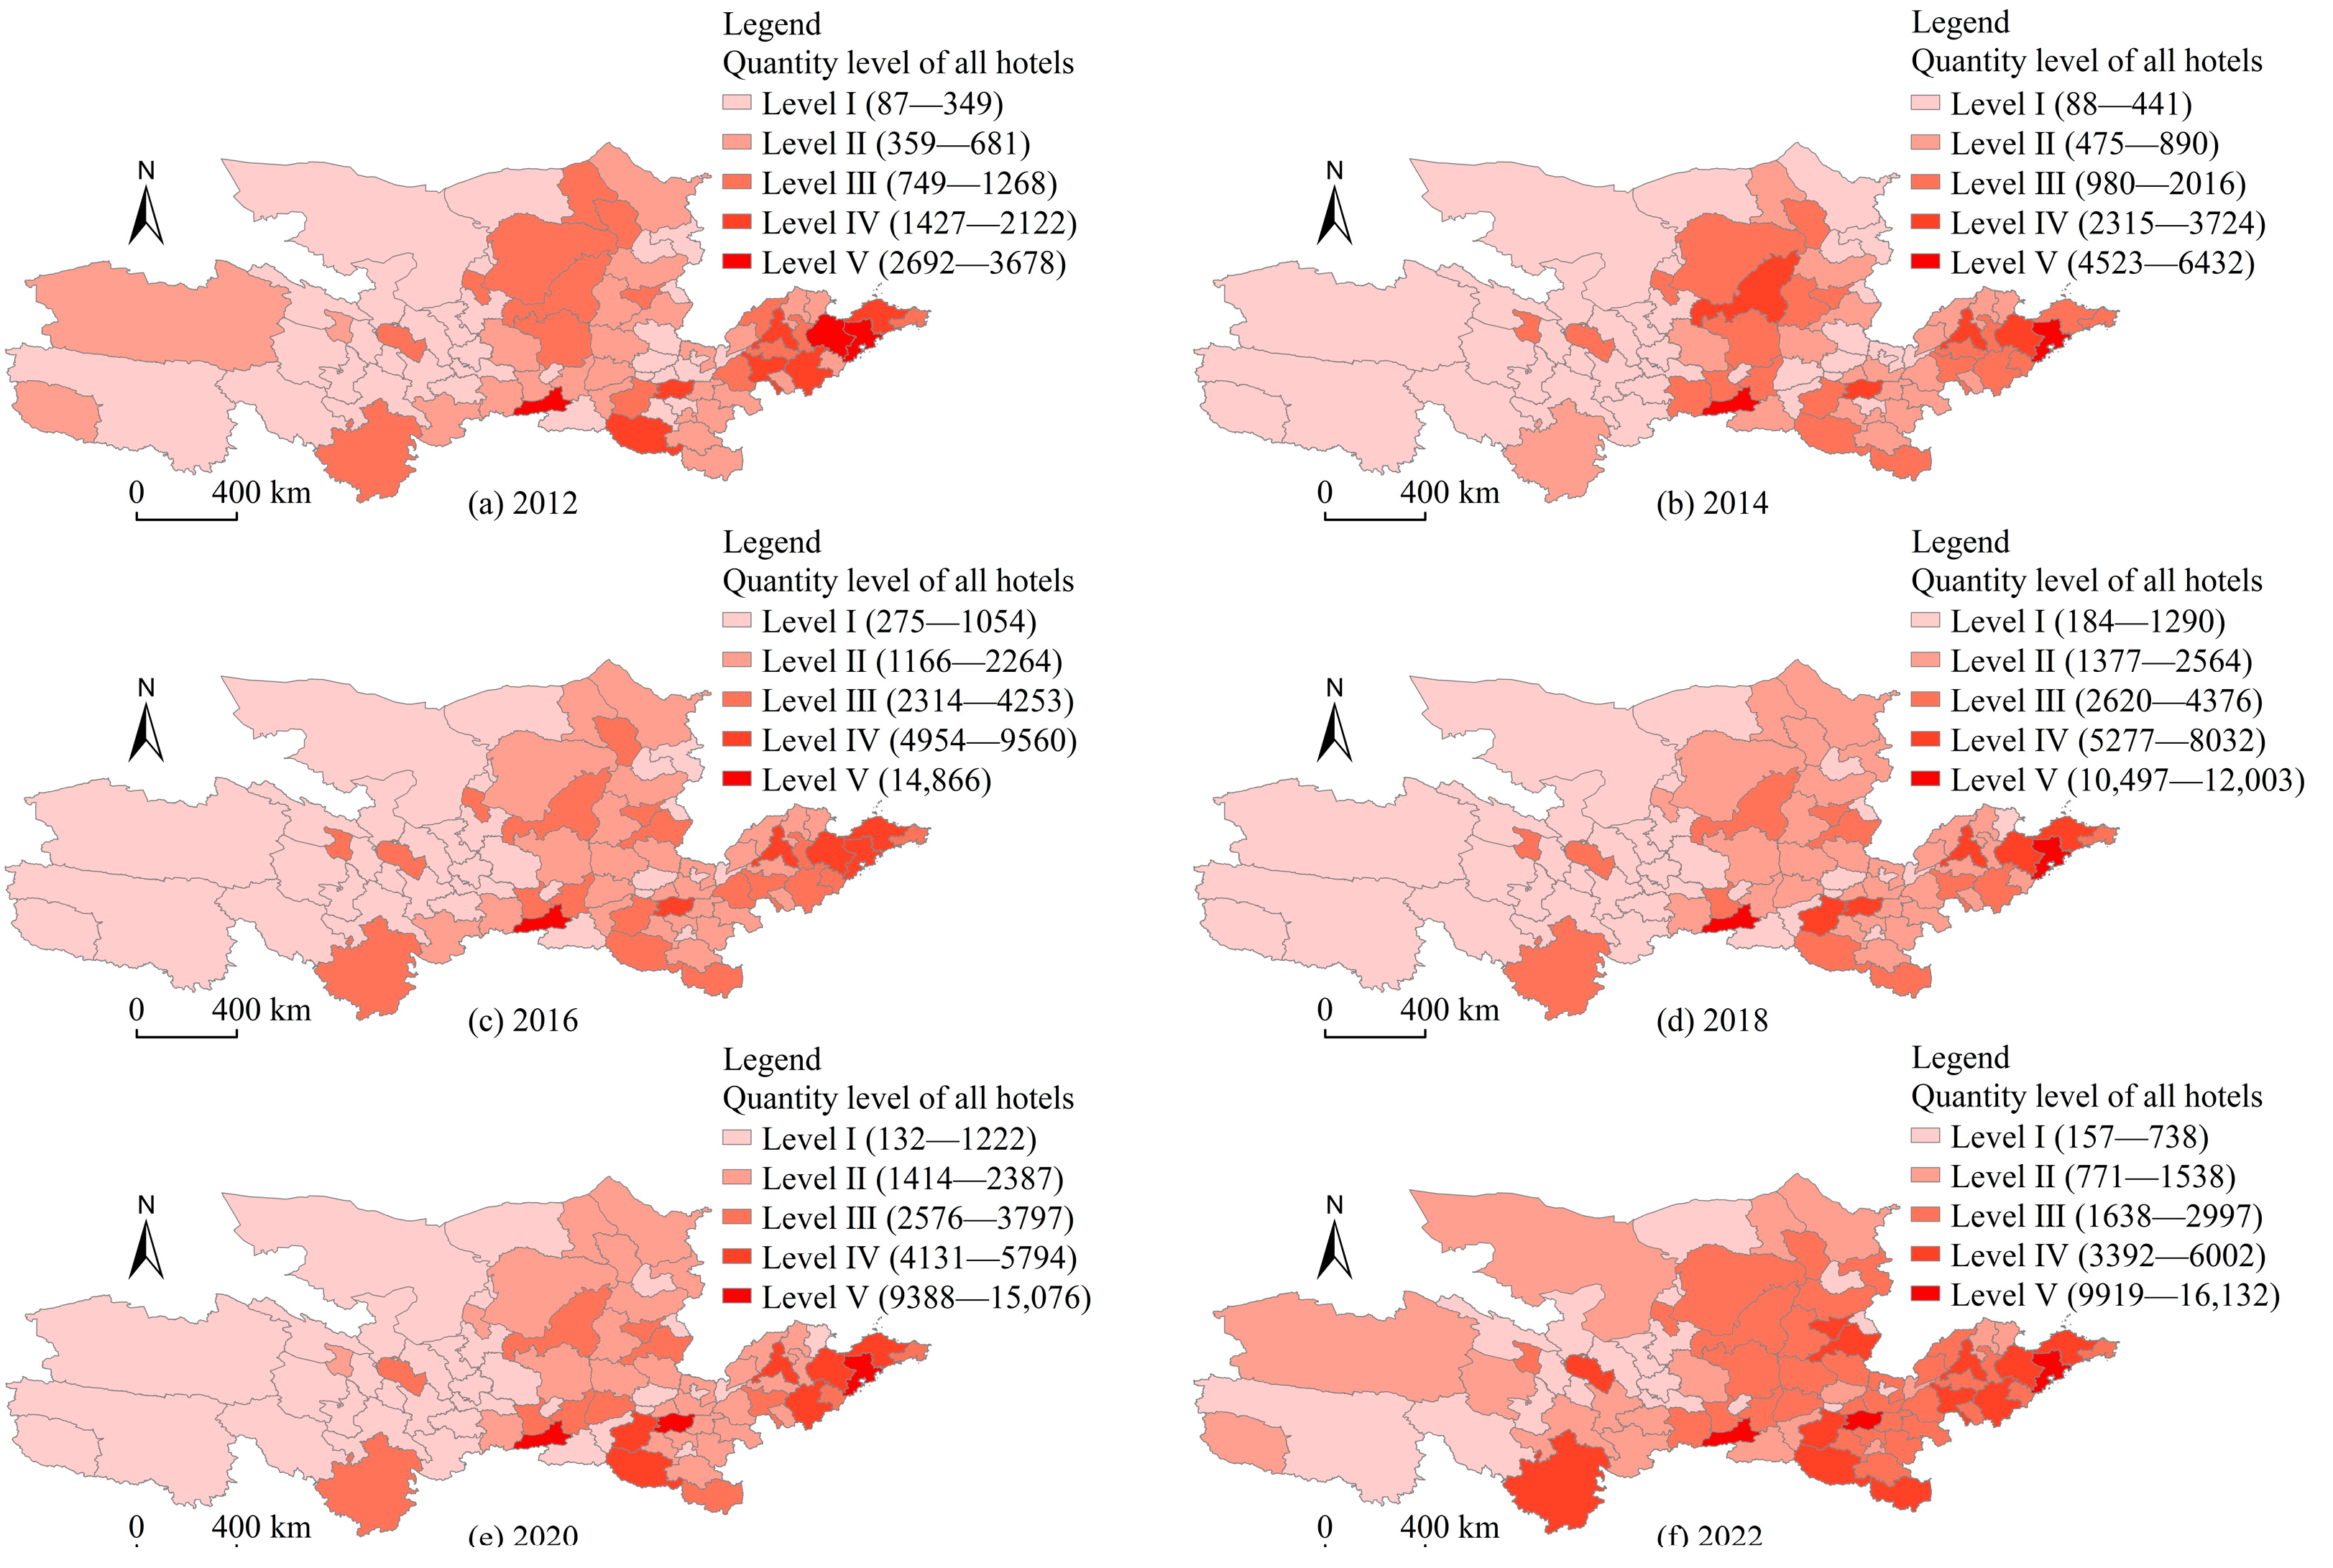
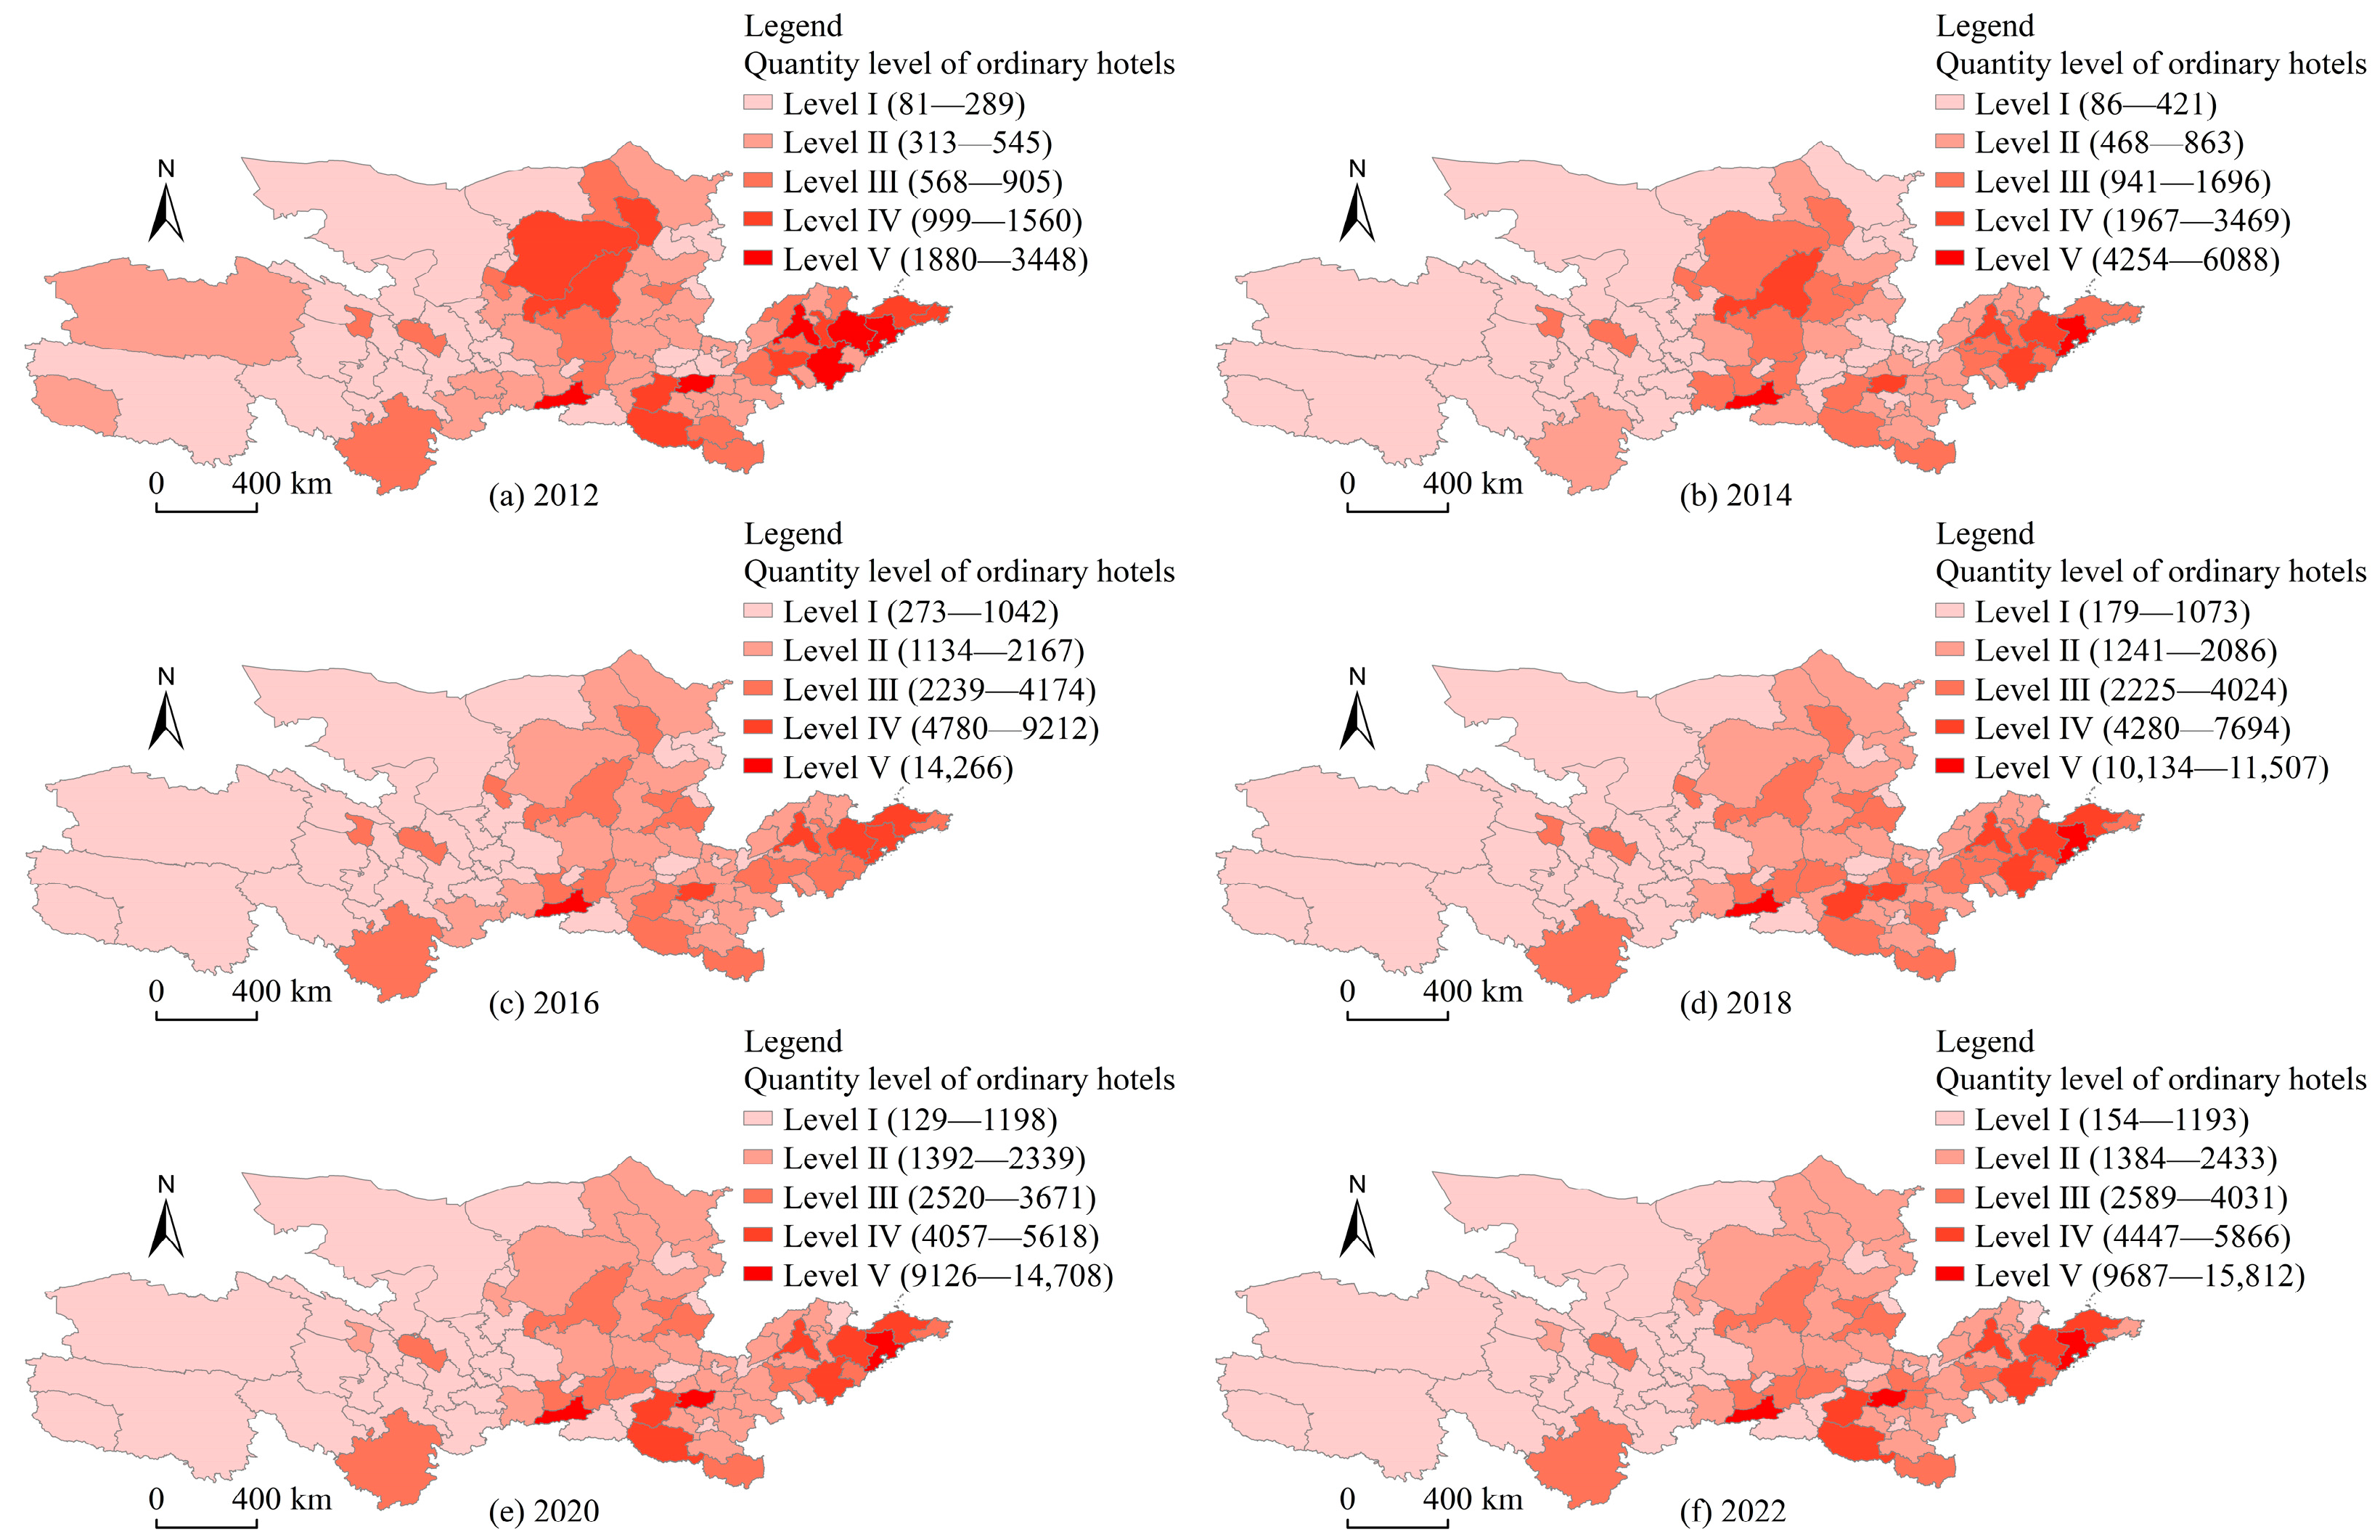
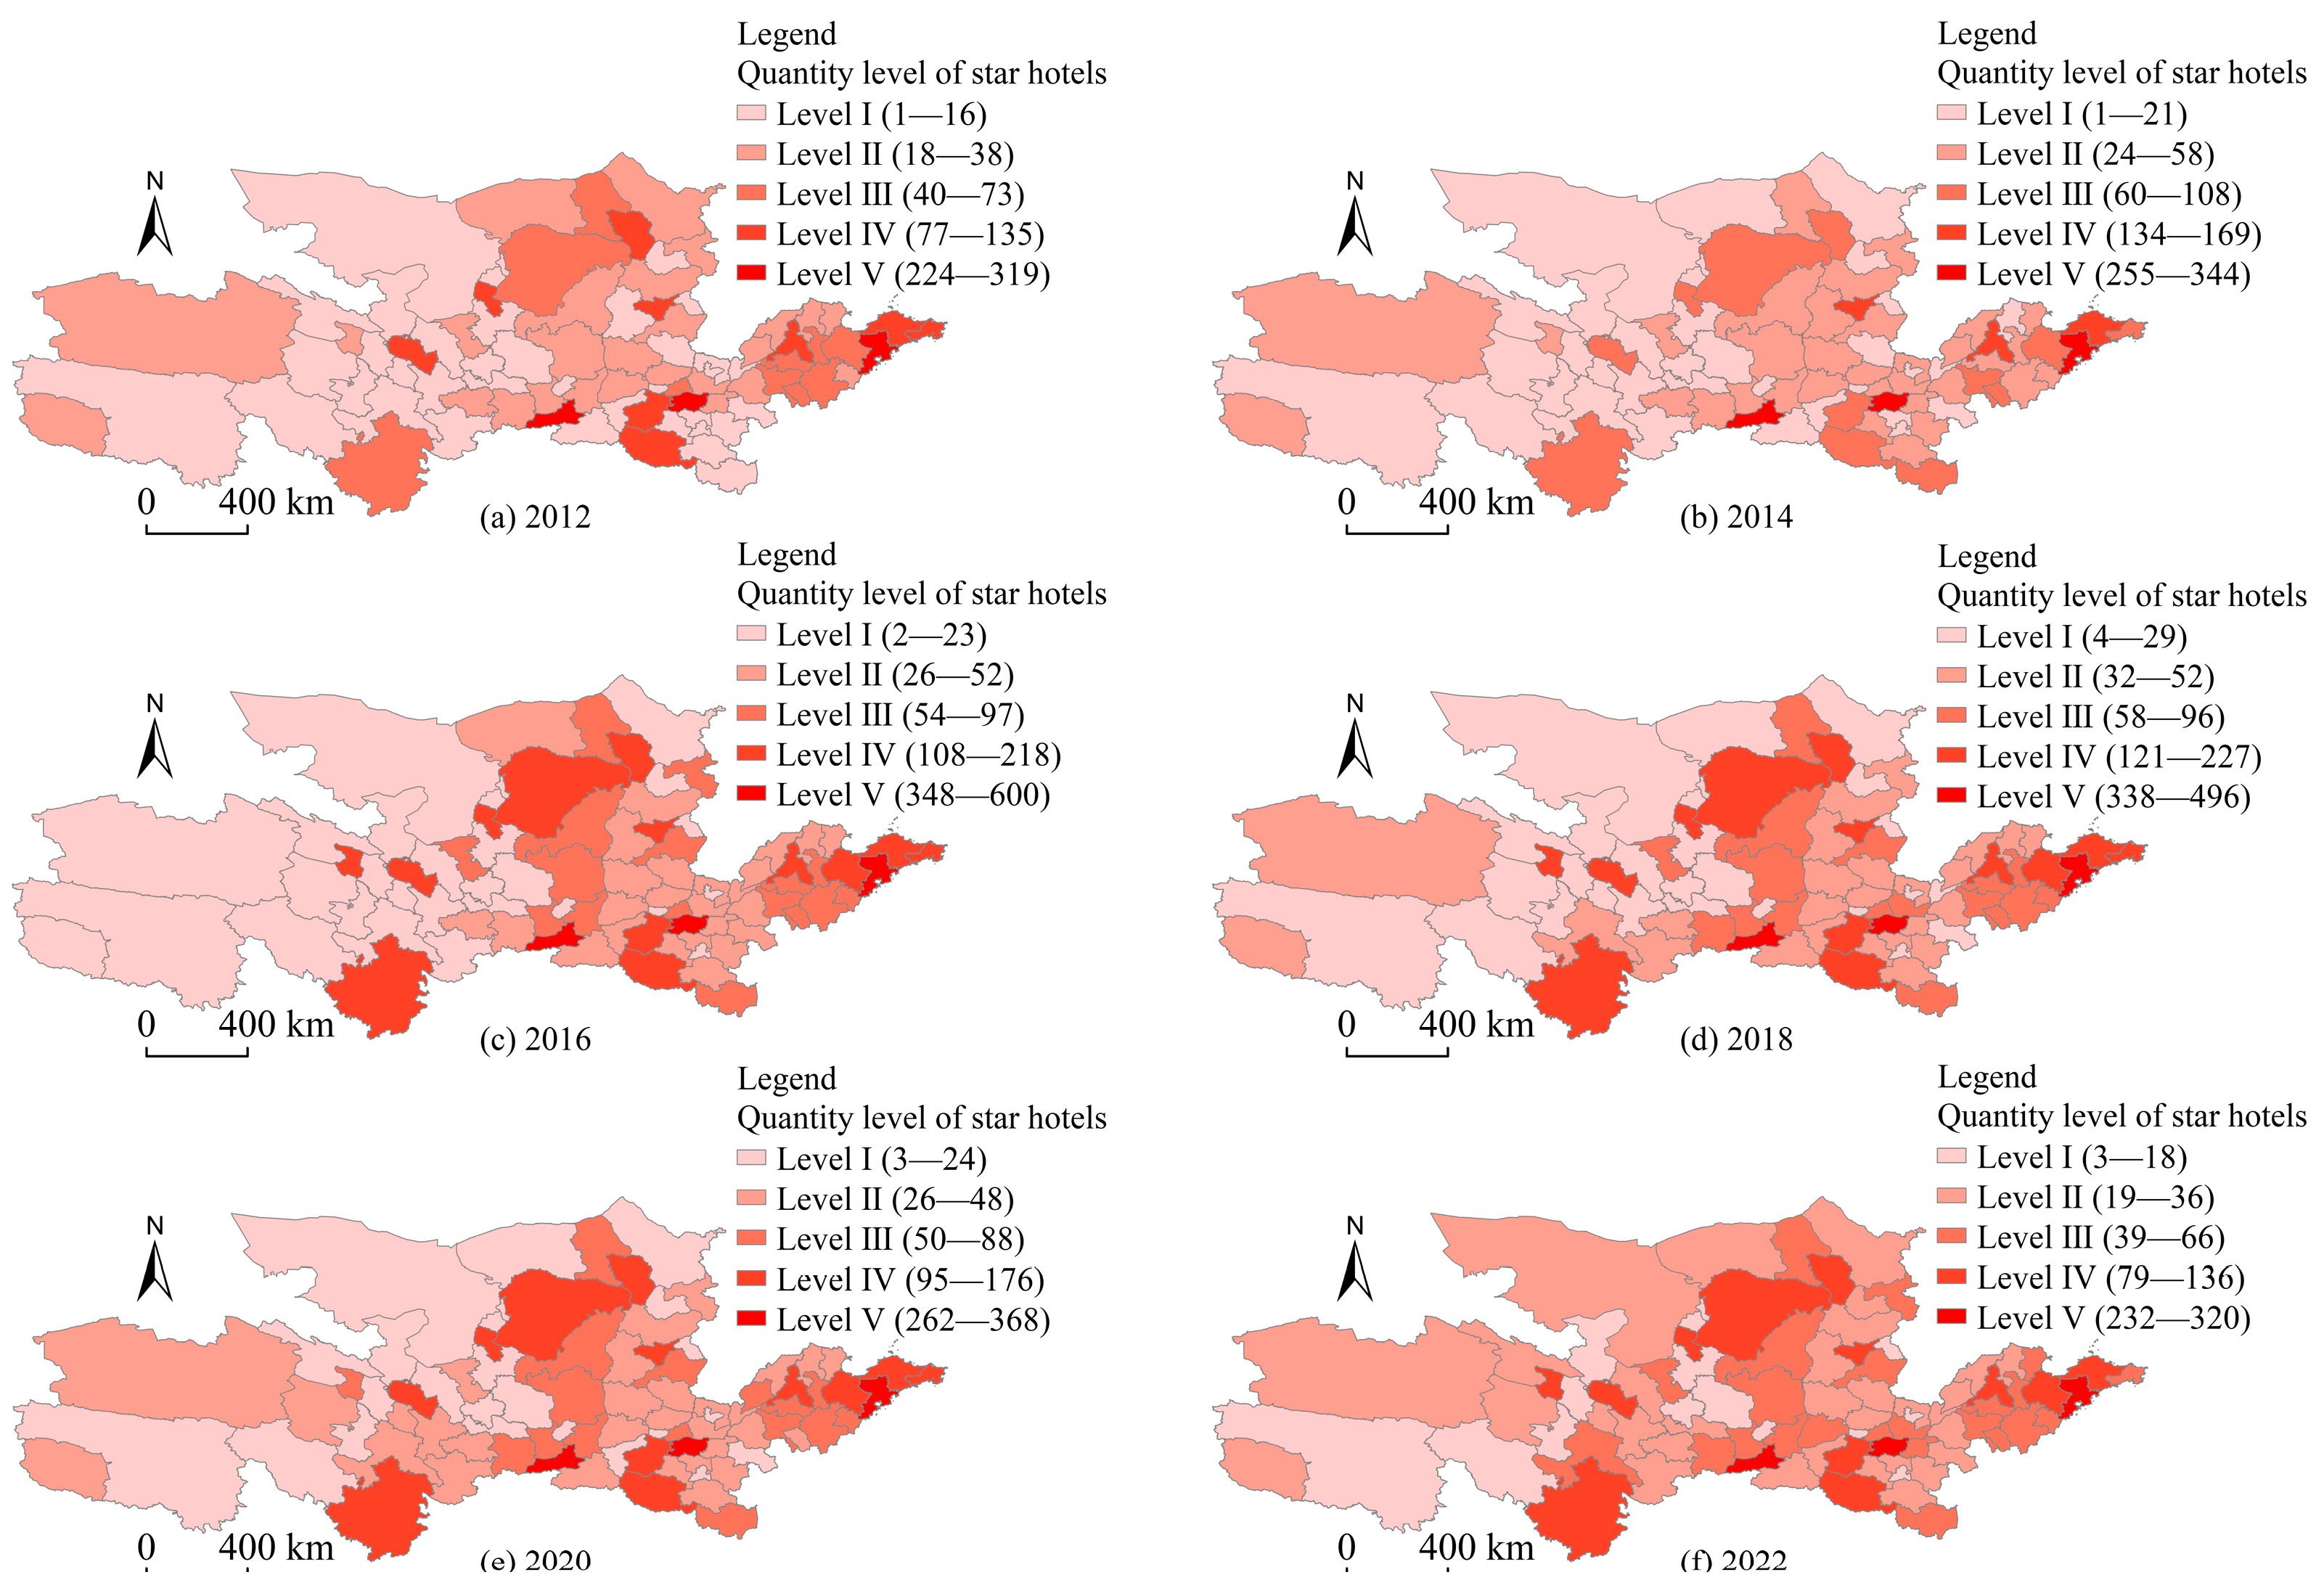
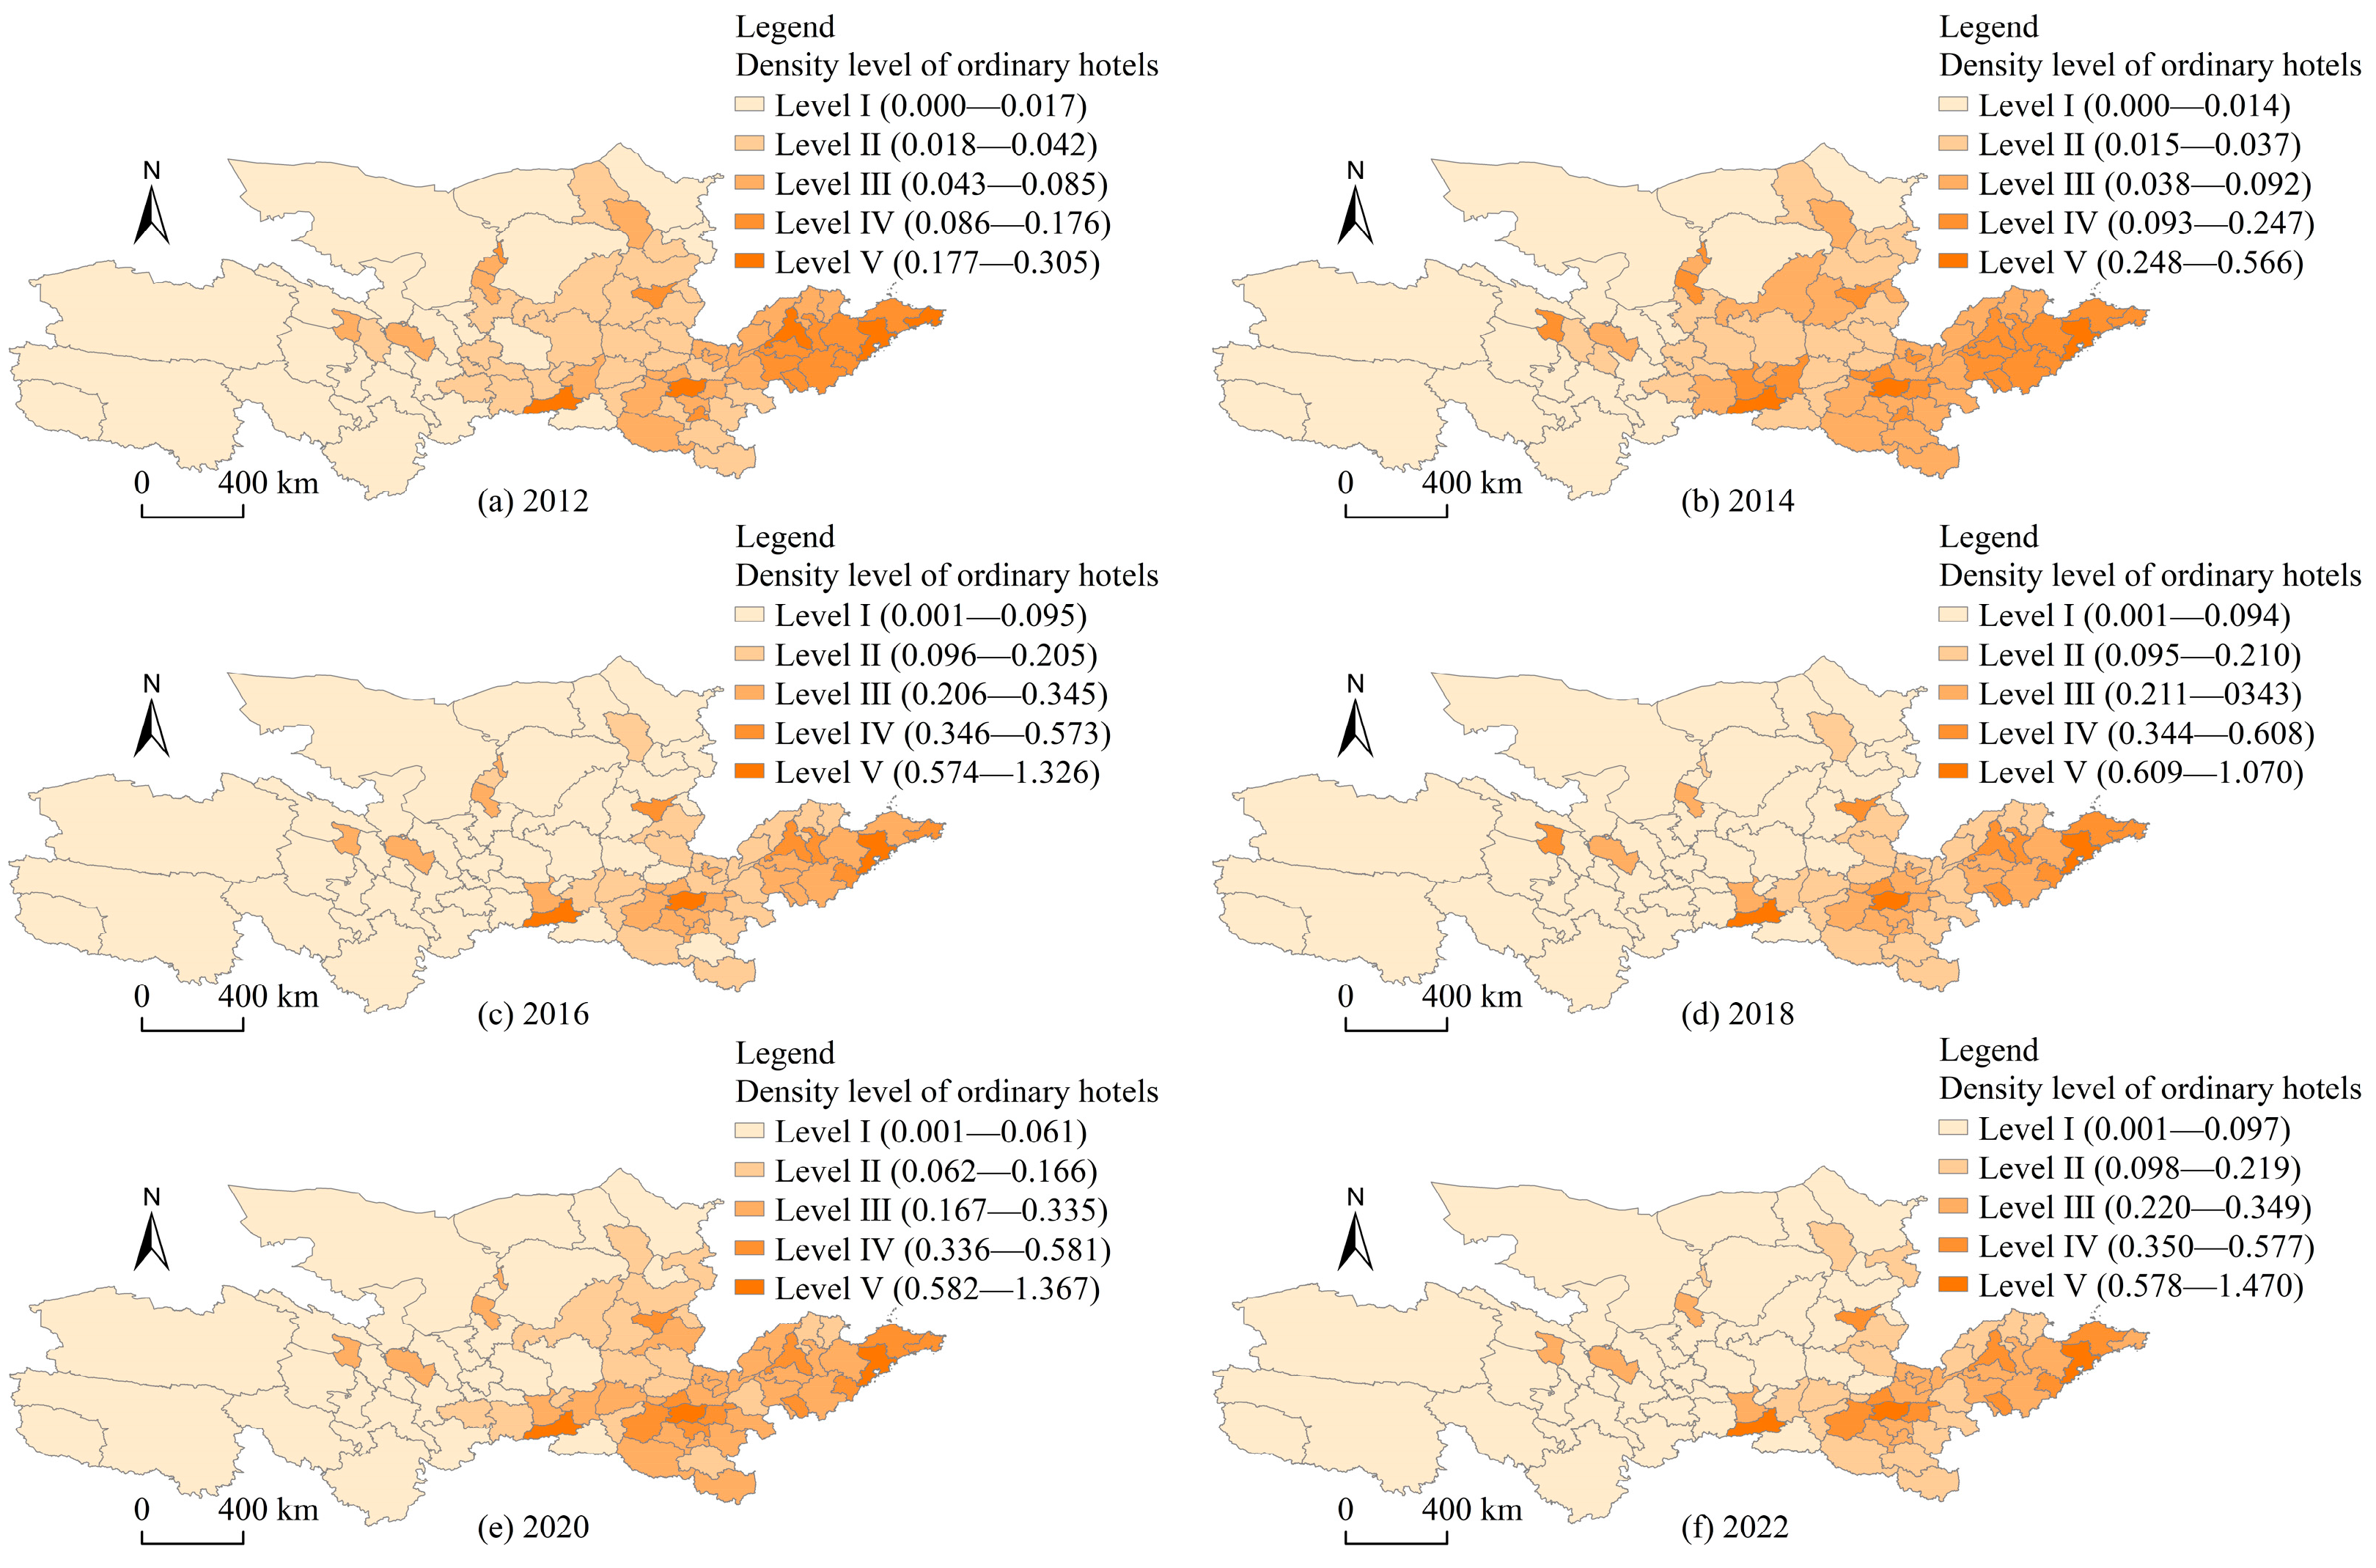
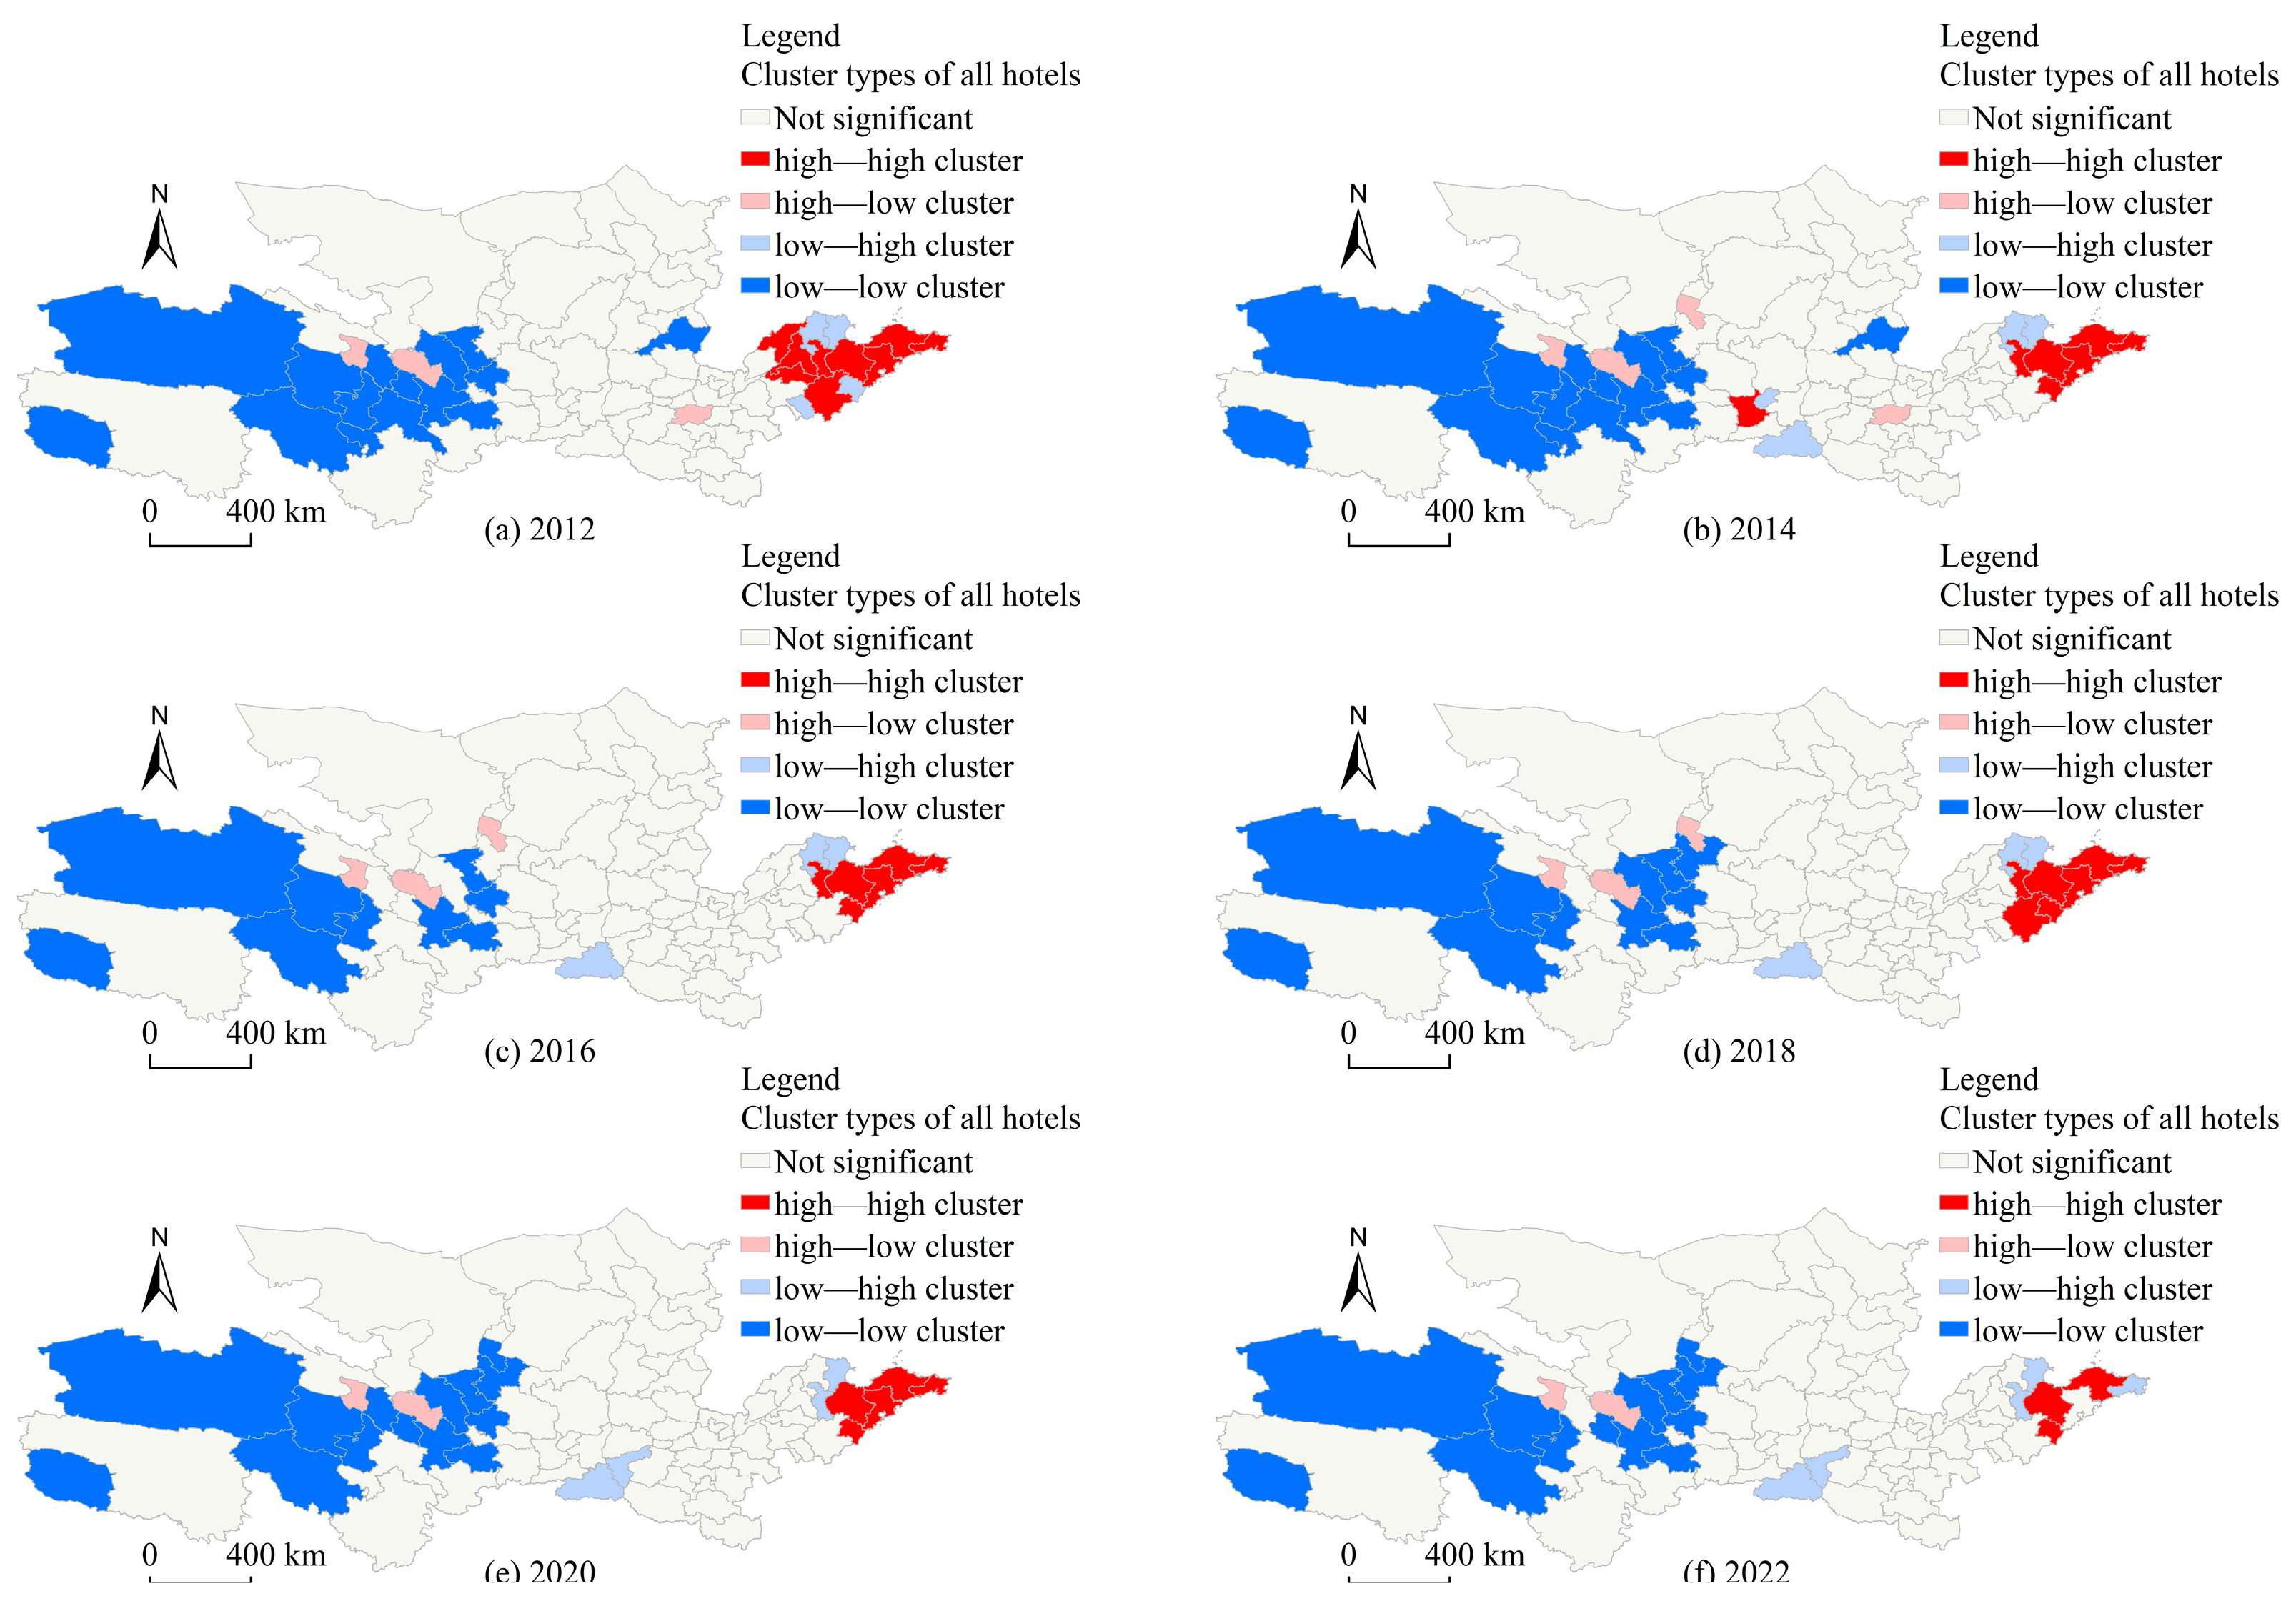
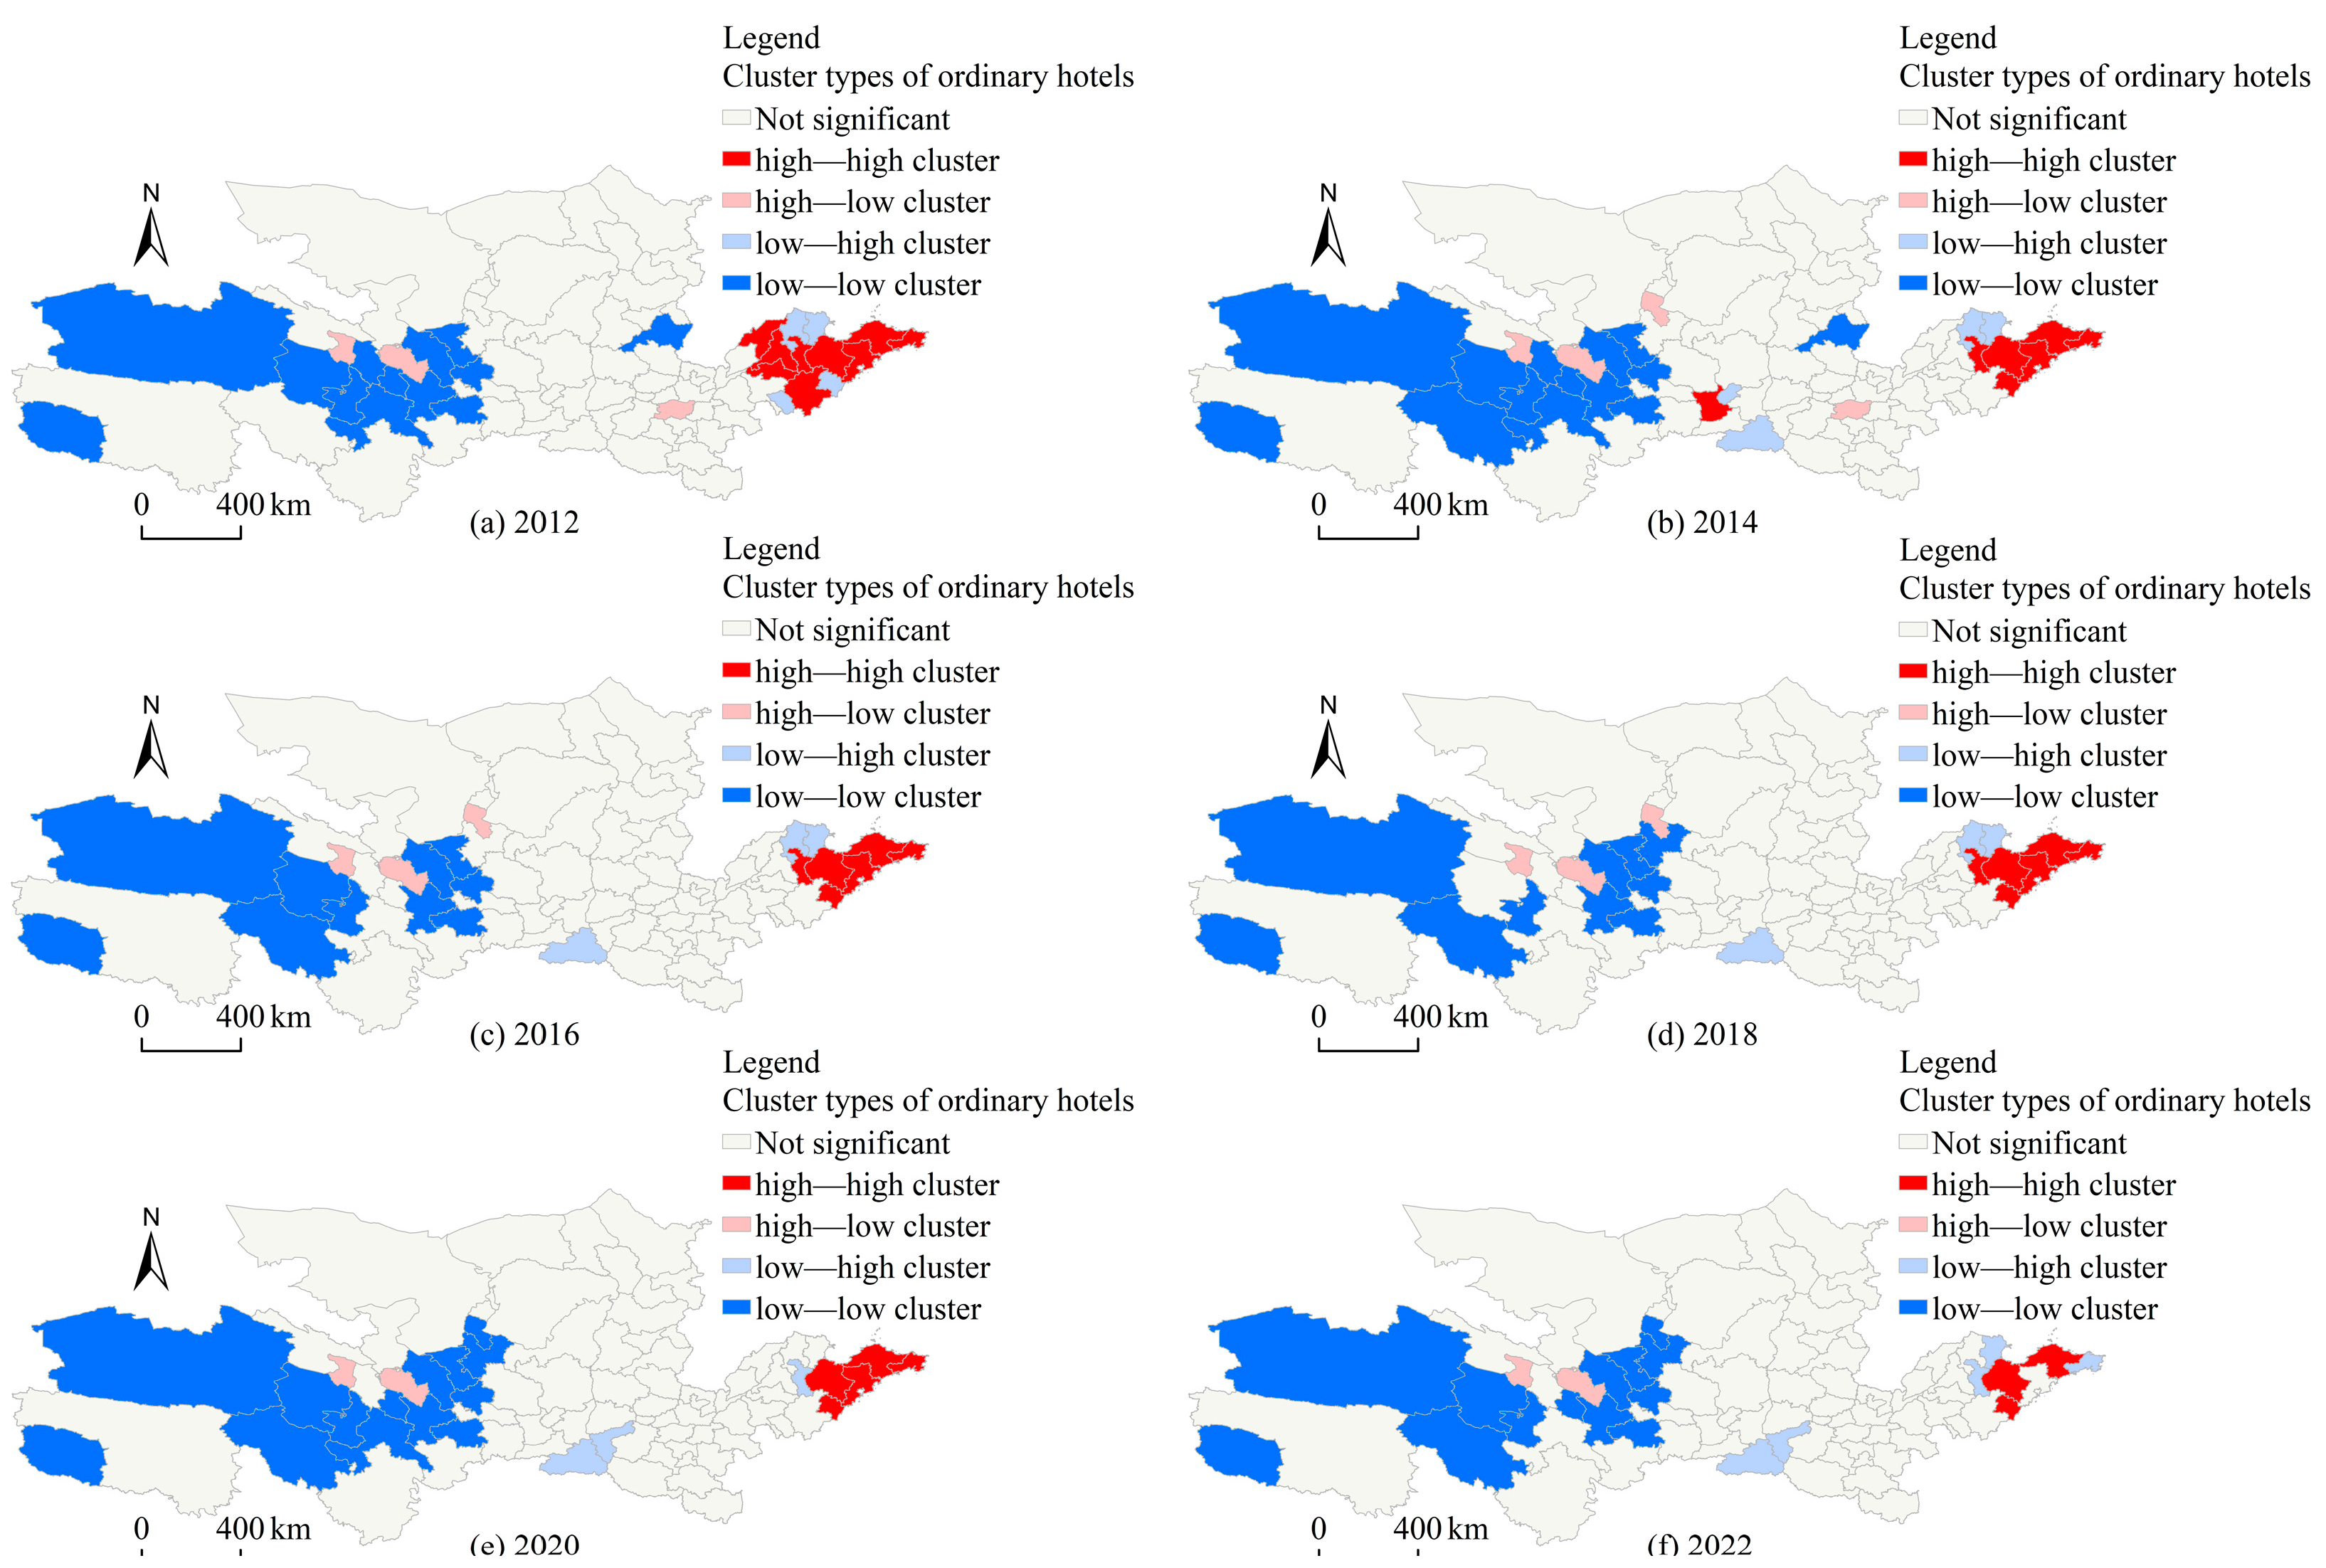
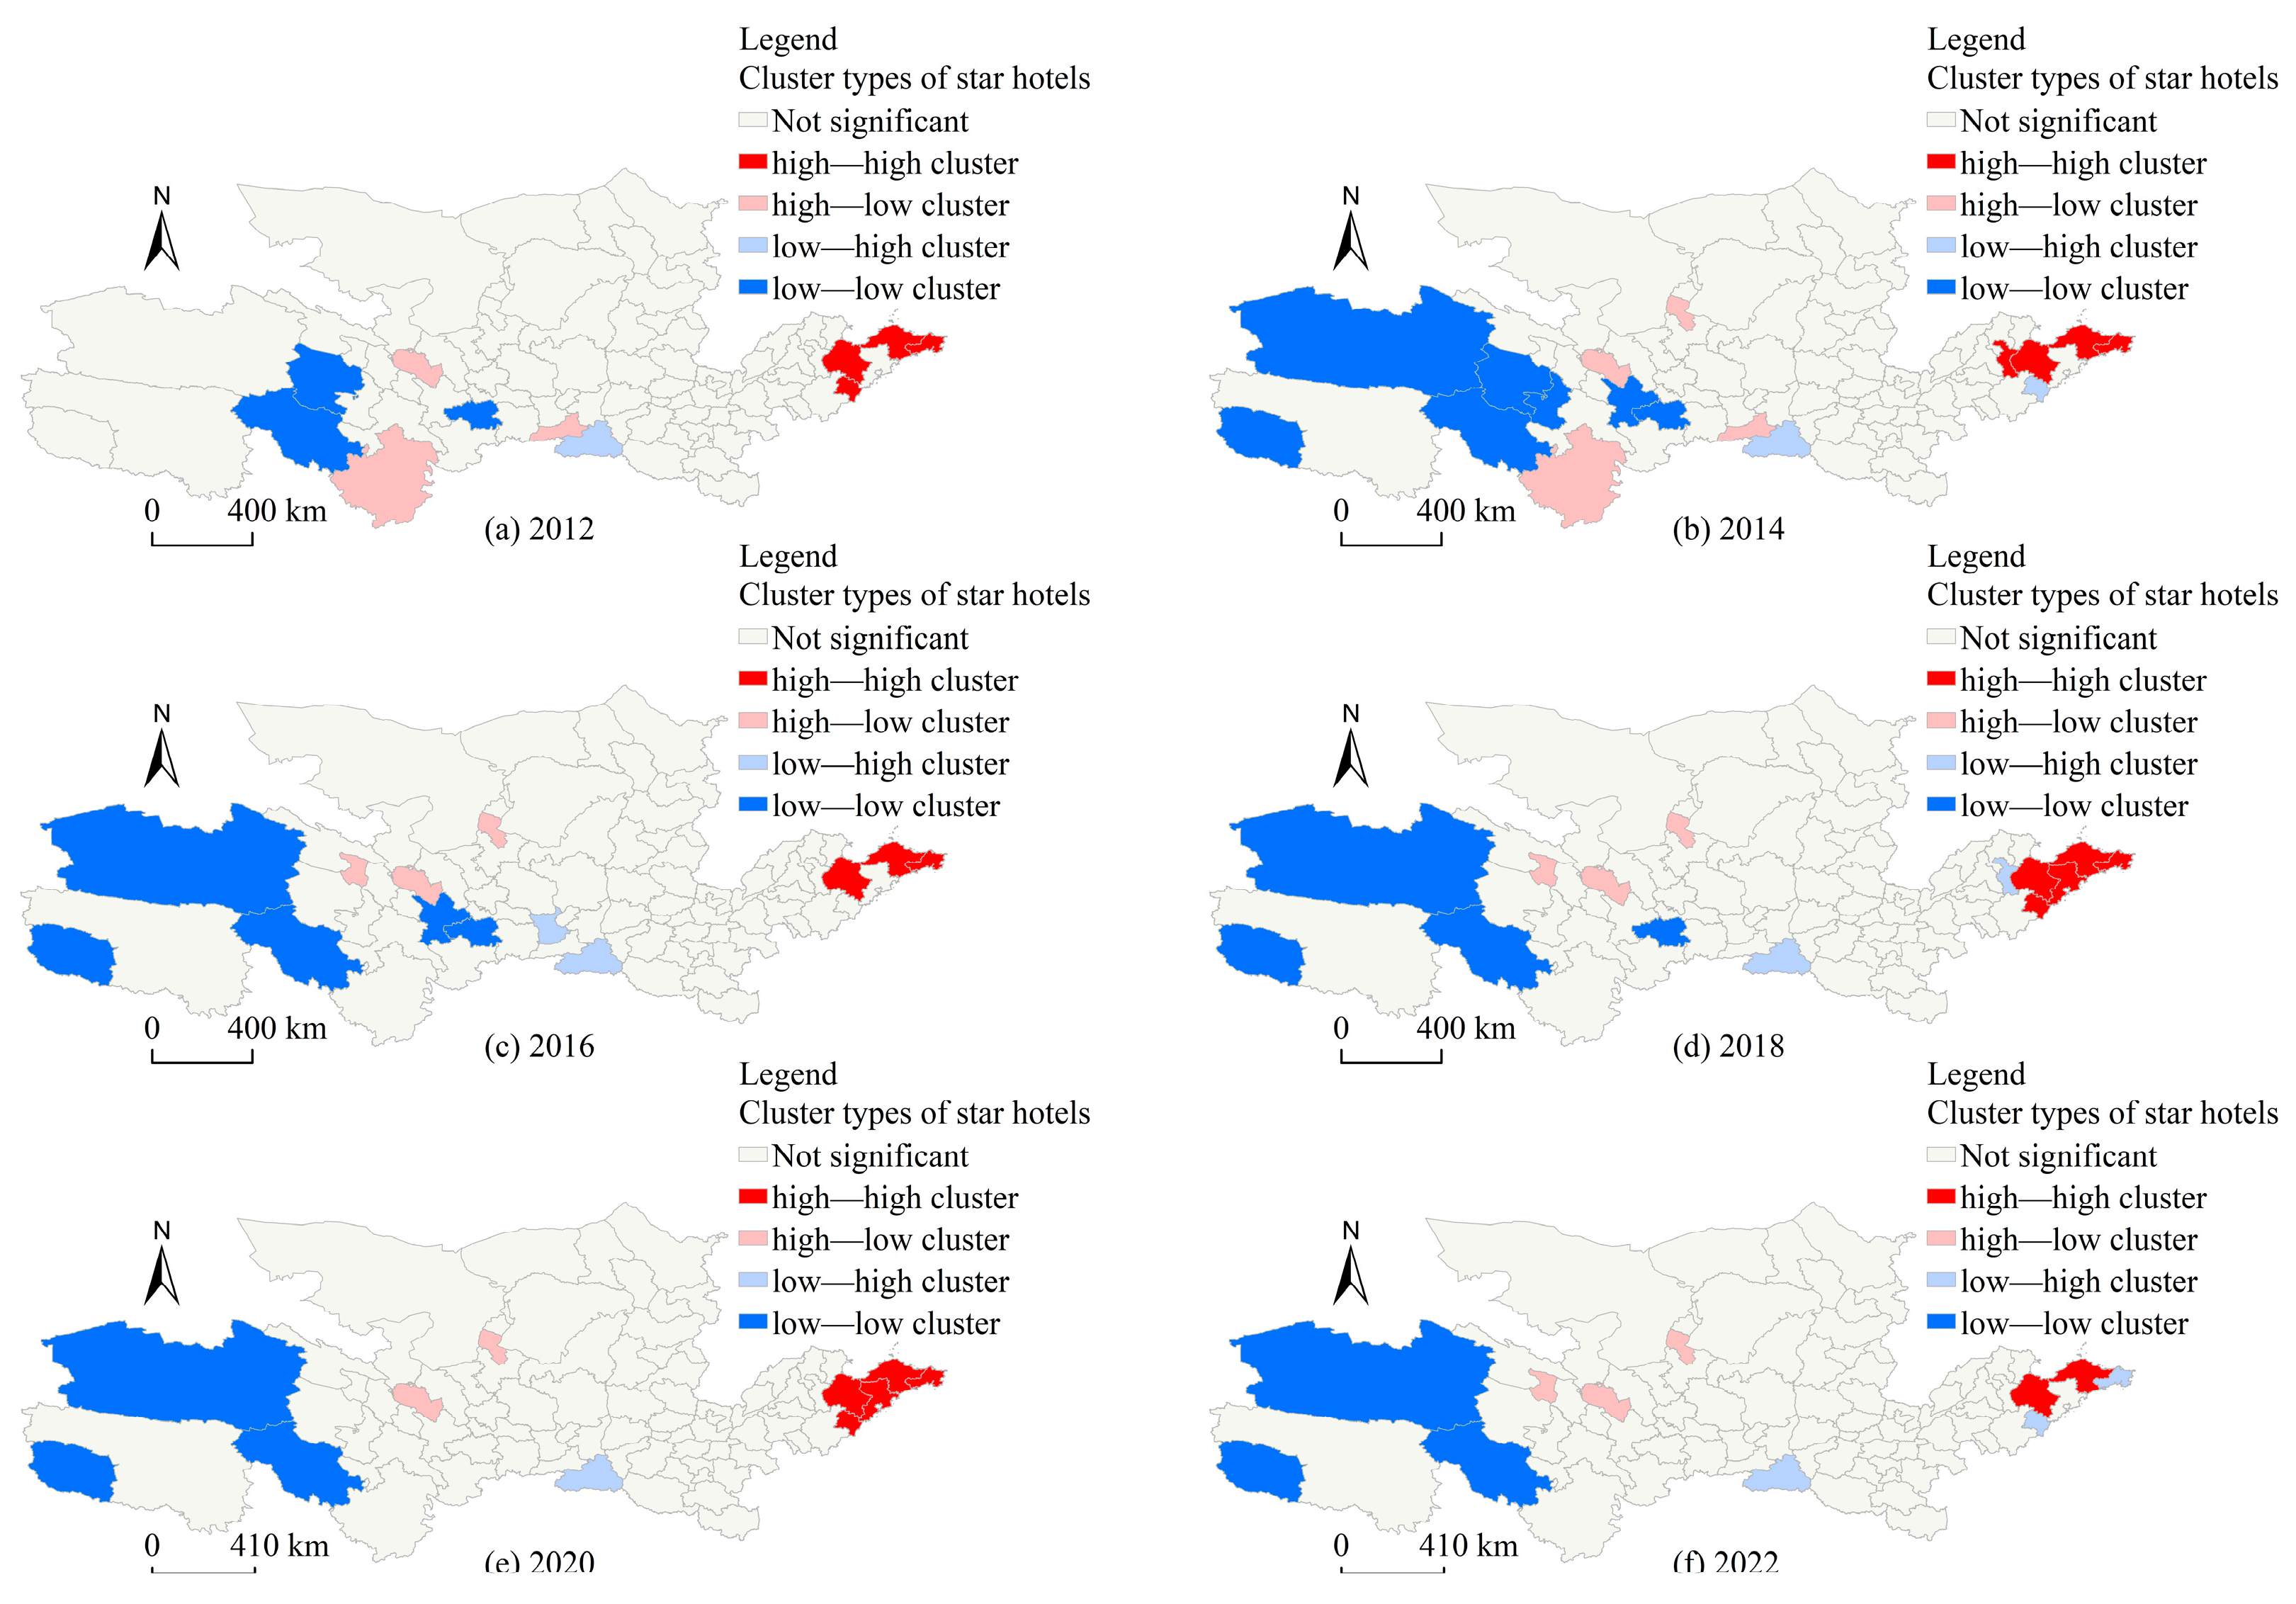
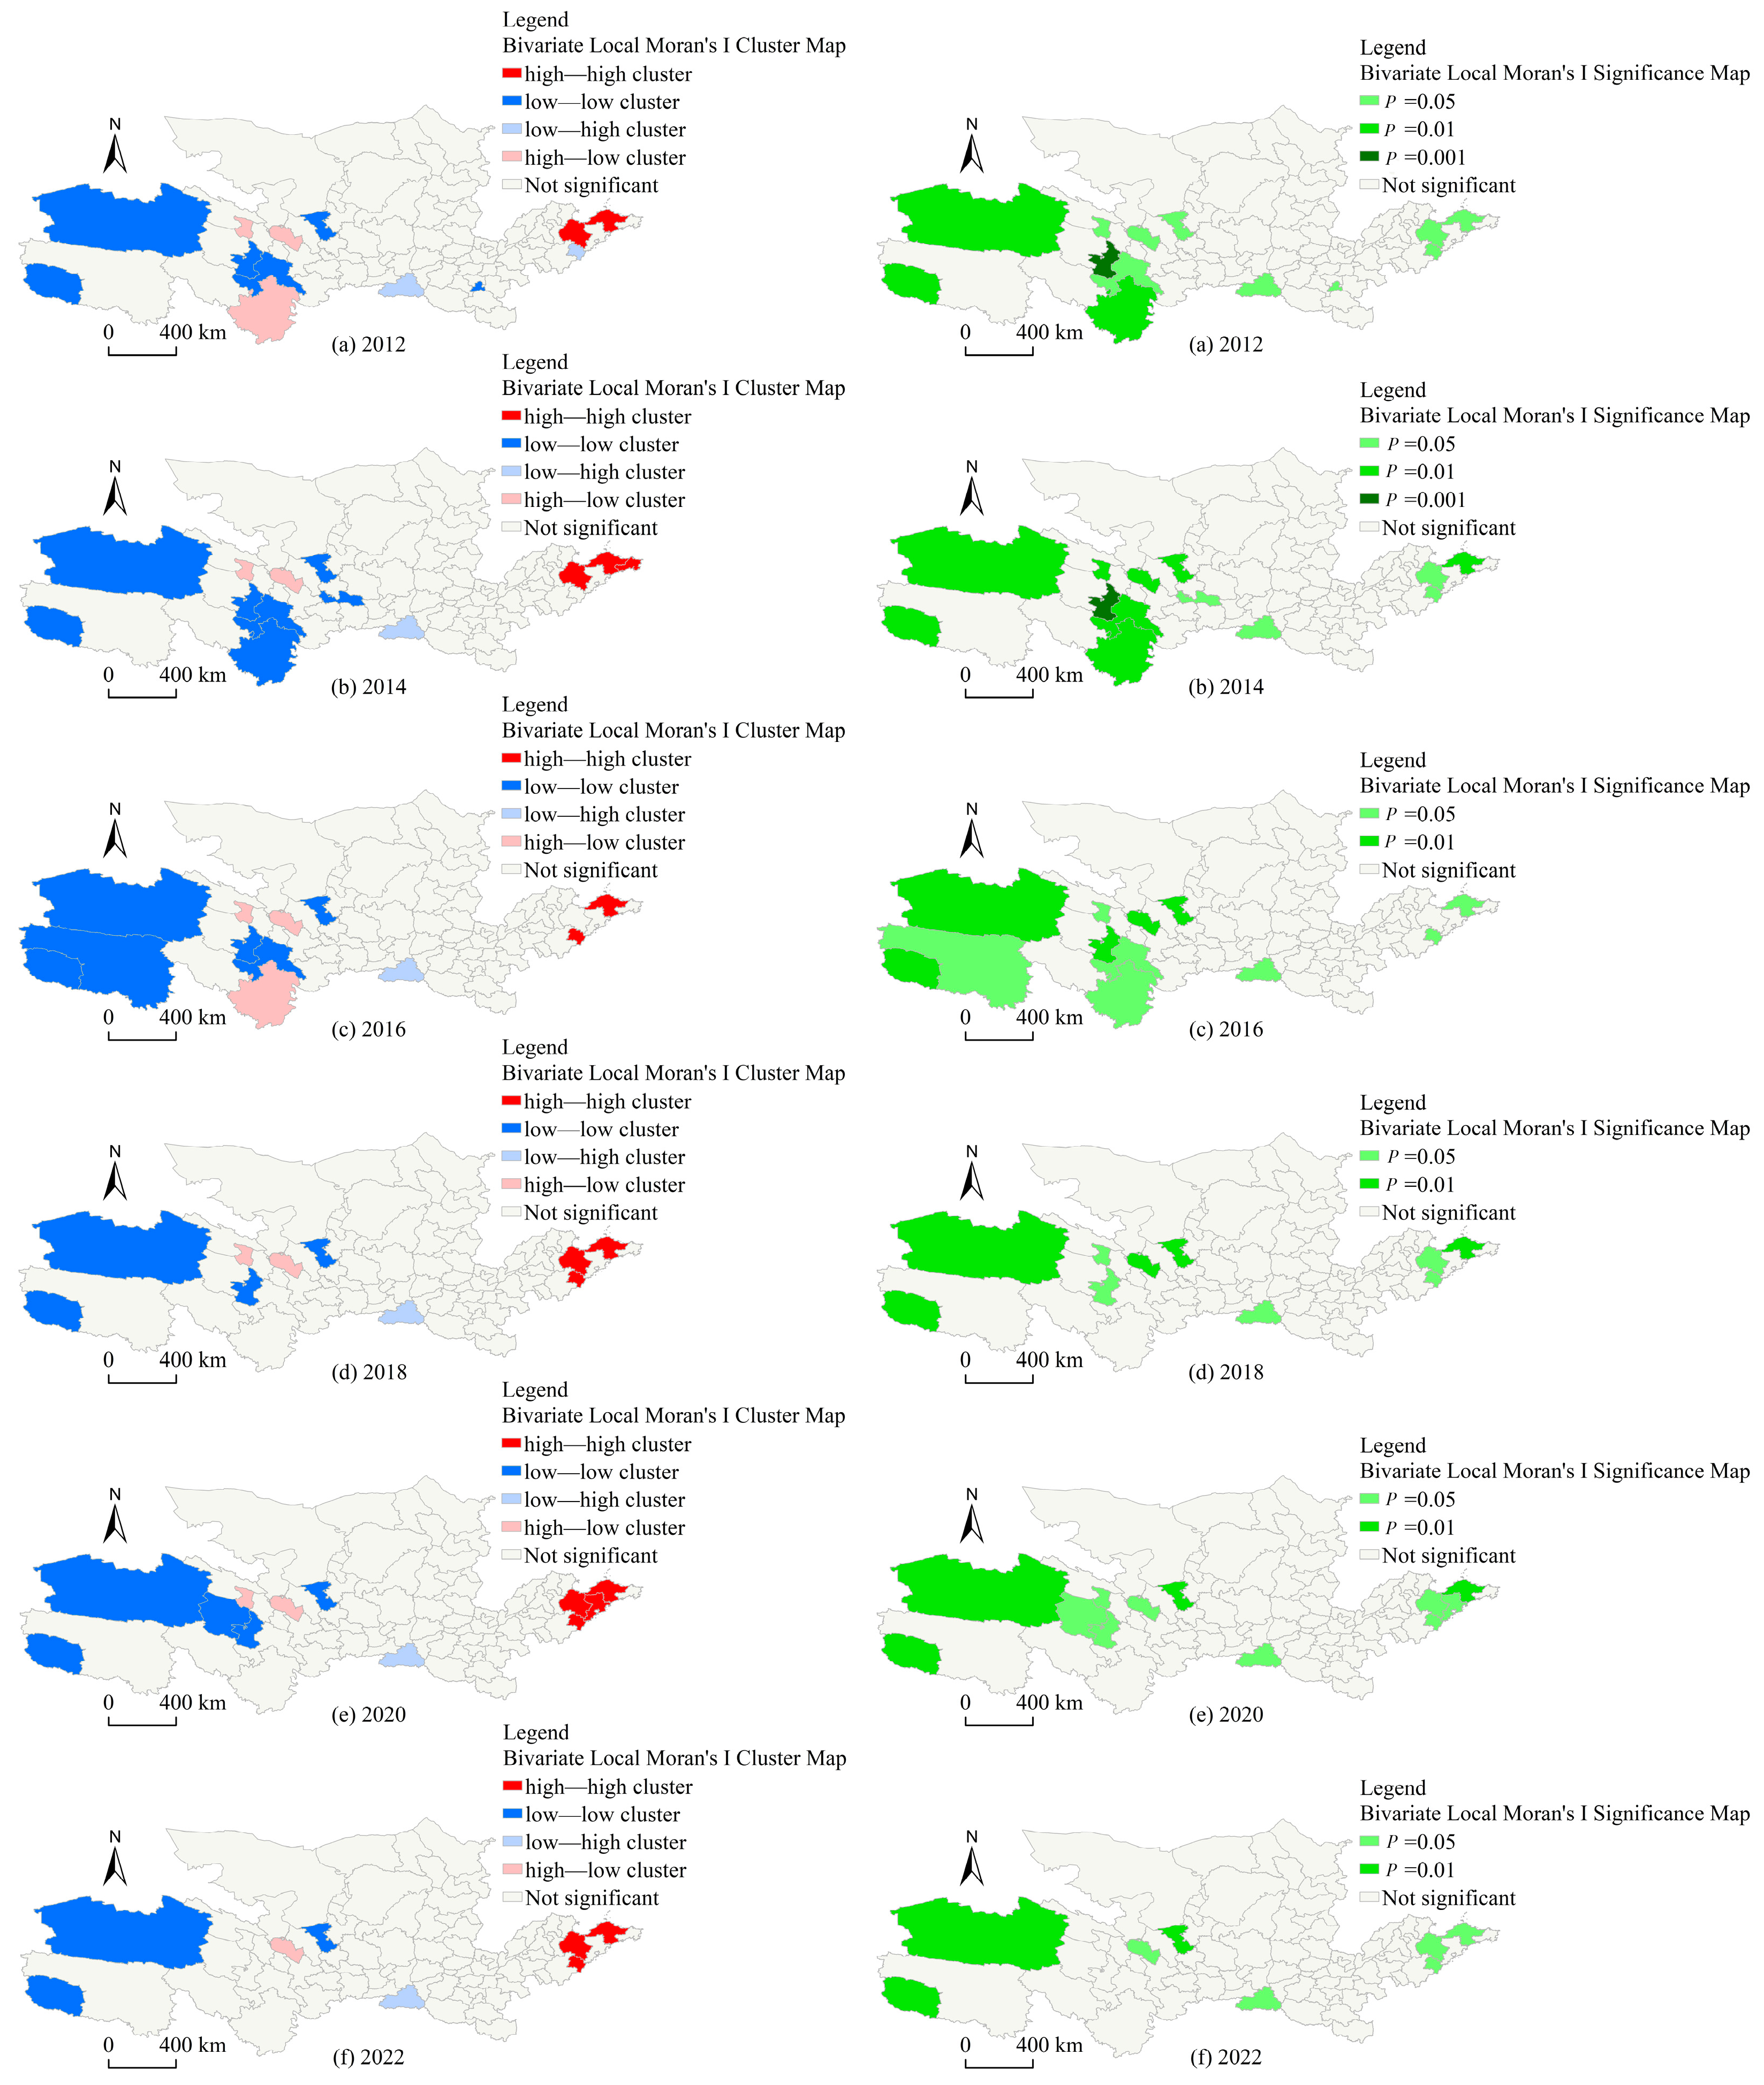
  • The scale of the hotel industry in the Yellow River Basin is undergoing continuous and dynamic changes, and there are significant differences in the comparison between the upstream, midstream, and downstream areas. From 2012 to 2022, the scale of the hotel industry in various cities in the Yellow River Basin expanded year by year, and the total number achieved rapid growth since 2016. The number and scale of hotels in prefecture-level cities were characterized by “more in the southeast and less in the northwest” in spatial distribution. The lower reaches of the Yellow River basin were mainly high value clusters of various types of hotels, the upper reach had mainly low clustering, and the middle reach were gradually becoming the clusters of central value regions. The uneven gap was gradually widening in the process of space-time evolution. However, there were differences in the number of different types of hotels. The space-time evolution characteristics of ordinary hotels were similar to those of the hotel industry, but the number of star hotels showed a trend of first increasing and then decreasing, and the numerical gap between prefecture-level cities is narrowing.
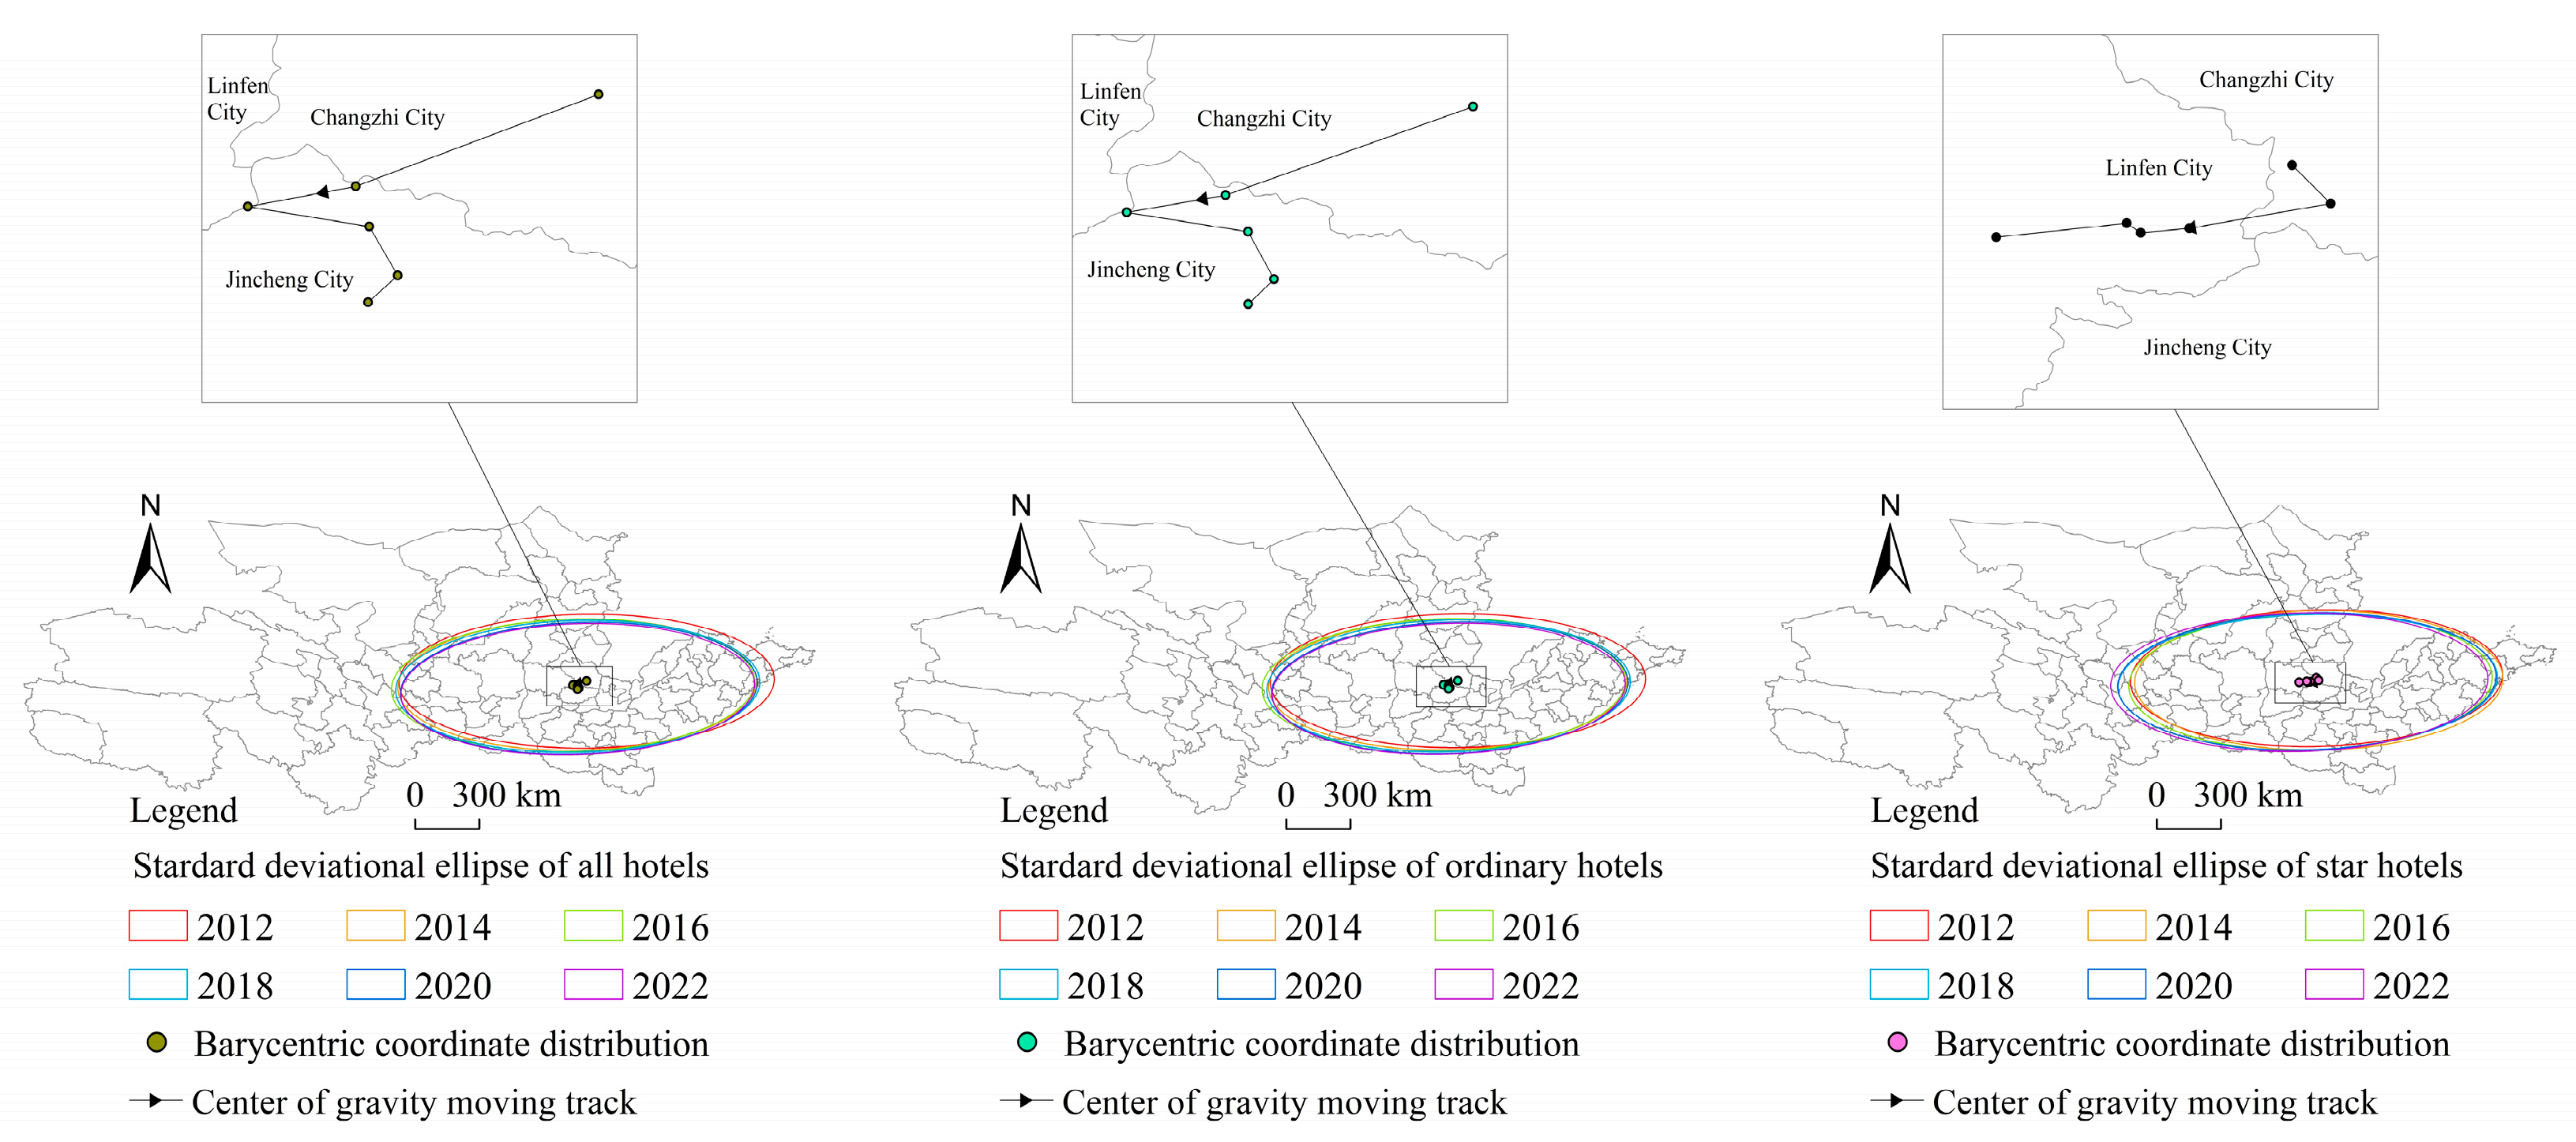
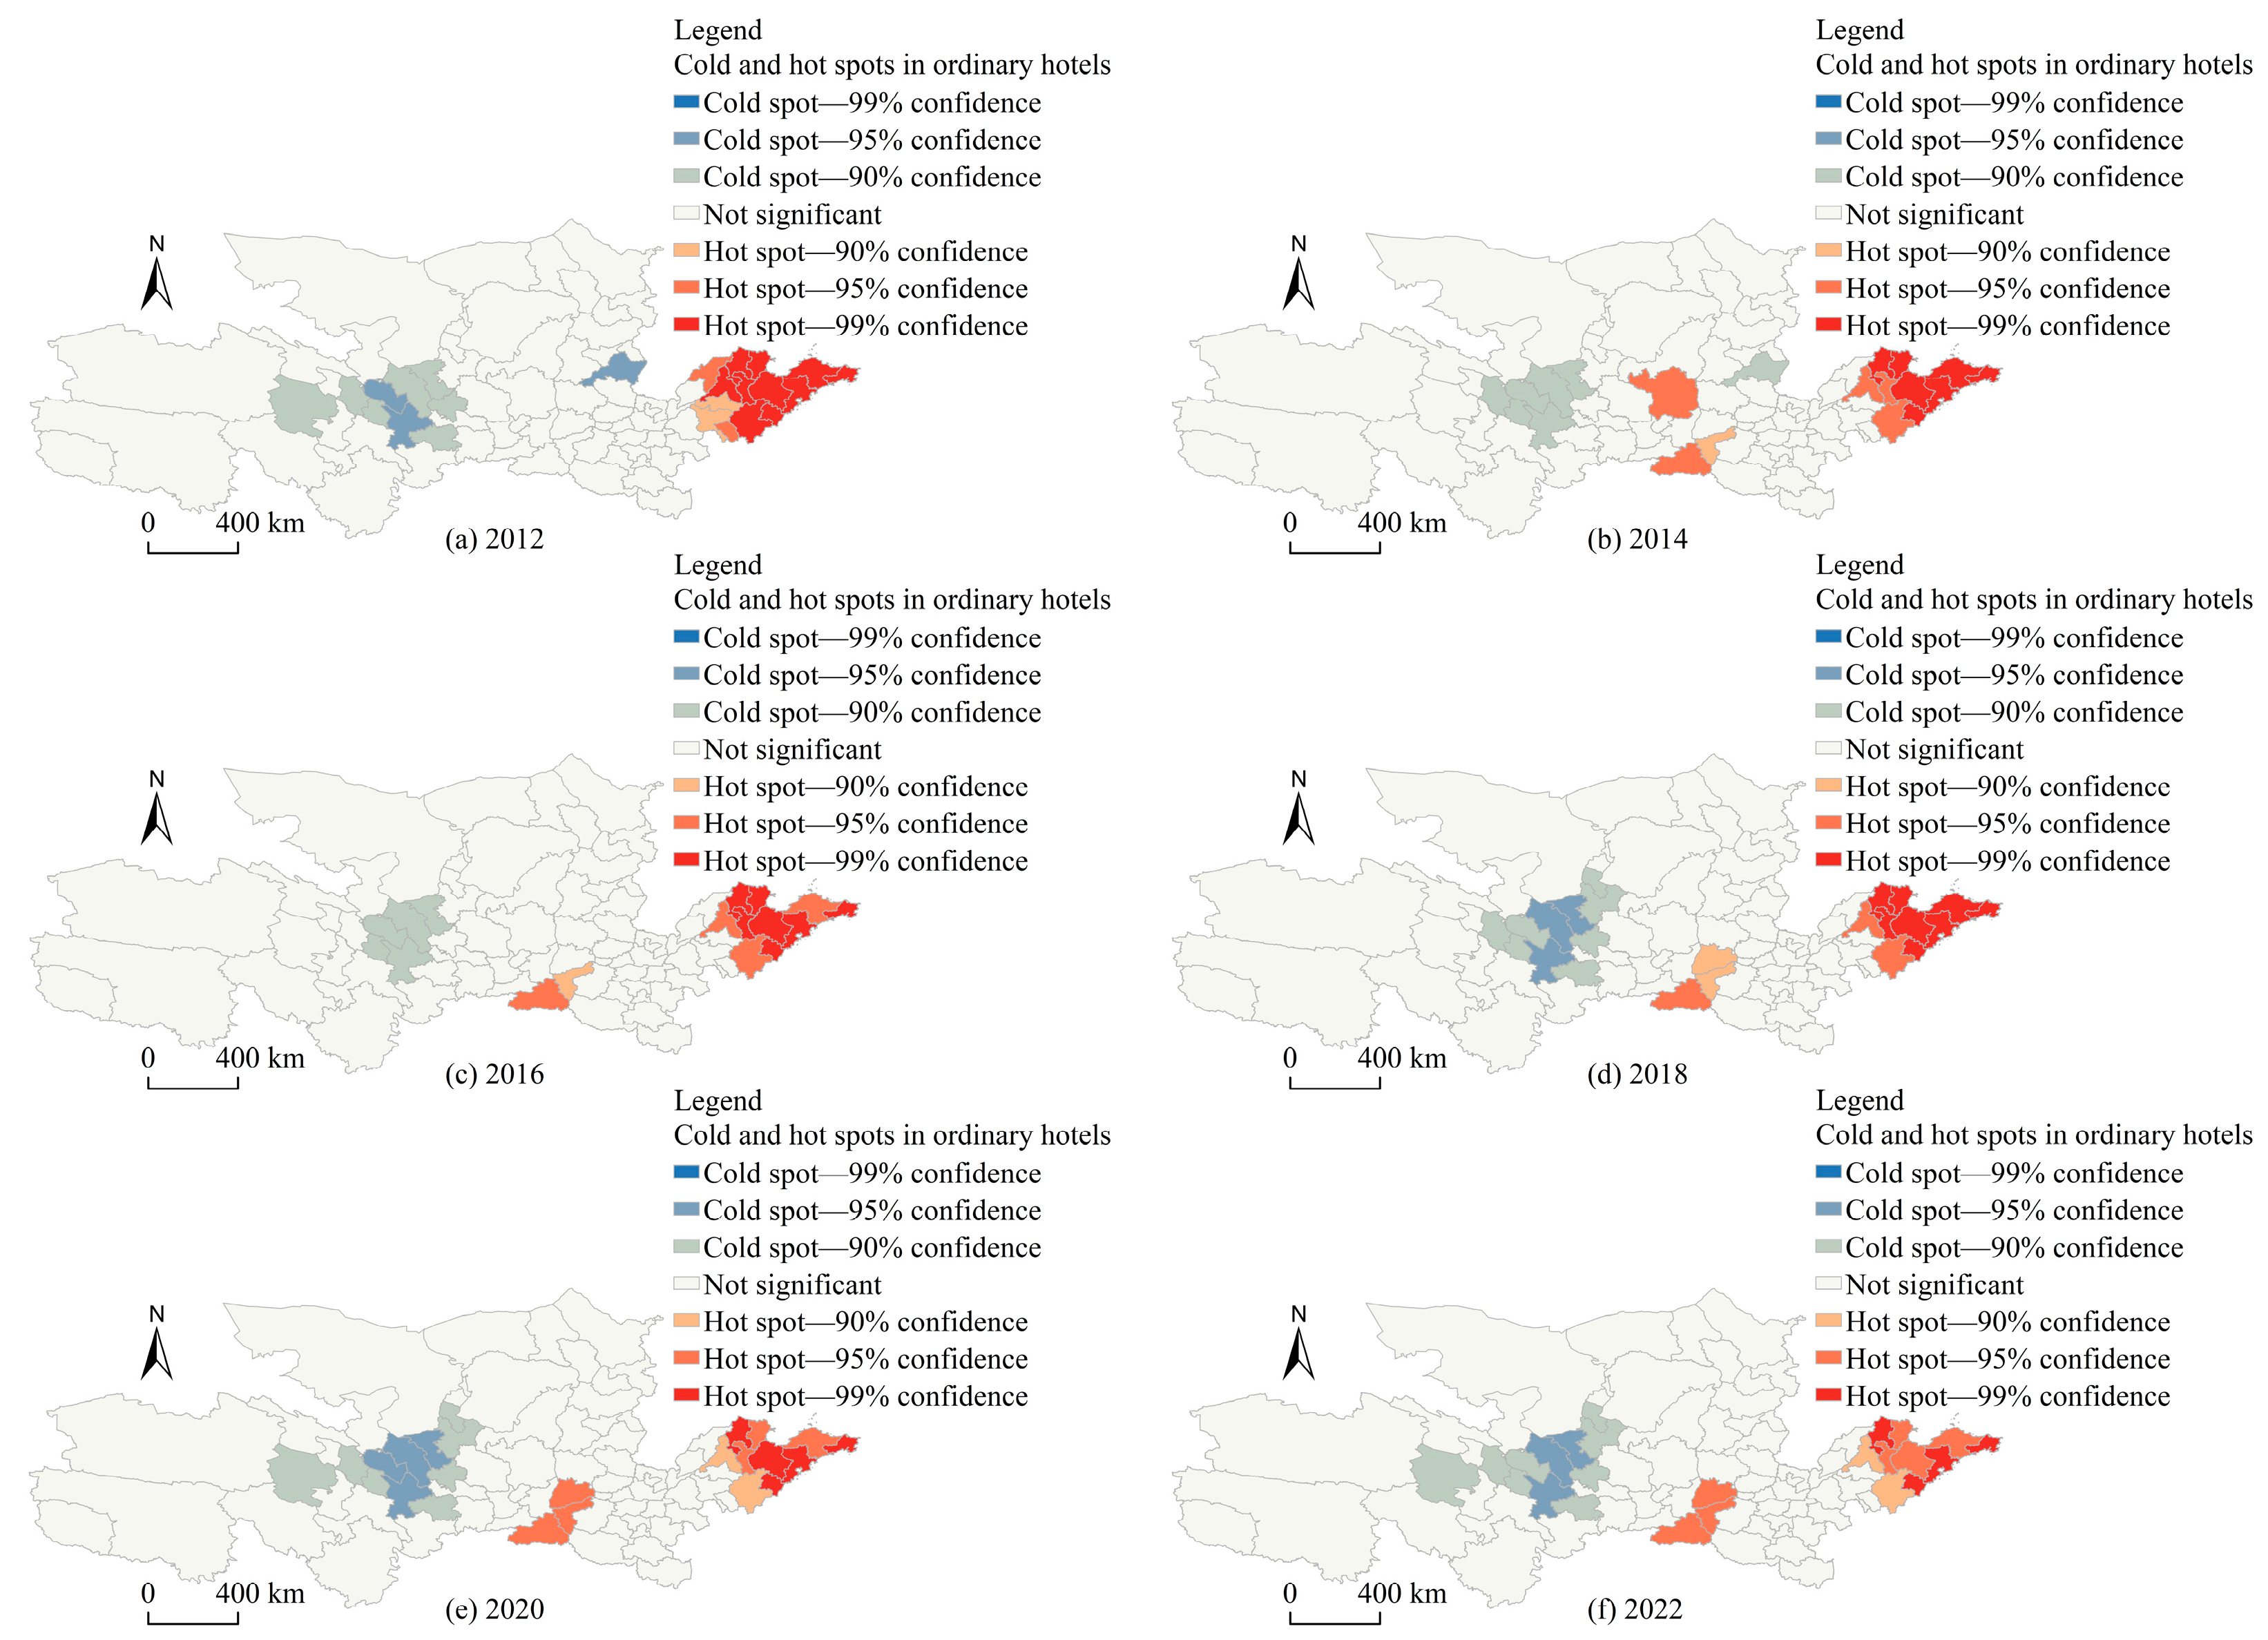
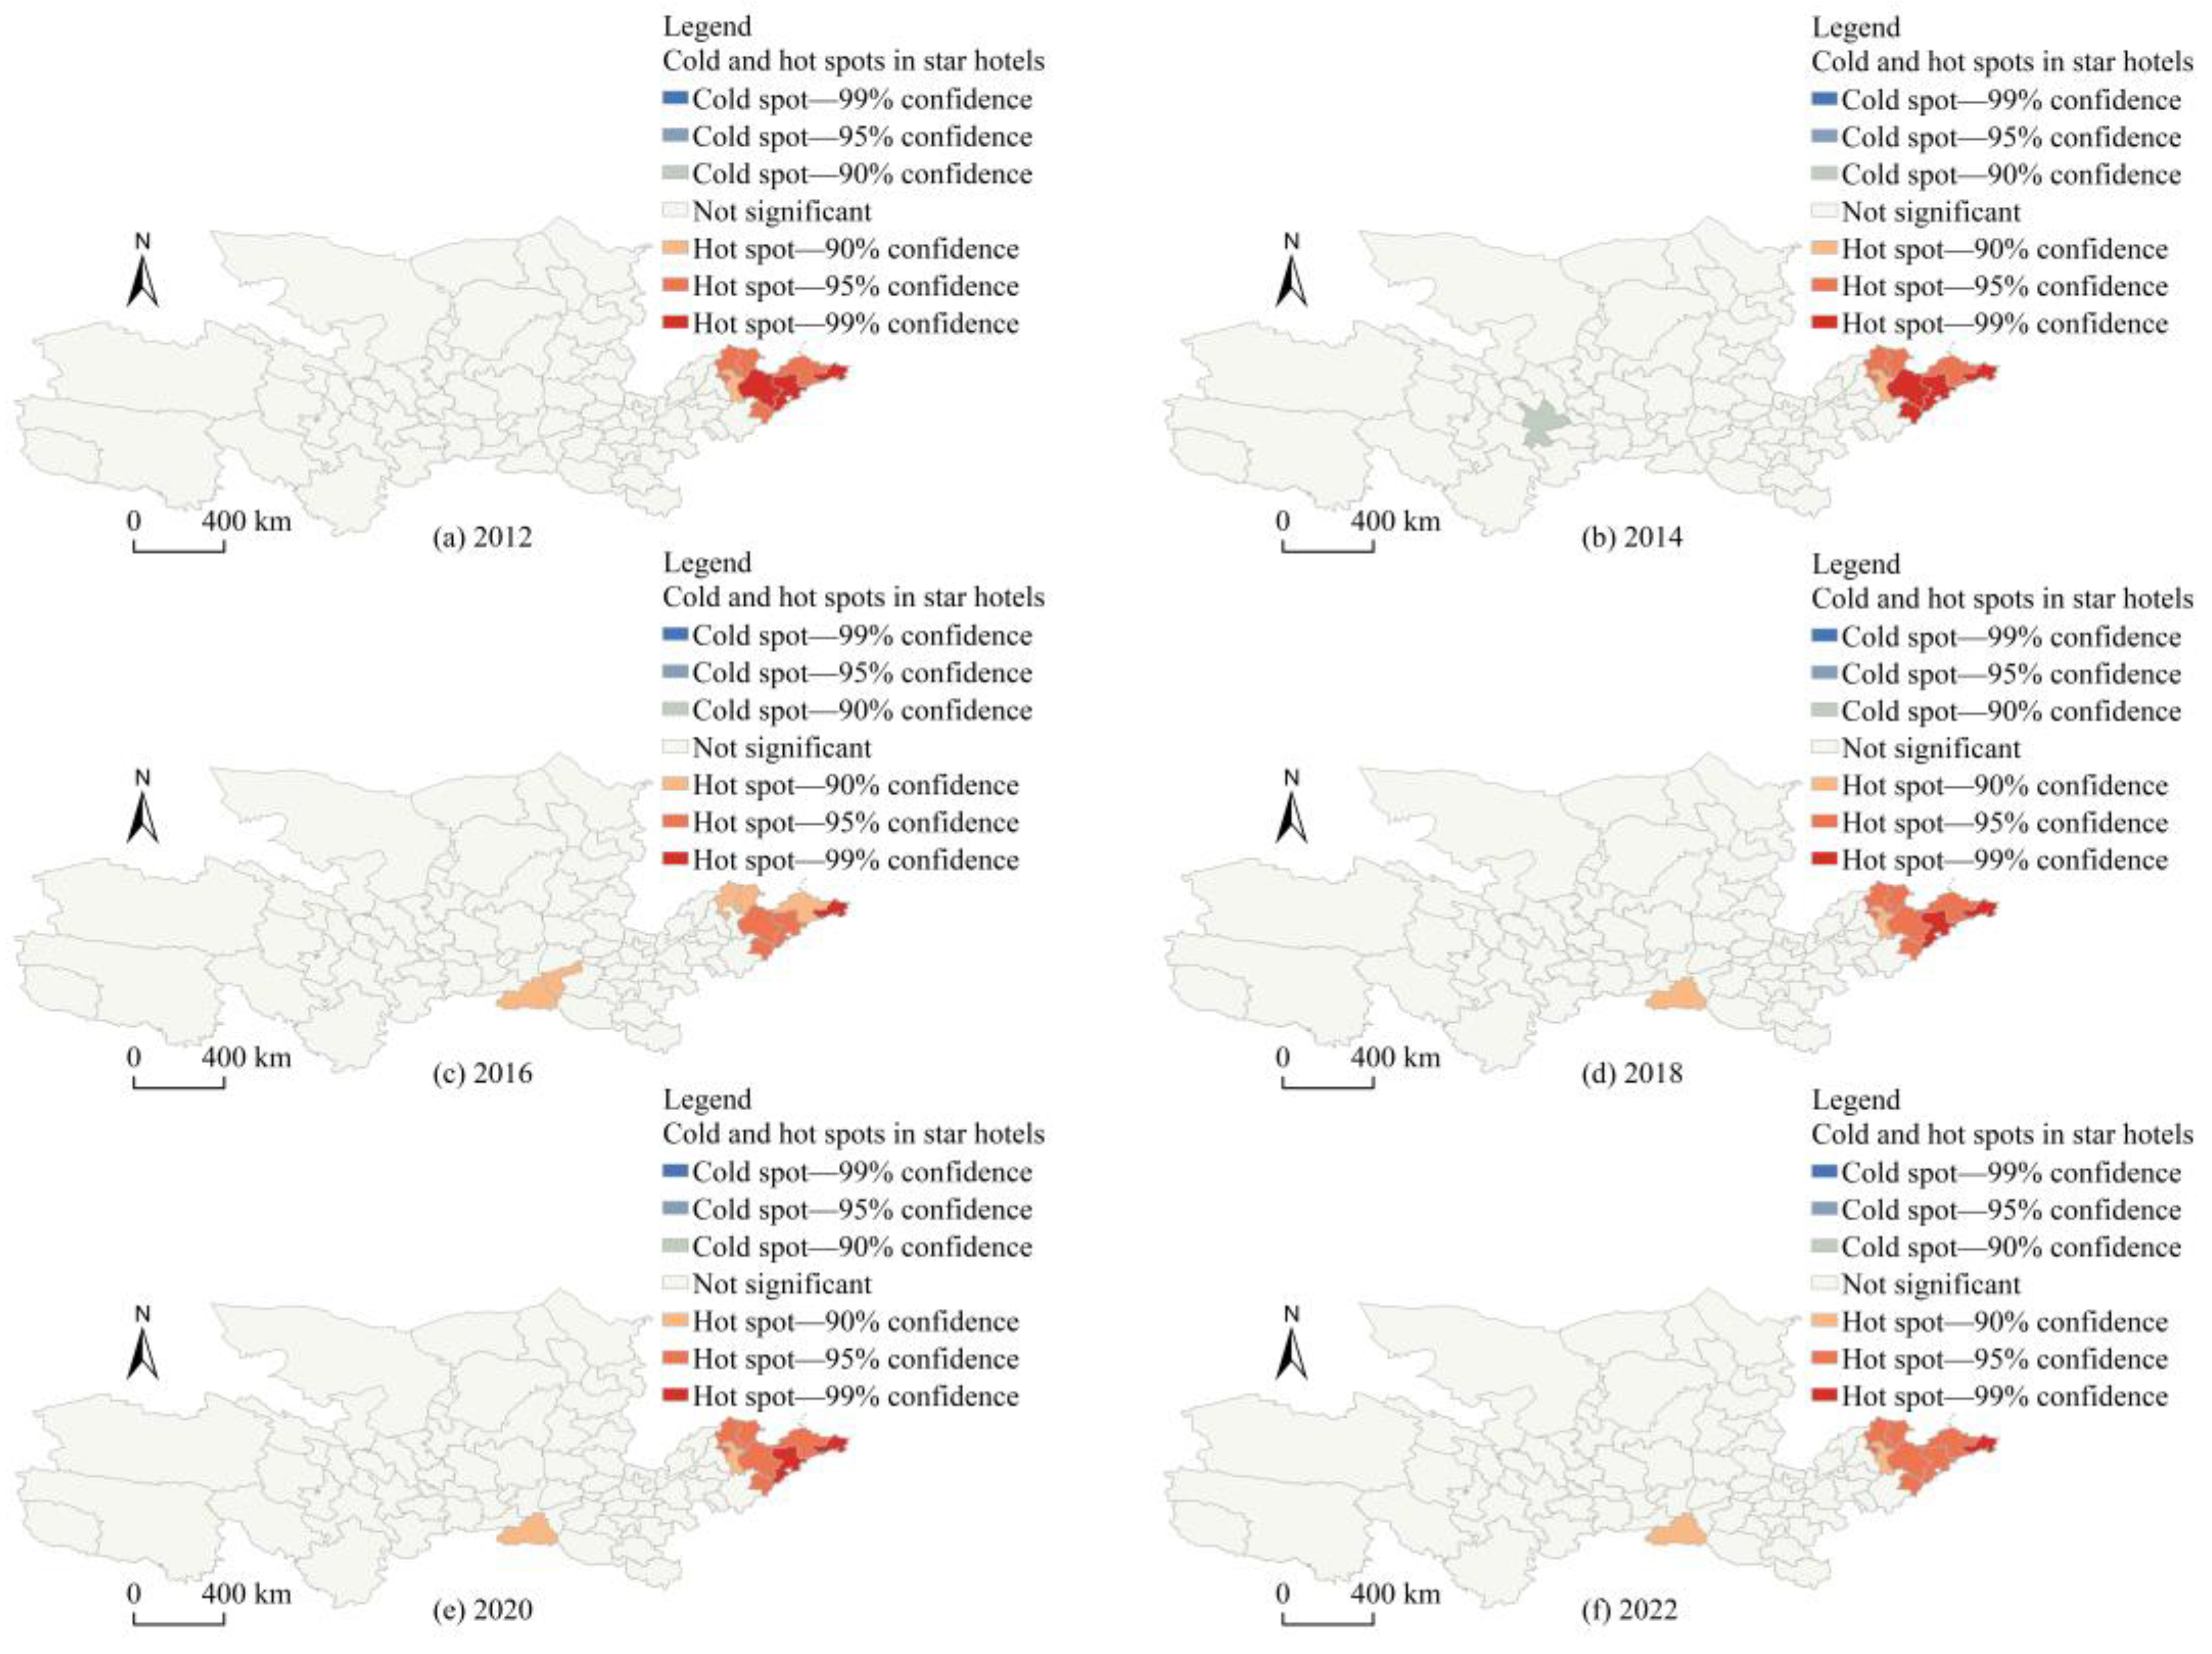
  • The agglomeration degree of hotel industry and ordinary hotels among prefecture-level cities in the Yellow River Basin decreased year by year, and presented a random distribution in 2022, while the spatial agglomeration degree of star hotels always was a weak random distribution. During the dynamic development of the hotel industry, there were continuous hot spots and cold spots. The hot spots were mainly distributed in some prefecture-level cities with good social and economic development in Shandong Province, Henan Province and Sichuan Province, while the cold spots were mainly located in parts of Qinghai Province and Gansu Province in the west. In addition, the number of ordinary hotels and the number of star-rated hotels had a strong synergy in the local space.
  • The total number of hotels, the number of ordinary hotels, and the number of star-rated hotels in cities across the Yellow River basin were positively driven by various factors and the degree of influence is different. On the whole, the development of the hotel industry was significantly affected by seven factors (structural force, macro force, ecological force, internal force, consumption force, intermediary force, and external force), and the forces acting on different types of hotels are different. These factors should be taken into account when chain hotels exist.
However, due to the availability of data and other reasons, this paper did not explore the impact of natural conditions such as terrain, vegetation, or light on the development of the hotel industry in the Yellow River basin, nor did it compare and analyze the turnover of different types of hotels. But while there are still deficiencies in the research process, but this also points out the way for future research. The research team is looking forward to conducting more in-depth cooperation with more government departments, further enriching the theoretical system, revealing the spatial-temporal evolution patterns and influence mechanism of the hotel industry at more scales, so as to build a comprehensive model suitable for national, provincial, municipal, and other multi-scale research.

Author Contributions

Conceptualization, G.W. and E.Z.; methodology, E.Z. and Y.Z.; software, E.Z. and Z.W.; validation, G.W., P.H., H.Z. and G.C.; formal analysis, E.Z. and G.C.; investigation, E.Z. and Z.W.; resources, E.Z.; data curation, E.Z.; writing—original draft preparation, E.Z.; writing—review and editing, G.W. and G.C.; visualization, E.Z. and Z.W.; supervision, G.W.; project administration, G.W.; funding acquisition, G.W. All authors have read and agreed to the published version of the manuscript.

Funding

This research was partly funded by the National Natural Science Foundation of China, grant number 51878516.

Institutional Review Board Statement

Not applicable.

Informed Consent Statement

Not applicable.

Data Availability Statement

The authors have no data to share.

Acknowledgments

The authors would like to thank editors and reviewers for this manuscript.

Conflicts of Interest

The authors declare no known conflict of interest.

References

  1. Zhang, Q.; Zhang, Z.; Shi, P.; Singh, V.P.; Gu, X. Evaluation of ecological instream flow considering hydrological alterations in the Yellow River basin, China. Glob. Planet. Chang. 2018, 160, 61–74. [Google Scholar] [CrossRef]
  2. Wang, Y.; Wang, H.; Liu, G.; Zhang, J.; Fang, Z. Factors driving water yield ecosystem services in the Yellow River Economic Belt, China: Spatial heterogeneity and spatial spillover perspectives. J. Environ. Manag. 2022, 317, 115477. [Google Scholar] [CrossRef] [PubMed]
  3. Jiang, W.; Gao, W.; Gao, X.; Ma, M.; Zhou, M.; Du, K.; Ma, X. Spatio-temporal heterogeneity of air pollution and its key influencing factors in the Yellow River Economic Belt of China from 2014 to 2019. J. Environ. Manag. 2021, 296, 113172. [Google Scholar] [CrossRef] [PubMed]
  4. Zhang, H.; Wang, Q.; Huang, J. China’s policy for the marine engineering equipment industry and potential challenges: An appraisal of the new developments under the 14th five-year plans. Front. Mar. Sci. 2022, 9, 1014959. [Google Scholar] [CrossRef]
  5. Geng, W.; Li, Y.; Zhang, P.; Yang, D.; Jing, W.; Rong, T. Analyzing spatio-temporal changes and trade-offs/synergies among ecosystem services in the Yellow River Basin, China. Ecol. Indic. 2022, 138, 108825. [Google Scholar] [CrossRef]
  6. Chen, Y.; Miao, Q.; Zhou, Q. Spatiotemporal Differentiation and Driving Force Analysis of the High-Quality Development of Urban Agglomerations along the Yellow River Basin. Int. J. Environ. Res. Public Health 2022, 19, 2484. [Google Scholar] [CrossRef]
  7. Jiang, L.; Zuo, Q.; Ma, J.; Zhang, Z. Evaluation and prediction of the level of high-quality development: A case study of the Yellow River Basin, China. Ecol. Indic. 2021, 129, 107994. [Google Scholar] [CrossRef]
  8. Boto-García, D.; Mayor, M. Domestic tourism and the resilience of hotel demand. Ann. Tour. Res. 2022, 93, 103352. [Google Scholar] [CrossRef]
  9. Fam, K.-S.; Cheng, B.L.; Cham, T.-H.; Yi, M.T.C.; Ting, H. The Role of Cultural Differences in Customer Retention: Evidence from the High-Contact Service Industry. J. Hosp. Tour. Res. 2023, 47, 257–288. [Google Scholar] [CrossRef]
  10. Ye, X.; Fu, Y.-K.; Wang, H.; Zhou, J. Information asymmetry evaluation in hotel E-commerce market: Dynamics and pricing strategy under pandemic. Inf. Process. Manag. 2023, 60, 103117. [Google Scholar] [CrossRef]
  11. Fissi, S.; Romolini, A.; Gori, E. Building a business model for a new form of hospitality: The albergo diffuso. Int. J. Contemp. Hosp. Manag. 2020, 32, 307–323. [Google Scholar] [CrossRef]
  12. Woo, L.; Mun, S.G. Types of agglomeration effects and location choices of international hotels in an emerging market. Tour. Manag. 2019, 77, 104034. [Google Scholar] [CrossRef]
  13. Zhang, Z.; Ye, Q.; Law, R. Determinants of hotel room price: An exploration of travelers’ hierarchy of accommodation needs. Int. J. Contemp. Hosp. Manag. 2011, 23, 972–981. [Google Scholar] [CrossRef]
  14. Carter, D.; Mazumder, S.; Simkins, B.; Sisneros, E. The stock price reaction of the COVID-19 pandemic on the airline, hotel, and tourism industries. Financ. Res. Lett. 2022, 44, 102047. [Google Scholar] [CrossRef] [PubMed]
  15. Hao, F.; Xiao, Q.; Chon, K. COVID-19 and China’s Hotel Industry: Impacts, a Disaster Management Framework, and Post-Pandemic Agenda. Int. J. Hosp. Manag. 2020, 90, 102636. [Google Scholar] [CrossRef]
  16. Ozdemir, O.; Dogru, T.; Kizildag, M.; Mody, M.; Suess, C. Quantifying the economic impact of COVID-19 on the U.S. hotel industry: Examination of hotel segments and operational structures. Tour. Manag. Perspect. 2021, 39, 100864. [Google Scholar] [CrossRef] [PubMed]
  17. dos Santos, R.A.; Méxas, M.P.; Meiriño, M.J.; Sampaio, M.C.; Costa, H.G. Criteria for assessing a sustainable hotel business. J. Clean. Prod. 2020, 262, 121347. [Google Scholar] [CrossRef]
  18. Chen, B.; Pang, Y. Space Production and Scene Manifestation of the Yellow River National Cultural Park. Wuhan Univ. J. (Philos. Soc. Sci.) 2022, 75, 66–80. [Google Scholar] [CrossRef]
  19. Feng, Y.; Zhu, A.; Liu, P.; Liu, Z. Coupling and coordinated relationship of water utilization, industrial development and ecological welfare in the Yellow River Basin, China. J. Clean. Prod. 2022, 379, 134824. [Google Scholar] [CrossRef]
  20. Xia, J.; Liu, X.; Sun, D.; Li, C.; Wang, Z. Energy Consumption Connection of Industrial Sector Based on Industrial Link Theory: A Case Study of China. Front. Ecol. Evol. 2022, 10, 897574. [Google Scholar] [CrossRef]
  21. Giroux, M.; Franklin, D.; Kim, J.; Park, J.; Kwak, K. The Impact of Same versus Different Price Presentation on Travel Choice and the Moderating Role of Childhood Socioeconomic Status. J. Travel Res. 2022, 61, 674–695. [Google Scholar] [CrossRef]
  22. Butcher, K.; Chomvilailuk, R. Guest benefits of hedonic value and perceived community value drive hotel CSR participation. J. Sustain. Tour. 2021, 30, 1262–1279. [Google Scholar] [CrossRef]
  23. Roma, P.; Panniello, U.; Vasi, M.; Nigro, G.L. Sharing economy and dynamic pricing: Is the impact of Airbnb on the hotel industry time-dependent? J. Hosp. Tour. Manag. 2021, 49, 341–352. [Google Scholar] [CrossRef]
  24. Chen, Q.; Guan, X.; Huan, T.-C. The spatial agglomeration productivity premium of hotel and catering enterprises. Cities 2021, 112, 103113. [Google Scholar] [CrossRef]
  25. Destefanis, A.; Neirotti, P.; Paolucci, E.; Raguseo, E. The impact of Airbnb on the economic performance of independent hotels: An empirical investigation of the moderating effects. Curr. Issues Tour. Res. 2020, 25, 3534–3564. [Google Scholar] [CrossRef]
  26. Qin, J.; Qin, Y.; Liu, C. Location and regionalization patterns of hotel chains: Evidence from China. Tour. Geogr. 2021, 2, 1–19. [Google Scholar] [CrossRef]
  27. Qin, Y.; Qin, J.; Liu, C. Spatial-temporal evolution patterns of hotels in China: 1978–2018. Int. J. Contemp. Hosp. Manag. 2021, 33, 2194–2218. [Google Scholar]
  28. La, L.; Xu, F.; Hu, M.; Xiao, C. Location of Airbnb and hotels: The spatial distribution and relationships. Tour. Rev. 2021, 77, 209–224. [Google Scholar] [CrossRef]
  29. Zhang, D.; Tu, J.; Zhou, L.; Yu, Z. Higher tourism specialization, better hotel industry efficiency? Int. J. Hosp. Manag. 2020, 87, 102509. [Google Scholar] [CrossRef]
  30. Zhao, H.; Gu, T.; Yue, L.; Xu, X. Locational Dynamics of Luxury Hotels in Shanghai Metropolis, China: A Spatial-Temporal Perspective. Land 2022, 11, 1690. [Google Scholar] [CrossRef]
  31. Vivel-Búa, M.; Lado-Sestayo, R. Contagion Effect on Business Failure: A Spatial Analysis of the Hotel Sector. J. Hosp. Tour. Res. 2023, 47, 482–502. [Google Scholar] [CrossRef]
  32. Lado-Sestayo, R.; Vivel-Búa, M.; Otero-González, L. Connection between hotel location and profitability drivers: An analysis of location-specific effects. Curr. Issues Tour. 2020, 23, 452–469. [Google Scholar] [CrossRef]
  33. Valentin, M.; O’Neill, J.W. The Value of Location for Urban Hotels. Cornell Hosp. Q. 2019, 60, 5–24. [Google Scholar] [CrossRef]
  34. Maté-Sánchez-Val, M.; Teruel-Gutierrez, R. Evaluating the effects of hotel location on the adoption of green management strategies and hotel performance. J. Sustain. Tour. 2022, 30, 2029–2052. [Google Scholar] [CrossRef]
  35. Orhan, E. Locational attributes of the lodging industry: An empirical study on urban hotels in Ankara, Turkey. Land Use Policy 2023, 125, 106504. [Google Scholar] [CrossRef]
  36. Muisyo, P.K.; Su, Q.; Hashmi, H.B.A.; Ho, T.H.; Julius, M.M. The role of green HRM in driving hotels’ green creativity. Int. J. Contemp. Hosp. Manag. 2022, 34, 1352. [Google Scholar] [CrossRef]
  37. Yin, J.; Fang, S.; Cheng, Y. Is traditional marketing mix still suitable for hotel banquets? An empirical study of banquet marketing in five-star hotels. Front. Psychol. 2022, 13, 973904. [Google Scholar] [CrossRef]
  38. Moreno-Perdigón, M.C.; Guzmán-Pérez, B.; Mesa, T.R. Guest satisfaction in independent and affiliated to chain hotels. Int. J. Hosp. Manag. 2021, 94, 102812. [Google Scholar] [CrossRef]
  39. Farooq, R.; Zhang, Z.; Talwar, S.; Dhir, A. Do green human resource management and self-efficacy facilitate green creativity? A study of luxury hotels and resorts. J. Sustain. Tour. 2022, 30, 824–845. [Google Scholar] [CrossRef]
  40. Rehman, K.U.; Adnan, M.; Ahmad, N.; Scholz, M.; Khalique, M.; Naveed, R.T.; Han, H. Impact of Substantive Staging and Communicative Staging of Sustainable Servicescape on Behavioral Intentions of Hotel Customers through Overall Perceived Image: A Case of Boutique Hotels. Int. J. Environ. Res. Public Health 2021, 18, 9123. [Google Scholar] [CrossRef]
  41. Filimonau, V.; Matute, J.; Mika, M.; Kubal-Czerwińska, M.; Krzesiwo, K.; Pawłowska-Legwand, A. Predictors of patronage intentions towards ‘green’ hotels in an emerging tourism market. Int. J. Hosp. Manag. 2022, 103, 103221. [Google Scholar] [CrossRef]
  42. Fang, L.; Li, H.; Li, M. Does hotel location tell a true story? Evidence from geographically weighted regression analysis of hotels in Hong Kong. Tour. Manag. 2019, 72, 78–91. [Google Scholar] [CrossRef]
  43. Rahman, I.; Chen, H.; Reynolds, D. Evidence of green signaling in green hotels. Int. J. Hosp. Manag. 2020, 85, 102444. [Google Scholar] [CrossRef]
  44. Zhang, F.; Xiao, Q.; Lee, S. What drives cross-border acquisitions of hotel companies based in an emerging economy? A Study Chin. Hotel. Corp. 2021, 49, 481–493. [Google Scholar] [CrossRef]
  45. Magro, B.; Borg, S.P. A Feasibility Study on CHP Systems for Hotels in the Maltese Islands: A Comparative Analysis Based on Hotels’ Star Rating. Sustainability 2023, 15, 1337. [Google Scholar] [CrossRef]
  46. Zheng, W.; Gao, S.; Fang, B. How Does Public Transportation Influence Hotel Demand? Evidence From a Natural Experiment. Int. J. Hosp. Manag. 2022, 107, 103338. [Google Scholar] [CrossRef]
  47. Arzaghi, M.; Genc, I.H.; Naik, S. Clustering and hotel room prices in Dubai. Tour. Econ. 2023, 29, 116–136. [Google Scholar] [CrossRef]
  48. Deng, T.; Gan, C.; Hu, Y. Do hotel business benefit from increased tourist accessibility? Evidence from China’s high-speed railway program. Tour. Econ. 2021, 27, 1357–1374. [Google Scholar] [CrossRef]
  49. Park, S.; Yang, Y.; Wang, M. Travel distance and hotel service satisfaction: An inverted U-shaped relationship. Int. J. Hosp. Manag. 2019, 76, 261–270. [Google Scholar] [CrossRef]
  50. Lee, Y.; Kim, D.-Y. The decision tree for longer-stay hotel guest: The relationship between hotel booking determinants and geographical distance. Int. J. Contemp. Hosp. Manag. 2020, 33, 2264–2282. [Google Scholar] [CrossRef]
  51. Zhang, H.; Lu, J. Forecasting hotel room demand amid COVID-19. Tour. Econ. 2022, 28, 200–221. [Google Scholar] [CrossRef]
  52. Wang, L.-J.; Chen, M.-H.; Lu, L. Air quality effect on the hotel industry. Tour. Econ. 2022, 28, 942–950. [Google Scholar] [CrossRef]
  53. Park, J.; Yoo, J.L.; Yu, J. Effect of Hotel Air Quality Management on Guests’ Cognitive and Affective Images and Revisit Intentions. Int. J. Environ. Res. Public Health 2021, 18, 9346. [Google Scholar] [CrossRef]
  54. Chang, H.; Huh, C.; Legendre, T.S.; Simpson, J.J. Exploring particulate matter pollution in hotel guestrooms. Int. J. Contemp. Hosp. Manag. 2020, 32, 1131–1162. [Google Scholar] [CrossRef]
  55. Chen, M.-H.; Wei, H.; Wei, M.; Huang, H.; Su, C. Modeling a green supply chain in the hotel industry: An evolutionary game theory approach. Int. J. Hosp. Manag. 2021, 92, 102716. [Google Scholar] [CrossRef]
  56. Dhirasasna, N.; Sahin, O. A system dynamics model for renewable energy technology adoption of the hotel sector. Renew. Energy 2021, 163, 1994–2007. [Google Scholar] [CrossRef]
  57. Walheer, B.; Zhang, L.; Luo, Y. Bidirectional technological spillover in the Chinese star-rated hotel sector: An empirical investigation. Econ. Model. 2020, 86, 210–226. [Google Scholar] [CrossRef]
  58. Tosetto, E.G.; Bertrand, A.; Neumann-Leitão, S.; Júnior, M.N. The Amazon River plume, a barrier to animal dispersal in the Western Tropical Atlantic. Sci. Rep. 2022, 12, 537. [Google Scholar] [CrossRef]
  59. Hirwa, H.; Zhang, Q.; Li, F.; Qiao, Y.; Measho, S.; Muhirwa, F.; Xu, N.; Tian, C.; Cheng, H.; Chen, G.; et al. Water Accounting and Productivity Analysis to Improve Water Savings of Nile River Basin, East Africa: From Accountability to Sustainability. Agronomy 2022, 12, 818. [Google Scholar] [CrossRef]
  60. Krasovich, E.; Lau, P.; Tseng, J.; Longmate, J.; Bell, K.; Hsiang, S. Harmonized nitrogen and phosphorus concentrations in the Mississippi/Atchafalaya River Basin from 1980 to 2018. Sci. Data 2022, 9, 524. [Google Scholar] [CrossRef] [PubMed]
  61. Manton, M.; Makrickas, E.; Banaszuk, P.; Kołos, A.; Kamocki, A.; Grygoruk, M.; Stachowicz, M.; Jarašius, L.; Zableckis, N.; Sendžikaitė, J.; et al. Assessment and Spatial Planning for Peatland Conservation and Restoration: Europe’s Trans-Border Neman River Basin as a Case Study. Land 2021, 10, 174. [Google Scholar] [CrossRef]
  62. Hernández Mogollón, M.J.; Sampaio, C.A.F.; Ricardo, R.G. Price Strategy, Market Orientation, and Business Performance in the Hotel Industry. J. Glob. Inf. Manag. (JGIM) 2021, 29, 85–102. [Google Scholar] [CrossRef]
  63. Zheng, W.; Ji, H.; Lin, C.; Wang, W.; Yu, B. Using a heuristic approach to design personalized urban tourism itineraries with hotel selection. Tour. Manag. 2019, 76, 103956. [Google Scholar] [CrossRef]
  64. Nurmatov, R.; Lopez, X.L.F.; Millan, P.P.C. Tourism, hospitality, and DEA: Where do we come from and where do we go? Int. J. Hosp. Manag. 2021, 95, 102883. [Google Scholar] [CrossRef]
Figure 1. The research area and its units.
Land 12 00770 g001
Figure 2. Changes in the number of hotels in the Yellow River Basin from 2012 to 2022.
Land 12 00770 g002
Figure 3. The spatial difference distribution of the total number of hotels in the Yellow River basin.
Land 12 00770 g003
Figure 4. The spatial difference distribution of ordinary hotels in the Yellow River Basin.
Land 12 00770 g004
Figure 5. The spatial difference distribution of star hotels in the Yellow River Basin.
Land 12 00770 g005
Figure 6. The spatial evolution characteristics of the hotel industry in the Yellow River Basin.
Land 12 00770 g006
Figure 7. Comparison of the density values for the total amount of hotels (Individual/km2).
Land 12 00770 g007
Figure 8. Comparison of the density value of ordinary hotels (Individual/km2).
Land 12 00770 g008
Figure 9. Comparison of the density value of star hotels (Individual/km2).
Land 12 00770 g009
Figure 10. The LISA spatial agglomeration difference of the total number of hotels.
Land 12 00770 g010
Figure 11. The LISA spatial agglomeration difference of ordinary hotels.
Land 12 00770 g011
Figure 12. The LISA spatial agglomeration difference of star hotels.
Land 12 00770 g012
Figure 13. Space distribution of cold hotspots of the total number of hotels.
Land 12 00770 g013
Figure 14. Space distribution of cold hotspots of ordinary hotel.
Land 12 00770 g014
Figure 15. Space distribution of cold hotspots of star hotels.
Land 12 00770 g015
Figure 16. The LISA space agglomeration difference between ordinary hotels and star hotels.
Land 12 00770 g016
Table 1. Standard deviation ellipse calculation results.
ClassYearStandard Deviation Ellipse
Area/10,000 km2Gravity Center of Longitude (°E)Gravity Center of Latitude (°N)Major Axis Standard Deviation/kmShort Axis Standard Deviation/kmAzimuth Angle/(°)
Hotel industry201268.82113.0936.15789.46277.5489.34
201464.55112.6936.00755.17272.1288.93
201665.98112.5135.97764.77274.6688.54
201865.69112.7135.93766.49272.8388.49
202064.32112.7635.85751.44272.4888.02
202263.41112.7135.81744.59271.1188.03
Ordinary hotels201268.75113.1236.14789.68277.1789.37
201464.23112.6935.99754.07271.1788.92
201665.90112.5235.96764.76274.3288.54
201865.51112.7335.93765.27272.5488.50
202064.12112.7735.85750.12272.1388.00
202263.20112.7335.81743.26270.7088.00
Star hotels201269.63112.6136.21782.87283.1788.70
201470.17112.7036.11774.82288.3089.24
201668.26112.3636.05764.80284.1388.43
201870.33112.2436.04798.13280.5588.26
202070.95112.2136.07796.51283.6088.25
202271.40111.8936.03793.72286.3788.74
Table 2. Global spatial autocorrelation features.
ClassYearMoran’s IZPDistribution
Hotel industry20120.2011774.8195150.000001Clustering
20140.1016972.6713600.007554Clustering
20160.0621531.7799400.075086Clustering
20180.0861592.2463310.024683Clustering
20200.0600361.6957510.089933Clustering
20220.0460801.3734580.169610Radom
Ordinary hotel20120.2185175.2074330.000000Clustering
20140.1079962.8161450.004860Clustering
20160.0657971.8650910.062169Clustering
20180.0898812.3292980.019843Clustering
20200.0615831.7323120.083218Clustering
20220.0475041.4071610.159380Radom
Star hotel2012−0.0074990.1063220.915327Radom
2014−0.0053790.1547400.877026Radom
2016−0.016586−0.1099420.912456Radom
20180.0071860.4467370.655065Radom
20200.0129200.5770920.563877Radom
2022−0.0093360.0630350.949739Radom
Table 3. Bivariate global spatial autocorrelation features.
ClassYearMoran’s IZP
Bivariate global Moran’s I20120.13972.33010.022
20140.12001.98890.035
20160.10181.71370.057
20180.14772.35780.022
20200.15052.40710.019
20220.11041.81240.046
Table 4. Indicator variables and descriptions.
FactorsVariable NameVariable MeaningUnit
Number of All Hotels (Y)Total Number of Urban HotelsNumber
Structural forceNumber of ordinary hotels (x1)Number of urban general hotelsNumber
Number of star hotels (x2)Number of urban star hotelsNumber
Macroscopic forceGDP (x3)The annual urban final output value of production activities of all permanent units100 million yuan
Total tourism revenue (x4)The annual total revenue of urban tourism100 million yuan
Total investment in fixed assets (x5)The sum of money terms for the work and costs associated with the construction and acquisition of fixed assets100 million yuan
Ecological forceThe number of national scenic spots (x6)The number of national scenic spotsNumber
The annual mean concentration of PM 2.5 (x7)Average daily PM 2.5 concentration of over a one-year periodMicrograms per cubic meter
Internal powerDensity of population (x8)Ratio of total population to administrative areaPerson/km2
Per capita GDP (x9) Per capita GDP by city for the year10 thousand yuan
Consumption powerTotal retail sales of consumer goods (x10)The total amount of consumer goods sold directly to urban and rural residents and social groups in various sectors of the national economy100 million yuan
The number of students enrolled in colleges and universities (x11)Total number of students in prefecture-level institutions of higher learning10 thousand people
The proportion of tertiary industry (x12)Proportion of output value of service industry in total output value%
Mediating forcePassenger traffic (x13)The annual average number of passengers transported per kilometer by various modes of transport
Road density (x14)The ratio of the total road area in the city to the district area-
External powerInbound tourist arrivals (x15)The number of tourist visits in a year10 thousand people
Actual utilization of foreign capital (x16)The funds that have been received and put into commercial operation in the investment projects of foreign commercial companies in prefecture cities10 thousand dollars
Table 5. The results of geographical detectors influence factors.
Indexx1x2x3x4x5x6x7x8x9x10x11x12x13x14x15x16
x10.938 ***
x20.9480.697 ***
x30.9420.7680.646 ***
x40.9420.7580.7360.637 ***
x50.9450.7720.6840.7390.616 ***
x60.9420.7220.7120.6650.6820.190 ***
x70.9460.7480.6890.6640.6590.3250.123 ***
x80.9450.7470.6940.7100.6580.4520.3960.235 ***
x90.9430.7130.6770.6640.6370.3730.3120.4530.156 ***
x100.9450.7980.7060.7370.7130.7440.7280.7280.6960.683 ***
x110.9440.7390.6970.6980.6990.6180.6090.6090.5900.7200.545 ***
x120.9430.7220.6810.6570.6720.2940.3540.5150.3910.7000.5720.099 ***
x130.9430.7500.6950.6890.6450.3830.3510.4590.4910.7150.6080.3780.251 ***
x140.9430.7850.7060.7280.6720.4200.3770.5090.5030.7440.7020.3730.3640.182 ***
x150.9450.7670.7240.6670.7050.5650.5720.5980.6240.7410.6540.6160.5780.6270.530 ***
x160.9420.7180.6710.6760.6430.4720.5200.5230.4740.7210.6130.5090.5480.6210.6420.411 ***
The orange area indicates the explanatory ability of single factor, and *** respectively indicate that the detection result of single factor is significant at the level of 1%. The yellow and green area represents the comprehensive explanation of the interaction of two factors, where yellow indicates interaction type as bifactor enhancement and the green indicates interaction type as non-linear enhancement.
Table 6. Pearson Results of the correlation factor analysis.
VariableTotal Number of Hotel IndustryNumber of Ordinary HotelsNumber of Star Hotels
R1Strength LevelR2Strength LevelR3Strength Level
x10.968 **Very strong correlation
x20.827 **Very strong correlation0.813 **Very strong correlation
x30.776 **strong correlation0.786 **strong correlation0.747 **strong correlation
x40.770 **strong correlation0.768 **strong correlation0.751 **strong correlation
x50.757 **strong correlation0.750 **strong correlation0.684 **strong correlation
x60.430 **moderate degree correlation0.413 **moderate degree correlation0.523 **moderate degree correlation
x70.260 **weak correlation0.278 **weak correlation0.168 **weak correlation
x80.462 **moderate degree correlation0.470 **moderate degree correlation0.369 **weak correlation
x90.369 **weak correlation0.361 **weak correlation0.452 **moderate degree correlation
x100.793 **strong correlation0.795 **strong correlation0.711 **strong correlation
x110.737 **strong correlation0.734 **strong correlation0.734 **strong correlation
x120.307 **weak correlation0.299 **weak correlation0.386 **weak correlation
x130.484 **moderate degree correlation0.469 **moderate degree correlation0.397 **moderate degree correlation
x140.424 **moderate degree correlation0.421 **moderate degree correlation0.255 **weak correlation
x150.707 **strong correlation0.708 **strong correlation0.651 **strong correlation
x160.604 **strong correlation0.597 **moderate degree correlation0.584 **moderate degree correlation
N420
** respectively indicate that the detection results of single factor is significant at the level of 1%; R∈[0.8, 1], Very strong correlation; R∈[0.6, 0.8], strong correlation; R∈[0.4, 0.6], moderate degree correlation; R∈[0.2, 0.4], weak correlation; R∈[0, 0.2], very weak or no correlations; "—" indicates no data.
Disclaimer/Publisher’s Note: The statements, opinions and data contained in all publications are solely those of the individual author(s) and contributor(s) and not of MDPI and/or the editor(s). MDPI and/or the editor(s) disclaim responsibility for any injury to people or property resulting from any ideas, methods, instructions or products referred to in the content.

