Article

Are Drought and Wind Force Driving Factors of Wind Erosion Climatic Erosivity in a Changing Climate? A Case Study in a Landlocked Country in Central Europe

by
Lenka Lackóová
*,
Tatiana Kaletová
and
Klaudia Halászová
Institute of Landscape Engineering, Faculty of Horticulture and Landscape Engineering, Slovak University of Agriculture in Nitra, Hospodárska 7, 94901 Nitra, Slovakia
*
Author to whom correspondence should be addressed.
Land 2023, 12(4), 757; https://doi.org/10.3390/land12040757
Submission received: 26 February 2023 / Revised: 23 March 2023 / Accepted: 25 March 2023 / Published: 27 March 2023

Abstract

:
The intensity and frequency of occurrence of wind erosion have had an increasing tendency in recent years, exacerbating environmental and agricultural problems around the world. The question of whether climate change will have an accelerating impact on wind erosion might be answered by analyzing three driving parameters: wind erosion climatic erosivity (CE), standard precipitation index (SPI), and wind factor (Wf). A time series analysis of historical climatic data over a period of 58 years was performed using ArcGIS software and descriptive statistics, to detect spatiotemporal variations regarding climate change. The results of the analysis indicate that the number and intensity of drought periods are already increasing in Central Europe. Through the CE equation using the key indicators wind speed (U), temperature (T), humidity (r), and precipitation (P), we calculated decadal spatiotemporal variation and potential scenarios of climate change in terms of wind erosion intensity. The results of the study show that there has been a 1.75 °C increase in temperature since 1961 and fluctuating wind erosion intensity in recent decades. The frequency of drought periods has increased only slightly, but there has been an increase in the amount of precipitation in the last two decades of the study period, up to +6.63 and +6.53%. The wind analysis showed that mean maximum wind speed (Umaxmean) had a decreasing trend (R2 = 0.32), and the occurrence of erosive wind (Uer) (>5 m/s) exhibited seasonal changes toward spring. Wf exhibited a rise of 11.86 and 3.66% in the first two decades of the study period, followed by a decline of 8.49% in the last decade. CE analysis indicated oscillation in both directions, with decadal changes ranging between −16.95 and +15.21%. Wind erosion is becoming a more significant issue in Central Europe because of climate change, and the situation could worsen in the future. This study provides valuable insights into the impact of climate change on wind erosion in Europe and highlights the need for effective measures to mitigate its effects.

1. Introduction

Land erodibility, or the susceptibility of soil to erosion, is an important factor to consider in managing land resources and preserving soil fertility. Many recent studies dealing with land degradation processes have proved that climate change affects land erodibility [1,2,3,4,5], which accelerates the process of wind erosion. Wind erosion is a major contributor to soil degradation and desertification in many regions of the world [6,7,8,9], mainly in drylands, leading to loss of fertility and reduced crop yields [10,11], with significant impacts on soil health and productivity [12]. It is crucial to emphasize the importance of addressing wind erosion as a major contributor to land degradation. However, predicting the specific effects of future climate change on wind erosion remains a challenge [13].
Wind erosion is highly dependent on the wind force and the severity of drought conditions as the two major drivers of wind erosion climatic erosivity in arid regions. Significant alterations in wind speed distribution around the globe are caused by climate change [14]. Over the past two decades, there has been growing interest in examining the variability and trends of near-surface wind. Two key phenomena have emerged from the research [15]: the first is “stilling”, which refers to a decrease in near-surface wind speeds between 1978 and 2010, and the second is the interruption of the stilling trend since the 2000s, known as a reversal of wind speed trends on a global and regional scale, including in China, Sweden, and the Iberian Peninsula. The Northern Hemisphere experienced decreasing trends in global near-surface wind speed between 1980 and 2016, while the Southern Hemisphere was characterized by upward trends [16].
Climate change is causing alterations in precipitation patterns and temperature regimes, which in turn can lead to changes in wind erosion patterns. During the last 50 years, climate change has caused increased precipitation [17], and a trend of increasing temperature has been recorded. The key finding of the sixth Assessment Report on climate change is that the increase in mean air temperature will reach 1.5 °C between 2030 and 2052 if it keeps rising at the current trend [18]. Early detection of the effects of climate change on wind erosion will help in promoting suitable sustainable soil practices to minimize financial and environmental damage. The problem is that a specific, precise model to evaluate the impact of climate change on soil erosion for a particular study area has not yet been developed [19]. Published research dealing with the impact of climatic change on soil erosion is mostly limited to smaller scales [20], and very few studies have focused on evaluating the impact of climate change on wind erosion around the world [12,21,22,23,24,25,26,27,28,29]. These studies have helped to advance our understanding of the relationship between wind erosion and climate change and have provided insights into the drivers of wind erosion and the impact of climate change on wind erosion patterns. Despite the progress made in wind erosion research, there are still significant gaps in our understanding of the relationship between wind erosion and climate change.
Global warming can intensify wind erosion and degrade local soil structure and conditions [30], and weather parameters are key indices of wind erosion, mostly in dry regions [31]. Drylands will expand at least by 11% by the end of this century [32]. These changes could endanger landscape sustainability [33]. Climate change has increased wind erosion in arid areas by 3.2% in the last 39 years [19]. Environmental changes caused by global warming will result in greater wind intensity and lower water availability, which will result in increased wind erosion, mostly in the outer environment [34]. Climate change will have shifting impacts either locally or regionally on important climatic indices of wind erosion, especially its frequency, duration, and severity. Identifying and assessing possible scenarios is important for managing sustainable land practices considering such changes. Climate parameters such as precipitation, temperature, and wind condition are key factors in determining the intensity of wind erosion. The connection between wind erosion events and precipitation from the perspective of broad-scale climate systems that control precipitation levels and soil moisture together with area management are crucial factors influencing wind erosion risk [35,36,37,38,39]. Although there are several climatic parameters and factors to evaluate the impact of climate change in relation to wind erosion, there is a lack of studies evaluating these parameters systematically and comprehensively.
Climatic erosivity (CE) is mainly determined by wind velocity and the amount and distribution of precipitation [40,41,42]. Wind erosion climatic erosivity is basically defined as the potential to create conditions prone to wind erosion through drought on the soil surface and erosive wind events [43]. Several recent studies [1,3,4] have investigated spatial and temporal variations of CE as a key indicator to evaluate scenarios of climate change trends to assess the scale at which it can affect wind erosion risk. In the revised wind erosion equation (RWEQ), wind erosivity is defined by the wind factor (Wf) to describe the influence of wind speed on wind erosion. Linking wind speed with climate change is important due to its impact on wind erosion; however, the lack of available data complicates the research [44]. Wind velocity is the driving force of wind erosivity, determined by weather processes [45]. A decrease in wind speed will reduce wind erosion [46]; however, averaging the wind speed can lower mean values, which can lead to a significant underestimation of wind erosivity [47]. The mean wind speed in Northern Europe is predicted to change by a ratio of ±15% [48]. In Southern Europe, the frequency of extreme wind events is expected to change significantly in the future, with historical 100-year return events projected to occur approximately every 58 years [49].
The weather factor (WF) is also used, expressed generally as an erosivity index or as CE as input for an equation. Wind erosion activity is often aligned with drought conditions as well [50]. The standardized precipitation index (SPI), calculated from precipitation data, is often used to evaluate drought periods [51]. Studies have shown that the magnitude of wind erosion is dependent on wind force and drought conditions; however, no studies have examined and analyzed complex spatial and temporal changes in combined parameters using long-time meteorological data. Addressing the challenges requires a multi-parametric approach involving all major drivers of wind erosion climatic erosivity to fully understand the complexities and relationships and predict wind erosion patterns in a changing climate.
Therefore, the intention of this study, for the period 1961–2019 in Western Slovakia, was to (1) investigate the changes and variations in climatic parameters U, P, r and T; (2) highlight the role of Uer in relation to P; (3) evaluate the dry periods based on SPI; (4) determine the role of drought periods and their effect on CE through the SPI and Wf indices; and (5) analyze the spatial and temporal changes in CE at the annual and monthly scale to determine its diversity caused by climate change.

2. Materials and Methods
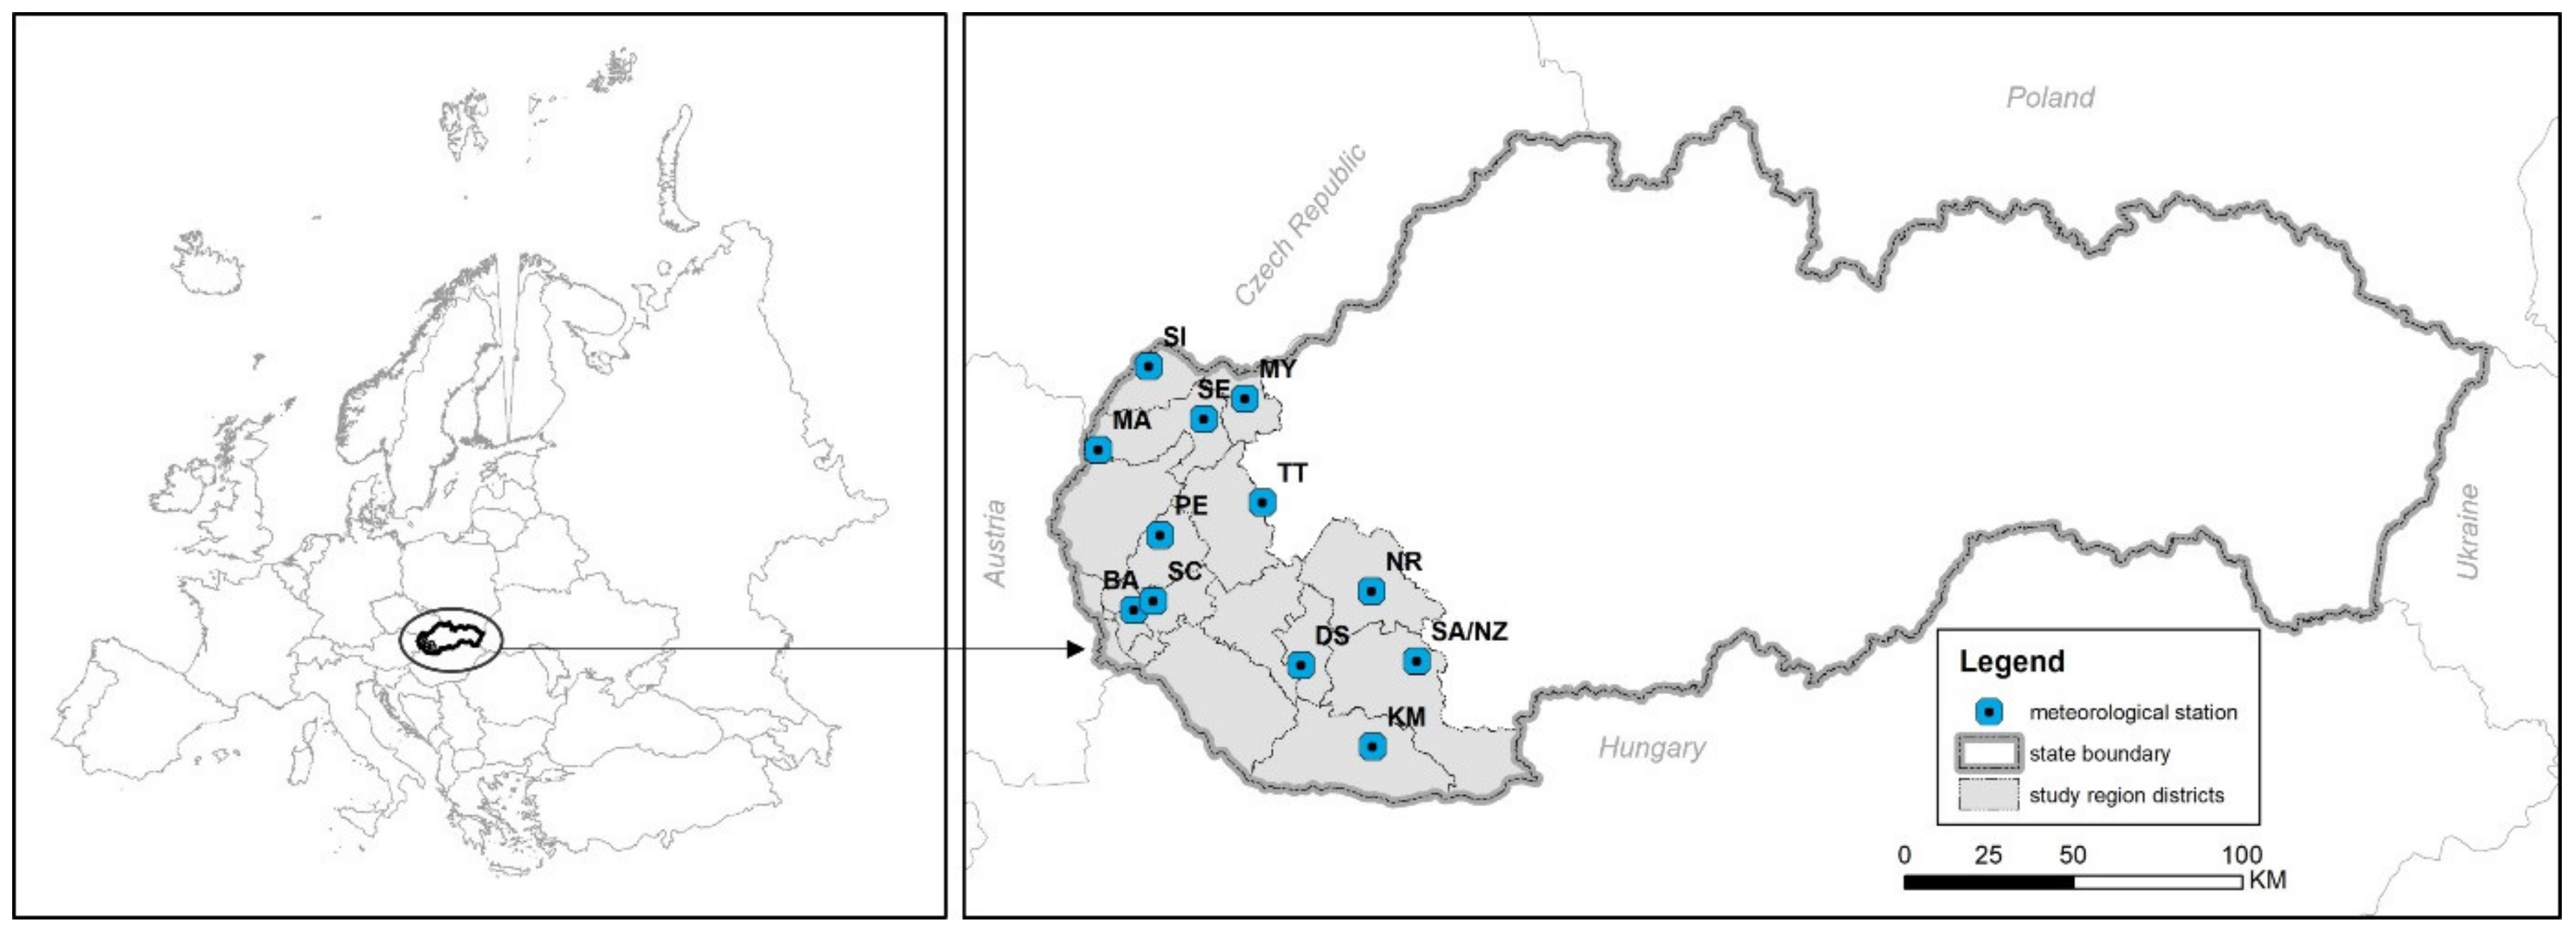
2.1. Study Area

The study area is in the western part of Slovakia, a landlocked country in Central Europe, and has a total area of 427.69 km2; it is bordered on the northwest by the Czech Republic, on the west by Austria, and on the south by Hungary (Figure 1). It is characterized as having a warm and dry climate, with mean annual air temperature (Tmeana) of 9.5 °C. The northern and eastern part toward the mountains is characterized as slightly humid with mild winters (Tmean in January: 1.9 °C). Pmeana is 550–700 mm. The area is also characterized by sandy, loamy sandy, and sandy loam soils highly prone to wind erosion, with significant changes in particle size distribution in last 50 years [52].

2.2. Climate Data Assessment and Interpretation

Interannual tables and charts of climatic parameters were built using long-term meteorological data in Western Slovakia at 12 meteorological stations (MSs) (Table 1)
Daily meteorological data including P (mm), Tmean, Tmax, and Tmin (°C), and r (%) and daily wind data at 3 time periods (7 AM, 2 PM, and 9 PM) over a period of 58 years and hourly wind data over 14 years (2005–2019) were provided by the Slovak Hydrometeorological Institute to evaluate and analyze the direction and prevalence of wind (Umean, Umax, Umin) in the study region. Data were processed by ArcGIS software using the Topo to Raster interpolation method with a raster resolution of 0.5 km. To standardize the yearly data from different weather stations, we used trend analysis and the interpolation method to obtain the missing data. The locations of the MSs are displayed in Figure 1, and specific data (coordinates) are presented in Supplementary Table S1.

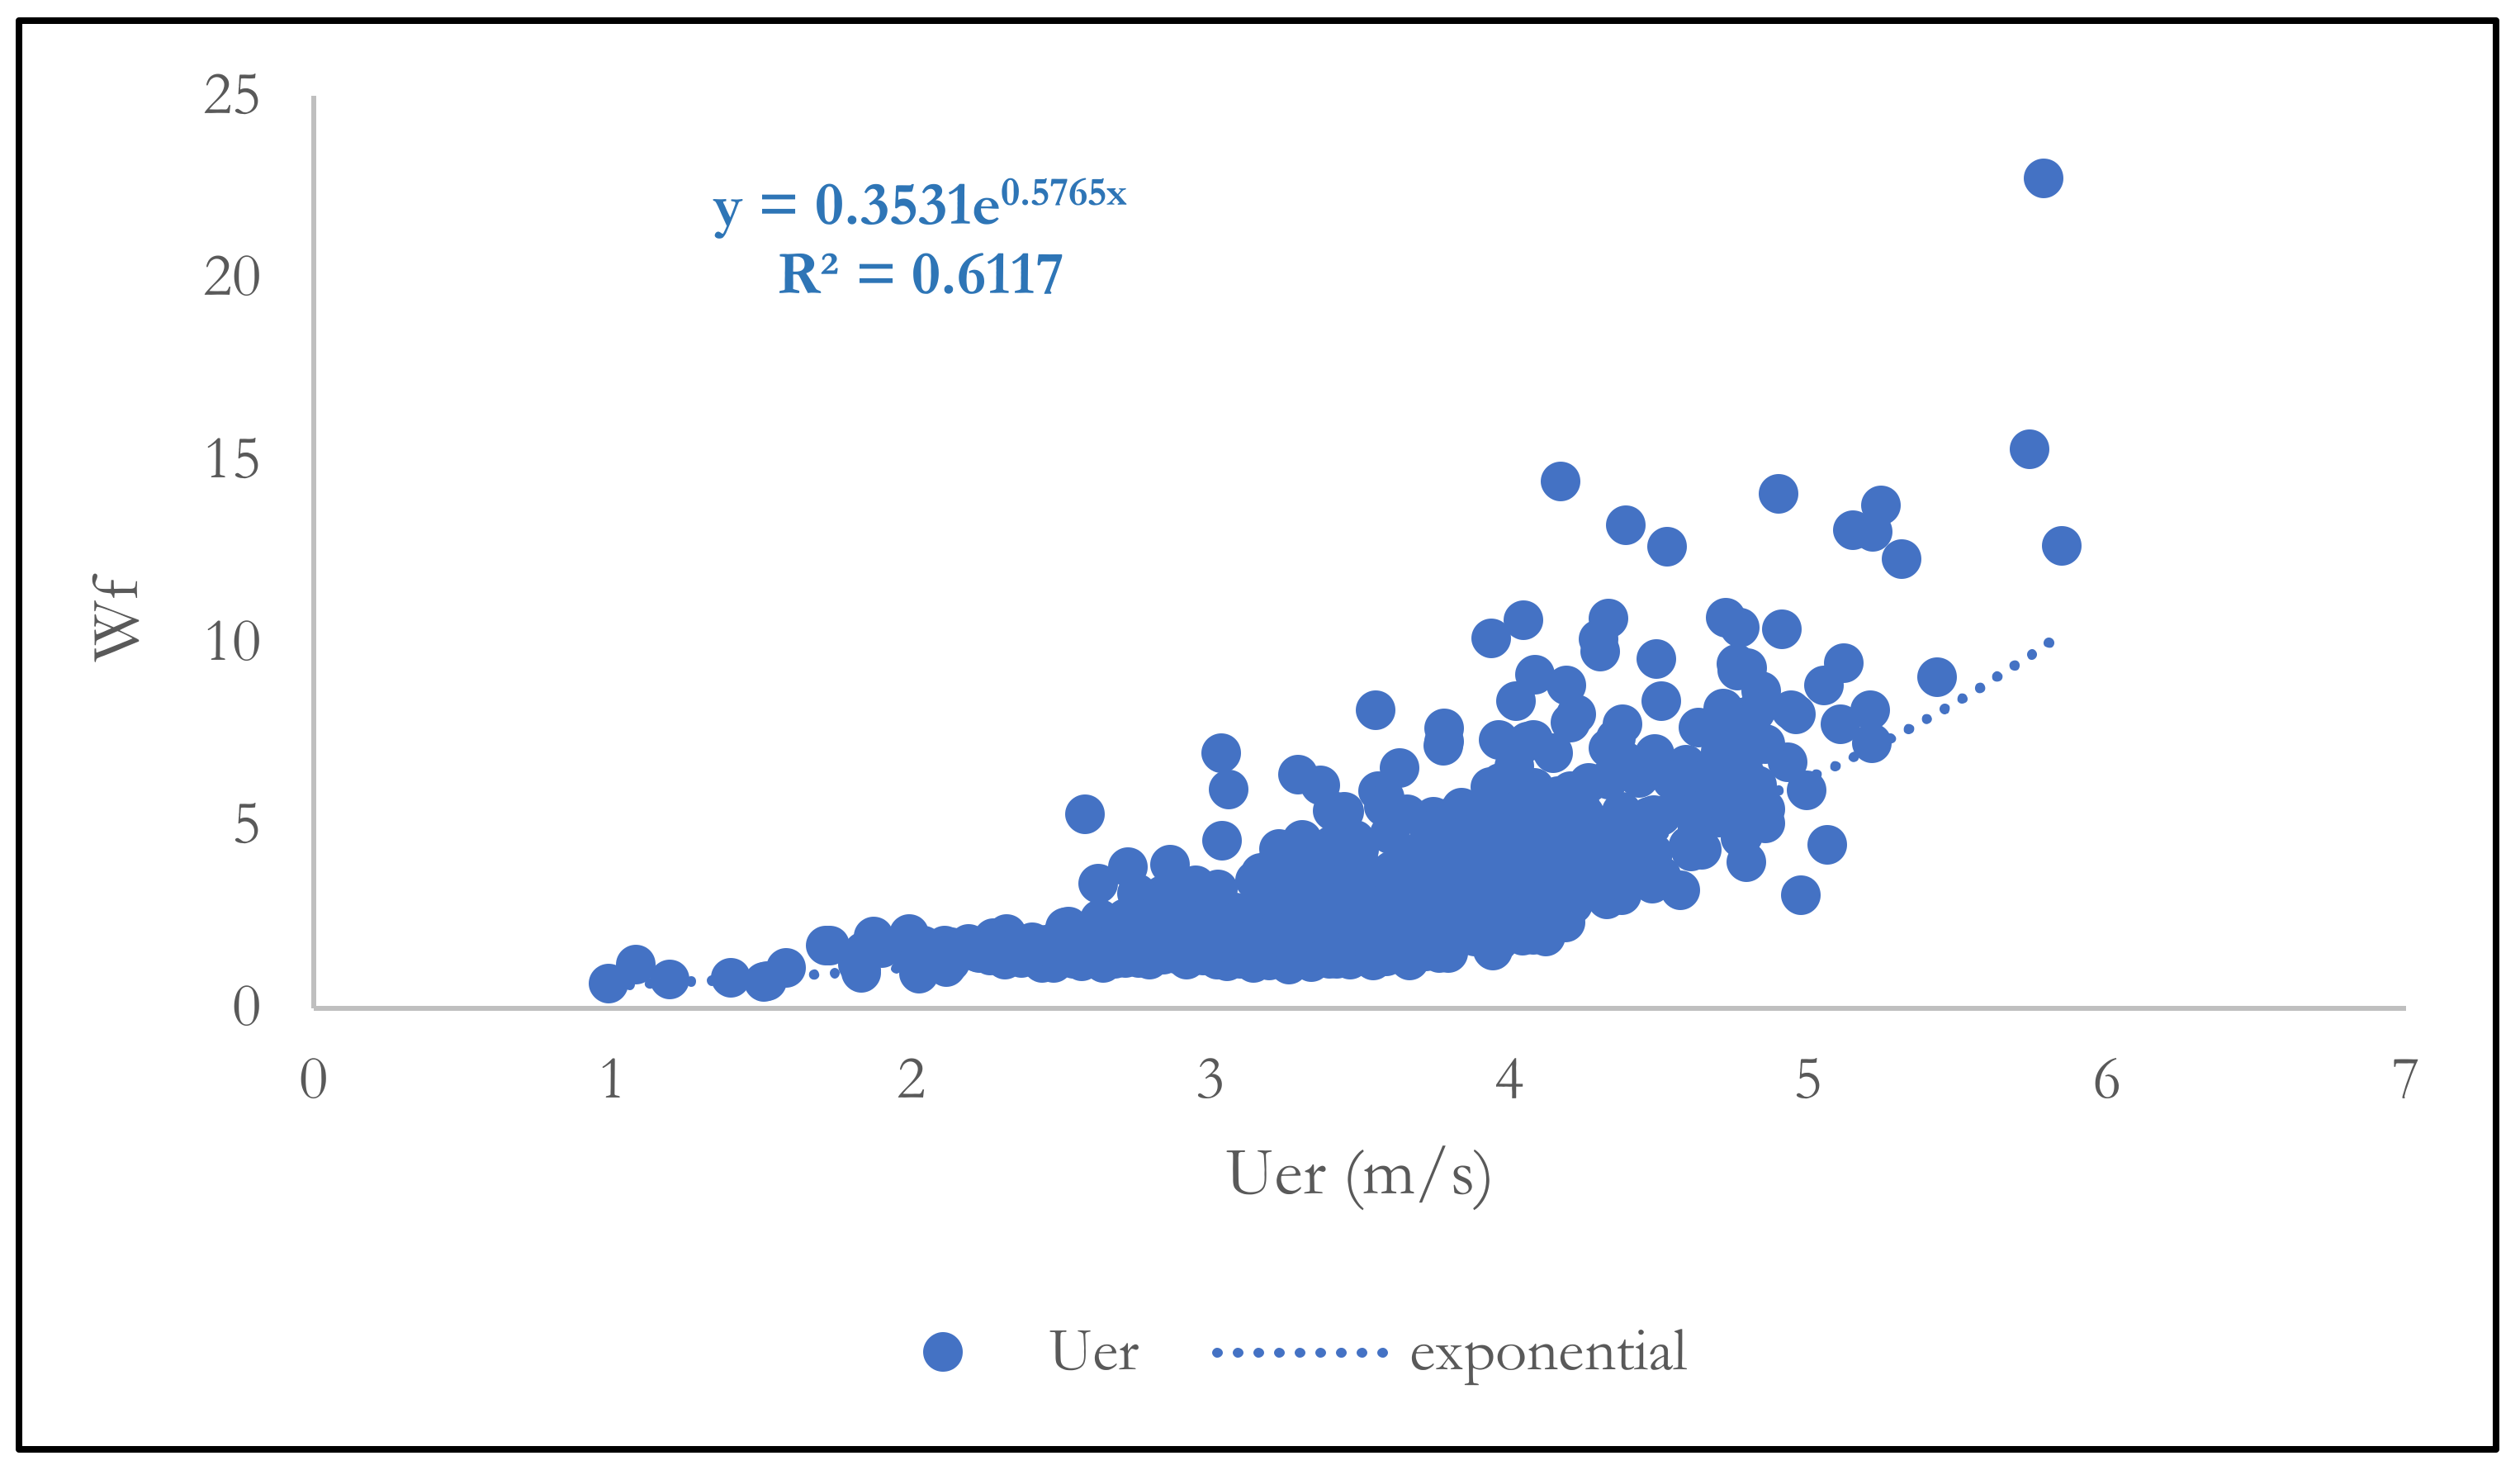
2.3. Wind Factor (Wf)

Wind is an independent factor influencing soil and land surface and is the main cause of wind erosion. There is no simple way to use U to determine the extent of wind erosion, so it is necessary to evaluate the effect of U on wind erosion through other parameters, such as Uer, Umax, Umaxmean, or Wf. U significantly influences the intensity and frequency of wind erosion and occurrence. According to research in the Záhorska lowland [53], wind erosion events occur in Slovakia when the wind speed exceeds 5 m/s. To calculate Wf, hourly mean wind speed datasets from MA (1995–2019), BA (1995–2019), NR (1996–2019), KM (1995–2019), and TT (1998–2019) stations were used in the equation for calculating erosive Wf (kg/m/s) [54]:
W f = i = 1 N ρ ( U i U t ) 2 U i g N .
where Ui is wind speed (m/s), Ut = 5.0 m/s (if Ui ˂ 5.0, Wf = 0), ρ is air density (kg/m3), g is acceleration due to gravity (m/s−2), and N is the number of wind events.
The conversion from wind speed observed at standard height to 2 m height was calculated using a wind profile conversion formula:
V 2 = V 1 × Z 2 Z 1 α .
where V1 is wind speed at standard height (10 m), V2 is wind speed at 2 m height, Z1 is the standard height (10 m), Z2 is the desired height (2 m), and α is the power law exponent (0.14).

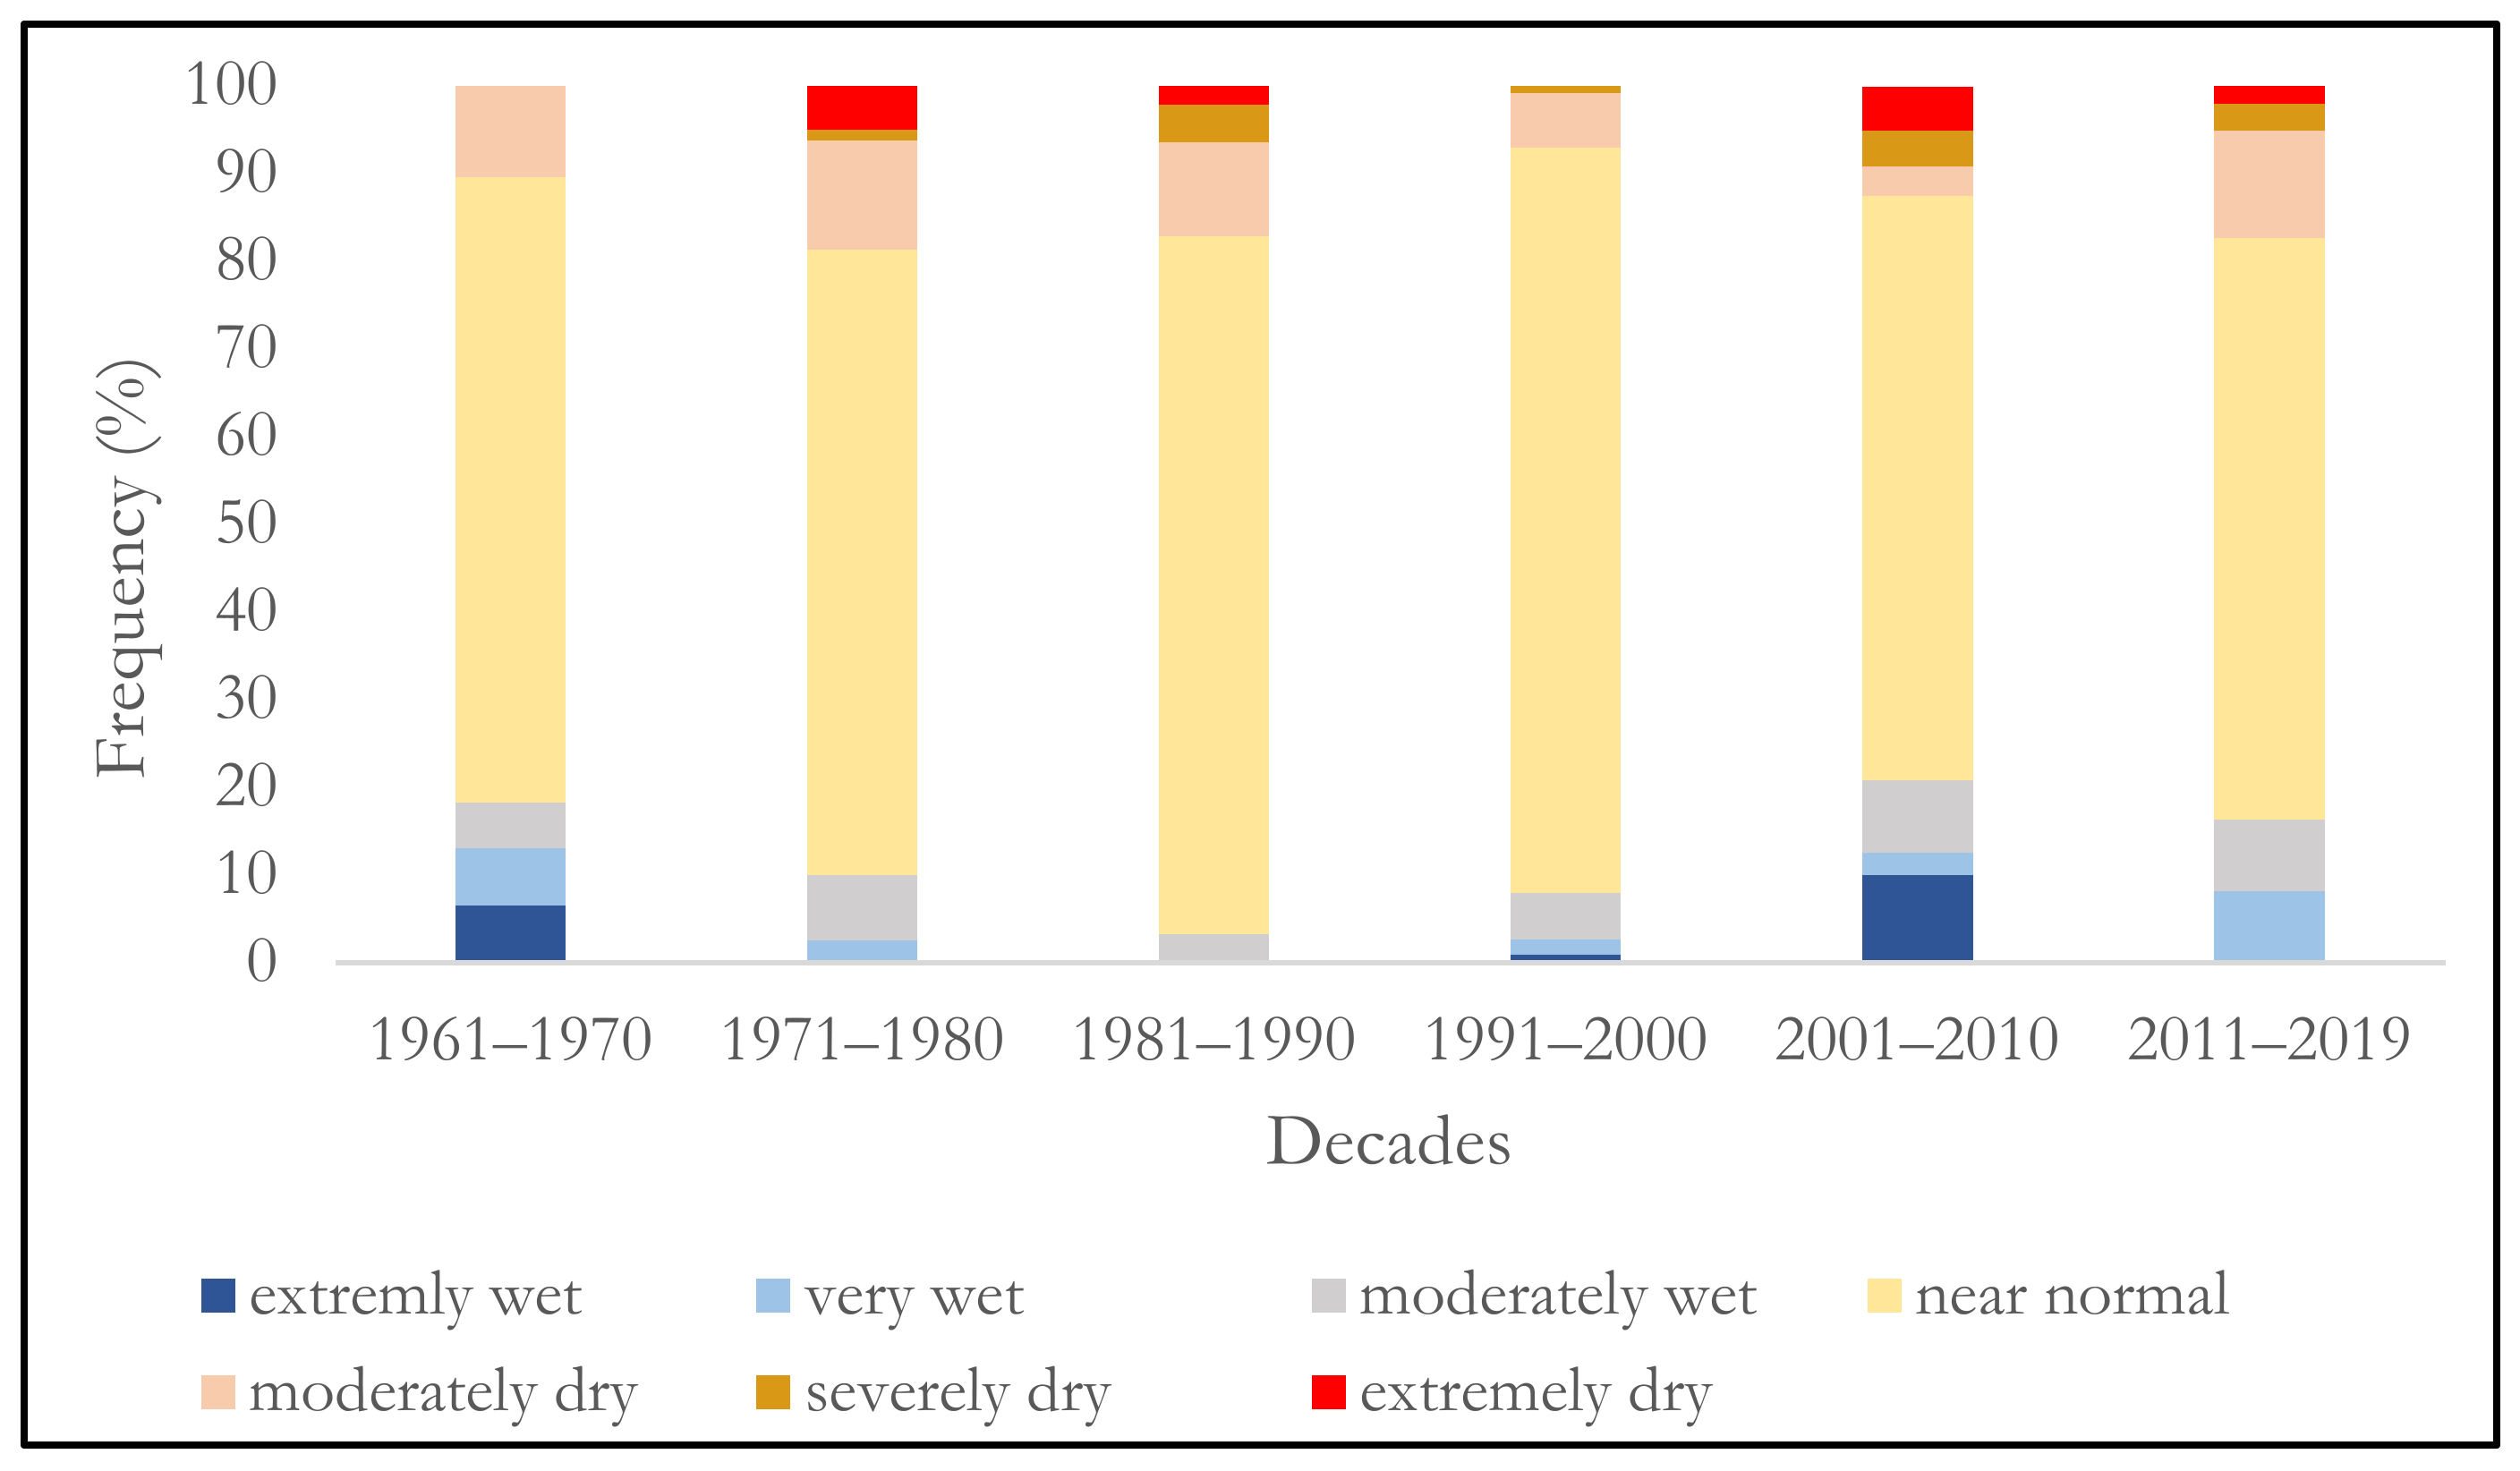
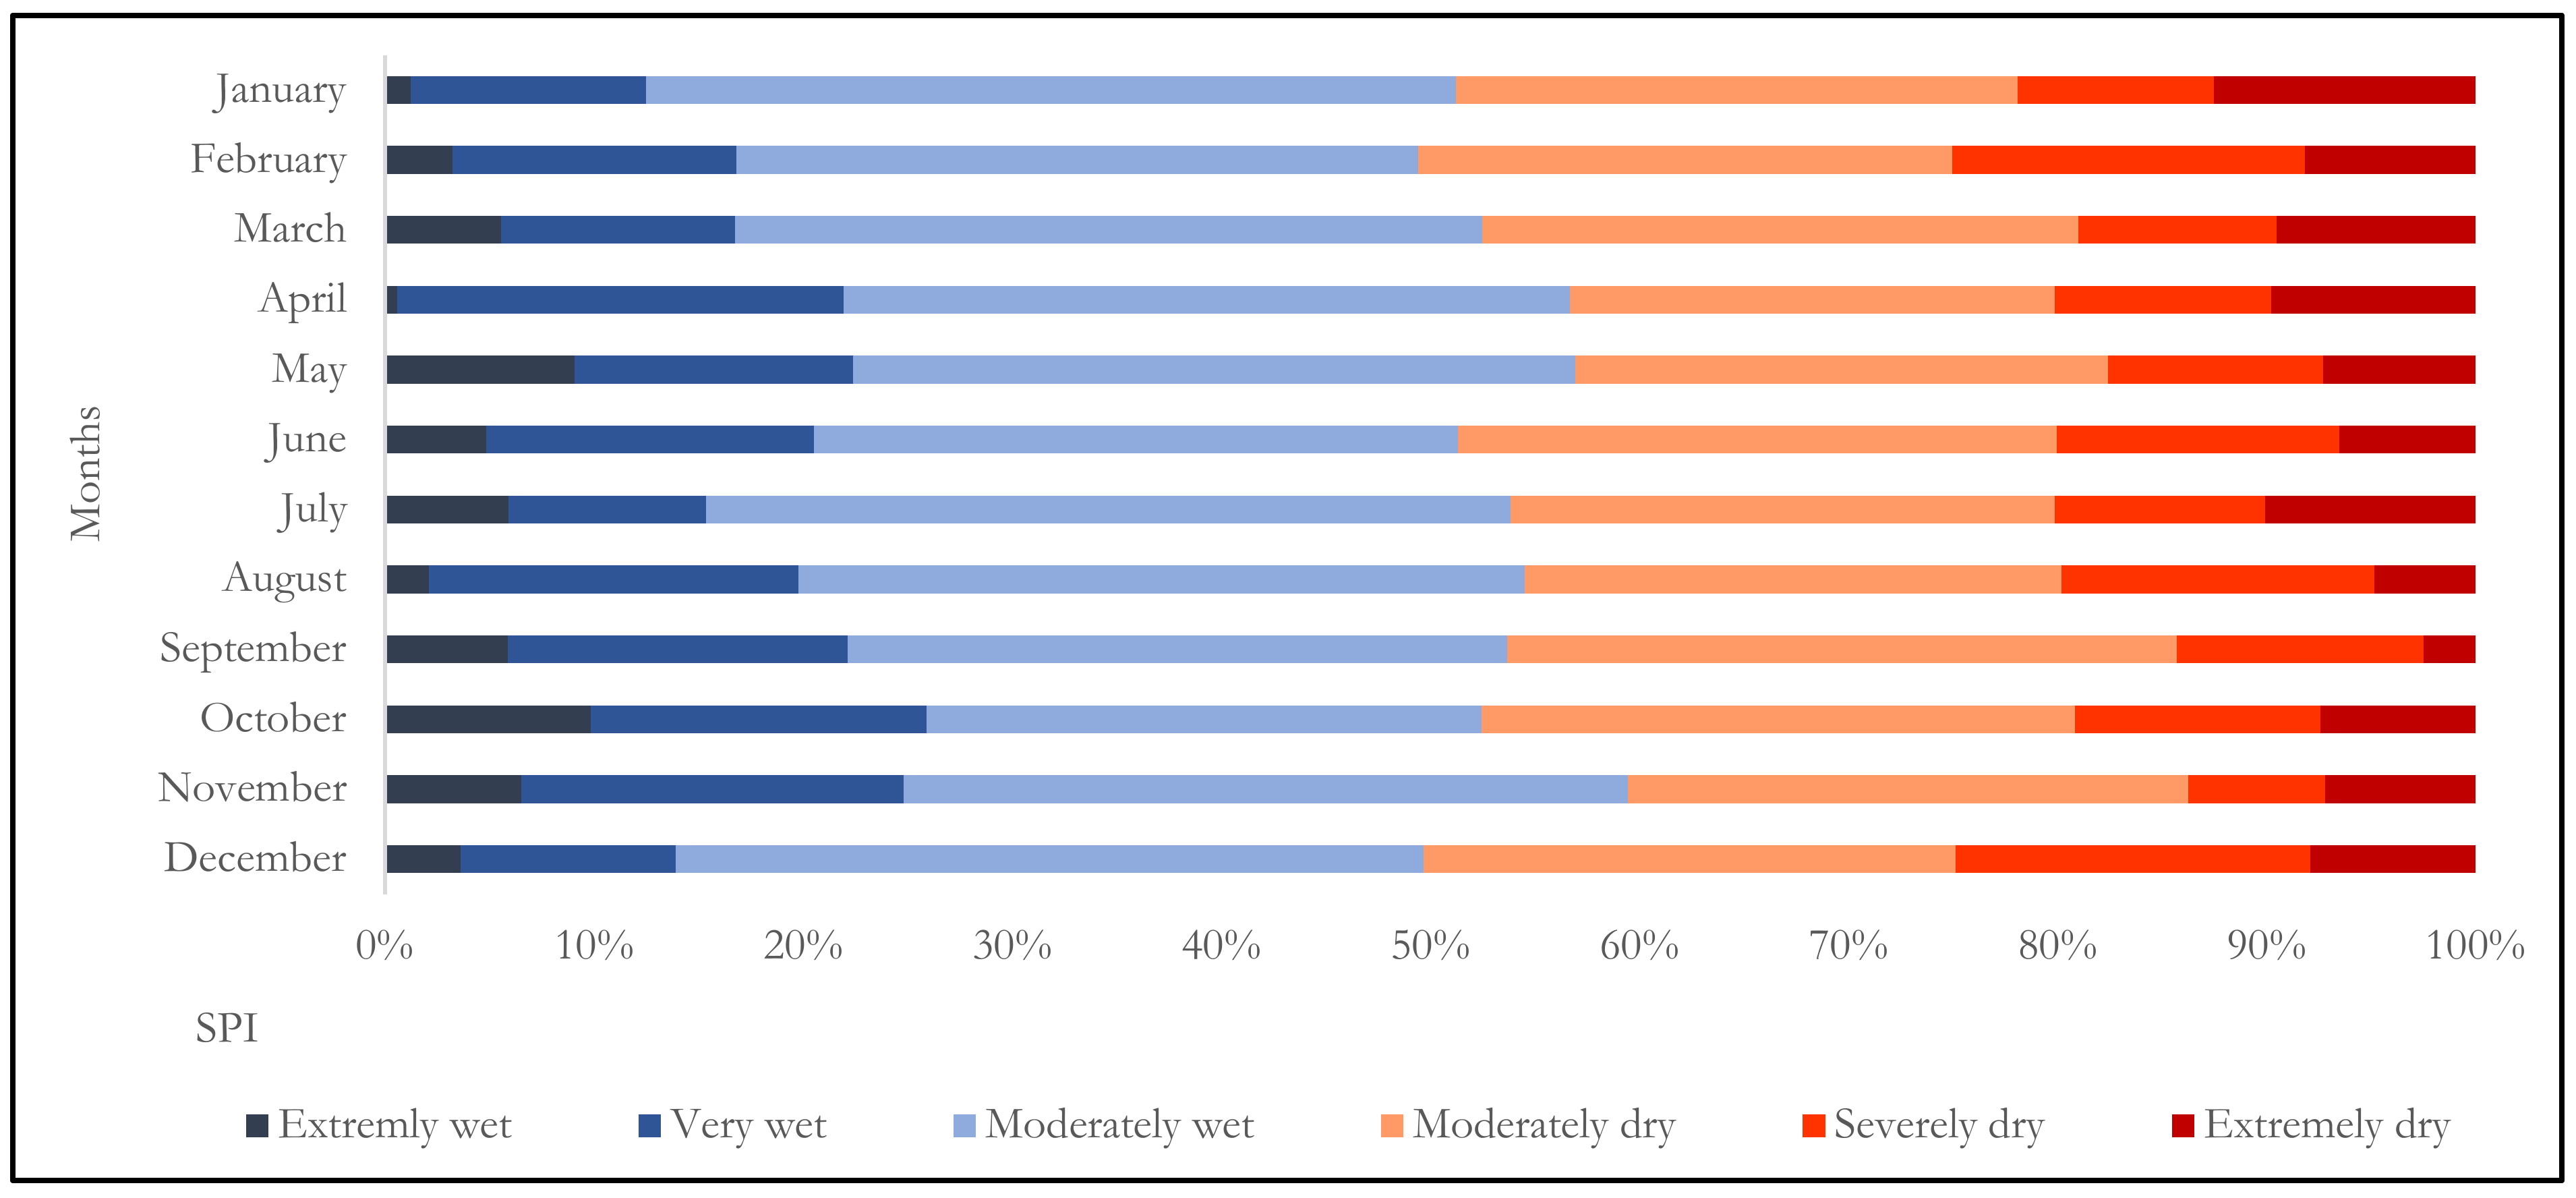
2.4. Meteorological Drought Analysis

SPI, the most widely adopted and recognized parameter for characterizing meteorological drought, was described in [55] for various time periods (1, 3, 6, 12, 24, and 48 months) [56]. Meteorological drought monitoring (MDM) software was developed in [57] to count and analyze drought with a high cross-correlation coefficient (R2 > 0.90). In this study, we calculated monthly and yearly SPI from the datasets of 12 MSs. The SPI index was classified into 7 categories: >2, extremely wet; 1.5 to 1.99, very wet; 1.0 to 1.49, moderately wet; −0.99 to 0.99, near normal; −1.0 to −1.49, moderately dry; −1.5 to −1.99, severely dry; and ˂−2, extremely dry.
CE refers to the inclination of the climate to create conditions that contribute to wind erosion. This study adopted a widely used equation [58] to calculate climatic erosivity:
C E = 1 100 i = 1 di u ¯ 3 E T P i P i E T P i U i .
where ū is monthly mean wind speed (m/s), ETPi is monthly potential evapotranspiration (mm), Pi is monthly precipitation (mm), and di is the number of days per month. ETPi is calculated by Equation (4), described in [59]:
E T P i = 0.19 ( 20 + T i ) 2   1 r i
where Ti is average monthly temperature (°C) and ri is monthly humidity.

3. Results

3.1. Trends in Variations of Climatic Parameters

The spatial distribution and variation of P within the study area show a significant discrepancy, with Pmeanmaxa of 869 mm (PE) and Pmeanmina of 523 mm (NR, KM, SC) (Figure 2a). The ra value oscillated during the year between 68 and 86%, with the lowest values in April–August and the highest in November–January. The spatial and temporal variation ranged from 72.1% (BA) to 77.78% (MY), with a minimum in 2003 (70.2%) and a maximum in 1966 (78.4%) (Figure 2b). Tmeanmin occurred in 2007 at SE station, which is also the MS with the lowest Tmeanmin (8.7 °C). Tmeanmax occurred at all stations within the last 7 years of the study period (2015–2019), with the highest (14.09 °C) at MY station. Tmeanmax occurred at SI (11.18 °C). The warmest months were May–September, accounting for 12–18% of Tmeanmax (Figure 2c).
Tmeana in the area shows a noticeable rise of +1.75 °C (R2 = 0.47) for the whole study period (1961–2019) (Figure 3). In the 1960s, Tmeana was 9.34 °C, but after 2010, it reached 11.09 °C. Although Tmeana fluctuated over the years, an overall positive trend can be identified even within decades. The first decade (1961–1969) is characterized by a 0.19 °C increase and the last one (2000–2019) by a 0.66 °C increase. Pmean shows a slightly increasing trend. The first three decades show a decreasing trend of up to −4.6%, but in the last two decades (2001–2010 and 2011–2019) the precipitation amount increased to +6.63% and +6.53%, respectively.
The temporal changes and spatial distribution of Umean were analyzed. The results show that the dominant wind direction was NE (24%), followed by NW (14%) and SWW (7%). As Uer plays an important role in wind erosion occurrence, the trend of wind speed shown by Umaxmean and Umeana from all available data was analyzed (Figure 4). Umeana was 2.74 m/s (max. 3.1 m/s in 1962, 1964, and 1965 and min. 2.4 m/s in 2016). Umaxmean was 10.35 m/s (max. 13.7 m/s in 1962 and min. 7.4 m/s in 2018). There was an obvious decline in Umaxmean from 1961 to 2019, with a decrease value of −0.05 m/s/year (R2 = 0.32), although the Umeana trend shows no visible changes. These results correlate with decadal analysis, which showed that Umaxmean in last two decades (2001–2010 and 2011–2019) was the lowest among all decades at 10.1 and 9.22 m/s, respectively. However, Uer analysis shows a significant increase in frequency (R2 = 0.34) during the study period, with a smaller decrease within the last four years.
The decadal analysis of seasonal periods did not show high variation during the study period. The proportion of Uer in the four seasons was 26, 21, 25, and 28%, with CV ranging from 5.9% (spring) to 9.1% (winter).
A comparison of the Umaxmean results for the whole study period and the last decade shows that the central belt of the study area is characterized by an increasing trend (Figure 5); however, the total temporal trend shows a decline by −1.13 m/s in the last decade.

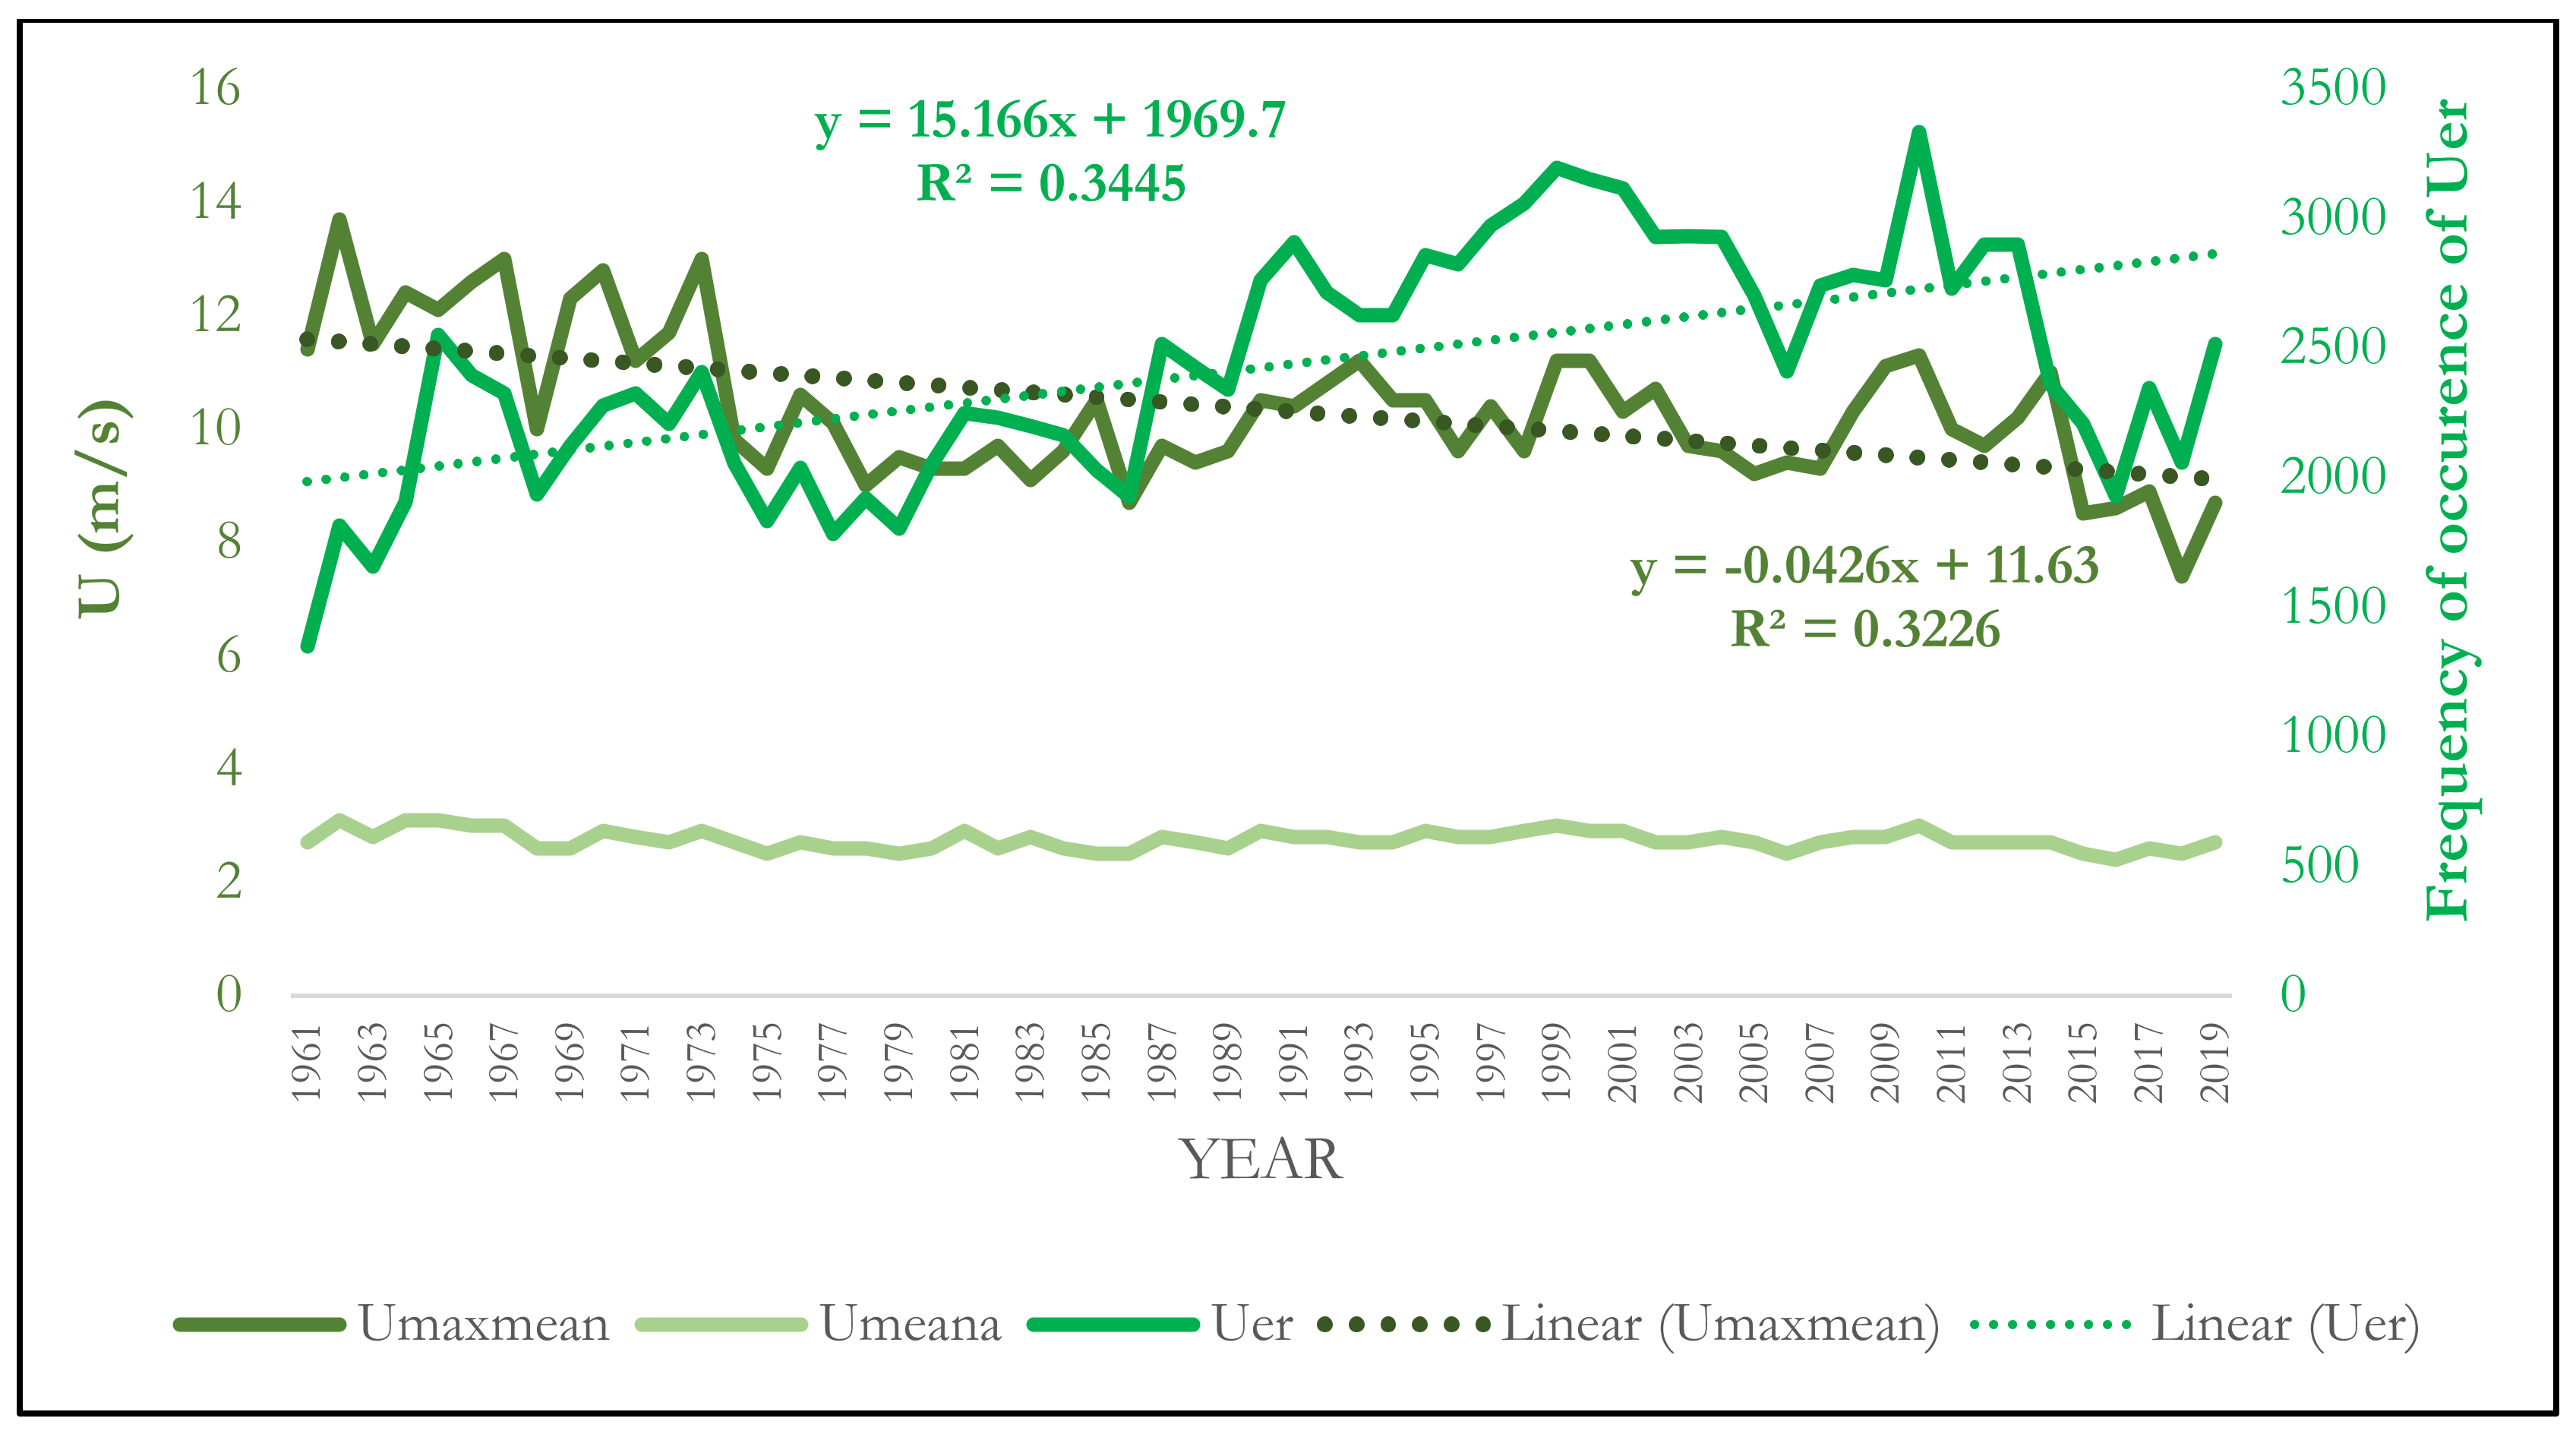
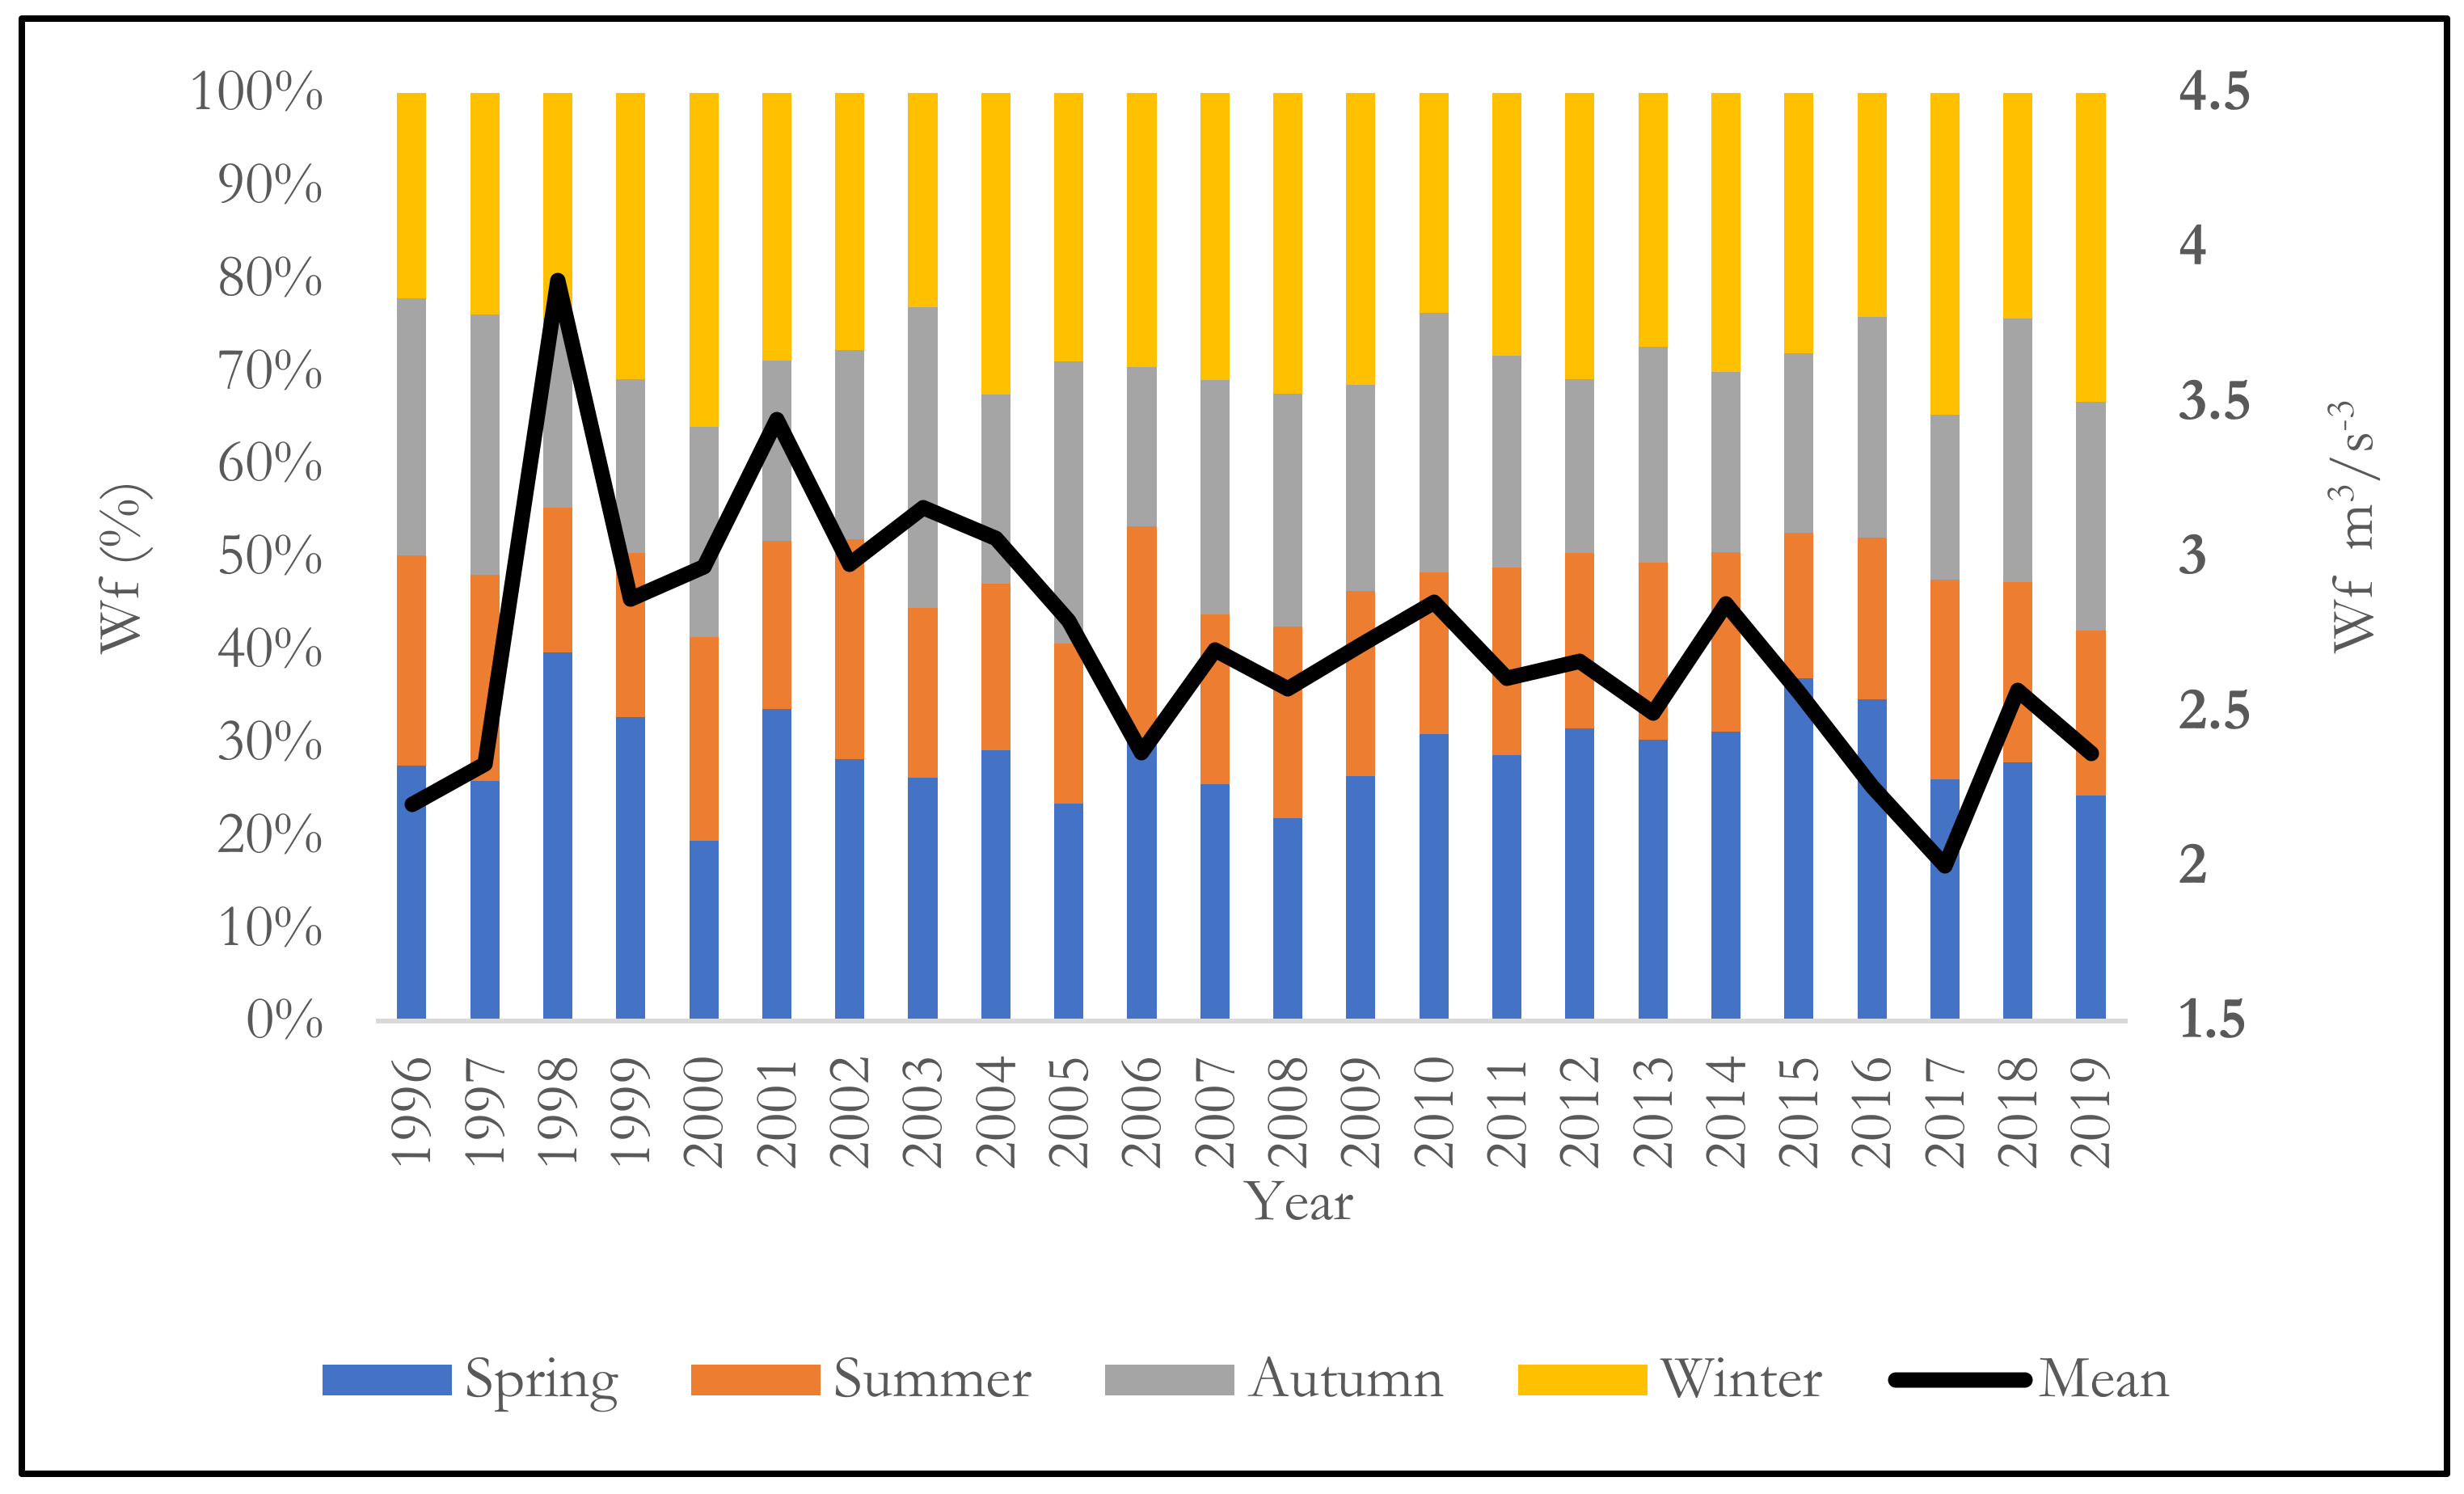
3.2. Trends in U and Wf Parameters

It was found that with regard to total wind occurrence (calculated from daily 7 AM, 2 PM, and 9 PM measurements) Umean values of <5, 5–6, 6–7, 7–8, and 8–9 m/s accounted for 87, 5.7, 3.4, 1.8, and 1%, respectively. Umean > 9 m/s accounted for less than 0.5%. Frequent Uer occurred mostly in spring (March, April) and autumn (October, November). Uer occurrence was less frequent in summer (July, August) (Figure 6).
To clarify the fluctuation of Wf, an analysis of Uer occurrence was performed based on the following scenarios: (a) Pmax < 0.1 mm within 5–10 days and Umean > 5 m/s; (b) Pmax < 0.1 mm within 10–19 days and Umean > 5 m/s; and (c) Pmax < 0.1 mm for >20 days and Umean > 5 m/s (Figure 7). The data show no significant change in the trend line in any of the analyzed scenarios during the study period. The mean number of days per year with Uer (Duer) in scenario a varies between 17.63 in 1961–1970 and 21.22 in 1971–1980, and 19.16 in the last decade. In scenario b, Duer varies from 4.91 in the last decade to 7.13 in 1971–1980, and in scenario c values vary between 0.17 in 1961–1970 and 1.02 in 1971–1980, and 0.3 in the last decade.
The analysis of the frequency of Uer occurrence in months with possible wind erosion occurrence in Slovakia across the decades shows that in the last decade, Uer occurred in March 95, 97, and 100% of the time in scenarios a, b, and c, respectively (Figure 8). However, the previous decade (2001–2010) showed different results. Erosive winds occurred 57, 20, and 20% of the time in March, April, and May, respectively. The ratio between spring and autumn Uer occurrence was 98:2 during the whole study period.
The seasonal and temporal variability of Wf (Figure 9) varied significantly between 1996 and 2006. Wf showed an increasing trend in the first two decades by +11.86% and +3.66% and a decreasing trend during the last decade by −8.49%. The highest Wf (3.14 m3/s−3) was found for spring, and the lowest for summer (2.07 m3/s−3).
The decadal variations of Wf showed the highest increase mainly in the northern part of the study area during the last decade, up to 95.21% (Figure 10). About 46% of the study area showed a decrease in Wf (up to −12.96%; mean −2.22%, SD 3.51) and 54% of the area showed an increase in Wf (mean +10.34%, SD 17.92).
The correlation coefficient between Wf and Uermean confirms the assumption that the occurrence and frequency of Uer are important factors in wind erosion events (Figure 11).

3.3. Variation of SPI Trend

To detect the role and effect of drought on wind erosion, the region’s drought was analyzed over a period of 58 years using MDM software to calculate monthly and yearly SPI from the datasets of 12 MSs. Supplementary Table S2 shows that drought occurred in the years when the SPI index reached negative values. The trend analysis shows that it differed at each station. At least one MS moderate drought was observed for 21 years, severe drought for 9 years, and extreme drought for 6 years. The decadal analysis showed that the frequency of dry periods (severely and extremely dry) slightly increased in the last two decades (Figure 12).
The SPI changes are related to some seasonal periods (Figure 13), whereas extremely dry and extremely wet periods can occur at any time of the year. Annual SPI exhibited a very slight increasing trend, but with no significance except BA and MA stations. The results are not significant, as SPI values move toward near normal and oscillate in both directions.

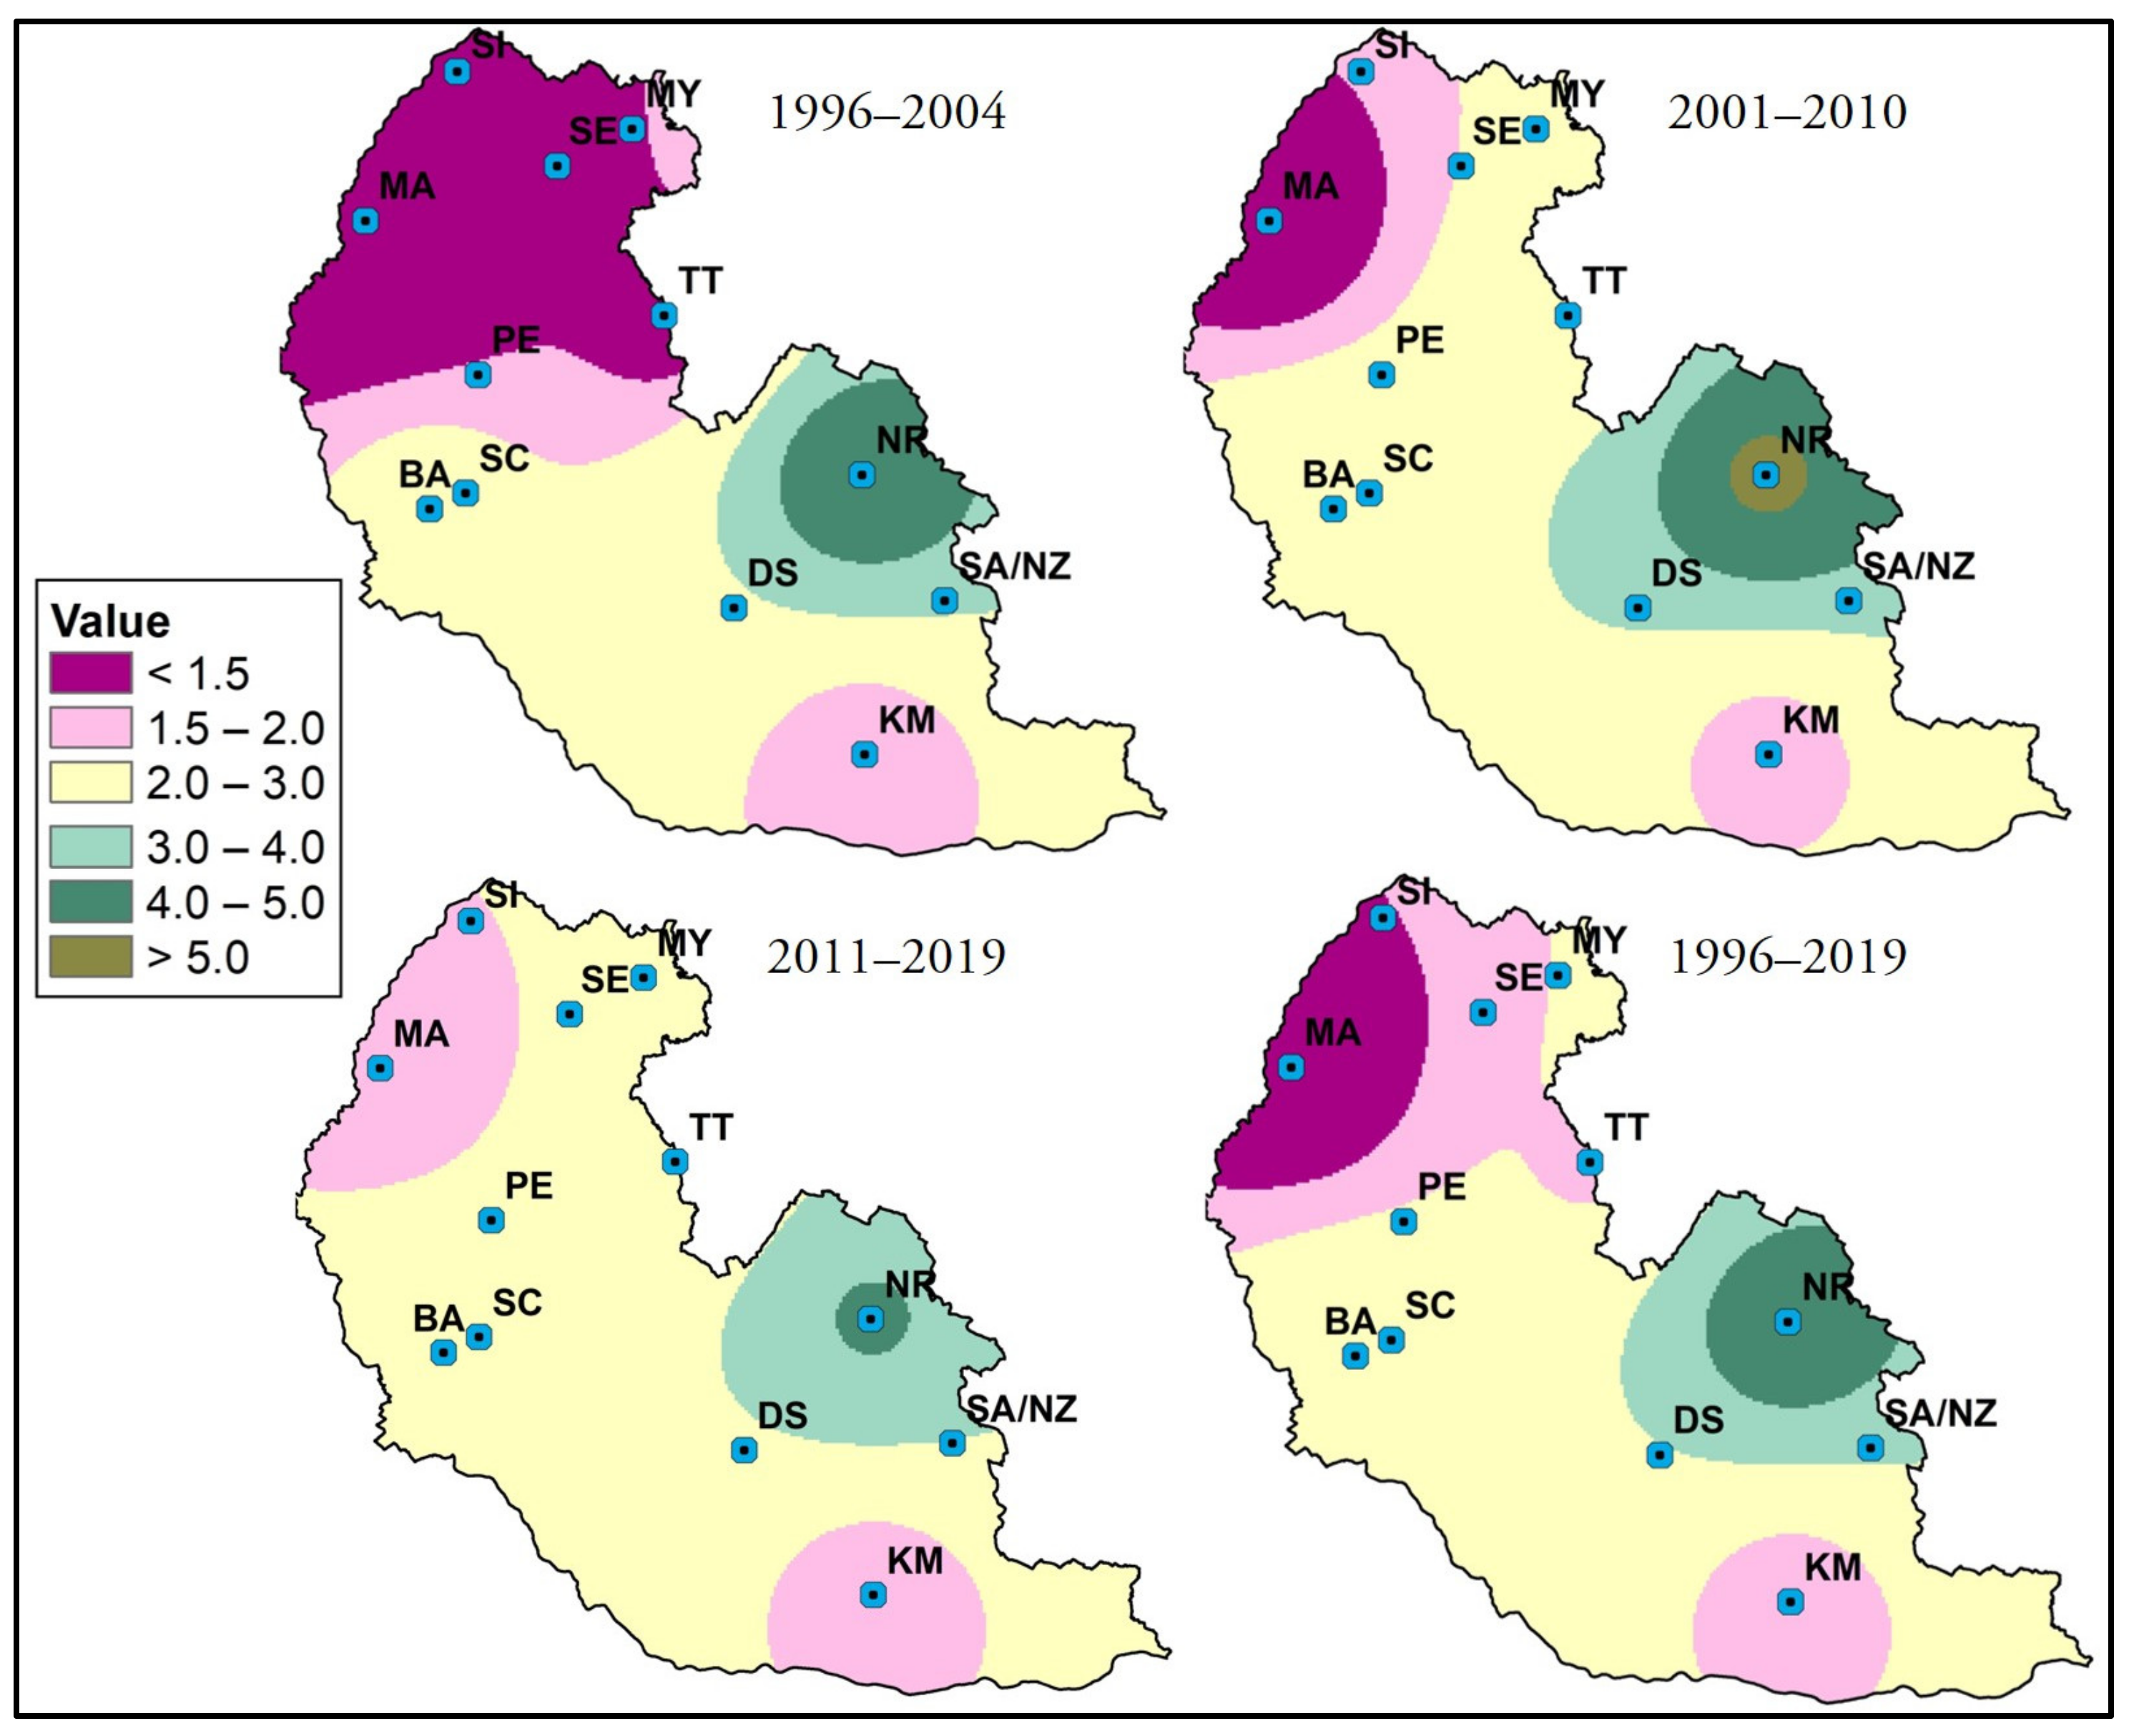
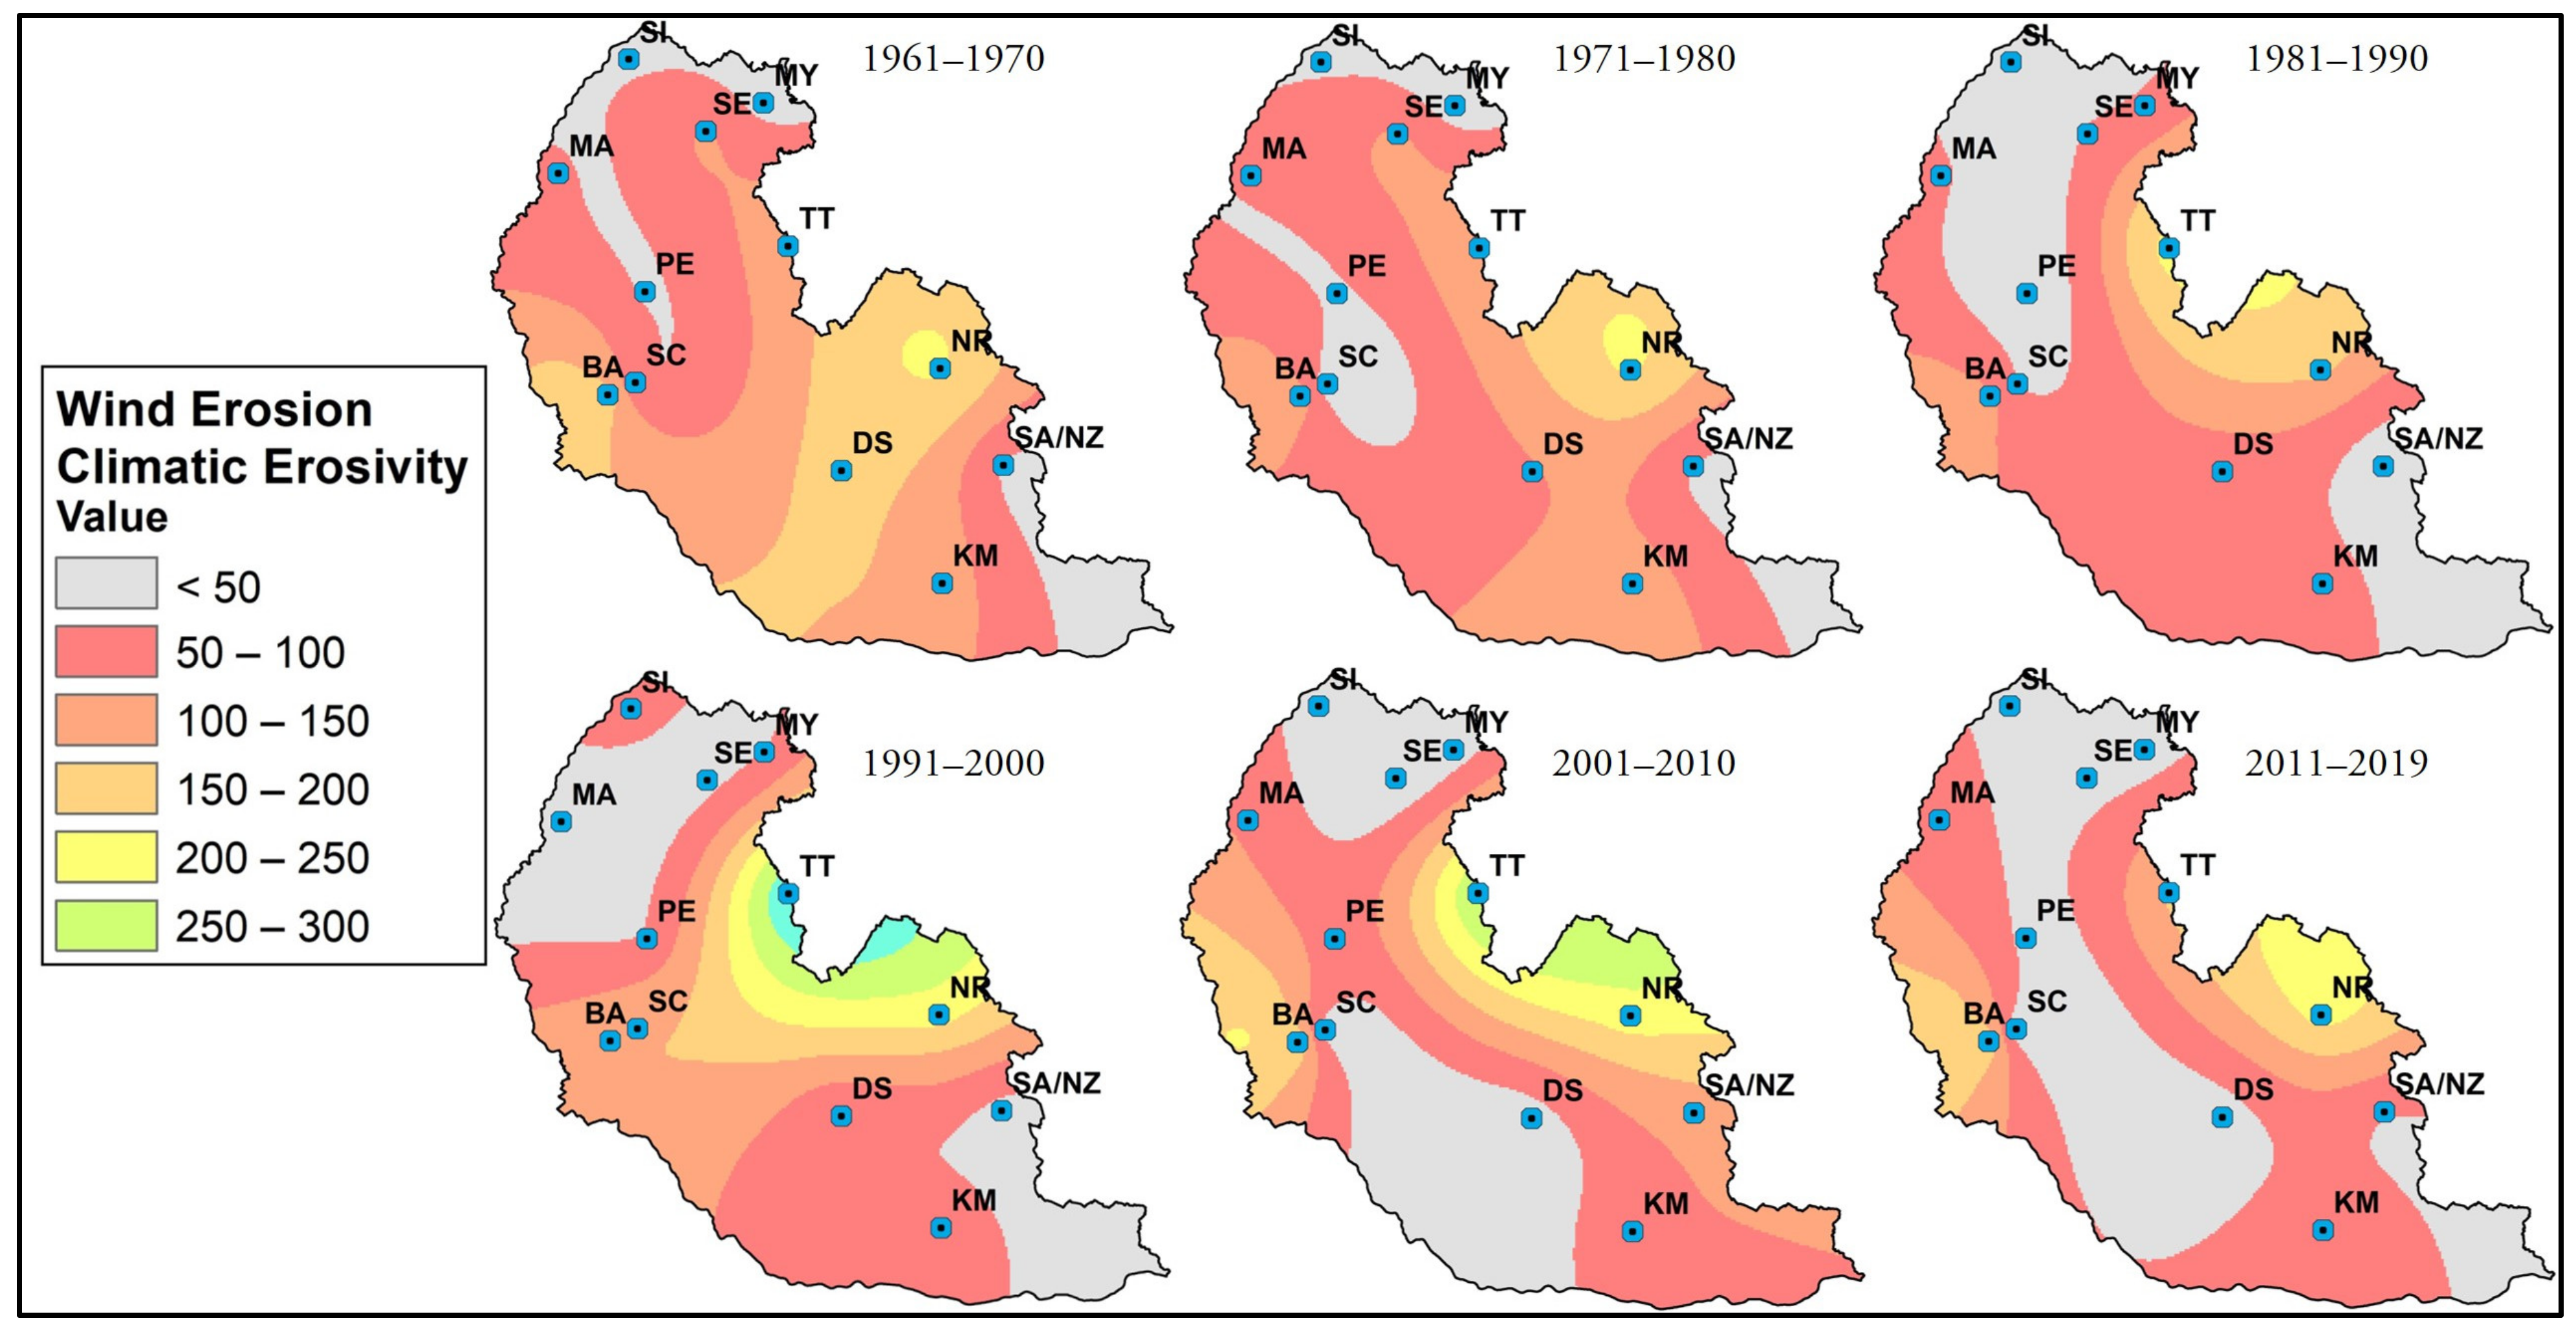
3.4. Variation of CE Trend

CEmeana for each MS was obtained by calculating monthly CE (CEm) from daily datasets. Spatial maps of 58-year CEmeana and decadal CE (CEd) were generated by the ArcGIS Topo to Raster method (Figure 14). Since U is the key element of Wf, the change in CE in the study area shows a high correlation with Umaxmean (R2 = 0.95).
CEmeana (for the whole study region) ranged from 58.4 to 171.31, with an average of 98. SD varied over years between 34 and 119, which also confirms high temporal fluctuation. CEmeana fluctuated until 1973, after which it rapidly decreased until 1987, when it went above average again. A similar shift occurred between 2012 and 2016, when the value decreased to a minimum value again. This trend also correlates well with Umaxmean (Figure 15). The evaluation of the total monitored period shows a slight decreasing trend of CEmeana, but with no great significance.
However, there was a clear fluctuation in CEmean during the year. CEmean is characterized by strong seasonality, with the highest value in spring (March, April, May), representing a considerable proportion of annual CE (34.5%), and the smallest ratio in summer (17.5%). During springtime, wind erosion occurs as a combination of Uer (9.78%) and less P (23%); on the contrary, during the summer, the concentration of P is higher (33%) and the frequency of Uer is lower (4.33%). In addition to monthly values, yearly CEmean values also showed high oscillation. The second and third decades are characterized by a decreasing trend, followed by a period of increasing values, and the last two decades are characterized by a downward trend (Figure 16).
In conclusion, during the whole study period, Umaxmean declined by 2.47 m/s and r by 3.09%, and Tmeana increased by 1.75 °C and Pmeana by 50.5 mm. These changes culminated in a 6% decline in CEmeana, and we assume the most significant parameter causing this decline was Umaxmean.

4. Discussion

In Europe, the impacts of climate change are already being felt, and the impacts on wind erosion and associated soil degradation are a growing concern. The report on Climate Change in Europe highlights that the most vulnerable regions are those in the south and southeast, where heatwaves and droughts are expected to become more severe in frequency and intensity [60].
The intensity and frequency of wind have changed as a result of climate change, with varying consequences. The variations of Wf in the present research show an increase in about 54% of the study area during the last decade, with the highest increase in the northern part, up to 95.2% (Figure 10). In addition, Uer analysis showed that there was a significant increase in frequency (R2 = 0.34) during the study period, with a smaller decrease within the last four years (Figure 4). So far, a definite conclusion regarding various wind pattern forecasts cannot be drawn. First, the near-surface wind speed will decrease over the Northern Hemisphere as the global warming level increases by 1.5–4.0 °C [61]. A decrease in global near-surface wind speeds, likely driven by changes in large-scale atmospheric circulation patterns associated with global warming, has also been observed [16]. Furthermore, a decrease in wind speed can have a substantial impact on reducing soil wind erosion, and temperature and precipitation were also found to have significant correlations with soil wind erosion [62]. On the contrary, wind speeds are likely to increase in many regions of the world, and the frequency of extreme wind events may also increase [14]. An increase in airflow originating from warmer directions was observed when the periods 1961–1990 and 1991–2020 were compared [63]. Moreover, the decadal 10 m wind speeds were stronger than average in the 1990s in Northern Europe and in the 1980s and 2010s in Southern Europe [64].
Europe has experienced severe drought in recent years and drought periods are becoming more frequent and severe in many regions [65]. SPI has increased over the past decade on two-thirds of the Europe continent, which indicates a trend toward drier conditions in those regions. The increase in SPI is particularly pronounced during the summer months, when high temperatures and increased evapotranspiration rates can exacerbate drought conditions [66]. Drought can also have a secondary effect of increasing the likelihood of wind erosion by reducing vegetation cover and increasing soil exposure. Much uncertainty remains about the complex physical connections between climate change, wind speed, and other extreme weather events [67].
The annual SPI in this study exhibited a slight increasing trend, with significant increases at BA and MA stations. The decadal analysis showed that the frequency of dry periods (severely and extremely dry) also slightly increased in the last two decades (Figure 12). Southern European regions including the Czech Republic, Slovakia, Hungary, Romania, Moldova, and Southern Poland experienced a similar drying trend. Moreover, a trend of increasing SPI was detected in Romania, Moldova, and Hungary, particularly in September and October [68]. In 2016–2018, the severity of soil moisture drought in large parts of Central and Northern Europe was extremely high, and the drought in 2018 was one of the most severe droughts in 253 years (1766–2018) in Germany, Czech Republic, Slovakia, Baltic countries, and Sweden [69]. It is predicted that the occurrence of severe or extreme droughts will substantially increase in comparison to the recent past, particularly in the Iberian Peninsula, Eastern Europe, and Mediterranean regions, and exceptional drought occurrences such as those in the past will likely happen again in the near future and toward the end of the century [70]. The increased frequency of dry days and extreme temperature events is a contributing factor to wind erosion susceptibility.
Calculation using a semi-empirical model with increased T by 1 °C predicted an increase in wind erosion by 31 t/km2/y [21]. An increasing climatic erosivity index has been confirmed in several studies across Europe [28,43,71,72] and the strong correlation between wind erosivity and changes in temperature and precipitation patterns, with high wind erosivity values typically occurring during dry and warm periods, indicates a higher potential for wind erosion.
However, a significant decline in soil erosion rates in the future scenario compared to historical data was found, which was likely due to a combination of factors, including changes in climate patterns and surface characteristics [39].
Future climate change could lead to increased erosivity (Figure 14) and wind erosion in some regions. A moderate change in sensitivity to wind erosion in the 21st century is expected due to the impact of climate change in Hungary [28]. Changes in temperature and precipitation patterns could lead to significant changes in wind erosion potential, with the highest erosion hazard occurring in areas with low precipitation and high temperatures. The combination of increased wind speed and erosivity could also lead to increased dust storms and desertification, particularly in Mediterranean and Eastern European regions. The potential for aeolian processes to have a significant effect could be increased by longer-term stresses and responses to climate change, such as decreased productivity, increased moisture deficits, and transitions from grass to shrub vegetation [73].
The complexity of factors responsible for wind erosion intensity and occurrence unconditionally requires more studies, especially in Europe, to draw conclusions on the extent to which climate change will have an impact on wind erosion. The importance of land use and land cover change in the context of climate change was highlighted in [74]. Land use change can directly affect the susceptibility of soil to wind erosion. Furthermore, the complexity of the relationship between wind erosion and climate change makes it difficult to accurately predict future trends in wind erosion [4]. This points out the need for further research to improve our understanding of wind erosion and its relationship with climate change.

5. Conclusions

In this research, two indices, SPI and Wf, were applied to detect the effect of climate change on CE by evaluating its spatiotemporal variation at the seasonal and annual scale in Western Slovakia over 58 years. The results indicate that Wf, Uer, and Umaxmean have a strong impact on CE change both spatially and temporally. Umean is projected to have minimal changes and Umaxmean will be lower, but the frequency of Uer occurrence shows an increasing trend. A significant decline in Umaxmean will lead to a decrease in CE; however, a small increase in drought frequency and severity during the study period was observed, so we assume that the combination of lower Umaxmean with more frequent drought occurrences will lead to milder recurrent wind erosion events. In this study, the climate parameters reflect various effects on CE regarding climate change; however, further research on the potential impacts of climate on wind erosion will be important in order to adjust land sustainability and management in response to these changes. The important role of climate parameters in assessing wind erosivity during drought periods also confirms the importance of research focused on this topic and highlights the need to correlate wind erosion rates with both indices. Obviously, there are other driving forces of wind erosion events, which should also be the subject of deeper research in relation to climate change.

Supplementary Materials

The following supporting information can be downloaded at https://www.mdpi.com/article/10.3390/land12040757/s1. Table S1. Coordinates of meteorological stations; Table S2. SPI for meteorological stations (1961–2019).

Author Contributions

Conceptualization: L.L., T.K. and K.H.; data curation: L.L. and T.K.; formal analysis: L.L. and T.K.; funding acquisition: L.L.; investigation: L.L., T.K. and K.H.; methodology: L.L. and K.H.; validation: T.K.; visualization: L.L.; writing—original draft: L.L.; writing—review and editing: T.K. and K.H. All authors have read and agreed to the published version of the manuscript.

Funding

This research was funded by Integrated Infrastructure Operational Program, ERDF: Scientific support of climate change adaptation in agriculture and mitigation of soil degradation (ITMS2014+ 313011W580), and SUA grant agency no. 09-GASPU-2021: Windbreaks in agricultural landscape—ecological, environmental, and economic value of multifunctional structures acting against soil degradation.

Data Availability Statement

The data presented in this study are available on request from the corresponding author.

Acknowledgments

The authors would like to acknowledge the Slovak Hydrometeorological Institute for providing meteorological data and for their cooperation and support throughout the entire research process.

Conflicts of Interest

The authors declare no conflict of interest.

References

  1. Lou, J.; Wang, X.; Cai, D. Spatial and Temporal Variation of Wind Erosion Climatic Erosivity and Its Response to ENSO in the Otindag Desert, China. Atmosphere 2019, 10, 614. [Google Scholar] [CrossRef] [Green Version]
  2. Wang, X.; Hua, T.; Lang, L.; Ma, W. Spatial differences of aeolian desertification responses to climate in arid Asia. Glob. Planet. Chang. 2017, 148, 22–28. [Google Scholar] [CrossRef] [Green Version]
  3. Yang, F.; Lu, C. Assessing changes in wind erosion climatic erosivity in China’s dryland region during 1961–2012. J. Geogr. Sci. 2016, 26, 1263–1276. [Google Scholar] [CrossRef]
  4. Yue, S.; Yang, R.; Yan, Y.; Yang, Z.; Wang, D. Spatial and temporal variations of wind erosion climatic erosivity in the farming-pastoral zone of Northern China. Theor. Appl. Climatol. 2019, 135, 1339–1348. [Google Scholar] [CrossRef]
  5. Zhang, F.; Wang, J.; Zou, X.; Mao, R.; Gong, D.; Feng, X. Wind Erosion Climate Change in Northern China During 1981–2016. Int. J. Disaster Risk Sci. 2020, 11, 484–496. [Google Scholar] [CrossRef]
  6. Bai, Z.G.; Dent, D.L.; Olsson, L.; Schaepman, M.E. Global Assessment of Land Degradation and Improvement. 1. Identification by Remote Sensing; Report 2008/01; ISRIC—World Soil Information: Wageningen, The Netherlands, 2008. [Google Scholar]
  7. Zhao, H.; Zhang, F.; Yu, Z.; Li, J. Spatiotemporal variation in soil degradation and economic damage caused by wind erosion in Northwest China. J. Environ. Manag. 2022, 314, 115121. [Google Scholar] [CrossRef]
  8. Chappell, A.; Webb, N.P.; Leys, J.F.; Waters, C.M.; Orgill, S.; Eyres, M.J. Minimising soil organic carbon erosion by wind is critical for land degradation neutrality. Environ. Sci. Policy 2019, 93, 43–52. [Google Scholar] [CrossRef]
  9. Iturri, L.A.; Avecilla, F.; Hevia, G.G.; Buschiazzo, D.E. Comparing adjacent cultivated and “virgin” soils in wind erosion affected environments can lead to errors in measuring soil degradation. Geoderma 2016, 264, 42–53. [Google Scholar] [CrossRef]
  10. Zarrinabadi, E.; Lobb, D.A.; Koiter, A.J.; Goharrokhi, M. Assessment of the effects of land rolling on wind erosion and crop growth in soybean production in the Red River Valley, Canada. Soil Tillage Res. 2022, 222, 105439. [Google Scholar] [CrossRef]
  11. Tan, J.; Wu, X.; Zeng, F.; Li, X.; Feng, M.; Liao, G.; Sha, R. Effects of crop residue on wind erosion due to dust storms in Hotan Prefecture, Xinjiang, China. Soil Tillage Res. 2022, 221, 105387. [Google Scholar] [CrossRef]
  12. Duniway, M.C.; Pfennigwerth, A.A.; Fick, S.E.; Nauman, T.W.; Belnap, J.; Barger, N.N. Wind erosion and dust from US drylands: A review of causes, consequences, and solutions in a changing world. Ecosphere 2019, 10, e02650. [Google Scholar] [CrossRef] [Green Version]
  13. Bartkowski, B.; Schepanski, K.; Bredenbeck, S.; Müller, B. Wind erosion in European agricultural landscapes: More than physics. People Nat. 2022, 5, 34–44. [Google Scholar] [CrossRef]
  14. Jung, C.; Schindler, D. Changing Wind Speed Distributions under future global climate. Energy Convers. Manag. 2019, 198, 111841. [Google Scholar] [CrossRef]
  15. Andres Martin, M.; Yu, Y.; Shen, C.; Azorin-Molina, C.; Deng, K.; Bedoya-Valestt, S.; Utrabo-Carazo, E. Projected changes in near-surface wind speed over Iberian Peninsula and associated atmosphere-ocean oscillations. In Proceedings of the EGU General Assembly 2022, Vienna, Austria, 23–27 May 2022. [Google Scholar] [CrossRef]
  16. Deng, K.; Azorin-Molina, C.; Minola, L.; Zhang, G.; Chen, D. Global near-surface wind speed changes over the last decades revealed by reanalyses and CMIP6 model simulations. J. Clim. 2021, 34, 2219–2234. [Google Scholar] [CrossRef]
  17. Piao, S.; Wang, X.; Park, T.; Chen, C.; Lian, X.; He, Y.; Bjerke, J.W.; Chen, A.; Ciais, P.; Tømmervik, H.; et al. Characteristics, drivers and feedbacks of global greening. Nat. Rev. Earth Environ. 2020, 1, 14–27. [Google Scholar] [CrossRef] [Green Version]
  18. IPCC. Climate Change 2021: The Physical Science Basis. Contribution of Working Group I to the Sixth Assessment Report of the Intergovernmental Panel on Climate Change; Masson-Delmotte, V., Zhai, P., Pirani, A., Connors, S.L., Péan, C., Berger, S., Caud, N., Chen, Y., Goldfarb, L., Gomis, M.I., et al., Eds.; IPCC: Geneva, Switzerland, 2021. [Google Scholar]
  19. Ma, X.; Zhao, C.; Zhu, J. Aggravated risk of soil erosion with global warming—A global meta-analysis. Catena 2021, 200, 105129. [Google Scholar] [CrossRef]
  20. Li, Z.; Fang, H. Impacts of climate change on water erosion: A review. Earth-Sci. Rev. 2016, 163, 94–117. [Google Scholar] [CrossRef]
  21. Gao, Q.; Ci, L.; Yu, M. Modelling wind and water erosion in northern China under climate and land use changes. J. Soil Water Conserv. 2002, 57, 46. [Google Scholar]
  22. McTainsh, G.H.; Leys, J.F.; O’Loingsigh, T.; Strong, C.L. Wind Erosion and Land Management in Australia during 1940–1949 and 2000–2009. In Report Prepared for the Australian Government Department of Sustainability, Environment, Water, Population and Communities on Behalf of the State of the Environment 2011 Committee; DSEWPaC: Canberra, Australia, 2011. [Google Scholar]
  23. Ashkenazy, Y.; Yizhaq, H.; Tsoar, H. Sand dune mobility under climate change in the Kalahari and Australian deserts. Clim. Chang. 2012, 112, 901–923. [Google Scholar] [CrossRef]
  24. Liddicoat, C.; Hayman, P.; Alexander, B.; Rowland, J.; Maschmedt, D.; Young, M.-A.; Hall, J.; Herrmann, T.; Sweeney, S. Climate Change, Wheat Production and Erosion Risk in South Australia’s Cropping Zone: Linking crop Simulation Modelling to Soil Landscape Mapping; Government of South Australia, through Department of Environment, Water and Natural Resources: Adelaide, Australia, 2012.
  25. Lemmen, D.S.; Vance, R.E.; Wolfe, S.A.; Last, W.M. Impacts of Future Climate Change on the Southern Canadian Prairies: A Paleoenvironmental Perspective. Geosci. Can. 1997, 24, 121–133. [Google Scholar]
  26. Munson, S.M.; Belnap, J.; Okin, G.S. Responses of wind erosion to climate-induced vegetation changes on the Colorado Plateau. Proc. Natl. Acad. Sci. USA 2011, 108, 3854–3859. [Google Scholar] [CrossRef] [PubMed] [Green Version]
  27. Böhner, J.; Riksen, M.; Böhner, J.; Gross, J. Impact of land use and climate change on wind erosion: Prediction of wind erosion activity for various land use and climate scenarios using the WEELS wind erosion model. In Waldproduktivität-Kohlenstoffspeicherung-Klimawandel WP-KS-KW View Project PADUCO II View Project Impact of Land Use and Climate Change on Wind Erosion: Prediction of Wind Erosion Activity for Various Land Use and Climate Scenarios Using the WEELS Wind Erosion Model; ESW Publications: Wageningen, The Netherlands, 2004. [Google Scholar]
  28. Mezősi, G.; Blanka, V.; Bata, T.; Ladányi, Z.; Kemény, G.; Meyer, B. Assessment of future scenarios for wind erosion sensitivity changes based on ALADIN and REMO regional climate model simulation data. Open Geosci. 2016, 8, 465–477. [Google Scholar] [CrossRef] [Green Version]
  29. Négyesi, G.; Lóki, J.; Buró, B.; Bertalan-Balázs, B.; Pásztor, L. Wind erosion researches in Hungary—Past, present and future possibilities. Hung. Geogr. Bull. 2019, 68, 223–240. [Google Scholar] [CrossRef] [Green Version]
  30. Li, J.; Ma, X.; Zhang, C. Predicting the spatiotemporal variation in soil wind erosion across Central Asia in response to climate change in the 21st century. Sci. Total Environ. 2020, 709, 136060. [Google Scholar] [CrossRef]
  31. Pouyan, S.; Ganji, A.; Behnia, P. Regional analysis of wind climatic erosivity factor: A case study in fars province, southwest Iran. Theor. Appl. Climatol. 2011, 105, 553–562. [Google Scholar] [CrossRef]
  32. Huang, J.; Yu, H.; Guan, X.; Wang, G.; Guo, R. Accelerated dryland expansion under climate change. Nat. Clim. Chang. 2016, 6, 166–171. [Google Scholar] [CrossRef]
  33. Jiang, Y.; Gao, Y.; Dong, Z.; Liu, B.; Zhao, L. Simulations of wind erosion along the Qinghai-Tibet Railway in north-central Tibet. Aeolian Res. 2018, 32, 192–201. [Google Scholar] [CrossRef]
  34. Wiggs, G.; Holmes, P. Dynamic controls on wind erosion and dust generation on west-central Free State agricultural land, South Africa. Earth Surf. Process. Landf. 2011, 36, 827–838. [Google Scholar] [CrossRef]
  35. Kouchami-Sardoo, I.; Shirani, H.; Esfandiarpour-Boroujeni, I.; Bashari, H. Application of a Bayesian belief network model for assessing the risk of wind erosion: A test with data from wind tunnel experiments. Aeolian Res. 2019, 41, 100543. [Google Scholar] [CrossRef]
  36. Evans, S.; Ginoux, P.; Malyshev, S.; Shevliakova, E. Climate—Vegetation interaction and amplification of Australian dust variability. Geophys. Res. Lett. 2016, 43, 823–830. [Google Scholar] [CrossRef] [Green Version]
  37. Hand, J.L.; White, W.H.; Gebhart, K.A.; Hyslop, N.P.; Gill, T.E.; Schichtel, B.A. Earlier onset of the spring fine dust season in the southwestern United States. Geophys. Res. Lett. 2016, 43, 11823–11830. [Google Scholar] [CrossRef] [Green Version]
  38. Lee, J.A.; Gill, T.E. Multiple causes of wind erosion in the Dust Bowl. Aeolian Res. 2015, 19, 15–36. [Google Scholar] [CrossRef]
  39. Sharratt, B.S.; Tatarko, J.; Abatzoglou, J.T.; Fox, F.A.; Huggins, D. Implications of climate change on wind erosion of agricultural lands in the Columbia plateau. Weather. Clim. Extrem. 2015, 10, 20–31. [Google Scholar] [CrossRef] [Green Version]
  40. Chepil, W.S.; Siddoway, F.H.; Armbrust, D.V. Climatic factor for estimating wind erodibility of farm fields. J. Soil Water Conserv. 1962, 17, 165–174. [Google Scholar]
  41. Skidmore, E.L. Wind erosion climatic erosivity. Clim. Chang. 1986, 9, 195–208. [Google Scholar] [CrossRef]
  42. Funk, R.; Reuter, H.I. Wind Erosion. In Soil Erosion in Europe; Boardman, J., Poesen, J., Eds.; Wiley: Chichester, UK; Hoboken, NJ, USA, 2006; pp. 563–582. ISBN 047085910. [Google Scholar]
  43. Středová, H.; Podhrázská, J.; Chuchma, F.; Středa, T.; Kučera, J.; Fukalová, P.; Blecha, M. The Road Map to Classify the Potential Risk of Wind Erosion. ISPRS Int. J. Geo-Inf. 2021, 10, 269. [Google Scholar] [CrossRef]
  44. Pryor, S.C.; Barthelmie, R.J.; Young, D.T.; Takle, E.S.; Arritt, R.W.; Flory, D.; Gutowski, W.J.; Nunes, A.; Roads, J. Wind speed trends over the contiguous United States. J. Geophys. Res. 2009, 114, D14. [Google Scholar] [CrossRef]
  45. Zou, X.; Li, H.; Liu, W.; Wang, J.; Cheng, H.; Wu, X.; Zhang, C.; Kang, L. Application of a new wind driving force model in soil wind erosion area of northern China. J. Arid Land 2020, 12, 423–435. [Google Scholar] [CrossRef]
  46. Van Donk, S.J. Wind erosion control. In Proceedings of 2004 Spring Field Day; Kansas State University Northwest Extension Center: Colby, KS, USA, 2004; pp. 22–24. [Google Scholar]
  47. Guo, Z.; Zobeck, T.M.; Stout, J.E.; Zhang, K. The effect of wind averaging time on wind erosivity estimation. Earth Surf. Process. Landf. 2012, 37, 797–802. [Google Scholar] [CrossRef]
  48. Pryor, S.C.; Schoof, J.T.; Barthelmie, R.J. Winds of change? Projections of near—Surface winds under climate change scenarios. Geophys. Res. Lett. 2006, 33, 11. [Google Scholar] [CrossRef] [Green Version]
  49. Outten, S.; Sobolowski, S. Extreme wind projections over Europe from the euro-CORDEX regional climate models. Weather Clim. Extrem. 2021, 33, 100363. [Google Scholar] [CrossRef]
  50. O’Loingsigh, T.; McTainsh, G.H.; Parsons, K.; Strong, C.L.; Shinkfield, P.; Tapper, N.J. Using meteorological observer data to compare wind erosion during two great droughts in eastern Australia. The World War II Drought (1937–1946) and the Millennium Drought (2001–2010). Earth Surf. Process. Landf. 2015, 40, 123–130. [Google Scholar] [CrossRef]
  51. World Meteorological Organization. Standardized Precipitation Index User Guide; Svoboda, M., Hayes, M., Wood, D., Eds.; WMO-No., 1090; World Meteorological Organization: Geneva, Switzerland, 2012. [Google Scholar]
  52. Lackóová, L.; Pokrývková, J.; Kozlovsky Dufková, J.; Policht-Latawiec, A.; Michałowska, K.; Dąbrowska, J. Long-Term Impact of Wind Erosion on the Particle Size Distribution of Soils in the Eastern Part of the European Union. Entropy 2021, 23, 935. [Google Scholar] [CrossRef] [PubMed]
  53. Urban, T.; Lackóová, L.; Halászová, K.; Streďanský, J. Wind Erosion in the Agricultural Landscape: The Wind Erosion Equation Used in GIS: Monograph; Wydawnictwo Uniwersytetu Rolniczego: Kraków, Poland, 2013; ISBN 978-83-60633-97-7. [Google Scholar]
  54. Fryrear, D.W.; Bilbro, J.D.; Salehm, A.; Schombergm, H.M.; Stout, J.E.; Zobeck, T.M. RWEQ: Improved wind erosion technology. J. Soil Water Conserv. 2000, 55, 183–189. [Google Scholar]
  55. McKee, T.B.; Doesken, N.J.; Kleist, J. The Relationship of Drought Frequency and Duration to Time Scales. In Proceedings of the 8th Conference on Applied Climatology, Anaheim, CA, USA, 17–22 January 1993; pp. 179–184. [Google Scholar]
  56. Edwards, D.C.; McKee, T.B. Characteristics of 20th Century Drought in the United States at Multiple Time Scales; Climatology Report 97-2; Department of Atmospheric Science, Colorado State University: Fort Collins, CO, USA, 1997. [Google Scholar]
  57. Salehnia, N.; Alizadeh, A.; Sanaeinejad, H.; Bannayan, M.; Zarrin, A.; Hoogenboom, G. Estimation of meteorological drought indices based on AgMERRA precipitation data and station-observed precipitation data. J. Arid. Land 2017, 9, 797–809. [Google Scholar] [CrossRef] [Green Version]
  58. FAO. A Provisional Methodology for Soil Degradation Assessment; Food and Agriculture Organization of the United Nations: Rome, Italy, 1979. [Google Scholar]
  59. Cheng, T.W.; Cheng, W.X. The Methods of Determination and Calculation of Evaporation and Potential Evapotranspiration in Farmland; Geographical Collection (No. 12); Beijing Science Press: Beijing, China, 1980. [Google Scholar]
  60. European Environment Agency. Climate Change in Europe: Impacts, Vulnerabilities and Adaptation in an Uncertain Future; EEA Report No 4/2020; European Environment Agency: Copenhagen, Denmark, 2020. [Google Scholar]
  61. Zha, J.; Shen, C.; Li, Z.; Wu, J.; Zhao, D.; Fan, W.; Sun, M.; Azorin-Molina, C.; Deng, K. Projected changes in global terrestrial near-surface wind speed in 1.5–4.0 °C global warming levels. Environ. Res. Lett. 2021, 16, 114016. [Google Scholar] [CrossRef]
  62. Zhao, C.; Zhang, H.; Wang, M.; Jiang, H.; Peng, J.; Wang, Y. Impacts of climate change on wind erosion in Southern Africa between 1991 and 2015. Land Degrad. Dev. 2021, 32, 2169–2182. [Google Scholar] [CrossRef]
  63. Hoogeveen, J.; Hoogeveen, H. Winds are changing: An explanation for the warming of the Netherlands. Int. J. Climatol. 2022, 43, 354–371. [Google Scholar] [CrossRef]
  64. Laurila, T.K.; Sinclair, V.A.; Gregow, H. Climatology, variability, and trends in near—Surface wind speeds over the North Atlantic and Europe during 1979–2018 based on era5. Int. J. Climatol. 2020, 41, 2253–2278. [Google Scholar] [CrossRef]
  65. Hari, V.; Rakovec, O.; Markonis, Y.; Hanel, M.; Kumar, R. Increased future occurrences of the exceptional 2018–2019 Central European drought under Global Warming. Sci. Rep. 2020, 10, 12207. [Google Scholar] [CrossRef]
  66. Spinoni, J.; Vogt, J.V.; Naumann, G.; Barbosa, P.; Dosio, A. Will drought events become more frequent and severe in Europe? Int. J. Climatol. 2018, 38, 1718–1736. [Google Scholar] [CrossRef] [Green Version]
  67. Seneviratne, S.I.; Nicholls, N.; Easterling, D.; Goodess, C.M.; Kanae, S.; Kossin, J.; Luo, Y.; Marengo, J.; McInnes, K.; Rahimi, M.; et al. Changes in climate extremes and their impacts on the natural physical environment. In Managing the Risks of Extreme Events and Disasters to Advance Climate Change Adaptation; Cambridge University Press: Cambridge, UK, 2012; pp. 109–231. [Google Scholar]
  68. Jaagus, J.; Aasa, A.; Aniskevich, S.; Boincean, B.; Bojariu, R.; Briede, A.; Zahradníček, P. Long-term changes in drought indices in eastern and central Europe. Int. J. Climatol. 2018, 38, e231–e243. [Google Scholar] [CrossRef]
  69. Moravec, V.; Markonis, Y.; Rakovec, O.; Svoboda, M.; Trnka, M.; Kumar, R.; Hanel, M. Europe under multi-year droughts: How severe was the 2014–2018 drought period? Environ. Res. Lett. 2021, 16, 034062. [Google Scholar] [CrossRef]
  70. Grillakis, M.G. Increase in severe and extreme soil moisture droughts for Europe under climate change. Sci. Total Environ. 2019, 660, 1245–1255. [Google Scholar] [CrossRef]
  71. Borrelli, P.; Lugato, E.; Montanarella, L.; Panagos, P. A new assessment of soil loss due to wind erosion in European agricultural soils using a quantitative spatially distributed modelling approach. Land Degrad. Dev. 2016, 28, 335–344. [Google Scholar] [CrossRef] [Green Version]
  72. Panagos, P.; Ballabio, C.; Borrelli, P.; Meusburger, K.; Klik, A.; Rousseva, S.; Tadić, M.P.; Michaelides, S.; Hrabalíková, M.; Olsen, P.; et al. Rainfall erosivity in Europe. Sci. Total Environ. 2015, 511, 801–814. [Google Scholar] [CrossRef] [Green Version]
  73. Edwards, B.; Webb, N.; Brown, D.; Elias, E.; Peck, D.; Pierson, F.; Williams, J.; Herrick, J. Climate change impacts on wind and water erosion on US rangelands. J. Soil Water Conserv. 2019, 74, 405–418. [Google Scholar] [CrossRef] [Green Version]
  74. Seneviratne, S.I.; Wartenburger, R.; Guillod, B.P.; Hirsch, A.; Vogel, M.M.; Brovkin, V.; Van Vuuren, D.P.; Schaller, N.; Boysen, L.; Calvin, K.V.; et al. Climate extremes, land–climate feedbacks and land-use forcing at 1.5°C. Philos. Trans. R. Soc. A Math. Phys. Eng. Sci. 2018, 376, 20160450. [Google Scholar] [CrossRef]
Figure 1. Study area and locations of MSs.
Land 12 00757 g001
Figure 2. Spatial variability of (a) Pmean (mm), (b) rmean (%), and (c) Tmean (°C) during 1961–2019.
Land 12 00757 g002
Figure 3. Tmeana and Pmeana during study period in investigated area.
Land 12 00757 g003
Figure 4. Trends of Umeana, Umaxmean, and Uer frequency during study period.
Land 12 00757 g004
Figure 5. Differences in Umaxmean compared to last decade.
Land 12 00757 g005
Figure 6. Frequency of monthly Uer occurrence within the study period.
Land 12 00757 g006
Figure 7. Yearly Duer occurrence for scenarios a, b, and c.
Land 12 00757 g007
Figure 8. Frequency of Uer occurrence in selected months across decades for scenarios a, b, and c.
Land 12 00757 g008
Figure 9. Seasonal and temporal variability of Wf.
Land 12 00757 g009
Figure 10. Spatiotemporal variations of Wf and mean Wf for the whole study period by decade.
Land 12 00757 g010
Figure 11. Relationship between Uer and Wf.
Land 12 00757 g011
Figure 12. SPI trend by decade.
Land 12 00757 g012
Figure 13. Monthly SPI calculated from study period (1961–2019).
Land 12 00757 g013
Figure 14. Spatiotemporal variation of CE by decade.
Land 12 00757 g014
Figure 15. Relationship between CEmeana and Umaxmean during study period.
Land 12 00757 g015
Figure 16. Changes in CEmean by season and decade during the study period.
Land 12 00757 g016
Table 1. List of meteorological stations and years of data measurements.
MSAbbreviationYears of Meteorological Data
TrnavaTT1961–2019
Bratislava BA1961–2019
Dunajská StredaDS1961–2019
KomárnoKM1961–2019
Šaľa/Nové ZámkySA/NZ1961–2019
SenecSC1961–2019
MyjavaMY1961–2013, 2017
SenicaSE1964–2014, 2017–2019
NitraNR1982–2019
PezinokPE1989–2019
SkalicaSI1989–2017
MalackyMA1997–2019
Disclaimer/Publisher’s Note: The statements, opinions and data contained in all publications are solely those of the individual author(s) and contributor(s) and not of MDPI and/or the editor(s). MDPI and/or the editor(s) disclaim responsibility for any injury to people or property resulting from any ideas, methods, instructions or products referred to in the content.

