Article

Impact of Factors That Predict Adoption of Geomonitoring Systems for Landslide Management

by
Adrian T. Rădulescu
1,
Corina M. Rădulescu
2,*,
Nataliya Kablak
3,
Oleksandr K. Reity
4 and
Gheorghe M. T. Rădulescu
1
1
Faculty of Civil Engineering, Technical University Cluj-Napoca, 72 Observatorului Street, 400641 Cluj-Napoca, Romania
2
Department of Economics and Physics, Faculty of Sciences, Technical University Cluj-Napoca, 76 Victoriei Street, 430122 Baia-Mare, Romania
3
Faculty of Geodesy and Cartography, Warsaw University of Technology, Plac Politechniki 1, 00-661 Warsaw, Poland
4
Department of Algebra and Differential Equations, Uzhhorod National University, 3 Narodna Square, Transcarpathian Region, 88000 Uzhhorod, Ukraine
*
Author to whom correspondence should be addressed.
Land 2023, 12(4), 752; https://doi.org/10.3390/land12040752
Submission received: 5 January 2023 / Revised: 20 March 2023 / Accepted: 23 March 2023 / Published: 27 March 2023

Abstract

:
Monitoring hazardous phenomena is a fundamental requirement of disaster risk management. Using new geomatic technologies integrated into complex geo information systems represents an innovative method of strengthening collaboration between stakeholder groups that aim at reducing the risk of disasters. This paper aimed to investigate the factors of adapting a geomonitoring information system for landslides in the cross-border area of Hungary, Slovakia, Ukraine, and Romania; the analysis was carried out in the case of the cross-border project, GeoSES. This study developed and empirically tested a novel UTAUT model based on the unified theory of acceptance and use of technology. PL-SEM (partial least-squares structural equation modeling) was used to test the model’s hypotheses. The data were collected by employing an online questionnaire on a target group of beneficiaries of the GeoSES project, in which the geomonitoring information system was proposed as an innovative solution to landslide management and disaster risk reduction. This study’s importance and added value reside in the theoretical and practical implications of the proposed model for predicting the beneficiaries’ adaptation of the landslide monitoring system. The results have shown that the GeoSES project beneficiaries coming from four neighboring nations are willing to utilize the integrated monitoring systems, which is one of the strengths of the collaborative efforts focused on mitigating risks and managing disasters in this region.

1. Introduction

Disasters are a permanent threat to sustainable development. Natural and anthropogenic hazards generate numerous losses of life every year, including human and material damage, all of which directly impact economic and social growth.
According to the IFRC Organization, between 2000 and 2019, more than 11,000 disasters resulted in more than 4.2 million deaths, affecting more than 2.9 billion people, and causing estimated damages of USD 4.7 trillion. About 80% of the 11,000 disasters that have been recorded in this database since 2000 happened in the 30 years prior to year 2000, a trend that is becoming worse [1].
The main factor that generates the increase is climate change, which causes more frequent extreme natural phenomena and socioeconomic developments determining vulnerabilities for populations in some regions. These disasters and emergencies tend to exceed the level of development and affect the poorest population disproportionately [2].
Over time, the hazards have changed their pattern, expanded, and became more frequent, becoming increasingly difficult to predict [3].
Landslides provide a significant threat in most hilly regions, as well as coastal and riverside areas. The study and evaluation of landslide risk is a topic that has lately received much attention in the specialized literature [4,5]. This phenomenon’s study approaches cover a wide range of methods and assumptions. For example, to assess the risk of landslides, it is required to understand the spatial and temporal probability of the phenomenon’s occurrence or the susceptibility of a region to the occurrence of landslides [6,7,8].
Regardless of the way the studies are approached, most of their results support the need for effective risk reduction and management solutions; several studies [9,10,11] demonstrate that risk management is essential for forming the link between all elements and entities in the disaster management system, to develop disaster mitigation tools based on prevention and intervention strategies, the transfer and mutual exchange of knowledge, education, and decision-making techniques [12].
Programs the European Union funds set up allow different groups to access them and run projects that help with disaster management [13].
The project extension of the operational Space Emergency System in the Hu-Sk-Ro-Ua cross-border region, GeoSES, had as its final goal the geomonitoring of natural and anthropogenic processes in the cross-border territory to prevent emergencies. Within the project, an integrated geomonitoring system (GeoSES-MS) was developed [14]. The system consists of a WebGIS portal and a mobile application that can be used by the project’s beneficiaries and stakeholders to give current information on risk circumstances in the research region and to serve as a potent emergency decision-making tool.
Although most projects targeted at disaster monitoring have excellent and effective results and products, few studies and little research reflect the beneficiaries’ views regarding the impact of using the products and technologies developed that lower the risk of disasters.
Theories and models of adapting new technologies support the development of an acceptable theoretical and experimental framework for demonstrating the appropriate application of technologies and systems. Ease of use may be a necessary but insufficient criterion for beneficiaries to recognize an innovative solution [15,16,17].
This study addresses this gap by influencing the intention to use geomonitoring information systems.
This study’s novelty, originality, and added value reside in developing a tailored and agile model containing factors of significant relevance for adapting geomonitoring systems for landslides.
This study developed a novel model for adapting the GeoSES geomonitoring system and subsequently tested it, intending to adjust its technical performance on time. The model proposed by the authors is based on the unified theory of acceptance and use of technology (UTAUT). In addition, PL-SEM (partial least-squares structural equation modeling) was used to test the model’s hypotheses.
The model is a valuable tool to capture feedback from beneficiaries and make early adjustments to any misfunction of the system, as coordination and accuracy of the system’s working are essential requirements. Investigating user behavior regarding the acceptance of a new information system has a significant role in evaluating and improving technology in any sector, even more so as this system becomes a means of preventing emergencies.
This article provides scientists and practitioners with a framework for understanding the factors determining the implementation of an information system for landslide monitoring actions and projects.
The flow of the organization of this paper is as follows.
The paper’s objectives and research gap are outlined in the introduction, which is a synthesis of the whole study. The introduction provides a more comprehensive understanding of the problem and expected outcomes. Next, the main theoretical concepts and literature will be discussed to create an adequate framework for the foundation of the proposed analysis model. The empirical study that continues is demonstrating a case study, with the description of the geomonitoring system. It is followed by relevant discussions highlighting the novelty of the proposed approach. Finally, compelling conclusions emphasize the contribution and added value brought by the study to this area of knowledge.

2. Theoretical Framework and Literature Review

Risk is a human and cultural perspective. Consequently, its conceptualization and estimation should be conducted within a risk-benefit analysis and decision-making process to consider vulnerability and technical and socioeconomic details, and the physical component. The risk of landslides is the potential harm to elements in danger. A disaster is a calamity in which harmfulness surpasses the local capability for recovery and necessitates external involvement. When landslides occur, several societal components (people, buildings, economic activity, public services, utility networks) are at risk of being impacted [18].
The basic equation for most disaster research over the past two decades was first published in Blaikie et al. (1994). It was formulated as:
DR = H · V
where disaster risk (DR) is a consequence not just of a hazard (H), but also of the vulnerability (V) of the impact region [19].
As event losses continued, the DRR research community had to demonstrate the relevance of studies to the community, meaning that it is more convergent and balanced. The emergence of disaster science, the new technologies used in risk management, the sophistication of social interactions, and the growth of collaborations among specialists and factors involved in disaster risk reduction demand more interaction between the DRR community and the policy studies community.
Olson et al. (2020) [20] propose an equation-based bridging effort to promote more coherent and expanded participation:
EmR/DR/CatR = H + Ex · V,
where emergency risk (EmR), disaster (DR) or catastrophe (CatR) is caused by a community’s hazard or hazards (H), as well as its human and asset exposures (Ex) to such dangers, as well as the vulnerabilities (V) of those risks.
Hurlbert et al. (2019) argue that to the extent the risk cannot be avoided, the only alternative is implementing a risk management strategy. Risk management aims to reduce the impact of disasters, including lowering the risk of human life, property damage, and environmental degradation. The first step in these solutions is determining and evaluating the hazards involved [21].
Wachinger et al. (2013) state that risk management is an administrative responsibility involving adherence to statutory, regulatory, and economic requirements. When faced with a disaster, most people act primarily on their subjective perception of the risk, rather than considering objective actions [22].
According to Chang et al. (2018) [23], the integration of the subsystems with evidence of the component modules and the interaction between them is a significant contribution to the implementation of such a complex system. The latter is an integrative system of mathematical, simulation, and control models for assessing environmental risk, natural disasters (floods, landslides, drought, etc.), and their consequences. These elements lead to [24]:
The development of an early warning system for the occurrence of natural disasters, and a system in internet technology intended for the management of information on the evolution of disruptive factors;
The development of an expert system for risk management;
The development of pilot systems for managing and disseminating information regarding the population’s safety.
Geo information and remote sensing are suitable tools for improving operational strategies for natural hazard prevention and assisting disaster-focused research and operations. Advanced Earth observation techniques and geomatics technologies are essential to studying natural risks and associated disasters [25].
Geomonitoring is a structured research activity that entails gathering and evaluating data and information using specific instruments. In disaster risk management, the use of Earth observation (EO) products and geo-information systems (GIS) has become integrated and effective [26].
Hazard and risk assessments are conducted at several analysis levels, ranging from global to local. Each of these levels has its inventory objectives and spatial data needs for dangers, environmental data, triggers, and elements at risk.
Using spatial data to analyze and model various hazards is one of the most useful geoinformatics applications in hazard monitoring [27].
The response time of all factors coordinating rescue operations is a critical criterion for the success of disaster management. Because of this, it is necessary to use information systems, and all parties involved must be willing to accept and use them [28].
Examining user activities to determine the acceptance of a new information system is crucial in evaluating and building a superior information system for usage in any industry [29].
Several earlier studies [30,31,32] utilized information system models and employed various instruments to determine the acceptance and improvement of the tested application’s technology. Various researchers [33,34,35,36] have focused on different technology acceptance models and incorporated one or two dependent or independent variables and/or moderating variables that affect the intention to use technology determinants. The latter concludes with the factors that influence technology adaptation in various contexts. The theory of planned behavior (TPB), technology acceptance model versions 1, 2, and 3, the theory of reasoned action (TRA), the diffusion of innovation theory, and the unified theory of acceptance and use of technology (UTAUT) are the most well-known theories and models that have been widely accepted and applied to explain technology acceptance.
There are several differences between the theory of planned behavior (TPB), theory of reasoned action (TRA), unified theory of acceptance and use of technology (UTAUT), and technology acceptance model (TAM) models in terms of:
  • Focus: TPB and TRA models focus on the behavior of individuals, the diffusion of innovation theory focuses on the different stages of technology adoption, while UTAUT and TAM models focus on the acceptance and use of technology.
  • Variables: TPB and TRA models consider three variables: attitude, subjective norm, and perceived behavioral control. The TAM model considers two variables: perceived usefulness and perceived ease of use, while UTAUT has some distinctive features, but also some advantages. UTAUT is a comprehensive model that explores several factors influencing user adoption of technology, including performance expectancy, effort expectancy, social influence, as well as facilitating conditions.
  • Individual vs. social factors: TPB and TRA models primarily focus on individual factors while UTAUT and TAM models also integrate social factors such as social influence and facilitating conditions
  • Complex moderating and mediating effects: UTAUT is known for the complex moderating effects arising from the interplay of its four core constructs. It is difficult to predict the behavior of end users without considering factors related to the technology, the organization, and the social context in which the user is situated.
  • Applicability: TPB and TRA models can be applied to a wide range of behaviors, including technology-based behaviors. UTAUT and TAM models are more specifically targeted toward understanding the adoption and use of technology.
  • Contextual differences: TAM is more suitable for investigating user acceptance of technology in a controlled environment, while UTAUT is more appropriate for examining technology adoption in a real-world context.
In summary, while TPB and TRA models consider individual-level factors to predict behavior, UTAUT and TAM models, on the other hand, attempt to provide a comprehensive framework that integrates both individual and social factors. UTAUT and TAM models are both useful for examining technology adoption, usage, and other technology-related behaviors while taking both individual and social factors into account.
While UTAUT is a powerful model, its application should be evaluated based on the specific research question and context at hand. Researchers should choose the model that best fits their research question and objectives.
In this study, a modified UTAUT model was used. The UTAUT model aims to assess the users’ intention to implement technology [37]. However, numerous studies dispute the original theory’s underlying components. Various research studies have identified the model’s single subject, such as community or organization, person, or age range, as its most significant limitation. Despite criticism of the UTAUT model, it can be successfully used for technological adoption prediction.
UTAUT outperforms all other models using the same data, explaining more than 70% of the variance in behavioral intention and more than 50% in technology use [38]. Prior research has validated the UTAUT model’s applicability in the geomatics sciences [39,40].

3. Materials and Methods

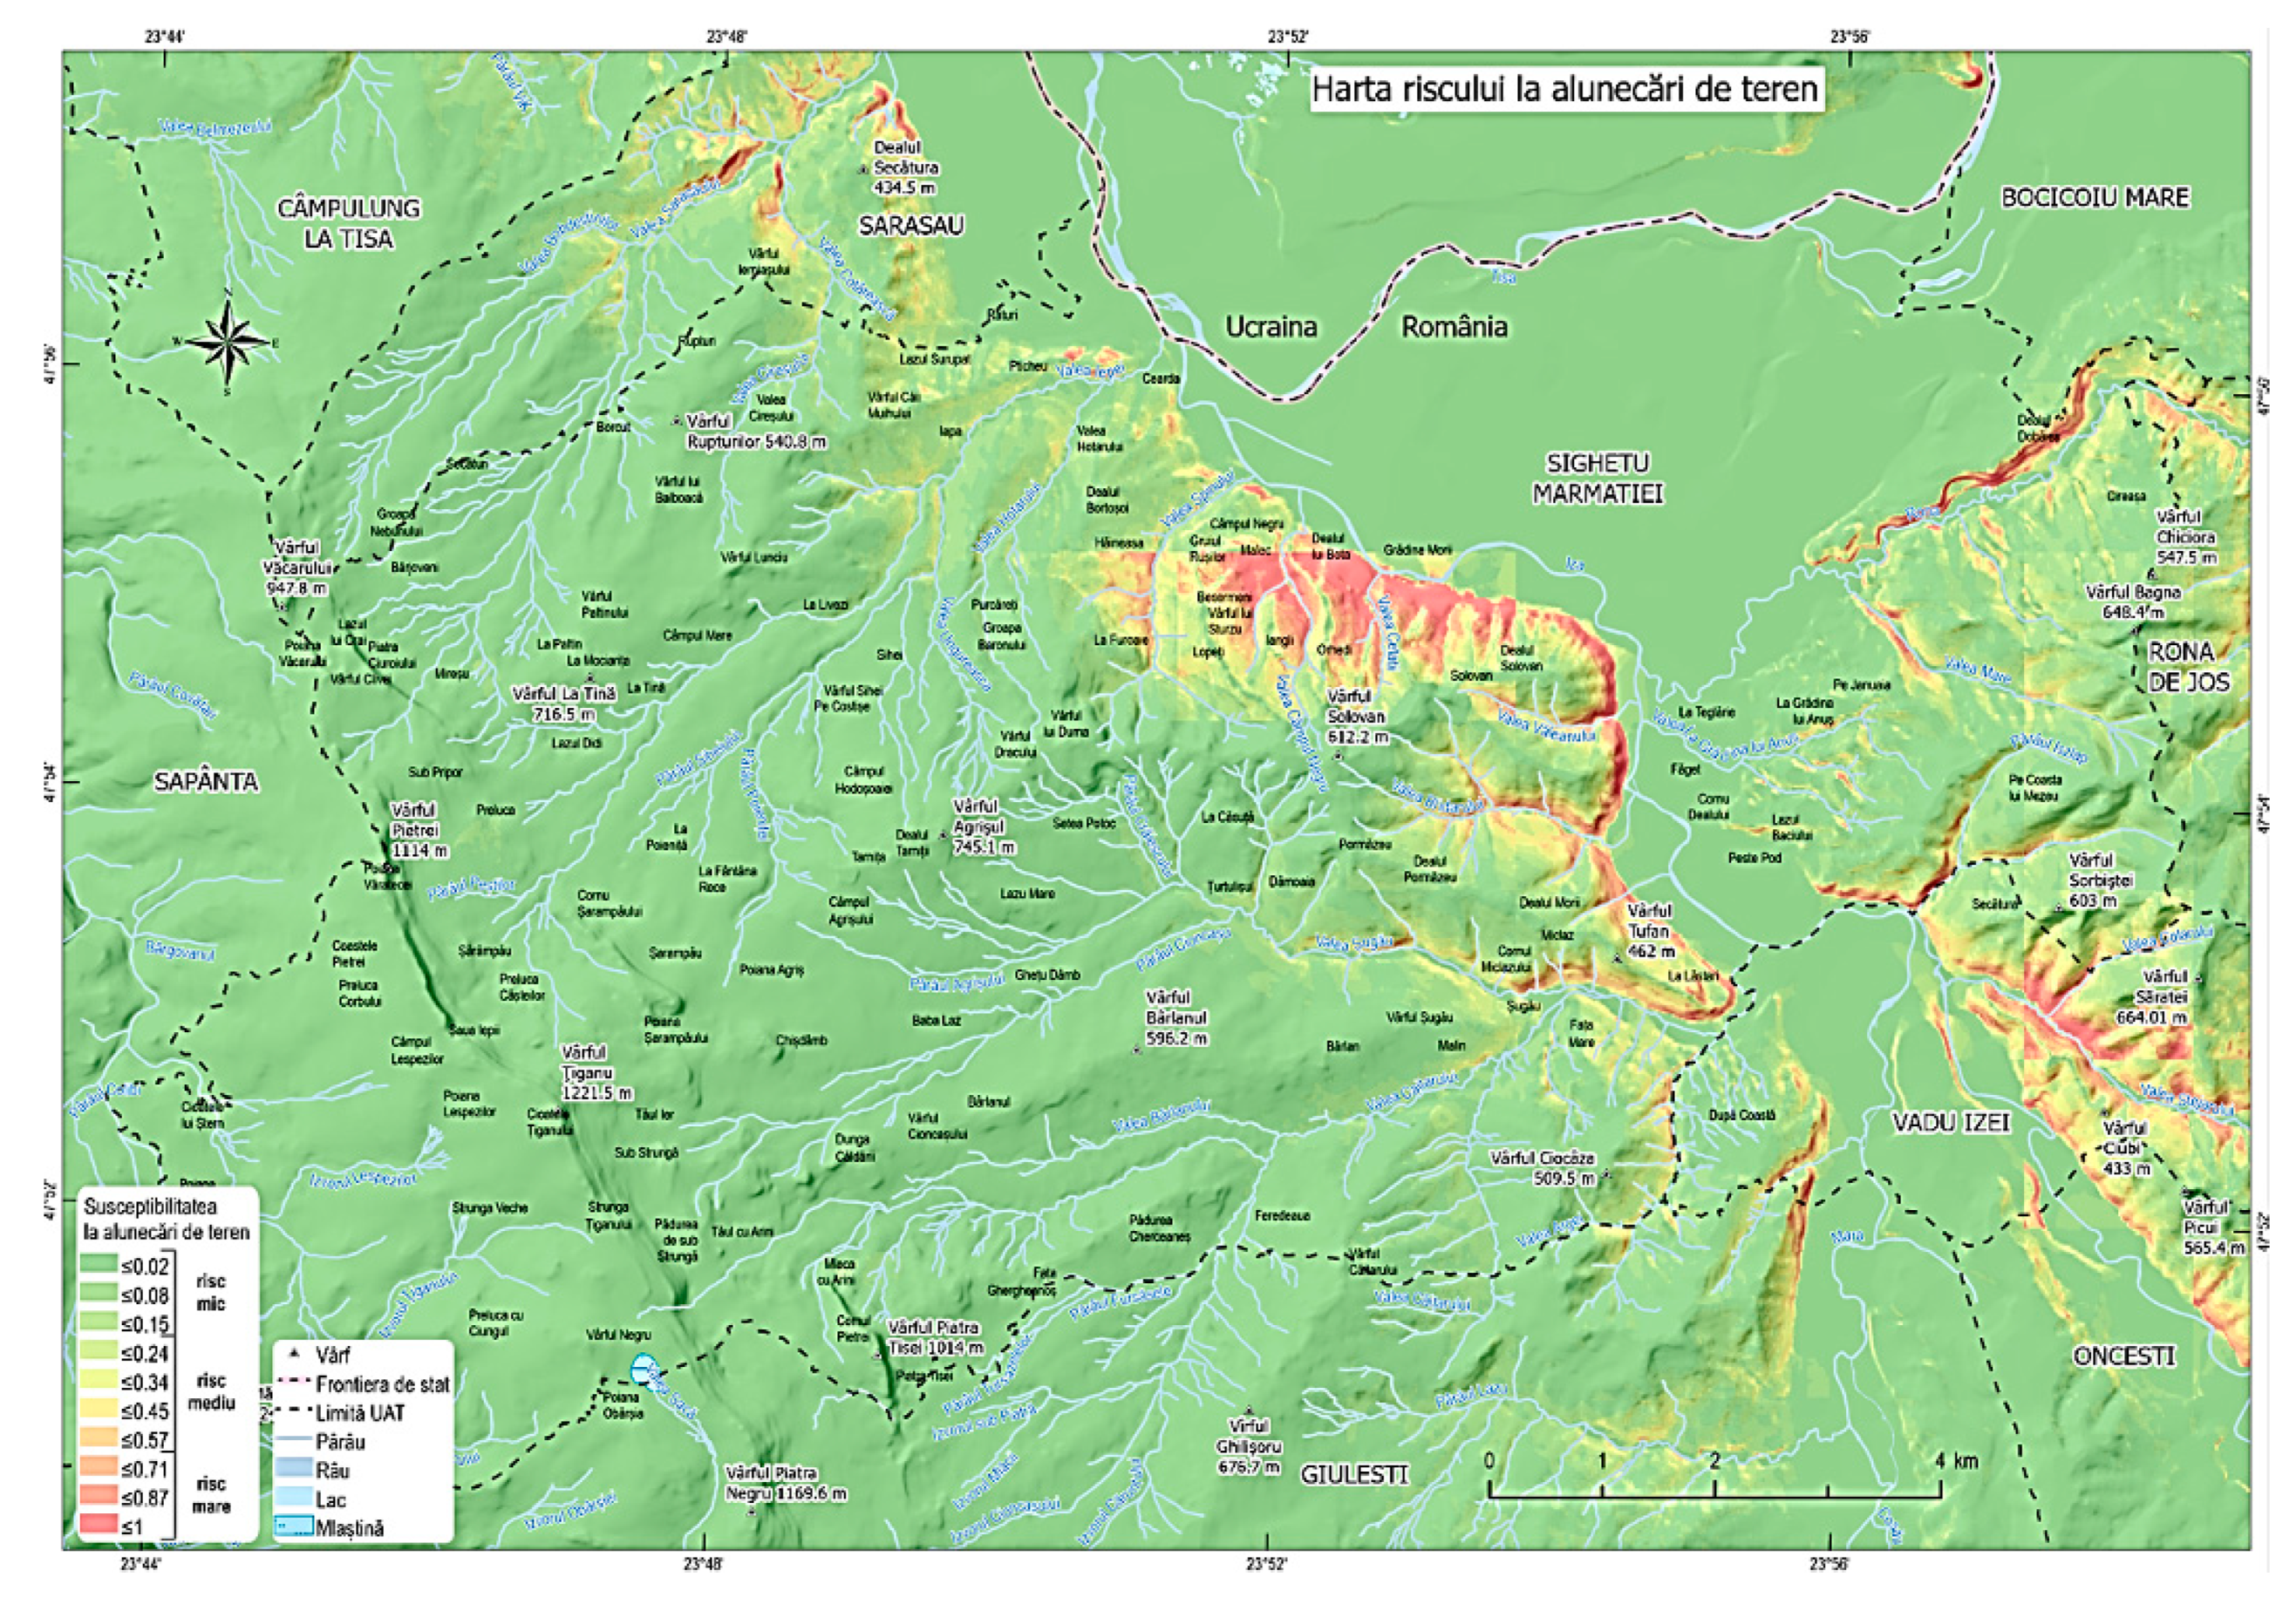
3.1. Overview of the Case Study

The border area between Romania, Hungary, Slovakia, and Ukraine is prone to landslides [41,42,43]. This new setting, in which human society’s global impact on the environment is crucial at the local and cross-border level, requires adapting technical and informational systems for disaster management and thus, cross-border initiatives are valuable instruments for development of projects aimed at examining and monitoring options for landslides [13].
The research on monitoring landslides was performed within the framework of the GeoSES project [41,43,44]. Within the project, an integrated geomonitoring system of landslides in this area was developed. Based on the deformation history of the persistent scatterers, areas with significant subsidence or deformations were identified. An inventory of around 120 locations was carried out [44]. In order to fulfill the requirements of the project, six Romanian locations, four Ukrainian locations, and two Slovakian locations were selected [44]. The study area is presented in Figure 1. The centers of the monitored locations in Romania and Ukraine are marked with yellow pointers.
By structuring natural disaster geodatabases and developing a WebGIS portal, the research findings of GeoSES project were able to validate early impact models and aid in disaster management.
The integrated geomonitoring system is a valuable result of the GeoSES project and enables a quality and long-term connection between the project partners, beneficiary authorities/stakeholders.

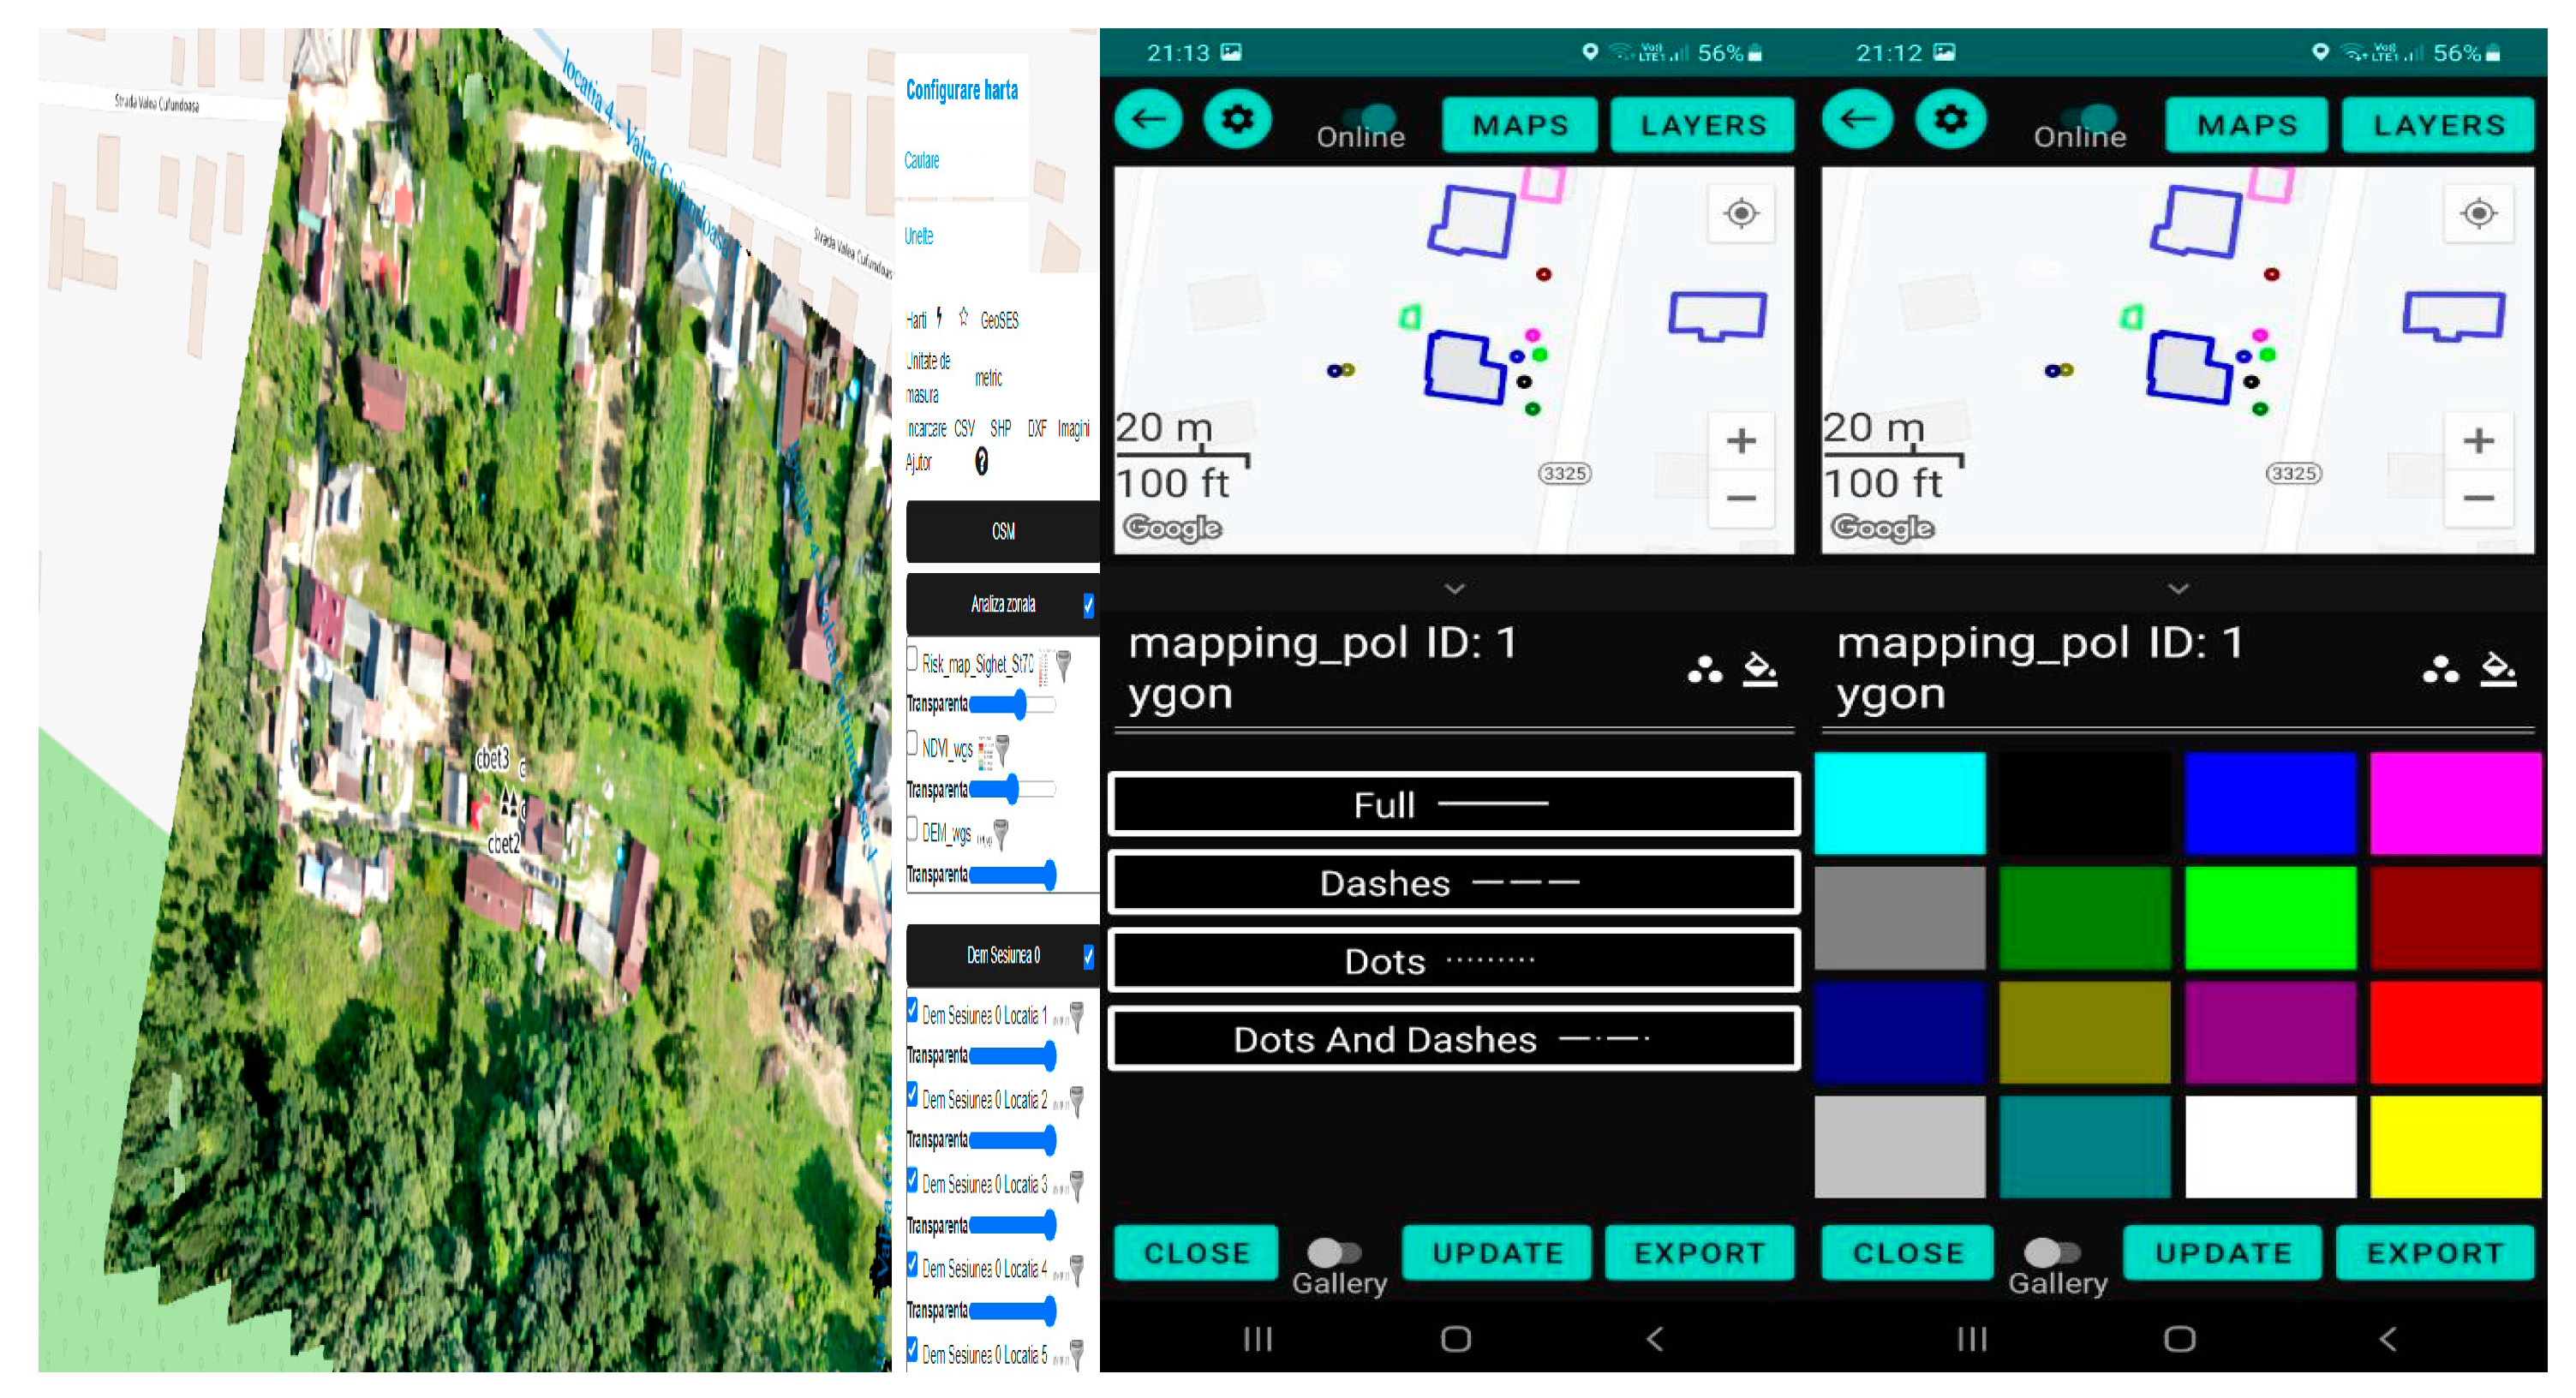
3.2. Development of the Integrated GeoSES Monitoring System

The scheme of the integrated landslide monitoring system in the Hu-Sk-Ro-Ua cross-border area is presented in Figure 2.
A satellite-based radar imagery was collected by Hungarian partners from various satellite missions to determine the deformation regime of the focus area over the past decade. For this purpose, we used VV-polarized, IW-acquisition mode complex SAR images from the Sentinel-1 mission, namely Sentinel-1A and B (S1AB) satellites of the ESA Copernicus Earth Observation program. For the 2019–2020 preprocessing period, available SAR imagery was accessed through the Alaska Satellite Facility, and the associated precise orbit data were through Sentinel-1 Quality Control [42]. During the course of this activity, the InSAR technique was used to conduct a general radar survey of the entire Hu-Sk-Ro-Ua region, focusing on existing or abandoned mining areas, deposits, and dams to detect endangered spots. The processing procedure, namely the persistent scatterer interferometry (PSInSAR), was performed. The derived phase unwrapped differential interferograms were analyzed using the GAMMA interferometric point target analysis (IPTA) procedure. The satellite-specific line-of-sight displacements were derived from the unwrapped differential, as well as post-processing steps associated with the phase terms described above. Interferometric synthetic aperture radar processing was carried out on the common border sections, focusing on the active mass movement areas defined by the project partners. It highlighted the recurrent karstic deformation caused by the abandoned salt mines in the sample area, which indicates significant surface changes with a satellite line-of-sight deformation rate of ~3 cm/yr in the vicinity of the developed sinkholes. Further studies of deformations of the Earth’s surface in the studied area are shown in [42]. Similar monitoring studies take the study of nature to a new level environment and will increase every year the scientific value of the obtained material.
Based on the deformation history of the persistent scatterers, areas with significant subsidence or deformations were identified. This phase led to an important output, i.e., the development of the database that involved the available radar imagery of the Hu-Sk-Ro-Ua area. These datasets (raw and preprocessed) were made available to project partners and other institutions in the eligible area for further analysis (Figure 2).
Next, four cycles of measurement were performed, each through geodetic/geographic methods and techniques (GNSS—global navigation satellite systems; TLS—terrestrial laser scanning; ALS—aerial laser scanning; UAV—unmanned aerial vehicle; high-precision leveling). In the resolution of high-precision leveling, the custom error of graduation plotting did not exceed ± 0.007 mm, and the errors of the leveling rod scale were not bigger than 1.2 ppm [45]. UAV photogrammetry can provide spatial resolution up to (1.25 cm/pixel) orthomosaics and digital models. Angular sampling resolution for the commercial TLS systems, which can be considered fine resolution scanners in terms of both sampling interval and beamwidth, was between 5 and 10 mm/at 50 m [46,47].
The results and information were collected into a central database. The importance of this integrated geoinformation system is that it allows, on the one hand, the configuration of a GIS, and on the other hand, the development of risk maps [41].
The development of risk maps with monitoring results enables the timely implementation of measures aimed at the localization of dangerous phenomena and preventing their progressing negative development (Figure 3).
The next step in the configuration of the GeoSES monitoring system was to design the deformation measurements database—SQL/NoSQL-Client Site Software Interface by TUCN(RO-partner), the server-side software, client-side software development (municipal and local authorities/self-governments).
The final step was server-side software development (WebGIS portal) and mobile application and development of field data collection (Figure 4).
The GeoSES monitoring system was installed in a timely manner, and subsequently, training workshops and educational seminars were conducted for the system’s beneficiaries.

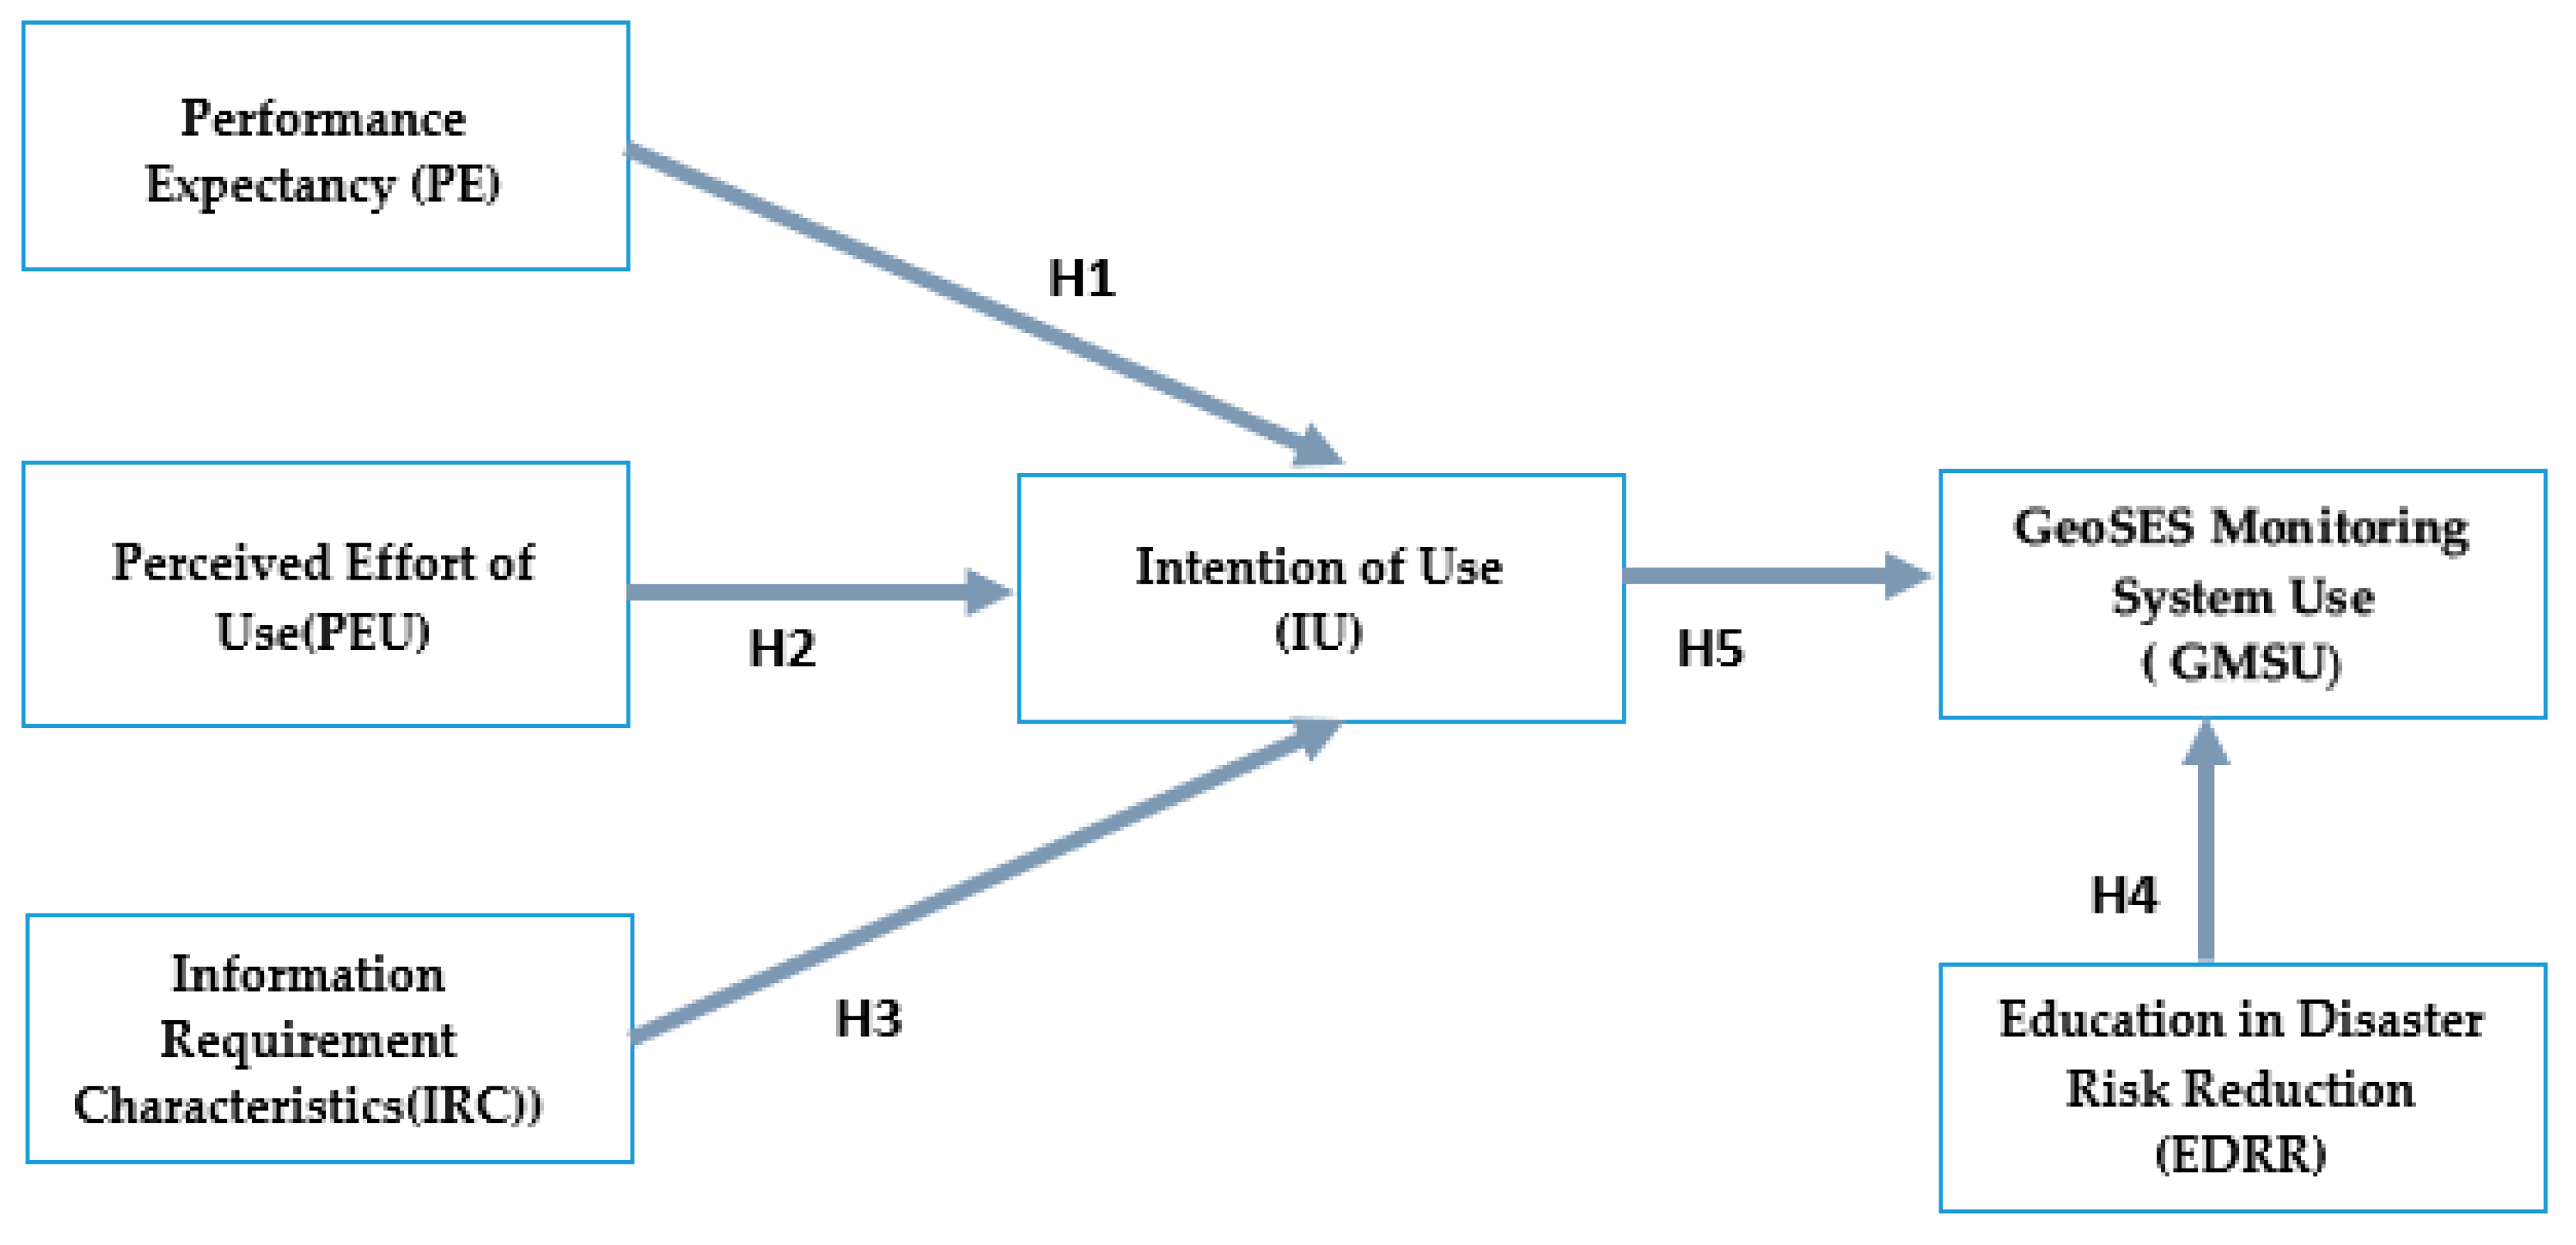
3.3. Research Model and Development of Research Hypotheses

To test and evaluate the factors contributing to implementing the GeoSES monitoring system presented in the previous section, we developed a new model based on the UTAUT theory. Its novelty relies on the elimination of constraints of the original model. They are related to altering model variables such as age, gender, or belonging to a specific entity.
The proposed model is a particularization of the UTAUT model. It uses factors found in the specialized literature to conduct the analysis, but adapted to the profile, needs, and expectations of users in the target group; i.e., testing users from 4 different countries. The model’s variables are based on constructs that define representative factors for the monitoring system within the analyzed project. Figure 5 illustrates the proposed conceptual model.
The overview of the description and the literature related to the factors of the proposed model can be found below, together with the formulation of research hypotheses. Table 1 presents the constructs and the corresponding references.
  • Performance Expectancy (PE)
Performance expectancy is the degree to which users believe that using the system will assist them in achieving higher work performance [48]. Edelhauser and Lupu-Dima (2020) show that physical education directly impacts the intention to use information systems [49]. Wu et al. (2010) have demonstrated that performance expectancy significantly influences people’s computer system use [50]. Hoque and Sorwar (2017) discovered that PE is one of the significant behavioral drivers of users’ willingness to embrace informational systems [51].
The expectations of GeoSES-MS users are related to the precision and accuracy of the information obtained through the system, the expectancy and effectiveness of the system in the event of a threat, the utility of the system for the authorities, and the guarantee of increased productivity in the event of a threat, as measured by a reduction in the time required to make a decision.
Keeping this in mind, the following hypothesis was formulated:
H1 
: Performance expectancy (PE) is positively correlated with the intention to use the GeoSES monitoring system.
  • Perceived Effort of Use (PEU)
Before using an information system, users typically consider the required effort. PEU is described as “the level of usability associated with a system” [52].
Users are more responsive and linked to technologies that are convenient and straightforward to employ [53]. The ease of access to technology tends to encourage consumers, making them very likely to adopt it [54]. The perception of users regarding the efforts associated with the use of technology and the benefits to customers varies based on the group’s typology and participation in a certain collectivity [55].
In the instance of GeoSES-MS, the objective is the ease with which users can access the information system, the ease with which they gain system-related knowledge, or the ease with which they can communicate via the system.
Keeping this in mind, the following hypothesis was formulated:
H2: 
Perceived effort of use (PEU) is positively correlated with intention to use the GeoSES monitoring system.
  • Informational Characteristics Requirement (IRC)
The views and perspectives of users are profoundly dynamic. Adopting new information technologies through information systems is frequently considerably influenced by specific features that they must possess in order to be successfully accepted by users [56].
Predictability, integration, the provision of multipurpose solutions, and the perceived popularity of new technology are the most significant characteristics of the basis of a functioning information system.
The GeoSES monitoring system is a system that combines geo-informational technologies with GIS technologies and web technologies to give users an integrated system of geo-informatics data. It is a modern, agile framework that creates interdisciplinary support for analysis, modeling, aggregation, fusion, and communication that is powered by timely, high-quality geospatial data [56].
This system can provide adequate implementation support and sustainable monitoring for a region.
The perceived quality of the information is due to the outputs of the field measurements, which were performed through geodetic/geographic methods and techniques (GNSS—global navigation satellite systems, TLS—terrestrial laser scanning, ALS—aerial laser scanning, UAV—unmanned aerial vehicle, and high-precision leveling). Thus, a study of karst manifestations in the project’s area was carried out with a comparison of the impact of destructive processes for 2010–2021, but it is advisable to conduct additional studies that will help to investigate in more detail the processes of karst formation in time.
Therefore, the following hypothesis was postulated:
H3: 
Informational characteristics requirement (IRC) is positively correlated with intention to use the GeoSES monitoring system.
  • Education in Disaster Risk Reduction (EDRR)
This component was adapted from the original model’s facilitating condition. It refers to the organizational and technical infrastructure required to support the system’s operation [36].
Several authors [57,58] include in these activities those pertaining to the development of human capital regarding the staff’s skills and capacity to exploit new technology. Under these circumstances, the component of the proposed model suggested in this study is education in disaster risk reduction (EDRR); it comprises factors connected to staff training, learning, and improvement, knowledge transfer, and processes directly related to the assimilation of new technologies and the successful implementation of the IT system.
The following hypothesis was postulated:
H4: 
Education in disaster risk reduction (EDRR) is positively correlated with the use of the GeoSES monitoring system.
  • Use of the GeoSES monitoring system (GMSU)
Intention of use (IU) and actual usage are significantly connected. Numerous studies show that usage intention predicts actual usage behavior [59,60,61,62,63].
Interestingly, in demonstrating that the intention to use a technology service should be made while the service is still relatively fresh on the market it was discovered that behavioral intention is strongly connected with actual use and this established the existence of an intention–behavior gap among subjects [64,65].
The analysis of this factor within the proposed model is of particular importance, due to the fact that the GeoSES-MS provides users with real solutions for better and faster monitoring of landslide risk. Due to the risk and uncertainty of the surrounding environment, the system is in a continuous development, evolution, and interesting dynamic.
Consequently, the following hypothesis was formulated:
H5: 
Intention of use (IU) is positively correlated with actual usage behavior of GeoSES monitoring system use (GMSU).
Table 1. Overview of factors of GeoSES model and corresponding references.
ConstructReferences
Performance expectancy (PE)[48,49,50,51]
Perceived effort of use (PEU)[52,53,54,55]
Informational characteristics requirement (IRC)[24,25,26,27,28]
Education in disaster risk reduction (EDRR)[41,43,57,58]
Intention of use (IU)[59,60,61,62,63]
Use of the GeoSES monitoring system (GMSU)[41,43,44,64,65]

3.4. Analysis of the Model

PLS-SEM (partial least squares-structural equation modeling) was employed to analyze the hypothesized model.
The SEM technique, which has become popular in the research community for estimating causal linkages by combining statistical data with qualitative causal hypotheses, was used to assess model hypotheses. In this study, data processing was conducted using the PLS-SEM method, which is acceptable for smaller sample sizes. The software utilized was version 4 of SMARTPLS [66].
Each factor of the proposed model was investigated through assumptions regarding the verification of the correlations between the variables of the model. For this purpose, a questionnaire has been developed and applied to the target group of GeoSES project.
The method of sampling in this study was expert sampling. This is a method that involves selecting a sample of individuals who are considered to be experts in a given field or domain. Some advantages of expert sampling are:
Higher-quality data: because experts are often highly knowledgeable and experienced in their field, they are likely to provide more accurate and reliable data;
Time efficiency: expert sampling can be more efficient than other sampling methods because it allows researchers to quickly identify and target people who have specialized knowledge and experience;
Cost savings: if experts are local or can be reached remotely, then the costs associated with travel and site visits can be minimized;
Reduced sample size: expert sampling can be especially useful when dealing with limited resources because it allows researchers to obtain a smaller sample size than other methods without sacrificing quality.
Overall, expert sampling can be a powerful tool for researchers looking to collect high-quality data quickly and efficiently.
Due to the specificity of the project and the objectives of the study, the target group was chosen from experts and specialists who are directly involved in the disaster monitoring processes in the regions where the research was carried out (users who are representatives of organizations in the study region and who are decision-makers or specialists in emergencies).
In this sense, 120 specialists from the 4 countries of the project were questioned.
The online distribution of 120 questionnaires resulted in 116 valid responses. Notably, 70 respondents participated throughout the project in information and training workshops organized by the project partners. The remaining respondents were informed of this system through the project’s training seminars.

3.4.1. Measurement Scales

The questionnaire consisted of 20 questions. These questions were rated using a 5-point Likert scale (1 = strongly disagree, 5 = strongly agree).
Each question or item was coded in order to facilitate the study. The questionnaire’s coded items are also shown in Table 2.
The survey and data collection was conducted between October and December of 2022.
The analysis aimed to discover cause–effect correlations between the model’s constructs.
The internal model, also known as the structural model, illustrates the links between the examined constructs. Outer or measurement models are employed to evaluate the relationship between indicator variables and the corresponding construct.

3.4.2. Testing for Reliability and Validity

In PLS-SEM analysis, an indicator’s reliability may be determined by its loadings, which are empirically determined to be more than 0.7. Based on the widely accepted Cronbach’s coefficient > 0.7, the internal consistency reliability of the model was evaluated. Composite reliability (CR) is another indicator that the PLS-SEM method uses to assess the internal consistency reliability of constructs. Next, convergent validity assesses the degree of correlation between one and more observable variables within a given concept. The extracted average variance (AVE) of measured constructs should be checked for convergent validity. According to Zeng et al. (2021) [67], the minimum acceptable AVE value in SEM-based research varies from 0.36 to 0.5, with all constructs in our model having AVE above this threshold (Table 3).
Both reliability and validity analyses were undertaken to see if the questionnaire items were appropriate for the study’s objectives. The reliability of the scale was also assessed for each item. All six proposed model constructs had Cronbach’s alpha values greater than 0.7, indicating strong internal consistency.
Composite reliabilities (CR) and average variance extracted (AVE) were explored after a t-test for factor loadings, confirming the convergent validity of the factors. The measure should have a stronger association with all others representing the same larger construct for discriminant validity. With acceptable discriminant validity, the average variance extracted (AVE) should be greater than the variance shared with other constructs [60,63].
Cronbach’s alpha, composite reliability (CR), and average variance extracted (AVE) of the variables are presented in Table 3.
The measurement of the model indicates that the AVEs fall between 0.683 and 0.894; however, the cross-loading matrix indicates that the item loading between 0.718 and 0.940 exceeds the literature-recommended threshold. The requirements for convergent validity were thus satisfied. The calculated square root of AVE, provided above (Table 3), was greater than the equivalent correlation, validating the discriminant data.

3.4.3. Correlations

The diagonal of Table 4 displays the correlation matrix between the components and the square root of AVE. Therefore, the discriminant validity was reasonable.
Fornell and Larcker (1981) introduced the conventional metric, comparing each construct’s AVE to the squared inter-construct correlation of that same construct and all other reflectively assessed constructs in the structural model. All model constructs’ shared variances should not be greater than their AVEs. In order to minimize multi-collinearity, the same authors suggest that correlations between all constructs should be less than the threshold of 0.85 [68,69,70].
AVE (average variance extracted) was further validated by examining the composites’ dependability.
As shown in Table 4, all factor loading scores surpassed 0.5, indicating that the assessment items represented the constructs satisfactorily. If the composite reliability and AVE measures are more significant than the corresponding thresholds of 0.36 and 0.5, we can assume that the convergent validity of the measurement model is adequate.

3.4.4. Evaluation of Reflective Structures-Discriminate Validity of Measurement Model

The connection between indicators and the underlying concept can either be formative or reflective.
Observable measurements serve to evaluate latent variables (indicators).
The measurement model describes the relationship between these indicators and the latent concept.
Measurement models can be either reflective or formative in nature.
In reflective models, the latent variable influences the indicators, whereas the indicators define the latent variable in formative models.
Because the concept is reflected in other indicators with a similar theme, reflective indicators are interchangeable [71].
As part of the research, the indicator reliability, composite, convergent validity, and discriminate validity of the reflective constructs were investigated. When an indicator fails to obtain a value of 0.7 or above, it is simple to eliminate interchangeable reflective indicators. In exploratory research, at least a 0.4 significance level is acceptable. Similarly, at the 0.1% significance level, all loadings of each reflective construct are statistically significant.
As shown in Table 5, every value of the reflective/latent variables was larger than 0.70.
The internal consistency and dependability of reflective constructs were excellent, as the composite reliability coefficients of each construct even surpassed 0.80. Notably, with PLS-SEM, composite reliability is typically preferred over Cronbach’s alpha indicator.
Additionally, convergence validity was verified because the AVE values exceeded 0.5. In this investigation, each latent variable explained at least 70% of the necessary variations.
Discriminant validity refers to the extent to which a construct is actually distinct from the other constructs of the structural model. The discriminant validity of heterotrait–monotrait (HTMT) was evaluated using the ratio and cross-loading criteria given by Fornell and Larcker [70]. Cross-loadings revealed that each indicator had the greatest loadings on the variable it was designed to assess. Thus, the Fornell and Larcker [70] condition was satisfied.
However, since HTMT values are regarded as more precise for PLS-SEM, only these are provided in Table 6. None of the latent variables had HTMT values more than 0.85, suggesting that the reflective variables were clearly distinct one from another (Table 6).
Given that all model testing conditions and reflexively assessed variables were satisfied, it can be concluded that these variables can be utilized to evaluate the influence of PE, PEU, PEIC, EDRR, and IU in the actual use of GeoSES-MS (GMSU).

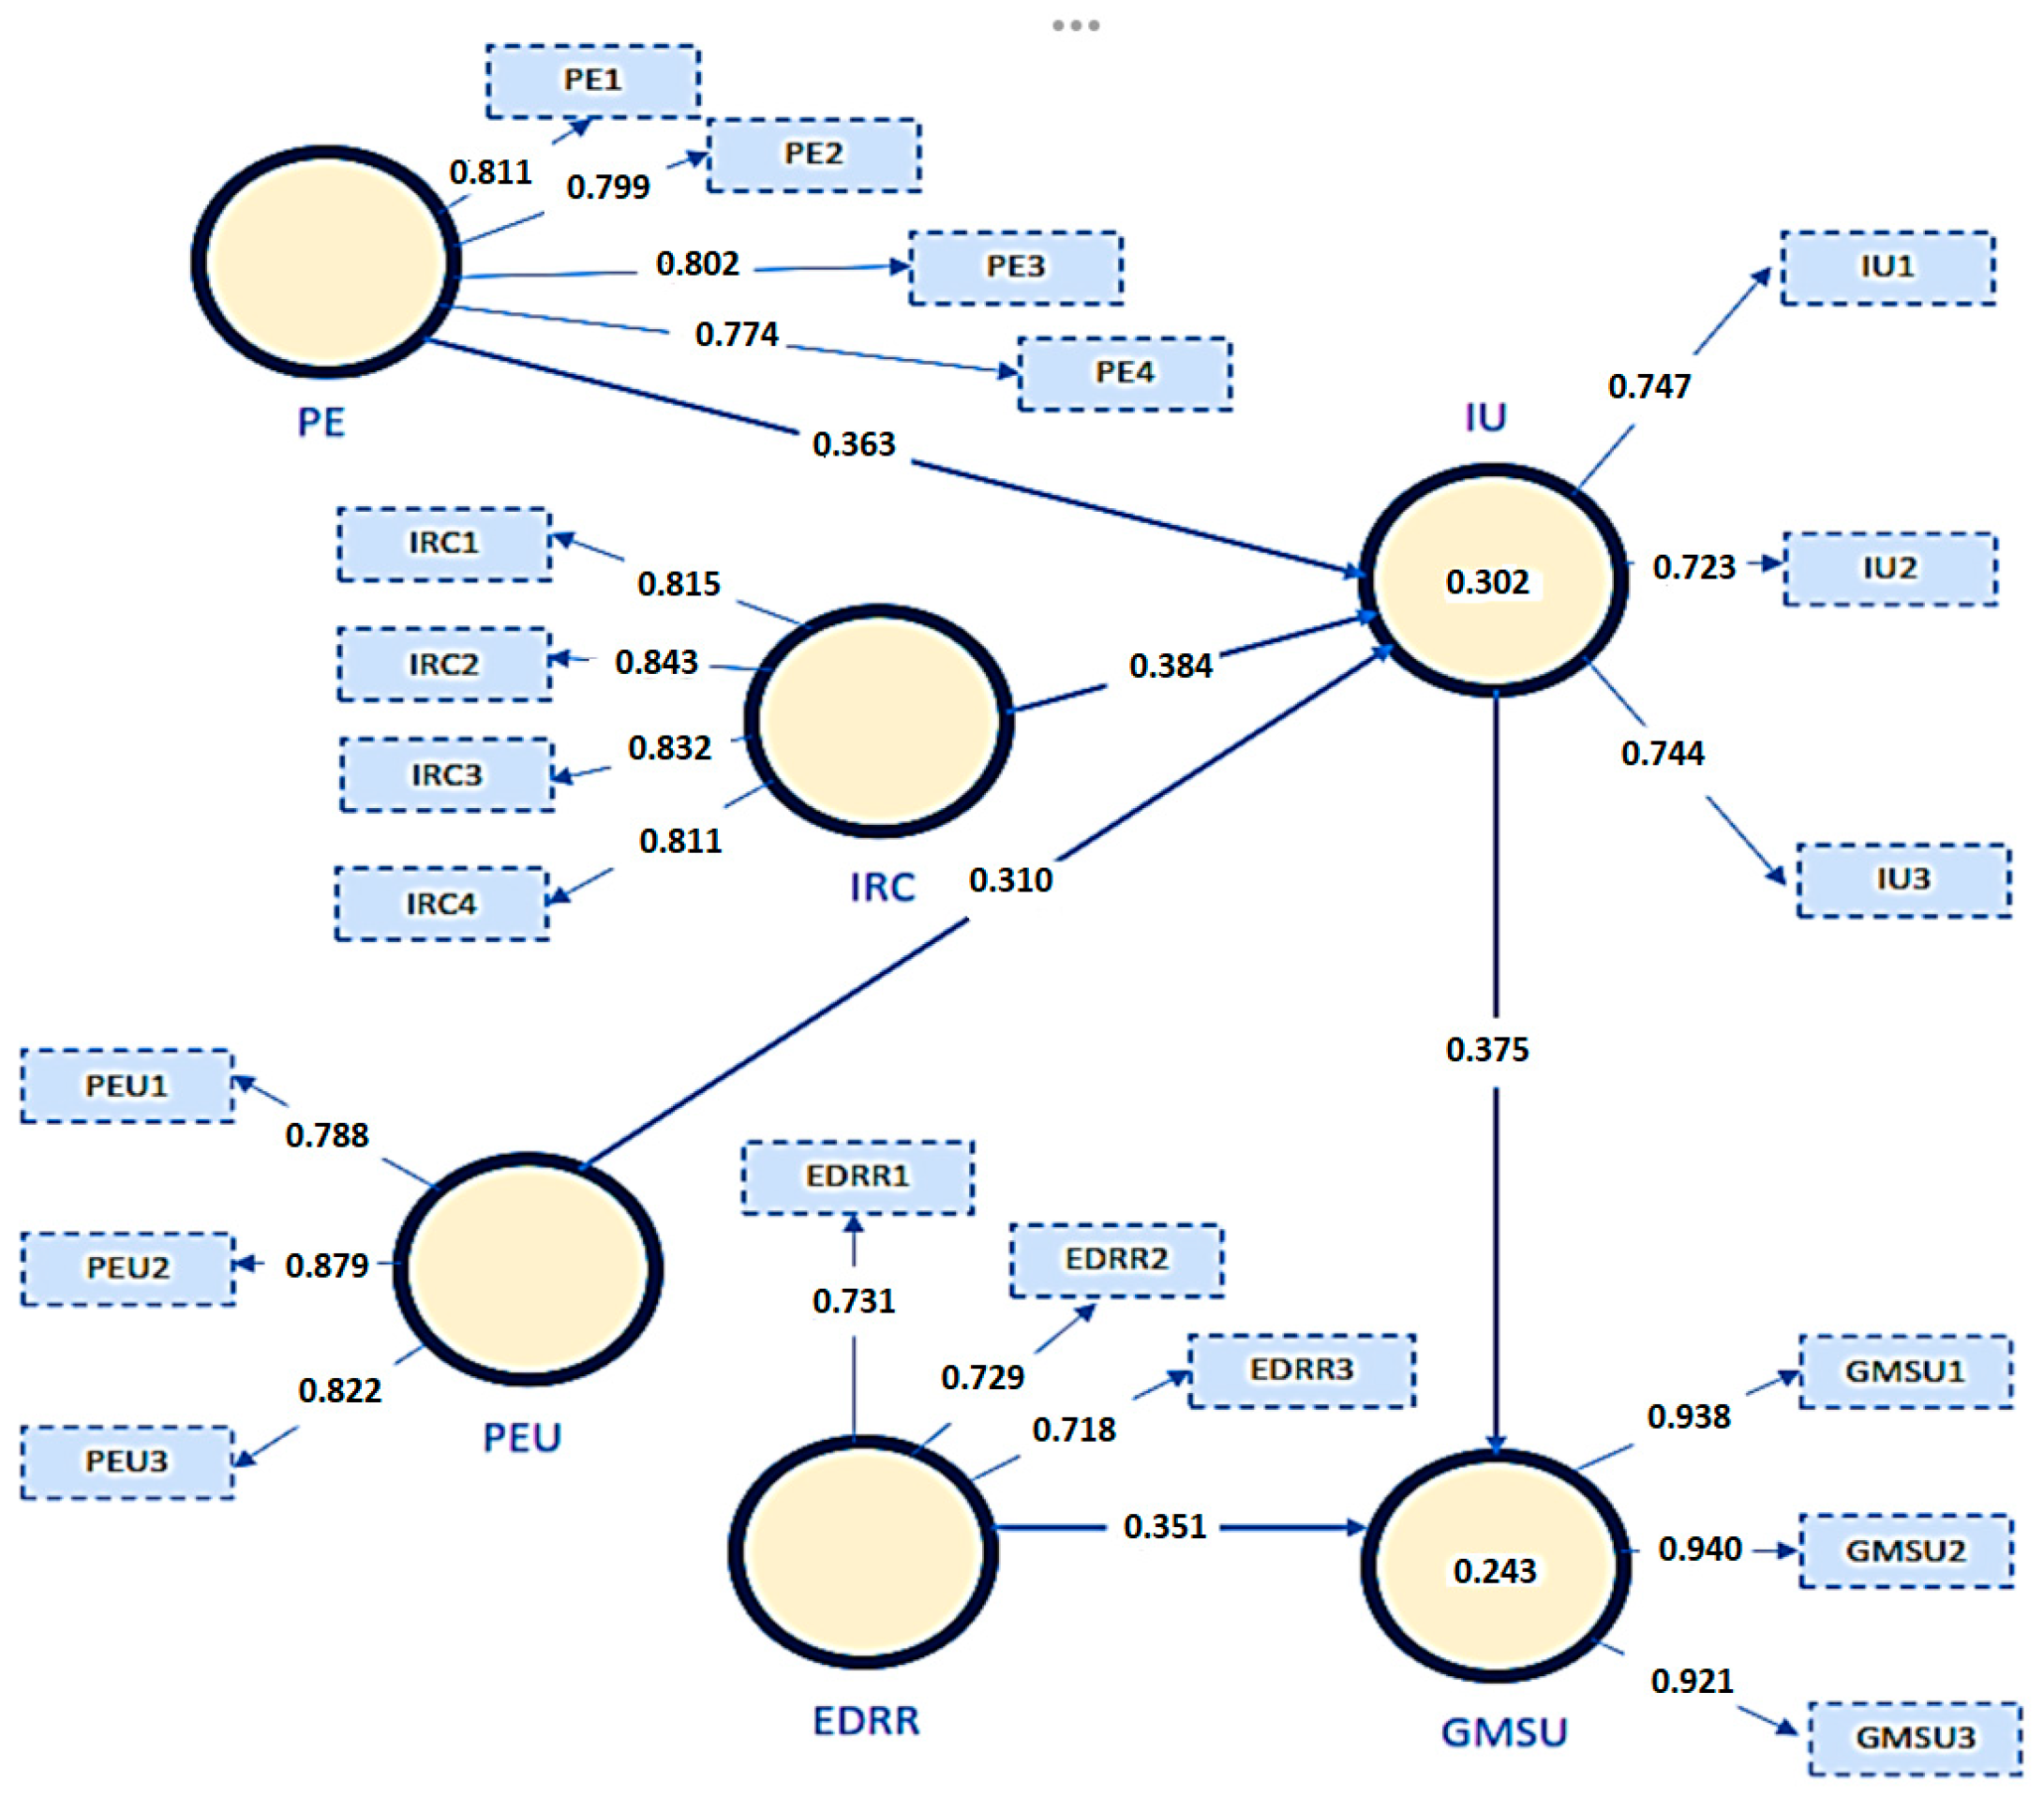
3.5. Results of Structural Modeling

Estimating the path coefficients, which represent the hypothesized correlations between the constructs, is used in analyzing a PLS-SEM model.
The range of path coefficient values is between 1 and +1, with values closer to +1 indicating strong positive interactions and values closer to 1 indicating strong negative relationships. Although results close to +1 or −1 are nearly always statistically significant, a standard error must be calculated using bootstrapping to assess significance.
Figure 6 illustrates the analysis of the causal relationship in the structural equation model.
The path coefficients and R2 (measures the predictive accuracy of the structural model) value are estimated as part of the structural model evaluation [71,72]. The path coefficient quantifies the strength of the association between the independent and dependent variables.
Evaluation of the structural model includes the estimation of route coefficients and R2 value. The path coefficient measures the strength of the relationship between variables. In contrast, the R2 value indicates a model’s ability to predict the dependent variables. The R2 values of the dependent variable, which is represented by the independent variables, the size, sign, and statistical significance of the path coefficient, are used to interpret the results of the analysis [73].
The path coefficients, significance level, and R2 values of the endogenous variables are shown in both Figure 6 and Table 7. Performance expectancy (PE) (b = 0.363, p < 0.05), perceived effort of use (PEU) (b = 0.310, p < 0.05), information requirement characteristics (IRC) (b = 0.384, p < 0,05), education in disaster risk reduction (EDRR), (b = 0.351, p < 0.05), and intention of use (IU) (b = 0.375, p < 0.05) all increase the (GMSU). H1, H2, and H3, by which the performance expectancy (PE), perceived effort of use (PEU), and information requirement characteristics (IRC) factors positively support the intention of use (IU) and which, in conjunction with the education in disaster risk reduction (EDRR) factor, positively influence the decision to use the GeoSES monitoring system (GMSU).
According to the results of the analysis, all hypotheses are validated.

4. Discussion

The UTAUT model has been shown to be more powerful than other competing models, despite the fact that it has been used in fewer studies than TAM and TPB [74].
In this regard, Williams et al. (2015) stated that the UTAUT model is really valuable and worth generalizing in the context of acceptance and validation of new technologies [58]. In this case, we made a modified UTAUT model for the deploying of information systems to monitor the risk of landslides in order to test and validate the use of the GeoSES monitoring system (GMSU), which was set up as part of the GeoSES project.
To test the model, the sampling of the target group was by the expert sampling method, widely used when checking and validating models in specific fields or particular technologies, which requires specialized knowledge, skills, and experience of the users, as is the case with the GeoSES monitoring system. However, the evaluation of bias in this method can be challenging and includes some limitations. It involves comprehensive scrutiny of various factors such as the formulation of questions, choice of the targeted group, and their answers. Limitations are related mainly to:
  • Formulation of questions: biased questions can lead to biased answers. The evaluation of question formulation involves checking whether the questions were phrased in an objective and non-leading manner. All possible interpretations of questions should be considered to ensure that the questions are clear and straightforward.
  • Choice of targeted group: another source of bias in expert sampling is the choice of the targeted group. It is essential to evaluate who is chosen as an expert and whether they represent the diversity of opinions in the population being studied. An adverse group of experts can help eliminate bias due to individual opinions or experiences.
  • Answers: biased answers can also lead to biased results. Identification and evaluation of possible sources of bias in the answers are critical. Evaluating the answers involves ensuring that the experts understand the questions, that their answers are objective and unbiased, and that they have the necessary knowledge and expertise to provide informed opinions.
Taking into account all these aspects, the choice of the target group of the study, the formulation of the questions, and the interpretation of the results were through careful design, selection, and implementation of the research methods used. Preparation of this methodology was carried out by the technical manager and communication manager of the GeoSES project.
Based on the feedback of 116 respondents from the project users, the study emphasizes the variations between the intention to use the GeoSES monitoring system and the actual GMSU usage behavior. The latter can be demonstrated through the extended UTAUT theory.
This study introduced the IRC construct, a factor that considers the geo-information quality and how field data are obtained and processed using various geomatic and Earth observation means.
The feedback from this construct demonstrates that users have a strong perception of the system’s intention to use it (b = 0.3884). Thus, the permanent improvement of the methods of collecting and processing geoinformation is highly recommended.
This study also introduced the EDRR factor, because knowledge of the system’s operation is fundamental to its practical use. According to the respondents’ perception, this factor is strongly related (b = 0.351) to the actual use of the GeoSES monitoring system. This underlines the importance of continuous development of the users of the system. However, the GeoSES monitoring system can only be used with staff training, the assimilation of updated knowledge related to utilizing the system, or the transfer of knowledge regarding the techniques used.

Theoretical and Practical Implications of the Study

There is an increasing need for innovative technologies in managing and reducing disaster risks. DDR (disaster risk reduction) must be a common concern of all decision-makers, regardless of the environmental policies adopted in each country. Consequently, our research focuses on finding the most effective solutions that offer the greatest impact on users.
The study’s theoretical implications refer to identifying and understanding the factors that significantly impact the decision to adopt the GeoSES monitoring system. In turn, this significantly influences the diffusion and rapid adoption of the landslide monitoring information system significantly.
In turn, this influences the diffusion and rapid adoption of the landslide monitoring information system significantly.
From a technical point of view, this system can be improved following the beneficiaries’ feedback. Therefore, the usability of the system must be tested through the prism of its acceptance, even in the design phase.
The impact that landslide risk monitoring systems have on users was evaluated in this study through a redesigned UTAUT model, proposed by the authors.
The factors that contribute to the adoption of the monitoring system were carefully selected. They were identified according to the system’s particularities, functions, usefulness, and motivational or user behavioral components.
The results of the study show that the system’s acceptability is a direct effect of its efficiency, the reduced effort of use, and the availability and quality of the collected geospatial information. The high impact of the factor related to education (EDRR), demonstrates the need for continuous training of personnel in using innovative geomonitoring systems.
The proposed model can be replicated in other regions or countries where similar technologies of geomonitoring systems are used.
By adopting the geomonitoring system, users form networks of specialists, local authorities, decision-makers, and policy-makers who can collaborate on the application and improvement of the integrated monitoring system.

5. Conclusions

In recent decades, ecological disasters have become more frequent in the Carpathian Euroregion [75,76,77]. The Earth’s surface deformities have been observed in relatively densely populated regions. [43,46]. The surface movement caused by these dangerous processes can destroy complex structures on the Earth’s surface, endangering human lives and property, and affecting the success of environmental protection activities. The lack of detailed land surface and landslide monitoring in the Hu-Sk-Ro-Ua region is an unresolved issue [13,14,41,43].
For this purpose, integrated information systems based on geomonitoring can be efficient solutions for entities involved in DDR (disaster risk reduction).
Aiming at the acceptance of such technologies by the users of the GeoSES-MS, a novel UTAUT model was developed and tested.
Although the complex environmental, cultural, and social paradigm in the UTAUT model of technology adoption is quite powerful [53,54,56,69,70], the model is rarely used in emergencies. More importantly, in the HU-SK-RO-UA cross-border area, it is entirely unused.
The study tailored the original UTAUT model to cover this gap with two additional constructs. These constructs proved to have significant relevance for the adaptation of geomonitoring systems for landslides. The constructs—performance expectancy, perceived effort of use, information requirement characteristics, education in disaster risk reduction, intention of use, GeoSES monitoring system use—proved to be of major relevance for the adoption of geomonitoring systems for landslides. The novelty and added value of our study reside in the newly developed model. This model has replaced some factors from the original one, such as social influence, hedonic motivation, or habit, and deleted the moderator factors of age, gender, and experience due to their nonrelevance, demonstrated in previous and specific research. The proposed model is customized, agile, and adapted to the needs and expectations of users of landslide geomonitoring systems.
The PLS-SEM method was used to test and validate the proposed model. The results of the analysis confirmed all the hypotheses.
The model is a useful tool to capture feedback from beneficiaries and make early adjustments to any misfunction of the system. One should emphasize that coordination and the system’s working accuracy is an essential requirement. The investigation of user actions regarding the acceptance of a new information system holds a significant role in evaluating and developing a better information system for use in any sector, even more so as this system becomes a means of preventing emergencies.
Our findings demonstrate that the acceptance of the integrated monitoring system by the beneficiaries of the GeoSES-MS, from four neighboring countries, is one of the strengths of our joint work for the mitigation of risks and management of disasters in this region.

Author Contributions

The authors contributed equally to this work. A.T.R. and C.M.R. developed the conceptualization, the methodology, and carried out the SEM; N.K. and O.K.R. carried out an analysis of measurements and observations in the UA area; G.M.T.R. performed numerical calculations and software processing. All authors have read and agreed to the published version of the manuscript.

Funding

This research benefited from funding from the TUCN Development Program.

Data Availability Statement

The data presented in this study are available on request from the corresponding author.

Acknowledgments

We thank the Research, Development, and Innovation Centre from the Technical University of Cluj-Napoca, Romania for their support of this research. We also thank the editor and the anonymous reviewers for their insightful and constructive comments.

Conflicts of Interest

The authors declare no conflict of interest. The founding sponsors had no role in the design of the study; in the collection, analysis, or interpretation of data; in the writing of the manuscript; or in the decision to publish the results.

References

  1. IFRC ORG. World Disasters Report 2020. Available online: https://www.ifrc.org (accessed on 12 December 2022).
  2. Nelson, D.R.; Adger, W.N.; Brown, K. Adaptation to environmental change: Contributions of a resilience framework. Annu. Rev. Environ. Resour. 2007, 32, 395–419. [Google Scholar] [CrossRef] [Green Version]
  3. Cutter, S.L.; Boruff, B.J.; Shirley, W.L. Social vulnerability to environmental hazards. In Hazards Vulnerability and Environmental Justice; Routledge: New York, NY, USA, 2012; pp. 143–160. [Google Scholar]
  4. Karsznia, K.; Tarnowska, A. Proposition of an integrated geodetic monitoring system in the areas at risk of landslides. Chall. Mod. Technol. Town Urban Plan. Archit. Build. Eng. 2014, 4, 33–40. [Google Scholar]
  5. Góraj, M.; Karsznia, K.; Sikorska, D.; Hejduk, L.; Chormański, J. Multi-wavelength airborne laser scanning and multispectral UAV-borne imaging. Ability to distinguish selected hydromorphological indicators. SGEM 2018 Vienna Green Conf. Proc. 2018, 18, 359–366. [Google Scholar] [CrossRef]
  6. Dai, F.C.; Lee, C.F.; Ngai, Y.Y. Landslide risk assessment and management: An overview. Eng. Geol. 2002, 64, 65–87. [Google Scholar] [CrossRef]
  7. Van Westen, C.J.; Van Asch, T.W.; Soeters, R. Landslide hazard and risk zonation—Why is it still so difficult? Bull. Eng. Geol. Environ. 2006, 65, 167–184. [Google Scholar] [CrossRef]
  8. Van Westen, C.J.; Castellanos, E.; Kuriakose, S.L. Spatial data for landslide susceptibility, hazard, and vulnerability assessment: An overview. Eng. Geol. 2008, 102, 112–131. [Google Scholar] [CrossRef]
  9. Prabhakar, S.V.R.K.; Srinivasan, A.; Shaw, R. Climate change and local level disaster risk reduction planning: Need, opportunities and challenges. Mitig. Adapt. Strateg. Glob. Change 2009, 14, 7–33. [Google Scholar] [CrossRef]
  10. Tapsell, S.; McCarthy, S.; Faulkner, H.; Alexander, M. Social Vulnerability and Natural Hazards. CapHaz-Net WP4 Report, Flood Hazard Research Centre – FHRC, Middlesex University, London. 2010. Available online: http://caphaz-net.org/outcomes-results/CapHaz-Net_WP4_Social-Vulnerability.pdf. (accessed on 15 December 2022).
  11. Wisner, B. Disaster risk reduction in megacities: Making the most of human and social capital. Build. Safer Cities: Future Disaster Risk 2003, 3, 181–196. [Google Scholar]
  12. Peplinska-Zaczek, J.; Podawca, K.; Karsznia, K. Reliability of geodetic control measurements of high dams as a guarantee of safety of the construction and the natural environment. Bull. Pol. Acad. Sci. Tech. Sci. 2018, 66, 87–98. [Google Scholar]
  13. ENI CBC Programmes. Available online: https://tesim-enicbc.eu/eni-cbc-programmes (accessed on 15 December 2022).
  14. Kalmar, T.M.; Dîrja, M.; Rădulescu, A.T.G.M.; Măran, P.D.; Rădulescu, G.M.T.; Rădulescu, C.M. Landslide analysis using GIS tools—case study analyzed in the cross-border GeoSES project. Sci. Papers. Ser. E. Land Reclam. Earth Obs. Surv. Environ. Eng. 2022, 9, 316–325. Available online: https://landreclamationjournal.usamv.ro/pdf/2022/Art38.pdf (accessed on 23 December 2022).
  15. Adams, D.A.; Nelson, R.R.; Todd, P.A. Perceived usefulness, ease of use, and usage of information technology: A replication. Manag. Inf. Syst. Q. 1992, 16, 227–247. [Google Scholar] [CrossRef]
  16. McCloskey, D.W. The importance of ease of use, usefulness, and trust to online consumers: An examination of the technology acceptance model with older customers. J. Organ. End User Comput. 2006, 18, 47–65. [Google Scholar] [CrossRef]
  17. Brown, I.T. Individual and technological factors affecting perceived ease of use of web-based learning technologies in a developing country. Electron. J. Inf. Syst. Dev. Ctries. 2002, 9, 1–15. [Google Scholar] [CrossRef]
  18. Corominas, J.; van Westen, C.; Frattini, P.; Cascini, L.; Malet, J.P.; Fotopoulou, S.; Smith, J.T. Recommendations for the quantitative analysis of landslide risk. Bull. Eng. Geol. Environ. 2014, 73, 209–263. [Google Scholar] [CrossRef] [Green Version]
  19. Blaikie, P.; Cannon, T.; Davis, I.; Wisner, B. At Risk: Natural Hazards, People’s Vulnerability, and Disasters; Routledge: New York, NY, USA, 1994. [Google Scholar]
  20. Olson, R.S.; Emel Ganapati, N.; Gawronski, V.T.; Olson, R.A.; Salna, E.; Pablo Sarmiento, J. From disaster risk reduction to policy studies: Bridging research communities. Nat. Hazards Rev. 2020, 21, 04020014. [Google Scholar] [CrossRef] [Green Version]
  21. Hurlbert, M.; Krishnaswamy, J.; Johnson, F.X.; Rodríguez-Morales, J.E.; Zommers, Z. Risk management and decision making in relation to sustainable development. In Climate Change and Land: An IPCC Special Report on Climate Change, Desertification, Land Degradation; Shukla, P.R., Skea, J., Calvo Buendia, E., Masson-Delmotte, V., Portner, H.-O., Roberts, D.C., Zhai, P., Slade, R., Connors, S., van Diemen, R., et al., Eds.; 2019; pp. 673–754. Available online: https://www.ipcc.ch/site/assets/uploads/sites/4/2019/11/10_Chapter-7.pdf (accessed on 15 December 2022).
  22. Wachinger, G.; Renn, O.; Begg, C.; Kuhlicke, C. The risk perception paradox—Implications for governance and communication of natural hazards. Risk Anal. 2013, 33, 1049–1065. [Google Scholar] [CrossRef] [PubMed]
  23. Chang, L.C.; Chang, F.J.; Yang, S.N.; Kao, I.F.; Ku, Y.Y.; Kuo, C.L.; Amin, I.M. Building an intelligent hydroinformatics integration platform for regional flood inundation warning systems. Water 2018, 11, 9. [Google Scholar] [CrossRef] [Green Version]
  24. Giardino, M.; Perotti, L.; Lanfranco, M.; Perrone, G. GIS and geomatics for disaster management and emergency relief: A proactive response to natural hazards. Appl. Geomat. 2012, 4, 33–46. [Google Scholar] [CrossRef]
  25. Nhamo, G.; Chikodzi, D. Use and Contestations of Earth Observation Technologies in Disaster Risk Reduction and Management. In Cyclones in Southern Africa; Springer: Cham, Germany, 2021; pp. 53–65. [Google Scholar]
  26. Baky, M.A.A.; Islam, M.; Paul, S. Flood hazard, vulnerability and risk assessment for different land use classes using a flow model. Earth Syst. Environ. 2020, 4, 225–244. [Google Scholar] [CrossRef] [Green Version]
  27. Bello, O.; Bustamante, A.; Pizarro, P. Planning for disaster risk reduction within the framework of the 2030 Agenda for Sustainable Development. 2021. Available online: https://repositorio.cepal.org/bitstream/handle/11362/46639/1/S2000452_en.pdf (accessed on 15 December 2022).
  28. Benitez-Amado, J.; Walczuch, R.M. Information technology, the organizational capability of proactive corporate environmental strategy and firm performance: A resource-based analysis. Eur. J. Inf. Syst. 2012, 21, 664–679. [Google Scholar] [CrossRef]
  29. Legris, P.; Ingham, J.; Collerette, P. Why do people use information technology? A critical review of the technology acceptance model. Inf. Man-Agement 2003, 40, 191–204. [Google Scholar] [CrossRef]
  30. Lu, J.; Yu, C.S.; Liu, C.; Yao, J.E. Technology acceptance model for wireless Internet. Int. Res. 2003, 13, 206–222. [Google Scholar] [CrossRef] [Green Version]
  31. Lai, P.C. The literature review of technology adoption models and theories for the novelty technology. J. Inf. Syst. Technol. Manag. 2017, 14, 21–38. [Google Scholar] [CrossRef] [Green Version]
  32. Alam, M.Z.; Hoque, M.R.; Hu, W.; Barua, Z. Factors influencing the adoption of mHealth services in a developing country: A patient-centric study. Int. J. Inf. Manag. 2020, 50, 128–143. [Google Scholar] [CrossRef]
  33. Ajzen, I. The theory of planned behavior: Frequently asked questions. Hum. Behav. Emerg. Technol. 2020, 2, 314–324. [Google Scholar] [CrossRef]
  34. Hale, J.L.; Householder, B.J.; Greene, K.L. The theory of reasoned action. Persuas. Handb. Dev. Theory Pract. 2002, 14, 259–286. [Google Scholar]
  35. Marangunić, N.; Granić, A. Technology acceptance model: A literature review from 1986 to 2013. Univers. Access Inf. Soc. 2015, 14, 81–95. [Google Scholar] [CrossRef]
  36. Venkatesh, V.; Morris, M.G.; Davis, G.B.; Davis, F.D. User Acceptance of Information Technology: Toward a Unified View. MIS Q. 2003, 27, 425–478. [Google Scholar] [CrossRef] [Green Version]
  37. Dwivedi, Y.K.; Rana, N.P.; Jeyaraj, A.; Clement, M.; Williams, M.D. Re-examining the unified theory of acceptance and use of technology (UTAUT): Towards a revised theoretical model. Inf. Syst. Front. 2019, 21, 719–734. [Google Scholar] [CrossRef] [Green Version]
  38. Alzahrani, N.A.; Sheikh Abdullah, S.N.H.; Mohamed, I.; Mukred, M. The adoption of geographic information systems in the public sector of Saudi Arabia: A conceptual model. Math. Probl. Eng. 2021. Special Issue. [Google Scholar] [CrossRef]
  39. Alharbi, S.T. Trust and acceptance of cloud computing: A revised UTAUT model. In Proceedings of the 2014 International Conference on Computational Science and Computational Intelligence, Las Vegas, NV, USA, 10–13 March 2014; IEEE: New York, NY, USA, 2014; Volume 2, pp. 131–134. [Google Scholar]
  40. Singh, N.; Jung, I.; Han, H.; Ariza-Montes, A.; Vega-Muñoz, A. Green Information System (GIS) Model in the Conference Sector: Exploring Attendees’ Adoption Behaviors for Conference Apps. Psychol. Res. Behav. Manag. 2022, 2229–2243. [Google Scholar] [CrossRef]
  41. Extension of the Operational “Space Emergency System” in the HU-SK-RO-UA Cross-Border Region-GeoSES Project. Available online: https://geoses.ro/ (accessed on 1 December 2019).
  42. Magyar, B.; Horváth, R.; Völgyesi, L.   Regional scale monitoring of surface deformation in transcarpathia using insar technology. Sci. Bull. Ser. D Min. Miner. Process. Non-Ferr. Metall. Geol. Environ. Eng. 2021, 35, 59–67. [Google Scholar]
  43. Rădulescu, A.T.G.M.; Kalmar, T.T.; Rădulescu, G.M.T.; Naș, S.M.; Rădulescu, V.M.G.M.; Măran, P.D.; Rădulescu, C.M.; Bondrea, M. The role of cross-border projects in disaster management. case study: Geoses project-extension of the operational ”Space emergency system” towards monitoring of dangerous natural and man-made geoprocesses in the Hu-Sk-Ro-Ua cross-border region. Sci. Bull. Ser. D Min. Miner. Process. Non-Ferr. Metall. Geol. Environ. Eng. 2021, 35, 77–85. [Google Scholar]
  44. GeoSES—Partnership without Borders. Available online: https://geoses.ro/category/announces (accessed on 20 February 2023).
  45. Sawaya, K.E.; Olmanson, L.G.; Heinert, N.J.; Brezonik, P.L.; Bauer, M.E. Extending satellite remote sensing to local scales: Land and water resource monitoring using high-resolution imagery. Remote Sens. Environ. 2003, 88, 144–156. [Google Scholar] [CrossRef]
  46. Curcio, A.C.; Peralta, G.; Aranda, M.; Barbero, L. Evaluating the Performance of High Spatial Resolution UAV-Photogrammetry and UAV-LiDAR for Salt Marshes: The Cádiz Bay Study Case. Remote Sens. 2022, 14, 3582. [Google Scholar] [CrossRef]
  47. Duggal, S.K. Surveying Volume 2, 4th ed.; McGraw Hill Education Private Limited: Sydney, NSW, Australia, 2013. [Google Scholar]
  48. Kumi, R.; Reychav, I.; Sabherwal, R. The impact of facilitating conditions on anxiety, attitude, self-efficacy, and performance: Insights from an empirical study of iPad adoption. AIS Electronic Library (AISeL), IAIM Conference, Proceedings 2012, 4. Available online: http://aisel.aisnet.org/siged2012/4 (accessed on 15 December 2022).
  49. Edelhauser, E.; Lupu-Dima, L. Is Romania prepared for eLearning during the COVID-19 pandemic? Sustainability 2020, 12, 5438. [Google Scholar] [CrossRef]
  50. Wu, J.H.; Tennyson, R.D.; Hsia, T.L. A study of student satisfaction in a blended e-learning system environment. Comput. Educ. 2010, 55, 155–164. [Google Scholar] [CrossRef]
  51. Hoque, R.; Sorwar, G. Understanding factors influencing the adoption of mHealth by the elderly: An extension of the UTAUT model. Int. J. Med. Inform. 2017, 101, 75–84. [Google Scholar] [CrossRef]
  52. Revythi, A.; Tselios, N. Extension of technology acceptance model by using system usability scale to assess behavioral intention to use e-learning. Educ. Inf. Technol. 2019, 24, 2341–2355. [Google Scholar] [CrossRef] [Green Version]
  53. Davis, F.D. User acceptance of information technology: System characteristics, user perceptions, and behavioral impacts. Int. J. Man-Mach. Stud. 1993, 38, 475–487. [Google Scholar] [CrossRef] [Green Version]
  54. Byun, S.; Byun, S.E. Exploring perceptions toward biometric technology in service encounters: A comparison of current users and potential adopters. Behav. Inf. Technol. 2013, 32, 217–230. [Google Scholar] [CrossRef]
  55. Ordanini, A.; Miceli, L.; Pizzetti, M.; Parasuraman, A. Crowd-funding: Transforming customers into investors through innovative service platforms. J. Serv. Manag. 2011, 22, 443–470. [Google Scholar] [CrossRef]
  56. Lewis, W.; Agarwal, R.; Sambamurthy, V. Sources of influence on beliefs about information technology use: An empirical study of knowledge workers. MIS Q. 2003, 27, 657–678. [Google Scholar] [CrossRef] [Green Version]
  57. Chang, A. UTAUT and UTAUT 2: A review and agenda for future research. Winners 2012, 13, 10–114. [Google Scholar] [CrossRef]
  58. Williams, M.D.; Rana, N.P.; Dwivedi, Y.K. The unified theory of acceptance and use of technology (UTAUT): A literature review. J. Enterp. Inf. Manag. 2015, 28, 443–488. [Google Scholar] [CrossRef] [Green Version]
  59. Bervell, B.; Umar, I.N. Validation of the UTAUT model: Re-considering non-linear relationships of Exogeneous variables in higher education technology acceptance research. Eurasia J. Math. Sci. Technol. Educ. 2017, 13, 6471–6490. [Google Scholar] [CrossRef] [PubMed]
  60. Shropshire, J.; Warkentin, M.; Sharma, S. Personality, attitudes, and intentions: Predicting initial adoption of information security behavior. Comput. Secur. 2015, 49, 177–191. [Google Scholar] [CrossRef]
  61. Lee, S.M.; Lee, D. Healthcare wearable devices: An analysis of key factors for continuous use intention. Serv. Bus. 2020, 14, 503–531. [Google Scholar] [CrossRef]
  62. Rajan, C.A.; Rupashree, B. Adoption of ERP system: An empirical study of factors influencing the usage of ERP and its impact on end user. IIMB Manag. Rev. 2015, 27, 105–117. [Google Scholar] [CrossRef]
  63. Tam, C.; Santos, D.; Oliveira, T. Exploring the influential factors of continuance intention to use mobile Apps: Extending the expectation confirmation model. Inf. Syst. Front. 2020, 22, 243–257. [Google Scholar] [CrossRef]
  64. Lee, D.C.; Lin, S.H.; Ma, H.L.; Wu, D.B. Use of a modified UTAUT model to investigate the perspectives of internet access device users. Int. J. Hum.–Comput. Interact. 2017, 33, 549–564. [Google Scholar] [CrossRef]
  65. Ajzen, I.; Fishbein, M.; Lohmann, S.; Albarracín, D. The influence of attitudes on behavior. In The Handbook of Attitudes, 2nd ed.; Vol. 1: Basic Principles; Routledge: New York, NY, USA, 2018; pp. 197–255. [Google Scholar] [CrossRef]
  66. Ringle, C.M.; Wende, S.; Becker, J.-M. ”SmartPLS 4.” Oststeinbek: SmartPLS GmbH. J. Appl. Struct. Equ. Model. 2022. Available online: http://www.smartpls.com (accessed on 1 December 2022).
  67. Zeng, N.; Liu, Y.; Gong, P.; Hertogh, M.; König, M. Do right PLS and do PLS right: A critical review of the appli-cation of PLS-SEM in construction management research. Front. Eng. Manag. 2021, 8, 356–369. [Google Scholar] [CrossRef]
  68. Hair, J.F.; Risher, J.J.; Sarstedt, M.; Ringle, C.M. When to use and how to report the results of PLS-SEM. Eur. Bus. Rev. 2019, 31, 2–24. [Google Scholar] [CrossRef]
  69. Hair, J.F., Jr.; Sarstedt, M.; Hopkins, L.; Kuppelwieser, V.G. Partial least squares structural equation modeling (PLS-SEM): An emerging tool in business research. Eur. Bus. Rev. 2014, 26, 106–121. [Google Scholar] [CrossRef]
  70. Fornell, C.; Larcker, D. FEvaluating structural equation models with unobservable variables and measurement error. J. Mark. Res. 1981, 18, 39–50. [Google Scholar] [CrossRef]
  71. Becker, J.M.; Klein, K.; Wetzels, M. Hierarchical latent variable models in PLS-SEM: Guidelines for using reflective-formative type models. Long Range Plan. 2012, 45, 359–394. [Google Scholar] [CrossRef]
  72. Hair, J.F., Jr.; Howard, M.C.; Nitzl, C. Assessing measurement model quality in PLS-SEM using confirmatory composite analysis. J. Bus. Res. 2020, 109, 101–110. [Google Scholar] [CrossRef]
  73. Wong, K.K.-K. Partial least squares structural equation modeling (PLS-SEM) techniques using SmartPLS. Market. Bull. 2013, 24, 1–32. [Google Scholar]
  74. Yu, C.S. Factors affecting individuals to adopt mobile banking: Empirical evidence from the UTAUT model. J. Electron. Commer. Res. 2012, 13, 104. [Google Scholar]
  75. Kuemmerle, T.; Chaskovskyy, O.; Knorn, J.; Radeloff, V.C.; Kruhlov, I.; Keeton, W.S.; Hostert, P. Forest cover change and illegal logging in the Ukrainian Carpathians in the transition. Remote Sens. Environ. 2009, 113, 1194–1207. [Google Scholar] [CrossRef]
  76. Lakatos, M.; Szentimrey, T.; Bihari, Z.; Szalai, S. Creation of a homogenized climate database for the Carpathian region by applying the MASH procedure and the preliminary analysis of the data. Időjárás 2013, 117, 143–158. [Google Scholar]
  77. Regional Environmental Center for Central and Eastern Europe and the European Academy Bolzano. Handbook on the Carpathian Convention; The Regional Environmental Center for Central and Eastern Europe: Szentendre, Hungary, 2007.
Disclaimer/Publisher’s Note: The statements, opinions, and data contained in all publications are solely those of the individual author(s) and contributor(s) and not of MDPI and/or the editor(s). MDPI and/or the editor(s) disclaim responsibility for any injury to people or property resulting from any ideas, methods, instructions or products referred to in the content.
Figure 1. Study area. Source: GeoSES project [41].
Land 12 00752 g001
Figure 2. GeoSES Monitoring System.
Land 12 00752 g002
Figure 3. Sighetu Marmației city—map of susceptibility to landslides. Source: GeoSES project [41].
Land 12 00752 g003
Figure 4. WebGIS portal and mobile application. Source: GeoSES project [38].
Land 12 00752 g004
Figure 5. Proposed model. Source: authors.
Land 12 00752 g005
Figure 6. Analysis of the causal relationship in the structural equation model.
Land 12 00752 g006
Table 2. Questionnaire regarding the beneficiaries’ perception of the use of GeoSES-MS.
Performance Expectancy (PE-4 Items)
PE1—The GeoSES monitoring system enhances the precision and responsiveness of emergency management teams
PE2—In the phase of disaster response, the GeoSES monitoring system can enhance efficacy and efficiency.
PE3—The authorities and rescue organizations will find the GeoSES monitoring system valuable.
PE4—The GeoSES monitoring system helps increase the efficiency of emergency management teams.
Perceived Effort of Use (PEU-3 items)
PEU1—The monitoring system for GeoSES is user-friendly.
PEU2—The GeoSES monitoring system’s data improve effective knowledge acquisition.
PEU3—Your communications with the GeoSES monitoring system will be straightforward and easily understood.
Information Requirement Characteristics (IRC-4 items)
IRC1—Information provided by GeoSES monitoring system can be used for the prediction of real-time disaster information.
IRC2—Integrated information can be accessed from GeoSES project participants through the WebGIS platform.
IRC3—Better decisions can be made by accessing GeoSES WebGIS portal.
IRC4—Information provided by GeoSES monitoring can be analyzed by large groups of users.
Education in Disaster Risk Reduction (EDRR-3 items)
EDRR 1—The GeoSES monitoring system is relevant to disaster risk knowledge involving rescue operation.
EDRR 2—The GeoSES monitoring system is important for disaster risk knowledge as a partially/fully disaster management organization.
EDRR 3—The GeoSES monitoring system is appropriate for disaster risk knowledge due to its outputs like hazard risk maps.
Intention of Use (IU-3 items)
IU1—It is prudent to adopt the GeoSES monitoring system for landslide disaster risk.
IU2—Our organization is aided by the GeoSES monitoring system in terms of saving lives and property.
IU3—GeoSES monitoring system is an effective disaster mitigation tool for our community.
GeoSES Monitoring System Use (GMSU-3 items)
GMSU 1—Using the GeoSES monitoring system helps us in making decisions.
GMSU 2—If we obtain the GeoSES monitoring system, we will use it to plan rescue efforts.
GMSU 3—Using the GeoSES monitoring system enables us to strengthen interaction with all stakeholders in the cross-border region to prevent emergency scenarios.
Table 3. Indicators of reliability and validity.
ConstructsCronbach’s αComposite Reliability (CR)Average Variance Extracted (AVE)
IU0.7760.7740.707
PE0.8570.8600.721
EDRR0.5770.7560.698
PEU0.8540.8440.732
IRC0.9250.9120.894
GMSU0.7610.7450.683
Table 4. Matrix of correlations.
IUPEEDRRPEUIRCGMSU
IU0.818
PE0.4050.847
EDRR0.4710.4780.839
PEU0.4370.4280.3210.785
IRC0.3650.2420.2390.4230.817
GMSU0.4690.2960.4750.2990.4620.785
Table 5. Correlation matrix of reflective/latent variables.
IUPUEDRRPEUIRCGMSU
IU10.747
IU20.723
IU30.744
PE1 0.811
PE2 0.799
PE3 0.802
PE4 0.771
EDRR1 0.731
EDRR2 0.729
EDRR3 0.718
PEU 1 0.788
PEU 2 0.879
PEU 3 0.882
IRC 1 0.815
IRC 2 0.843
IRC 3 0.832
IRC 4 0.811
GMSU1 0.938
GMSU 2 0.940
GMSU 3 0.921
Table 6. Discriminant validity test.
IUPEEDRRPEUPEICGMSU
IU0.719
PE0.5980.836
EDRR0.4810.4780.726
PEU0.4970.4880.3530.835
PEIC0.3650.2320.2490.3230.801
GMSU0.4690.2760.3550.2830.3690.798
Table 7. Testing the hypotheses in the structural model.
HypothesisRelationshipPath Coef. bStandard Deviation (STDEV)T-Statisticsp ValuesHypothesis Status
H1PE -> IU0.3630.04452300.000Supported
H1PEU -> IU0.3100.03510.2730.000Supported
H3IRC -> IU0.3840.02258300.000Supported
H4EDRR > GMSU0.3510.0385.3610.000Supported
H5IU > GMSU0.3750.04283320.000Supported
Disclaimer/Publisher’s Note: The statements, opinions and data contained in all publications are solely those of the individual author(s) and contributor(s) and not of MDPI and/or the editor(s). MDPI and/or the editor(s) disclaim responsibility for any injury to people or property resulting from any ideas, methods, instructions or products referred to in the content.

