Article

Assessing Land-Use Conflict Potential and Its Correlation with LULC Based on the Perspective of Multi-Functionality and Landscape Complexity: The Case of Chengdu, China

1
School of Architecture, Southwest Jiaotong University, Chengdu 611756, China
2
Sichuan Institute of Land and Spatial Planning, Chengdu 610000, China
*
Author to whom correspondence should be addressed.
Land 2023, 12(4), 742; https://doi.org/10.3390/land12040742
Submission received: 14 February 2023 / Revised: 21 March 2023 / Accepted: 23 March 2023 / Published: 25 March 2023

Abstract

:
The rapid development of megacities has greatly impacted land use in the urban–rural fringe area. The Western Protected Area defined by Chengdu’s Master Plan (2016–2035) to end the unrestrained urban sprawl, where locates the most superior agricultural and ecological resources, namely Mount Qingcheng and the Dujiangyan Essence Irrigation District, is facing great challenges when implementing protective strategies, related to huge land use competition caused by land multi-functionality. To better assess and understand land-use conflict and its influence, this paper constructs a comprehensive evaluation model with ‘multi-functionality and landscape complexity’ based on existing research, with a 1 km × 1 km spatial resolution, and analyzes its relationship with land-use and land-cover (LULC) change, based on 30 m land resolution data from 2000, 2010, and 2020, produced by the Institute of Resource and Environmental Science and the Data Center of the Chinese Academy of Sciences. Overall, two kinds of land-use conflict concerning function suitability and landscape pattern co-emerge spatially, but there also exist “high-low” combinations. The result shows that land consolidation or the adjustment of land use might take place more often when both the suitability conflict and the landscape conflict reach a certain threshold. The results provide enlightenment for further expanding the quantitative research on land-use conflict and confirm the potential of applying the land-use conflict index in delineating territorial spatial planning control areas.

1. Introduction

Accompanied by huge scale rural–urban immigration, food/energy consumption adjustment, and a massive influx of investment into rural areas, the rural land-use function is becoming more and more diversified, which has caused dramatic challenges for cultivated land protection and ecological protection by initiating frequent land-use conflicts [1]. According to the third Chinese national land survey, cultivated land has been reduced by 7.5 million hectares, largely due to the net flow of cultivated land into forest land with the implementation of the Landscape Greening Project. In the Chengdu Plain Economic Zone, a region in southwest China known as the “Tianfu granary”, the reduction has reached 40 percent in the last 10 years, which makes it quite urgent that conflict management is carried out in this area.
Land-use conflict has exacerbated the contradiction between the economic benefits, ecological benefits, and social benefits, with land scarcity and land-use diversification as the basic driving mechanism, and has gained extensive attention from scholars [2,3,4]. More and more research has tried to utilize various quantitative methods to measure the intensity or potential of land-use conflict. On one hand, land-use multi-functionality has been used as a quantitative empirical method to assess potential land-use conflicts by many scholars [5,6,7]. The criterion indicator generally includes natural conditions, locational conditions, and social conditions. However, inconsistency exists at the third-level indicator due to the data sources used in further research, for e.g., a lack of soil data when calculating the suitability of agricultural production and the ambiguity of social condition indicators when calculating the suitability for life. Some studies make the supplementation by imploring land survey data and zoning maps [8]. Special research provides a detailed guide for this study, by constructing a comprehensive indicator system to assess the conflict between agriculture and ecology [9]. On the other hand, the landscape ecological risk index is another assessment method widely used by scholars, with three dimensions of complexity (risk sources), fragility (risk receptors), and stability (risk effects) of the land-use cover [10,11,12,13]. However, no research exists examining and comparing the relationship between different assessment methods [14]. More important is the lack of practical verification of the prediction effect of these indicators on land-use transfer. Research papers on land-use and land-cover change [15,16] have also ignored the need to include land-use conflict as an important independent variable, focusing more on social and economic factors rather than land use and landscape characteristics.
This study is trying to put forward the research on land-use conflict in Chengdu’s Western Protected Area, as a case for empirical analysis using multi-sourced data on land use and the natural–economic–social elements, compared to the two most frequently used land-use conflict identification methods, namely the land-use function conflict based on establishing an evaluation system of land-use function suitability and the ecological risk based on landscape metrics. Furthermore, this paper details the potential distribution characters of land-use conflict and its relationship with land-cover change, which reveal the underlying impact mechanisms of land-use conflict in a more quantitative way.

2. Materials and Methods

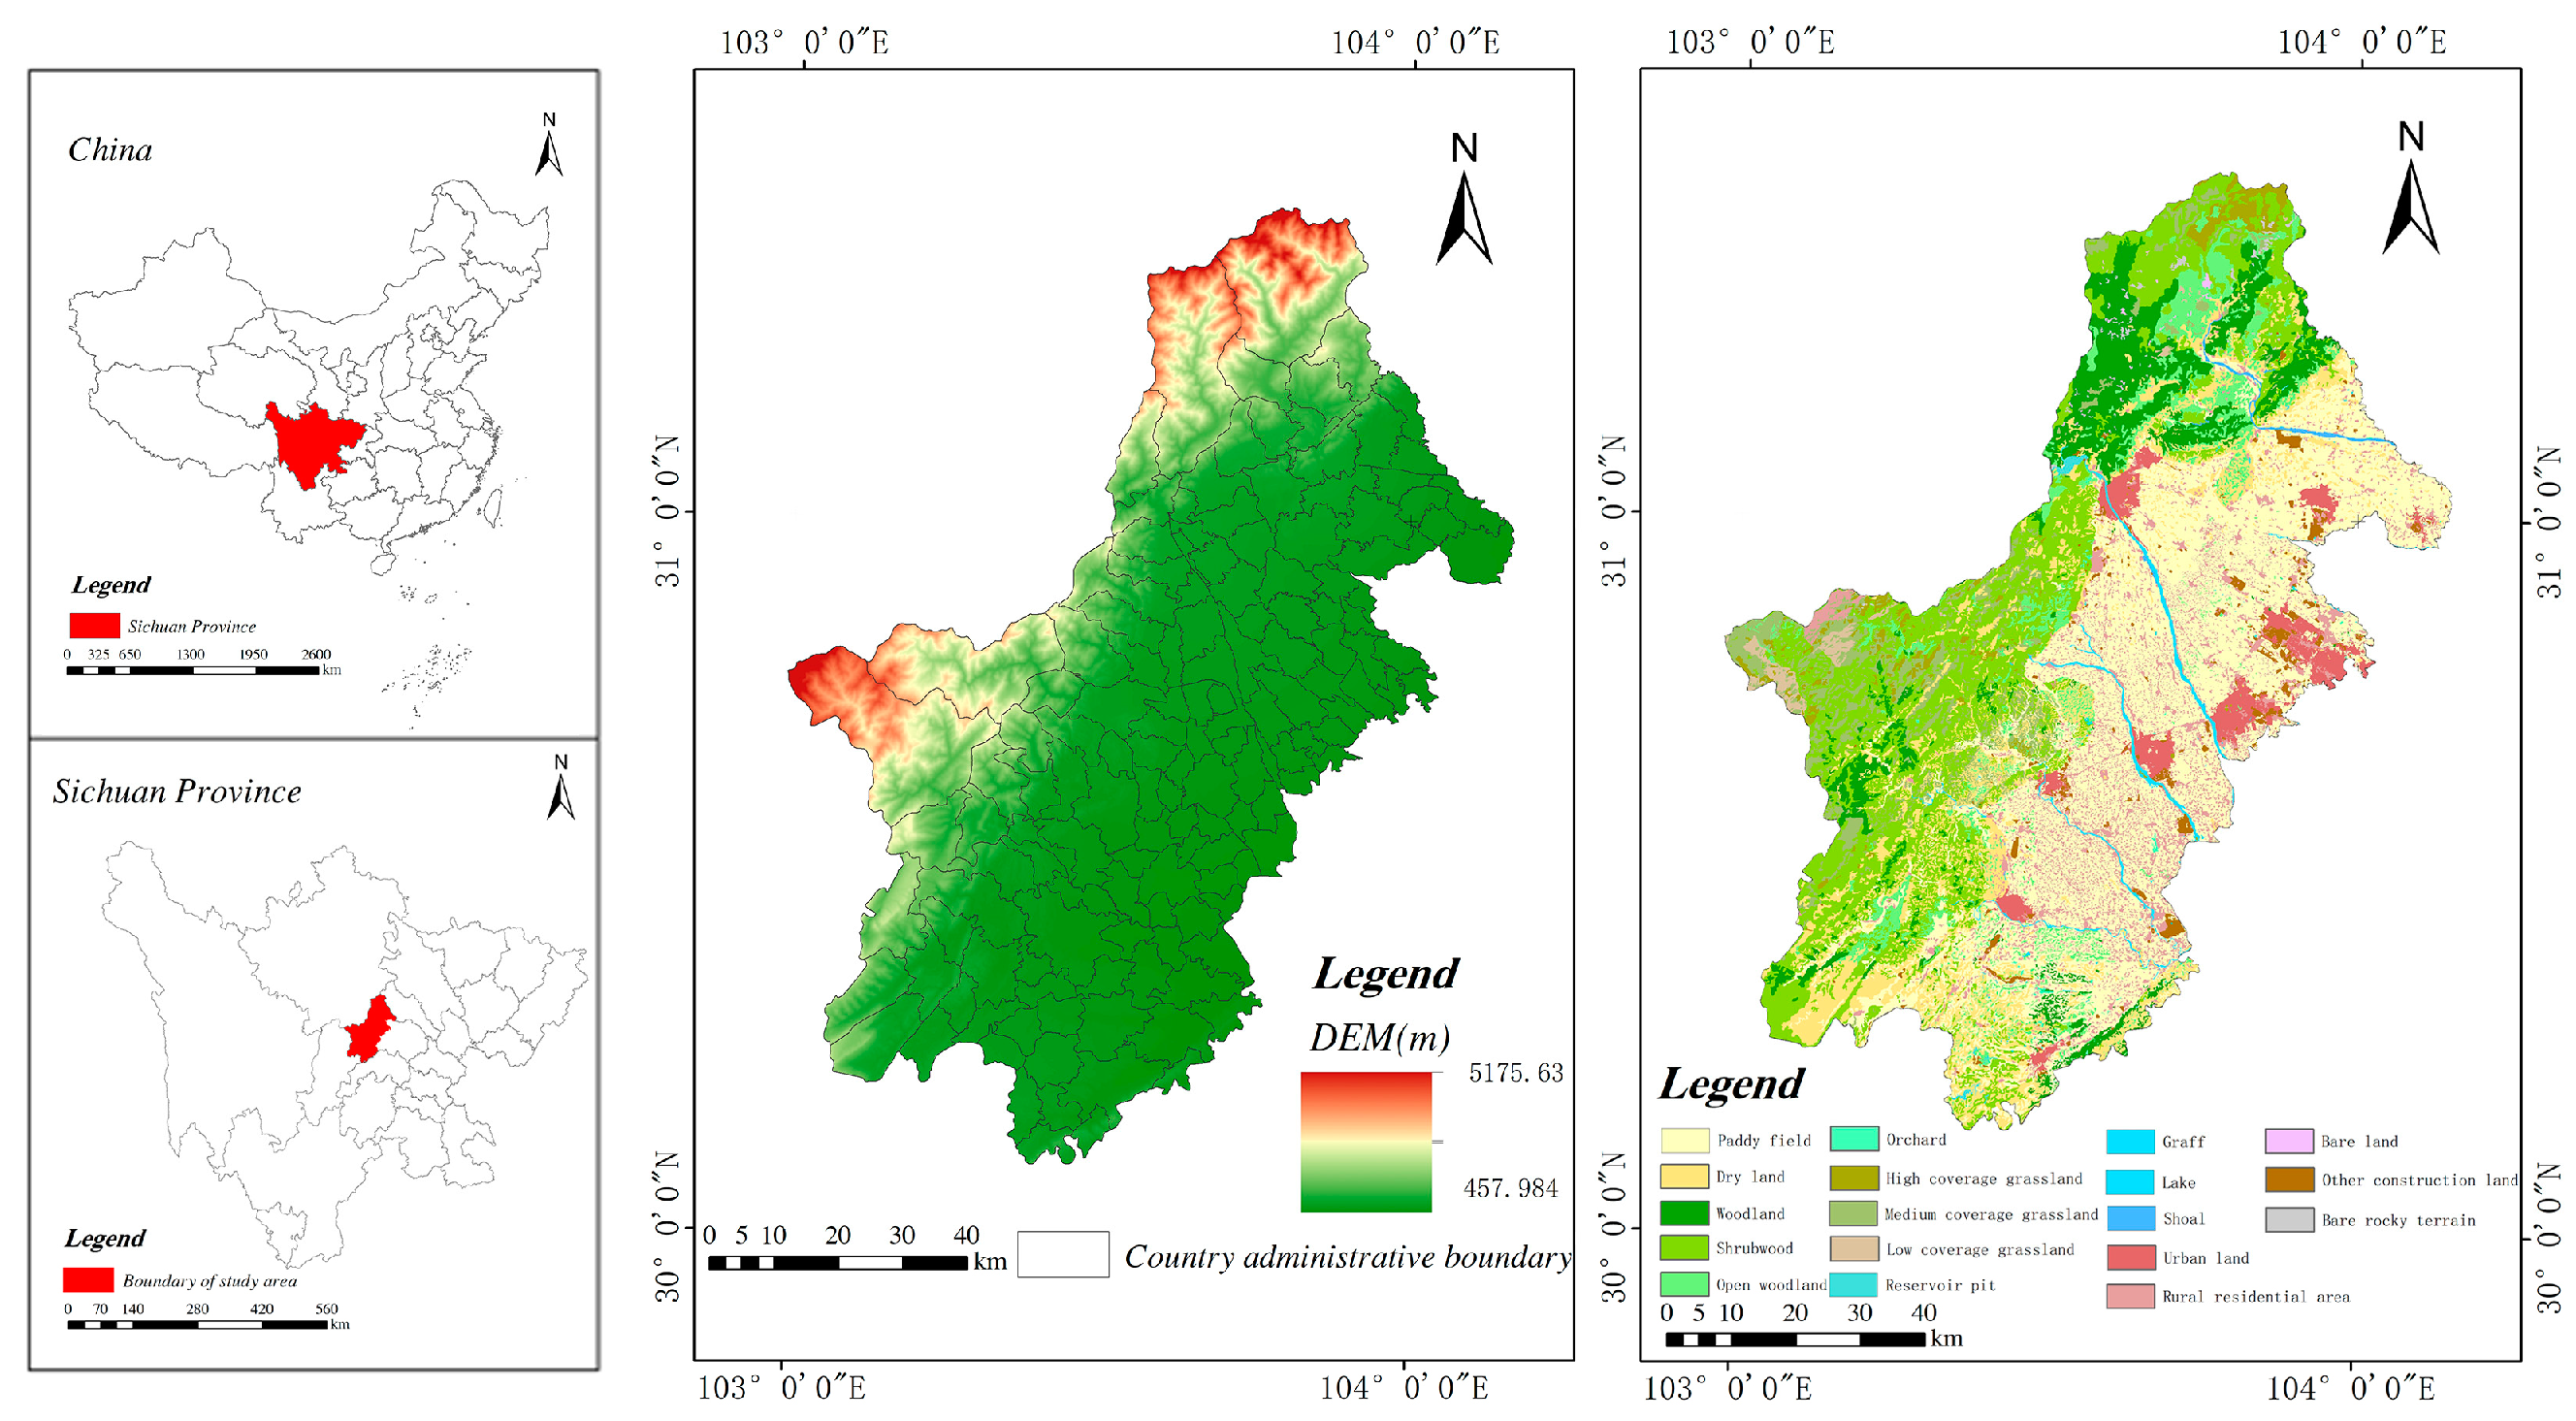
2.1. Research Area and Data

The “Western Protected Area” is defined by Chengdu’s Master Plan (2016–2035) to end the unrestrained urban sprawl, which includes the location of the most superior ecological resources and is the origin of the Minjiang and Tuojiang watershed. It contains 8 districts outside the urban ring expressway, with 136 towns (7185 km2). We include all the towns in these 8 districts as research sites, considering conflict in the urban–rural fringe designated as an ecological zone around the city. Mountain Qing Cheng, a world heritage and famous National Scenic Park, and the Dujiangyan Essence Irrigation District, another world heritage site due to its irrigation system, are both located in the “Western Protected Area”, which increased its particularity as a research base (Figure 1).
This study used land cover type data with a 30 m spatial resolution for 2000, 2010, and 2020, which was produced by the Institute of Resource and Environmental Science and the Data Center of the Chinese Academy of Sciences (https://www.resdc.cn/ (accessed on 1 May 2022)), by visual interpretation using Landsat MSS, Landsat TM/ETM, and Landsat 8 data [17]. In addition to land-use data, we also collected other multiple-source data, including natural condition data and social condition data, to meet the needs of evaluating land-use functions. As for the social conditions, we calculated the distance datasets using the “Euclidean Distance” analysis function in ArcGIS 10.6, containing the distance from the main roads above the county level (DR), the distance from major rivers (RIV), the distance from the township (DT), the distance from education facilities (DEF), and the distance from medical facilities (DMF), with road and river data, and a facility data download from the Baidu map. Soil quality was supplemented by the Institute of Resource and Environmental Science and the Data Center of the Chinese Academy of Sciences and CASEarth (Big Earth Data for three poles, http://poles.tpdc.ac.cn/zh-hans/ (accessed on May 2022)), for e.g., the content of organic, phosphorus, potassium, pH value, erosion, soil texture type (ST), and agricultural output per km2. Weather and terrain data, including slope, elevation, geological disaster probability (GDsP), average annual temperature (AT), and average annual precipitation (AP), were also collected, mainly provided by the Institute of Resource and Environmental Science and the Data Center of the Chinese Academy of Sciences, as well as economic (GDP per km2) and population data (pop per km2). As for the ecological evaluation, we used data produced by the Institute of Mountain Hazards and Environment in Chengdu, which is a branch of the Chinese Academy of Science, namely water and soil loss vulnerability (WSLV), water conservation (WC), soil conservation (SC), and biodiversity conservation (BC).
The research framework is shown in Figure 2, and the evaluation model is explained in Section 2.2.

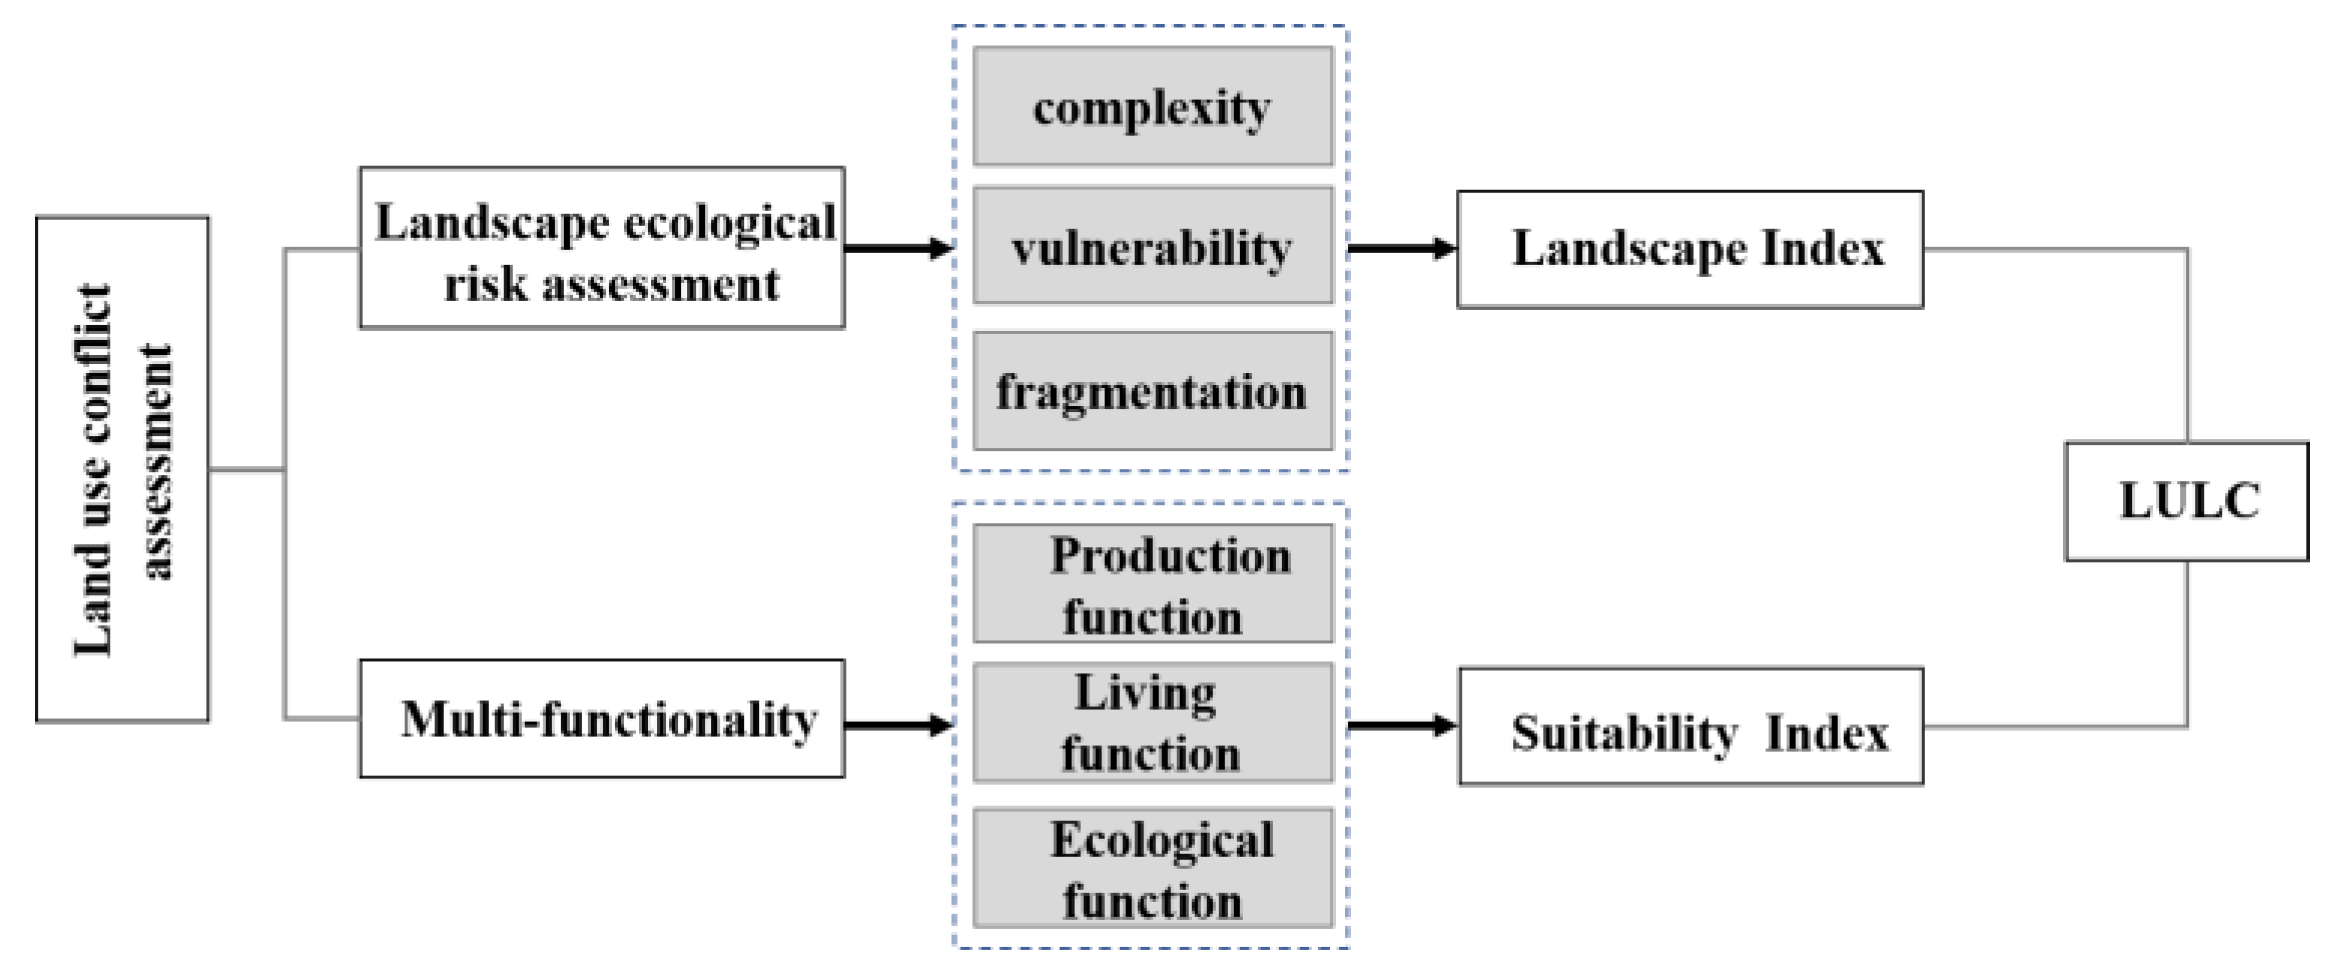
2.2. Research Methods and Assessment Model

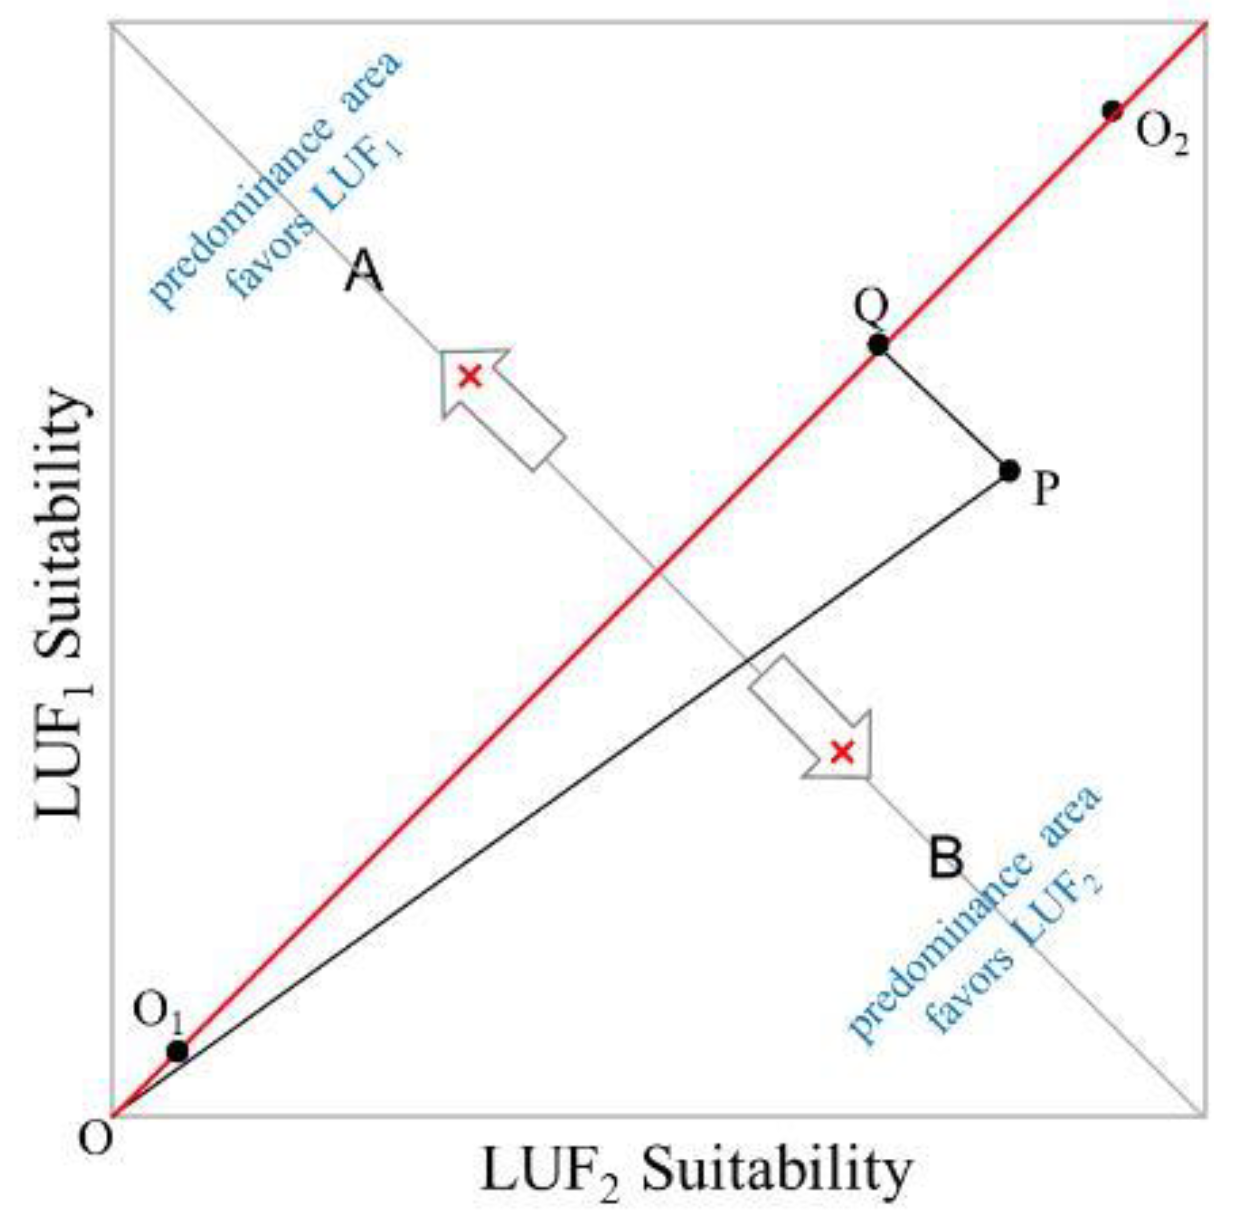
2.2.1. Developing an Assessment Model of Land-Use Conflict Based on Multi-Functionality

With references to other papers on land-use multi-functionality assessment [18,19] and the “Technical Guide for Suitability Evaluation of Territorial Space Development” published by China’s Ministry of Natural Resources, this paper includes our assessment system (see Table 1). Based on the resolution of the available data and a reasonable research scale, land-use conflict is analyzed with 1 km spatial resolution. In order to make classification assignments from 1–5 for each evaluation index, the natural breakpoint method is used, where 5 refers to the highest score and 1 refers to the lowest. Then, the entropy weight method is used to calculate the basic index weight, with the entropy weight of the index k calculated using Formula (1), in which ek is the entropy value of the index k and is calculated using Formula (2). p k j refers to the proportion of the average value of index k in the total of this index, calculated with normalized value.
u k = ( 1 e k ) / k n ( 1 e k ) ,
e k = j = 1 m ( p k j l n p k j ) / ln ( m ) ,
The adjustment is executed by referring to the existing research and opinions of planning practitioners.
The method most used when identifying the land-use conflict zone involves the construction of 27 combinations of multi-land use functions by categorizing each special unit into strong (S), medium (M), and weak (W) levels, according to the natural breakpoint. The deficiency is apparent when used in later analysis, due to too many conflict types, even though scholars merged all the elements into 8 strong categories and 16 medium categories [8]. We constructed a new suitability conflict assessment index normalized by using the newly emerged calculation method for land-use multi-functional trade-off synergy status [20]. Figure 3 shows the conflict potential between specifical land-use functions (e.g., L U F 1 and L U F 2 ). Points O1 and O2 are located on the 45° straight line, representing the ‘weak-weak’ and ‘strong-strong’ combination, respectively. The stronger the conflict level will be when a spatial unit is closer to point O2. The distance away from the 45° straight line in the A and B regions represents the relative advantage favoring the L U F 1 or L U F 2 . We define |OP − PQ| as the quantitative index to measure the degree of suitability conflict potential. The detailed calculation equation is as below:
L U F C = L U F 1 2 + L U F 2 2 | ( L U F 1 L U F 2 ) | 2 / 2 ,
Then 3 sets of potential conflict values are obtained, and, thus, the maximum results for land-use conflict for the specific unit.

2.2.2. Assessment Model of Land-Use Conflict Based on Landscape Ecology

The land-use conflict measurement index is constructed, namely the SSCI, shown in Formula (4). The complexity index ( C I ) is mainly calculated by the area-weighted patch fractal dimension ( A W M P F D ) using fragstats. The higher the fractal index is, the more likely it is to be interfered with by the surrounding adjacent landscapes, shown in Formula (5). The vulnerability index ( F I ) represents the resistance to interference. It is commonly accepted that different land cover types have different degrees of resistance, while the list from weak to strong is built-up land (1), forest (2), grassland (3), arable land (4), water (5), and unused land (6) [21], shown as Formula (6). The stability index (SI) is represented by the patch density (PD), shown in Formula (7). A higher PD means a high degree of landscape fragmentation, a lower recovery capability after interference, and worse stability. However, the FI index calculated by the landscape ecological risk is more biased towards ecological vulnerability [22], so the S C C I N index is proposed to calculate the potential of land-use conflict in this paper, shown in Formula (8). Land cover data with a 30 m spatial resolution were collected, and land-use conflict focused on landscape ecological risk was analyzed with a 1 km spatial resolution to be in accordance with the L U F C .
S C C I = C I + F I S I ,
A W M P F D = i = 1 m j = 1 n [ 2 ln ( 0.25 P i j ) ln ( a i j ) ( a i j A ) ] ,
F I = i = 0 n F i × a i S ( n = 4 ) ,
S I = 1 P D P D m i n P D m a x P D m i n ,
S C C I N = C I S I ,

2.2.3. Multivariate Linear Regression Model of Land-Use/Cover Change

In the multivariate linear regression (MLR) model, variables that have multicollinearity can be filtered and removed using a stepwise regression. Research has shown that land-use change is driven by various factors: population aggregation and economic development are two major driving forces of land-use change [23], the growth of infrastructure and residential facilities would significantly increase fixed assets investment (FAI), which in turn stimulates land-use change [24], which could be measured using road length and the number of POIs in the analysis unit. As the urbanization level casts great importance, we also used the distance from urban areas as control variables. We assumed that land-use change is stimulated by land-use conflict, a multivariate linear regression model was used to detect the relative importance of the land-use function conflict and landscape conflict, the interaction effect was also considered. All the data were calculated into a grid-based unit with a 1 km spatial resolution. Then the parameters were estimated in the MLR by ordinary least squares, and significance was accepted at p = 0.01. The statistical analyses were conducted in Python 3.7.

3. Results

3.1. Spatial Distribution Characteristics of Land-Use Conflict

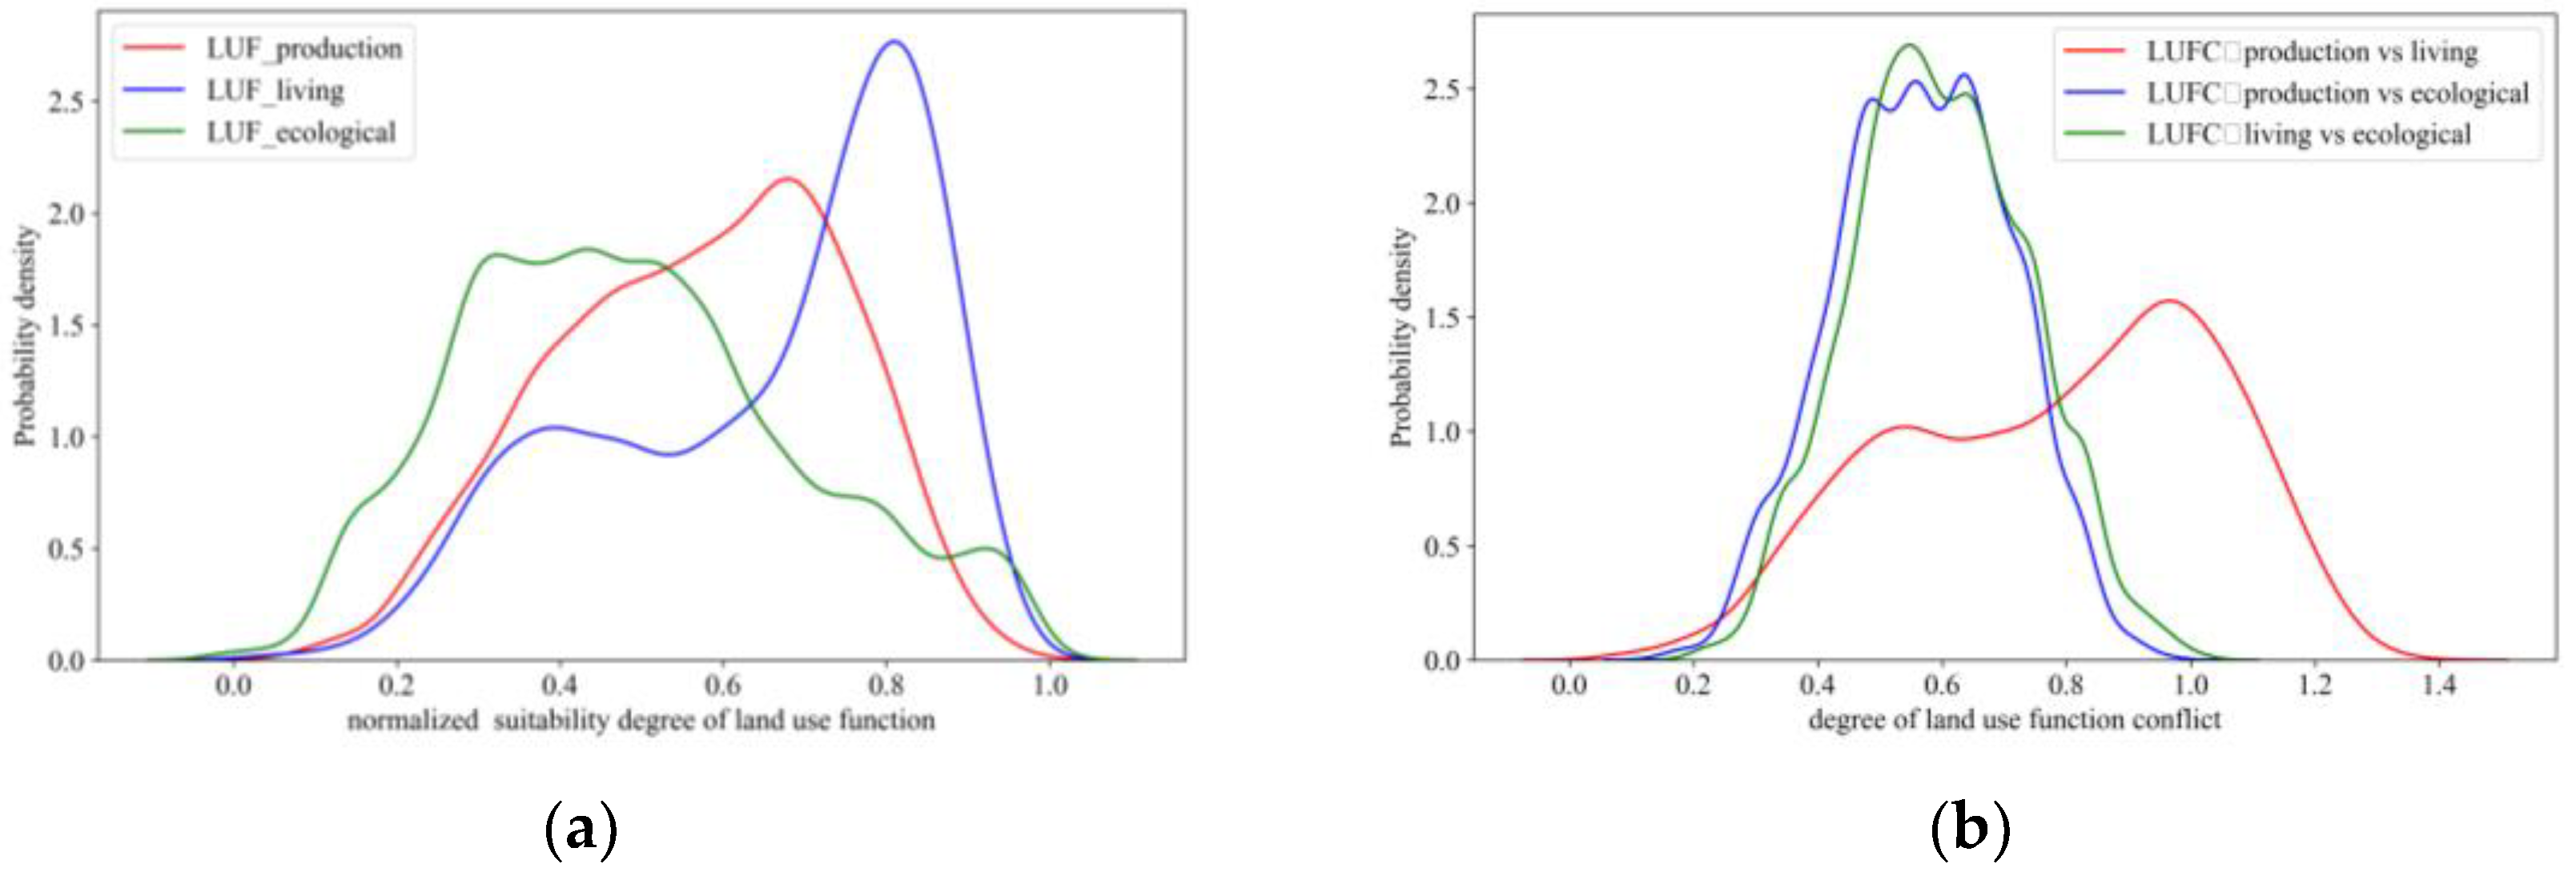
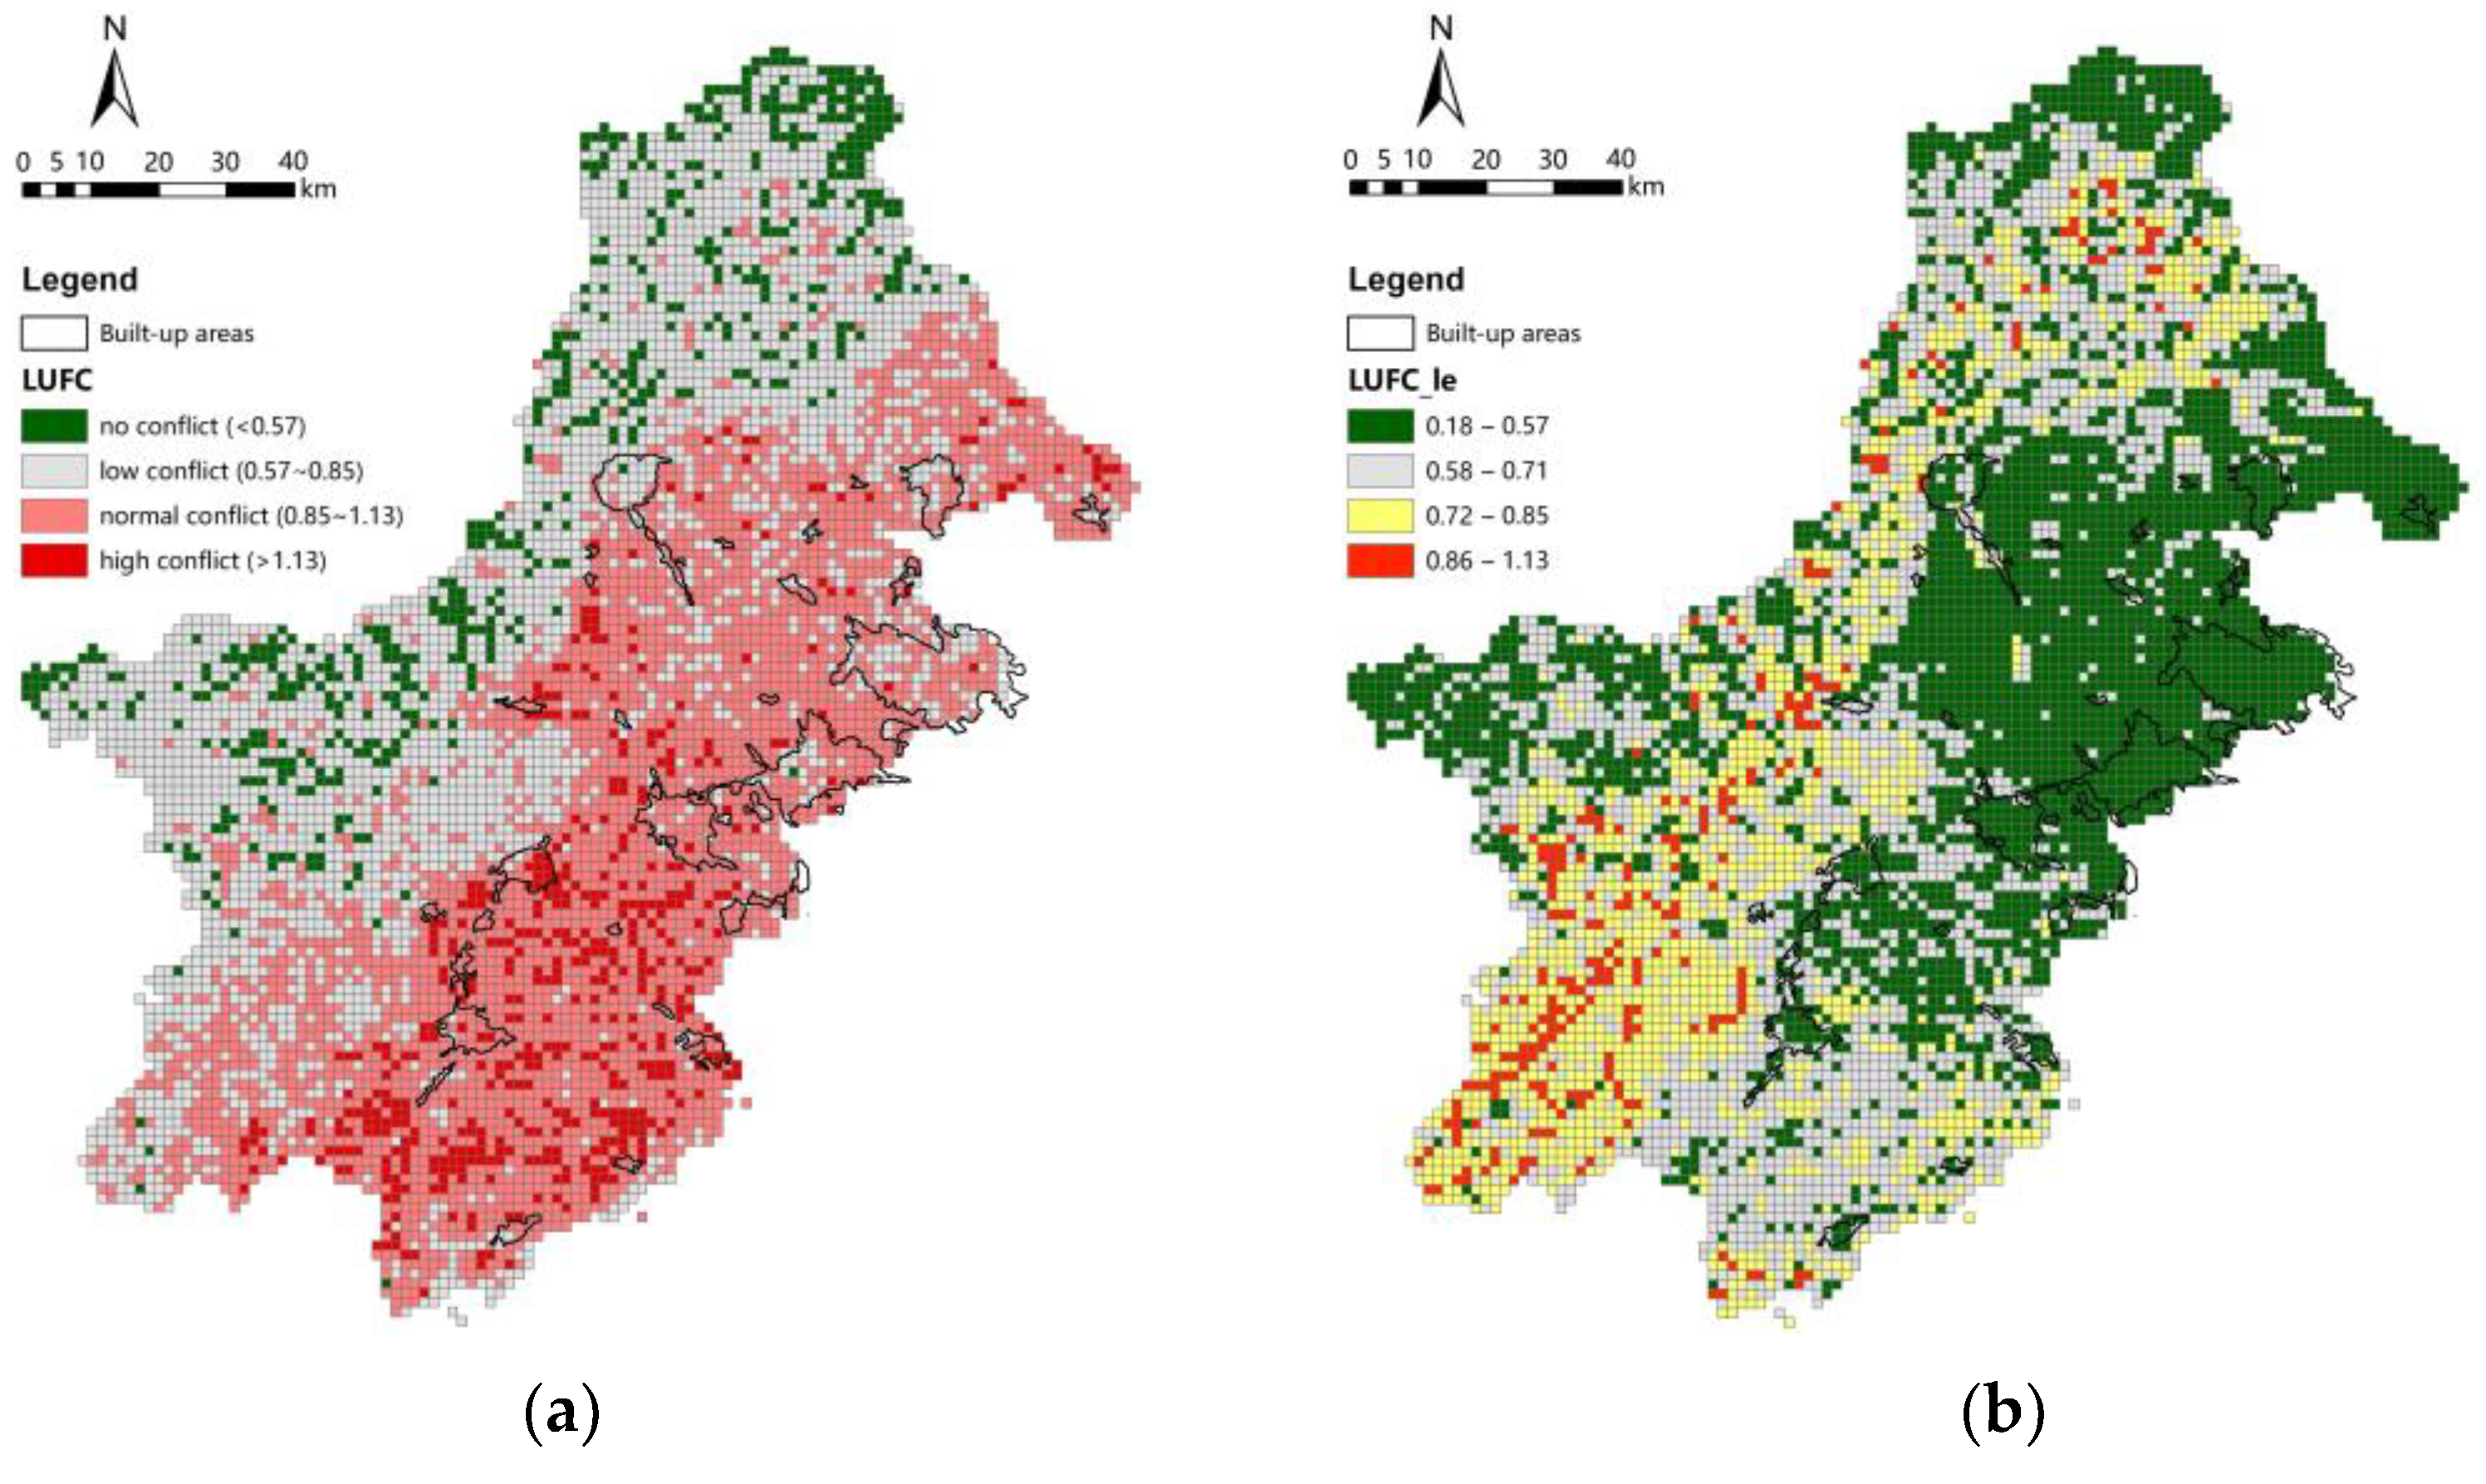
3.1.1. LUFC Zones Based on Multi-Functionality

The suitability conflict between the production and living function is dominant, which is to some extent due to the lack of high suitability of the ecological units, as shown in the probability distribution diagram (Figure 4). The suitability degree can be divided into four partitions, with a normalized LUF value for each function; units with an LUF ≥ 0.8 are of the highest suitability, while units with a 0.8 > LUF ≥ 0.6 are slightly high. Then, LUFC ≥ 1.13 means high conflict units, and LUFC ≥ 0.85 are for normal conflict units, according to Formula (1). In 7069 spatial units, 6.9% (488) are of high conflict, while 42.8% (3027) are of normal conflict. The sensitivity analysis (Table 2) shows that conflict units dramatically decrease while the suitability threshold increases, for e.g., 13.0% (916) are conflict units if the LUFC is calculated with LUF ≥ 0.76, and 21.1% (1489) if calculated with LUF ≥ 0.72. This result further proved the disadvantage of the traditional methods, which divide suitability grade according to the natural breakpoint method and delineate the conflict units according to suitability combinations, while the quantitative measurement index proposed by this paper enhances the flexibility of the conflict unit identification and delimitation, aimed at strengthening territorial management accordingly.
The conflict units are mainly distributed in the plain area (Figure 5a), which align with the fact that the plain area of Chengdu is suitable for urban and rural construction as well as agricultural planting due to the good irrigation system, while a small number of ecological–living and ecological–production conflict units are distributed in the western mountainous area. As for the vulnerability of ecological areas, the identification of conflict unit thresholds can be moderately reduced to reflect conflict more accurately in the shallow mountain areas of the Long Quan (Figure 5b).
Setting 0.8 > LUF ≥ 0.6 as a slightly high suitability threshold, we detect urban and rural construction land, forest land, and cultivated land as the main component of the land-use structure of the conflict unit, with a small amount of grassland and water. From 2000 to 2020, urban and rural construction land in the high conflict unit increased by 22.1 km2 and cultivated land decreased by 26.1 km2, while construction land in the normal conflict unit increased by 199.5 km2 and cultivated land decreased by 224.0 km2, which confirms the judgment detailed before that the conflict between agricultural production and living functions are dominant. What is more, as shown in Table 3, the proportion of forest land in conflict units is about 13.5%~14.3%. Forest land increased by 28.6 km2 from 2000 to 2020, indicating that the net flow of other land types into forest land was also very large, especially in the first 10 years, as China officially launched the implementation of large eco-projects, such as concerning natural forest resource protection or the return of farmland to forests in specific areas since 2001.

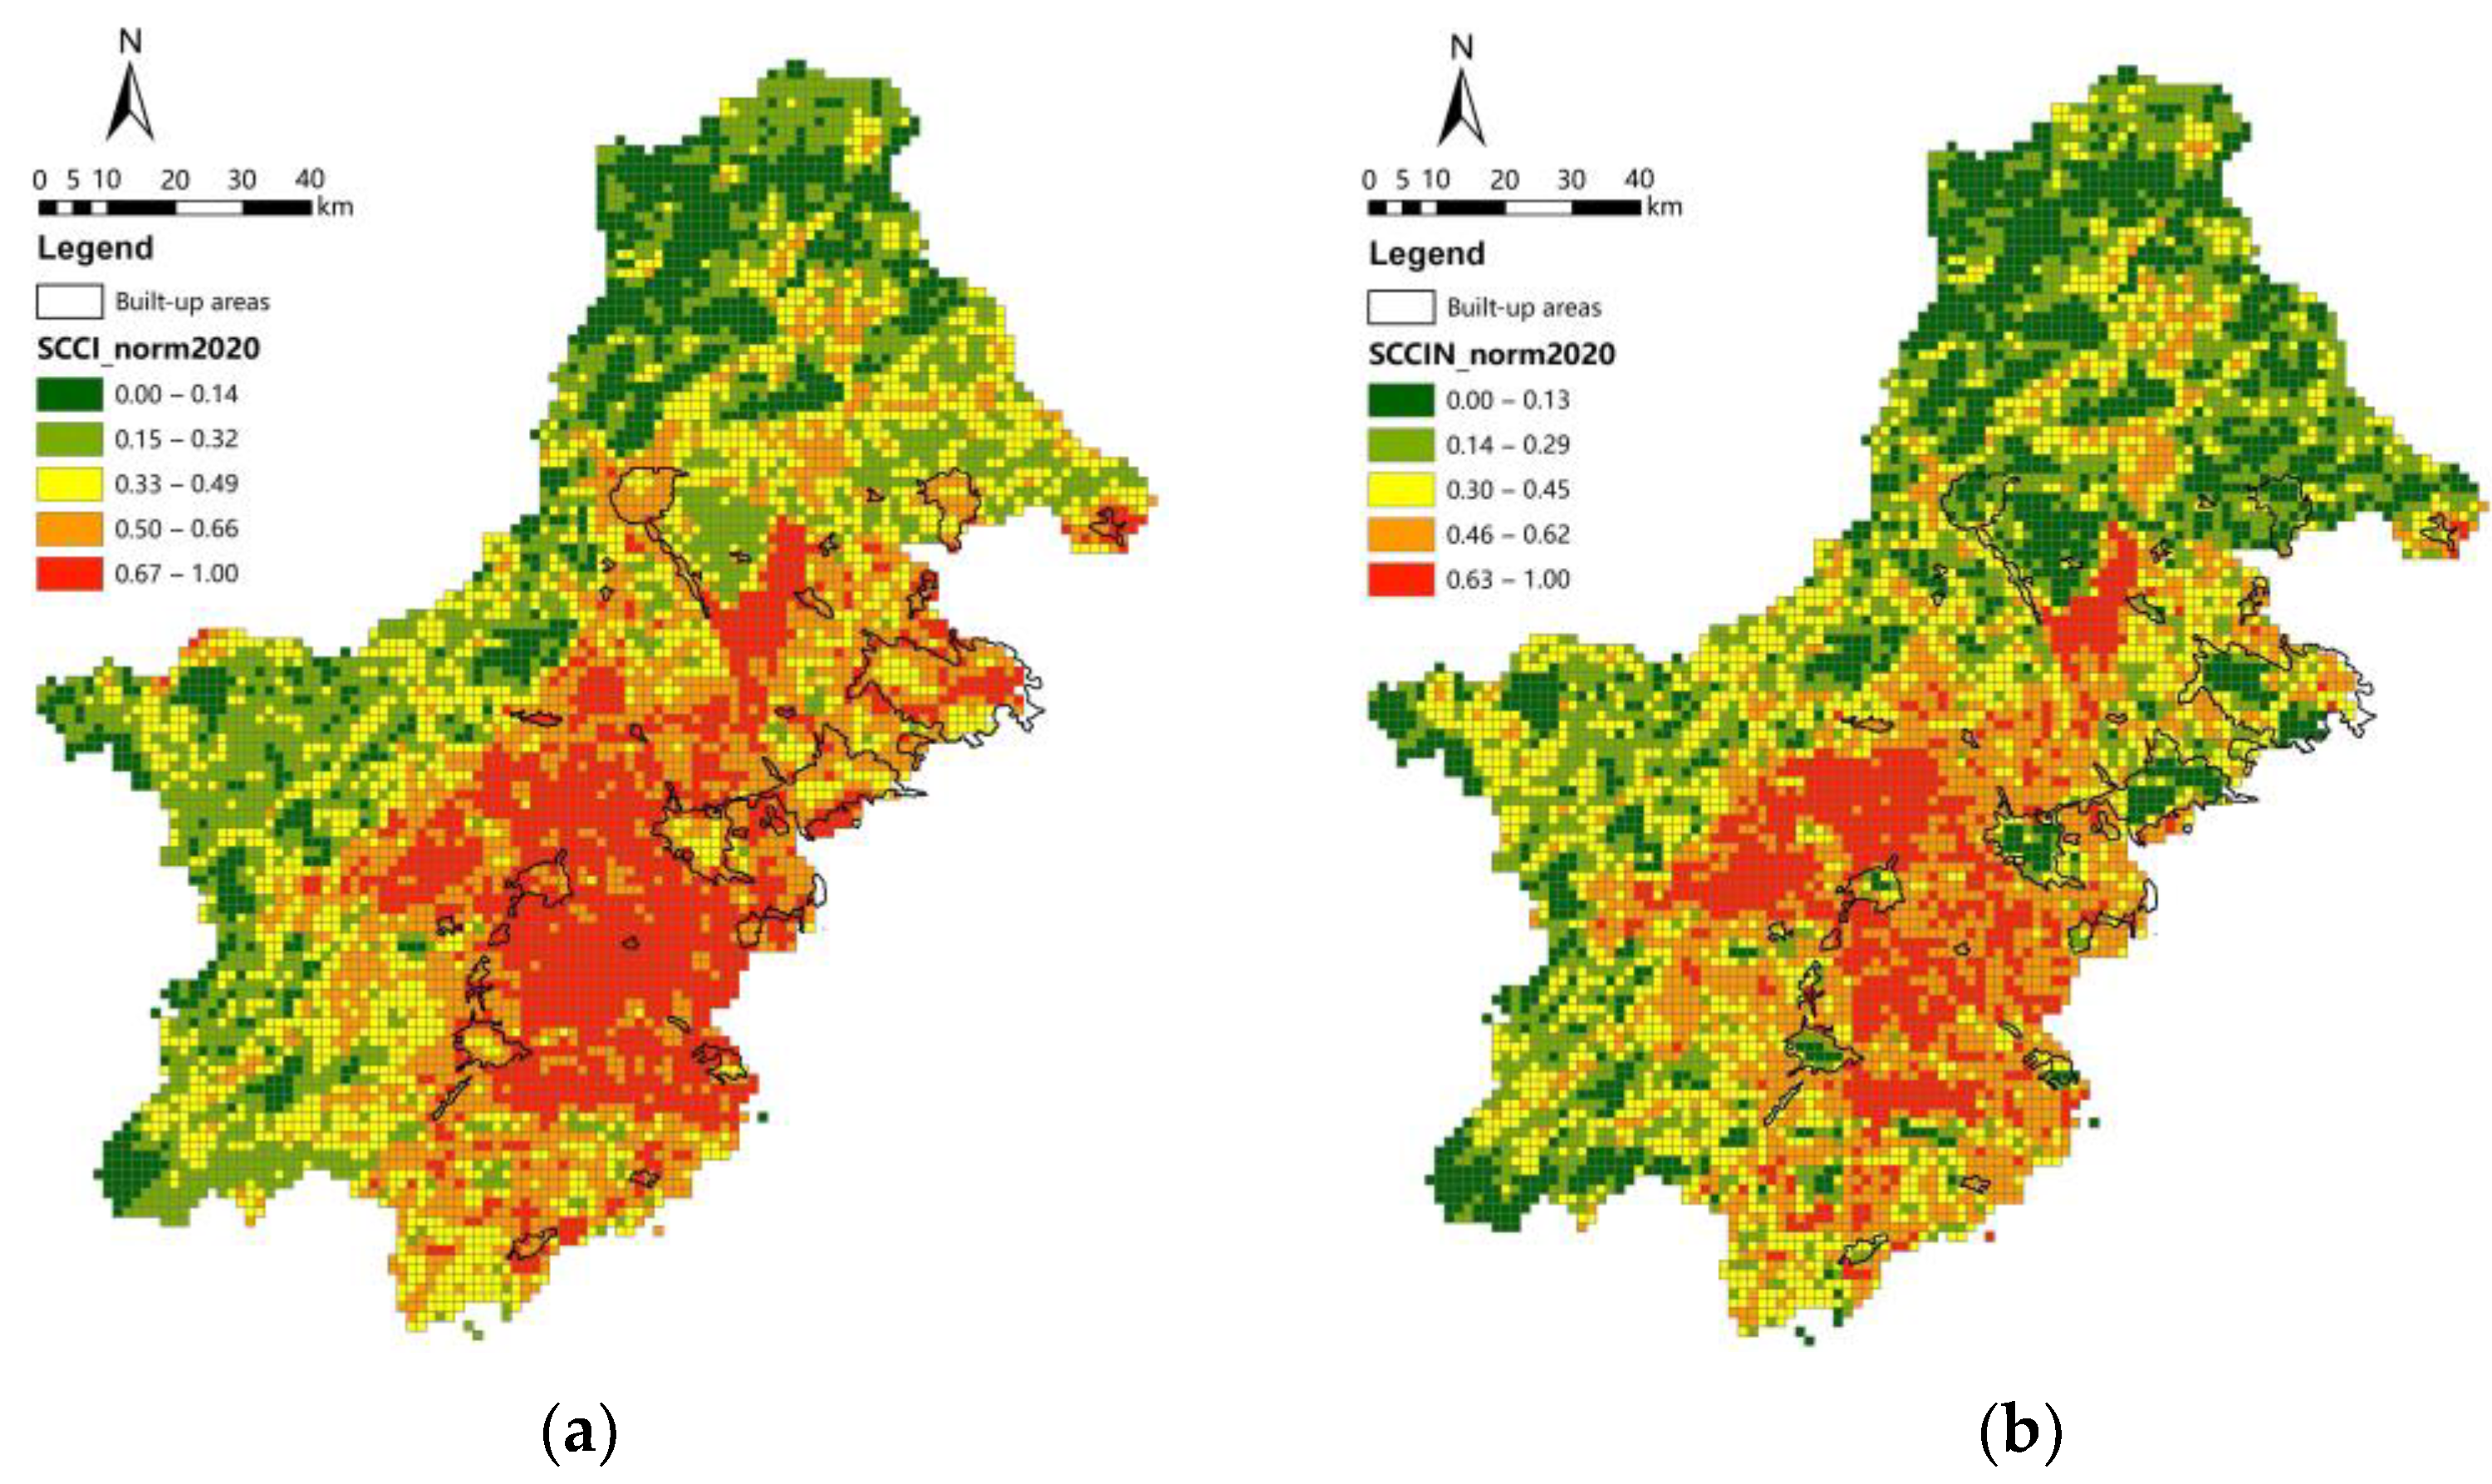
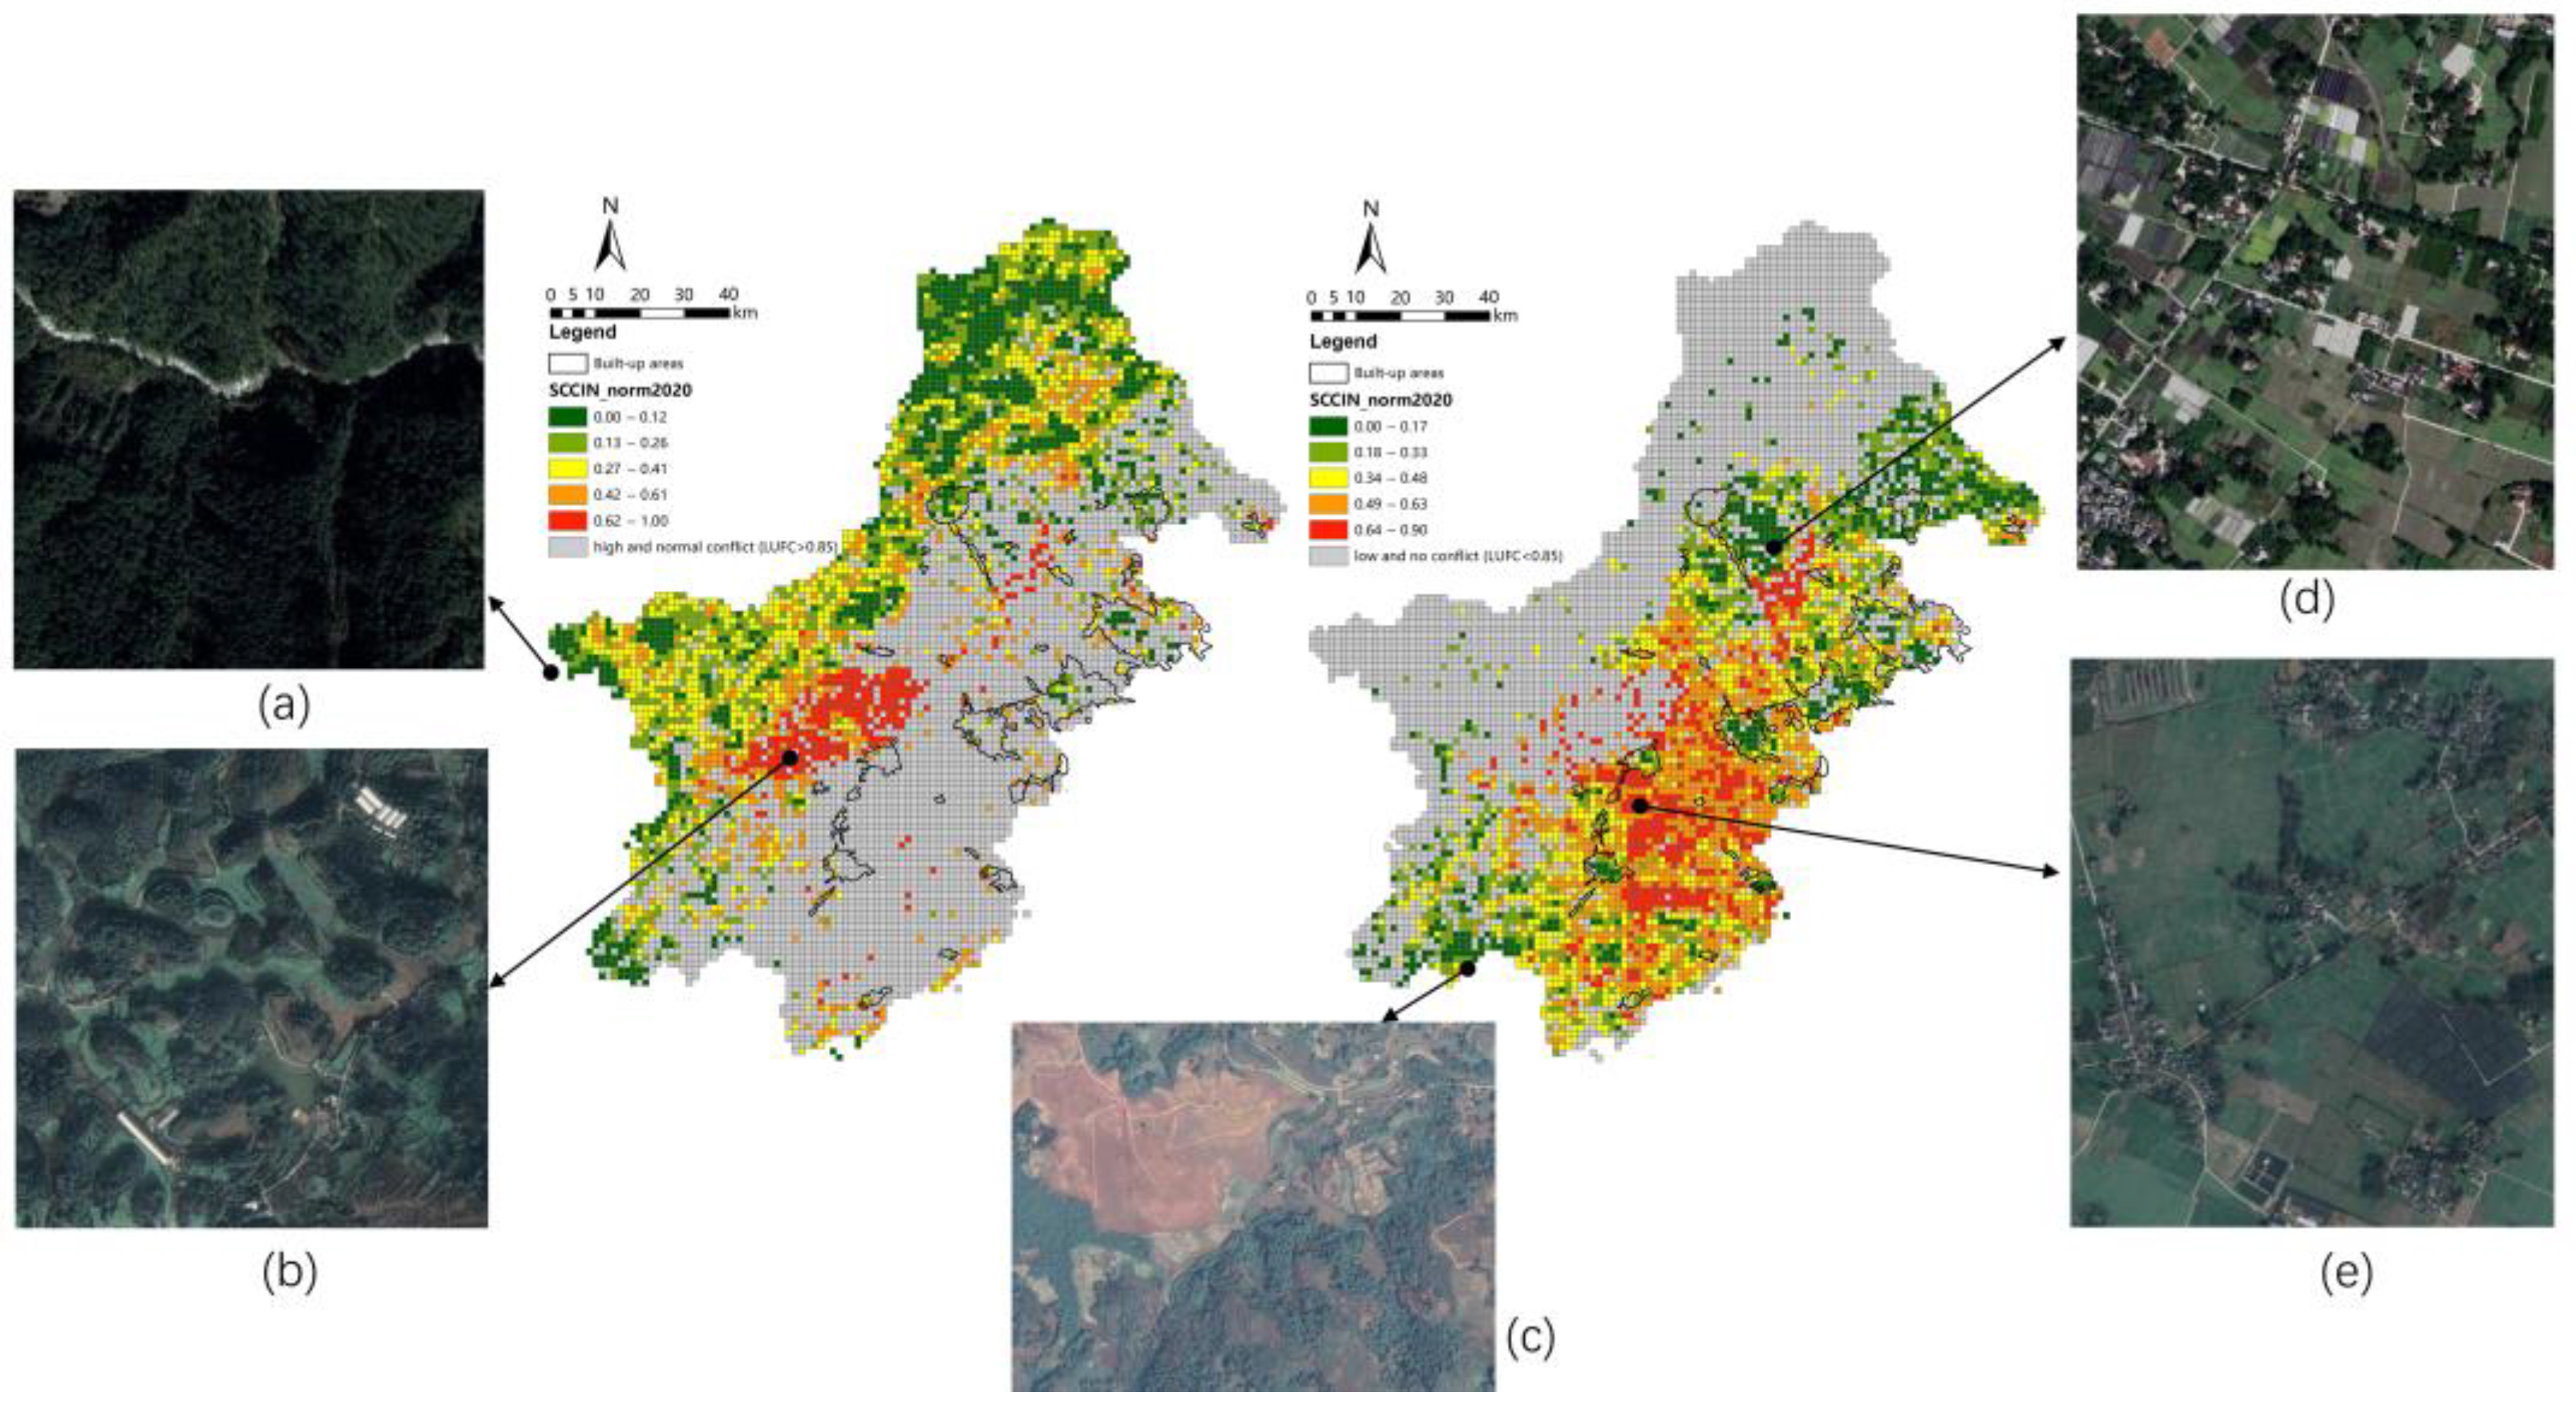
3.1.2. LUFC Zones Based on Landscape Pattern

The land use and conflict measurement index, both SCCI and SCCIN, measure the relative degree of conflict risk within a region. However, compared with SCCI, this paper’s newly constructed index, SCCIN, has significantly reduced the number of high conflict units and increased the number of low conflict units in all 3 years, 2000, 2010, and 2020 (Figure 6). While the main difference between the two formulas is land-cover types, it indicated that the structure of land-cover types contributes greatly to the landscape ecological risk in the traditional calculation method, as the traditional landscape ecological risk measurement method focuses on the risk impact of the composition of construction land patches, rather than the characteristics of the land use configuration pattern. Taking the year 2020 as an example, the conflict risk units identified with SCCIN are almost contained in those with SCCI (Figure 7). However, the conflict risk inside urban built-up areas and at the edge of built-up areas is significantly reduced. Even though there are also ecological, water system, and other non-construction land in the urban built-up area, the possibility of land-use transfer are far lower than that outside in the countryside, which results in the difficulty for SCCI to reflect the resilience resistance landscape ecological risk itself inside built-up areas, proving that the SCCIN constructed by this paper to be more reliable.
Compared with the degree of suitability conflict potential (LUFC), the spatial agglomeration of the conflict units defined by the landscape pattern is more obvious, forming relatively continuous conflict agglomeration areas. As shown in Figure 8, while beyond a certain landscape risk degree, namely 0.2, the higher the LUFC, the stronger the landscape complexity (SCCIN), this is mightily due to more intense “competition” between the different functions for land space, resulting in the mixing of agriculture and forestry land or mosaic landscape patterns in these regions. So, special attention should be paid to areas with high conflict risk accordingly, from the perspective of the regional agricultural–ecological landscape and the protection of the settlement landscape with the local feature. Specifically, the four kinds of relationship situations between the LUFC and SCCIN are as follows: (1) units of low functional suitability conflict and low landscape complexity conflict, mainly concentrated in areas with ecological advantages in deep mountains, as shown in Figure 9a, where suitability for agricultural production and urban–rural living is poor; (2) units of low functional suitability conflict and high landscape complexity conflict, as shown in Figure 9b, mainly concentrated in the shallow mountain and hilly areas, dominated by the mixture of ecological space and agricultural production space. Agricultural land in the valley is continuously distributed along the terrain, resulting in land use vulnerable to the impact of land consolidation projects, such as “slope upgrading, land greening or returning the forest to farmland”; (3) units of high functional suitability conflict and low landscape complexity conflict, as shown in Figure 9c,d, while the former is dominated by the large scale of farmland or forest land, and the latter is dominated by high density and relatively homogeneous rural settlements, which are generally identified as construction land patches in 30 m resolution remote sensing recognition, resulting in lower landscape complexity; and (4) units of high functional suitability conflict and high landscape complexity conflict, as shown in Figure 9e, where the residential area is more sparse and the density is lower, the agricultural production space and urban–rural living space are mixed.

3.2. LUCC Pattern and Its Relationship with Land-Use Conflicts

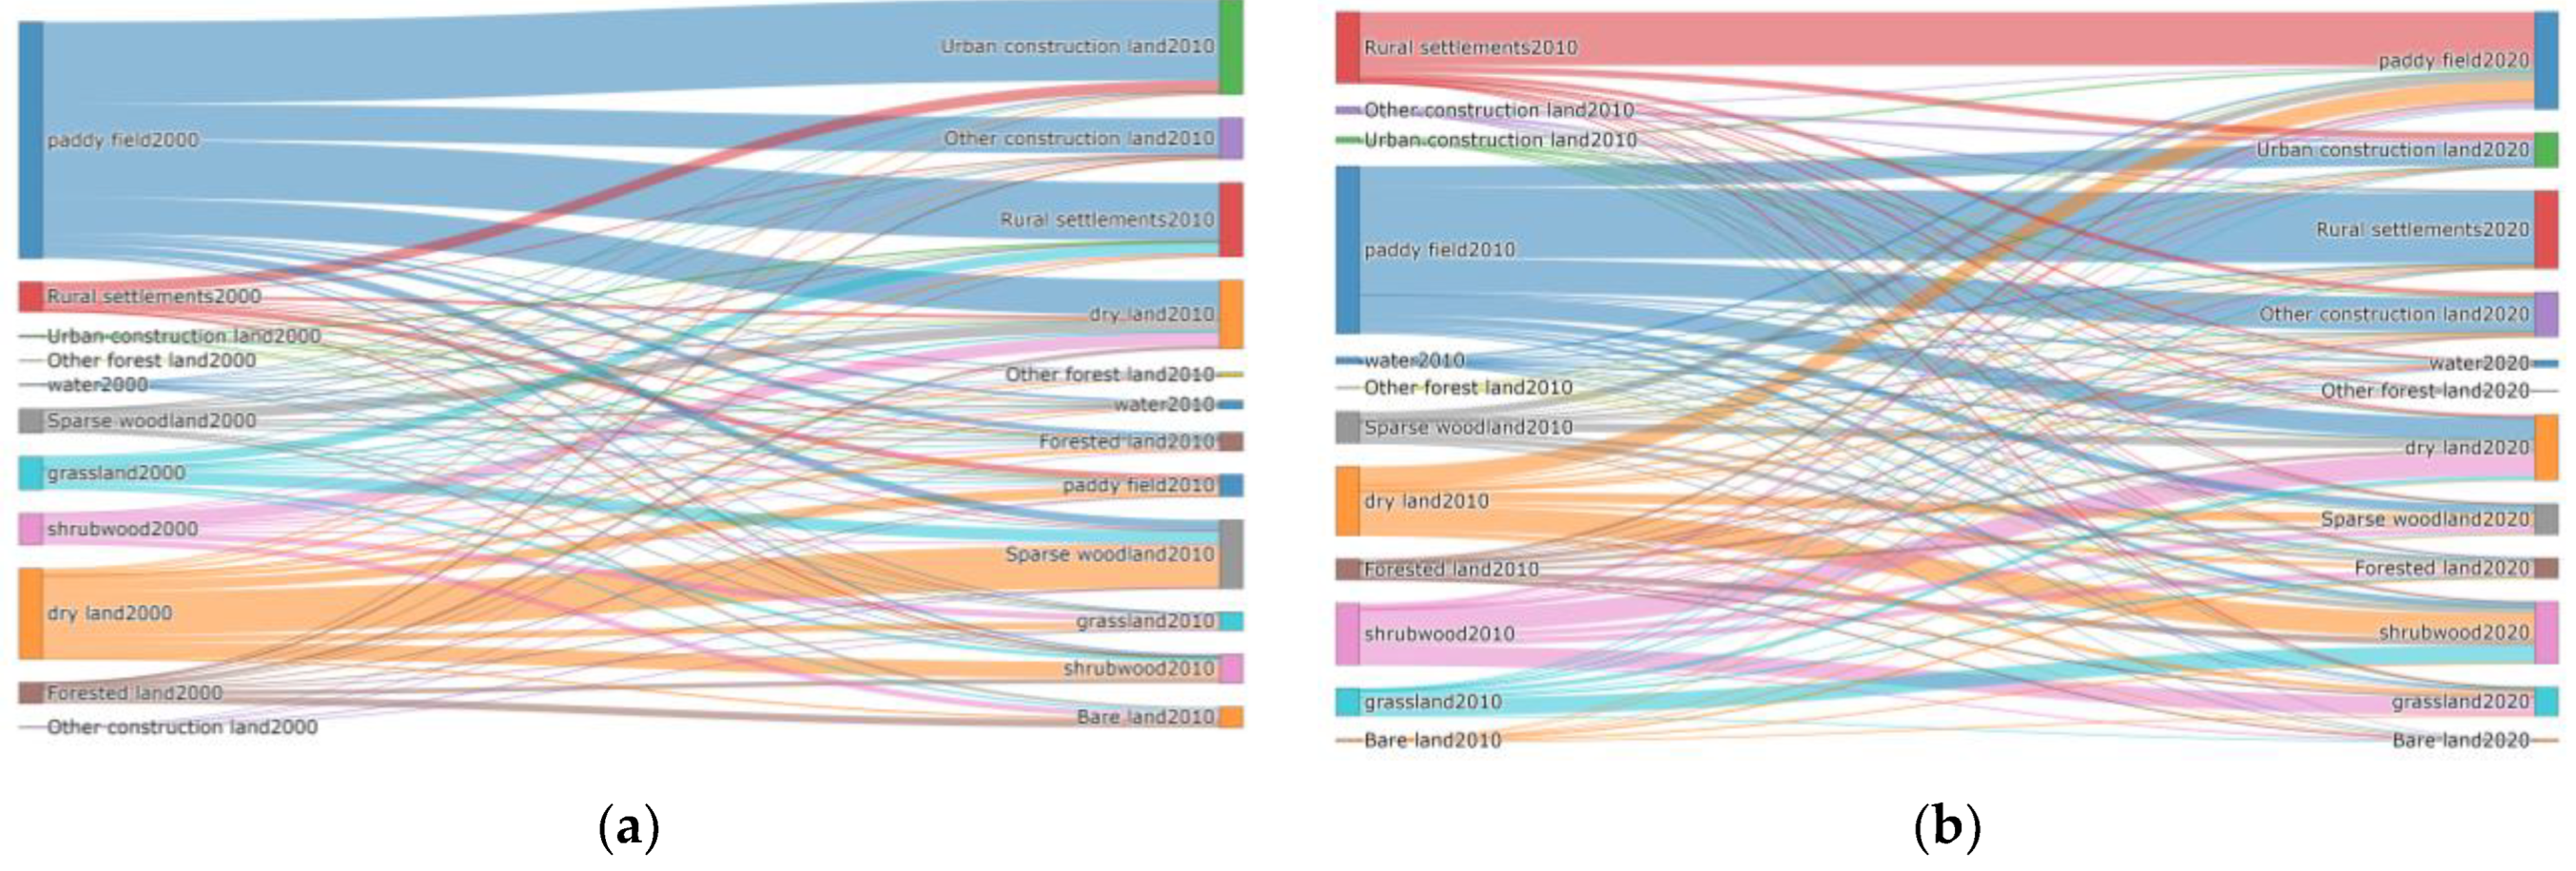
3.2.1. Land-Use/Cover Change in the Research Area

During 2000–2010 and 2010–2020, cultivated land, especially paddy fields, decreased by the most, transforming into urban–rural construction land, but this has eased in the last 10 years. Another land use transformation worth noticing is the transformation of dry land into sparse forest land and shrub forest land (with a total amount of 81.3 km2), which went through little change during 2010–2020 (Figure 10a). Thanks to the transformation of paddy fields into dry land, and land consolidation projects that restore the shrubbery to dry land, the full scale of dry land remained unchanged from 2010 to 2020 (Figure 10b). The different patterns of land use transformation among the “ecology, production and living” space in the different regions of the “Western Protected Area” are shown. From the perspective of net flow from 2000 to 2020 (Table 4), the net flow of paddy fields to construction land was 318 km2, and 18.9 km2 to forest land, the net flow of dry land to construction land was 7.7 km2 and 50.1 km2 to forest land, which represented two types of multi-functional conflict, the “production–living conflict” and “production–ecology conflict”.

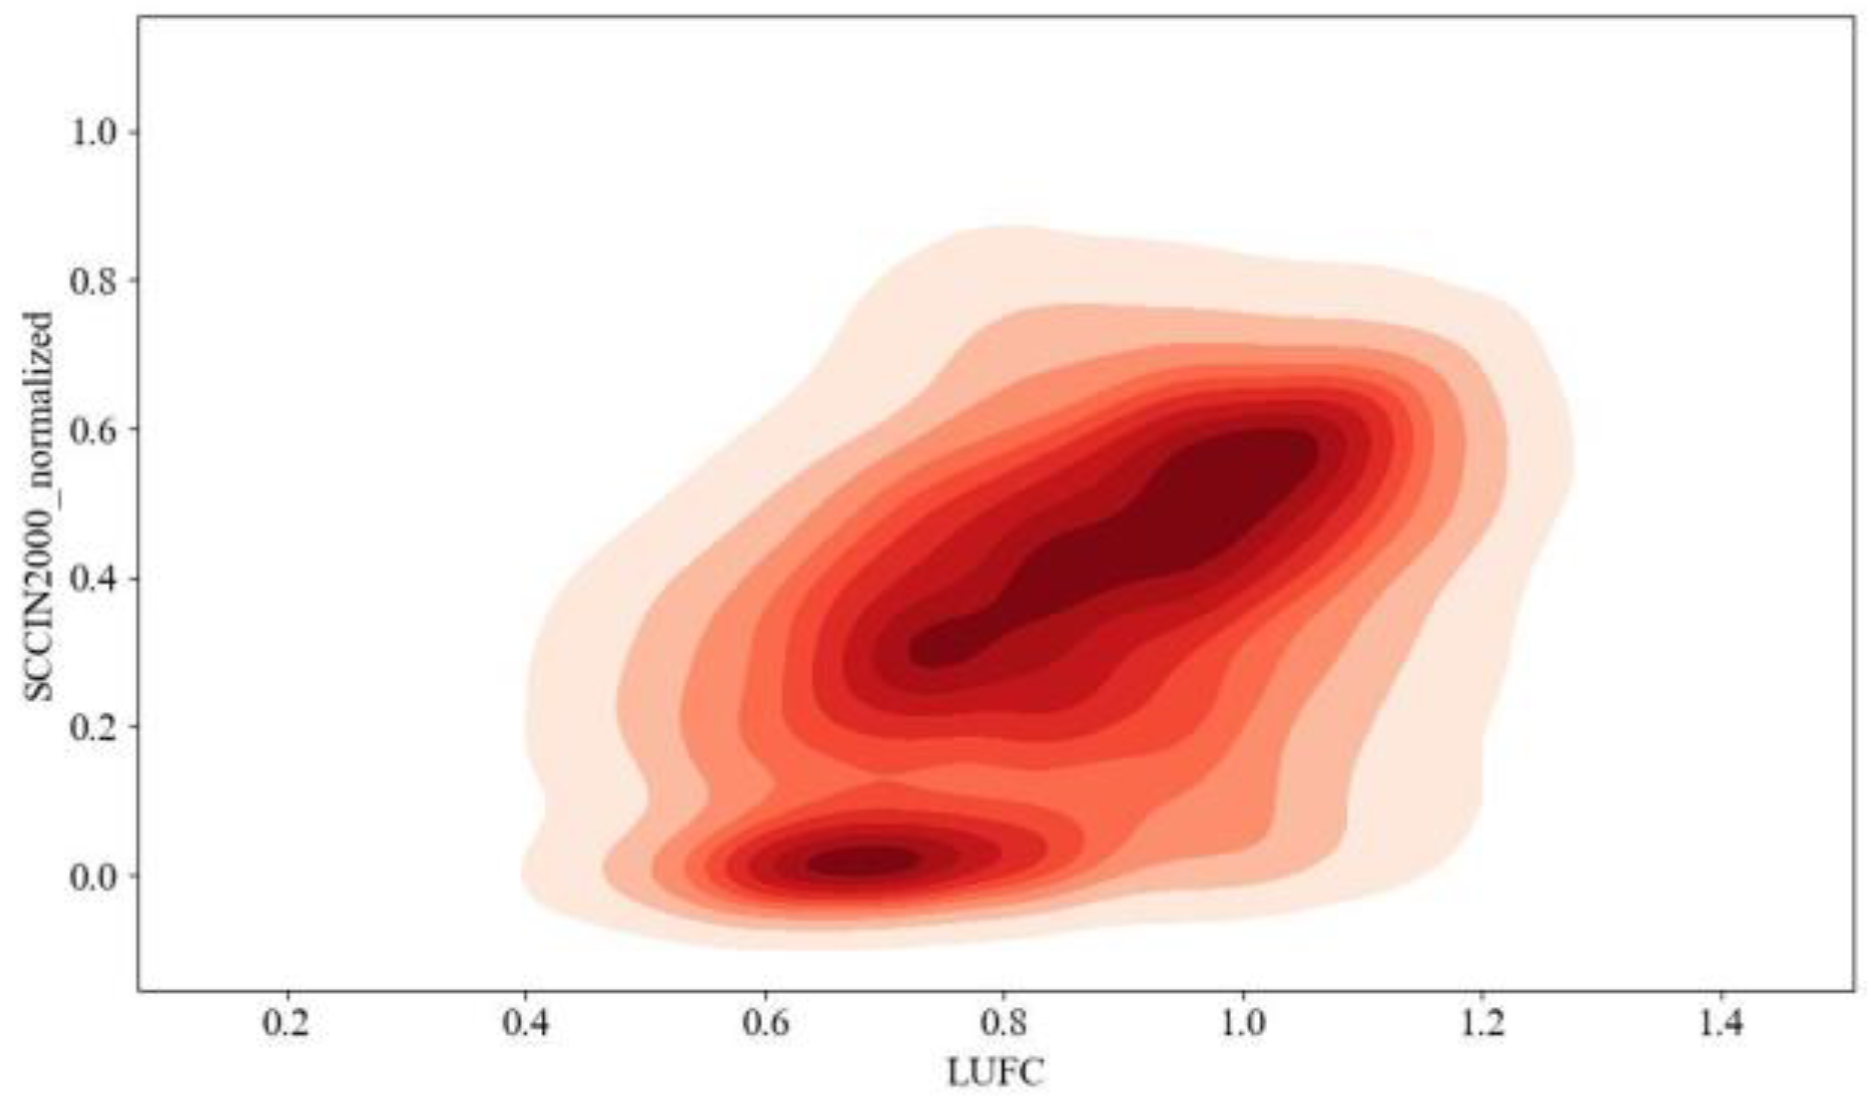
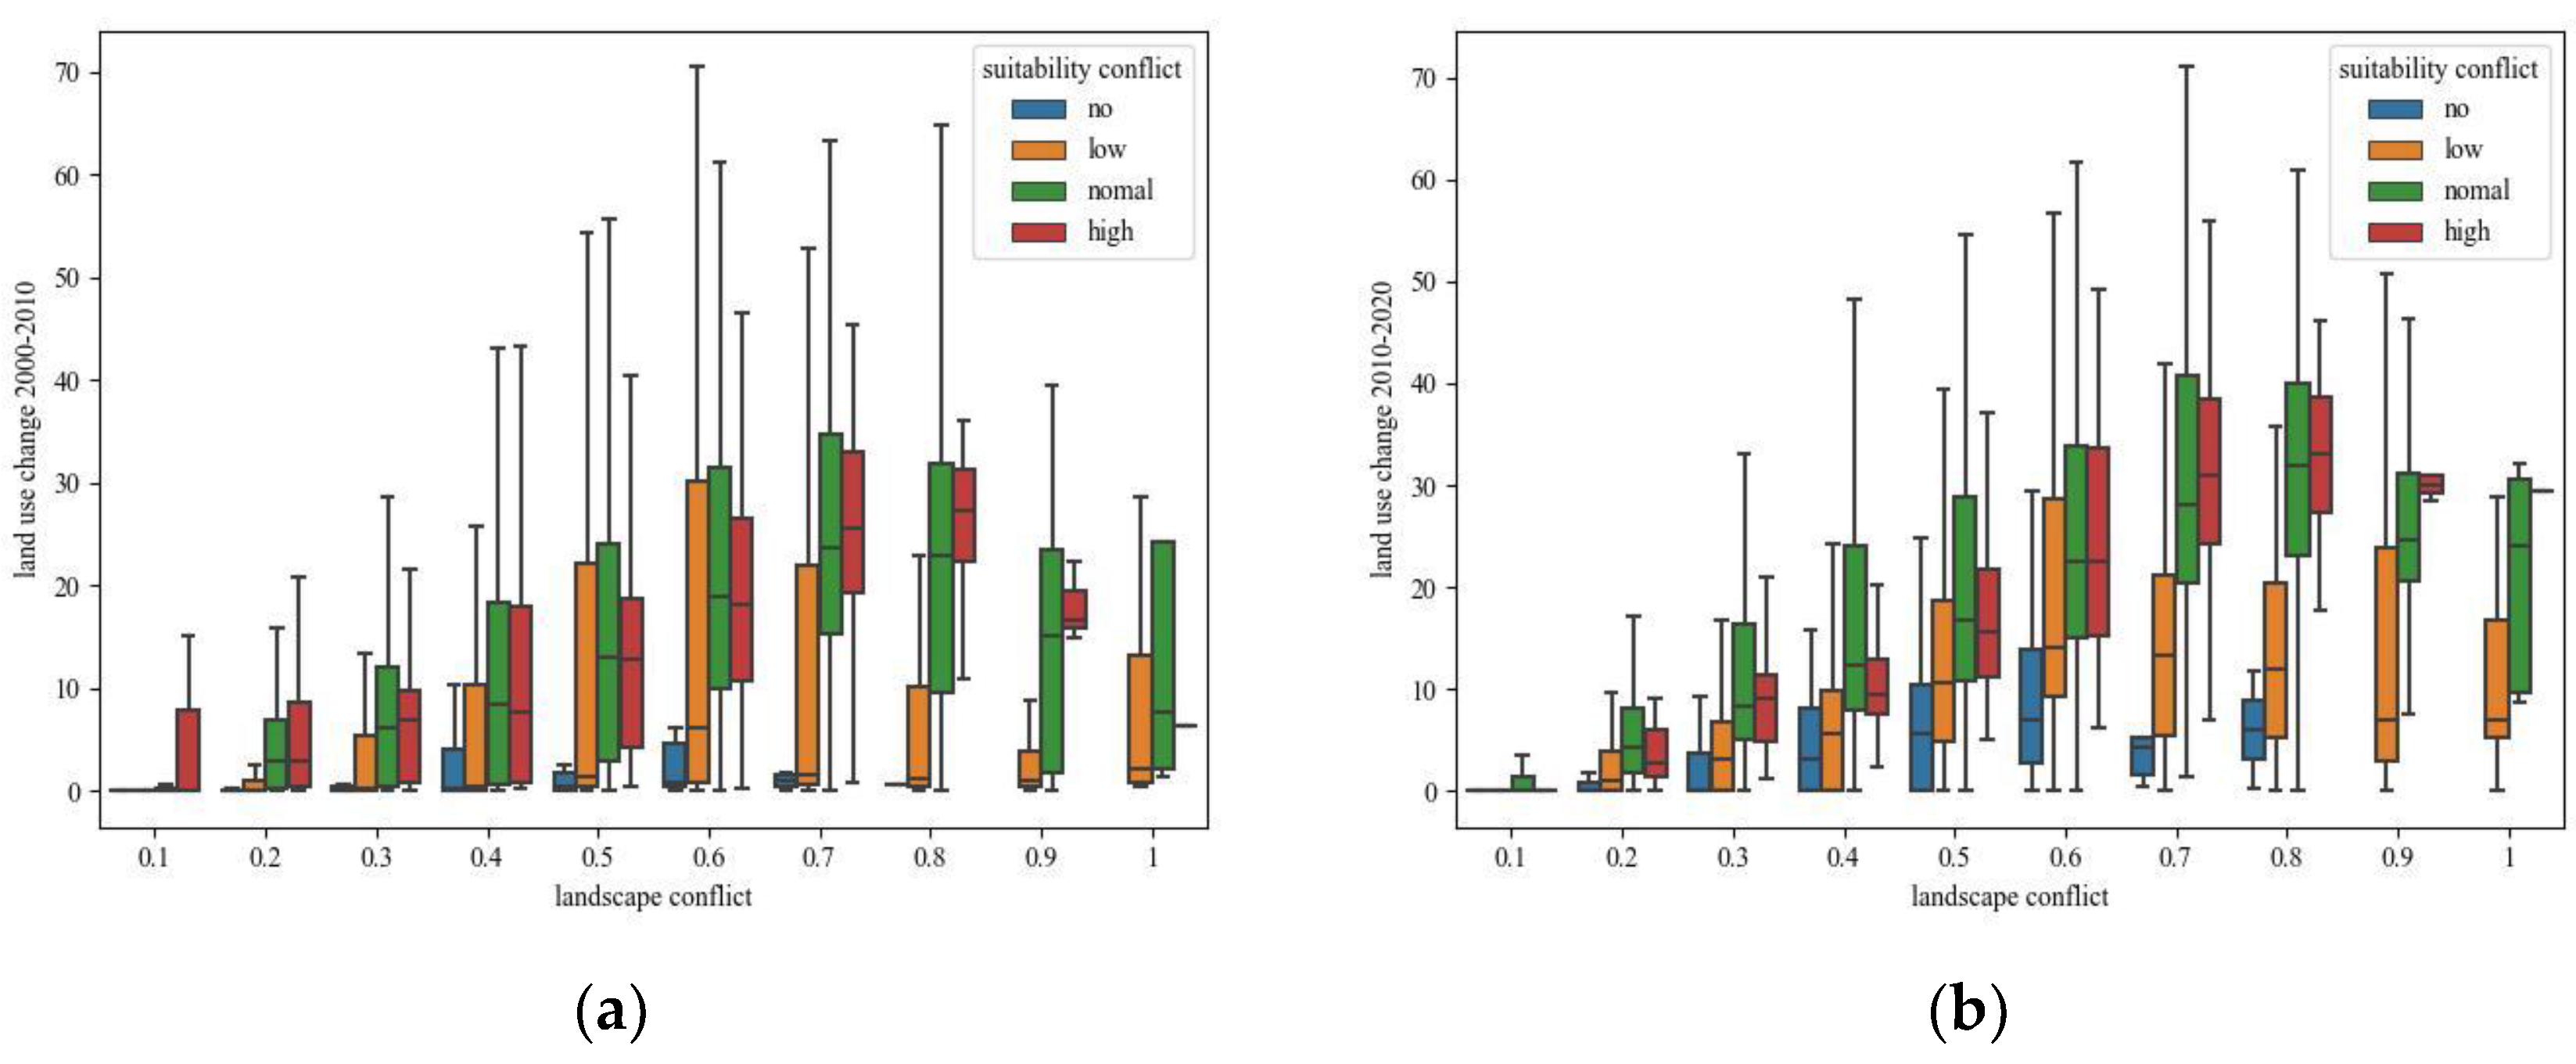
3.2.2. Relationship of Land-Use/Cover Change and Land-Use Conflict

As mentioned above, conversions among cultivated, forest, and construction land are the most significant part of land-use transfer in the study area. They fully reflect the functional conflict of the “production–living–ecological” aspects. Take the sum scales for the mutual transfer of these three types of land as the dependent variable and analyze the prediction effect of the “conflict risk index” and other independent variables on land-use change.
The box chart analysis shows that, with the increase in landscape conflict risk in 2000–2010 and 2010–2020, the scale of land-use transition presents a trend of increasing and then decreasing (Figure 11), which indicates that other factors are affecting the prediction effect of landscape conflict risk, especially after the landscape conflict risk reaches 0.8. Under the conditions of equal landscape conflict risk, the land-use transition scale within the highest suitability conflict and standard suitability conflict units are significantly larger than that of the low suitability conflict or no suitability conflict units. With the increasing landscape conflict risk, this gap becomes more obvious, indicating that landscape conflict risk can enhance the prediction effect of land-use transition caused by suitability conflict. It is worth noting that there are outliers showing that the conflicting index is not the only factor determining the land-use evolution. Some units with low conflict risk index represent a larger scale of land-use evolution.
With the sum of the mutual conversion among cultivated land, forest land and construction land as the dependent variable, regression analysis shows certain prediction reliability of the conflict risk index. Without considering the interaction effect, the suitability risk index (LUFC) constructed in this paper has a strong positive prediction effect on land-use transition. However, it is far weaker than the landscape conflict risk (SCCIN), which is confirmed by the regression results of model 1 (Table 5). Road network density, GDP density, population density, POI quantity, and other indicators reflecting human settlement vitality positively predict land-use transition. The farther away from the urban area, the smaller the change scale.
Considering the interaction effect, as in model 2, the prediction effect of suitability conflict risk and landscape conflict risk on land-use transition is mutually constrained, which reflects a threshold effect. When landscape conflict risk is greater than 0.18 (=9.13/51.15) during 2000–2010, the prediction of suitability conflict risk is a positive sign. With the increasing suitability conflict risk, the prediction intensity is enhanced, and the threshold value from 2010 to 2020 is 0.05 (=2.60/54.78). On the contrary, when landscape conflict risk is lower than the threshold value, the prediction effect of suitability conflict is negative, which might be due to the higher cost of land-use transition in areas with low landscape conflict, as a certain type of suitable land is dominant and continuous. Similarly, the positive prediction effect of landscape conflict risk depends on the suitability conflict risk index, with a threshold of 0.45 and 0.32 in 2000–2010 and 2010–2020, respectively. This means that although the landscape pattern of the spatial unit is fragmented and diversified, landscape conflict could lead to land-use transition only when the suitability conflict reaches a certain degree. Otherwise, the possibility of adjusting the existing landscape pattern is low.

4. Discussion

4.1. Insight into Land-Use Conflict Characteristics

In this paper, an index representing land-use function suitability conflict is constructed by referring to the multi-functional trade-off synergy analysis method. This facilitates quantitative analysis of the land-use function conflict with a continuous variable LUFC, resulting more in-depth analysis, such as sensitivity analysis of the conflict units with different thresholds of land-use function suitability, compared with existing research that would obtain 27 kinds of composition relations and eight types of LUFCs zones [5,8], or the spatial autocorrelation of conflicts between the agricultural and ecological functions [9]. This might be useful as the land-use function suitability threshold should vary according to the local physical geographical conditions [8], as the ratio of conflict units drops dramatically when the threshold of high land-use suitability increases and somehow provides elasticity of land-use management rather than the existing method. We also make revisions to the calculation formula for landscape conflict, by neglecting the vulnerability index which refers to ratios of land-cover types, as it mainly focuses on the ecological security perspective [25] rather than the landscape pattern itself. Our findings show a tiny difference between these two methods, especially in built-up areas.
The interactions and relationships among the different conflicts are important [26], a comparison between the land-use function conflict and landscape conflict could be analyzed, as these two indexes are of the same resolution. Research shows that elements such as slope, elevation, average annual temperature, and soil type affect the spatial differentiation of landscape conflict [27,28], but lack mechanism explanations for it. We noticed that most of those are indexes are for the land-use suitability evaluation system, and these two kinds of land-use conflict co-occur spatially overall, but there also exists “high-low” combinations. These findings are crucial to the deep understanding of how land-use suitability affects land-use conflict.
More importantly, it is still not clear about the relationship between land-use change and land -se conflict, while pioneer research has been established to simulate sustainable land-use scenarios based on conflict management [7]. The governance of spatial conflicts can affect the mutual conversion between land uses through the optimal allocation of land resources, resulting in changes in the level of spatial conflict driven by the rational adjustment of land use [29], the process of land-use/land-cover (LULC) dynamics can lead to dramatic changes in regional landscape patterns [30]. However, it is also possibly correct vice versa, as landscape patterns have been influenced in some parts by land consolidation works over the years [31], while the need for land consolidation comes from the reduction of economic costs relating to land fragmentation [32]. Our findings from the multivariate linear regression model confirmed that land consolidation or adjustment of land use took place more often when both suitability conflict and landscape conflict reaches a certain threshold, which might support more precise identification of land-use conflict zones.

4.2. Policy Implications for Chengdu’s Western Protected Area

As for the “Western Protected Area” in Chengdu, the reciprocal transformation of land use among construction land, cultivated land, and forest land are dominant, which is consistent with the land-use conflict analysis result, showing the great necessity to apply land-use conflict assessment in comprehensive spatial planning and build more effective protection and control systems. Plain areas should be paid more attention, as suitability conflict and landscape conflict are both the highest, especially in urban–rural fringe areas of Dayi and Chongzhou county, seen also in other research [33]. However, some counties encountered low land-use conflict in urban–rural fringe areas such as Pidu and Dujiangyan, reflecting good implementation of urban development boundaries. Strict control should also be implemented at the foot of Mount Qingcheng where the terrain fluctuates rapidly, as lots of units of high land-use conflict are located there.

4.3. Limitations and Future Research

The ecological risk index is optimized by highlighting the effect of landscape pattern complexity on land-use conflict and the relationship between these two commonly used land-use conflict assessment methods is thus cross-analyzed. Then, the two indexes were further used to predict the land-cover change, other regression analysis methods could be tested in the future, such as the optimal parameters-based geographic detector [28] or machine learning to reveal the interaction mechanism on how suitability and landscape conflict affects land-cover change.
What is more, this research did not recognize the land-use conflict of small-scale agroforestry land due to limitations in data resolution and soil data richness, but the production value of small-scale agroforestry land has been widely proven [34]. Linpan, a special residential typology in rural areas with small-scale agroforestry land around buildings, has also been specially protected by the government [35]. In addition, fine planting conditions provide the potential for developing economic crops, such as nursery stock, flowers, and orchards, especially at the edge of the metropolis, where land-use function shows characteristics of agriculture, but also forests, resulting in a new type of land-use conflict. The assessment scale of land-use function suitability conflict and landscape pattern conflict cannot distinguish this special scenario at the scale of a 1 km grid and 30 m resolution, which might be breakthroughs for future research.

Author Contributions

J.C. contributed to all aspects of this work; S.Z. and L.Z. conducted data processing and analysis; J.C. and H.Z. wrote the draft and obtained funding support. All authors have read and agreed to the published version of the manuscript.

Funding

The research reported in this manuscript is funded by the Natural Science Foundation of China (Grants No. 31971716, 32271945) and the Scientific and Technological Project in Chengdu (Grant No. 2021-YF05-00033-SN, 2019-RK00-00055-ZF).

Data Availability Statement

The data presented in this study are available on request from the author.

Acknowledgments

Thanks to anonymous experts for their suggestions.

Conflicts of Interest

The authors declare no conflict of interest.

References

  1. Hui, E.C.M.; Bao, H. The Logic behind Conflicts in Land Acquisitions in Contemporary China: A Framework Based upon Game Theory. Land Use Policy 2013, 30, 373–380. [Google Scholar] [CrossRef]
  2. Cui, J.; Kong, X.; Chen, J.; Sun, J.; Zhu, Y. Spatially Explicit Evaluation and Driving Factor Identification of Land Use Conflict in Yangtze River Economic Belt. Land 2021, 10, 43. [Google Scholar] [CrossRef]
  3. Iojă, C.I.; Niţă, M.R.; Vânău, G.O.; Onose, D.A.; Gavrilidis, A.A. Using Multi-Criteria Analysis for the Identification of Spatial Land-Use Conflicts in the Bucharest Metropolitan Area. Ecol. Indic. 2014, 42, 112–121. [Google Scholar] [CrossRef]
  4. Zou, L.; Liu, Y.; Wang, Y. Research progress and prospect of land-use conflicts in China. Prog. Geogr. 2020, 39, 298–309. [Google Scholar] [CrossRef]
  5. Cheng, Z.; Zhang, Y.; Wang, L.; Wei, L.; Wu, X. An Analysis of Land-Use Conflict Potential Based on the Perspective of Production–Living–Ecological Function. Sustainability 2022, 14, 5936. [Google Scholar] [CrossRef]
  6. Dong, G.; Ge, Y.; Jia, H.; Sun, C.; Pan, S. Land Use Multi-Suitability, Land Resource Scarcity and Diversity of Human Needs: A New Framework for Land Use Conflict Identification. Land 2021, 10, 1003. [Google Scholar] [CrossRef]
  7. Zou, L.; Liu, Y.; Wang, J.; Yang, Y.; Wang, Y. Land Use Conflict Identification and Sustainable Development Scenario Simulation on China’s Southeast Coast. J. Clean. Prod. 2019, 238, 117899. [Google Scholar] [CrossRef]
  8. Zou, L.; Liu, Y.; Wang, J.; Yang, Y. An Analysis of Land Use Conflict Potentials Based on Ecological-Production-Living Function in the Southeast Coastal Area of China. Ecol. Indic. 2021, 122, 107297. [Google Scholar] [CrossRef]
  9. Li, S.; Zhu, C.; Lin, Y.; Dong, B.; Chen, B.; Si, B.; Li, Y.; Deng, X.; Gan, M.; Zhang, J.; et al. Conflicts between Agricultural and Ecological Functions and Their Driving Mechanisms in Agroforestry Ecotone Areas from the Perspective of Land Use Functions. J. Clean. Prod. 2021, 317, 128453. [Google Scholar] [CrossRef]
  10. Liu, X.; Zhang, Z.; Li, M.; Fu, Y.; Hui, Y. Spatial Conflict Simulation of Land-Use Based on Human-Land-Landscape Elements Intercoordination: A Case Study in Tianjin, China. Environ. Monit. Assess. 2022, 194, 317. [Google Scholar] [CrossRef]
  11. Qiu, G.; Wang, Y.; Guo, S.; Niu, Q.; Qin, L.; Zhu, D.; Gong, Y. Assessment and Spatial-Temporal Evolution Analysis of Land Use Conflict within Urban Spatial Zoning: Case of the Su-Xi-Chang Region. Sustainability 2022, 14, 2286. [Google Scholar] [CrossRef]
  12. Zuo, Q.; Zhou, Y.; Wang, L.; Li, Q.; Liu, J. Impacts of Future Land Use Changes on Land Use Conflicts Based on Multiple Scenarios in the Central Mountain Region, China. Ecol. Indic. 2022, 137, 108743. [Google Scholar] [CrossRef]
  13. Jiang, S.; Meng, J.; Zhu, L.; Cheng, H. Spatial-Temporal Pattern of Land Use Conflict in China and Its Multilevel Driving Mechanisms. Sci. Total Environ. 2021, 801, 149697. [Google Scholar] [CrossRef] [PubMed]
  14. Zhai, J.; Xiao, C.; Feng, Z.; Liu, Y. Spatio-Temporal Patterns of Land-Use Changes and Conflicts between Cropland and Forest in the Mekong River Basin during 1990–2020. Land 2022, 11, 927. [Google Scholar] [CrossRef]
  15. Grecchi, R.C.; Gwyn, Q.H.J.; Bénié, G.B.; Formaggio, A.R.; Fahl, F.C. Land Use and Land Cover Changes in the Brazilian Cerrado: A Multidisciplinary Approach to Assess the Impacts of Agricultural Expansion. Appl. Geogr. 2014, 55, 300–312. [Google Scholar] [CrossRef]
  16. Zheng, Q.-H.; Chen, W.; Li, S.-L.; Yu, L.; Zhang, X.; Liu, L.-F.; Singh, R.P.; Liu, C.-Q. Accuracy Comparison and Driving Factor Analysis of LULC Changes Using Multi-Source Time-Series Remote Sensing Data in a Coastal Area. Ecol. Inform. 2021, 66, 101457. [Google Scholar] [CrossRef]
  17. Yang, J.; Huang, X. The 30 m Annual Land Cover Dataset and Its Dynamics in China from 1990 to 2019. Earth Syst. Sci. Data 2021, 13, 3907–3925. [Google Scholar] [CrossRef]
  18. Fu, J.; Bu, Z.; Jiang, D.; Lin, G.; Li, X. Sustainable Land Use Diagnosis Based on the Perspective of Production–Living–Ecological Spaces in China. Land Use Policy 2022, 122, 106386. [Google Scholar] [CrossRef]
  19. Zhang, J.; Li, S.; Lin, N.; Lin, Y.; Yuan, S.; Zhang, L.; Zhu, J.; Wang, K.; Gan, M.; Zhu, C. Spatial Identification and Trade-off Analysis of Land Use Functions Improve Spatial Zoning Management in Rapid Urbanized Areas, China. Land Use Policy 2022, 116, 106058. [Google Scholar] [CrossRef]
  20. Fan, Y.; Jin, X.; Gan, L.; Jessup, L.H.; Pijanowski, B.C.; Lin, J.; Yang, Q.; Lyu, L. Dynamics of Spatial Associations among Multiple Land Use Functions and Their Driving Mechanisms: A Case Study of the Yangtze River Delta Region, China. Environ. Impact Assess. Rev. 2022, 97, 106858. [Google Scholar] [CrossRef]
  21. Fan, J.; Wang, Y.; Zhou, Z.; You, N.; Meng, J. Dynamic Ecological Risk Assessment and Management of Land Use in the Middle Reaches of the Heihe River Based on Landscape Patterns and Spatial Statistics. Sustainability 2016, 8, 536. [Google Scholar] [CrossRef] [Green Version]
  22. Zhang, J.; Chen, Y.; Zhu, C.; Huang, B.; Gan, M. Identification of Potential Land-Use Conflicts between Agricultural and Ecological Space in an Ecologically Fragile Area of Southeastern China. Land 2021, 10, 1011. [Google Scholar] [CrossRef]
  23. Li, Y.; Liu, G. Characterizing Spatiotemporal Pattern of Land Use Change and Its Driving Force Based on GIS and Landscape Analysis Techniques in Tianjin during 2000–2015. Sustainability 2017, 9, 894. [Google Scholar] [CrossRef] [Green Version]
  24. Du, X.; Jin, X.; Yang, X.; Yang, X.; Zhou, Y. Spatial Pattern of Land Use Change and Its Driving Force in Jiangsu Province. Int. J. Environ. Res. Public Health 2014, 11, 3215–3232. [Google Scholar] [CrossRef] [PubMed] [Green Version]
  25. Dong, G.; Liu, Z.; Niu, Y.; Jiang, W. Identification of Land Use Conflicts in Shandong Province from an Ecological Security Perspective. Land 2022, 11, 2196. [Google Scholar] [CrossRef]
  26. Ma, W.; Jiang, G.; Chen, Y.; Qu, Y.; Zhou, T.; Li, W. How feasible is regional integration for reconciling land use conflicts across the urban–rural interface? Evidence from Beijing–Tianjin–Hebei metropolitan region in China. Land Use Policy 2020, 92, 104433. [Google Scholar] [CrossRef]
  27. Zhao, Y.; Zhao, X.; Huang, X.; Guo, J.; Chen, G. Identifying a Period of Spatial Land Use Conflicts and Their Driving Forces in the Pearl River Delta. Sustainability 2023, 15, 392. [Google Scholar] [CrossRef]
  28. Cao, J.; Cao, W.; Fang, X.; Ma, J.; Mok, D.; Xie, Y. The Identification and Driving Factor Analysis of Ecological-Economi Spatial Conflict in Nanjing Metropolitan Area Based on Remote Sensing Data. Remote Sens. 2022, 14, 5864. [Google Scholar] [CrossRef]
  29. Zheng, Y.; Cheng, L.; Wang, Y. Measuring the Spatial Conflict of Resource-Based Cities and Its Coupling Coordination Relationship with Land Use. Land 2022, 11, 1460. [Google Scholar] [CrossRef]
  30. Deng, J.S.; Wang, K.; Hong, Y.; Qi, J.G. Spatio-temporal dynamics and evolution of land use change and landscape pattern in response to rapid urbanization. Landsc. Urban Plan. 2009, 92, 187–198. [Google Scholar] [CrossRef]
  31. Sigura, P. Landscape analysis in areas affected by land consolidation. Landsc. Urban Plan. 1997, 37, 91–98. [Google Scholar] [CrossRef]
  32. Zang, Y.; Yang, Y.; Liu, Y. Toward serving land consolidation on the table of sustainability: An overview of the research landscape and future directions. Land Use Policy 2021, 109, 105696. [Google Scholar] [CrossRef]
  33. Liang, T.; Du, P.; Yang, F.; Su, Y.; Luo, Y.; Wu, Y.; Wen, C. Potential Land-Use Conflicts in the Urban Center of Chongqing Based on the “Production–Living–Ecological Space” Perspective. Land 2022, 11, 1415. [Google Scholar] [CrossRef]
  34. Kay, S.; Rega, C.; Moreno, G.; den Herder, M.; Palma, J.H.N.; Borek, R.; Crous-Duran, J.; Freese, D.; Giannitsopoulos, M.; Graves, A.; et al. Agroforestry Creates Carbon Sinks Whilst Enhancing the Environment in Agricultural Landscapes in Europe. Land Use Policy 2019, 83, 581–593. [Google Scholar] [CrossRef]
  35. Abramson, D.B. Ancient and Current Resilience in the Chengdu Plain: Agropolitan Development Re-‘Revisited’. Urban Stud. 2020, 57, 1372–1397. [Google Scholar] [CrossRef]
Figure 1. Location of the research area.
Land 12 00742 g001
Figure 2. Conceptual framework of land-use conflict assessment and correlation with LULC.
Land 12 00742 g002
Figure 3. Land-use function conflict identification between specifical LUFs.
Land 12 00742 g003
Figure 4. Probability density diagram of (a) the normalized land-use function suitability evaluation and (b) the land-use function suitability conflict.
Land 12 00742 g004
Figure 5. Distribution of land-use function suitability conflict. (a) Considering production–living–ecological conflict and (b) only considering living–ecological conflict.
Land 12 00742 g005
Figure 6. Probability density diagram of land-use conflict index based on the landscape ecological risk index, (a) with traditional measures and (b) with newly constructed index not considering the vulnerability index.
Land 12 00742 g006
Figure 7. Distribution of land-use conflict index considering the landscape pattern in the year 2020. (a) Normalized land-use conflict using landscape ecological risk and (b) normalized land-use conflict not considering the vulnerability index.
Land 12 00742 g007
Figure 8. Landscape ecological risk index and functional conflict risk index double probability density map.
Land 12 00742 g008
Figure 9. Types of landscape complexity conflicts for units of high or low functional suitability conflict, with typical sites of (a) low LUFC and low landscape complexity conflicts, (b) low LUFC and high landscape complexity conflicts, (c) high LUFC and low landscape complexity conflicts with ecological aspects dominating, (d) high LUFC and high landscape complexity conflicts, (e) high LUFC and low landscape complexity conflicts with production aspects dominating.
Land 12 00742 g009
Figure 10. Sankey diagram of land-use transfer (a) from 2000 to 2010 and (b) from 2010 to 2020.
Land 12 00742 g010
Figure 11. The relationship between land-use change and land-use conflict (a) from 2000 to 2010 and (b) from 2010 to 2020.
Land 12 00742 g011
Table 1. Production–living–ecological function evaluation system.
Factor
(Weight)
Indicator and WeightIndicator Classification and Score
IndexesValueWeights54321
Production FunctionSoil
(0.3719)
Organic-0.0431HighestVery highMediumLowLowest
Phosphorus-0.0824HighestVery highMediumLowLowest
Potassium-0.0332HighestVery highMediumLowLowest
pH value-0.03486.5~76~6.5/7~7.55~6/7.5~84.5~5/8~8.5<4.5/>8.5
Erosion-0.0348SlightestSlightModerateVery strongStrongest
Soil texture type-0.0471Clay-Silty-Sand
Agricultural outputkg/ha0.0966>80006000~80004000~60001000~4000≤1000
Terrain
(0.2506)
Elevationm0.1362≤800800~15001500~25002500~3500>3500
Slope°0.0277≤2°2–6°6–15°15–25°>25°
Geological disaster probability-0.0867HighestVery highMediumLowLowest
Weather
(0.1693)
Average annual temperature0.1024≥18 °C15~18 °C10~15 °C5~10 °C<5 °C
Average annual precipitationmm0.0669≥1200800~1200400~800200~400<200
Location
(0.2082)
Distance from main roads above county levelm0.0972≤1010~5050~100100~300>300
Distance from major riversm0.1111≤100100~200200~400400~800>800
Living
Function
Terrain
(0.6018)
Elevationm0.2006≤800800~15001500~25002500~3500>3500
Slope°0.1605≤3°3–8°8–15°15–25°>25°
Geological disaster probability-0.2407HighestVery highMediumLowLowest
Social
(0.1321)
PopulationPer km20.0151≥15001000~1500600~1000400~6000~400
distance from education facilitiesm0.0522HighestVery highMediumLowLowest
Distance from medical facilitiesm0.0536HighestVery highMediumLowLowest
GDPPer km20.0112≥30,00010,000~30,0003500~10,0002500~3500<2500
Location
(0.2661)
Distance from the townshipm0.0761<500500~10001000~30003000~5000>5000
Distance from main roads above county levelm0.0994≤100100~200200~400400~800>800
Distance from major riversm0.0906≤100100~200200~400400~800>800
Ecological FunctionEcological Sensitivity (0.282)Water and soil loss vulnerability-0.2820LowestLowMediumVery highHighest
Ecosystem
Service (0.718)
Water conservation-0.1970HighestVery highMediumLowLowest
Soil conservation-0.1970Highest-Medium-Lowest
Biodiversity conservation-0.3240HighestVery highMediumLowLowest
Table 2. Sensitivity analysis of the conflict units with different thresholds of land-use function suitability.
Threshold of High LUF0.40.50.60.640.680.720.760.8
Corresponding LUFC0.570.710.850.910.971.021.071.13
Number of Conflict Units651552503515285621561489916488
Ratio of Conflict Units92.2%74.3%49.7%40.4%30.5%21.1%13.0%6.9%
Table 3. Land-use status of conflict unit (km2).
Land Use and
Conflict Grade
202020102000
NormalHighNormalHighNormalHigh
Construction land552.5184.73466.8775.39353.0262.60
Bare land0.520.000.490.000.000.00
Woodland482.6833.47484.0733.44459.1830.36
Water56.295.7556.615.6354.615.02
Agriculture1990.25378.172074.38387.662214.23404.30
Grassland36.150.5035.910.5037.310.34
Table 4. Net change of land-use structure in the “Western Protected Area” from 2000–2020 (km2).
Land-Use TypeID1234567891011121314
Medium Coverage Grassland1□ *
Low Coverage Grassland2−0.7
Other Construction Lands3−0.10.0
Other Forest Lands4−0.40.00.0
Rural Settlements5−0.3−12.79.81.8
Urban Construction Land6−0.10.0−5.70.0−22.4
Dry Land73.0−0.26.20.8−1.32.8
Forest Land8−0.40.12.30.0−0.7−0.3−1.5
Bare Land9−2.50.00.10.00.00.0−1.1−9.5
Water10−0.20.00.50.1−1.30.10.0−1.80.0
Paddy Field110.40.097.02.089.9130.933.85.70.03.9
Shrub Wood121.50.81.30.3−0.8−0.1−6.6−3.97.81.2−1.9
Sparse Woodland13−15.11.71.10.0−0.80.3−41.14.94.11.4−9.30.4
High Coverage Grassland14−45.8−3.2−0.20.0−0.10.3−4.4−0.10.10.0−1.7−2.4−0.1
* Net change of land-use structure is symmetric matrix; therefore, only semi-symmetric data is displayed.
Table 5. Regression analysis of the driving factors of total land-use transition.
2000–20102010–2020
Model 1Model 2Model 1Model 2
CoefP > |t|CoefP > |t|CoefP > |t|CoefP > |t|
Intercept−15.650.00−2.50.058−25.120.00−10.420.00
LUFC8.820.00−9.130.0017.040.00−2.60.135
SCCIN_Normalized21.020.00−23.10.0029.470.00−17.80.00
SSCIN_Normalized × LUFC□ *0.0051.150.00□ *0.0054.780.00
Road Length9.810.0010.510.007.840.008.380.00
GDP Per Km200.0000.0000.0000.00
Population Per Km20.040.000.040.000.050.000.050.00
Number of POI0.130.000.130.000.150.000.150.00
Distance From Urban Areas−1.180.00−0.790.00−1.590.00−1.230.00
R-squared0.5330.5440.6380.647
* Model 1 did not include this variable for comparison with Model 2.
Disclaimer/Publisher’s Note: The statements, opinions and data contained in all publications are solely those of the individual author(s) and contributor(s) and not of MDPI and/or the editor(s). MDPI and/or the editor(s) disclaim responsibility for any injury to people or property resulting from any ideas, methods, instructions or products referred to in the content.

