Article

The Association between Carbon Emission and Urban Spatial Form—A Study of Zhuhai, China

1
Faculty of Innovation and Design, City University of Macau, Macau 999078, China
2
Second Institute of National Spatial Planning, Zhuhai Institute of Urban Planning and Design, Zhuhai 519100, China
3
Key Laboratory for Urban Habitat Environmental Science and Technology, School of Urban Planning and Design, Peking University, Shenzhen 518055, China
*
Author to whom correspondence should be addressed.
Land 2023, 12(3), 720; https://doi.org/10.3390/land12030720
Submission received: 8 March 2023 / Revised: 17 March 2023 / Accepted: 20 March 2023 / Published: 21 March 2023

Abstract

:
Research on carbon emission is an important basis for solving global climate problems, and it is also one of the ways to quantitatively assess the impact of human activities. Cities are one of the main bearing spaces of human activities, and reasonable urban form is conducive to reducing energy consumption in human activities. This paper takes 50 clusters within Zhuhai, China, as the research object, quantifies the landscape spatial form index and social spatial form index of each cluster and establishes the index set of urban spatial form, so as to analyze the influence of different urban spatial form index on carbon emission. The main conclusions are as follows: (1) From the spatial distribution of each index, the urban cluster size and residential building area of each cluster in Zhuhai are generally large, and the distribution is basically consistent with that of densely populated areas. The urban clusters with high dominance are mainly located in the main urban area of Xiangzhou District, and the urban compactness, dispersion and industrial building area are generally high in the west and low in the east. (2) The size of urban clusters, industrial building area and residential building area have a strong promoting effect on carbon emission, while the compactness, dispersion and dominance of urban clusters have a strong inhibiting effect on carbon emission. (3) Based on the above conclusions, the low-carbon urban spatial form optimization strategy should be proposed from three aspects: urban development boundary control, promoting industrial structure transformation and compact urban development.

1. Introduction

The production and emission of greenhouse gases (carbon dioxide, methane, nitrous oxide, hydrofluorocarbons, perfluorocarbons, sulfur hexafluoride, etc.) are usually referred to as carbon emissions for short, which is one of the main reasons leading to the greenhouse effect. A carbon sink refers to the absorption and storage of carbon dioxide in greenhouse gases, mainly through the photosynthesis of green plants. In 1992, the United Nations signed the United Nations Framework Convention on Climate Change. The Kyoto Protocol and the Paris Agreement were adopted in 1997 and 2005, respectively. Reducing carbon emissions to tackle climate change has gradually become a global consensus. The study of carbon emissions and carbon sinks is an important basis for solving the global climate problem and also one of the ways to quantitatively assess the impact of human activities [1]. China has proposed the goal of “striving to reach the peak of carbon dioxide emissions before 2030 and striving to achieve carbon neutrality before 2060”, which reflects its responsibility as a major country to actively cope with the global climate issue and also shows its determination to promote the construction of ecological civilization and achieve high-quality development [2]. In May 2021, the “Outline of the 14th Five-Year Plan” issued by Guangdong Province also clearly proposed the goal of “forming a green way of production and life, taking the lead in reaching the peak of carbon emissions and then stabilizing with a decline” and selected Shenzhen Qianhai Cooperation Zone, Hengqin New District of Zhuhai and other regions to carry out the construction of the first batch of carbon neutral pilot demonstration cities (districts) [3].
Urban carbon emissions are mainly generated by transportation, residential life and construction, and residential carbon emissions mainly come from breathing and household garbage. The carbon emission of the building sector mainly refers to the energy consumption of the whole life cycle of the building, which can be divided into four stages. The first stage is the production and transportation of building materials, including energy consumption in the production sector of the building industry. The second stage is the carbon emissions produced by the construction phase. The third stage is the building operation stage after the completion of the building, including the burning of fossil fuels (natural gas, fuel oil) for space heating or cooling, hot water, lighting, space cooling and auxiliary equipment loads [4]. The carbon emissions of urban transport mainly come from urban road transport. The calculation of carbon emissions mainly includes the carbon emissions of buses, taxis, private cars and rail transit [5]. The influence of urban spatial form on carbon emissions is connected through various intermediary factors. Generally speaking, urban spatial form can indirectly affect carbon emissions by influencing urban transportation [6], the urban heat island effect [7], electric power transportation [8], urban infrastructure [9], energy efficiency of buildings [10] and other factors [11].
Cities are one of the main bearing spaces of human activities. The impact of urban spatial form on carbon emissions is a hot topic in academic circles. According to previous studies, up to 50% of carbon emissions in cities can be attributed to the choice of urban spatial form. For example, the impact of the change in urban spatial form on the energy demand of urban buildings can reach 2.5 times, and the impact on the performance of urban energy system can reach two times [4]. Ma et al. used activity diary survey and GIS-based land use data in Beijing to investigate the impact of urban form characteristics at community and city scales on individual daily travel behavior and carbon emissions from work and non-work trips. The results show that residents living in communities with higher employment density, close to sub-employment centers and better subway accessibility tend to choose shorter travel distances and low-carbon travel modes, resulting in less carbon dioxide emissions from work-related travel [12]. Urban growth, complexity and compactness are the most commonly used indicators to measure urban spatial form. Falahatkar et al. empirically found that urban growth is positively correlated with complexity and carbon emissions based on the temporal data of 15 cities in Iran. On the contrary, urban compactness is negatively correlated with carbon emissions, and the correlation is higher [13]. Makido et al. took 15 cities in Japan as research objects, used landscape pattern index to measure the compactness and complexity of cities and proved that the emission of carbon dioxide from compact cities with low fragmentation degree is less than that from sprawling cities [14]. Rational urban form is beneficial to reduce energy consumption in human activities. Therefore, this study explores the correlation between carbon emissions and factors related to urban form and effectively reduces urban carbon emissions by controlling relevant variables, which has certain practical significance for optimizing urban form [15]. Some studies have shown that compact cities, characterized by high density mixed land use and pedestrian housing, are beneficial for reducing carbon emissions. Due to the imbalance between work and housing and other reasons, scattered and irregular urban spatial form may lead to more vehicle exhaust emissions. Urban spatial form may also affect carbon emissions through meteorological factors affecting the region, such as the urban heat island effect, which directly or indirectly affects energy consumption [16]. Wei et al. quantified the direct and spillover effects of multidimensional urbanization and foreign direct investment on carbon emissions using multivariate remote sensing data, and the results showed that multidimensional urbanization and foreign direct investment had a significant positive impact on carbon emissions [17]. Zhou et al. made a quantitative analysis of the impact of mode substitution and carbon emissions in the use stage of electric bicycle sharing system (EBSS) by using independent survey data and EBSS operating data [18]. Therefore, it is of profound theoretical and practical significance to explore the relationship between urban spatial form and carbon emission and realize low-carbon sustainable development by changing urban spatial form. The measurement of carbon emissions is an important step in related research. Carbon emissions can be divided into direct carbon emissions and indirect carbon emissions [19]. The carbon emission produced by land use and land cover can be classified as direct carbon emissions, while the carbon emission produced by social economic growth and development activities such as urbanization, energy consumption and agricultural production can be classified as indirect carbon emissions [20]. Yang et al. estimated land use carbon emissions using both direct and indirect carbon emissions estimation methods. Direct carbon emissions are generated by forests, grasslands, water and unused land, while indirect carbon emissions are generated by energy needed for socio-economic growth and construction land and farmland development [21].
The current research on the spatio-temporal differences in carbon emissions mainly focuses on the national and provincial levels or some mature urban agglomerations. The existing studies mostly use technology black boxes to calculate carbon emissions and sinks. Moreover, the correlation degree between carbon emissions and sinks and relevant factors at the city level is not discussed enough, and carbon emissions and sinks are mostly calculated at the national, provincial and urban agglomeration levels. The construction of analysis framework on the scale of urban clusters is still lacking, which is not conducive to guiding the specific construction points of low-carbon cities. Therefore, in this study, 50 urban clusters in Zhuhai were taken as the research object. The landscape spatial form index and social spatial form index of each urban cluster were calculated, and the urban spatial form index system was established through screening. Carbon emissions were estimated by direct and indirect measurements. Then, the effects of different urban spatial form indexes on carbon emissions were analyzed. The main objective of this study is to explore how carbon emissions are affected by urban spatial form, propose specific spatial optimization strategies and clarify the practicability and practical significance of the study. The framework for analyzing is shown in Figure 1.

2. Materials and Methods

2.1. Study Area and Data Sources

This study takes Zhuhai City as an example. Located on the southwest bank of the Pearl River Estuary in Guangdong Province, Zhuhai has a warm and rainy climate and dense water network. Five of the eight estuaries of the Pearl River are located here. Zhuhai has jurisdiction over three administrative regions, namely Xiangzhou District, Doumen District and Jinwan District. Zhuhai is a special economic zone with international and socialist modernization, a core city on the west bank of the Pearl River Estuary, a hub city connecting Hong Kong and Macao and a marine center city in the Greater Bay Area. The research area is bounded by the administrative jurisdiction of Zhuhai City, with a total of 58 basic urban clusters. Based on the actual research situation, the basic urban cluster of Zhuhai City in this study, with a total of 50 research units, is obtained after integration, as shown in Figure 2. The total land area of the study area is 1725.06 square kilometers, and the construction land area is 391.95 square kilometers.
The study of urban spatial form and carbon emission needs accurate urban data support. The data needed for the research mainly include urban land use data, road data, population density data, building data and socio-economic data, as shown in Table 1. All spatial data are projected in the coordinate system WGS_1984_UTM_Zone_49N. The data of administrative boundary came from the overall territorial space plan of Zhuhai City (2021–2035). Road data were derived from the third National Land Survey land use type desensitization data and open block map (OSM). Building data are derived from the basic mapping and geographic information desensitization data of the central city of Zhuhai. Land use data are derived from the 2020 Global 30-m land cover Fine classification product [22] of the Chinese Academy of Astronautics and Astronomy, which is produced by using all Landsat satellite data (Landsat TM, ETM+ and OLI) from 1984 to 2020 and follows the classification system of 2020 baseline data. A total of 29 land cover types were included, and the renewal cycle was 5 years. Population density data come from Worldpop population density data set, which classifies and spatializes the spatial distribution of global population by using a large number of high-resolution images, reports, statistical data and geographic information system data to support the study and analysis of global population dynamics. The social and economic data mainly come from 2021 Zhuhai Statistical Yearbook, from the official website of Zhuhai Statistics Bureau. The carbon emission inventory come from China’s county-level carbon dioxide emission inventory.

2.2. Methods

2.2.1. Construction of Urban Spatial Form Index System

Construction and Calculation of Landscape Spatial Index

Based on existing studies, 13 landscape form indicators [7] are selected from the direction of city size and aggregation degree and calculated by Fragstats 4.2 software (a landscape index calculation software developed by the Forest Science Department of Oregon State University in the United States, which contains landscape indicators of area, edge, shape, aggregation and other dimensions). The calculation of landscape index is based on the impervious water grid data within the urban cluster. The specific explanation of the selected indicators in Fragstats is shown in Table 2.

Construction and Calculation of Social Spatial Index

Population Density, Residential Building Area, Commercial Building Area and Industrial Building Area are selected as social spatial indicators of urban spatial form. In ArcGIS 10.5 (Environmental Systems Research Institute, RedLands, State of California, USA), the raster data of population density were analyzed in different regions to obtain the population density index of each cluster in Zhuhai. Then, the current building data are separated into residential, commercial and industrial building types, and the area of each type of building in each cluster is counted, respectively.

2.2.2. Measurement of Carbon Emission Index

In this study, direct and indirect methods were used to measure carbon emissions. The direct measurement method measures the carbon emissions caused by cultivated land, forest land, grassland, water area and other types. Land use data are reclassified and obtained according to the corresponding carbon emission coefficient. The calculation formula is as follows:
E d i r e c t = L i = A i × F i
where, Edirect is direct carbon emission; Li is the carbon emission of land use type i; Ai is the area of the i-th land use type; Fi is the carbon emission coefficient of the i-th land use type. Referring to previous studies, the carbon emission coefficients of cultivated land, forest land, grassland and water area are, respectively, 7.9, −57, −2.1 and −2.3 [23].
The indirect method measures the carbon emissions of construction land due to the energy consumption of human activities. Since construction land is difficult to directly measure carbon emissions, this paper calculates energy consumption indirectly with the following formula [24]:
E i n d i r e c t = S i × Y i
where, Eindirect is indirect carbon emission; Si represents energy consumption converted into standard coal in domestic, industrial and transportation sectors; Yi represents the carbon emission coefficient corresponding to each energy source. Referring to the relevant literature, the coefficient is 0.67 in this study [25]. After the carbon emissions of construction land in Zhuhai are calculated, the total carbon emissions will be allocated to each cluster according to the proportion of living, industrial and road land area in the whole city.
To sum up, the total amount of carbon emissions depends on the difference between carbon sources and carbon sinks, in which construction land and cultivated land are the main carbon sources, while woodland, grassland and water area are the main carbon sinks. Finally, the direct and indirect measurements add up to total carbon emissions. At the same time, in order to eliminate the impact of data dimensional differences, all variables need to be normalized, and all variables can be compared in the same dimension by means of extreme value standardization. The standardization formula of extreme values is as follows:
X = x x m i n x m a x x m i n

2.2.3. Ecological Network Connectivity Evaluation

With each cluster in Zhuhai as the unit, carbon emission as the dependent variable and landscape spatial index and social spatial index factor as the independent variable, Spearman correlation analysis was used to screen factors with high correlation with each other, and then the indicators were selected. In addition, multiple regression model was established to analyze the key factors affecting carbon emission in urban spatial form. Finally, the key factors with high significance were obtained, which provided the basis for policy recommendations.

3. Results

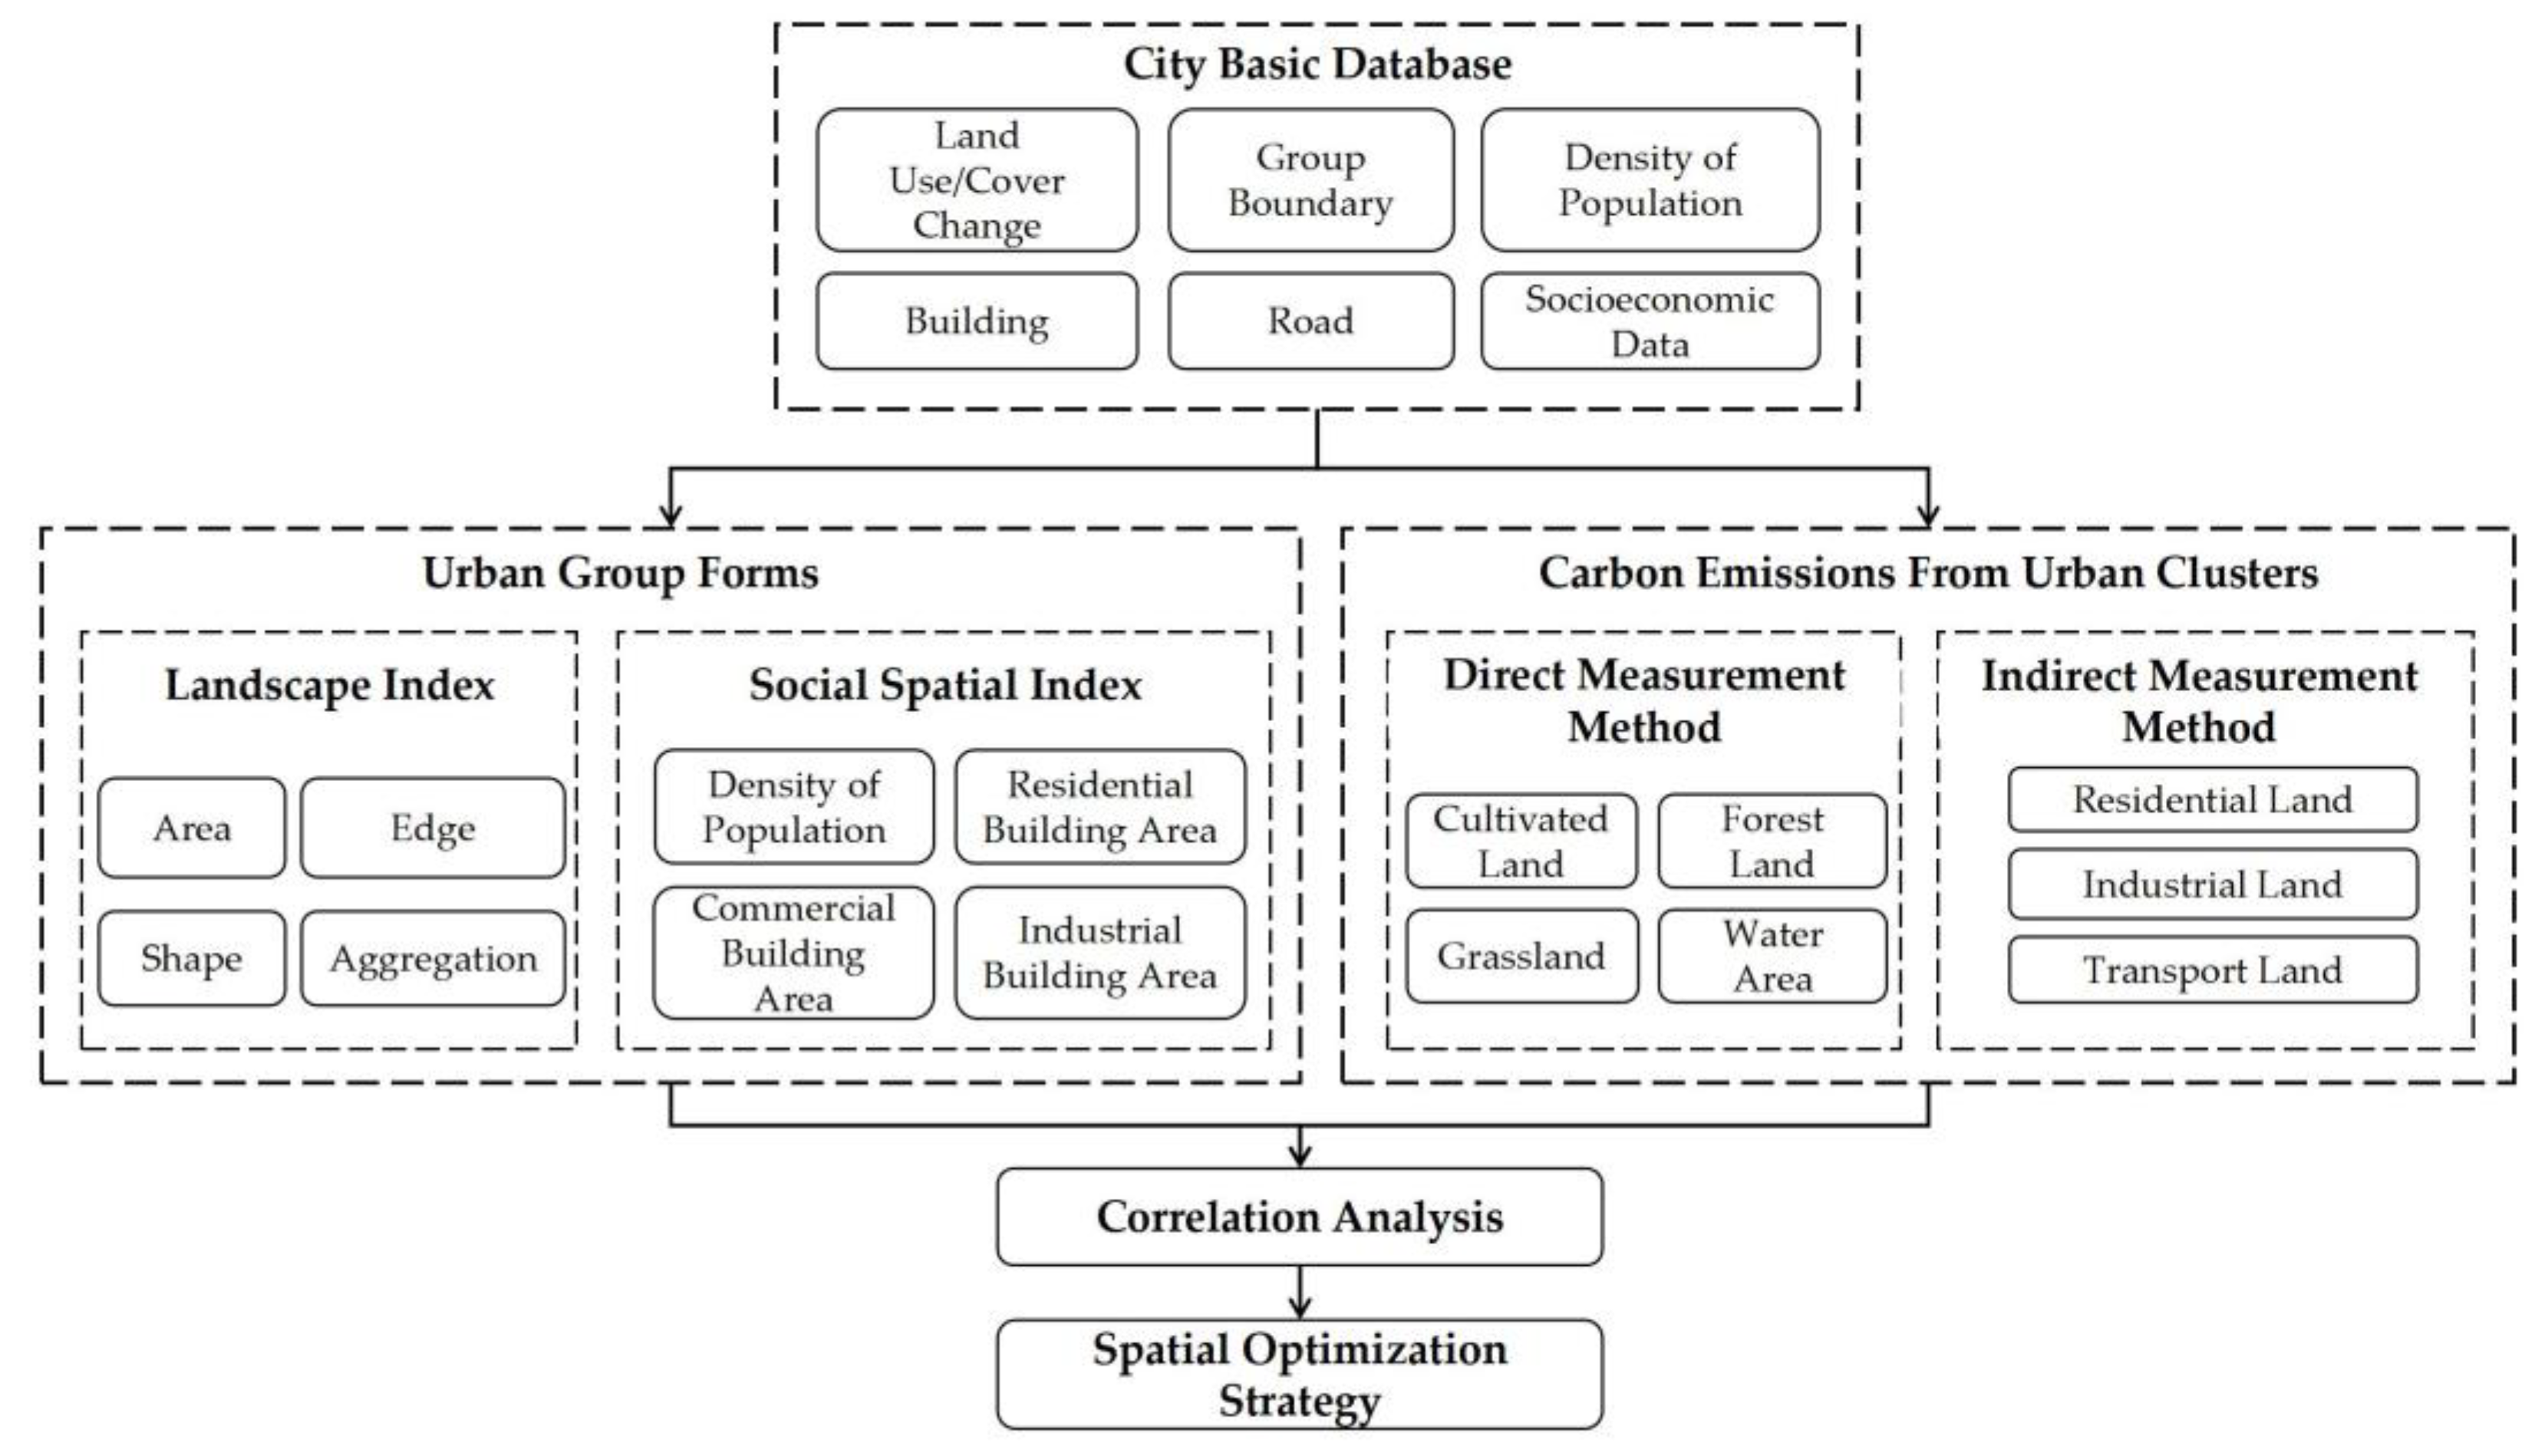
3.1. Measurement and Screening of Landscape Spatial Structure Index

The selection of indicators should be careful, as highly correlated indicators may bring the threat of redundant information [26]. For example, in multivariable regression, the multicollinearity between the independent variables will lead to the larger confidence interval of the parameter and the sign error of parameter fitting, and the wrong result will be obtained by hypothesis testing [27]. Variance inflation factor (VIF) is an important index to quantify the degree of multicollinearity. The higher the collinearity between independent variables, the larger the VIF value. The empirical judgment method shows that a VIF value greater than 10 indicates that the model has severe multicollinearity [28]. After obtaining the results of 13 landscape spatial indicators by Fragstats 4.2 software (Appendix A, Table A1), multicollinearity test was carried out. According to VIF values in Table 3, the variables selected in this paper have serious multicollinearity and need to be screened for indicators.
The most common way to solve multicollinearity is to find the explanatory variable that causes multicollinearity and exclude it. Spearman’s rank correlation coefficients (RHOs) are nonparametric indicators that measure the dependence of two variables. Pairwise correlation Spearman rank correlation coefficients were tested for all 13 variables. Among them, the correlation coefficients were ±0.75–1.0 for strong correlation, ±0.5–0.75 for moderate correlation and ±0.25–0.5 and ±0–0.25 for weak correlation and no correlation, respectively. According to the Spearman rank correlation coefficient, the high correlation indicators with large absolute values were sorted from largest to smallest in order to achieve preliminary screening of indicators. The Spearman rank correlation coefficient matrix of all variables is shown in Table 4, and the variable combinations with higher coefficients are shown in Table 5.
According to Spearman rank correlation coefficient matrix, landscape spatial form index was eliminated in further analysis, and variables highly correlated with other variables and with high correlation frequency were given priority to be eliminated. Combined with the correlation between the indicators and the applicability of the representation of urban spatial form, four indicators were left: Patch Class Area (CA), Largest patch area (LPI), Patch Density (PD) and Mean Euclidean Nearest Neighbor Distance (ENN-MN). These four indicators represent the four dimensions of urban spatial form: city scale, dominance, compactness and dispersion.
CA is equal to the sum of all the construction land patch areas within the urban cluster. The size of urban patch not only affects the urban productivity but also affects the healthy development of residential environment [29]. This indicator helps reveal the size of cities, which can reduce vegetation cover and lead to a decrease in carbon sinks. This will have a negative impact on the carbon cycle, resulting in an increase in carbon emissions.
LPI is the area proportion of dominant patch types in the landscape, which can describe the degree to which an urban cluster area is characterized by a single nuclear development pattern on the type scale. The larger the value is, the larger the contiguous area of urban patches is, which directly affects the carbon emission. The stronger the advantages of the core area and the more concentrated the resources, the lower the cost of infrastructure construction connecting the patches, and the increase in round-trip activities and transportation distance will also lead to the increase in carbon emissions.
PD represents the patch area per unit area, and the greater the value, the greater the patch density per unit area in the urban cluster. Compactness is the core concept of urban sustainable development [30], and its quantitative index is an effective method to evaluate the internal structure of urban spatial clusters. Compact development allows for shorter distances between different parts of the city, and shorter distances reduce the need for car traffic, directly reducing carbon emissions. In addition, urban compactness indirectly affects ecological environment, industrial production, travel choice and other factors, thus affecting carbon emissions.
ENN-MN quantified the average distance between the two closest urban built-up patches, which could be interpreted as the spatial linkage value between urban patches. The larger the value, the higher the degree of urban growth and expansion. This index can measure the spatial correlation between urban patches. The higher the dispersion of urban patches, the higher the cost of infrastructure construction to connect the patches, and the increase in round-trip activities and transportation distance will also lead to the increase in carbon emissions.
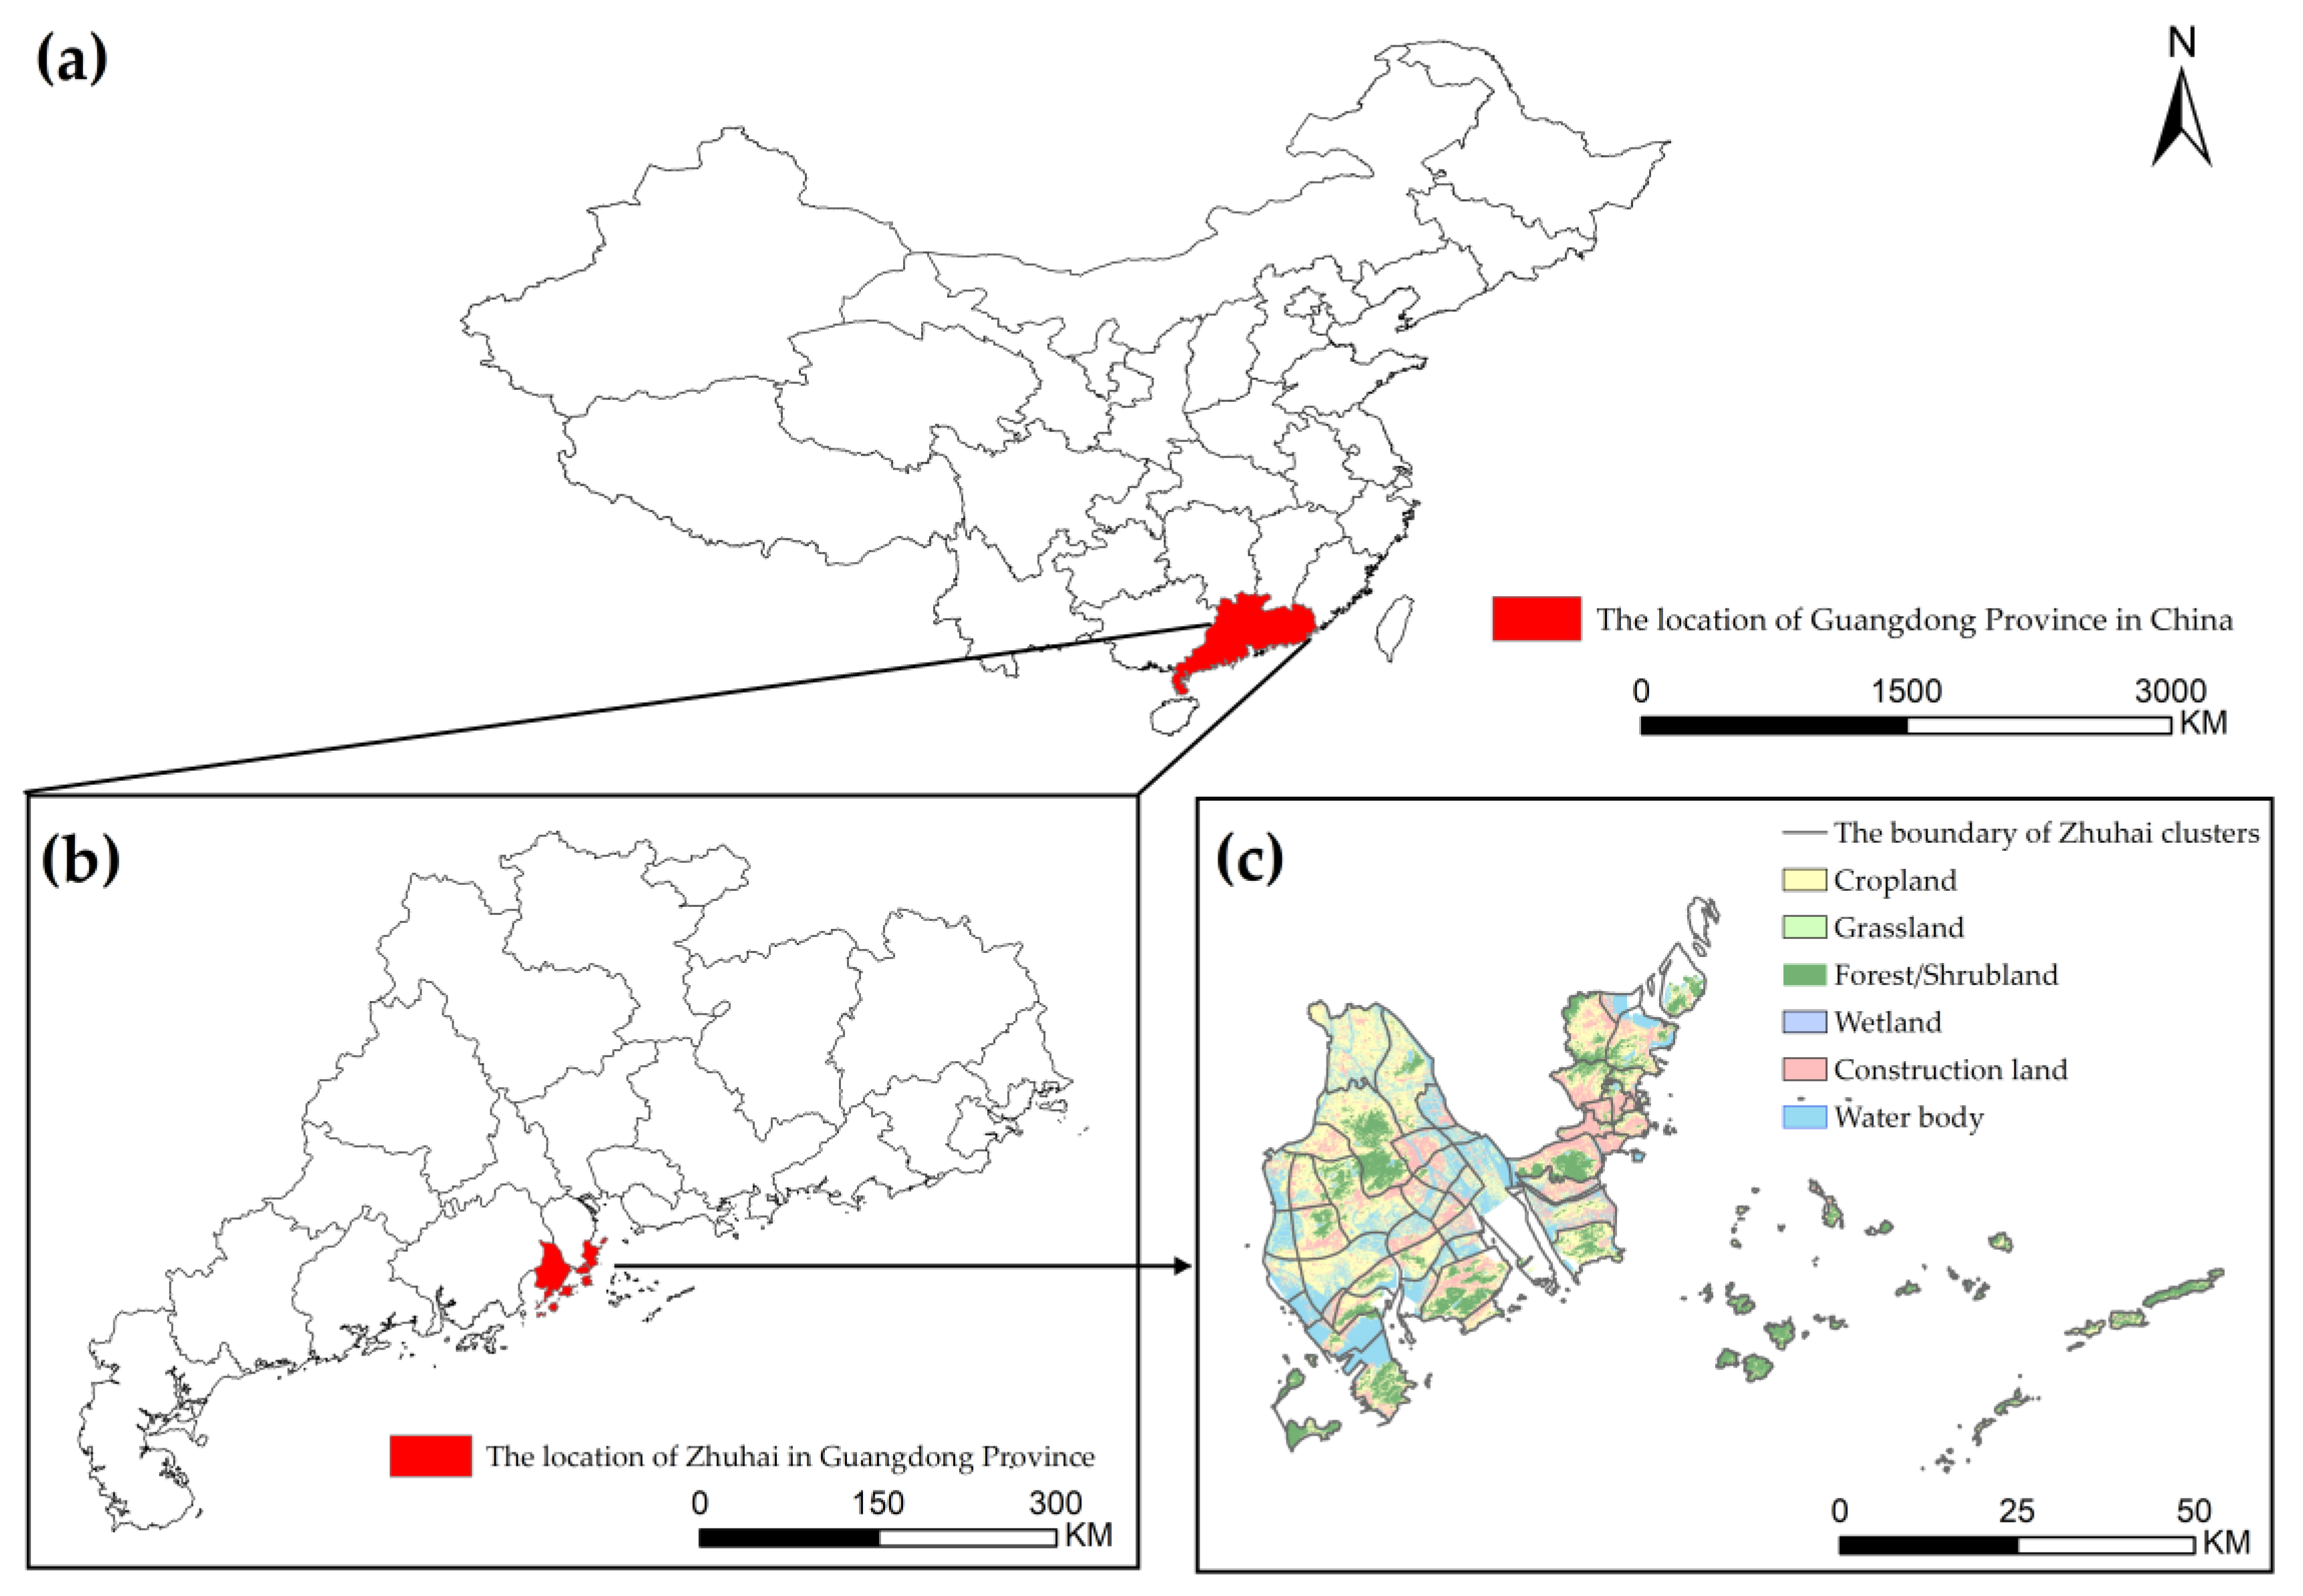
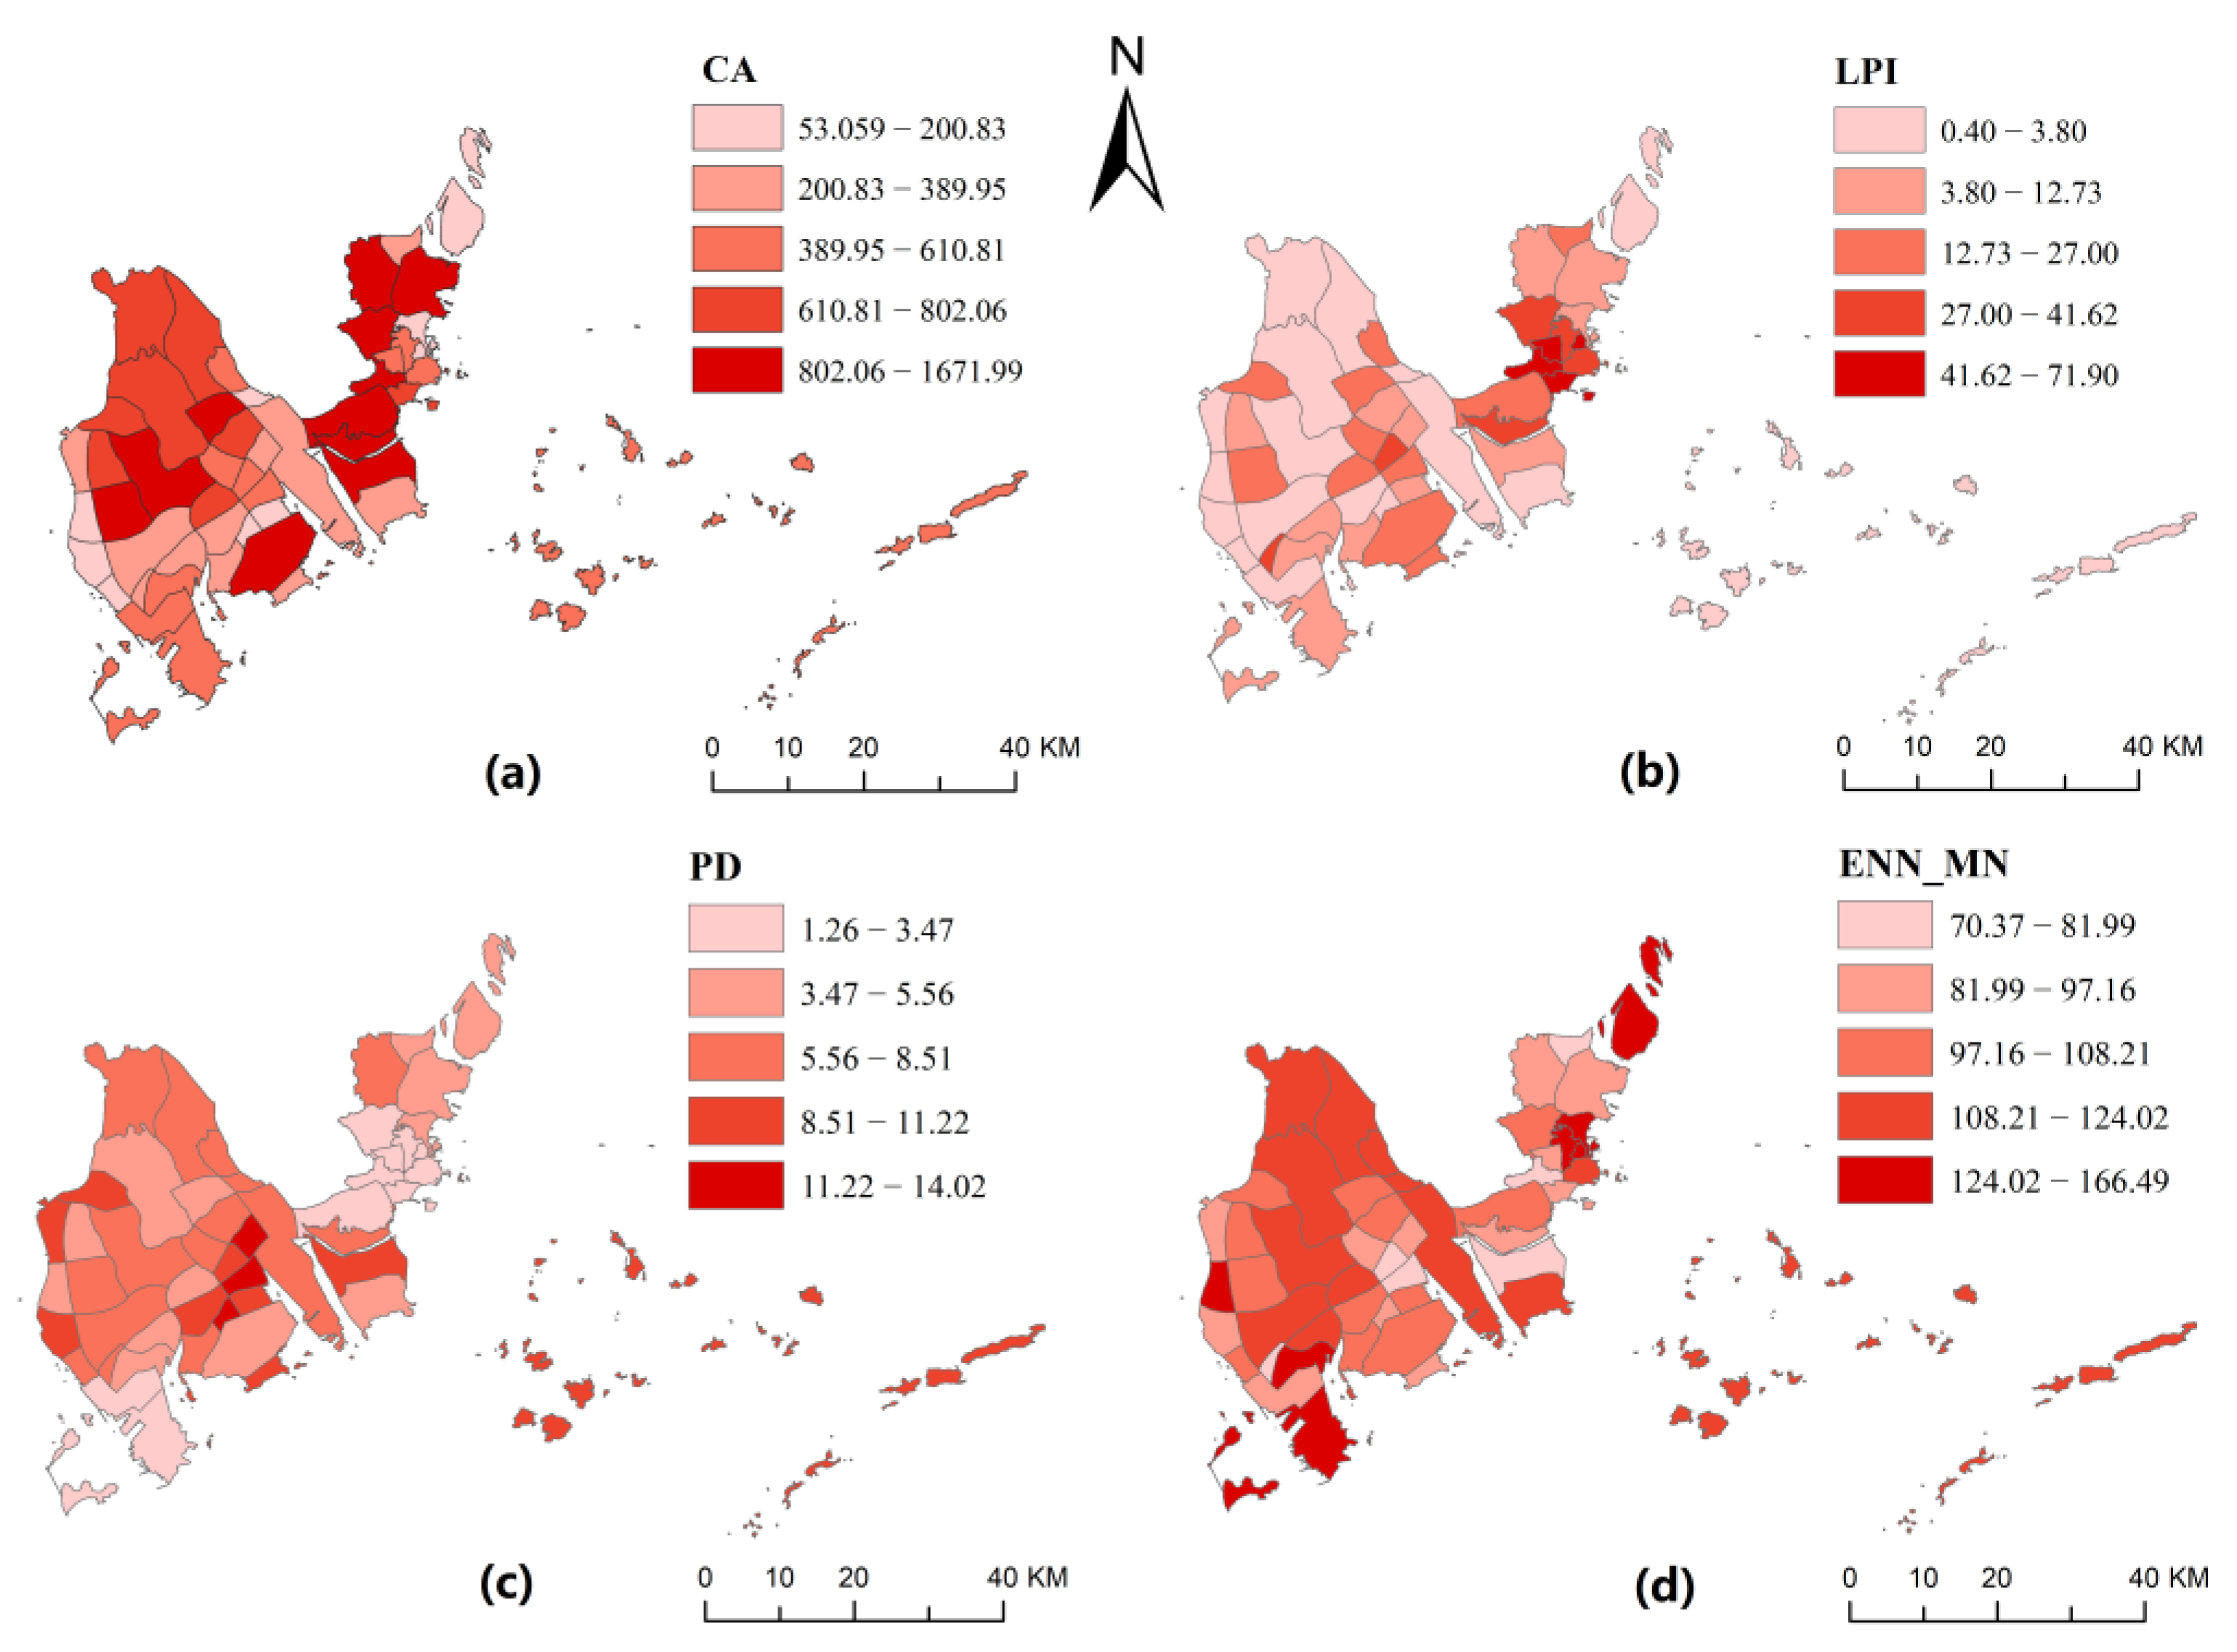
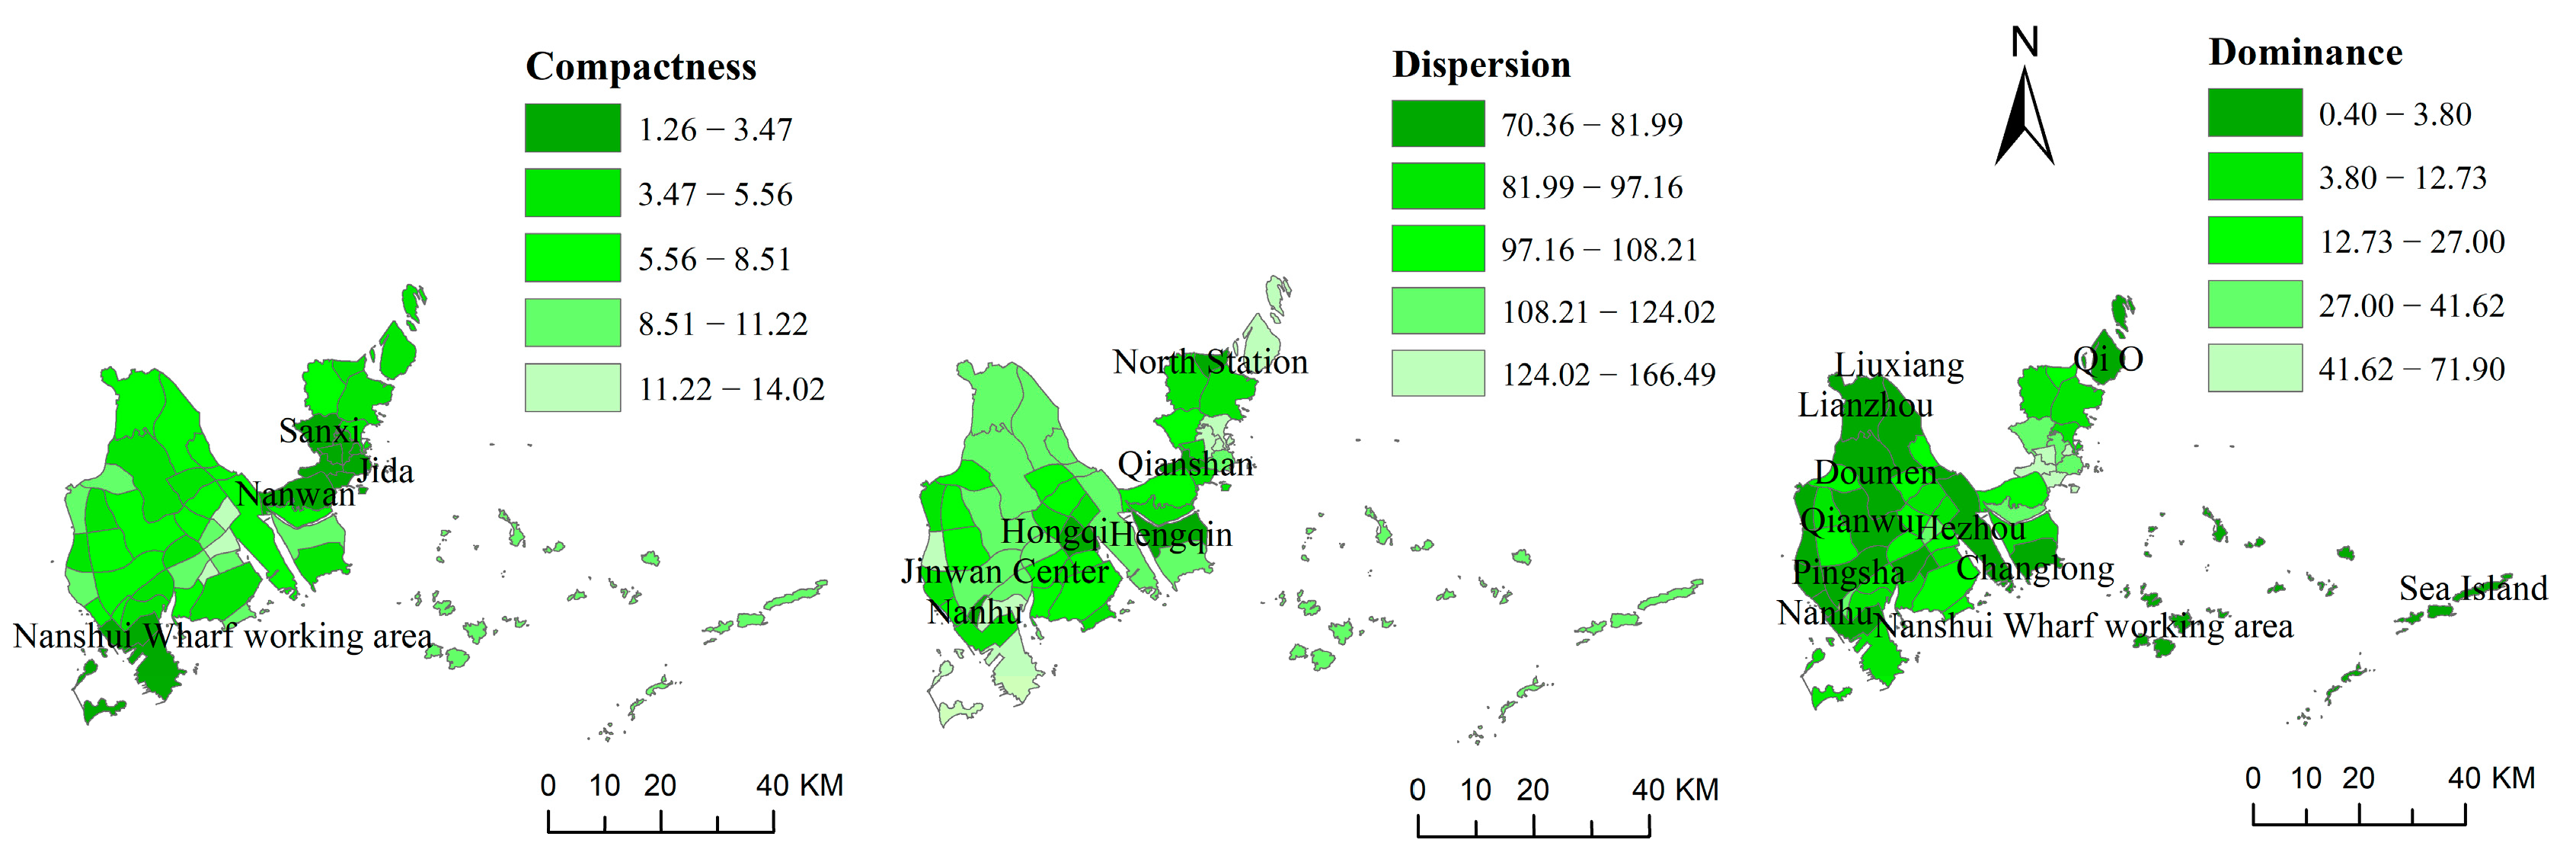
After the selection of landscape spatial form, in order to further understand the correlation between landscape spatial form and carbon emission, according to the natural discontinuity method, the spatial distribution map of landscape spatial form index in Zhuhai was obtained (Figure 3), and the distribution characteristics of variables were analyzed.
As can be seen from Figure 3a, the overall distribution of large urban clusters in Zhuhai is relatively uniform. Since this index has a large correlation with the total area of urban clusters, the scale of urban clusters in Xiangzhou District (eastern central urban area) is relatively small. As can be seen from Figure 3b, the urban clusters with high dominance in Zhuhai are mainly located in Xiangzhou District. Due to the long development time within these clusters, the fragmented built-up areas within them have been basically contiguous, and the dominance of large built-up patches is strong. In contrast, the dominance of the western district of Zhuhai is relatively low. As can be seen from Figure 3c, the areas with high patch density (PD) are mainly distributed in the western suburbs of Zhuhai (Doumen District and Jinwan District), especially the central district of Jinwan, Hezhou high-speed railway Station and Fushan Industrial Zone. The main reason is industrial structure. Due to the large amount of farmland and other ecological land, the patches of construction land are cut into small pieces, resulting in high patch density. On the contrary, the patch density in eastern central city was lower. As can be seen from Figure 3d, ENN_MN was generally high and evenly distributed, showing a high distribution in the west and low distribution in the east. The high dispersion of most clusters in the western suburbs of Zhuhai reflects that the construction of a large number of new towns and the expansion of construction land in the western suburbs in recent years lead to the high dispersion of built-up areas. The high dispersion of Xiangzhou District (central urban area) is mainly in the east coastal zone. These areas are mainly blocked by terrain, and the patch dispersion is high. The central area of Jinwan in the western suburbs of Zhuhai and the high-tech zone in the north of Xiangzhou District are depressions with group dispersion. The construction land in these places is mainly distributed in the plain, and the built-up areas are basically contiguous with low dispersion.

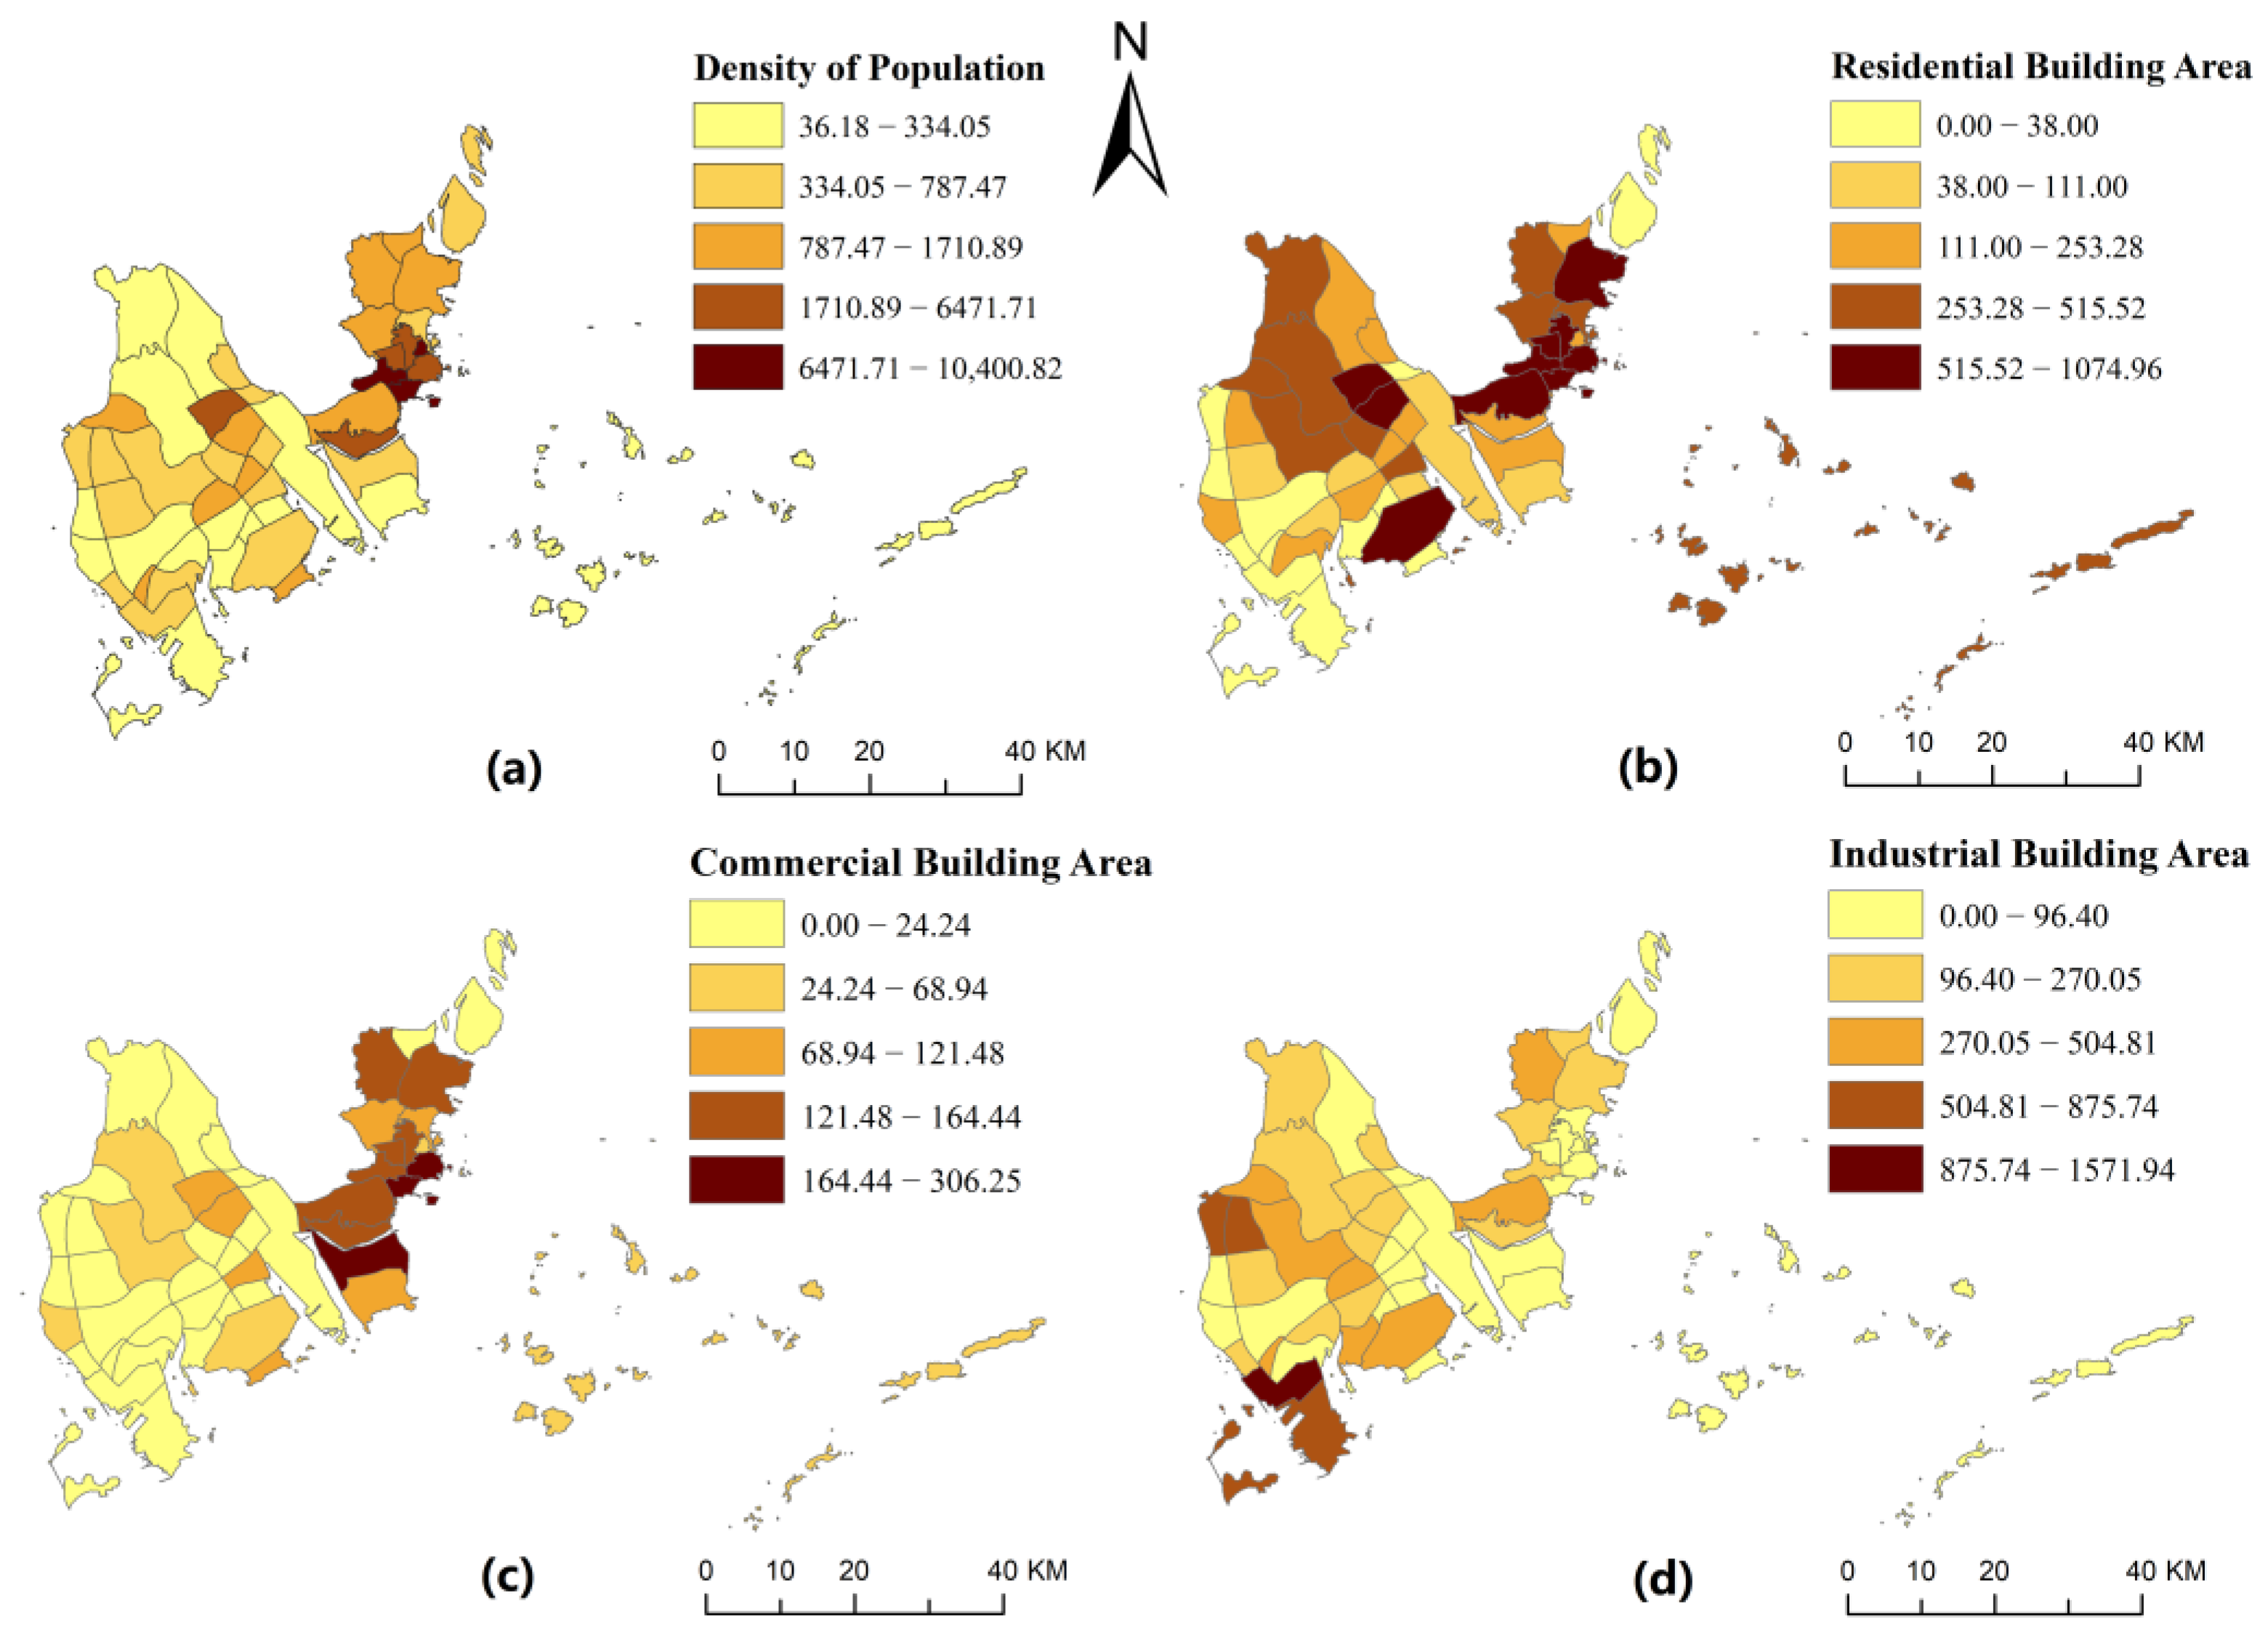
3.2. The Results of Social Spatial Structure Measurement

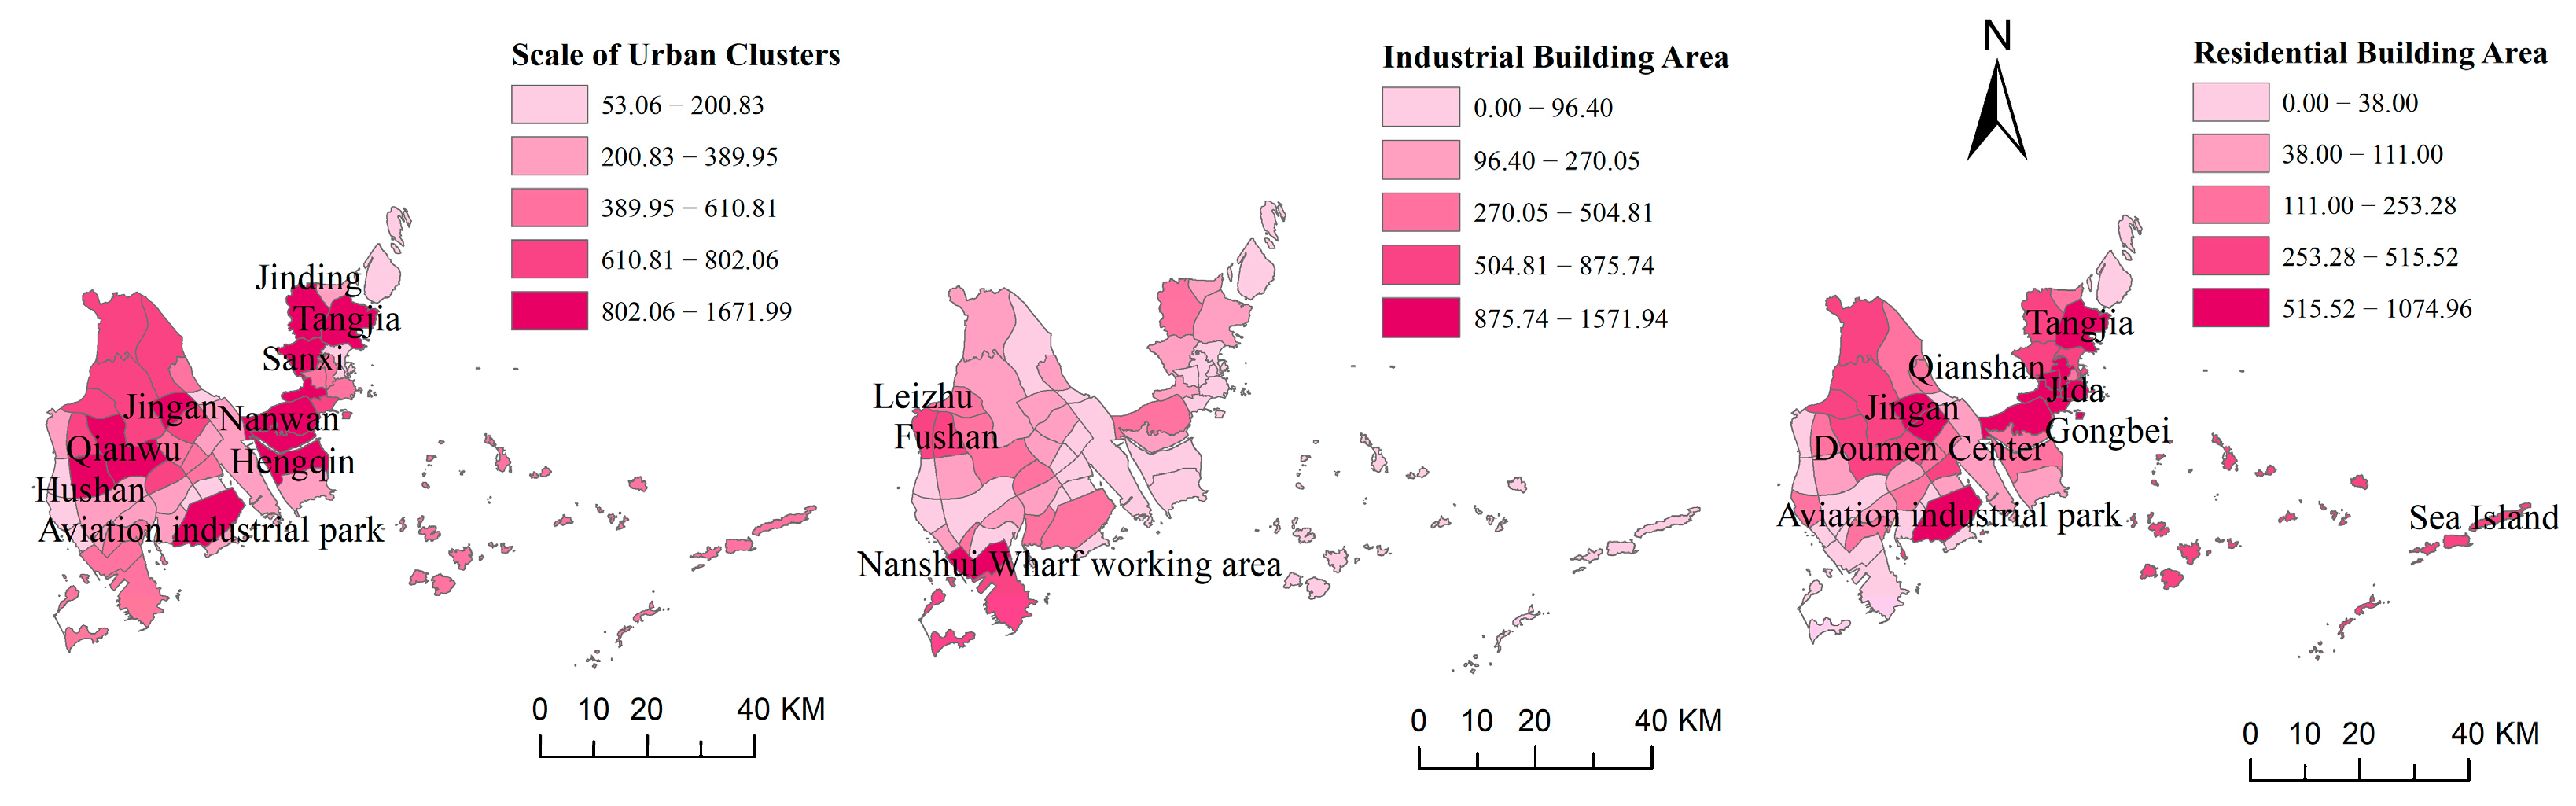
The social space indicators in urban spatial form are calculated, and the results are divided into five levels according to the natural discontinuity method, as shown in Figure 4. Social spatial index factors are few, and there is no high correlation between each other, so it does not need to be screened.
As can be seen from Figure 4a, the densely populated areas of Zhuhai are mainly distributed in Xiangzhou (the central area of Zhuhai), especially Qianshan Cluster and Shishan Cluster. Jingan Cluster, as the central urban area of Doumen District (western suburb) and one of the sub-centers of Zhuhai, has a high population density too. In contrast, the population density of other clusters is lower, and there is still a large room for population growth. As can be seen from Figure 4b, there are more high-value areas of residential building area and relatively dispersed areas. For example, Xiangzhou District, aviation industrial Park in the western suburbs and Doumen Center and other clusters of residential buildings are relatively high, which is basically consistent with the distribution of densely populated areas. In the southwest of Zhuhai, the residential area of the cluster is small. This area is an industrial intensive area, which is dominated by industrial land. As can be seen from Figure 4c, there is a large gap between the east and west of Zhuhai in terms of commercial building area. Xiangzhou district in the east is generally higher, while Doumen District and Jinwan District in the west is generally lower. It reflects the commercial development gap between the East and west of Zhuhai. As can be seen from Figure 4d, different from the commercial building area, the industrial building area of Zhuhai is generally higher in the west and lower in the east. The industrial layout of Zhuhai is mainly in the western district, especially the booming development of Gaolan Industrial zone and Fushan Industrial Zone, which result in the large industrial building area of these two clusters. The industry in the east has basically completed the relocation, and the industrial structure is dominated by the tertiary industry.

3.3. The Influence of Urban Spatial Form on Carbon Emission

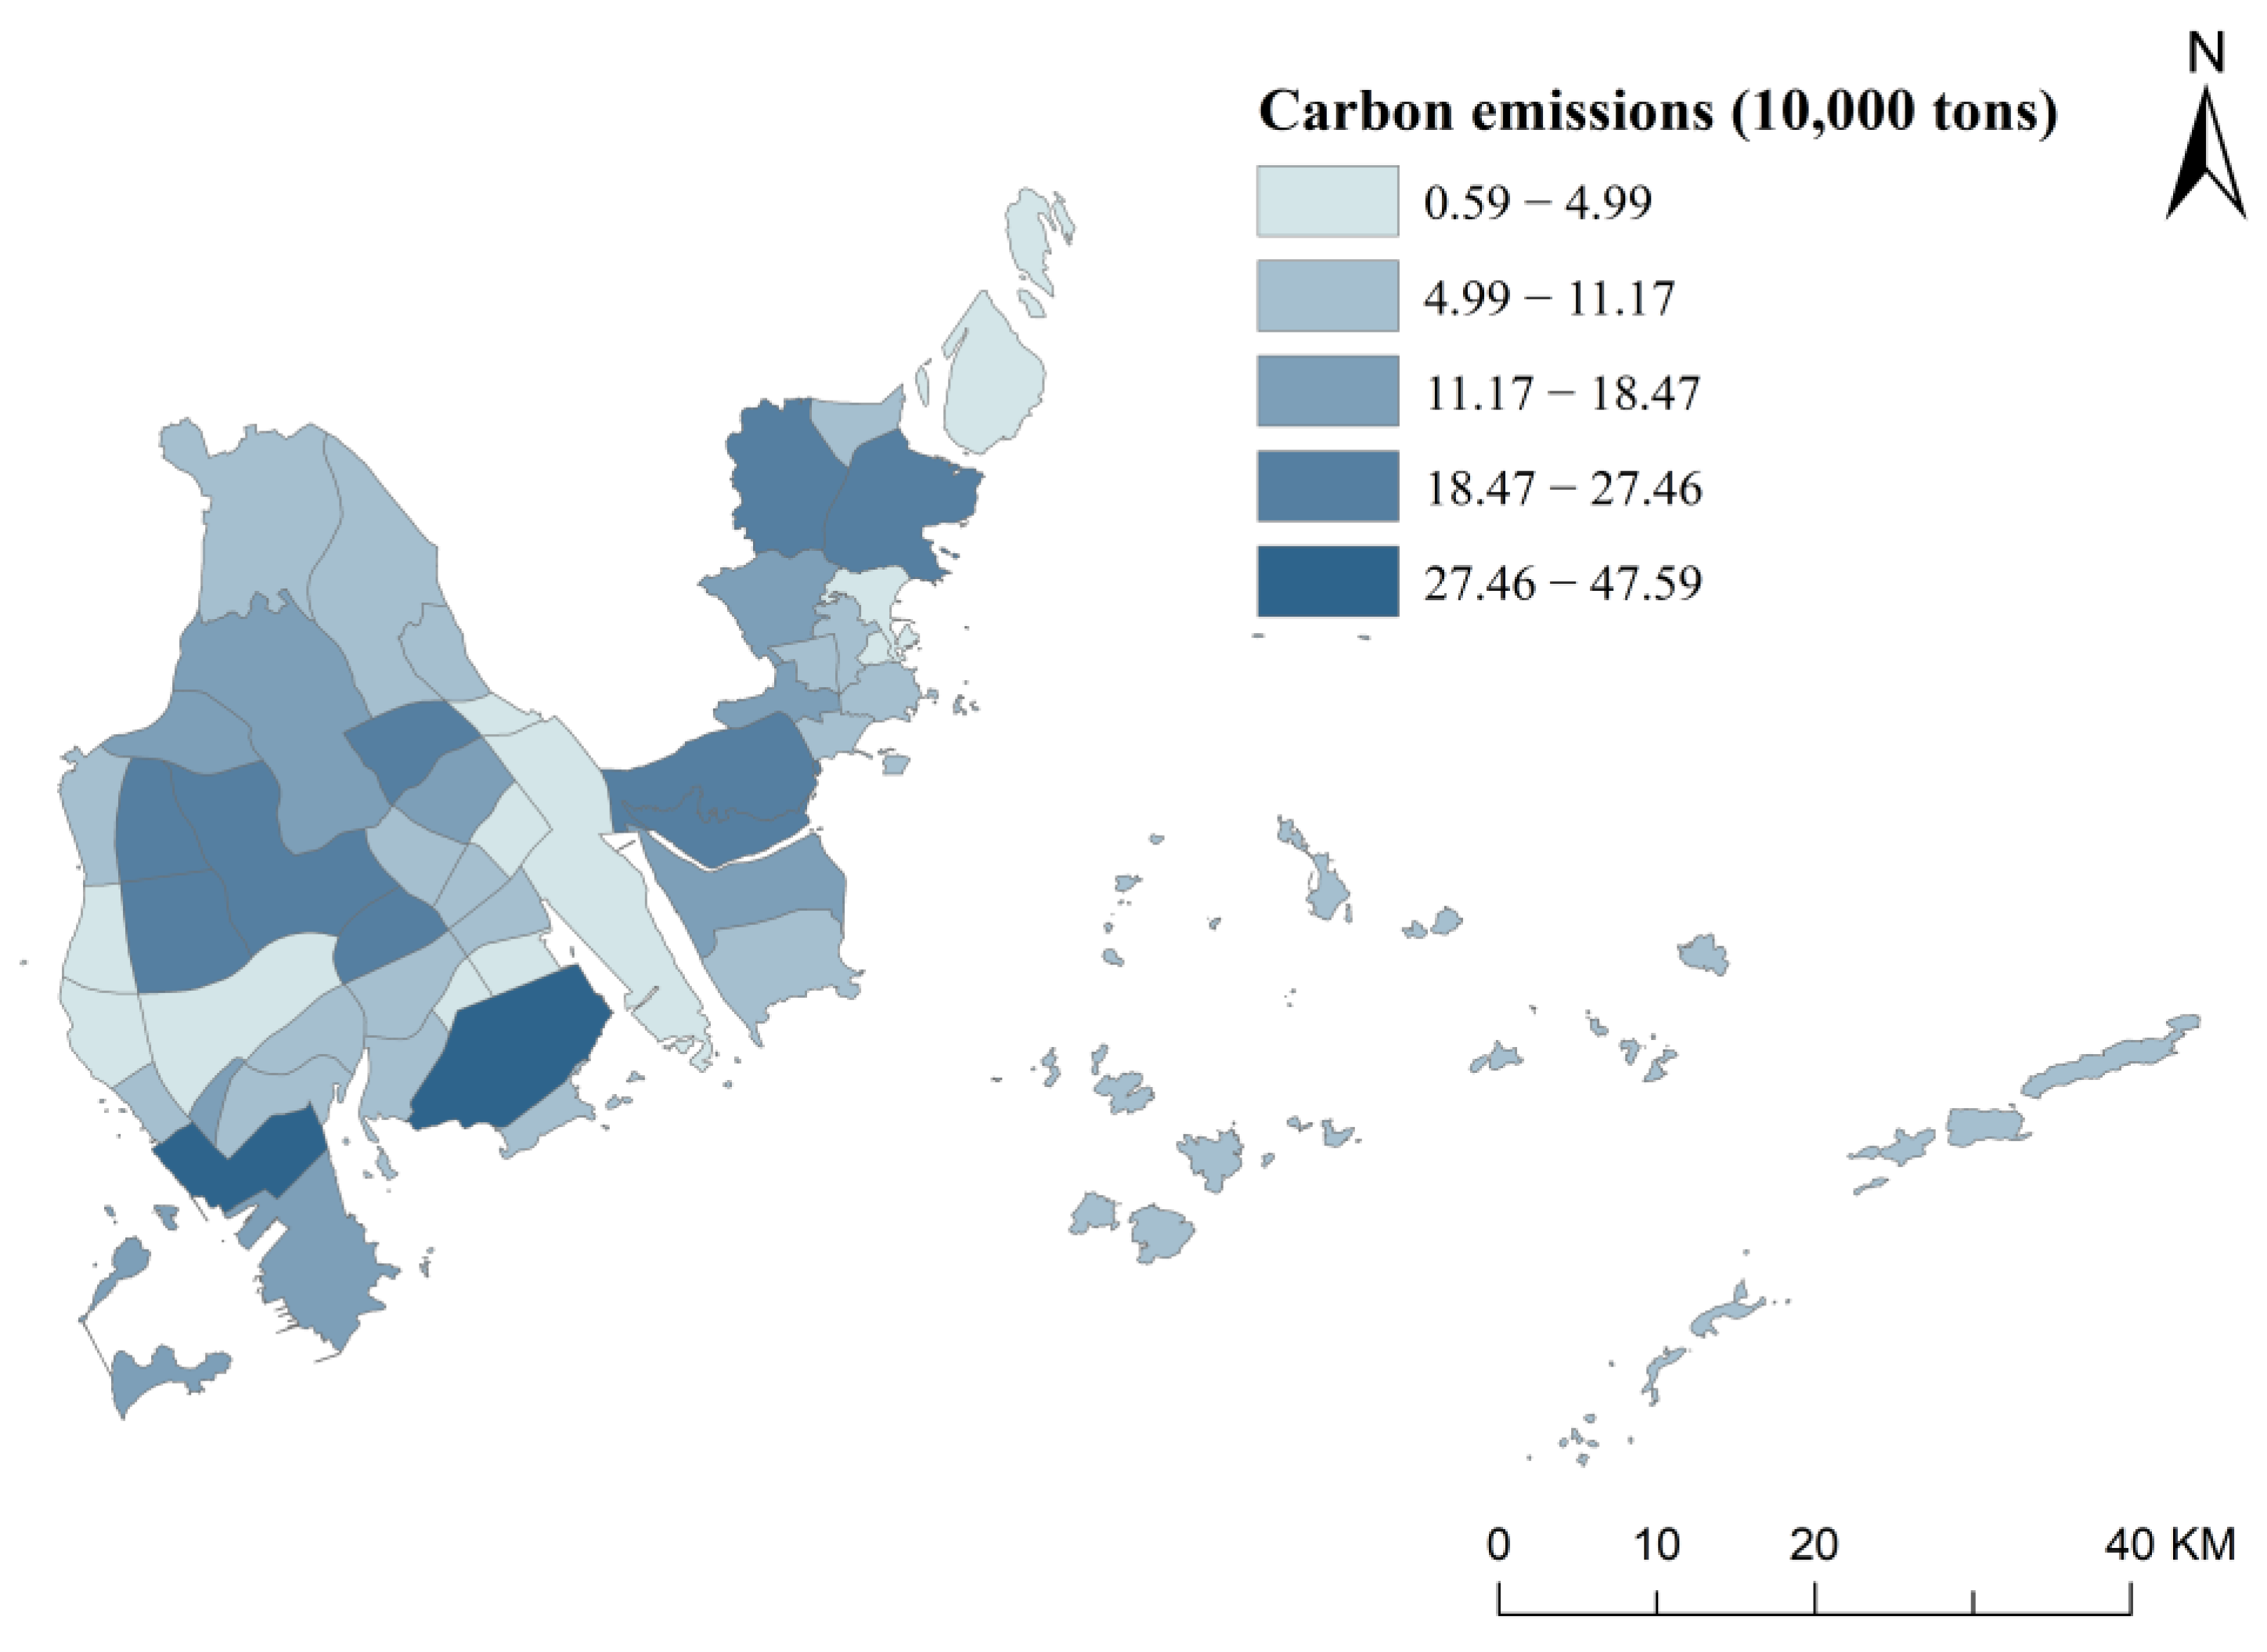
The carbon emissions of each cluster in Zhuhai are obtained by adding the values obtained by the direct and indirect measurement methods, as shown in Figure 5. Zhuhai’s carbon emissions totaled 6.16 million tons. According to China’s county-level carbon dioxide emission inventory [31], Zhuhai’s carbon dioxide emission in 2017 was about 16.13 million tons. Since one ton of carbon completely burned in oxygen produces about 3.67 tons of carbon dioxide, the resulting carbon emission from the inventory is about 4.4 million tons. Considering that the carbon emission in 2020 is calculated in this paper, the result is not much different from that calculated in this paper, which is considered to be basically reasonable.
As can be seen from Figure 5, The high-value area of Zhuhai carbon emission is the aviation industrial park and Nanhu Cluster in the south of the western suburbs, which are basically consistent with the distribution area of heavy industry. In addition, Nanping Town in the west of Xiangzhou District, the high-tech zone in the north of Xiangzhou District and the west of Doumen District also have high carbon emissions.
In order to investigate the influence of urban spatial form on carbon emission, CA, LPI, PD, ENN-MN in landscape spatial form index and population density, residential building area, commercial building area and industrial building area in social spatial form index were taken as explanatory variables, and urban carbon emission was taken as explained variables. The least square regression model was used to conduct multiple regression analysis for the two clusters, respectively. The regression results of landscape spatial form and carbon emission of urban clusters are shown in Table 6, and the regression results of social spatial form and carbon emission of urban clusters are shown in Table 7.
In the regression of landscape spatial form and carbon emission, the overall R2 of model regression is 0.713, with good regression accuracy. It can be found that the four variables all have significant effects on carbon emissions (significance is 0).
According to the comparison of standardization coefficient values, city scale has the greatest influence on carbon emissions of each cluster (0.630), followed by city compactness (−0.498), city dispersion (−0.418) and dominance has the least influence (−0.388). The size of a city plays a role in promoting carbon emissions; that is, the bigger the city, the higher the carbon emissions. Compactness, dispersion and dominance have an inhibitory effect on carbon emissions; that is, the more compact the city is, the stronger the urban expansion is, the more dominant the core is, and the less carbon emissions will be. In addition to the dispersion, the results of the other three variables are consistent with our hypothesis. Considering the actual situation of Zhuhai, the cluster with high dispersion is generally the area with more construction land such as farmland and mountain forest, which makes the built-up area distributed scattered. These areas, however, emit less carbon because of the smaller amount of construction land, such as industrial land and residential land.
The inner land of the urban cluster tends to be saturated, so the urban scale can only be increased by outward expansion to obtain new land resources. However, it is of great significance to avoid excessive expansion of construction land to reduce carbon emissions. In addition, for each large cluster, enhancing the inner compactness of the city in a planned way and enhancing the advantage of the core area are also an effective way to reduce the carbon emissions of each urban cluster.
In the regression of social spatial form and carbon emission, the overall R2 of model regression is 0.709, with good regression accuracy. The residential building area and the industrial building area have significant influence on urban carbon emission.
According to the comparison of standardized coefficient values, industrial building area has the greatest impact on carbon emissions of each cluster (0.751), followed by residential building area (0.405). Both industrial and residential building area play a role in promoting carbon emissions; that is, the larger the industrial and residential building area, the higher the carbon emissions. Industrial carbon emissions and domestic carbon emissions are important sources of carbon emissions, and industrial carbon emissions account for a larger proportion, so it is necessary to prioritize emissions reduction in the industrial sector.

4. Discussion

According to the empirical analysis of Zhuhai City, through screening and regression analysis of 17 indicators of urban spatial form, it is found that the size of urban cluster, industrial building area and residential building area have a strong promoting effect on carbon emission, while the compactness, dispersion and dominance of urban cluster have a strong inhibiting effect on carbon emission. Therefore, optimizing urban spatial form is an important policy tool for building low-carbon cities, as well as one of the important ways to realize low-carbon cities. In this regard, this study proposes the following low-carbon urban spatial form optimization strategies.
(1) We should develop boundary controls in cities. As far as possible, urban sprawl should be avoided; the contradiction between urban development and ecological protection should be coordinated; and the main urban development boundary should be defined with stock development as the primary purpose to protect the ecological bottom line. At the same time, it is more reasonable to predict the land demand of population economic development in different periods in the future [32], and the future urban growth boundary is simulated by combining the evaluation of suitability and carrying capacity [33]. As can be seen from the spatial distribution diagram of positive independent variable indicators in Figure 6, the built-up areas of Qianshan, Nanwan, Hongwan, Hengqin, Sanxi, Jinding and Tangjia clusters in Xiangzhou District, Jingan, Qianwu and Hushan clusters in Doumen District and aviation industrial Park clusters in Jinwan District are of large scale, and urban development boundaries should be strictly controlled to avoid disorderly expansion of built-up areas. The residential floor area is directly related to the urban cluster area, so the future residential land increment should be rationally arranged according to the population growth and economic development, so as to avoid the excessive growth of residential construction land. On the premise of ensuring the healthy and orderly development of the real estate market, the government should carry out effective supervision over the newly released land and promote the use of small- and medium-sized housing types, strictly controlling the proportion of large housing types [34].
(2) The government should promote the transformation of industrial structure and increase the proportion of tertiary industry. The cluster of high industrial building area in Zhuhai is mainly Leizhu, Fushan and Nanshui Wharf industrial zones, which belong to the urban industrial new town with a high proportion of secondary industry and more chemical industries, which directly leads to high carbon emissions. Enterprises need to increase emissions of carbon dioxide and other greenhouse gases from reprocessing. The government should strictly control the proportion of heavy industry and increase the proportion of supporting and tertiary industries.
(3) The government should promote the development of compact cities, enhance the dominance of main urban areas within clusters and strengthen the spatial linkages between patches. It is important for Zhuhai to implement the compact spatial pattern, limit the urban leapfrog development and encourage the slow increase in the main urban area. For Zhuhai, compact development can not only improve land use efficiency, shorten the distance between cities and reduce traffic carbon emissions but also enhance carbon sequestration efficiency of ecological land such as forest land and water area, so as to effectively reduce urban carbon emission intensity. As can be seen from the spatial distribution of negative independent variable indicators in Figure 7, the compact degree of clusters in Sanxi, Cuixiang, Qianshan and Nanwan in the main urban area of Xiangzhou and Nanshui Wharf Industrial Zone in Jinwan District is low, and compact development is particularly important. However, most of the clusters in the western part of Zhuhai and Qi ‘ao and Chimelong in Xiangzhou District have low dominance, so it is important to focus on enhancing the dominance of the core area.

5. Conclusions

This research takes 50 clusters within Zhuhai as the research object, calculates the landscape spatial form index and social spatial form index of each cluster and establishes the index set of urban spatial form through screening, so as to analyze the influence of different urban spatial form index on carbon emissions. The main research conclusions include the following.
(1) Through the calculation and screening of various urban form indices, the index set of urban spatial form is finally established. Landscape spatial form leaves four indicators: Class Area (CA), Largest Patch Index (LPI), Patch Density (PD) and Mean Euclidean Nearest Neighbor Distance (ENN-MN), which represent four dimensions of urban spatial form: city size, dominance, compactness and dispersion. (2) From the spatial distribution of each index, the scale of urban clusters in Zhuhai is generally large. The urban clusters with high dominance are mainly located in the main urban area of Xiangzhou, while the compact areas are mainly distributed in the western part of Zhuhai. The urban dispersion and industrial building area are generally higher in the west and lower in the east, while the residential building area of each cluster is generally higher. The distribution is basically consistent with densely populated areas. (3) According to the results of correlation analysis, the size of urban cluster, industrial building area and residential building area have a strong promoting effect on carbon emission, while the compactness, dispersion and dominance of urban cluster have a strong inhibiting effect on carbon emission. These results indicate that avoiding rapid urban sprawl, increasing internal compactness and strengthening spatial connections among cities are key measures to reduce carbon emission in Zhuhai. (4) Based on the above conclusions, the low-carbon urban spatial form optimization strategy should be proposed from three aspects: urban development boundary control, promotion of the transformation of industrial structure, increasing the proportion of the three industries, urban compact development, enhancing the dominance of the main urban area within the cluster, and strengthening the spatial connection between patches.
Due to the availability of current data, there are limitations in the construction of urban spatial form indicators in this paper. For example, dimension indicators such as the volume of various buildings and gross floor area ratio have not been included in the research category, which can be refined in future work. In future studies, the urban spatial form of various clusters in Zhuhai can be classified according to landscape spatial index and social spatial index, and the impact of urban spatial form on carbon emission can be analyzed category by category.

Author Contributions

Conceptualization, Y.Z., S.Z. and Y.G.; methodology, Y.Z., S.Z. and Y.G.; software, S.Z. and Y.G.; validation, Y.Z. and S.Z.; resources, Y.Z. and Y.G.; data curation, Y.Z., S.Z. and Y.G.; writing—original draft preparation, Y.Z., S.Z. and Y.G.; writing—review and editing, Y.Z.; visualization, S.Z. and Y.G.; supervision, Y.Z.; project administration, Y.Z. All authors have read and agreed to the published version of the manuscript.

Funding

This research received no external funding.

Institutional Review Board Statement

Not applicable.

Informed Consent Statement

Not applicable.

Data Availability Statement

The basic data and sources used in this study can be seen in Table 1. The data of administrative boundary came from the overall territorial space plan of Zhuhai City (2021–2035) (accessed on 3 January 2023). Road data were derived from the third National Land Survey land use type desensitization data and open block map (OSM) (http://openstreetmap.org/ (accessed on 3 January 2023)). Building data are derived from the basic mapping and geographic information desensitization data of the central city of Zhuhai (accessed on 3 January 2023). Land use data are derived from the 2020 Global 30-m land cover Fine classification product of the Chinese Academy of Astronautics and Astronomy (https://data.casearth.cn/sdo/detail/5fbc7904819aec1ea2dd7061/ (accessed on 3 January 2023)). Population density data come from Worldpop population density data set (https://www.worldpop.org/project/categories?id=18/ (accessed on 3 January 2023)). The social and economic data mainly come from 2021 Zhuhai Statistical Yearbook, from the official website of Zhuhai Statistics Bureau (http://tjj.zhuhai.gov.cn/tjsj/tjnj/content/post_3020527.html/ (accessed on 3 January 2023)). The carbon emission inventory come from China’s county-level carbon dioxide emission inventory (https://www.ceads.net/user/index.php?id=1057&lang=en/ (accessed on 3 January 2023)).

Acknowledgments

We sincerely thank the reviewers for their helpful comments and suggestions about our manuscript.

Conflicts of Interest

The authors declare no conflict of interest.

Appendix A

Table A1. The result of landscape spatial index measurement.
Cluster NumberCANPPDLPIEDLSIPARA_MNPROX_MNENN_MNCLUMPYPLADJCOHESIONAI
BB-01782.03687.008.021.4139.4830.20998.1515.92124.020.6264.6291.2665.38
BB-02802.06580.005.371.3225.9625.76984.1911.99121.140.6970.2390.6771.05
BB-03644.69664.008.511.0638.3729.80991.149.07112.010.5961.5886.8462.39
DM-01428.73124.006.6615.1467.7815.561028.01114.76111.870.7075.4597.3076.66
FS-01750.81248.008.8814.8471.8918.62930.93127.45102.950.7177.8196.9178.74
FS-02718.00150.005.0811.6958.0016.47944.03114.51103.610.7579.8497.3980.83
FS-03301.94233.0010.312.4960.1320.41964.5821.9789.040.5761.4790.4962.65
GL-01609.00195.002.666.0124.3118.94994.61118.27148.220.7474.8297.9275.82
GL-02427.35120.003.322.2638.5717.28932.0847.4088.370.7072.6494.5773.81
GL-0366.7085.007.872.1833.0211.101064.609.31103.510.5454.7986.1157.12
GL-04317.8244.006.8041.62137.1112.70963.92296.2870.360.5776.5898.5978.02
GL-05429.26104.005.036.8246.2112.17948.2059.81134.590.7780.8196.2282.11
GL-06287.2482.004.145.0138.5811.92914.9733.02117.080.7577.0095.4578.52
GL-07195.29228.0010.731.5249.1919.21984.928.3795.980.5254.9484.3256.26
HQ-011210.87505.0011.2210.23113.3036.941000.48186.9677.110.5365.2296.9365.84
HQ-02312.28208.005.542.7131.0116.87983.4425.96118.700.6768.6392.6069.93
HZ-011012.27178.007.5334.86109.5521.04990.68703.4589.130.6478.4199.0579.23
HZ-02, HZ-03, HZ-04, HZ-05, HZ-06, HZ-07275.31362.007.811.7532.4423.101049.4610.43120.620.5354.4188.2555.51
HZ-08, JW-09, XZ-09530.91859.0011.080.6433.3834.241014.733.70116.740.4851.2179.4051.95
JW-01701.70127.005.5627.0065.3714.341064.20356.07122.160.7682.2698.8483.29
JW-02389.95227.009.322.7752.8917.46949.2213.07107.930.6771.1391.7872.33
JW-03471.67183.0014.0223.03149.6823.221005.62161.7275.260.4764.8597.5665.85
JW-04215.86108.007.274.9558.7315.24973.4633.90105.330.6265.7792.6667.28
JW-0569.4793.0012.961.3253.9013.50973.905.6486.750.4346.1778.0948.08
JW-06143.09118.0010.057.7447.3012.511016.1419.53104.930.6365.5293.2467.38
JW-071671.99316.004.7415.3460.2225.13966.56435.7898.050.7479.9098.5880.55
JW-08286.6090.009.9123.23101.7514.58943.6785.4086.740.6171.8297.3973.24
SB-01736.85196.007.4912.7389.5022.201030.96106.43103.040.6473.1997.5574.09
SB-0273.4168.008.253.7641.9710.451065.6111.48122.870.5859.8088.5962.19
SB-031382.93129.004.7024.9470.3413.611003.94357.30103.540.7788.0498.9988.82
SB-04288.63195.0013.2010.7181.9618.58970.1734.6491.220.5763.9994.2165.26
SB-05576.51169.008.4019.1079.2616.97974.80174.6394.040.6976.8097.6577.86
SB-0653.0688.004.270.8811.799.78984.592.77160.580.5755.8277.5758.46
SB-07998.21566.007.063.8038.7925.26986.3749.71120.710.7173.8594.8074.62
SB-08373.43528.008.280.4030.0025.71981.713.70116.900.5556.3578.5657.32
SB-091039.65286.006.3714.7454.4519.52956.13237.06102.510.7580.2097.9681.02
SB-10571.18111.009.2238.93109.9114.301022.40250.0178.320.6580.4098.5881.51
TJ-01, TJ-0287.4772.003.922.3618.449.34931.678.27136.560.6866.9987.7469.44
TJ-03269.8750.004.9214.4380.7213.081023.41214.3270.840.6773.9297.6175.43
TJ-041112.31340.006.836.2858.9222.49940.3996.2997.160.7377.9296.0278.69
TJ-051007.58223.004.376.3657.1123.48921.96181.6696.690.7175.8097.1476.59
XZ-011086.32114.003.4731.1852.1314.25989.44556.92106.830.8085.8999.2986.75
XZ-02196.7952.004.186.5443.1010.44938.7834.57137.840.7375.6994.1577.49
XZ-03547.1040.003.1240.9688.3712.41957.01481.96112.880.7282.6099.3083.77
XZ-04493.8322.001.9440.2656.408.17960.62162.16166.490.8187.9399.2289.25
XZ-05200.835.001.7167.9569.994.54795.2197.33145.200.7389.5299.4691.64
XZ-06610.8130.003.3666.3688.379.05987.56663.8485.570.6688.0199.5889.19
XZ-071040.8234.002.3971.9065.328.24886.05921.6381.990.7291.6599.7392.59
XZ-08626.6913.001.2660.5964.297.38997.04450.8494.150.7890.3399.6691.53
XZ-101479.25151.002.7924.4053.1519.22974.241053.45108.210.7983.6699.2684.38

References

  1. Zhou, S.; Tong, Q.; Pan, X.; Cao, M.; Wang, H.; Gao, J.; Ou, X. Research on low-carbon energy transformation of China necessary to achieve the Paris agreement goals: A global perspective. Energy Econ. 2021, 95, 105137. [Google Scholar] [CrossRef]
  2. Liang, X.; Jin, X.; He, J.; Wang, X.; Xu, C.; Qiao, G.; Zhang, X.; Zhou, Y. Impacts of land management practice strategy on regional ecosystems: Enlightenment from ecological redline adjustment in Jiangsu, China. Land Use Policy 2022, 119, 106137. [Google Scholar] [CrossRef]
  3. Notice of the People’s Government of Guangdong Province on the Issuance of the 14th Five-Year Plan for National Economic and Social Development of Guangdong Province and the Outline of Long-Range Goals for 2035; Guangdong Provincial Government [2021] No. 28; Bulletin of Guangdong Provincial People’s Government: Guangzhou, China, 2021; Volume 2.
  4. Christen, A.; Coops, N.; Crawford, B.; Kellett, R.; Liss, K.; Olchovski, I.; Tooke, T.; Laan, M.; Voogt, J. Validation of Modeled Carbon-Dioxide Emissions from an Urban Neighborhood with Direct Eddy-Covariance Measurements. Atmos. Environ. 2011, 45, 6057–6069. [Google Scholar] [CrossRef]
  5. Zhang, J.; Jia, R.; Yang, H.; Dong, K. Does electric vehicle promotion in the public sector contribute to urban transport carbon emissions reduction? Transp. Policy 2022, 125, 151–163. [Google Scholar] [CrossRef]
  6. Hankey, S.; Marshall, J. Impacts of Urban Form on Future US PassengerVehicle Greenhouse Gas Emissions. Energy Policy 2010, 38, 4880–4887. [Google Scholar] [CrossRef]
  7. Ye, H.; He, X.; Song, Y.; Li, X.; Zhang, G.; Lin, T.; Xiao, L. A Sustainable Urban Form: The Challenges of Compactness from the Viewpoint of Energy Consumption and Carbon Emission. Energy Build. 2015, 93, 90–98. [Google Scholar] [CrossRef]
  8. Ewing, R.; Rong, F. The Impact of Urban Form on, U.S. Residential Energy Use. Hous. Policy Debate 2008, 19, 1–30. [Google Scholar] [CrossRef]
  9. Ishii, S.; Tabushi, S.; Aramaki, T.; Hanaki, K. Impact of Future Urban Form on the Potential to Reduce Greenhouse Gas Emissions from Residential, Commercial and Public Buildings in Utsunomiya, Japan. Energy Policy 2010, 38, 4888–4896. [Google Scholar] [CrossRef]
  10. Ratti, C.; Baker, N.; Steemers, K. Energy Consumption and Urban Texture. Energy Build. 2005, 37, 762–776. [Google Scholar] [CrossRef]
  11. Chai, Y.; Xiao, Z.; Liu, Z. Comparative analysis on CO2 emission per household in daily travel based on spatial behavior constraints. Sci. Geogr. Sin. 2011, 31, 843–849. [Google Scholar]
  12. Ma, J.; Liu, Z.; Chai, Y. The Impact of Urban Form on CO2 Emission from Work and Non-Work Trips: The Case of Beijing, China. Habitat Int. 2015, 47, 1–10. [Google Scholar] [CrossRef]
  13. Falahatkar, S.; Rezaei, F. Towards Low Carbon Cities: Spatio-Temporal Dynamics of Urban Form and Carbon Dioxide Emissions. Remote Sens. Appl. Soc. Environ. 2020, 18, 100317. [Google Scholar] [CrossRef]
  14. Makido, Y.; Dhakal, S.; Yamagata, Y. Relationship between Urban Form and CO2 Emissions: Evidence from Fifty Japanese Cities. Urban Clim. 2012, 2, 55–67. [Google Scholar] [CrossRef] [Green Version]
  15. Hong, S.; Hui, E.C.; Lin, Y. Relationship between urban spatial structure and carbon emissions: A literature review. Ecol. Indic. 2022, 144, 109456. [Google Scholar] [CrossRef]
  16. Palme, M.; Inostroza, L.; Villacreses, G.; Lobato-Cordero, A.; Carrasco, C. From Urban Climate to Energy Consumption. Enhancing Building Performance Simulation by Including the Urban Heat Island Effect. Energy Build. 2017, 145, 107–120. [Google Scholar] [CrossRef]
  17. Wei, G.; Bi, M.; Liu, X.; Zhang, Z.; He, B. Investigating the impact of multi-dimensional urbanization and FDI on carbon emissions in the belt and road initiative region: Direct and spillover effects. J. Clean. Prod. 2023, 384, 135608. [Google Scholar] [CrossRef]
  18. Zhou, Y.; Yu, Y.; Wang, Y.; He, B.; Yang, L. Mode substitution and carbon emission impacts of electric bike sharing systems. Sustain. Cities Soc. 2023, 89, 104312. [Google Scholar] [CrossRef]
  19. Niu, Y.; Zhao, X.; Hu, Y. Spatial variation of carbon emissions from county land use in Chang-Zhu-Tan area based on NPP-VIIRS night light. Acta. Sci. Circumst. 2021, 41, 3847–3856. [Google Scholar]
  20. Zhu, E.; Deng, J.; Zhou, M.; Gan, M.; Jiang, R.; Wang, K.; Shahtahmassebi, A. Carbon emissions induced by land-use and land-cover change from 1970 to 2010 in Zhejiang, China. Sci. Total Environ. 2019, 646, 930–939. [Google Scholar] [CrossRef]
  21. Yang, Y.; Li, H. Spatiotemporal dynamic decoupling states of eco-environmental quality and land-use carbon emissions: A case study of Qingdao City, China. Ecol. Inform. 2023, 75, 101992. [Google Scholar] [CrossRef]
  22. Zhang, X.; Liu, L.; Chen, X.; Gao, Y.; Xie, S.; Mi, J. GLC_FCS30, global land-cover product with fine classification system at 30 m using time-series Landsat imagery. Earth Syst. Sci. Data 2021, 13, 2753–2776. [Google Scholar] [CrossRef]
  23. Fang, J.; Guo, Z.; Piao, S.; Chen, A. Terrestrial vegetation carbon sinks in China, 1981–2000. Sci. China Ser. D Earth Sci. 2007, 50, 1341–1350. [Google Scholar] [CrossRef]
  24. Zhao, R.; Huang, X.; Zhong, T. Research on carbon emission intensity and carbon footprint of different industrial spaces in China. Acta Geogr. Sin. 2010, 65, 1048–1057. [Google Scholar]
  25. Jiang, J. An evaluation and decomposition analysis of carbon emissions in China. Resour. Sci. 2011, 33, 597–604. [Google Scholar]
  26. Alphan, H. Analysis of Landscape Changes as an Indicator for Environmental Monitoring. Environ. Monit. Assess. 2017, 189, 24. [Google Scholar] [CrossRef]
  27. Roozbeh, M.; Babaie-Kafaki, S.; Sadigh, A. A Heuristic Approach to Combat Multicollinearity in Least Trimmed Squares Regression Analysis. Appl. Math. Model. 2018, 57, 105–120. [Google Scholar] [CrossRef]
  28. Jasiński, T. Modeling electricity consumption using nighttime light images and artificial neural networks. Energy 2019, 179, 831–842. [Google Scholar] [CrossRef]
  29. Jia, Y.; Tang, L.; Xu, M.; Yang, X. Landscape Pattern Indices for Evaluating Urban Spatial Morphology–A Case Study of Chinese Cities. Ecol. Indic. 2019, 99, 27–37. [Google Scholar] [CrossRef]
  30. Bibri, S.; Krogstie, J.; Kärrholm, M. Compact city planning and development: Emerging practices and strategies for achieving the goals of sustainability. Dev. Built Environ. 2020, 4, 100021. [Google Scholar] [CrossRef]
  31. Chen, J.; Gao, M.; Cheng, S.; Hou, W.; Song, M.; Liu, X.; Liu, Y.; Shan, Y. County-level CO2 emissions and sequestration in China 1997–2017. Sci. Data. 2020, 7, 391. Available online: https://www.nature.com/articles/s41597-020-00736-3 (accessed on 3 January 2023). [CrossRef]
  32. Lin, J.; Qiao, Z.; Ye, Z. Delimitation’ and ‘Implementation’ of urban growth boundary: Analysis and thoughts on the practice in 14 pilot cities in China. Urban Plan. Forum. 2017, 2, 37–43. [Google Scholar]
  33. Wang, W.; Jiao, L.; Zhang, W.; Jia, Q.; Su, F.; Xu, G.; Ma, S. Delineating urban growth boundaries under multi-objective and constraints. Sustain. Cities Soc. 2020, 61, 102279. [Google Scholar] [CrossRef]
  34. Qin, B.; Qi, B. The impact of urban form on household building carbon emission: A case study of Beijing. Urban Plan. Int. 2013, 28, 42–46. [Google Scholar]
Figure 1. The Framework for Analyzing.
Land 12 00720 g001
Figure 2. (a) The location of Guangdong Province, (b) The location of Zhuhai in Guangdong Province. (c) Distribution of planning and governance units in Zhuhai.
Land 12 00720 g002
Figure 3. Spatial distribution of landscape spatial form index in Zhuhai: (a) CA, (b) LPI, (c) PD, and (d) ENN_MN.
Land 12 00720 g003
Figure 4. The spatial distribution of social spatial form index in Zhuhai: (a) density of population, (b) residential building area, (c) commercial building area, (d) industrial building area.
Land 12 00720 g004
Figure 5. Spatial distribution of carbon emission index in Zhuhai.
Land 12 00720 g005
Figure 6. Spatial distribution of positive independent variables in Zhuhai.
Land 12 00720 g006
Figure 7. Spatial distribution of negative independent variables in Zhuhai.
Land 12 00720 g007
Table 1. Basic data list.
Data NameFormat and ResolutionYearData Source
Urban cluster boundary datashp2020Master Plan of Zhuhai Territory Space (2021–2035), (accessed on 3 January 2023)
Land use data30 m tiff2020The Global 30-m land Cover Fine Classification product of CAS 2020
https://data.casearth.cn/sdo/detail/5fbc7904819aec1ea2dd7061, (accessed on 3 January 2023)
Road datashp2020Data of desensitization of land use types in the third National Land Survey, Open Street Map (OSM), http://openstreetmap.org, (accessed on 3 January 2023)
Population density data1 km tiff2020Worldpop population density data set, https://www.worldpop.org/project/categories?id=18, (accessed on 3 January 2023)
Building datashp2020Basic mapping and geographic information desensitization data of central city of Zhuhai, (accessed on 3 January 2023)
Socioeconomic datapdf2020Zhuhai Statistics Bureau, http://tjj.zhuhai.gov.cn/tjsj/tjnj/content/post_3020527.html, (accessed on 3 January 2023)
Carbon emission inventory dataxlsx2020China’s county-level carbon dioxide emission inventory, https://www.ceads.net/user/index.php?id=1057&lang=en, (accessed on 3 January 2023)
Table 2. Landscape spatial index system.
First-Order IndexSecondary IndexMeaning
AreaPatch Class Area (CA)The total area of a certain type of landscape patch can measure the growth of urban cluster.
Number of Patches (NP)The number of a certain kind of landscape patches can measure the degree of fragmentation of the city, and the larger the value, the more patches inside the city and the more dispersed the urban form.
Largest Patch Index (LPI)The area proportion of dominant patch types in the landscape can describe the extent to which an urban area is characterized by a single pattern of nuclear development.
EdgeEdge Density (ED)The length of landscape element boundary in a unit area of landscape can represent the spread and shape of different urban land edges and quantify the complexity of urban shape.
ShapeMean Perimeter-Area Ratio (PARA-MN)It represents the ratio of total urban patch perimeter to total area, which can describe the regularity of urban form. The smaller the value, the more regular the city shape.
Landscape Shape Index (LSI)Measuring the perimeter area ratio of urban patches can reflect the regularity of urban interior.
AggregationClumpiness Index (CLUMPY)Reflecting the degree of aggregation among urban patches, its value is 0 for random distribution of urban patches and 1 for maximum aggregation of urban patches.
Percentage of Like Adjacencies (PLADJ)Represents the degree of connectivity within urban built-up areas, and the index is minimum if urban patches are dispersed to the greatest extent, and maximum if urban patches are coherent to the greatest extent.
Patch Cohesion Index (COHESION)It is possible to measure the physical connectivity of urban land, which increases as urban patches become more clustered in distribution.
Aggregation Index (AI)The number of similar adjacencies of the same type of pixels based on the single counting method. The more adjacencies of the same type of patches, the higher the degree of aggregation. When there were no adjacent pixels between patches of the same type, the degree of polymerization was the lowest.
Mean Proximity Index (PROX-MN)Refers to the ratio of “mean observed distance” to “mean expected distance”. All other things being equal, an adjacent patch with a corresponding type of patch distributed over a larger, more adjacent patch will also have a larger index value. Thus, the proximity index measures both the degree of isolation of a patch and the degree of fragmentation of the corresponding type of patch in a given neighborhood.
Mean Euclidean Nearest Neighbor Distance (ENN-MN)The average distance between the two closest urban patches is quantified, which can be interpreted as the spatial linkage value between urban patches. The larger the value, the higher the degree of urban growth and expansion.
Patch Density
(PD)
Represents the patch area per unit area, and the larger the value, the greater the patch density per unit area in the city.
Table 3. Statistics of multicollinearity test results.
IndexCollinear Statistics
ToleranceVIF
CA0.1059.545
NP0.0425.229
PD0.1238.11
LPI0.04920.594
ED0.0519.826
LSI0.01759.777
PARA_MN0.5531.807
PROX_MN0.1675.996
ENN_MN0.3263.072
CLUMPY0.01375.383
PLADJ04752.656
COHESION0.06415.611
AI05237.145
Table 4. Spearman rank correlation coefficient matrix (significance: p < 0.01 ** and p < 0.05 *).
CANPPDLPIEDLSIPARA_MNPROX_MNENN_MNCLUMPYPLADJCOHESIONAI
CA1
NP0.411 **1
PD−0.2050.521 **1
LPI0.375 **−0.533 **−0.391 **1
ED0.285 *−0.2370.1590.761 **1
LSI0.460 **0.947 **0.507 **−0.425 **−0.071
PARA_MN−0.0280.1780.329 *−0.1070.0140.191
PROX_MN0.651 **−0.290 *−0.437 **0.893 **0.681 **−0.155−0.0551
ENN_MN−0.1740.034−0.346 *−0.335 *−0.681 **−0.118−0.012−0.400 **1
CLUMPY0.490 **−0.259−0.758 **0.498 **−0.001−0.310 *−0.353 *0.564 **0.311 *1
PLADJ0.552 **−0.428 **−0.684 **0.837 **0.429 **−0.399 **−0.317 *0.837 **−0.050.844 **1
COHESION0.545 **−0.423 **−0.542 **0.949 **0.644 **−0.303 *−0.1110.949 **−0.2640.631 **0.901 **1
AI0.530 **−0.447 **−0.687 **0.844 **0.428 **−0.419 **−0.319 *0.831 **−0.0390.842 **0.998 **0.901 **1
Table 5. Combination table of Gauss Pilman rank correlation coefficients.
Variable 1Variable 2Spearman Rank Correlation Coefficient between Variables
PLADJAI0.998 **
LPICOHESION0.949 **
PROX_MNCOHESION0.949 **
NPLSI0.947 **
PLADJCOHESION0.901 **
LPIPROX_MN0.893 **
CLUMPYPLADJ0.844 **
CLUMPYAI0.842 **
PROX_MNPLADJ0.837 **
PROX_MNAI0.831 **
LPIED0.761 **
PDCLUMPY−0.758 **
PDAI−0.687 **
PDPLADJ−0.684 **
EDPROX_MN−0.681 **
EDENN_MN−0.681 **
CAPROX_MN0.651 **
EDCOHESION0.644 **
CLUMPYCOHESION0.631 **
CAPLADJ0.552 **
CACOHESION0.545 **
NPLPI−0.533 **
NPPD0.521 **
PDLSI0.507 **
Significance: p < 0.01 **.
Table 6. Regression results of landscape spatial form and carbon emission in urban clusters.
ModelUnstandardized CoefficientStandardization CoefficienttSignificanceCollinear Statistics
BStandard ErrorBetaToleranceVIF
(Constant)0.4750.096 4.9350.000
CA0.5540.0770.6307.1840.0000.8291.206
LPI−0.3110.080−0.388−3.8680.0000.6321.582
PD−0.4330.099−0.498−4.3530.0000.4862.059
ENN_MN−0.3940.099−0.418−3.9750.0000.5771.733
Table 7. Regression results of social spatial form and carbon emission in urban clusters.
ModelUnstandardized CoefficientStandardization CoefficienttSignificanceCollinear Statistics
BStandard ErrorBetaToleranceVIF
(Constant)0.028 0.030 0.939 0.353
Density of Population −0.169 0.092 −0.182 −1.849 0.071 0.664 1.505
Residential Building Area0.343 0.087 0.405 3.925 0.000 0.608 1.646
Commercial Building Area0.175 0.094 0.209 1.858 0.070 0.509 1.964
Industrial Building Area0.885 0.097 0.751 9.084 0.000 0.945 1.059
Disclaimer/Publisher’s Note: The statements, opinions and data contained in all publications are solely those of the individual author(s) and contributor(s) and not of MDPI and/or the editor(s). MDPI and/or the editor(s) disclaim responsibility for any injury to people or property resulting from any ideas, methods, instructions or products referred to in the content.

