
The Threat of COVID-19 on Food Security: A Modelling Perspective of Scenarios in the Informal Settlements in Windhoek

Abstract
:1. Introduction
COVID-19 Containment Stringency and Food Insecurity
2. Methodology
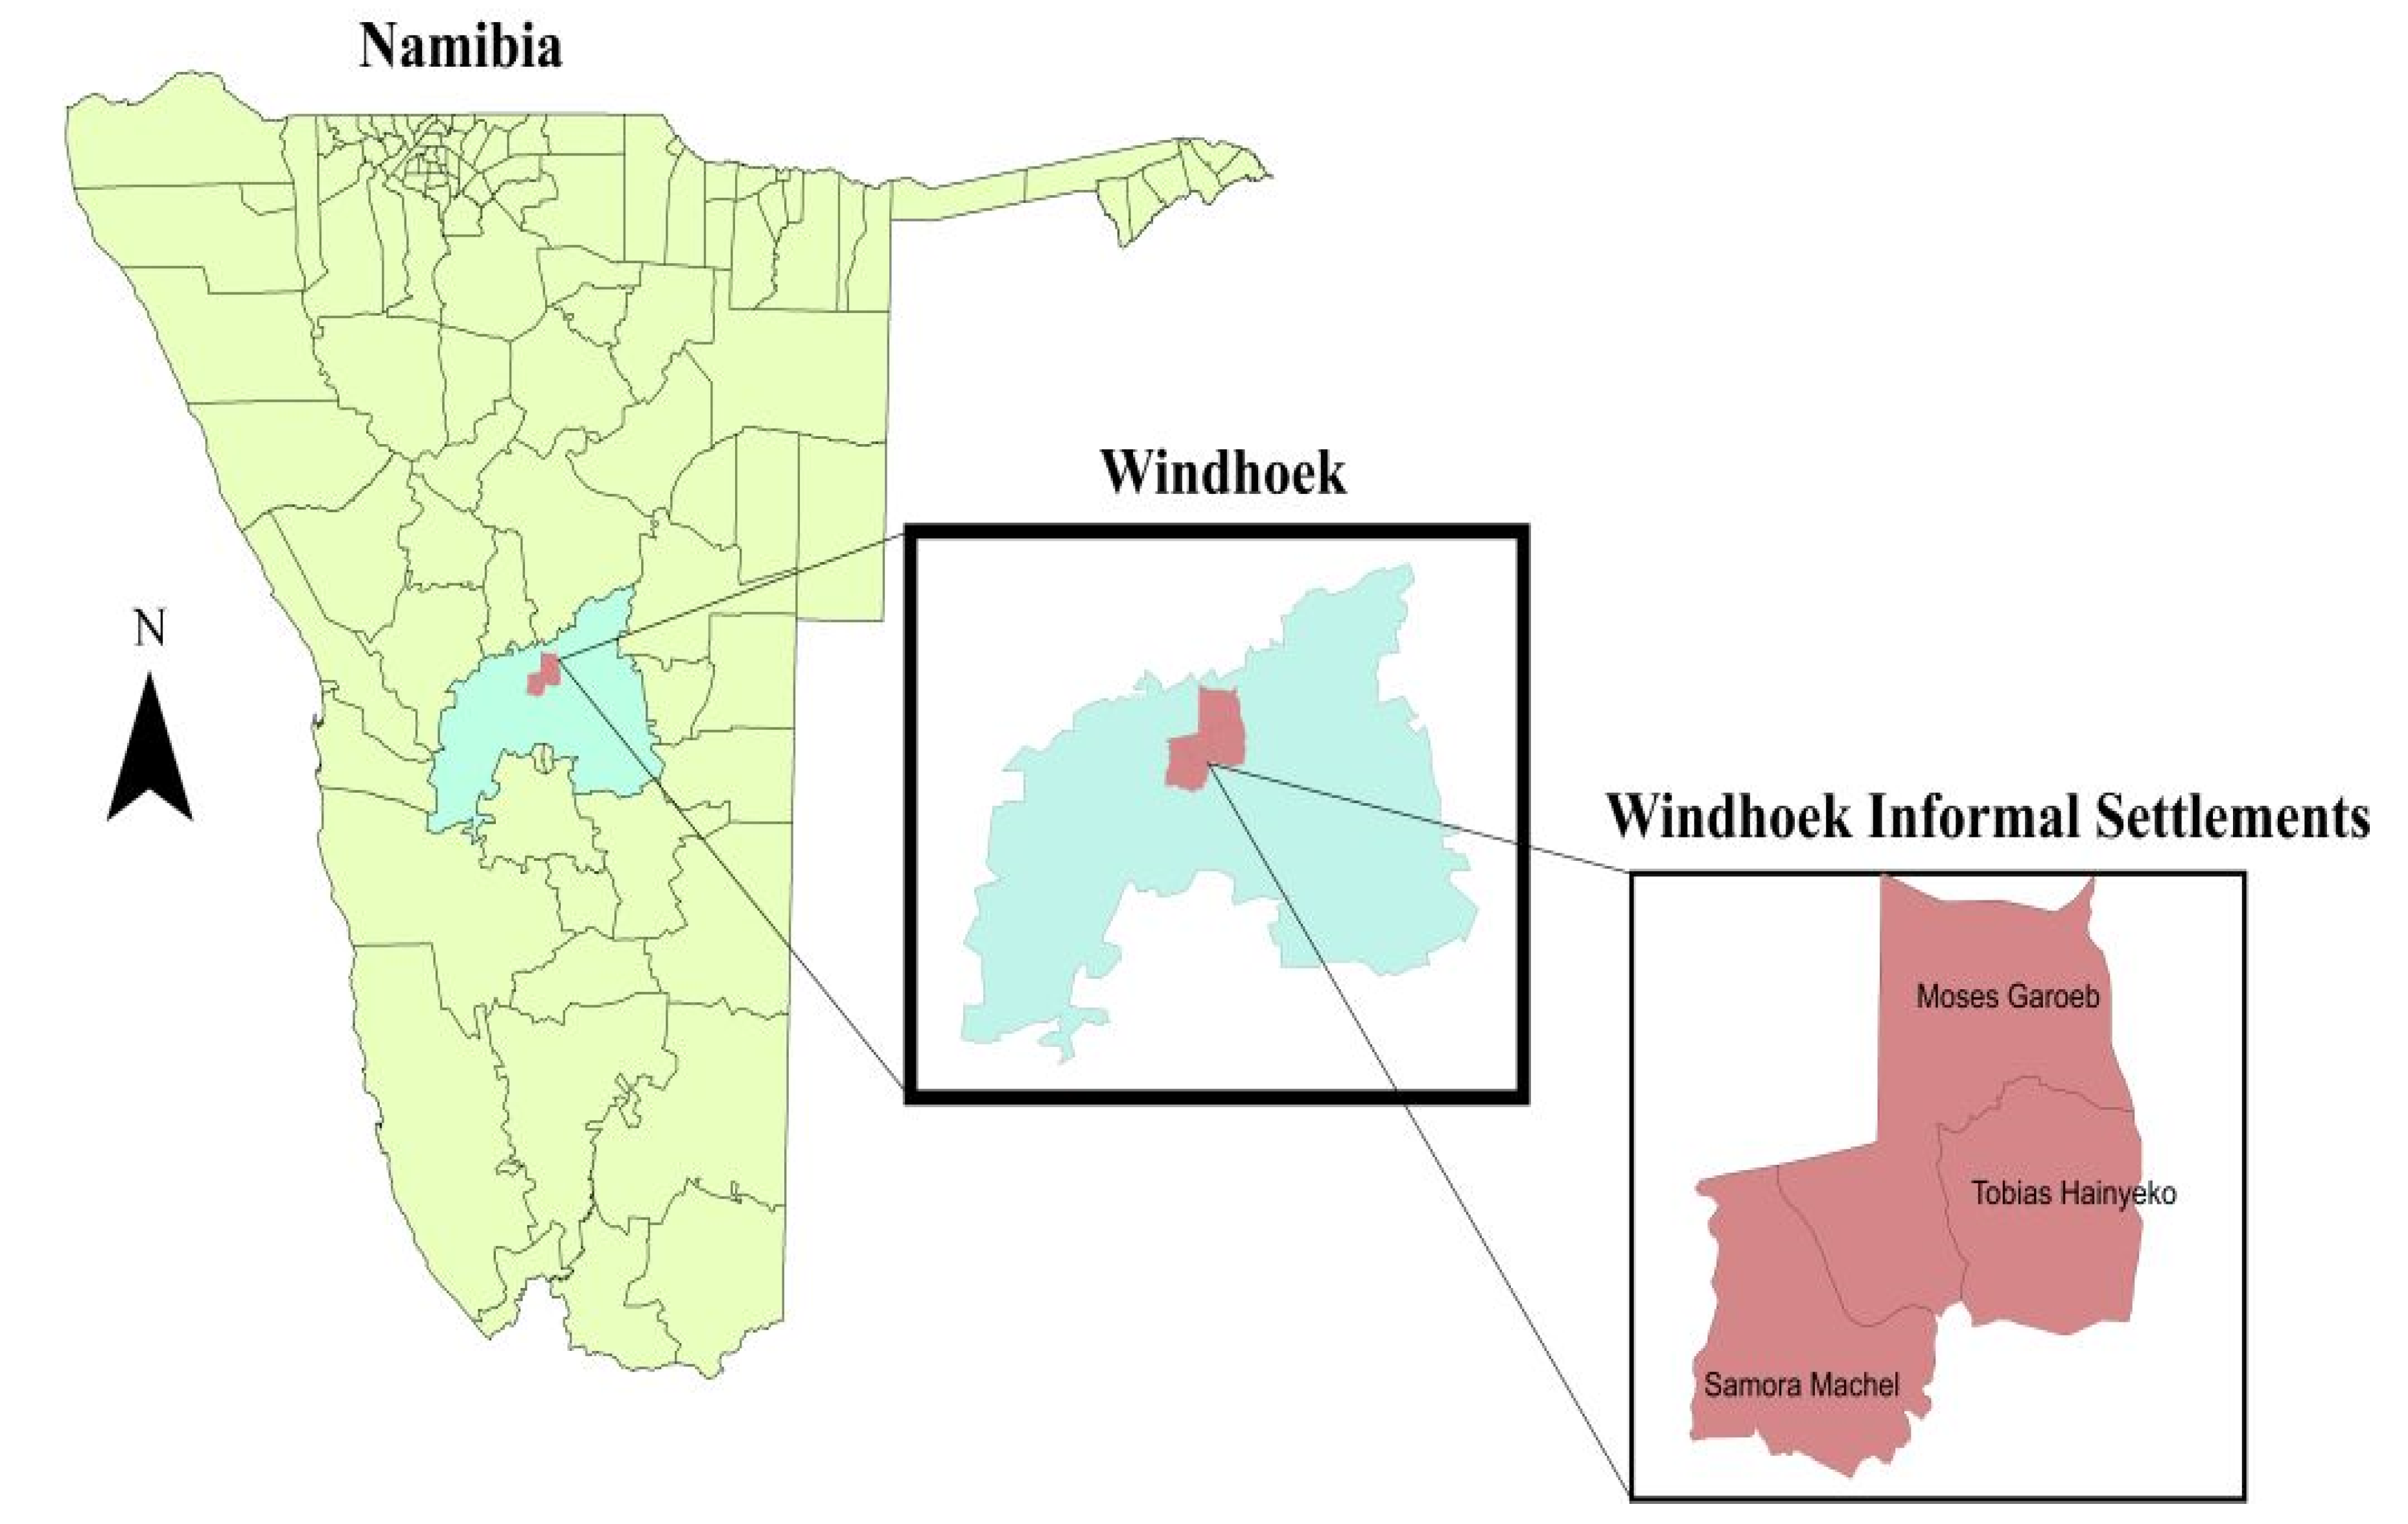
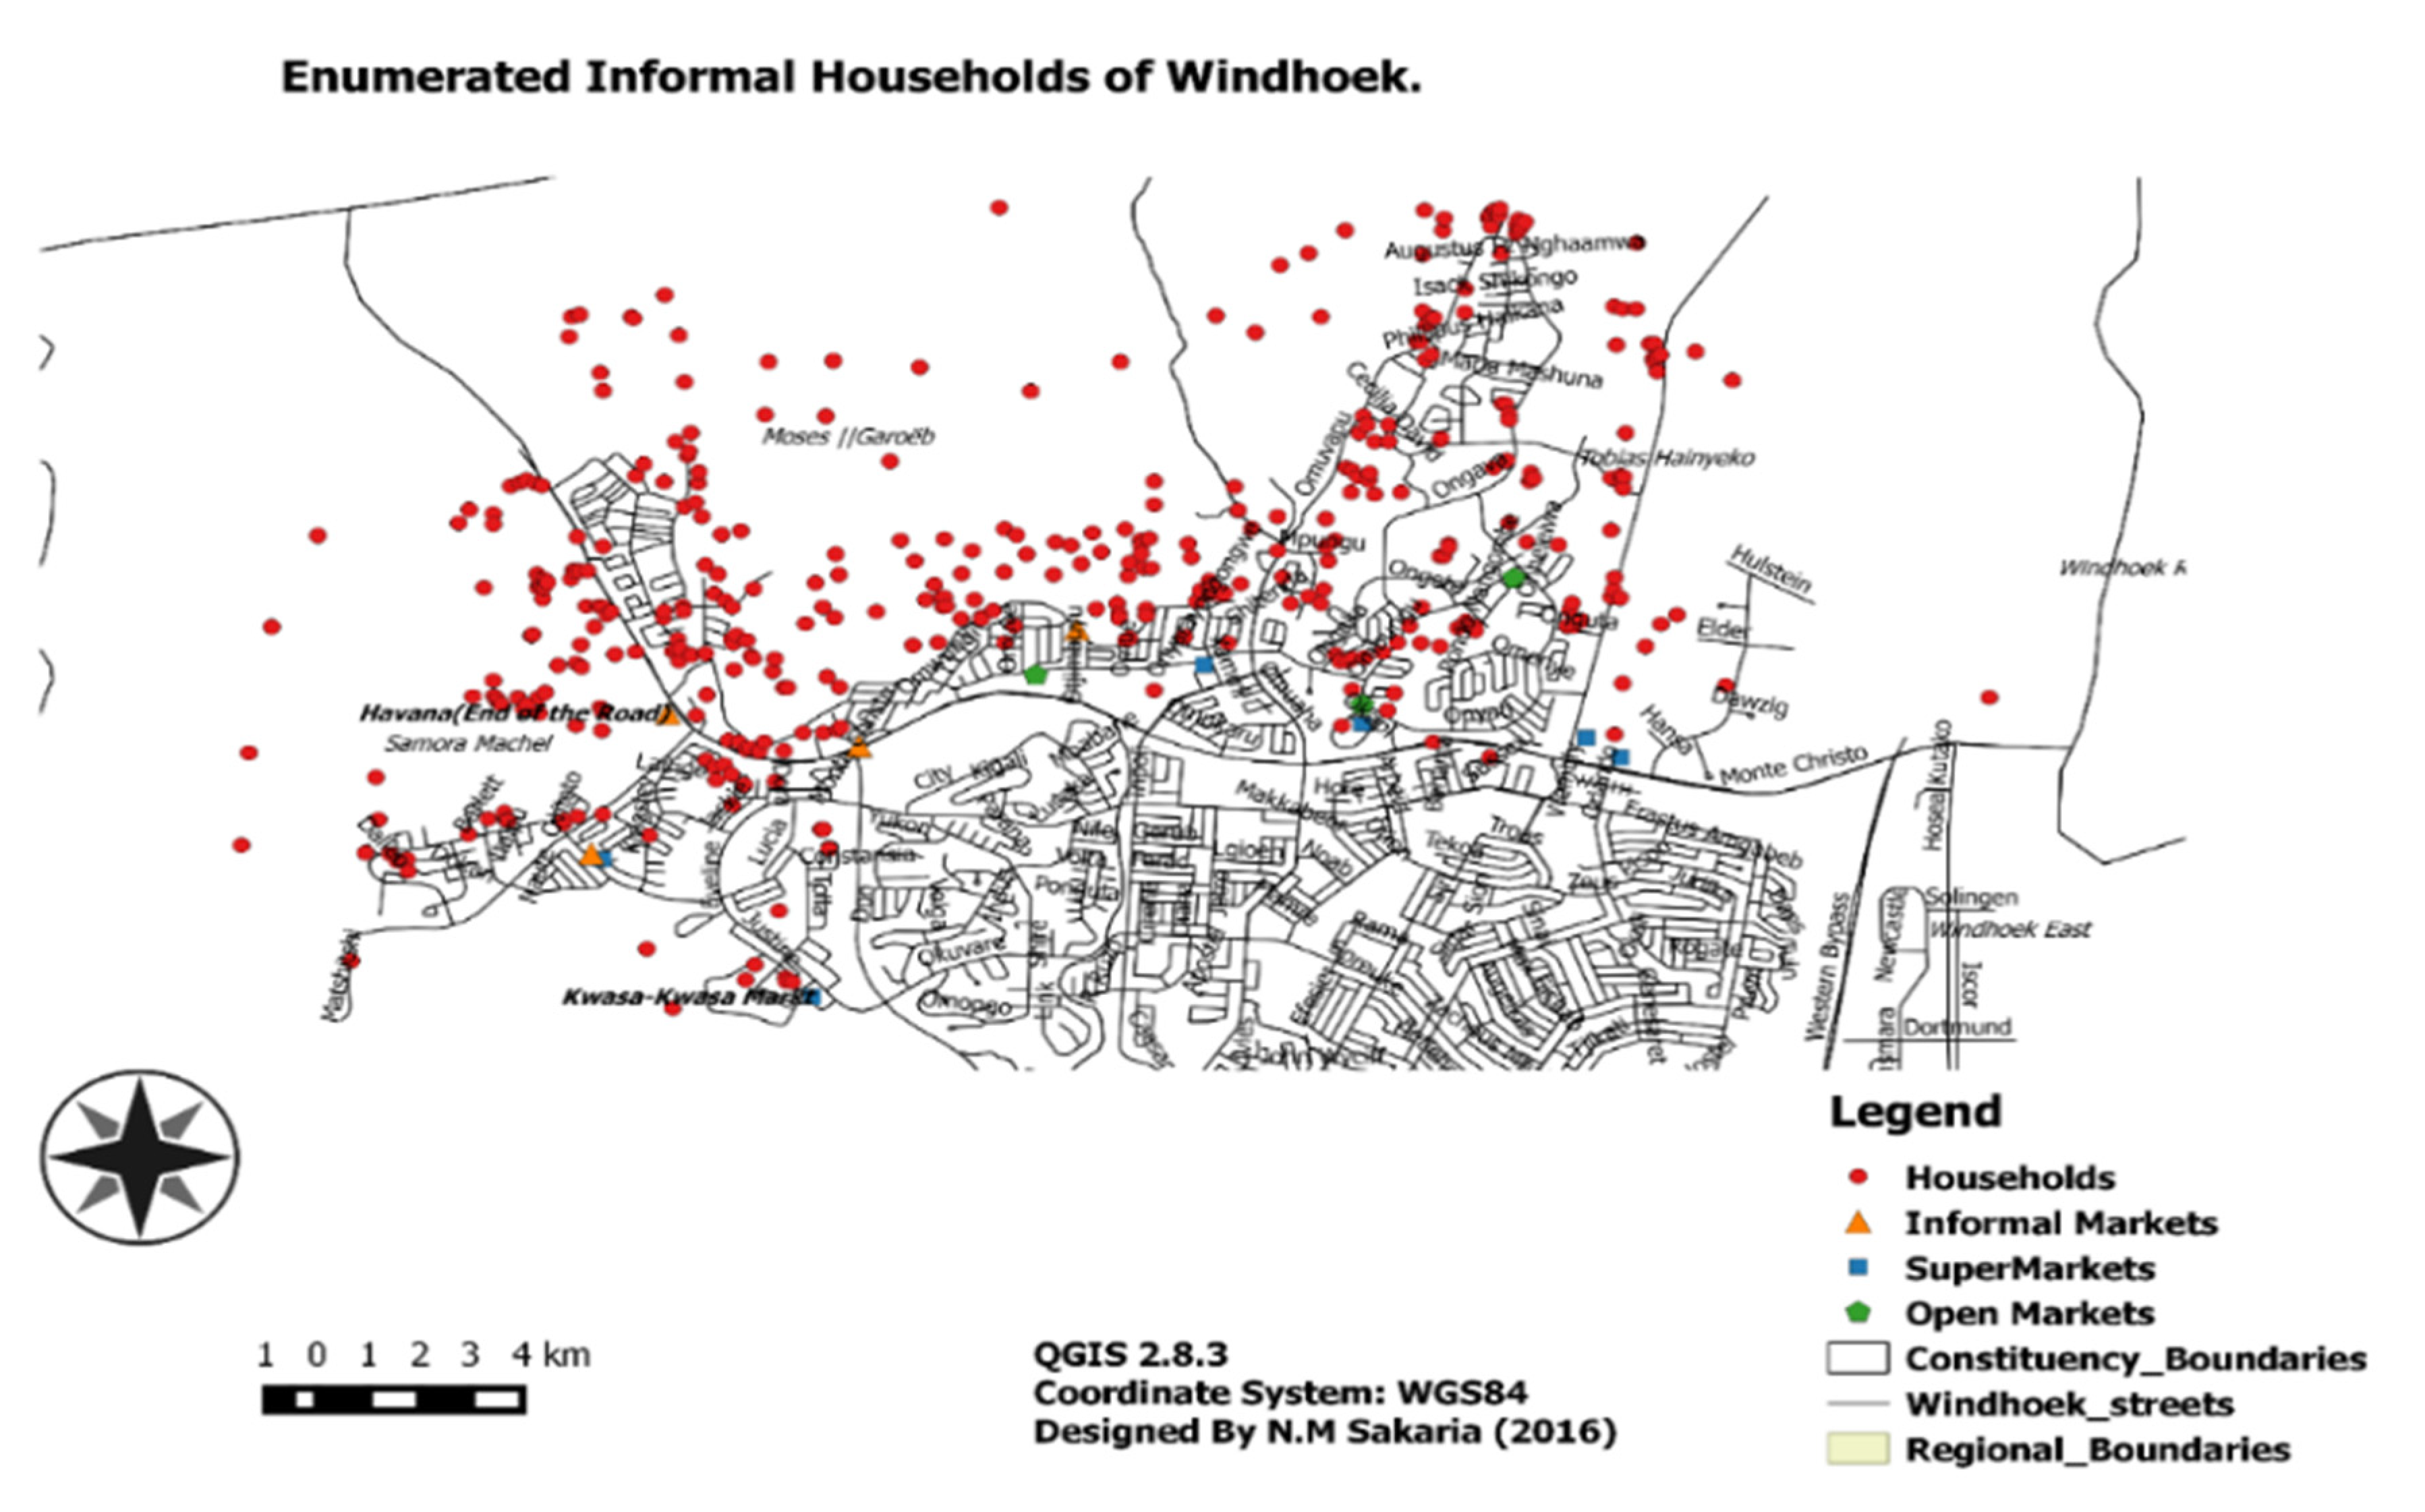
2.1. Settings
2.2. Data
2.3. Measures
2.3.1. Food Insecurity Outcomes
- a.
- In the past four weeks, did you worry that your household would not have enough food?
- b.
- In the past four weeks, were you or any household member not able to eat the kinds of foods you preferred because of a lack of resources (money)?
- c.
- In the past four weeks, did you or any household member have to eat a limited variety of foods due to a lack of resources (money)?
- d.
- In the past four weeks, did you or any household member have to eat some foods that you really did not want to eat because of a lack of resources (money) to obtain other types of food?
- e.
- In the past four weeks, did you or any household member have to eat a smaller meal than you felt you needed because there was not enough food?
- f.
- In the past four weeks, did you or any household member have to eat fewer meals in a day because there was not enough food?
- g.
- In the past four weeks, was there ever no food to eat of any kind in your household because of lack of resources (money) to get food?
- h.
- In the past four weeks, did you or any household member go to sleep at night hungry because there was not enough food?
- i.
- In the past four weeks, did you or any household member go a whole day and night without eating anything because there was not enough food?
- j.
- In the past week, did you or any household member eat a cooked meal less than once a day?
2.3.2. Predictor Variables
2.3.3. Statistical Analysis
2.4. Univariate Probit Model
2.5. Bivariate Probit with Partial Observability
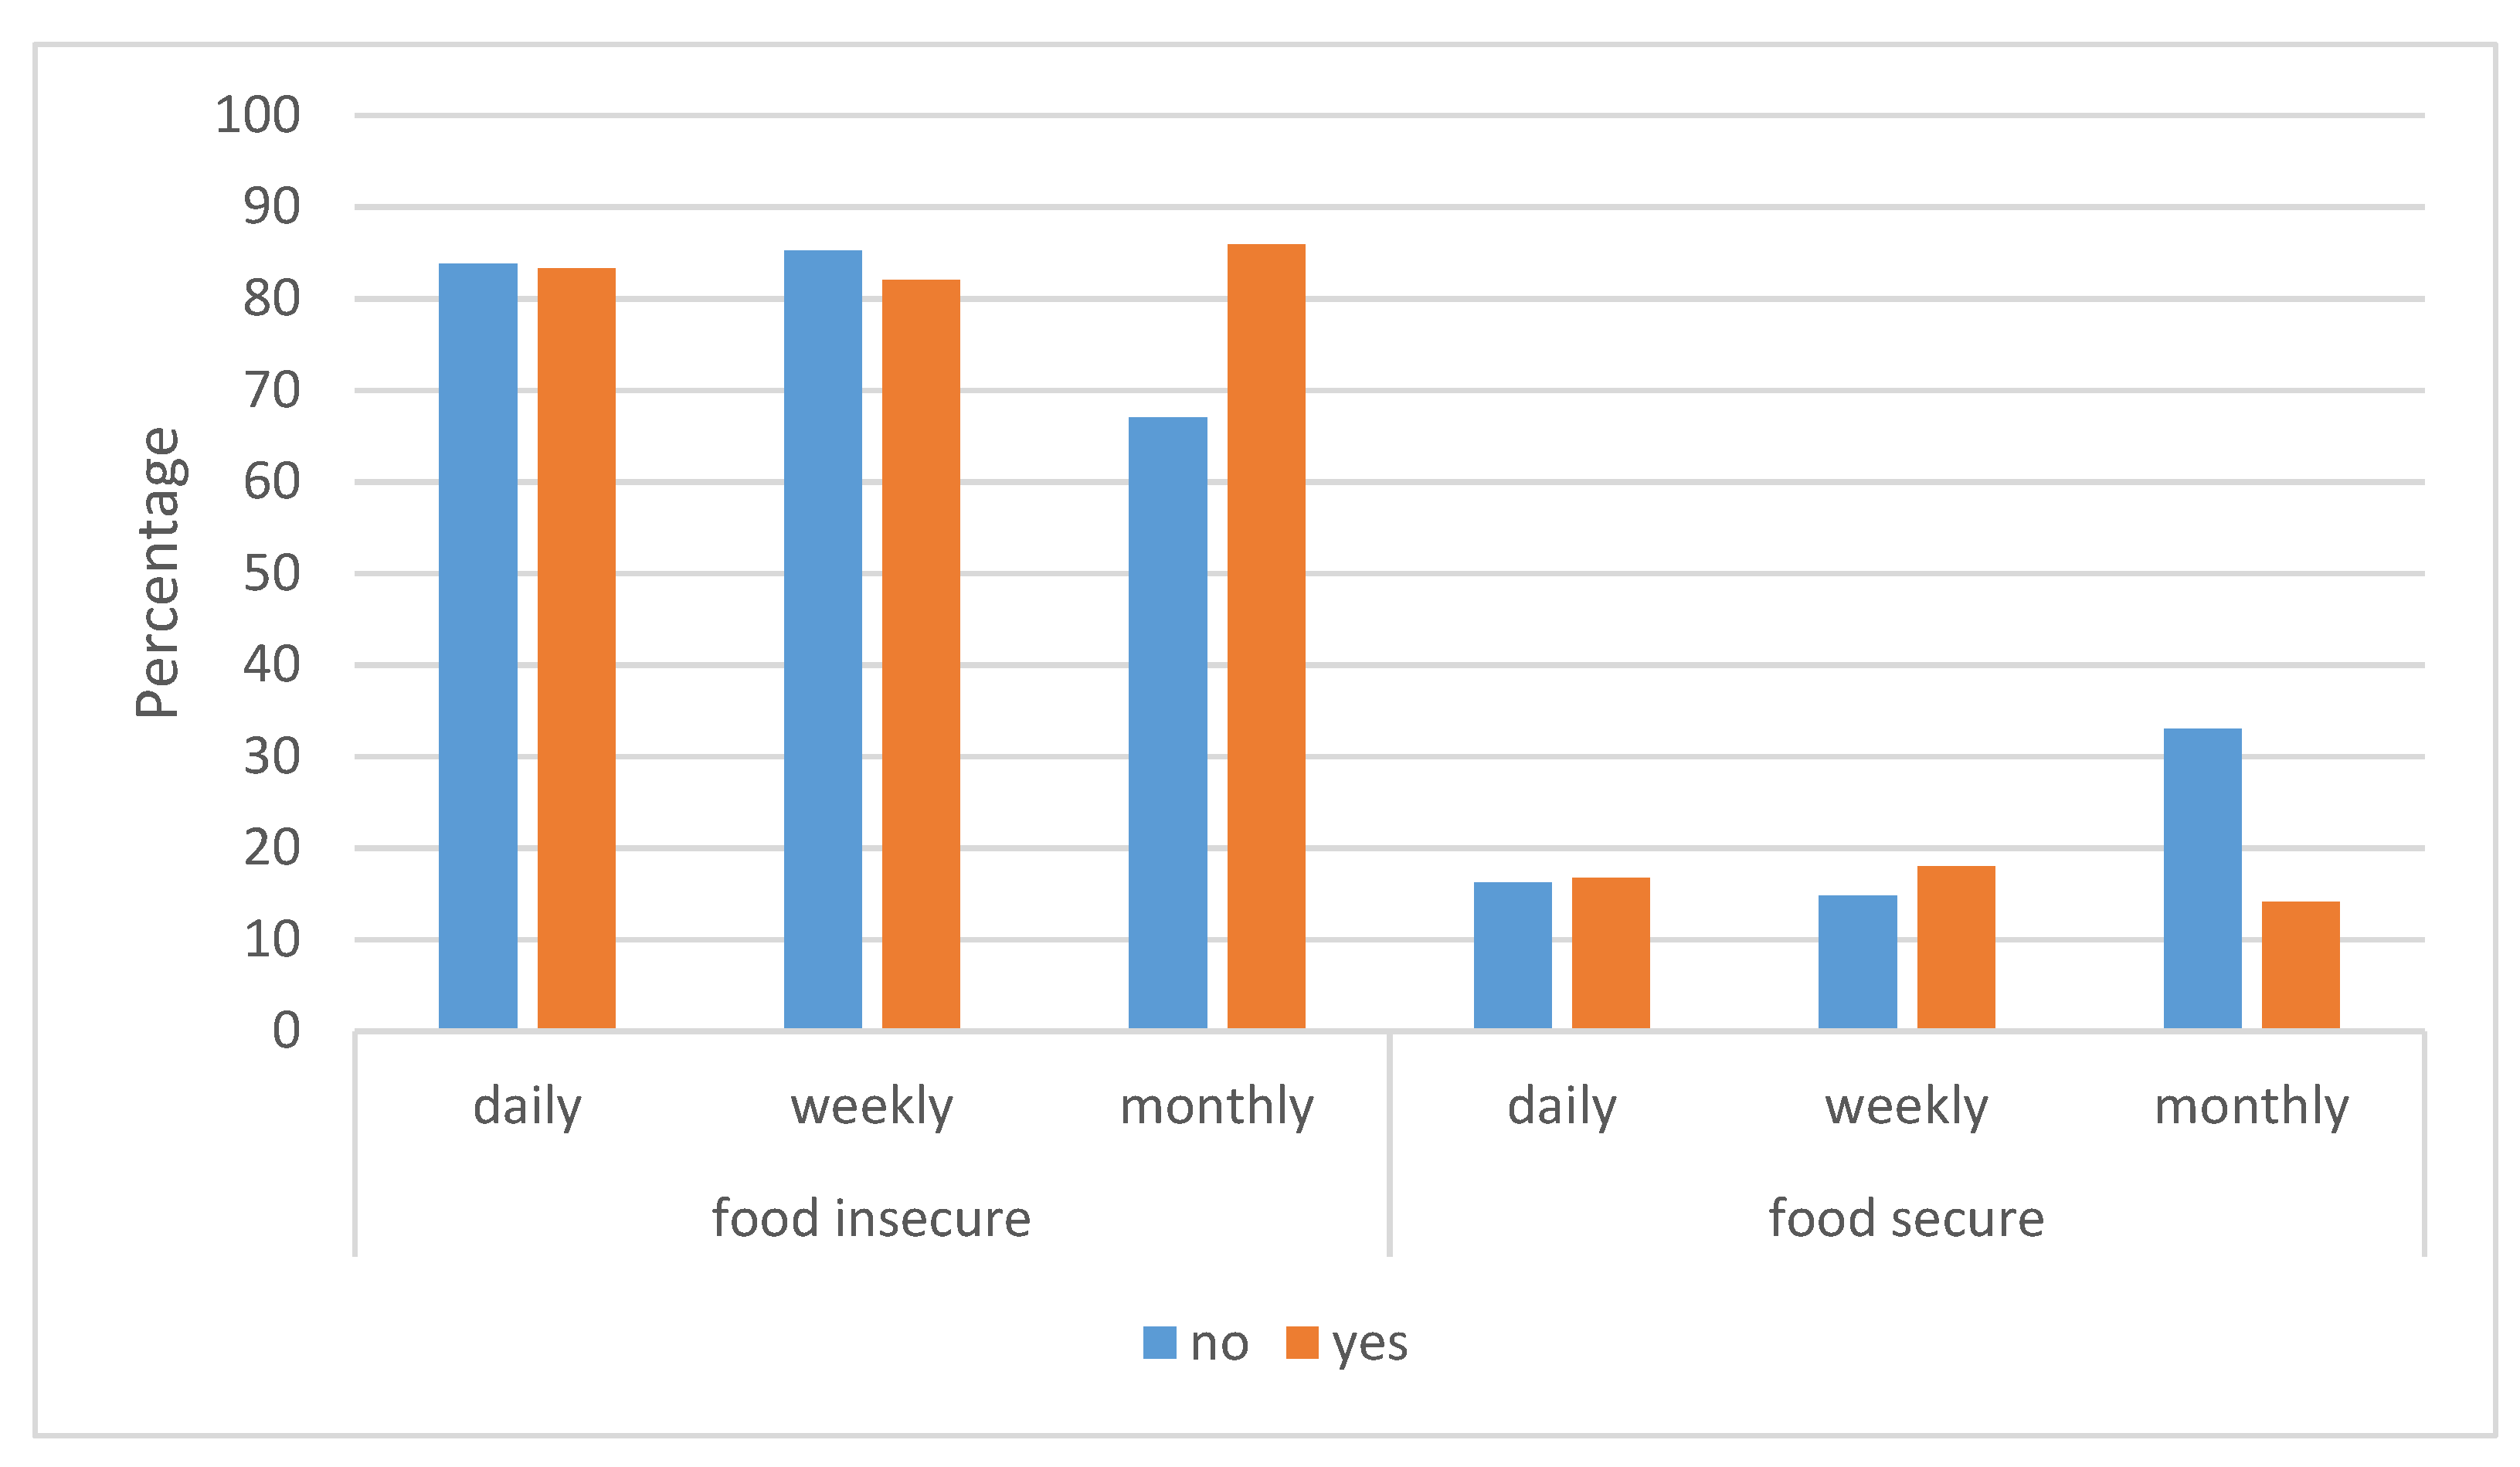
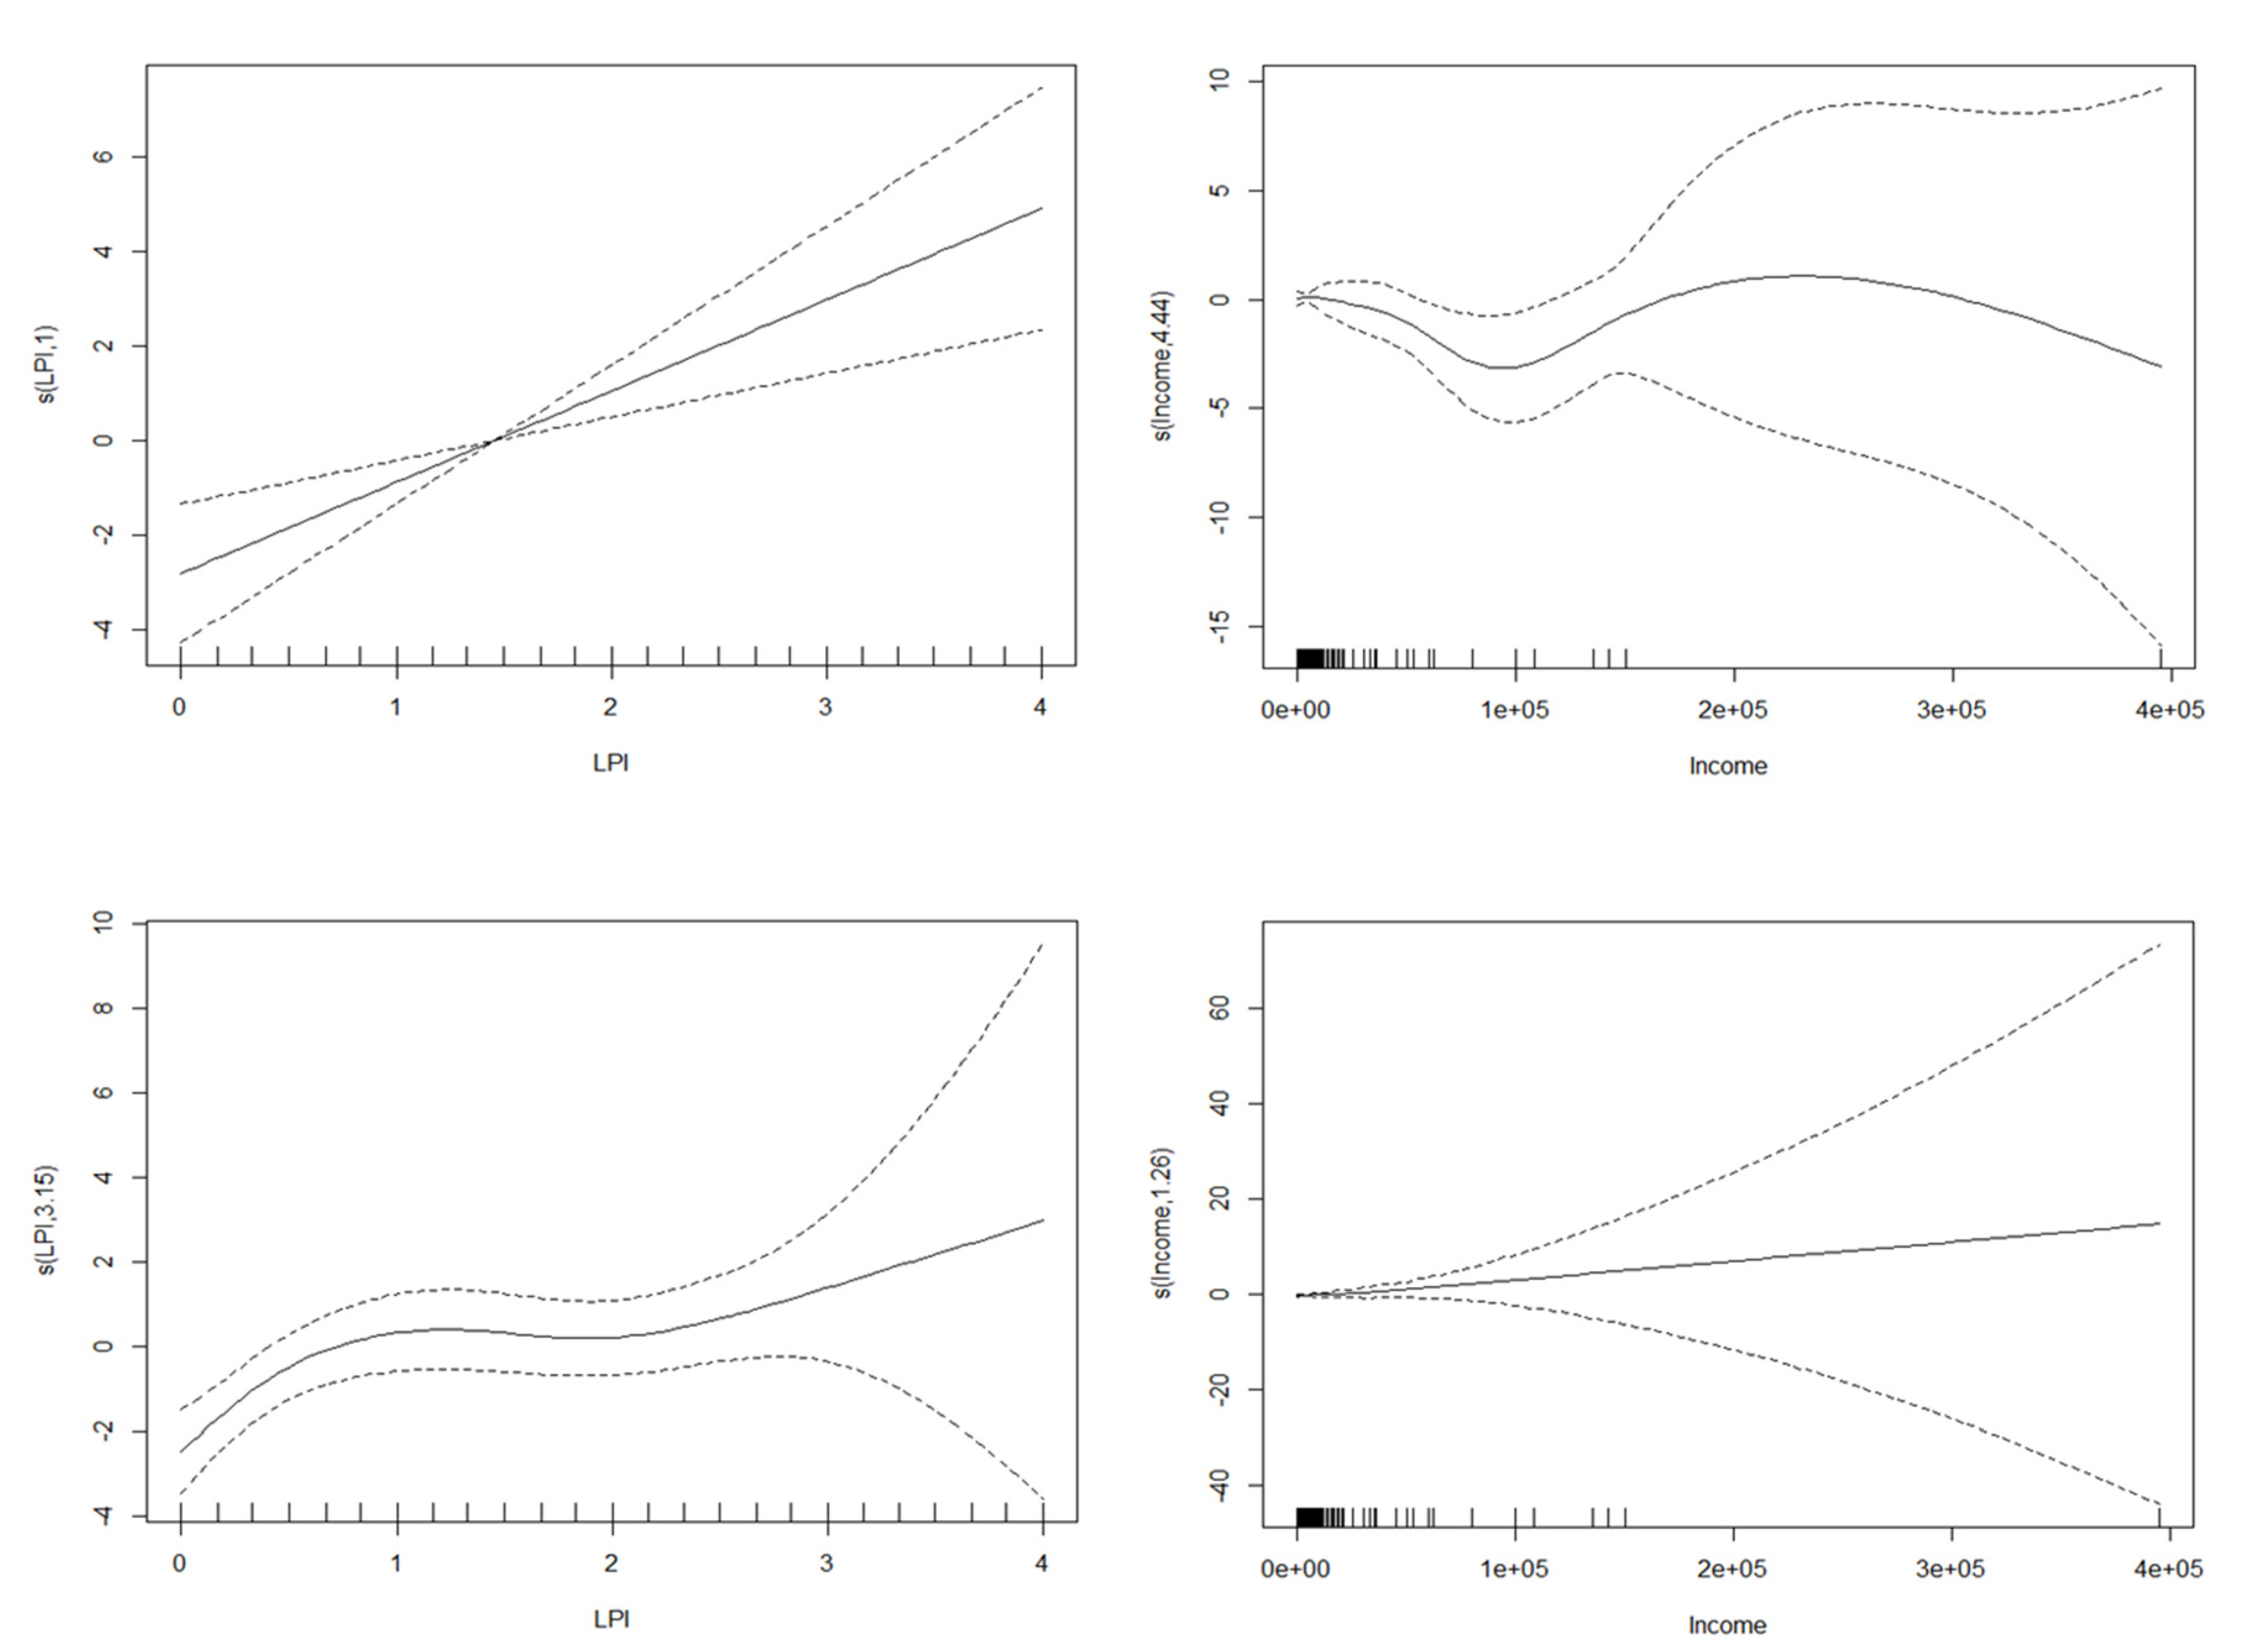
3. Results
4. Discussion
5. Conclusions and Recommendations
Author Contributions
Funding
Institutional Review Board Statement
Informed Consent Statement
Data Availability Statement
Conflicts of Interest
References
- Zhu, N.; Zhang, D.; Wang, W.; Li, X.; Yang, B.; Song, J.; Zhao, X.; Huang, B.; Shi, W.; Lu, R.; et al. China novel coronavirus investigating and research team. A novel coronavirus from patients with pneumonia in China, 2019. N. Engl. J. Med. 2020, 382, 727–733. [Google Scholar] [CrossRef] [PubMed]
- Wang, C.; Horby, P.W.; Hayden, F.G.; Gao, G.F. A novel coronavirus outbreak of global health concern. Lancet 2020, 395, 470–473. [Google Scholar] [CrossRef] [PubMed] [Green Version]
- WHO. WHO Coronavirus Disease (COVID-19) Dashboard. 2023. Available online: https://covid19.who.int/ (accessed on 23 February 2023).
- Amanat, F.; Krammer, F. SARS-COV-2 Vaccines: Status Report. Immunity 2020, 52, 583–589. [Google Scholar] [CrossRef]
- Tripathi, D.; Yi, G.; Vankayalapati, R. COVID-19: An update on vaccine development. Indian J. Rheumatol. 2020, 15, 70–72. [Google Scholar] [CrossRef]
- Cirrincione, L.; Plescia, F.; Ledda, C.; Rapisarda, V.; Martorana, D.; Moldovan, R.E.; Theodoridou, K.; Cannizzaro, E. COVID-19 pandemic: Prevention and protection measures to be adopted at the workplace. Sustainability 2020, 12, 3603. [Google Scholar] [CrossRef]
- Flaxman, S.; Mishra, S.; Gandy, A.; Unwin, H.; Coupland, H.; Mellan, T.; Zhu, H.; Berah, T.; Eaton, J.; Perez Guzman, P.; et al. Report 13: Estimating the Number of Infections and the Impact of Non-Pharmaceutical Interventions on COVID-19 in 11 European Countries: Technical Description Update; Imperial College COVID-19 Response Team: New York, NY, USA; London, UK, 2020; Available online: https://arxiv.org/abs/2004.11342 (accessed on 14 March 2023).
- Tian, H.; Liu, Y.; Li, Y.; Wu, C.H.; Chen, B.; Kraemer, M.U.; Li, B.; Cai, J.; Xu, B.; Yang, Q.; et al. An investigation of transmission control measures during the first 50 days of the COVID-19 epidemic in China. Science 2020, 368, 638–642. [Google Scholar] [CrossRef] [Green Version]
- Boissay, F.; Rungcharoenkitkul, P. Macro-Economic Effects of COVID-19: An Early Review. BIS Bulletin. No. 7. 2020. Available online: https://www.bis.org/publ/bisbull07.pdf (accessed on 4 August 2020).
- Congressional Research Service. Global Economic Effects of COVID-19. 2020. Available online: https://fas.org/sgp/crs/row/R46270.pdf (accessed on 4 August 2020).
- Deliotte. Economic Impact of the COVID-19 Pandemic on East African Economies: Summary of Government Intervention Measures and Deloitte Insights. 2020. Available online: https://www2.deloitte.com/content/dam/Deloitte/tz/Documents/finance/Economic_Impact_Covid-19_Pandemic_on_EastAfrican_Economies.pdf (accessed on 4 August 2020).
- UNDP. A Preliminary Assessment of the Socio-Economic Impact of Coronavirus (COVID-19) in Zimbabwe, Harare; Policy Brief 01/2020; UNDP: New York, NY, USA, 2020. [Google Scholar]
- Nuugulu, S.M.; Homateni, L. Estimating the Economic Impact of COVID-19: A Case Study of Namibia. Munich Personal RePEc Archive. Paper No. 99641. 2020. Available online: https://mpra.ub.uni-muenchen.de/99641/ (accessed on 4 August 2020).
- Doerr, S.; Gambacorta, L. COVID-19 and regional employment in Europe, BIS Bulletin, No. 16. 2020. Available online: https://www.bis.org/publ/bisbull16.pdf (accessed on 4 August 2020).
- ILO. Impact of the COVID-19 Crisis on Loss of Jobs and Hours Among Domestic Workers. 2020. Available online: https://www.ilo.org/wcmsp5/groups/public/---ed_protect/---protrav/---travail/documents/publication/wcms_747961.pdf (accessed on 4 August 2020).
- Campos, M.C.; Dombrowski, J.G.; Phelan, J.; Marinho, C.R.F.; Hibberd, M.; Clark, T.G.; Susana Campino, S. Zika might not be acting alone: Using an ecological study approach to investigate potential co-acting risk factors for an unusual pattern of microcephaly in Brazil. PLoS ONE 2018, 13, e0201452. [Google Scholar] [CrossRef] [PubMed] [Green Version]
- Redding, D.W.; Atkinson, P.M.; Cunningham, A.A.; Lo Iacono, G.; Moses, L.M.; Wood, J.L.; Jones, K.E. Impacts of environmental and socio-economic factors on emergence and epidemic potential of Ebola in Africa. Nat. Commun. 2019, 10, 4531. [Google Scholar] [CrossRef] [Green Version]
- Moore, M.; Gelfeld, B.; Okunogbe, A.; &Christopher, P. Identifying Future Disease Hot Spots; Rand Corporation: Santa Monica, CA, USA, 2017. [Google Scholar]
- Adda, J. Economic activity and the spread of viral disease. Q. J. Econ. 2016, 131, 891–941. [Google Scholar] [CrossRef] [Green Version]
- Rohr, J.R.; Barret, C.B.; Civitello, D.J.; Craft, M.E. Emerging human infectious diseases and the links to global food production. Nat. Sustain. 2019, 2, 445–456. [Google Scholar] [CrossRef]
- WHO. Communicable Diseases and Severe Food Shortages: WHO Technical Note. 2010. Available online: https://apps.who.int/iris/bitstream/handle/10665/70485/WHO_HSE_GAR_DCE_2010_6_eng.pdf;jsessionid=24B76F7A07C4F263787CF1939D3E8CA2?sequence=1 (accessed on 4 August 2020).
- Asian Development Bank. Food Security in Asia and the Pacific amid the COVID-19 Pandemic. ADB Brief No. 139. 2020. Available online: https://www.adb.org/sites/default/files/publication/611671/adb-brief-139-food-security-asia-pacific-covid-19.pdf (accessed on 4 August 2020).
- IPES. COVID-19 and the Crisis in Food Systems: Symptoms, Causes and Potential Solution. International Panel of Experts on Sustainable Food Systems, Communique April 2020. 2020. Available online: http://www.ipes-food.org/_img/upload/files/COVID-19_CommuniqueEN%283%29.pdf (accessed on 4 August 2020).
- Wiggins, S.; Calow, R.; Feyertag, J.; Levine, S.; Lowe, A. Policy Interventions to Mitigate Negative Effects on Poverty, Agriculture and Food Security, from Disease Outbreaks and Other Crises; Agriculture Policy Research in Africa (APRA), ODI: London, UK, 2020. [Google Scholar]
- Ozili, P.K. COVID-19 in Africa: Socio-Economic Impact, Policy Response, and Opportunities. Int. J. Sociol. Soc. Policy 2020, 42, 177–200. Available online: https://www.emerald.com/insight/0144-333X.htm (accessed on 4 August 2020). [CrossRef]
- UN-HABITAT. COVID-19: Socio-Economic Impacts in Africa, Discussion Paper—9 April 2020. 2020. Available online: https://unhabitat.org/sites/default/files/2020/04/dp_covid-19_effects_in_africa5.pdf (accessed on 4 August 2020).
- FAO; IFAD; WFP; The World Bank. Joint Statement on COVID-19 Impacts on Food Security and Nutrition; The World Bank: Washington, DC, USA, 21 April 2020. [Google Scholar]
- Anthem, P. Risk of Hunger Pandemic as COVID-19 Set to Almost Double Acute Hunger by End of 2020; World Food Program Insights: Rome, Italy, April 2020. [Google Scholar]
- United Nations. World Urbanization Prospects: The 2018 Revision; UN Department of Economic and Social Affairs: New York, NY, USA, 2019; Available online: https://population.un.org/wup/publications/Files/WUP2018-Report.pdf (accessed on 10 February 2021).
- Ravallion, M.; Chen, S.; Sangraula, P. New Evidence on the Urbanization of Poverty. Popul. Dev. Rev. 2007, 33, 667–701. [Google Scholar] [CrossRef] [Green Version]
- Nickanor, N.; Crush, J.; Pendleton, W. Migration, rural-urban linkages and food insecurity. In Rapid Urbanisation, Urban Food Deserts and Food Security in Africa; Crush, J., Battersby, J., Eds.; Springer: Cham, Switzerland, 2016; pp. 97–111. [Google Scholar] [CrossRef]
- Pendleton, W.; Nickanor, N.; Pomuti, A. The State of Food Insecurity in Windhoek, Namibia; Urban Food Security Series No. 14; African Food Security Urban Network: Kingston, ON, Canada; Cape Town, South Africa, 2012; pp. 1–37. [Google Scholar]
- Nickanor, N.; Kazembe, L.; Crush, J.; Wagner, J. The Supermarket Revolution and Food Security in Namibia; AFSUN Series No. 26; African Food Security Urban Network: Kingston, ON, Canada; Cape Town, South Africa, 2017; pp. 1–97. [Google Scholar]
- Namibia Statistics Agency. A Year Living with COVID-19: COVID-19 Households and Job Tracker Survey; NSA: Windhoek, Namibia, 2021. [Google Scholar]
- Namibia Statistics Agency (NSA). Namibia 2011 Population and Housing Census Basic Report; NSA: Windhoek, Namibia, 2012. [Google Scholar]
- Mbongo, L. Food Insecurity and Quality Of Life in Informal Settlements of Katutura, Windhoek, Namibia. Master’s Thesis, University of Namibia, Windhoek, Namibia, 2017. [Google Scholar]
- Crush, J.; McCordic, C. The Hungry Cities Food Purchases Matrix: A Measure of Urban Household Food Security and Food System Interaction; HCP Discussion Paper No. 10; Hungry Cities Partnership: Waterloo, ON, Canada, 2017. [Google Scholar]
- Nickanor, N.; Kazembe, L.; Crush, J. Urban Household Poverty and Food Insecurity: A Case of Windhoek, Namibia; University of Namibia Working Paper 2019; Balsillie School of International Affairs: Waterloo, ON, Canada, 2019. [Google Scholar]
- Mattes, R.; Dulani, B.; Gyimah-Boadi, E. Africa’s Growth Dividend? Lived Poverty Drops across Much of the Continent; Policy Paper No. 29; Afrobarometer: Accra, Ghana, 2016. [Google Scholar]
- Rajbhandari, A. Identification and MCMC estimation of bivariate probit model with partial observability. In Bayesian Inference in Social Sciences; Jeliazkov, I., Yang, X., Eds.; John Wiley & Sons, Inc.: Hoboken, NJ, USA, 2014; Chapter 13. [Google Scholar] [CrossRef]
- Guggisberg, M.; Romana, A. BiProbitPartial: Bivariate Probit with Partial Observability. Version 1.0.3. 2019. Available online: https://cran.r-roject.org/web/packages/BiProbitPartial/ (accessed on 14 March 2023).
- Kang, H. The prevention and handling of the missing data. Korean J. Anesthesiol. 2013, 64, 402–406. [Google Scholar] [CrossRef] [PubMed] [Green Version]
- Mitra, R.; McGough, S.F.; Chakraborti, T.; Holmes, C.; Copping, R.; Hagenbuch, N.; Biedermann, S.; Noonan, J.; Lehmann, B.; Shenvi, A.; et al. Learning from data with structured missingness. Nat. Mach. Intell. 2023, 5, 13–23. [Google Scholar] [CrossRef]
- Pereira, M.; Oliveira, A.M. Poverty and food insecurity may increase as the threat of COVID-19 spreads. Public Health Nutr. 2020, 23, 3236–3240. [Google Scholar] [CrossRef] [PubMed]
- Niles, M.T.; Bertmann, F.; Belarmino, E.H.; Wentworth, T.; Biehl, E.; Neff, R. The Early Food Insecurity Impacts of COVID-19. Nutrients 2020, 12, 2096. [Google Scholar] [CrossRef]
- Onyeaka, H.; Anumudu, C.K.; Al-Sharify, Z.T.; Egele-Godswill, E.; Mbaegbu, P. COVID-19 pandemic: A review of the global lockdown and its far-reaching effects. Sci. Prog. 2021, 104, 368504211019854. [Google Scholar] [CrossRef]
- Syafiq, A.; Fikawati, S.; Gemily, S.C. Household food security during the COVID-19 pandemic in urban and semi-urban areas in Indonesia. J. Health Popul. Nutr. 2022, 41, 4. [Google Scholar] [CrossRef]
- Elsahoryi, N.; Al-Sayyed, H.; Odeh, M.; McGrattan, A.; Hammad, F. Effect of Covid-19 on food security: A cross-sectional survey. Clin. Nutr. ESPEN 2020, 40, 171–178. [Google Scholar] [CrossRef]
- Ali, J.; Kapoor, S.; Moorthy, J. Buying behaviour of consumers for food products in an emerging economy. Br. Food J. 2010, 112, 109–124. [Google Scholar] [CrossRef]
- Odunitan-Wayas, F.A.; Okop, K.J.; Dover, R.V.; Alaba, O.A.; Micklesfield, L.K.; Puoane, T.; Levitt, N.S.; Battersby, J.; Meltzer, S.T.; Lambert, E.V. Food purchasing behaviour of shoppers from different South African socio-economic communities: Results from grocery receipts, intercept surveys and in-supermarkets audits. Public Health Nutr. 2021, 24, 665–676. [Google Scholar] [CrossRef] [PubMed]
- Abhishek, B.V. India’s food system in the time of COVID-19. Econ. Political Wkly. 2020, 55, 11. [Google Scholar]
- Sulser, T.; Dunston, S. COVID-19-Related Trade Restrictions On Rice And Wheat Could Drive Up Prices And Increase Hunger. IFPRI Blog: Research Post. 15 May 2020. Available online: https://www.ifpri.org/blog/covid-19-related-trade-restrictions-rice-and-wheat-could-drive-prices-and-increase-hunger (accessed on 14 March 2023).
- Echevarría, R. Fixing the Global Food System after Coronavirus. IFPRI Blog: Issue Post. 15 May 2020. Available online: https://www.ifpri.org/blog/fixing-global-food-system-after-coronavirus (accessed on 10 October 2022).


| Variable and Category | Number of Households | Percentage |
|---|---|---|
| Outcome variable | ||
| Food insecurity: Yes | 719 | 83.6 |
| Food insecurity: No | 141 | 16.4 |
| Main Predictor variable | ||
| Frequency Purchase (Daily) | 8 | 0.9 |
| Frequency Purchase (Weekly) | 13 | 1.5 |
| Frequency Purchase (Twice Monthly) | 82 | 9.5 |
| Frequency Purchase (Monthly) | 757 | 88.0 |
| Other Predictor Variables | ||
| Housing type (Informal) | 476 | 55.9 |
| Housing type (Formal) | 375 | 44.1 |
| Household size: 1 member | 76 | 8.8 |
| Household size: 2–3 members | 256 | 29.8 |
| Household size: 4–5 members | 274 | 31.9 |
| Household size: 6 or more members | 254 | 29.5 |
| Household structure: Female-centered | 280 | 30.3 |
| Household structure: Male-centered | 163 | 19.3 |
| Household structure: Nuclear | 204 | 24.1 |
| Household structure: Extended | 201 | 23.7 |
| Household occupation: Formal | 401 | 50.7 |
| Household occupation: Causal | 156 | 19.7 |
| Household occupation: Business | 89 | 11.3 |
| Household occupation: Others | 145 | 18.3 |
| Informal Work Income: No | 573 | 69.1 |
| Informal Work Income: Yes | 268 | 31.9 |
| Child/Pension/Disability Grant: No | 754 | 88.1 |
| Child/Pension/Disability Grant: Yes | 102 | 11.9 |
| Lived Poverty Index Score * | Mean = 1.31 | SD = 1.03 |
| Household Income: ≤NAD 700.00 | 139 | 21.7 |
| Household Income: 701.00–1500.00 | 142 | 22.1 |
| Household Income: 1501.00–2500.00 | 105 | 16.4 |
| Household Income: 2501.00–6300.00 | 128 | 19.9 |
| Household Income: 6301.00+ | 128 | 19.9 |
| Variable | Basic Model | Full Model | ||||
|---|---|---|---|---|---|---|
| Coefficient | Std. Error | p-Value | Coefficient | Std. Error | p-Value | |
| Intercept | 1.074 | 0.057 | 0.001 | 0.721 | 0.111 | 0.001 |
| Frequency Purchase (Daily) | 0.076 | 0.571 | 0.05 | −0.146 | 0.163 | 0.368 |
| Frequency Purchase (Weekly) | −0.572 | 0.368 | 0.61 | −0.039 | 0.198 | 0.844 |
| Frequency Purchase (Twice Monthly) | −0.699 | 0.153 | 0.001 | −0.201 | 0.045 | 0.001 |
| Frequency Purchase (Monthly) | 0 | . | . | 0 * | . | . |
| Housing type (Informal) | 0.909 | 0.034 | 0.007 | |||
| Housing type (Formal) | 0 * | . | . | |||
| Household size: 1 member | −0.234 | 0.052 | 0.001 | |||
| Household size: 2–3 members | −0.034 | 0.035 | 0.337 | |||
| Household size: 4–5 members | 0.008 | 0.034 | 0.817 | |||
| Household size: 6 or more members | 0 * | . | . | |||
| Household structure: Female-centered | 0.016 | 0.039 | 0.682 | |||
| Household structure: Male-centered | −0.095 | 0.044 | 0.034 | |||
| Household structure: Nuclear | −0.094 | 0.041 | 0.021 | |||
| Household structure: Extended | 0 * | . | . | |||
| Household occupation: Formal | 0.003 | 0.044 | 0.953 | |||
| Household occupation: Causal | 0.127 | 0.095 | 0.179 | |||
| Household occupation: Business | 0.074 | 0.097 | 0.441 | |||
| Household occupation: Others | 0 * | . | . | |||
| Informal Work Income: No | 0.052 | 0.094 | 0.579 | |||
| Informal Work Income: Yes | 0 * | . | . | |||
| Child/Pension/Disability Grant: No | −0.007 | 0.048 | 0.878 | |||
| Child/Pension/Disability Grant: Yes | 0 * | . | . | |||
| Lived Poverty Index score | 0.084 | 0.014 | 0.001 | |||
| Household Income: ≤ NAD 700.00 | 0.082 | 0.058 | 0.157 | |||
| Household Income: 701.00–1500.00 | 0.121 | 0.049 | 0.013 | |||
| Household Income: 1501.00–2500.00 | 0.116 | 0.054 | 0.022 | |||
| Household Income: 2501.00–6300.00 | 0.121 | 0.047 | 0.010 | |||
| Household Income: NAD 6301.00+ | 0 * | . | . | |||
| Variable | Insec: Probability (Food Insecurity) | Purch: Probability (Food Insecurity|Frequency of Food Purchase) | ||||
|---|---|---|---|---|---|---|
| Coefficient | Std. Error | p-Value | Coefficient | Std. Error | p-Value | |
| Intercept | 1.114 | 0.7339 | 0.129 | 7.833 | 13.707 | 0.988 |
| Housing type (Formal) | 0 | . | . | 0 | . | . |
| Housing type (Informal) | 1.396 | 0.568 | 0.0142 | 1.173 | 0.392 | 0.069 |
| Household size: 1 member | 0 | . | . | 0 | . | . |
| Household size: 2–3 members | 2.517 | 0.652 | 0.00011 | −4.969 | 13.709 | 0.992 |
| Household size: 4–5 members | 4.245 | 0.841 | 0.00045 | −5.414 | 13.707 | 0.996 |
| Household size: 6 or more members | 4.082 | 0.902 | 0.00062 | −5.622 | 13.706 | 0.993 |
| Household structure: Female-centered | 0 | . | . | 0 | . | . |
| Household structure: Male-centered | −1.885 | 0.612 | 0.0021 | 0.524 | 0.486 | 0.281 |
| Household structure: Nuclear | −1.217 | 0.801 | 0.128 | −0.328 | 0.392 | 0.403 |
| Household structure: Extended | −1.905 | 0.744 | 0.011 | 5.192 | 6.468 | 0.927 |
| Household occupation: Formal | 2.693 | 1.524 | 0.132 | −5.327 | 7.380 | 0.992 |
| Household occupation: Causal | 4.368 | 5.732 | 0.446 | −5.944 | 7.386 | 0.991 |
| Household occupation: Business | 5.082 | 5.787 | 0.379 | −1.146 | 0.502 | 0.069 |
| Household occupation: Others | 0 | . | . | 0 | . | . |
| Informal Work Income: No | 0 | . | . | 0 | . | . |
| Informal Work Income: Yes | −4.371 | 5.734 | 0.445 | 0.699 | 0.757 | 0.355 |
| Child/Pension/Disability Grant: No | 0 | . | . | 0 | . | . |
| Child/Pension/Disability Grant: Yes | 10.111 | 61.327 | 0.978 | −1.125 | 0.515 | 0.028 |
Disclaimer/Publisher’s Note: The statements, opinions and data contained in all publications are solely those of the individual author(s) and contributor(s) and not of MDPI and/or the editor(s). MDPI and/or the editor(s) disclaim responsibility for any injury to people or property resulting from any ideas, methods, instructions or products referred to in the content. |
© 2023 by the authors. Licensee MDPI, Basel, Switzerland. This article is an open access article distributed under the terms and conditions of the Creative Commons Attribution (CC BY) license (https://creativecommons.org/licenses/by/4.0/).
Share and Cite
Nickanor, N.M.; Tawodzera, G.; Kazembe, L.N. The Threat of COVID-19 on Food Security: A Modelling Perspective of Scenarios in the Informal Settlements in Windhoek. Land 2023, 12, 718. https://doi.org/10.3390/land12030718
Nickanor NM, Tawodzera G, Kazembe LN. The Threat of COVID-19 on Food Security: A Modelling Perspective of Scenarios in the Informal Settlements in Windhoek. Land. 2023; 12(3):718. https://doi.org/10.3390/land12030718
Chicago/Turabian StyleNickanor, Ndeyapo M., Godfrey Tawodzera, and Lawrence N. Kazembe. 2023. "The Threat of COVID-19 on Food Security: A Modelling Perspective of Scenarios in the Informal Settlements in Windhoek" Land 12, no. 3: 718. https://doi.org/10.3390/land12030718