1. Introduction
Stakeholder involvement is receiving increasing attention and is changing in public policies on the built environment. For example, the Omgevingswet [Environment Act] in the Netherlands encourages the ‘involvement of stakeholders (residents, businesses, civil society organisations and government bodies) at an early stage in the process of decision-making on a project or activity’, but also forces governments to participate through a duty of organization and motivation [
1]. A large part of the projects and transformation processes will take place in existing urban areas. The European Green Deal announced a ‘renovation wave’ for 35 million residential and non-residential buildings by 2030 to foster deep energy renovations [
2]. One of the key building principles (next to e.g., energy efficiency and affordability) for this massive renovation operation is the respect for aesthetics and architectural quality. It refers to the Davos Declaration that promotes the concept of a high-quality
Baukultur in Europe, stressing preservation of the quality of the built environment and the value of cultural heritage [
3].
Stakeholder participation is also being promoted to heritage identification and management. The Faro Convention [
4] declares it a human right for every citizen to engage with the cultural heritage of their choice and mentions the need to involve everyone in society in the ongoing process of defining and managing cultural heritage. This is in line with the later Davos Declaration that addresses the impact of the built environment on people’s quality of life and the requirement for their participation. The growing attention is also reflected in academic studies on participation practices in heritage management e.g., comparing international practices in community participation [
5], studying the different roles in participatory heritage practices and related methods [
6] and research on the representation (or lack) of nation and cultural diversity within discourses, identification and nomination of heritage [
7].
While many studies research when and how stakeholders are or should be involved in the process, the specific interests of various participating stakeholders have been less researched. Who are they? And, more importantly, what do they find important in their living environment? What groups can be identified and to what extent do individuals in a group agree on the evaluation of qualities? What is their perspective on heritage? This paper discusses the identification of attributes in neighbourhoods and buildings, by individuals and groups in order to differentiate stakeholders based on their interests. A greater awareness on how individuals and groups identify attributes as their heritage, helps growing understanding on how they may or may not differ. This is relevant to anticipate potential conflicts or shared interests for the conservation of significant attributes within renovation processes. In addition, more information on how stakeholder profiles (background, profession) relate to their assessment can inform who to invite at the participation table to include their opinions and achieve stakeholder support. The context of this study is the overlap between everyday neighbourhoods and heritage. The interface between everyday and heritage applies to the theory, methods and case study used. Starting point is the importance of preserving qualities in every living environment, as stated in the Davos Declaration and the Faro Convention. Preservation of existing qualities is at the core of the heritage discipline. Where the attributes justifying heritage listings started highlighting history and monumental artworks, in the last century younger objects, commonplace buildings and neighbourhoods started being listed and also further researched in heritage studies [
8]. These developments show that ‘everyday’ and ‘heritage’ are converging.
This paper presents a detailed analysis of interview responses from various groups. The aim is to reveal the variation of perspectives between and within stakeholder groups, in order to better understand the contributions per stakeholder profile and how they can influence the choice of attributes in their assessment of significance. In doing so, the researchers aim to help reduce the knowledge gap on how stakeholders, individuals and groups, convey significance to their living environment, in their similarities and differences. The research is based on a single case study and has multiple respondents with diverse backgrounds, professions, and connections to the neighbourhood. The case study concerns a Dutch 1980s neighbourhood in Amsterdam Zuidoost, whose heritage significance (attributes and values) has not yet been extensively studied. By assessing a not-listed neighbourhood, using theories and methods common in heritage studies, this article also contributes to the knowledge about and preservation of everyday attributes and their importance for stakeholders. In addition, it examines how considering the diversity of stakeholder interests influences the identification of attributes and hence the possible designation of heritage.
First, the paper discusses theory about stakeholder classification to define a theoretical framework for the research (
Section 2). It then illustrates the case study and explains the research methods for data collection, data analysis, applying sequentially quantitative and qualitative methods (
Section 3). In the results section (
Section 4), the aggregated opinions of the stakeholder groups are presented in a ‘majority report’, as well as the deviating responses in a ‘minority report’. In the discussion section (
Section 5), building on the results, propositions are formulated and related to the theoretical framework. Research contributions and recommendations follow in the conclusion (
Section 6).
2. Theoretical Framework
In order to identify the stakeholder groups and their priorities in heritage assessment and the possible differentiation between and within groups, current theories on stakeholder categories are discussed. Firstly, the main principles of group classification are compared, both from contemporary guiding heritage policies and from academic studies, addressing groups in terms of their role, power and influence on the heritage management process. Secondly, the link to interest in heritage is made by studying the relationship between stakeholder groups and heritage attributes. Then, a further specification of attributes is discussed, by identifying underlying principles to classify attributes, ranging from tangible to intangible, as well as, ranging from micro to macro scale. Finally, key concepts from the theory discussed are explained as a theoretical framework for operationalisation in this study.
2.1. Stakeholder Involvement
Although it is widely recognised that stakeholders should be involved in the identification and management of heritage, policies in urban development and heritage practices mention the term ‘stakeholder’ often preceded by ‘multiple’, ‘a wide range of’, ‘an inclusive set of’, without specifying the specific groups. The European countries ratifying the Faro Convention [
4] agree to involve everyone in society in the ongoing process of defining and managing cultural heritage. ‘Everyone’ is defined as ‘heritage communities’ consisting of ‘people who value specific aspects of cultural heritage which they wish (…) to sustain and transmit to future generations’. It is this broad integration of ‘everyone’ and at the same time the ‘specific aspects’ they consider important, that calls for more precision in the stakeholder groups and their interests. What are the criteria for distinguishing stakeholder groups?
A main and frequently used classification is the distinction between professionals and laymen. The Faro Convention states that the management of the cultural heritage and participation should be a joint action by public authorities, experts, owners, investors, businesses, non-governmental organisations and civil society [
4]. In this classification, several professionally involved groups are mentioned based on their role in relation to the heritage property. Civil society, certainly the largest in number, is not further specified, but seems to be a catch-all term for the not professionally involved. The 2011 ‘Recommendation on the Historic Urban Landscape’ (HUL) differentiates professional stakeholders by geographical scope, mentioning the involvement of ‘a variety of stakeholders, including local, national, regional, international, public and private actors in the urban development process’ [
9]. Also, a division between public and private is included. And although in the HUL recommendations on policies and responsibilities, professional stakeholders are classified by profession, role in the process, public or private sector, non-professionals are mentioned as one collective group, named civil society or community.
The difference between professionals and non-professionals according to the role they play in heritage management and conservation is addressed by Randall Mason [
10]. He distinguishes insiders who are ‘at the table’ and outsiders who are not. Insiders refer to actors with power, such as public officials, bureaucrats, policy makers, those who influence them, and other experts invited into the process. Outsiders, according to Mason, constitute everyone else with a stake in the heritage in question but with little or no leverage on the process. Outsiders often are non-professionals, but e.g., conservation professionals can also be outsiders if they have little access to the decision-making process. A further division of power and influence is described by Loes Veldpaus [
11] classifying politicians and policy makers as ‘decision makers’. Experts are differentiated in experts from policy, practice or academia. The heritage community is considered as divided in a direct community (inhabitants, users, and developers) and external community (wider public, local or national and tourists) [
11]. As Veldpaus acknowledges, the involved stakeholders and their roles have expanded and changed over the last decades and are dynamic. Mason introduces ‘potential stakeholders’ as a stakeholder group that has no influence but that may develop an interest in the heritage property in the future, such as future generations [
10]. This group can include both professionals and laypeople, but the prospect is the interest they will have in the heritage property.
2.2. Stakeholder Interests
The involvement of a broad range of stakeholders in the identification and management of heritage assumes that when the attributes and the significance they convey are identified and acknowledged; they could be conserved. In this way; stakeholder participation can indicate possible conflicting interests that require solutions or; on the contrary; corresponding interests that can facilitate the process. Classification of stakeholders by interest in a heritage property is the organising principle applied by Peter Howard in his ‘heritage markets’ [
12]. Accordingly, people with an interest in heritage are regarded as ‘markets’ conceptualising that each group invests labour, financial or cultural capital in the preservation and promotion of the heritage. Although Howard acknowledges that every group can have different sub-groups and that evaluations can be disputed between subgroups as well as between individuals; he indicates general fields of interest per heritage market (see
Table 1). For example, visitors are keen on access, which may contrast with the interest of academics in authenticity in preservation of physical, material constructions and details. This differs from the media who are interested in the authenticity of appearance rather than material. Also governments and visitors want to conserve material objects, while insiders care deeply about very ordinary things and accredit deeper meanings to people and to sites [
12]. The classification by Howard includes some groups also mentioned by others, in some cases with different meanings (e.g., outsider; insider). Although professionals or laypeople are included, it is not a main division. The distinguishing aspect in his classification, is the arrangement on the basis of someone’s interest in heritage (see
Table 1).
In a study among residents of historic city centres as users of urban heritage, Elke Ennen [
13] distinguishes three types of residents, based on the meaning they attribute to their living environment. The ‘connoisseurs’ have emphatically chosen to live in the heritage environment, have interest in cultural facilities and participate actively in local heritage manners. The ‘take-it-or-leavers’ are neutral to heritage identity but have interest in the public space, social contacts, and cheap city centre facilities. The ‘rejecters’ live in the historic city centre because of employment and other facilities, but would rather live elsewhere [
13]. Another study by Hannah Garrow in the urban area of Leith in Edinburgh, distinguishes resident groups by their residential history and examines how this influences their assessment and their narratives in determining what constitutes heritage. ‘Auld Leithers’ attach personal meaning to spaces enabled by ancestral ties to Leith and through experiencing historical events in their lifetimes. ‘Real Leithers’ were born in Leith, but like Ennen’s ‘take-it-or-leavers’ are rather ambivalent about preserving (historic) qualities and simply accept their living environment. ‘New Leithers’ moved there recently and demonstrate a wider view in assessing Leith’s heritage, not relating to personal history but to other locations and references [
14]. Although Ennen’s and Harrow’s classification are limited to residents, they reveal nuances of appreciation within a stakeholder group, hinting that subgroups may have contrasting interests.
2.3. Stakeholders, Attributes and Scales
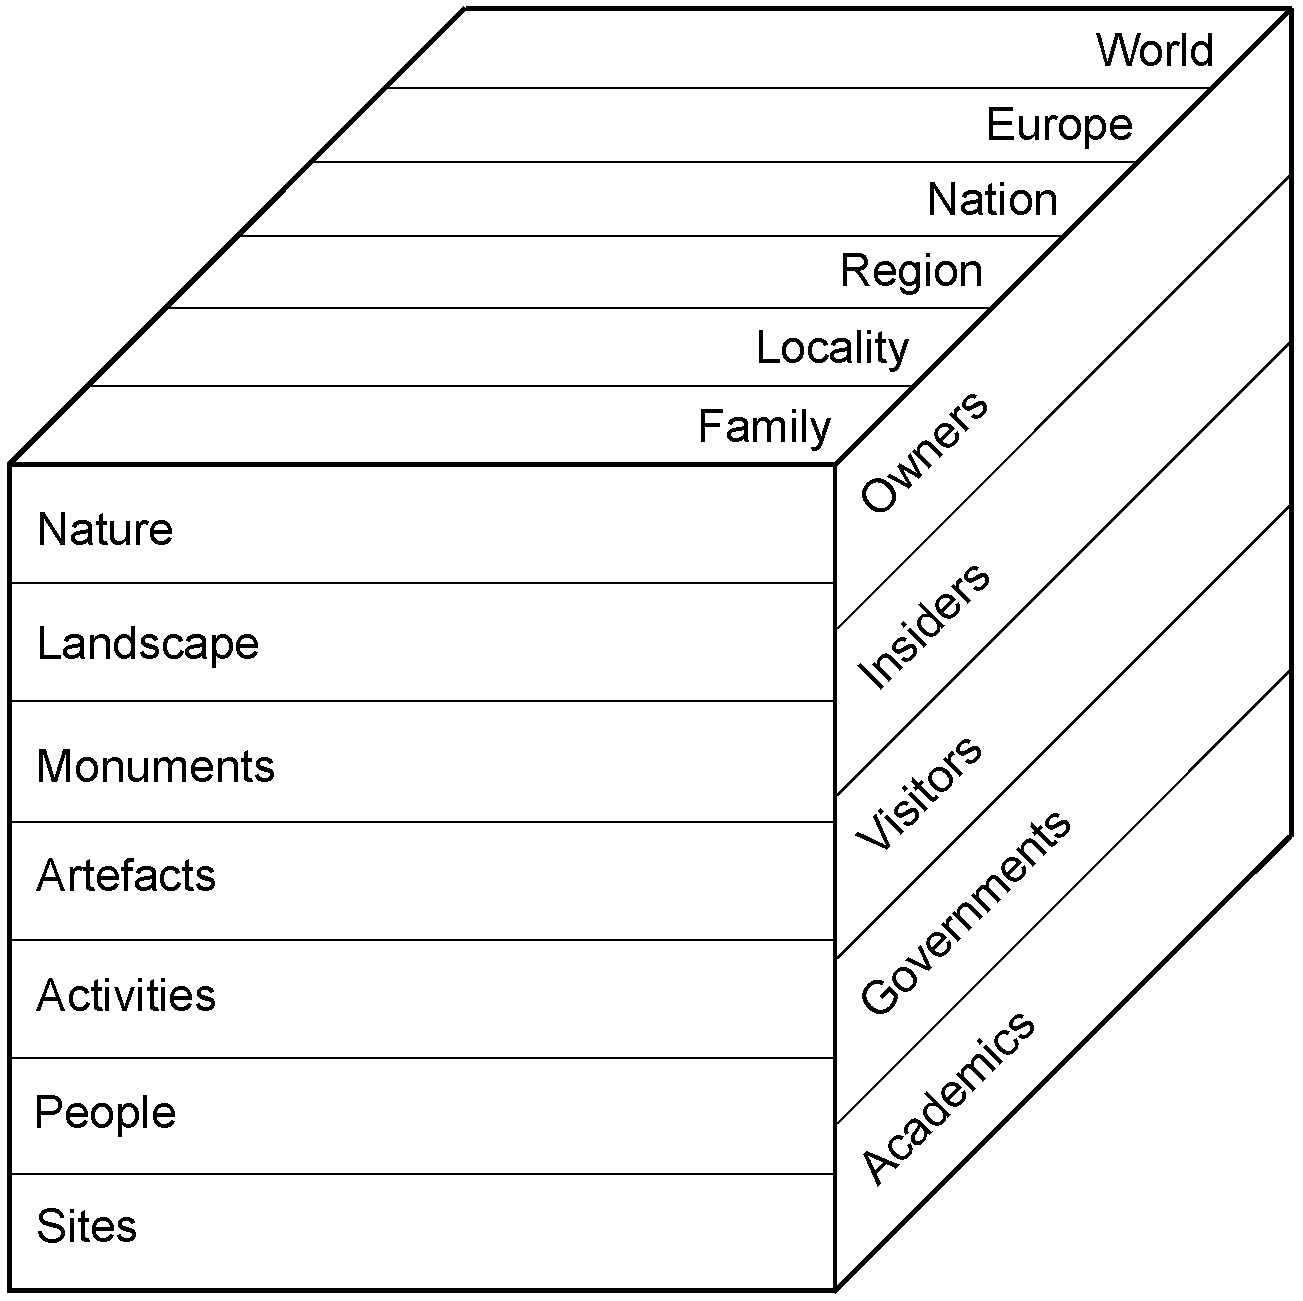
The beforementioned ‘heritage markets’ defined by Howard are one dimension of the ‘heritage cube’, a concept that classifies (1) the kinds of things that people conserve and collect (heritage fields), (2) the types of people who do it (heritage markets) and (3) the levels of identity at which the activity takes place (heritage identity levels) (see
Figure 1). These are considered the three faces of a cube and any dispute about heritage management can be imagined as existing somewhere within the cube, at the intersection of categories [
12].
Various terms can be used to identify and discuss what heritage is and why. The term ‘attribute’ has been growing adoption in the context of heritage, and its distinction to values has been highlighted by the 2011 Recommendation on the Historic Urban Landscape (HUL) [
9]. Attributes are the set of characteristics, qualities, uses, and meanings used by society to justify the classification of a specific resource as a heritage property and consequently, promote its conservation for the benefit of present and future generations. Attributes represent
what is heritage, which can be either tangible (material) or intangible (immaterial). In turn, values are the reason
why certain attributes are considered outstanding. Veldpaus developed a taxonomy to classify attributes and compare different sources and case studies. The tangible attributes categories are organised according to scale level: asset, area and landscape. The intangible attribute categories refer to the ideas underlying the product, the practice/ societal, and the process [
11].
When researching preferred attributes in participatory processes, the match between participant responses and attribute categories becomes relevant. As known from earlier research, individual responses in evaluating the living environment often consist of combinations of a variety of interrelated tangible and intangible attributes [
15]. The gradations in categories of attributes is also recognised by Coolen [
16], in his research on housing preferences. Coolen highlights the large variety of tangible and intangible attributes and explains this from the heterogeneity and complexity of housing, as a ‘product’. Respondents mention not only attributes related to the house, but also include the neighbourhood and location as important levels to the appreciation of the house. He lists different types of motivations, like everyday activities (playing, sleeping, supermarket), functional reasons (cheaper, practical) or psychosocial motivations (proud, relaxing, social control) [
16].
2.4. Operationalisation of the Theory
The ‘heritage cube’ by Howard is useful as a conceptual model for this study, as it organises stakeholders (markets), attributes (fields) and scales (levels). The principle of classification is adopted, albeit with adapted categories. Howard’s stakeholder categories (heritage markets) are detailed, yet comprehensive. Moreover, they are related to the assessment of preferred attributes. Since it is the aim of this study to find the similarities and differences between stakeholders’ interests, contributing to the participation process, Howard’s classification of stakeholders is used as a basis for this study. Howard and Ennen’s notion that subgroups with different interests exist within groups also provides a starting point in analysing results. For the scale levels, the organising principle from small to large is used, adapted to the relevant identification levels of the case study. The gradual transition from tangible to intangible attributes, as we have seen in the study by Coolen and Veldpaus, is a concept used in this research when classifying attributes, because it allows for a wide range of responses in the significance assessment of the varied stakeholders.
3. Method
The research primarily uses qualitative methods based on detailed interviews with a variety of respondents (59 individuals) about a neighbourhood in Amsterdam. The respondents of the different stakeholder groups were invited because of their profession and relation to the project, or through random encounters on the street. The sample of respondents was not meant to be representative, but big enough to identify and discuss the diversity of perspectives among stakeholder groups. As described by Small, ‘the respondents who were polite enough to talk, friendly enough to make an appointment based on a stranger’s cold call, and extroverted enough to share their feelings with this stranger may have systematically different attitudes’ [
17]. The results of this specific case study are not meant to be generalised to other case studies with alike attributes. Instead, the case study and methods are used to test the hypothesis and guide for further research.
3.1. Case Study
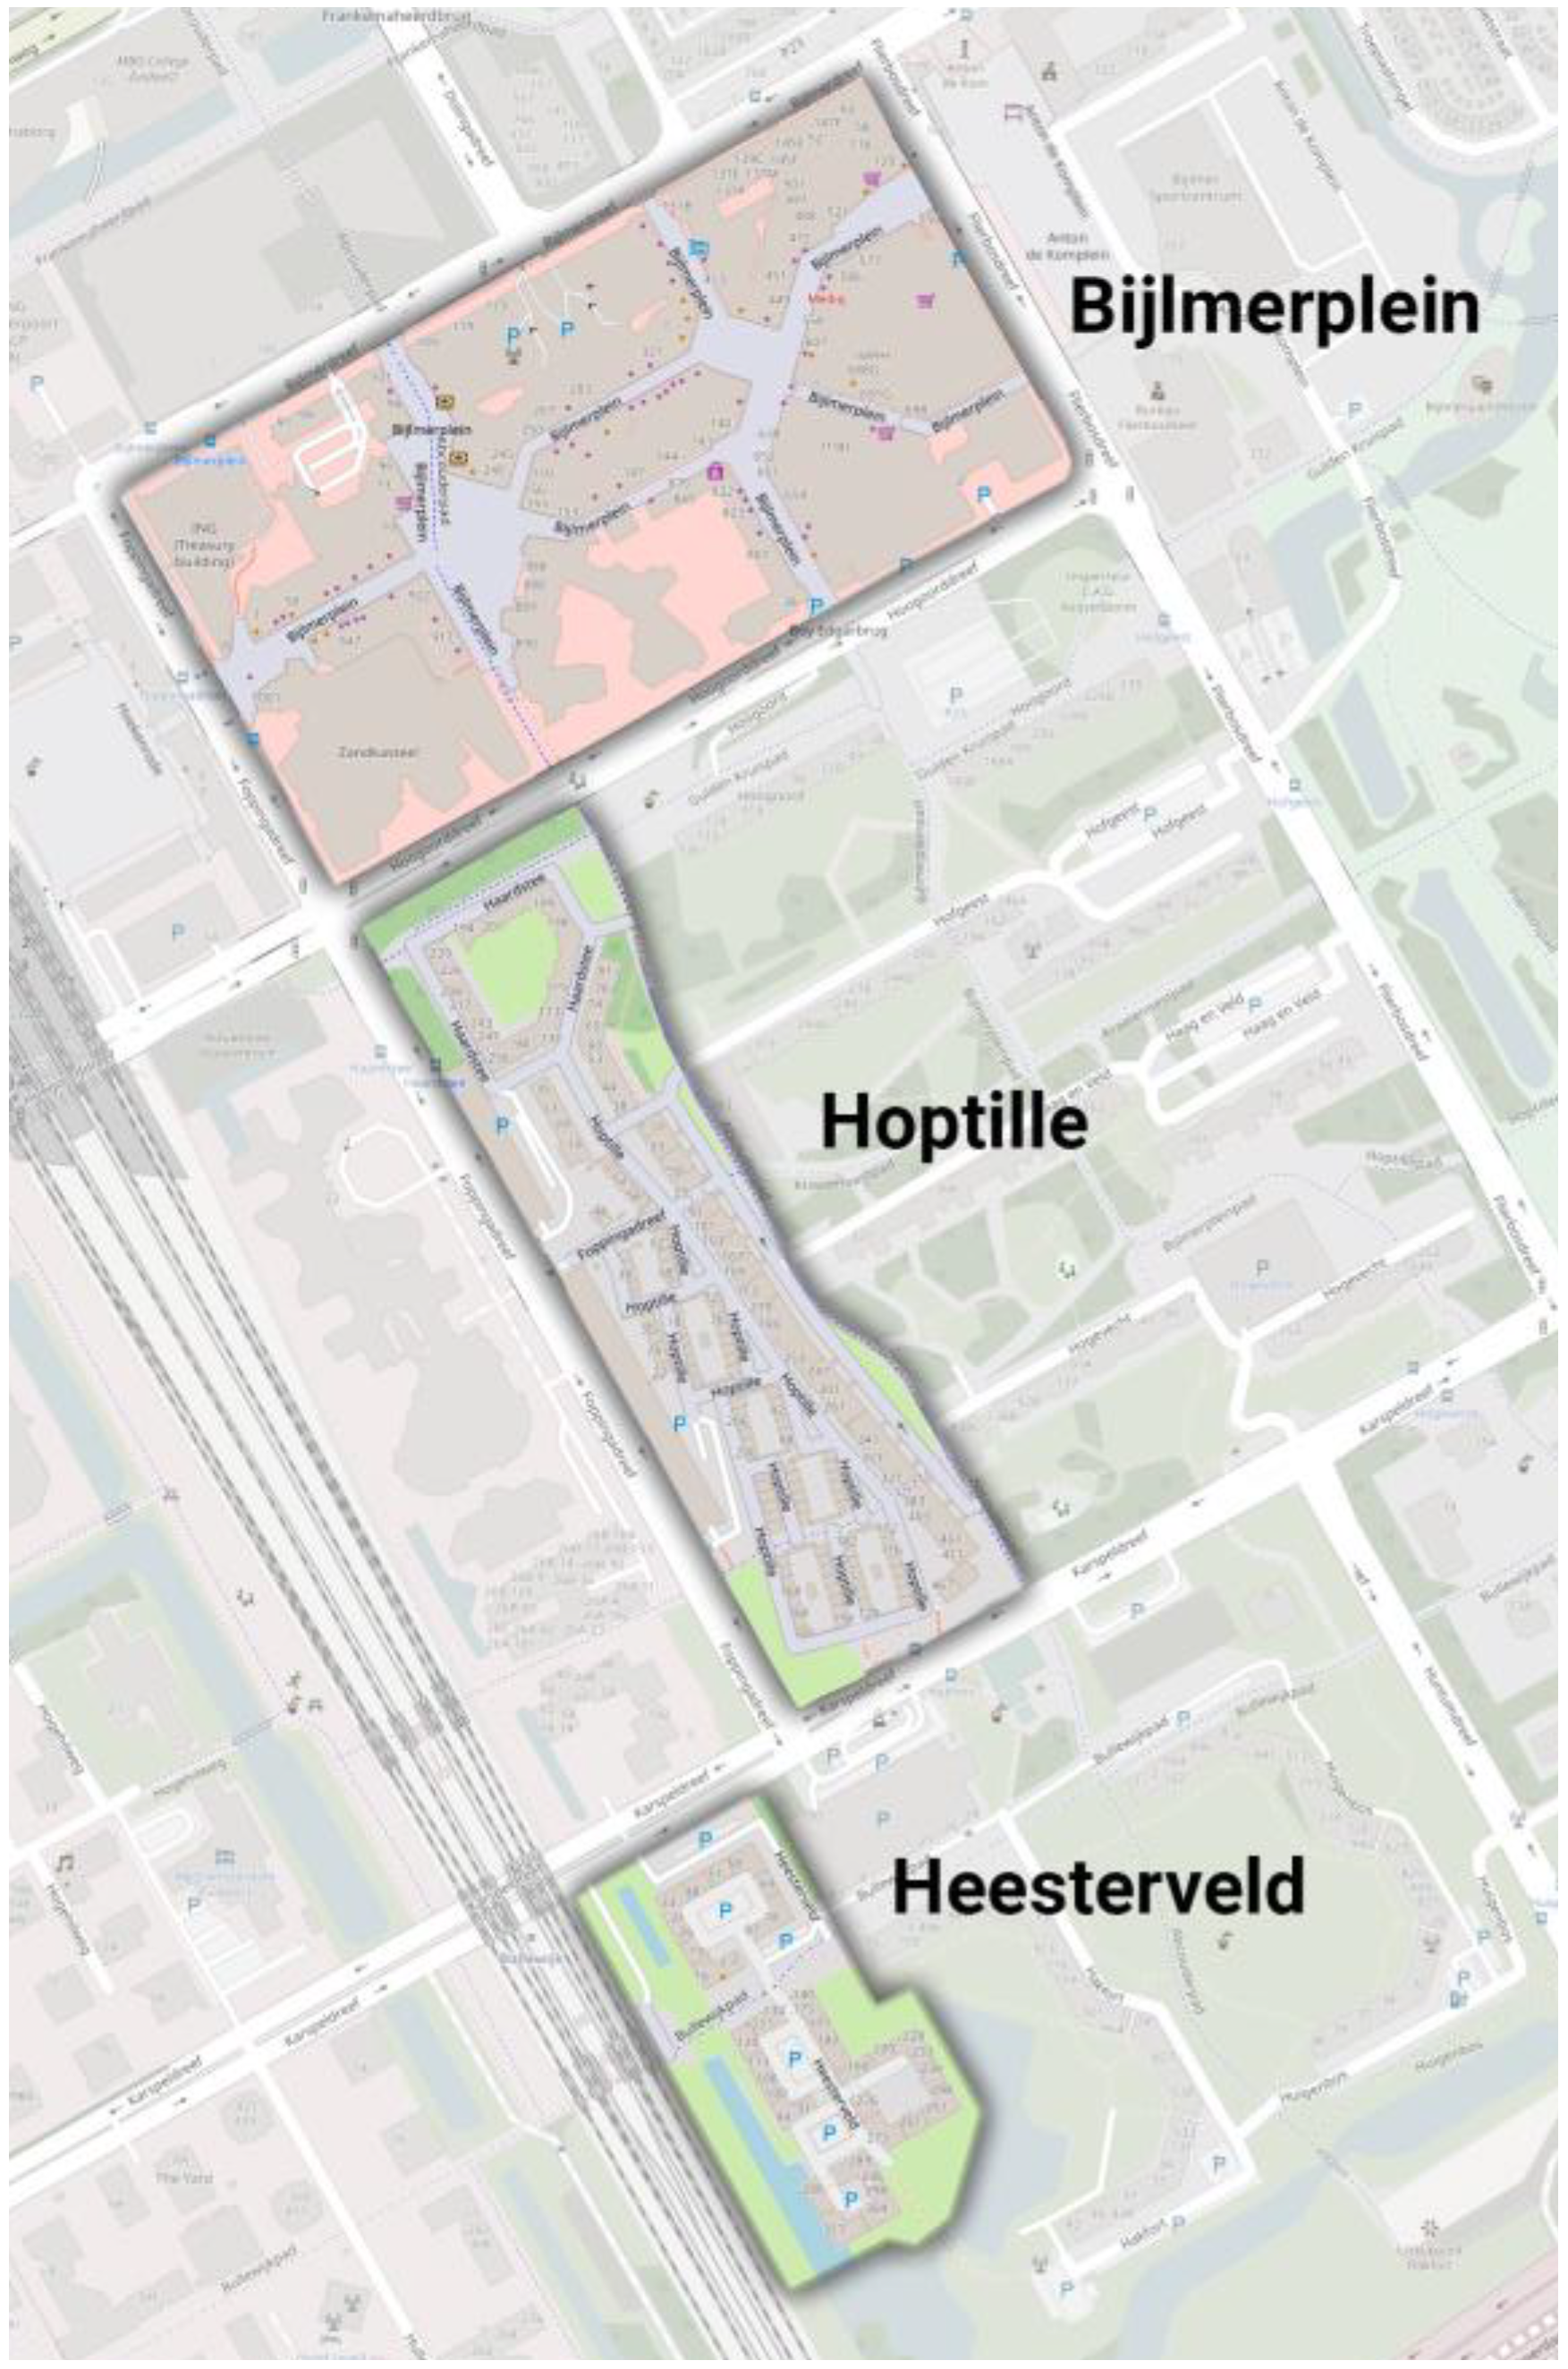
The research is conducted in the neighbourhoods Heesterveld, Hoptille and Bijlmerplein in Amsterdam (see
Figure 2). The Bijlmerplein neighbourhood has a mixed program of shops, offices, and housing. Hoptille and Heesterveld exist of residential complexes mainly, although Hoptille has some social meeting areas and in Heesterveld there is an artist community and related workshops and facilities. The neighbourhoods are part of Amsterdam Zuidoost, also known as the Bijlmermeer or Bijlmer. The Bijlmer is one of the most well-known housing estates in the Netherlands, characterised by long high-rise flat buildings in honeycomb patterns, built in the late 1960s and based on the CIAM ideology of separation of functions living, working, recreation, traffic [
18]. Already during the completion of the high-rise part of the Bijlmer, there was criticism of, among other things, a chaotic management situation, social problems, and the urban design concept, with the dominating massiveness of the apartment buildings, the lack of transparency and orientation. The neighbourhoods in this research are developed in the 1970s and 1980s according to another urban concept, as a ‘correction’ to the CIAM ideology. These neighbourhoods have a mixture of shopping facilities and housing, medium rather than high-rise buildings, and street profiles and facades that refer to traditional materials and architecture [
19]. The neighbourhoods are not listed as heritage or valuable architecture, although, in general, the stock built after 1965 has recently come under increasing attention in heritage practice and research [
20,
21].
3.2. Data Collection
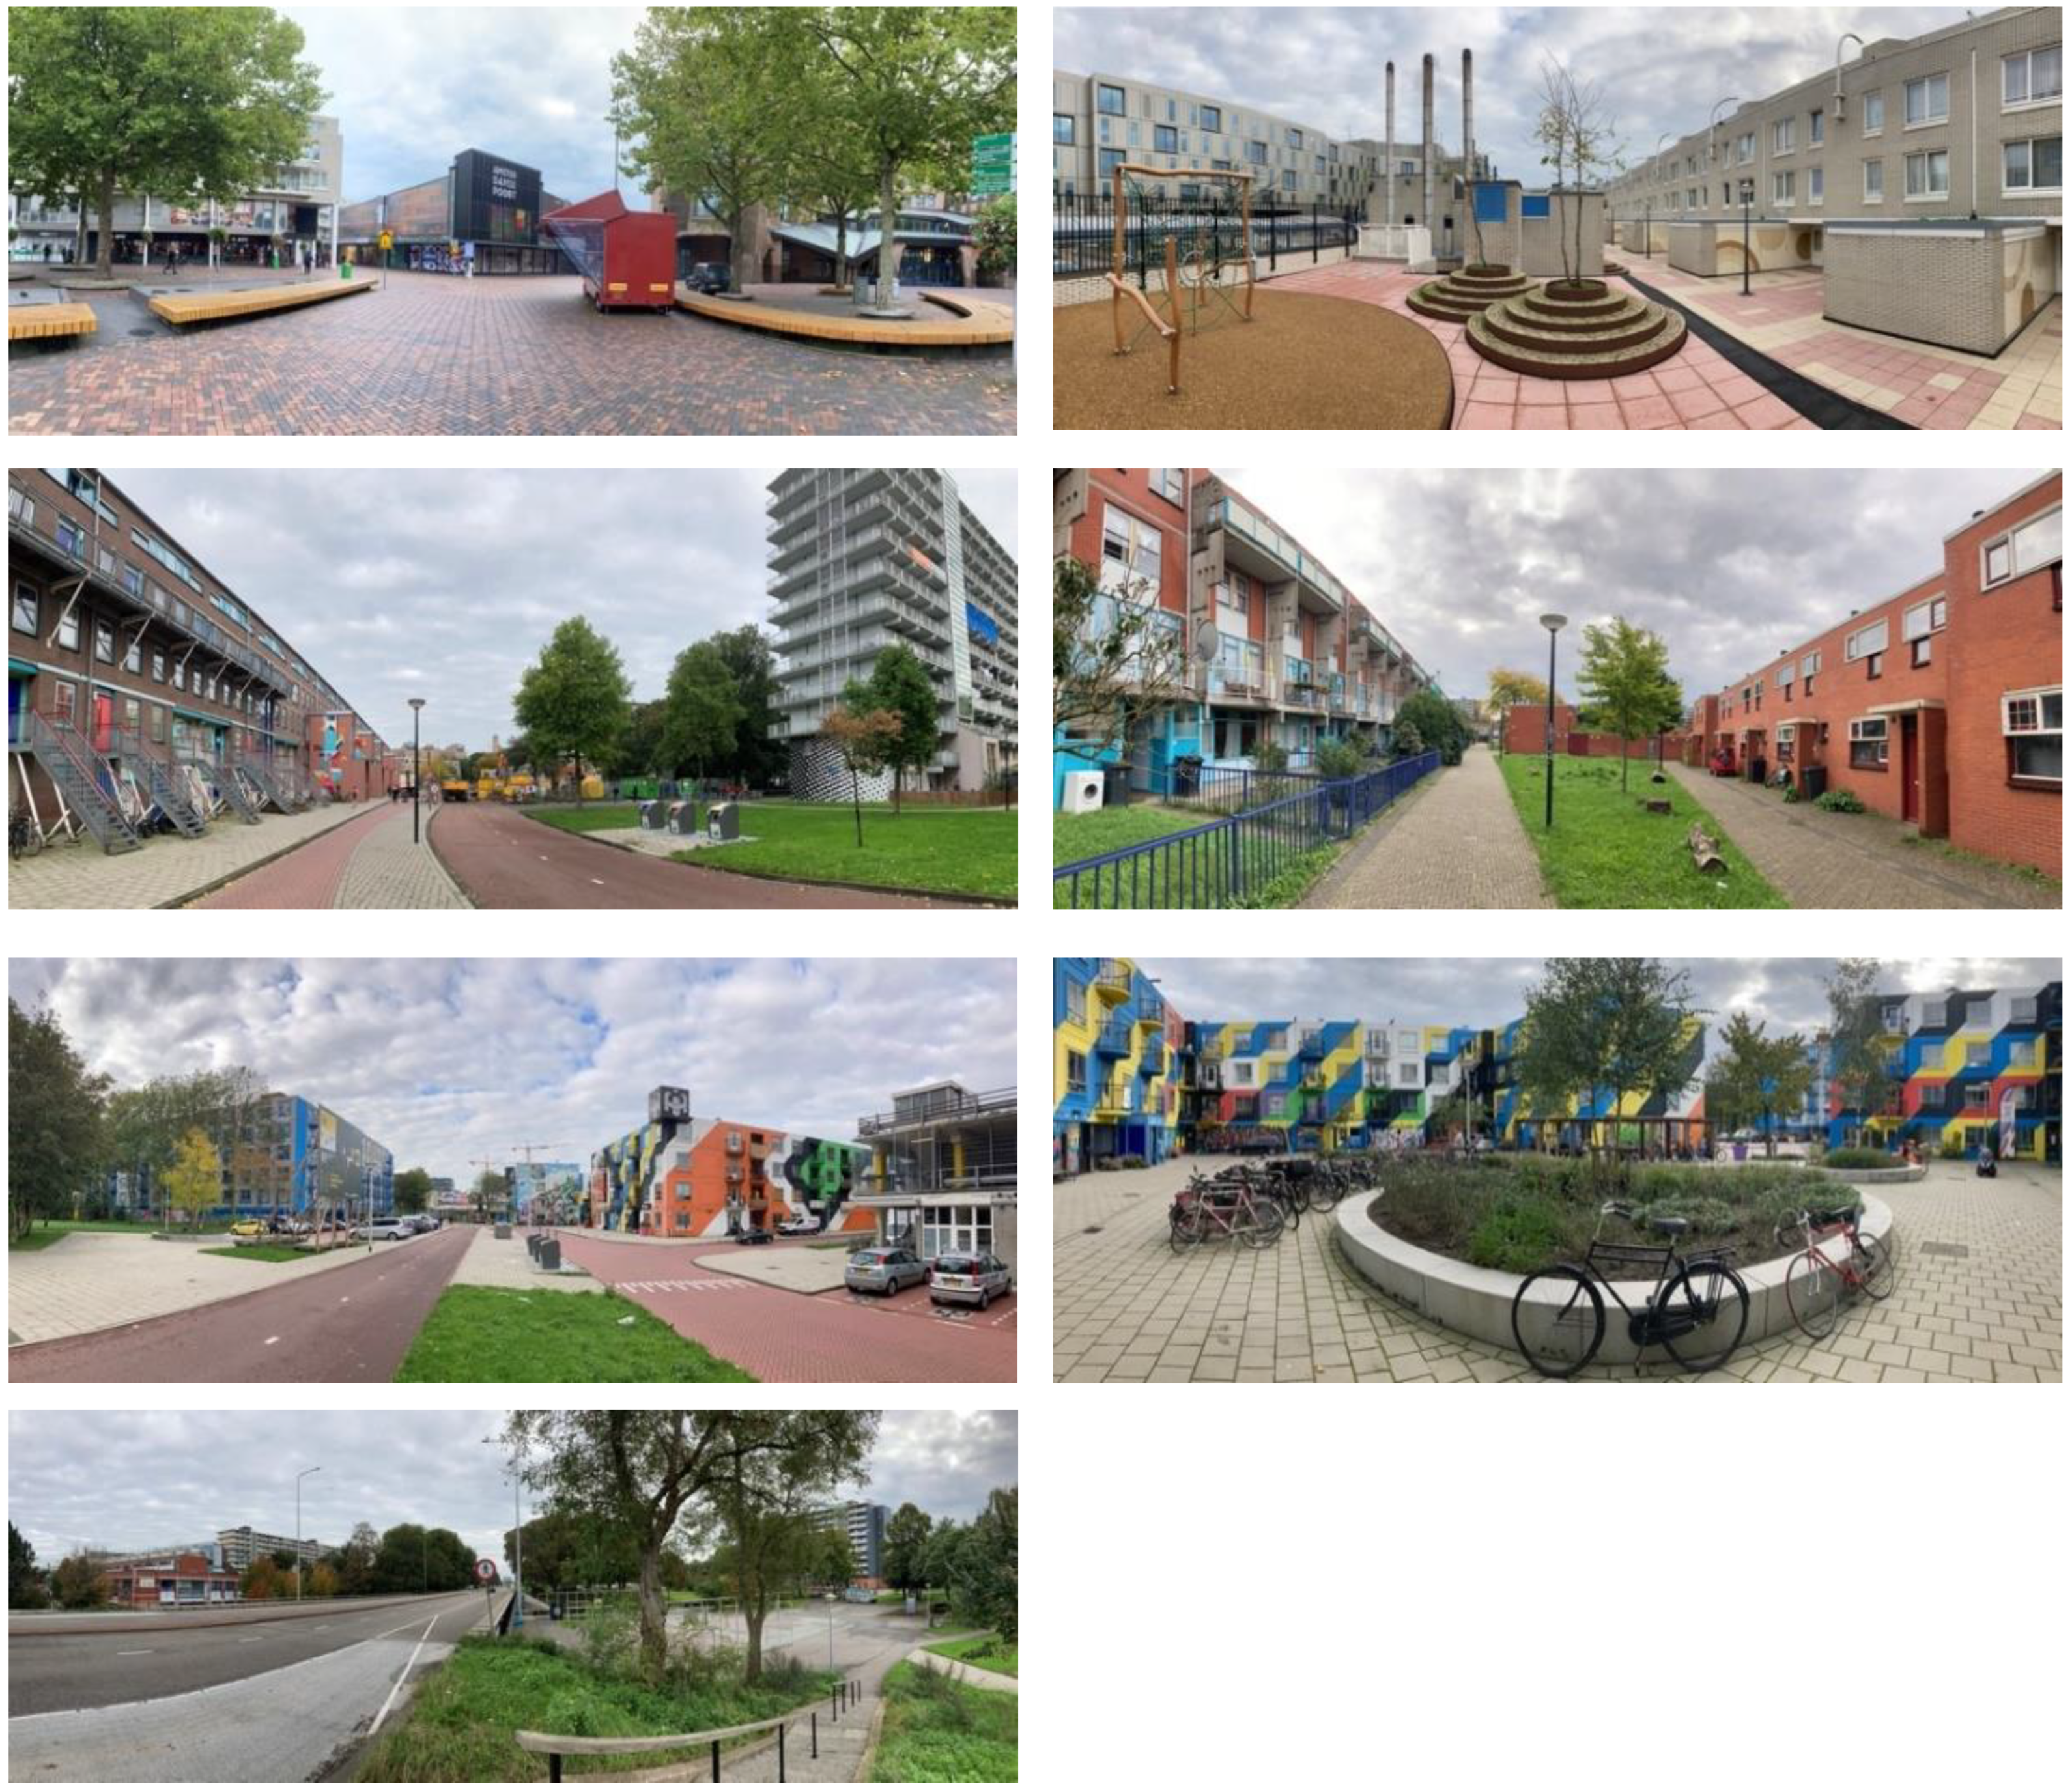
This research applied photo elicitation as a method for data collection, meaning the simple idea of inserting photographs into an interview [
22]. Harper argues that responses to photos and words differ, because the parts of the brain that process visual information are evolutionarily older than the parts that process verbal information. Thus, images evoke deeper elements of human consciousness than words. By using both words and photos in the photo elicitation interview, it does not only elicit more information, but rather evokes a different kind of information [
22]. Exploring a ‘different kind of information’ suits the aim of this research, to reveal the experiences and appreciated attributes in the neighbourhoods.
For the photo elicitation interviews, a set of seven photos was selected (see
Figure 3). They illustrated a great variety of attributes which respondents could identify as significant. The photos present the streetscape of the three neighbourhoods. The groups interviewed are based on but adapted from the ‘Heritage Markets’ as defined by Howard [
12] (see
Table 2). A group of ‘makers’ is added and includes architects and urban planners of the neighbourhoods who are still alive. Some respondents belong to more than one group e.g., both resident and local professional or architect and former resident. In those cases, the dominant profile is chosen for the aggregate analysis.
All groups have been confronted with the same set of photos. However, the interaction between interviewer and interviewee differs per group, as some are contacted in spontaneous encounters in the street, while others are consulted in agreed online interviews, which could have influenced the understanding and length of the responses. All participants were asked to describe what is depicted on the photos and to identify positive and negative attributes. All interviews are post-coded and analysed accordingly. The interrogation of various stakeholders by presenting the same selection of photos refers to the research paradigm that multiple realities exist. Each individual, also within every stakeholder group, might assess the same objects, events and places differently. Giving voice to the experiences of individuals allows viewpoints to be heard, which may otherwise be silenced or excluded [
23].
3.3. Coding
The data collected in the interviews was coded, using software Atlas.ti. Coding is a process to break down the entire data into meaningful parts, enabling focus and comparison on specific issues (codes) for analysis [
24]. A code in qualitative inquiry is most often a word or short phrase that symbolically assigns a summative, salient, essence-capturing, and/or evocative attribute for a portion of language based or visual data [
25]. Two approaches to coding were applied. Firstly, deductive coding was carried out, based on the classification scale levels and attribute categories from previous research [
15]. The classification involves mainly two types of codes: the scale levels to which an answer relates (from small to large) and the category of the attribute referred to (tangible to intangible). Additionally, inductive coding based on the data was applied to include ‘in vivo’ codes. This has led to adaptions during the coding process. Several attribute categories were added (object, comfort, appearance, story/memory) rising from the data. Some scales were hardly mentioned and therefore left out of the analysis (room, region, world). The scale level ‘world’ was mentioned only by the ‘makers’ group, referring to inspirational projects not directly related to the evaluation of this area and therefor disregarded in the analysis. In addition to the scale levels and the attribute categories, the codes include many attributes, which express the actual aspect that the respondents mention as positive or negative.
3.4. Analysis
Following the coding process of all interview transcripts, a first quantitative analysis was carried out. For each stakeholder group and for every individual respondent, a table was created showing the cooccurrence of all attribute categories (rows) and scale levels (columns). Each quote from the data that relates to a combination of scale level and attribute is displayed and counted in the table (see in
Appendix A). Because the length and detail of the interviews differ, the number of quotes per person or group vary. Quantitative tables were created per individual and per stakeholder group and were used to find focus/gravity point of scale level—attribute combinations. By comparing stakeholder groups similarities and differences between the assessment of groups can be found (see
Figure 4). By comparing the individual to its stakeholder group, matching but also deviating results can be found. After the first quantitative analysis step in which the main combinations of scale level and attribute were indicated, the qualitative data from the interviews in which these assessments were expressed were examined to identify what is significant for a group or individual. The stakeholder group tables served as starting point of analysing the coded data, finding the aggregate opinion (majority report). Individual tables then served to find divergent opinions to the consensus (minority report).
Quotes reflecting aggregate opinion and deviation were presented in majority and minority reports for each stakeholder group. These qualitative data are the main source for analysis, illustrate the detailed findings and lead to the propositions on stakeholders’ heritage assessment.
3.5. Theory Building
The research results are used to formulate propositions in a process inspired by grounded theory [
26] developing theory evidenced from the data [
27]. Following an iterative process of reading, data collection, coding and analysing, little by little the attributes and patterns ‘hidden’ in the data are identified. In the words of Charmaz, ‘Grounded theories dig deep into the empirical and build analytic structures that reach up to the hypothetical. Thus, straightforward categories about ordinary experiences shine with bright meanings through our analytic renderings’ [
28]. Analysing both aggregate (majority) and deviating (minority) opinions in a quantitative and qualitative approach, might reveal patterns in assessing attributes. Looking at the data in these divergent ways, the research tries to overcome information-processing biases, such as leaping to conclusions influenced by the vividness or by more elite respondents, ignoring basic statistical properties or dropping disconfirming evidence [
29].
The propositions are shaped from the majority and the minority opinions, finding logic and exception between groups and within the stakeholder group. These are compared to present theory on stakeholder assessment. As stated by Eisenhardt, [
29] ‘Cases which confirm emergent relationships enhance confidence in the validity of the relationships. Cases which disconfirm the relationships often can provide an opportunity to refine and extend the theory’. Because every neighbourhood is characterised by a mix of variables, generalisation of results is difficult in case study research. That is why results based on one or few cases have a hypothetical character requiring further testing [
30]. The propositions in this study are therefore intended as a starting point for further research.
4. Research Results
The research result includes a total of 59 individual responses. The results per stakeholder group are presented in a table showing the aggregate result of attribute-scale level combinations (see tables per stakeholder group in
Appendix A). For every group (and every individual), the number of responses, the interview method, specification of participant profile and neighbourhood were listed. Only the tables representing stakeholder groups are presented in the paper. The total dataset, including individuals’ tables can be requested from the authors.
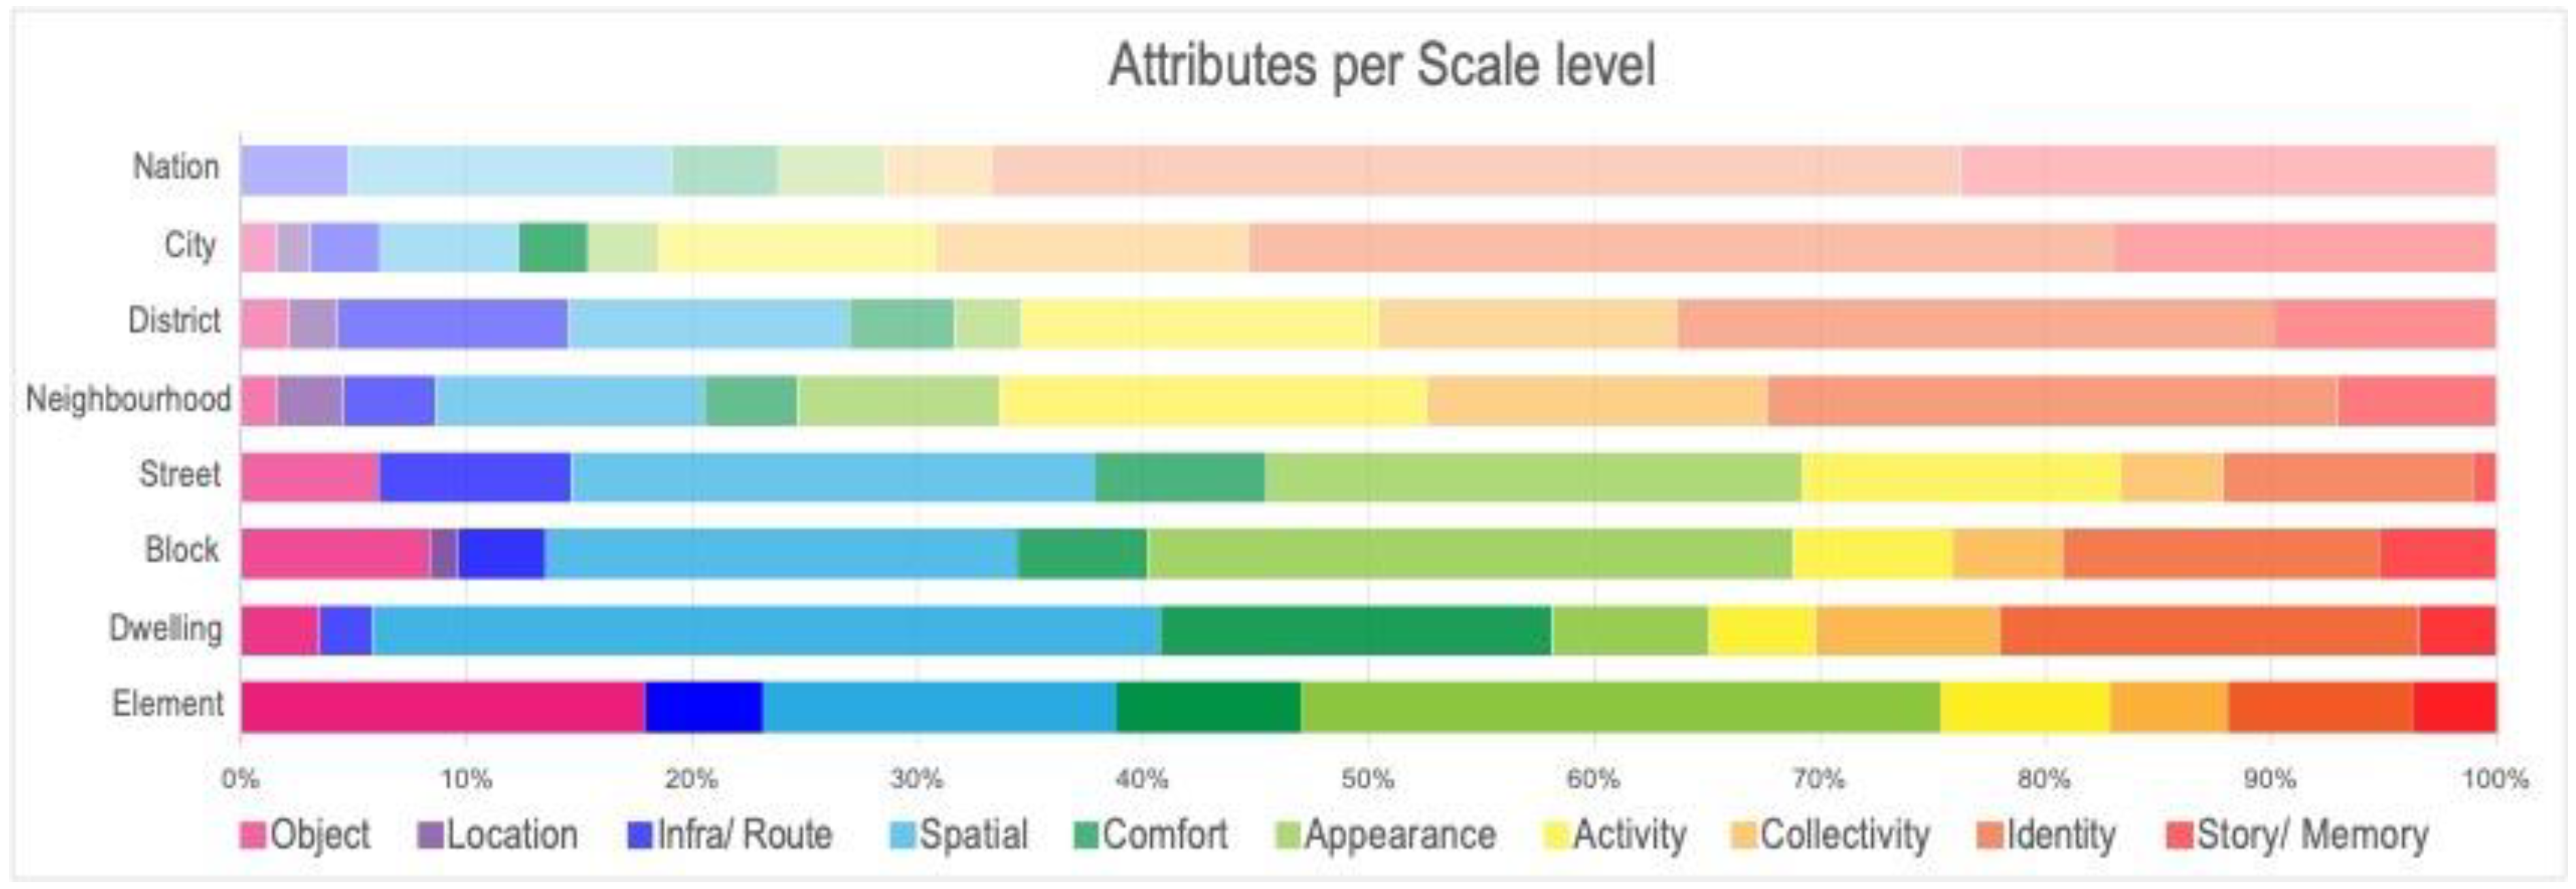
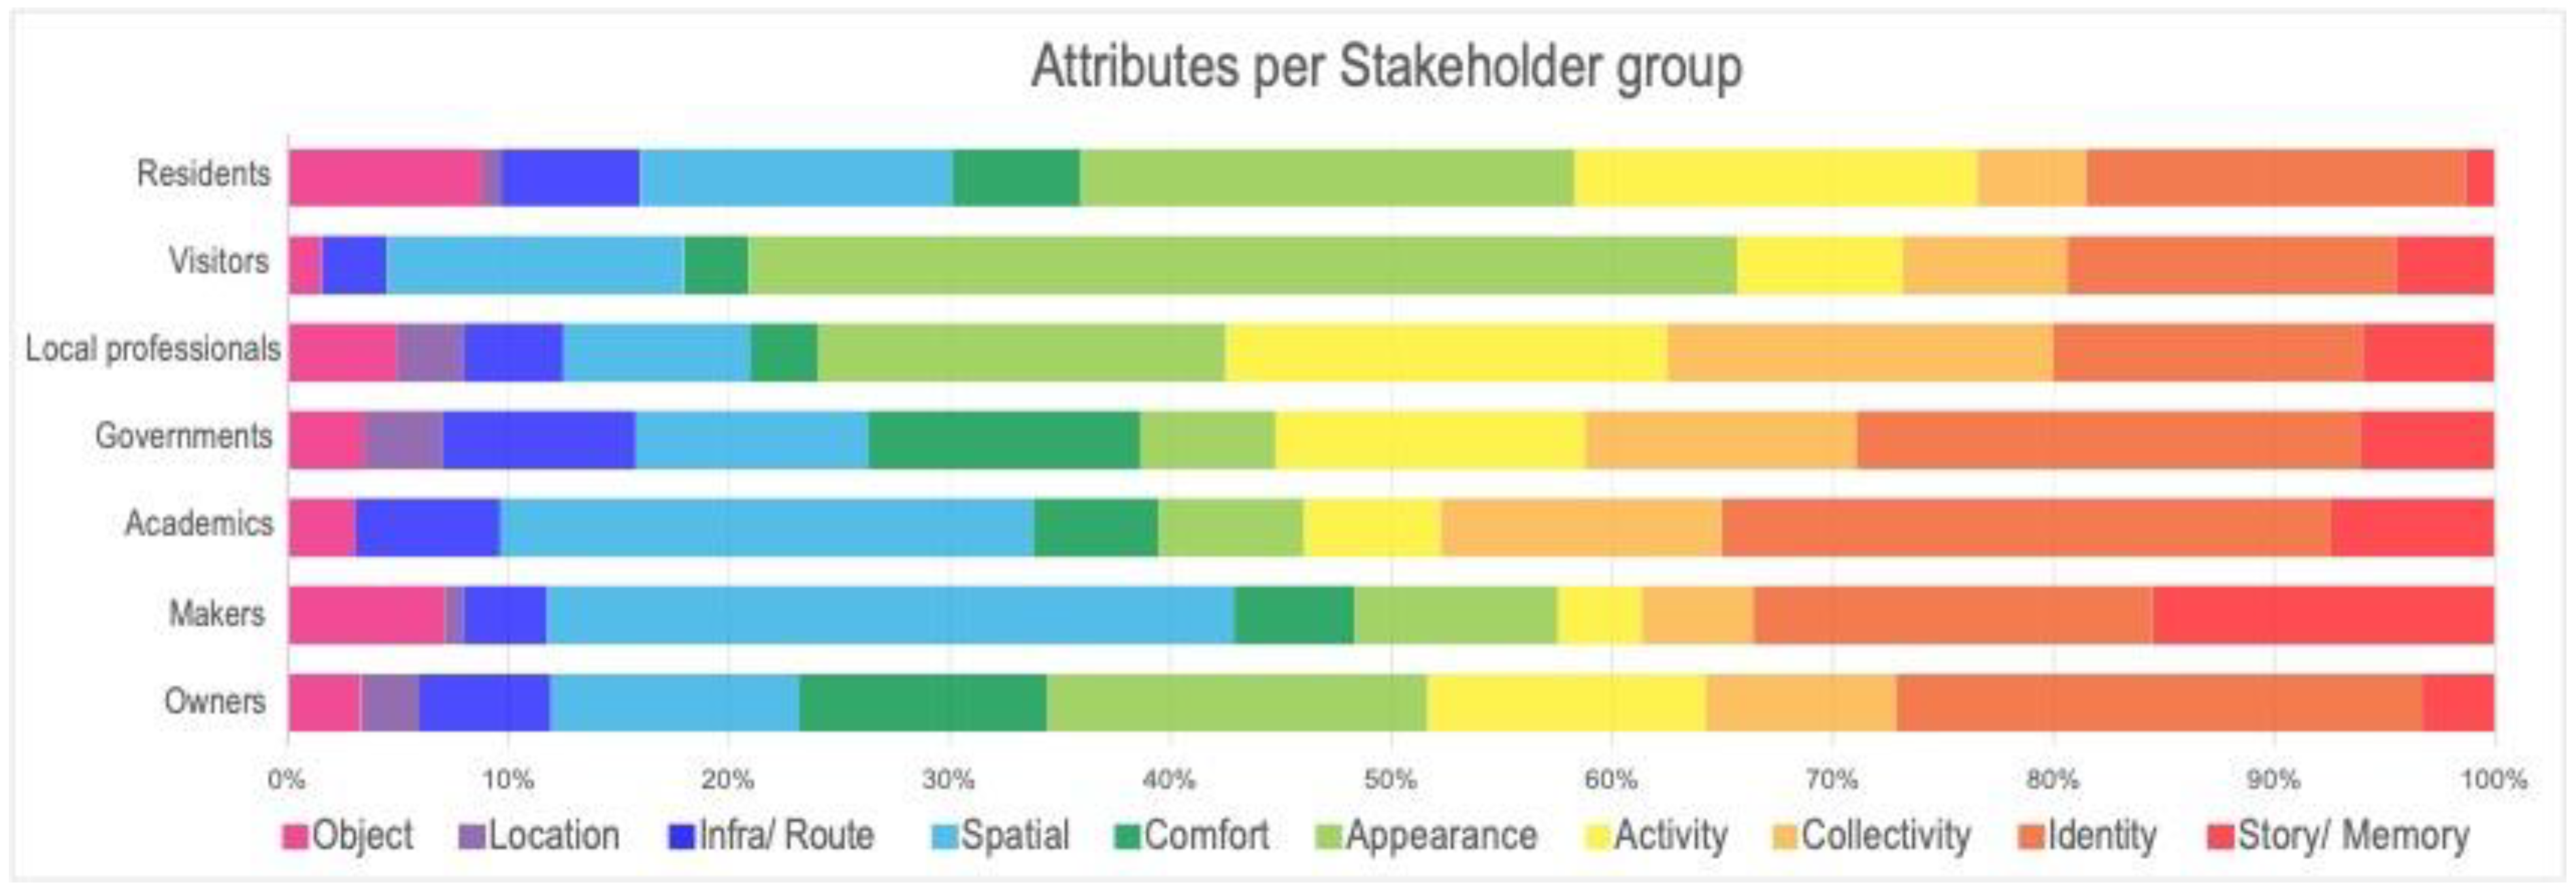
Figure 5 clearly shows that the significant attribute categories differ per stakeholder group, but there are also similarities in terms of most frequent or least frequent. Identity is often mentioned, and across all groups. Spatial and appearance also occur frequently but the latter in particular shows greater variation across groups. The tangible categories of object and location, as well as intangible categories comfort and story/memory, are among the least nominated attribute categories. The attribute category ‘location’ was hardly mentioned. This might be related to the interview method. In previous research open questions were asked (‘what do you like about your neighbourhood/ street’). In this method however, the photos already show a given neighbourhood or street.
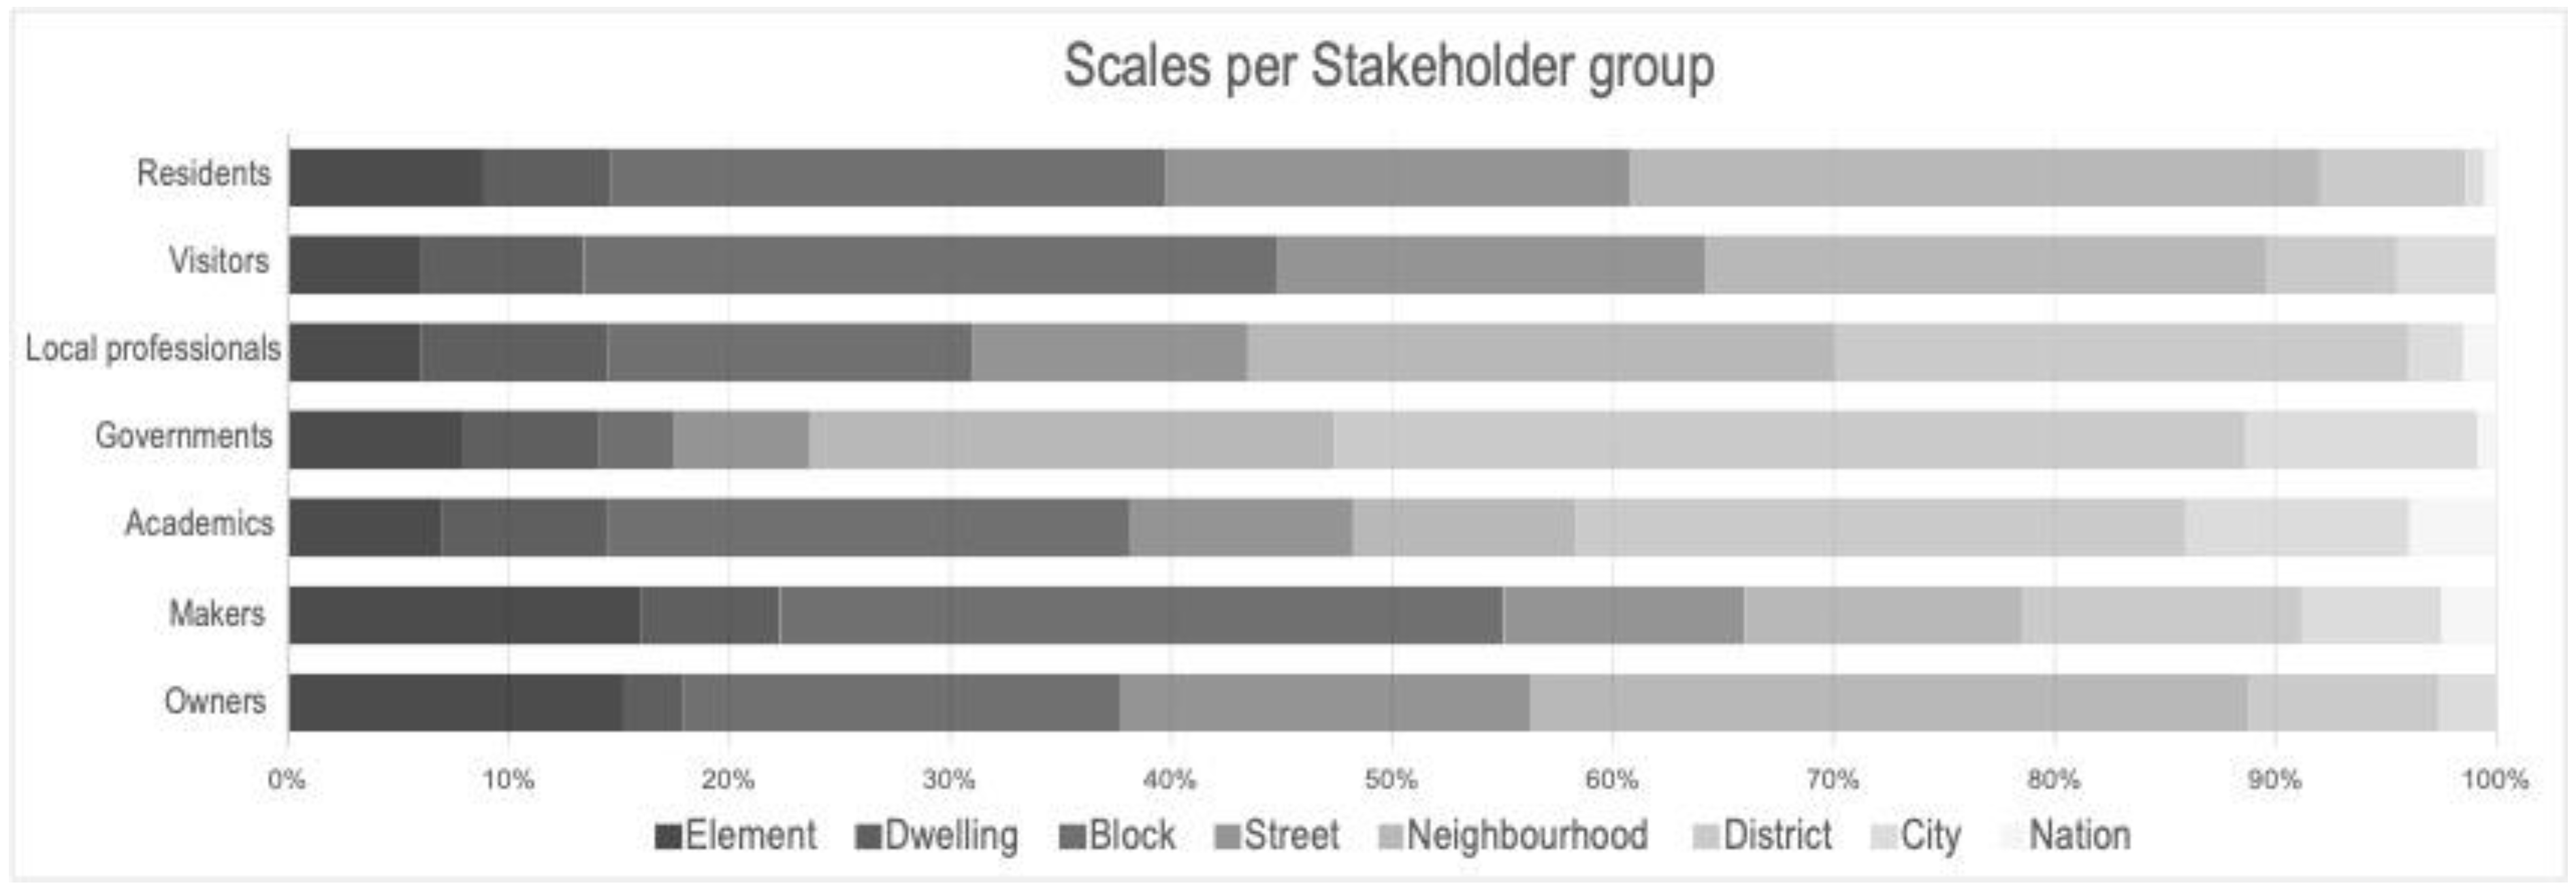
Figure 6 shows the scales at which stakeholder groups find attributes significant. The neighbourhood scale is the most mentioned overall and is well represented in all groups, while the national scale is hardly mentioned as significant. The block and district scales are among the frequently mentioned, but both show outliers, such as low score of governments on block scale and divisions between groups on district scale.
Corresponding to the ‘gravity point’ in the tables (
Appendix A), general observations are mentioned per group. This includes the quantitative proportions of more and less mentioned attributes and scale levels and their comparison to other groups (see
Figure 5 and
Figure 6). The qualitative data is presented in
Table 3, including a majority report and minority report per group. The majority report explains the dominant scale level and attribute, identified by the higher percentages, illustrated by quotes from the data. The minority report, presents deviating observations by individuals within the group, mentioning e.g., an alternative scale level or attribute category, also illustrating by quotes from the data.
As demonstrated by the relative spread of attributes (
Figure 5) and scales (
Figure 6), the stakeholder groups show clear differences in their focus in terms of significant attributes. Below is the description of the main findings for each group.
Residents show a relatively wider spread of attributes, but limited to the scale levels of block, street and neighbourhood. Within this diversity, a focus on appearance of the block and activity on neighbourhood level can be observed. However, the responses are very diverse and many ‘minority reports’ could be reported. Just a few are mentioned in
Table 3.
The responses of visitors clearly show a strong focus on the appearance on block level and on street level. Former residents, now visiting the area, report on deviating attributes.
The local professionals show a strong focus on collectivity and activity, especially if compared to other stakeholder groups. Their main focus regarding scale are the neighbourhood and district level. Generally, the local professionals show more attention for the intangible attributes (story, identity, collectivity, activity) and less for the tangible attributes (object, location, infra, spatial)
For the government responses, the identity on district level is a main focus in their assessment. It is remarkable that government officials often assess the neighbourhood (e.g., Hoptille) in relation to the larger district (H-Buurt or Bijlmer), identifying these scale levels as their main reference. Because the number of government respondents is low (two individuals), only corresponding attributes are reported and no minority reports.
The identity on district level is also a main focus for the academics. However, the attribute scale level combinations are quite diverse in this stakeholder group. Moreover, several academics have different points of attention, often reflecting their expertise and (mixed) profiles. This is expressed in the minority reports about e.g., architectural style or sustainability.
For the makers as a stakeholder group, responses show a strong focus on spatial quality, mainly on the block level but also mentioned on other scale levels. The focus on spatial quality is aligned with the profession of the architects and planners in this stakeholder group. The minority reports include, for example, stories about the design ideas and social conditions in the creation of the residential blocks in this neighbourhood.
A general observation on aggregate results of responses by owners is the focus on identity on a neighbourhood level as a dominant attribute-scale combination. The minority reports address e.g., social, or architectural aspects, relating to the specific profession of the respondents, that are all professionals working for a housing corporation.
5. Discussion
Based on the research results, six propositions are formulated, presenting main observations. They are discussed in relation to the concepts explained in the theorical framework.
5.1. Residents Have a Broader View on Attributes
For residents, a wider range of attribute categories matters, but this broad interpretation of attributes applies to a small physical scope (block, street, neighbourhood). This result correspondents to previous research in Almere, comparing several participatory pilots [
31]. The district level, in this case Bijlmermeer/ Amsterdam Zuidoost, appears no relevant scale level for residents. However, for many other groups e.g., government, makers, and academics, the district level is an important scale level. Referring to the aforementioned common categorisation of professionals and community, the observed difference in both attributes and scale level is important. The ‘actors with power’ or decision-making stakeholders, as categorised by Veldpaus [
11], have a certain focus, which does not represent the important attributes for residents. If community participation is the goal, expanding the scope of the attributes should be considered to match the groups one wants to involve. Referring to Howard: ‘The idea that there are specific groups who are heritage-conscious and others who are not is usually a result of defining heritage too narrowly’ [
12]. The residents’ broad view of attributes might relate to the size and plurality of this group. Also in the sample for this study, residents were the largest group (49%). Differentiation of groups of residents as e.g., studied by Ennen [
13] and Garrow [
14] is relevant, as this group is large, diverse and often represents long term users of a neighbourhood. How personal aspects, like age, social-economic background, or residential history, play a role in assessing heritage significance of neighbourhood attributes was not included in this research. Future research could surely provide an even more detailed insight into individual assessments and similarities or deviations. Also, alternative groups could be studied, referring to e.g., the ‘future stakeholder’ as mentioned by Mason.
5.2. Respondents with Mixed Profiles See More
In many cases, the minority report reflects the view of respondents with a mixed profile (e.g., designer and former resident or academic and government employee). Participants with a plural relation to the neighbourhood seem to have a broader scope and ‘see more’. This goes beyond the existence of subgroups but introduces mix-groups. Participation of individuals with multiple profiles could be considered an opportunity as they represent more viewpoints and groups. Even if a mixed profile assumes an internal conflict of interests, illustrated by Howard as ‘the archaeologist who would seek to protect a stone circle from the hands of tourists, for purposes of research, is not necessarily beyond being a tourist elsewhere, or even being a druid at the weekend’ [
12] these individuals have proven to convey a richer understanding of the interests at stake and may therefore be able to better understand and interpret the positions of other groups. However, more research is needed to find out how these capacities can be utilised to the benefit of participatory heritage processes.
More generally, the complexity of respondents’ profiles and related opinions questions the accuracy of categorizing stakeholders into groups. In their study about classification and its consequences, Bowker and Star recognise classification as a ‘balancing act’. They address the importance of being sensitive to exclusions as residual categories to assign views that would otherwise remain invisible [
32]. Although in some groups, like the academics and residents, we have observed more individual deviation from the aggregate opinion, many minority reports could be found in all groups. Being sensitive to exclusions, means that only quantitative studies and aggregate opinions cannot capture the different interpretations that can exist within any given neighbourhood and do not offer enough explanation of the reasons why and the processes by which individuals develop bonds with their environment [
14]. As stated by Ennen, ‘Heritage is interpretation. Every story is one story. Although different stories may complement one another they may also contradict each other.’ [
13].
5.3. Tangible Is Small, Intangible Is Large
The aggregate results of all respondents seem to show a ‘diagonal’ in attribute-scale level combinations (see the first table ‘total sample’ in the
Appendix A, also visible in
Figure 4). On smaller scale levels (dwelling, block), the physical/ tangible attributes like objects or spatial quality are addressed. On a larger scale (district, city), more intangible attributes like identity or story are mentioned. This confirms, on the one hand, the observations of Coolen, who applied the means-end theory to housing as a more complex product, that respondents mention a multitude of physical and intangible attributes at various scales [
16]. However, he does not mention the dependence of physical attributes on small scale and intangible attributes on large scale. Looking at the taxonomy of attributes by Veldpaus [
11], the physical attributes are categorised in an ascending scale level, from building element (small) to landscape (large). The intangible attributes do not refer to scales. So, although the distinction between tangible and intangible attributes is widely acknowledged, their relation to scale levels would need more research.
Over all, the intangible attribute ‘identity’ emerges as the most important attribute category. This result could be related to the applied photo-elicitation method but could also be related to this specific 1980′s Dutch case study, as the Bijlmer was known first, as a ‘innovative and utopian neighbourhood’, and later as a ‘problem neighbourhood’. Further research with a larger sample of stakeholders and/or different neighbourhoods can investigate whether these results are specific to this neighbourhood, or if the theoretical framework and categories have further general validity.
5.4. Residents and Visitors Are Opposites
The results show that visitors have a very narrow view on attributes, with a dominant focus on appearance. This is different for the residents who on the contrary mention a wider range of attributes. The diverging interests between residents and visitors, or insiders and outsiders, confirms the theory on heritage interests by Howard [
12]. Our data does not show a focus on accessibility by visitors, probably related to the fact that our case study is not a protected heritage site, but the focus on activities, ‘ordinary things’ and personal memories by residents is clear. Although the different interests are clear from the theory, in practice both groups are included in ‘civil society’ or ‘community’, as are referenced in inter-governmental conventions as UNESCO and the European Faro Convention. The clear difference between these groups, regarding attribute priorities, indicates the need for more differentiation of catch-all terms like civil society or community that are used. In the identification of heritage qualities, rather than classification by role or power over the decision-making process, opinions should be the principle behind formation of stakeholder groups.
5.5. Academics Are Not a Group
In their responses, academics show a wide spread across scale levels and attribute categories. This applies to the aggregate results and becomes even more evident in the individual responses. Many individual academics have a specific focus but differ from each other, relating to their expertise of research (i.e., sociology, history, architecture). This is aligned with the notion by Veldpaus distinguishing different types of experts, ranging from international, national or subnational levels, from policy, practice or academia, and from various disciplines [
11]. Apart from their variety in expertise, Howard states that ‘academics rarely perceive themselves as a market, preferring the self-perception of the disinterested observer, merely studying heritage objects for the sake of scholarship’. He also points to the inaccessibility and limited reach of academic publications due to their often very knowledgeable but also very narrow approach to topics and opinions [
12].
5.6. Makers Are a New Group
In this study, makers, an added group to the heritage markets as defined by Howard, show a focus on spatial qualities spread across all scales, with the building being dominant as a scale level. In previous research in the Dutch new town Almere, we found that makers focused mainly on infrastructure and landscape as areas of heritage significance [
31]. Makers were introduced in this research as a stakeholder group, including architects and urban designers involved in the original design of the neighbourhood. This group is not mentioned in present theory about heritage evaluation. However, dealing with young heritage, this new stakeholder group could be acknowledged as influential. Increasingly, the professionals who were involved in the creation of buildings and areas that now become heritage, or ‘founding fathers’ are still alive. They often have deep knowledge of the original intentions and historical developments, and in some cases, they will claim legal authorship/copyright. Explorations in practice show that the issue regarding architects’ copyright in renovations is highly relevant, especially now that the emphasis in construction is increasingly on renovations of existing buildings and areas. While there are laws and guidelines on copyright and involving original makers, additional renovation protocols are mentioned, such as a value assessment of the existing property [
33]. However, the legal position of makers is not the only perspective in dealing with new heritage. Given the tendency to consider younger stock as heritage, more research for this stakeholder group is needed.
6. Conclusions
In this research the main aim was to reveal and discuss potential differentiation of stakeholders, based on the assessment of the heritage significance of a Dutch neighbourhood. In order to anticipate shared interests or potential conflicts in identification and management of neighbourhood attributes in renovation and development processes, this research contributed to a better understanding of the stakeholders and groups involved. By applying heritage assessment methods to an unlisted/ unprotected neighbourhood, we set the context to find everyday attributes and their significance for stakeholders. Results reveal that the position of stakeholders matters in their assessment of attributes, referring to their profession or role, observing important differences between the stakeholder groups’ interest in the attribute category and the scale level they focus on. Residents e.g., have a wide scope on attributes (tangible and intangible ones) but on a limited scale level (block, street, neighbourhood), whereas visitors or makers show priority for one specific attribute category (respectively appearance and spatial attributes) on one scale level (block). By comparing the aggregate results per stakeholder group with the individual responses, we found ‘minority reports’ within all groups. Moreover, many minority opinions were expressed by respondents with a mixed profile, so individuals belonging to more than one group.
The findings show that there are clear differences between and within groups, which makes it relevant to further differentiate commonly used terms like community, civil society, experts etc. When participation is a goal or even a duty in processes concerning heritage and the built environment, the identification of different stakeholder interests is important to invite the right and relevant groups to the ‘participation table’. Especially in the context of broadening heritage values and multiplicity of actors, this is relevant to avoid a mismatch between perceived significance and formal decision-making on designation. Information on stakeholder interests increases support and thus the speed of development processes. The recognition that individuals within assumed groups do not necessarily share the same views, points out the need for identification and categorisation based on interests, rather than role, position, or power.
The main contribution of this paper is the new knowledge on the diversity between stakeholders on what attributes in their neighbourhoods they convey significance, resultant from a detailed comparative analysis of interviews using photo-elicitation. On the one hand, the results confirm earlier conclusions in existing literature on differences between stakeholder groups. However, especially the definition of groups and the differences between individuals within groups became more evident, through the distinction made between majority and minority reports, but are insufficiently described in the existing literature. Therefore, the results of this paper call for the acknowledgement of more precise differentiation between stakeholder groups and within groups, based on their significance assessment of neighbourhood attributes. By conducting the research in an ordinary neighbourhood, using theories and methods common in heritage studies, this study sets an example for a European ‘renovation wave’, to first identify the significance of neighbourhoods to prevent its conservation, while decarbonizing the built environment in upcoming renovations. Further research is needed to test the propositions in this paper. Moreover, parties involved in heritage identification and designation or in neighbourhood renovations have a task of considering how differentiated opinions of stakeholders and individuals can be incorporated into sustainable heritage development and decision-making processes.
Author Contributions
Conceptualization, methodology, software, validation, formal analysis, investigation, resources, data curation, writing—original draft preparation, visualization, project administration, funding acquisition: L.S.; Supervision: D.C., A.P.R., W.d.J.; Writing—review and editing: L.S., D.C., A.P.R., W.d.J. All authors have read and agreed to the published version of the manuscript.
Funding
The researchers have received a financial contribution from Ymere housing corporation. This concerns a contribution to fundamental research where the data are available to both parties. The authors declare that they have no known competing financial interests or personal relationships that could influence the work in this article.
Informed Consent Statement
Respondents have given their consent to participate in the research project, and in case the interview was recorded, consent for recording was also included in the video. The data and quotes in this paper have been anonymised and do not contain any retrievable personal information.
Data Availability Statement
The anonymised version of the dataset used in the study is accessible and can be inquired from the authors upon request.
Acknowledgments
A group of MSc students from the graduation studio ‘New Heritage’ (autumn semester 2020) at Delft University of Technology conducted the interviews. The authors are grateful to the respondents for their contribution, willing to give their time and share their views.
Conflicts of Interest
The authors declare no conflict of interest.
Appendix A
Tables presenting the results per stakeholder group.
Table logic: rows show attribute categories and columns show scale levels. The cells show the percentage of the total quotations of this combination.
Table A1.
Total sample: 59 respondents.
Table A1.
Total sample: 59 respondents.
| | Element | Dwelling | Block | Street | Neighbourhood | District | City | Nation |
|---|
| Story/Memory | 0% | 0% | 1% | 0% | 2% | 2% | 1% | 0% |
| Identity | 1% | 1% | 3% | 2% | 6% | 5% | 2% | 1% |
| Collectivity | 1% | 1% | 1% | 1% | 3% | 2% | 1% | 0% |
| Activity | 1% | 0% | 2% | 2% | 4% | 3% | 1% | 0% |
| Appearance | 3% | 0% |
7%
| 3% | 2% | 1% | 0% | 0% |
| Comfort | 1% | 1% | 1% | 1% | 1% | 1% | 0% | 0% |
| Spatial | 2% | 2% | 5% | 3% | 3% | 2% | 0% | 0% |
| Infra/ Route | 1% | 0% | 1% | 1% | 1% | 2% | 0% | 0% |
| Location | 0% | 0% | 0% | 0% | 1% | 0% | 0% | 0% |
| Object | 2% | 0% | 2% | 1% | 0% | 0% | 0% | 0% |
Table A2.
Residents: 29 respondents.
Table A2.
Residents: 29 respondents.
| | Element | Dwelling | Block | Street | Neighb | District | City | Nation |
|---|
| Story/Memory | 0% | 0% | 0% | 0% | 1% | 0% | 0% | 0% |
| Identity | 1% | 1% | 4% | 3% | 7% | 1% | 0% | 0% |
| Collectivity | 0% | 0% | 1% | 1% | 2% | 1% | 0% | 0% |
| Activity | 1% | 1% | 2% | 4% | 9% | 1% | 1% | 0% |
| Appearance | 1% | 1% |
10%
| 5% | 5% | 1% | 0% | 0% |
| Comfort | 0% | 2% | 1% | 1% | 1% | 1% | 0% | 0% |
| Spatial | 2% | 2% | 3% | 4% | 3% | 1% | 0% | 0% |
| Infra/Route | 0% | 1% | 1% | 2% | 1% | 1% | 0% | 0% |
| Location | 0% | 0% | 0% | 0% | 0% | 1% | 0% | 0% |
| Object | 3% | 0% | 3% | 2% | 1% | 0% | 0% | 0% |
Table A3.
Visitors: seven respondents.
Table A3.
Visitors: seven respondents.
| | Element | Dwelling | Block | Street | Neighb | District | City | Nation |
|---|
| Story/Memory | 0% | 0% | 1% | 0% | 1% | 1% | 0% | 0% |
| Identity | 0% | 0% | 0% | 1% | 9% | 1% | 3% | 0% |
| Collectivity | 1% | 0% | 1% | 1% | 3% | 0% | 0% | 0% |
| Activity | 0% | 0% | 0% | 1% | 3% | 1% | 1% | 0% |
| Appearance | 3% | 1% |
24%
| 13% | 3% | 0% | 0% | 0% |
| Comfort | 0% | 1% | 0% | 0% | 1% | 0% | 0% | 0% |
| Spatial | 1% | 4% | 3% | 1% | 3% | 0% | 0% | 0% |
| Infra/Route | 0% | 0% | 0% | 0% | 1% | 1% | 0% | 0% |
| Location | 0% | 0% | 0% | 0% | 0% | 0% | 0% | 0% |
| Object | 0% | 0% | 1% | 0% | 0% | 0% | 0% | 0% |
Table A4.
Local professionals: seven respondents.
Table A4.
Local professionals: seven respondents.
| | Element | Dwelling | Block | Street | Neighb | District | City | Nation |
|---|
| Story/Memory | 1% | 1% | 0% | 0% | 3% | 3% | 0% | 0% |
| Identity | 0% | 1% | 4% | 2% | 3% | 5% | 0% | 1% |
| Collectivity | 0% | 2% | 2% | 0% |
9%
| 5% | 1% | 0% |
| Activity | 1% | 1% | 2% | 2% | 7% | 8% | 1% | 0% |
| Appearance | 4% | 1% | 7% | 5% | 2% | 1% | 1% | 0% |
| Comfort | 1% | 1% | 1% | 1% | 1% | 0% | 0% | 0% |
| Spatial | 0% | 3% | 1% | 2% | 2% | 1% | 1% | 1% |
| Infra/Route | 0% | 0% | 0% | 1% | 1% | 3% | 0% | 1% |
| Location | 0% | 0% | 1% | 0% | 1% | 1% | 1% | 0% |
| Object | 0% | 1% | 1% | 2% | 1% | 1% | 0% | 0% |
Table A5.
Governments: two respondents.
Table A5.
Governments: two respondents.
| | Element | Dwelling | Block | Street | Neighb | District | City | Nation |
|---|
| Story/Memory | 0% | 0% | 0% | 0% | 3% | 2% | 2% | 0% |
| Identity | 0% | 3% | 0% | 0% | 4% |
11%
| 4% | 0% |
| Collectivity | 1% | 0% | 1% | 1% | 4% | 4% | 2% | 0% |
| Activity | 1% | 0% | 0% | 2% | 4% | 6% | 1% | 0% |
| Appearance | 3% | 0% | 0% | 1% | 0% | 2% | 1% | 0% |
| Comfort | 1% | 2% | 3% | 1% | 1% | 4% | 1% | 1% |
| Spatial | 0% | 2% | 0% | 1% | 4% | 4% | 0% | 0% |
| Infra/Route | 1% | 0% | 0% | 0% | 2% | 6% | 0% | 0% |
| Location | 0% | 0% | 0% | 0% | 3% | 1% | 0% | 0% |
| Object | 2% | 0% | 0% | 1% | 0% | 1% | 0% | 0% |
Table A6.
Academics: five respondents.
Table A6.
Academics: five respondents.
| | Element | Dwelling | Block | Street | Neighb | District | City | Nation |
|---|
| Story/Memory | 0% | 0% | 1% | 0% | 1% | 2% | 2% | 1% |
| Identity | 1% | 1% | 5% | 1% | 4% |
10%
| 4% | 2% |
| Collectivity | 1% | 1% | 1% | 1% | 3% | 4% | 2% | 0% |
| Activity | 0% | 0% | 1% | 0% | 0% | 4% | 0% | 0% |
| Appearance | 1% | 0% | 4% | 0% | 0% | 0% | 0% | 0% |
| Comfort | 0% | 1% | 1% | 2% | 0% | 1% | 0% | 0% |
| Spatial | 1% | 4% | 7% | 4% | 3% | 5% | 1% | 0% |
| Infra/ Route | 1% | 0% | 1% | 2% | 0% | 1% | 1% | 0% |
| Location | 0% | 0% | 0% | 0% | 0% | 0% | 0% | 0% |
| Object | 1% | 0% | 2% | 0% | 0% | 0% | 0% | 0% |
Table A7.
Makers: four respondents.
Table A7.
Makers: four respondents.
| | Element | Dwelling | Block | Street | Neighb | District | City | Nation |
|---|
| Story/Memory | 2% | 0% | 5% | 0% | 2% | 4% | 1% | 1% |
| Identity | 2% | 2% | 3% | 1% | 3% | 3% | 3% | 1% |
| Collectivity | 0% | 0% | 0% | 0% | 2% | 1% | 0% | 0% |
| Activity | 0% | 0% | 1% | 1% | 1% | 0% | 0% | 0% |
| Appearance | 4% | 0% | 3% | 0% | 0% | 0% | 0% | 0% |
| Comfort | 1% | 1% | 2% | 1% | 0% | 0% | 0% | 0% |
| Spatial | 3% | 2% |
14%
| 5% | 3% | 3% | 0% | 0% |
| Infra/Route | 0% | 0% | 1% | 1% | 0% | 0% | 0% | 0% |
| Location | 0% | 0% | 1% | 0% | 0% | 0% | 0% | 0% |
| Object | 3% | 0% | 3% | 0% | 0% | 0% | 0% | 0% |
Table A8.
Owners: five respondents.
Table A8.
Owners: five respondents.
| | Element | Dwelling | Block | Street | Neighb | District | City | Nation |
|---|
| Story/Memory | 0% | 0% | 1% | 1% | 1% | 1% | 1% | 0% |
| Identity | 1% | 1% | 3% | 3% |
13%
| 2% | 1% | 0% |
| Collectivity | 1% | 0% | 3% | 0% | 3% | 2% | 1% | 0% |
| Activity | 1% | 0% | 3% | 3% | 4% | 1% | 1% | 0% |
| Appearance | 5% | 1% | 4% | 5% | 3% | 0% | 0% | 0% |
| Comfort | 3% | 1% | 2% | 2% | 3% | 1% | 0% | 0% |
| Spatial | 1% | 0% | 2% | 4% | 3% | 1% | 0% | 0% |
| Infra/ Route | 1% | 0% | 2% | 1% | 1% | 1% | 0% | 0% |
| Location | 0% | 0% | 0% | 0% | 3% | 0% | 0% | 0% |
| Object | 1% | 0% | 1% | 0% | 1% | 1% | 0% | 0% |
References
- Ministry of BZK. Informatieblad Participatie in de Omgevingswet—Wat Regelt de Wet? Ministerie van Binnenlandse Zaken en Koninkrijksrelaties: The Hague, The Netherlands, 2021. [Google Scholar]
- European Commission. A Renovation Wave for Europe—Greening Our Buildings, Creating Jobs, Improving Lives; European Commission: Brussels, Belgium, 2020. [Google Scholar]
- Federal Office of Culture. Davos Declaration, Towards a High-Quality Baukultur for Europe; Federal Office of Culture: Bern, Switzerland, 2018. [Google Scholar]
- Council-of-Europe. Council of Europe Framework Convention on the Value of Cultural Heritage for Society; Council of Europe: Faro, Portugal, 2005. [Google Scholar]
- Li, J.; Krishnamurthy, S.; Pereira Roders, A.; van Wesemael, P. Community participation in cultural heritage management: A systematic literature review comparing Chinese and international practices. JCIT Cities 2020, 96, 102476. [Google Scholar] [CrossRef]
- Rosetti, I.; Cabral, C.B.; Pereira-Roders, A.; Jacobs, M.; Albuquerque, R. Heritage and Sustainability: Regulating Participation. Sustainability 2022, 14, 1674. [Google Scholar] [CrossRef]
- Labadi, S. Representations of the nation and cultural diversity in discourses on World Heritage. J. Soc. Archaeol. 2007, 7, 147–170. [Google Scholar] [CrossRef]
- Spoormans, L.; Pereira-Roders, A. Methods in assessing the values of architecture in residential neighbourhoods. IJBPA Int. J. Build. Pathol. Adapt. 2021, 39, 490–505. [Google Scholar] [CrossRef]
- UNESCO. Recommendation on the Historic Urban Landscape; United Nations Educational, Scientific and Cultural Organization: Paris, France, 2011. [Google Scholar]
- Mason, R. Assessing Values in Conservation Planning: Methodological Issues and Choices. Assess. Values Cult. Herit. 2002, 1, 5–30. [Google Scholar]
- Veldpaus, L. Historic Urban Landscapes: Framing the Integration of Urban and Heritage Planning in Multilevel Governance. Ph.D. Thesis, Technische Universiteit Eindhoven, Eindhoven, The Netherlands, 2015. [Google Scholar]
- Howard, P. Heritage—Management, Interpretation, Identity; Continuum: London, UK, 2003. [Google Scholar]
- Ennen, E. Heritage in Fragments, The Meaning of Pasts for City Centre Residents. Ph.D. Thesis, Rijksuniversiteit Groningen, Groningen, The Netherlands, 1999. [Google Scholar]
- Garrow, H. Living in and Loving Leith—Using ethnography to explore place attachment and identity processes. In People-centred Methodologies for Heritage Conservation: Exploring Emotional Attachments to Historic Urban Places; Rebecca Madgin, L.J., Ed.; Routledge: London, UK, 2021. [Google Scholar]
- Spoormans, L.; Pereira Roders, A.; Czischke, D.; de Jonge, W. ‘What I Love about my Neighbourhood’: Towards a Method to Include Unheard Voices and Unseen Architecture in the Heritage Domain; TU Delft: Delft, The Netherlands, 2021. [Google Scholar]
- Coolen, H.; Hoekstra, J. Values as determinants of preferences for housing attributes. J. Hous. Built Environ. 2001, 16, 285–306. [Google Scholar] [CrossRef]
- Small, M. ‘How many cases do I need?’ On science and the logic of case selection in field-based research. Ethnography 2009, 10, 34. [Google Scholar] [CrossRef]
- Wassenberg, F. Large Housing Estates: Ideas, Rise, Fall and Recovery the Bijlmermeer and Beyond; TU Delft: Delft, The Netherlands, 2013. [Google Scholar]
- Horst, J.T.; Meyer, H.; de Vries, A. Sleutelen aan de Bijlmer: Interpretaties; Publikatieburo, Faculteit der Bouwkunde, TU Delft: Delft, The Netherlands, 1991. [Google Scholar]
- Somer, K. Groei, Verandering, Differentiatie. Architectuur in Nederland 1965–1990; Rijksdienst voor het Cultureel Erfgoed: Amersfoort, The Netherlands, 2020. [Google Scholar]
- Blom, A.; Snijders, A.; van der Peet, C.; Koper-Mosterd, D.; Alkemade, F.; Burgers, I.; Somer, K.; van Thoor, M.; Lammers, S. Post 65: Inspirerende Bouwkunst, ons Wereldbeeld in de Architectuur van na 1965; Atelier Rijksbouwmeester: The Hague, The Netherlands, 2021. [Google Scholar]
- Harper, D. Talking about pictures: A case for photo elicitation. Vis. Stud. 2002, 17, 13–26. [Google Scholar] [CrossRef]
- Bijoux, D.J.M. Interviews, Solicited Diaries and Photography: ‘New’ Ways of Accessing Everyday Experiences of Place. Grad. J. Asia-Pac. Stud. 2006, 4, 44–64. [Google Scholar]
- Hennink, M.; Hutter, I.; Bailey, A. Qualitative Research Methods; SAGE Publications: London, UK, 2020. [Google Scholar]
- Saldaña, J. The Coding Manual for Qualitative Researchers; SAGE Publications: Los Angeles, CA, USA, 2009. [Google Scholar]
- Glaser, B.; Strauss, A. The Discovery of Grounded Theory, Strategies for Qualitative Research; Aldine Publishing Company: New Brunswick, NJ, USA, 1967. [Google Scholar]
- Groat, L.; Wang, D. Architectural Research Methods; Wiley: New York, NY, USA, 2002. [Google Scholar]
- Charmaz, K. Constructing Grounded Theory: A Practical Guide through Qualitative Analysis; Sage Publications: London, UK, 2006. [Google Scholar]
- Eisenhardt, K. Building Theories from Case Study Research. Acad. Manag. Rev. 1989, 14, 532–550. [Google Scholar] [CrossRef]
- Swanborn, P.G. Case-Study’s: Wat, Wanneer en Hoe? Boom: Amsterdam, The Netherlands, 1996. [Google Scholar]
- Spoormans, L.; Kaya, D.I. Almere Heritage Cube, An Assessment Framework for Participatory Heritage Valorisation in Almere; TU Eindhoven—TU Delft: Delft, The Netherlands, 2021. [Google Scholar]
- Bowker, G.C.; Star, S.L. Sorting Things Out: Classification and Its Consequences; MIT Press: Cambridge, MA, USA, 2000. [Google Scholar]
- Heeger, H. Verkenning Problematiek Auteursrecht Architecten bij Renovatie; TU Delft: Delft, The Netherlands, 2014. [Google Scholar]
| Disclaimer/Publisher’s Note: The statements, opinions and data contained in all publications are solely those of the individual author(s) and contributor(s) and not of MDPI and/or the editor(s). MDPI and/or the editor(s) disclaim responsibility for any injury to people or property resulting from any ideas, methods, instructions or products referred to in the content. |
© 2023 by the authors. Licensee MDPI, Basel, Switzerland. This article is an open access article distributed under the terms and conditions of the Creative Commons Attribution (CC BY) license (https://creativecommons.org/licenses/by/4.0/).


