Article

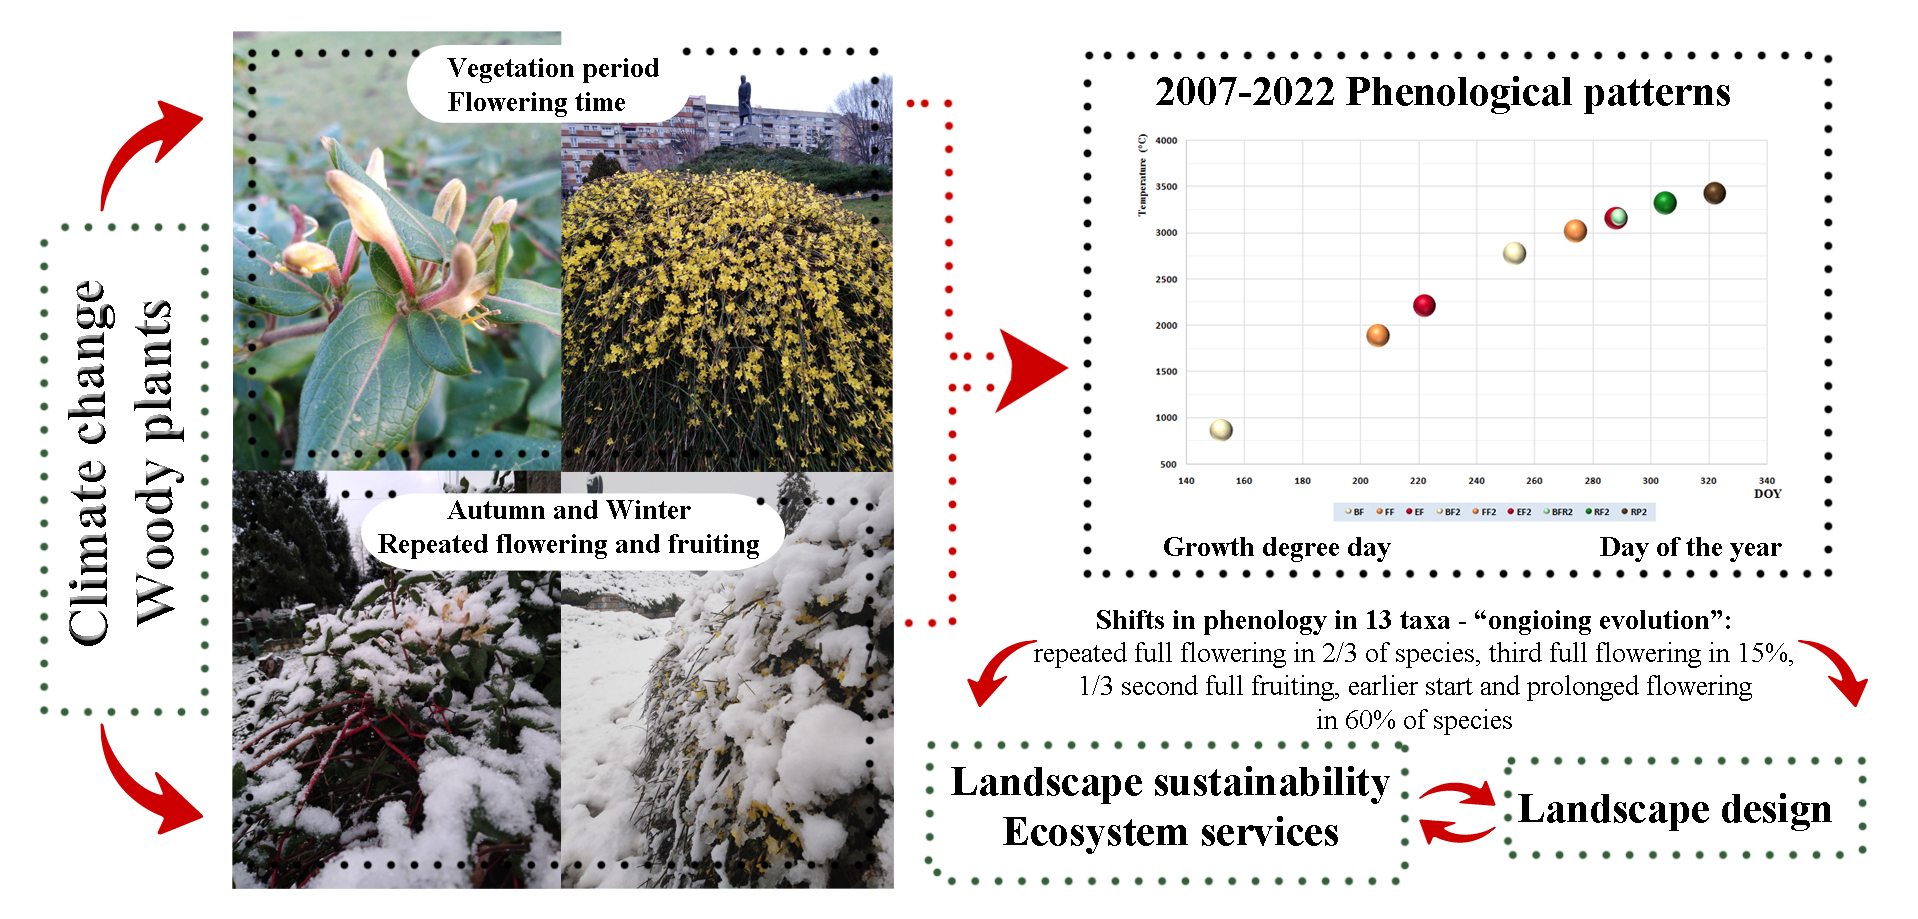
Phenological Flowering Patterns of Woody Plants in the Function of Landscape Design: Case Study Belgrade

1
University of Belgrade–Faculty of Forestry, Kneza Viseslava 1, 11030 Beograd, Serbia
2
BioSense Institute, University of Novi Sad, Dr Zorana Djindjića 1, 21000 Novi Sad, Serbia
*
Author to whom correspondence should be addressed.
Land 2023, 12(3), 706; https://doi.org/10.3390/land12030706
Submission received: 15 February 2023 / Revised: 12 March 2023 / Accepted: 15 March 2023 / Published: 18 March 2023

Abstract

:
The study focuses on describing key events in the flowering phenophases of woody taxa that promote practical landscape sustainability and design planning. Apart from the beginning of flowering, the full development and the duration of phenophases are important for landscape architecture, consumers, and pollination. The phenological patterns of 13 woody taxa were monitored for 16 years through 90,860 phenological observations from the BBCH scale for the period 2007–2022. Growing degree days were determined by combining phenological and climatic data and a linear trend was used to assess phenophase tendencies. Mann–Kendall and Sen’s slope tests and Spearman’s correlation coefficient were used to assess statistical significance. Shifts in flowering indicated warming trends, reflecting various changes in phenology. Early flowering taxa were affected the most, but plants shifted phenophases in both directions (earlier and later in the year). Repeated flowering (and occasionally fruiting) and even third flowering, as seen in 2022, can significantly affect biodiversity and lead to plant–pollinator asynchrony and changes in ecosystem functioning, ecological interaction, and landscape design. A list of native and introduced taxa and their adaptation mechanisms to climate change are provided and can be used for sustainable landscape design and nature-based solutions in landscape architecture.

Graphical Abstract

1. Introduction

Ecology and geography, as well as landscape science (including landscape design and planning), should play an important role in sustainability research and practice and focus on regional and local problem solving. At the landscape level, it is easiest to link ecology to landscape architecture and its practice, linking ecological processes, nature, and the urban environment, as well as ecosystem services [1,2,3]. For ecosystem services to be sustainable, it is crucial to understand how we need to design, conserve, and manage landscapes [4]. Understanding and organizing natural, economic, social, and cultural spaces, as well as the very integration of human–environment interactions (which are linked to local processes), are very important to achieve long-term sustainability and environmental stability [5,6,7]. Climate changes, as well as the consequences they cause, have a major impact on sustainable development and quality of life, so it is very important to connect science and practice in order to improve the environment. Global environmental change can be tracked through shifts in phenology that further influence both individual species and ecosystems [8]. One of the major ecological problems is the application of phenological observations in the function of landscape design, landscape sustainability, and ecosystem services. Comparison of phenological patterns and liaison between the occurrence of second and even third flowering in the same vegetative season and the fruiting in autumn and at the beginning of winter is detrimental to plant taxa due to the asynchrony between the plants and the pollinators.
Given that changes in the phenophases of woody plants are observed in different parts of the world [9], the recorded phenological observations and data obtained from this research can be implemented in the design of sustainable spaces not only locally but globally, in accordance with evident climate changes. The close relation to climate change reflects in changes in the timing and intensity of phenological flowering patterns, including plant growth, development, and animal behavior [10]. Phenology and phenophases help us design green spaces that are attractive all year round. Phenophases themselves are influenced by seasonal and climatic variations. An environment with green areas rich in ecological and spatial relations is visually stimulative and needs to develop and transform through the seasons. Several studies have confirmed a partial association between different flowering stages of ornamental taxa [11,12]. Therefore, it is very important to establish correlations between flowering events for predicting the behavior of plants under climate change conditions [13,14] and defining recommendations that will serve for operationalizing landscape design. Furthermore, green areas represent the habitats of many city animals and the flowering of the species is very important for pollinators and their developmental cycles as well as the functioning of organisms and ecosystems as a whole. Therefore, species’ coexistence and competition for resources are neatly linked to phenology and its shifts [15].
Phenological observations and recording of events are of great importance for all disciplines whose foci are ecological systems, as well as for policymakers for the protection of ecosystem services. Bearing in mind the need for holistic perspectives in sustainable urban development and the need to unify the concepts of different degrees of urbanization at the local and regional levels [16], the aim of this study was to determine the changes in phenological patterns of 13 taxa flowering over 16 years and their potential repercussions to ecosystem services and landscape sustainability and design. This research is an example of ‘ongoing evolution’ for woody taxa in a temperate continental climate and, following the revised method of heat accumulation [17], we study phenological patterns of flowering, not only at the beginning of the phenophase but during all the key elements denoted by the number of the day of the year (DOY).
Changes in the phenological patterns of flowering, i.e., the beginning, full development, and the end of flowering as well as its duration (the period between the first and last day of flowering), have ecological and economic impacts on natural and cultural landscapes [18,19]. There are many studies on the beginning of flowering of woody taxa [9,20,21,22,23], but the full development, the end, and the duration of flowering have not been researched in detail. These phases are key flowering events and have a direct impact on pollination and fruiting. Changes in the global environment are best reflected in the phenological shifts of species and ecosystems [8]. Prolonged flowering increases the chances of pollination [21,24] and thus extends the period of ornamentalism of taxa on landscape architectural objects. The appearance of the second flowering can also cause unsuccessful pollination in the first flowering phenophase [13,25]. From the point of view of landscape design, so far there is no evidence to prove whether second flowering events are characteristic of the taxon or are a consequence of specific abiotic and biotic conditions. Our research outlines the occurrence of the extreme climatic events in 2022 in Belgrade (especially the air temperatures) and their liaison to phenology in comparison to decade-and-a-half long observations of the same taxa.
Despite the numerous papers in this field, the relations between shifts in phenological patterns and other flowering events with climatic parameters and their repercussions on ecosystem services are still the focus of scientific research. One of the key ecosystem services related to the flowering phenophase is the provision of food for pollinators. Pollinators are of crucial importance for the ecosystem and landscape sustainability and, therefore, for humanity [26]. Plants, as the food for pollinators, are one of the most important drivers of the decrease in their number [27,28,29,30]. The positive influence of plants on the cycle of matter through the decomposition and deposition of various amounts of carbon and other nutrients in the soil is generally known [31,32,33,34]. Woody plants represent a very important element in the food chain and the circulation of matter. The nutrient cycle is strongly affected by phenological mismatch as it represents the environmental supply of building blocks for those dependent on nectar and pollen [35,36,37,38].
With shifts in the phenology of woody species and events, such as the emergence of insects that do not occur in synchronization, there is a disruption of biological and ecological relationships, such as a mismatch between insects as consumers and the flowering of woody plants. Changes in flowering period, length, and abundance, as well as nectar and pollen production, can disrupt interactions between plants, pollinators, herbivores, floral parasites, pests, and diseases [19]. An extended growing season, as well as other changes in phenology, can disrupt ecological interactions, such as germination, fruiting, and senescence. Repeated flowering leads to a reduced yield and exhaustion of the plant and, ultimately, a decrease in its resistance occurs. However, if species’ flowering periods overlap with those of pollinating animals, this can positively affect reproductive success and mutual services between the plant and insects as consumers as well as pollinators [26,39,40,41,42,43].
The phenology of plants is the link between pollinators and nutrients on the one hand and landscape sustainability and design on the other hand. Affirmation of the dominant influence of the temperature on the flowering phenophase would suggest that, with the increase of the frequency, intensity, and duration of climatic extremes, potential repercussions to ecosystem services such as biodiversity, pollination, fruiting, landscape sustainability, and design would be only some of the risks.

2. Materials and Methods

2.1. Study Area

The research area is 450 km2 in the territory of the city of Belgrade (Figure S1) Serbia, Southeastern Europe. Locations for phenological observations were chosen to be representative of the wider environment; primarily, the type of soil, the appearance and position of the terrain (Figure S1), and the orientation were taken into account based on the recommendations of WMO [10] and FHZ [44]. The criterion for setting up phenological stations was the coverage of city (urban) and suburban zones. The degree of urbanization was determined from the land cover/land use database, which is the result of the Copernicus Earth observation program (Urban Atlas https://land.copernicus.eu/local/urban-atlas/urban-atlas-2018, accessed on 27 February 2023), not taking into account urban green areas and sports fields. According to these criteria, phenological observation points were classified in the Belgrade or the Surčin group, i.e., climate data from GMS Belgrade or GMS Surčin were used in the analysis.
For the purposes of this study, 12 locations (Figure S1) were analyzed in the municipalities: Novi Beograd (Univerzijade Street 24, Novi Beograd, Ledine), Savski venac (Savska Street, Gazela Park, Vojvode Mišić Boulevard, Topčider Park), Stari Grad (Nikola Pašić Square, Pionir Park), Palilula (Beogradska Street, Tašmajdan Park), Vračar (Nebojšina Street, St. Sava’s Park), and Čukarica (Mirosavljeva Street, Banovo Brdo, Obrenovački Road, Ada Ciganlija, Vinogradski venac, Cerak, Savska Street, Ostružnica, and Street Ive Lola Ribara, Ostružnica). A further description of the study sites is included in Table S1. Supplementary Materials Figure S1a shows the degree of urbanization by municipality, including the territory where GMSs are positioned.

2.2. Data Acquisition

Based on the set phenological network, the direct observations were summarized in 2022 for short trees (4608), shrubs (81,184), and climbers (5068). After data homogenization and time series analysis, climatic parameters were used to quantify direct and indirect drivers of phenological changes.
Phenological data. The presented phenological data are the result of our own intensive phenological monitoring of 100 representative woody taxa of angiosperms in the study area in the period from 2007–2022, where the permanent recording of meteorological parameters is carried out. The case study includes a time series of 16 years of continuous records for 13 taxa (Table 1), where, in autumn and early winter 2022/23, we recorded repeated flowering or repeated flowering and fruiting.
Phenological observations were made visually on predetermined dates, at least twice weekly, always on the same days of the week (Table 1) for all the plants. Observers used a digital messaging system and dates were always recorded in the same format: month and day. Data evaluation of observation dates was made according to Koch et al. [45], where the data were automatically converted to the day of the year (e.g., 1 January = (DOY) 1, 16 January = (DOY) 16, 2 February = (DOY) 33, etc.) by acquisition software. An extended general BBCH scale was used, which is applicable for uniform coding of phenologically similar phases of all monocotyledonous and dicotyledonous plants for which a separate scale has not yet been defined [46,47]. Application of the mentioned system included the dates of: the formation of flower buds (FB), the beginning of flowering (BF), full flowering (FF), the end of flowering (EF), the beginning of fruit formation (BFR), the appearance of the first ripe fruits (RF), and the ripening of fruits (RP). The beginning of flowering is defined as the day when the first flowers open (<10%) on the greater part of the canopy, i.e., the first flowers on a larger number of inflorescences [48]. The full flowering date is the day when more than half of the flowers open (>50%). The flowering end date is the day when there are no more open flowers. The date of the beginning of fruit formation is the day when the first fruits appear. The date of the first ripe fruits is the day when the first ripe fruits appear (<10%). The fruit ripening date is the day when all the fruits have ripened [49].
Climate data. Data for the reference period 1991–2020, as well as older time series 1981–2010, 1971–2000, and 1961–1990 (according to the recommendation of the WMO due to the observed deviations compared with the referential period) and 2022 were taken from the Republic Hydrometeorological Service of Serbia (RHMZ) https://www.hidmet.gov.rs/index.php (accessed on 5 January 2023) collected from the 2 main meteorological stations: Belgrade (44°47’54.44”N; 20°27’53.35”EGr; 132 m altitude) and Surčin (airport) (44°49’27.37”N; 20°17’27.82”EGr; 99 m elevation). For locations 3, 4, 5, 6, 7, 8, and 12, data from the Belgrade station were used; for 1, 2, 9, 10, and 11, data from the Surčin (airport) station were used (Table 1 and Table S1).

2.3. Data Processing

For the purposes of this study, meteorological data were processed and displayed: (a) for months, years, and seasons and (b) so that the period boundaries included the day of the beginning and the day of the end of the phenophases. This kind of representation is necessary because the development of plants does not take place according to dates but is based on the accumulation of heat above a specific temperature threshold during all 24 h of the day [17]; namely, for the beginning of certain phenophases (beginning of flowering, full flowering, etc.), the sum of temperatures is decisive (although other factors such as the duration of the day and environmental stress factors can also contribute). To calculate growth degree days, it is necessary to determine the temperature threshold at which growth and development stop if the temperature drops below the threshold [17]. The vegetation period begins when enough heat accumulates and, for most plant taxa in moderately continental climates, the temperature threshold (Tt) is 5 °C or 10 °C [50]. In the Belgrade case study, a temperature threshold of 5°C was used according to WMO [10] and Lalić et al. [17]. In the study, the sum of degree days or accumulated growing degree days (GDD) was determined according to McMaster and Wilhelm [51]. The applied method is adequate, because degree days (DD) are more suitable than calendar days and they are determined based on the maximum (Tmax) and minimum (Tmin) temperature in one day and the temperature threshold or limit (Tt). When Tmin > Tt, the following formula was used:
D D = T m a x + T m i n 2 T t
When Tmax < Tt, then DD = 0.
In case Tmax > Tt > Tmin, the following formula was used:
where the coefficient is as follows:
ε = T m a x T m i n 2
and
R = T t T m i n T m a x T m i n
The value of the function f(R) is taken from the table in relation to R according to Lalić et al. [17]. The basic elements of this method are the temperature and the development of the plants, which are monitored mutually but also separately. From the temperature data, daily air temperatures and the sum of effective temperatures were used, which, according to Vučetić and Vučetić [52], is a good substitute for unknown amounts of received net insolation. For each taxon, the need for heat in specific phenophases (e.g., from the beginning of flowering to full flowering) can be determined by combining phenological and climatological data. The starting date from which the temperature sums are added depends on the taxon, but, in this study, the sums are added from January 1st because more taxa are analyzed for which the date or temperature sum is not precisely determined. GDD was determined by adding the active temperature sums of degree days (DD) from day to day until the beginning of a certain phase for each taxon in 2007. The procedure was repeated for each of the next 15 years, ending in 2022. Based on the sixteen-year sums, the mean values were determined, that is, the mean values of GDD for each observed phenophase. Basic statistical analysis includes descriptive statistics: mean, standard deviation, minimum, and maximum value. A linear trend was used to assess the tendency of phenophases [53,54] and the non-parametric Mann–Kendall test (Kendall’s tau) was used to assess statistical significance. The selected test, as recommended by the WMO, is suitable for assessing trends in the time series of environmental data because seasonal aspects are not represented in the data [55]. In this study, Mann–Kendall was used to analyze GDD and DOY for the observed phenophases of flowering in the period 2007–2022. Given that the Mann–Kendall test does not provide an estimate of the proportion of trends according to Diress and Bedada [54], the non-parametric Theil–Sen (Sen’s slope) method was also used to quantify the proportion (inclination) of the trend. The method calculates the median of all slopes determined for each set of data pairs (x,y) and gives an accurate confidence level regardless of the distribution (any monotonous trend can be estimated). If the slope is greater than 0, it means that the time series has an upward trend; if the slope is less than 0, it means that the time series has a decreasing trend. Spearman’s correlation coefficient (ρ) was also used in the study because it has a wider meaning than the linear correlation coefficient and shows whether there is any constantly increasing or constantly decreasing relationship between two variables (monotonous relationship). This coefficient does not require an assumption about the frequency distribution of the variables [56] and the value and preposition determine the strength and direction of the relationship. The range of ρ values is from −1 to 1. When interpreting the strength of the correlation, the following scale according to Horvat and Mijoč [57] was used: 0 (no correlation), 0–0.24 (very weak), 0.25–0.49 (weak), 0.50–0.74 (medium), 0.75–0.99 (strong to very strong), and 1 (complete). Only coefficients where there is a statistically significant correlation with a probability of p < 0.05 were interpreted.
The software packages XLSTAT 2020, STATISTICA 10, and ArcGIS/ArcMap 10.3 were used for data processing.

3. Results

3.1. Chronology of Climate Data

Descriptive statistics such as mean values and sums, mean monthly air temperatures, mean monthly maximum air temperatures, mean monthly minimum air temperatures, mean monthly relative humidity, mean and monthly precipitation, mean and monthly insolation, average number and the number of days with the amount of precipitation ≥ 0.1 mm, and the average number of days with the amount of precipitation ≥ 1.0 mm were calculated on a monthly and annual level for the reference period, older time series, and 2022, for stations Belgrade and Surčin (Supplementary Materials Tables S2 and S3).
The mean annual air temperature for the period 1991–2020 was 13.2 °C and 14.5 °C for 2022 for the Belgrade station (Table S2) and 12.5 °C and 13.8 °C for Surčin (Table S3). A comparative analysis of the aforementioned data shows an increase in average annual air temperatures in relation to earlier time series, which in relation to the period 1961–1990 for Belgrade is 1.3 °C and for Surčin is 1.2 °C, while in 2022 they were higher by 2.6 °C and 2.5 °C, respectively. The annual amount of precipitation for the Belgrade station for the referential period compared with the oldest time series was higher by 14.4 mm and, in 2022, a smaller amount of precipitation was recorded compared with the referential period by 59.1 mm, i.e., 44.7 mm compared with 1961–1990. We found a decrease in the number of days with precipitation ≥ 1.0 mm for 4.3 days of the referential period compared with 1961–1990 and for 10 days in 2022 compared with the referential period and 14.3 compared with 1961–1990. The annual amount of precipitation for the Surčin station for the referential period compared with the oldest time series was lower by 15.2 mm and, in 2022, a higher amount of precipitation was recorded compared with the referential period by 21.3 mm and 6.1 mm compared with 1961–1990. The decrease in the number of days with precipitation ≥ 1.0 mm was 2.5 days (referential period compared with 1961–1990), 14.9 days (2022 compared with the referential period), and 17.4 (2022 compared with 1961–1990). The average monthly sunshine duration increased by 158.4 h (referential period compared with 1961–1990) and by 413.5 h in 2022 compared with the oldest time series for Belgrade. For Surčin, the values were higher by 155.2 h. (Note: The referential period was compared with the time series 1971–2000 because the sunshine duration at Surčin station was not recorded in the previous time series. In addition, it was not possible to compare 2022 with the older time series because data from May to December 2022 were missing.)
If the period 1991–2020 was observed in relation to 1961–1991, the temperatures were 1.5 °C higher, but, looking at the previous year, it was noticeable that the temperature rose by 2.5 °C (Belgrade) and 2.6 °C (Surčin).
For the same climate variables in 2022 and time series for the Belgrade and Surčin stations, Table S4 shows data by season.
A comparative analysis of the data from Supplementary Materials Table S4 shows an increase in the mean seasonal air temperatures of the referential period in relation to earlier time series and in relation to the period 1961–1990 for Belgrade 1.2 °C (spring), 2.2 °C (summer), 0.9 °C (autumn), and 1.0 °C (winter) and for Surčin 1.1 °C (spring), 1.9 °C (summer), 0.9 °C (autumn), and 1.1 °C (winter). Average seasonal temperatures varied depending on the season, so compared with the referential period for spring, they were lower for both stations and significantly higher for winter, summer, and autumn. However, by comparing 2022 with the period 1961–1990, an increase in average temperatures was recorded, namely for Belgrade 1.0 °C (spring), 4.2 °C (summer), 1.8 °C (autumn), and 2.3 °C (winter) and for Surčin 0.9 °C (spring), 3.6 °C (summer), 1.8°C (autumn), and 3.0 °C (winter). Seasonal amounts of precipitation for the Belgrade station for the referential period compared with the oldest time series were lower during spring (by 6.5 mm) and winter (by 2.9 mm) and higher during summer (9.1 mm) and autumn (16.8 mm), while for Surčin they were lower during spring (3.6 mm) and summer (by 27.6 mm) and higher during autumn (by 12.3 mm) and winter (by 4.2 mm). Seasonal amounts of precipitation for the Belgrade station for 2022 compared with the referential period were lower during spring (by 49.7 mm) and summer (20.3 mm) and higher during autumn (13.1 mm) and winter (by 77.7 mm), while for Surčin they were lower during spring (42.5 mm) and summer (by 12.8 mm) and higher during autumn (by 88.1 mm) and winter (by 44.4 mm). The number of days with precipitation ≥ 1.0 mm was lower during spring (2.1), summer (1.1), and winter (1), while during autumn it was identical in the comparison of the referential period and 1961–1990 for Belgrade; for Surčin it was lower during spring (1.8) and summer (1.9) and higher during autumn (0.6) and winter (0.7). The same number of days for the Belgrade station for 2022 compared with the referential period was lower during spring (4.8) and summer (8.3) and higher during autumn (1.4) and winter (6.6) and Surčin with lower values of 5.3 (spring) and 6.6 (summer) and higher values of 1.4 (autumn) and 3.2 (winter). The average monthly sunshine duration increased (referential period and 1961–1990) for Belgrade 60.5 h (spring), 56.8 h (summer), 14.6 h (autumn), and 29.9 h (winter) and for Surčin 42.5 h (spring), 76.4 h (summer), 24.2 h (autumn), and 12.4 h (winter). For Surčin, the referential period was compared with the time series 1971–2000, since the sunshine duration at the Surčin station was not recorded in the previous time series and for 2022 it was not shown due to the missing data. In the comparison of 2022 with the oldest displayed time series, the sunshine duration for Belgrade was lower by 8.8 h during autumn and higher by 175 h (spring), 125.3 h (summer), and 84.4 h (winter).
Spearman’s correlation coefficients were determined with a probability of p < 0.05 for the referential period and 2022 for mean monthly temperatures for Belgrade (0.972*) and Surčin (0.937*) and mean monthly temperatures and monthly precipitation for Belgrade (0.707) and Surčin (0.392). Values marked with * are statistically significant and confirm a very strong positive correlation between mean monthly temperatures for 2022 and the period 1991–2020, i.e., their growth. No statistically significant correlation or association was confirmed between the other two variables.

Climate in Serbia in 2022

In autumn 2022, in Serbia, a cold wave was recorded at the end of the second and the beginning of the third decade of September for the Belgrade station. In the same period, three cold, two very cold, and one extremely cold day were recorded at the Surčin station, but there were no cold waves. The average air temperature during autumn was 14.2 °C in Belgrade and 13.6 °C in Surčin. The seasonal deviation of the mean air temperature from the average values during autumn for both stations was +0.9 °C. According to the tercile method, the mean air temperature during autumn was in the warm category for both stations. Three tropical days were recorded in Belgrade and two in Surčin. The lowest daily air temperature during autumn was measured in Belgrade and Surčin on 26 November, and it was +0.9 °C or −1.2 °C. One tropical night was recorded at both stations. No frosty days were recorded in Belgrade and one was recorded in Surčin. According to the percentile method, the mean daily air temperature in Belgrade and Surčin was in the normal category during most of October, in the cold category in the middle of the first decade, and during the last decade it was in the warm and very warm categories. According to the percentile method, the mean daily air temperature in Belgrade and Surčin was in the normal category during most of November; in the middle of the first and second decades, it was in a warm category. December 2022 was the warmest in Belgrade (1887–2022) and Surčin (1962–2022), when observing the entire period of operation of these stations. The average air temperature during December was 7.0 °C in Belgrade and 6.4 °C in Surčin. According to the percentile method, the mean daily air temperature in Belgrade and Surčin was in the categories of warm to extremely warm during most of December. It was normal at the beginning of the first and the beginning and the end of the second decade. In Belgrade, the highest daily air temperature was 19.4 °C (10 December) and in Surčin it was 18.0 °C (26 December). The heat wave was recorded from 29 December 2022 to 3 January 2023, at both stations. The average minimum air temperature during December was 4.2 °C in Belgrade and 2.9 °C in Surčin. A total of 4 frosty days were recorded in Belgrade and 7 in Surčin (Tmin < 0 °C), which is significantly lower compared with the reference period (1991–2020), in which the average number of such days was 13.7 (Belgrade) and 17.0 (Surčin) https://www.hidmet.gov.rs/index_eng.php (accessed on 12 January 2023).

3.2. Phenology and Flowering Patterns

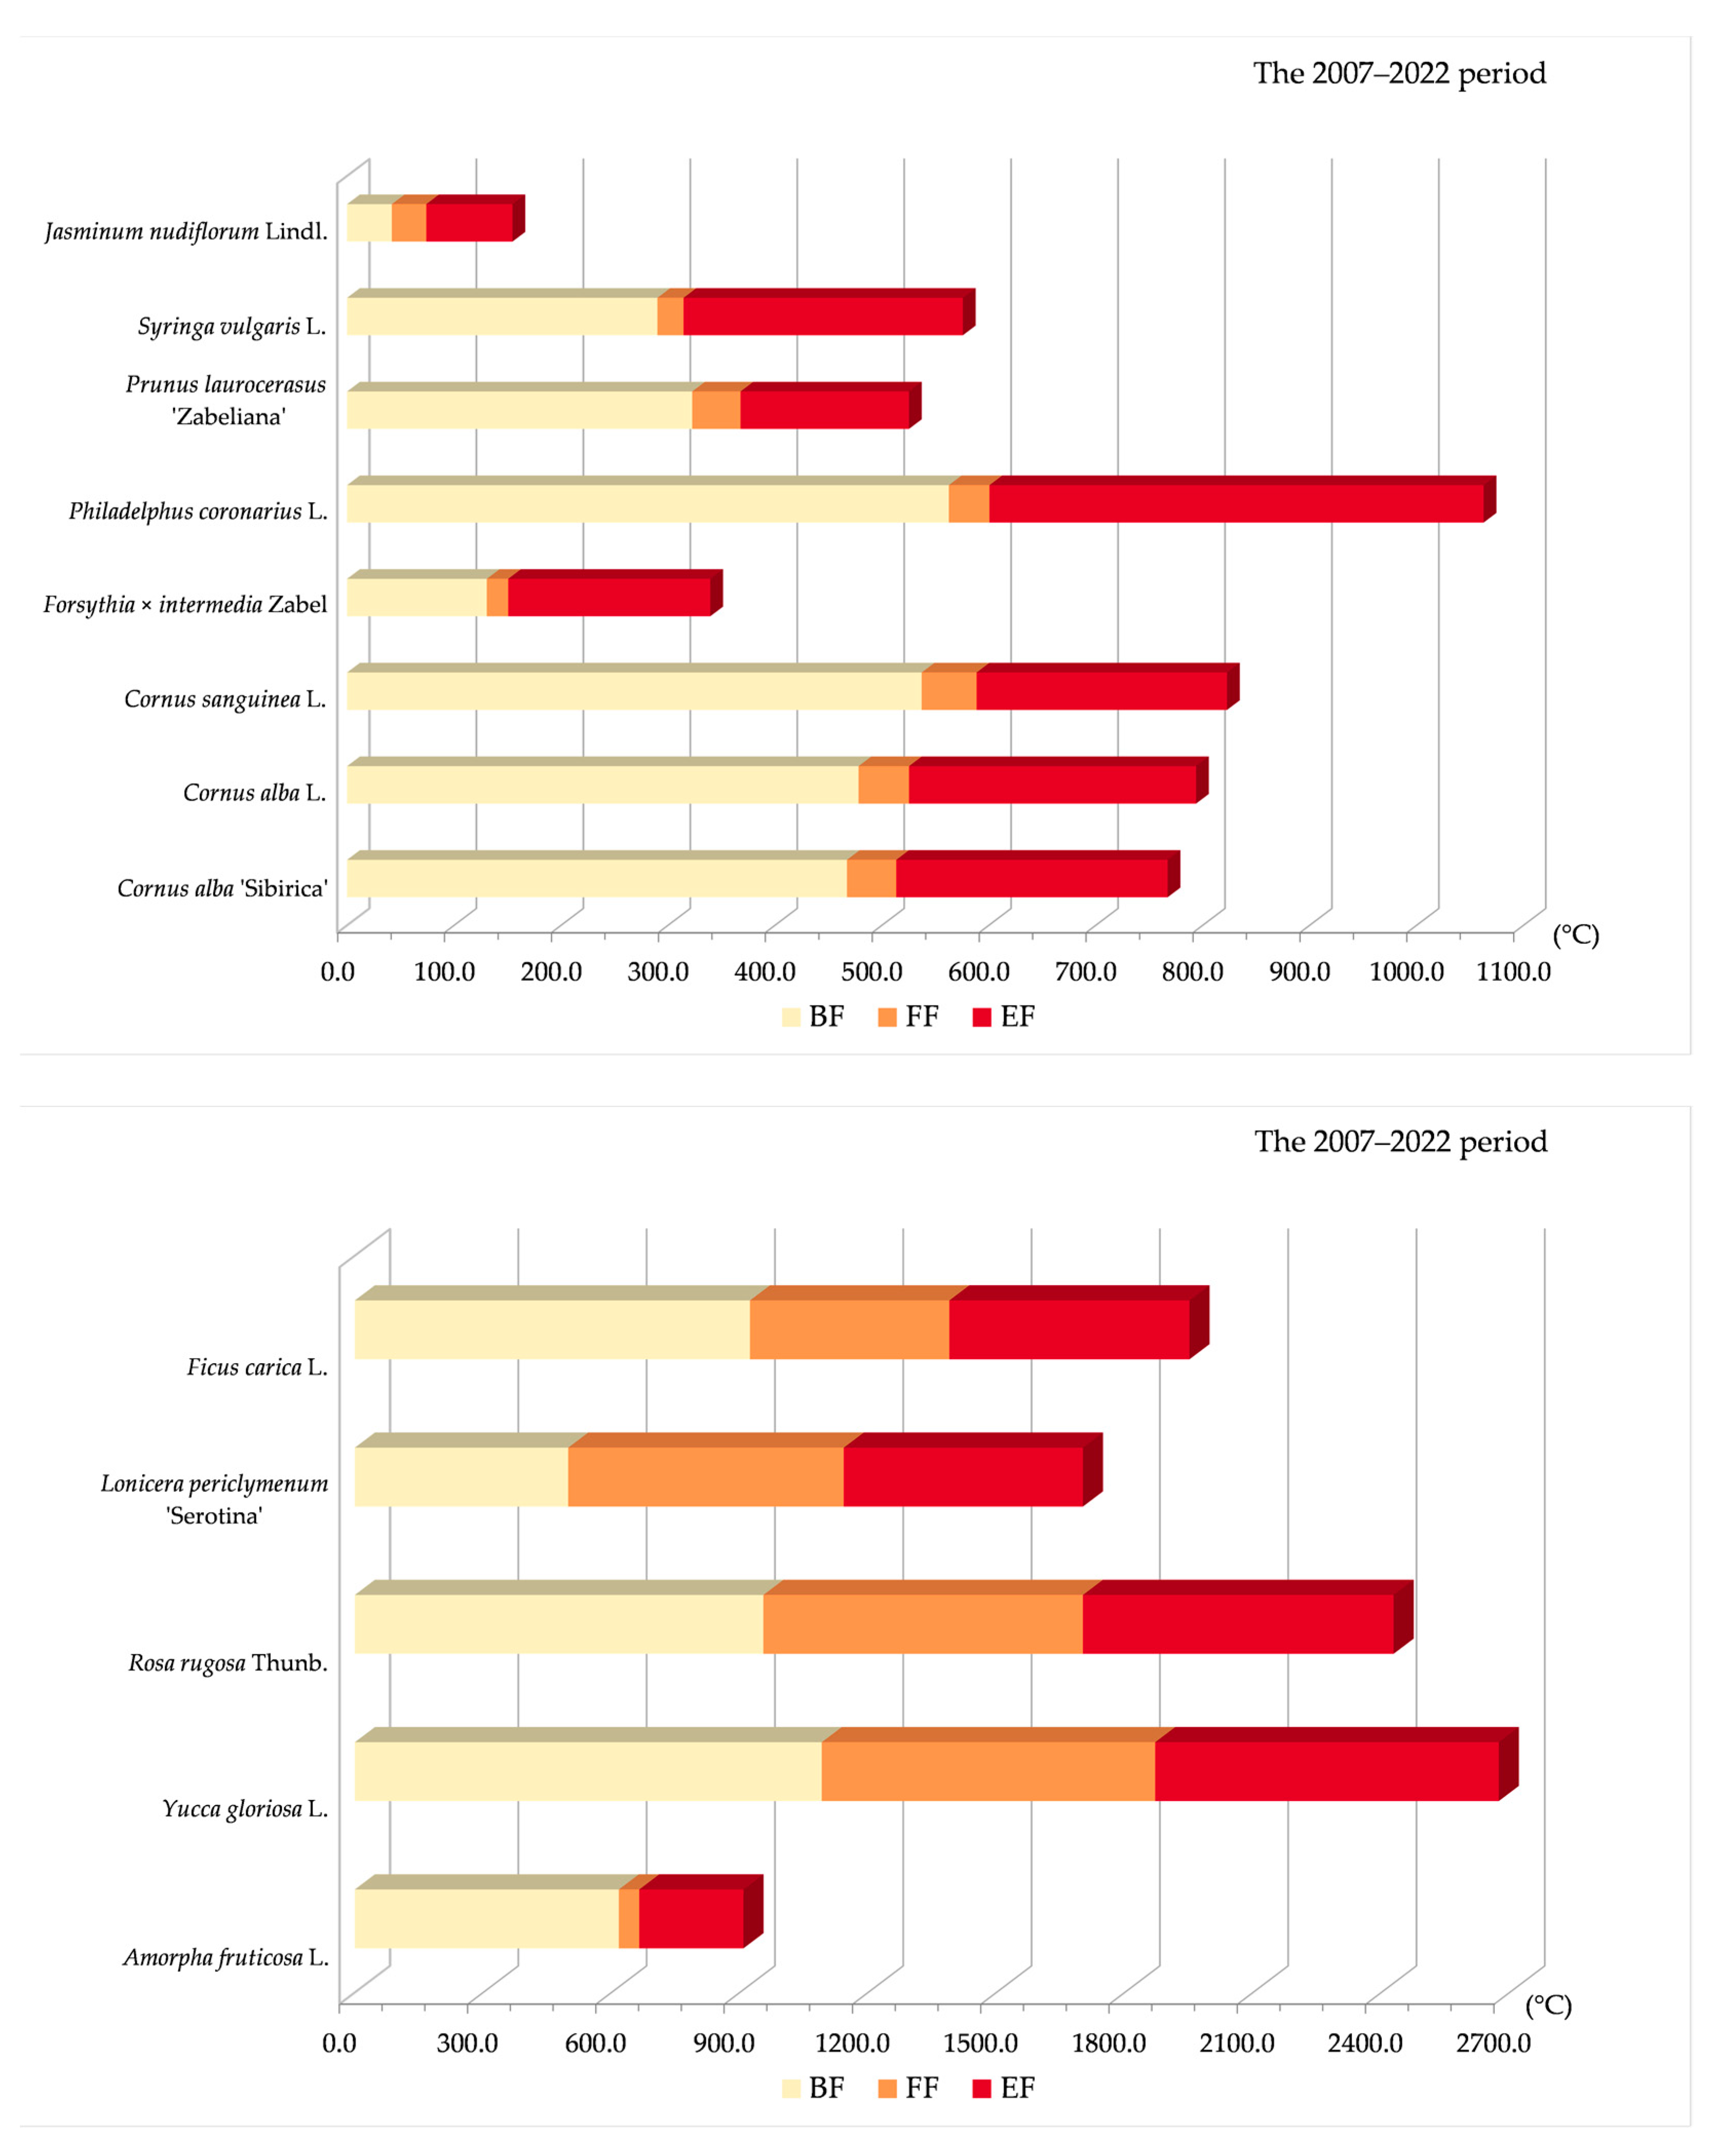
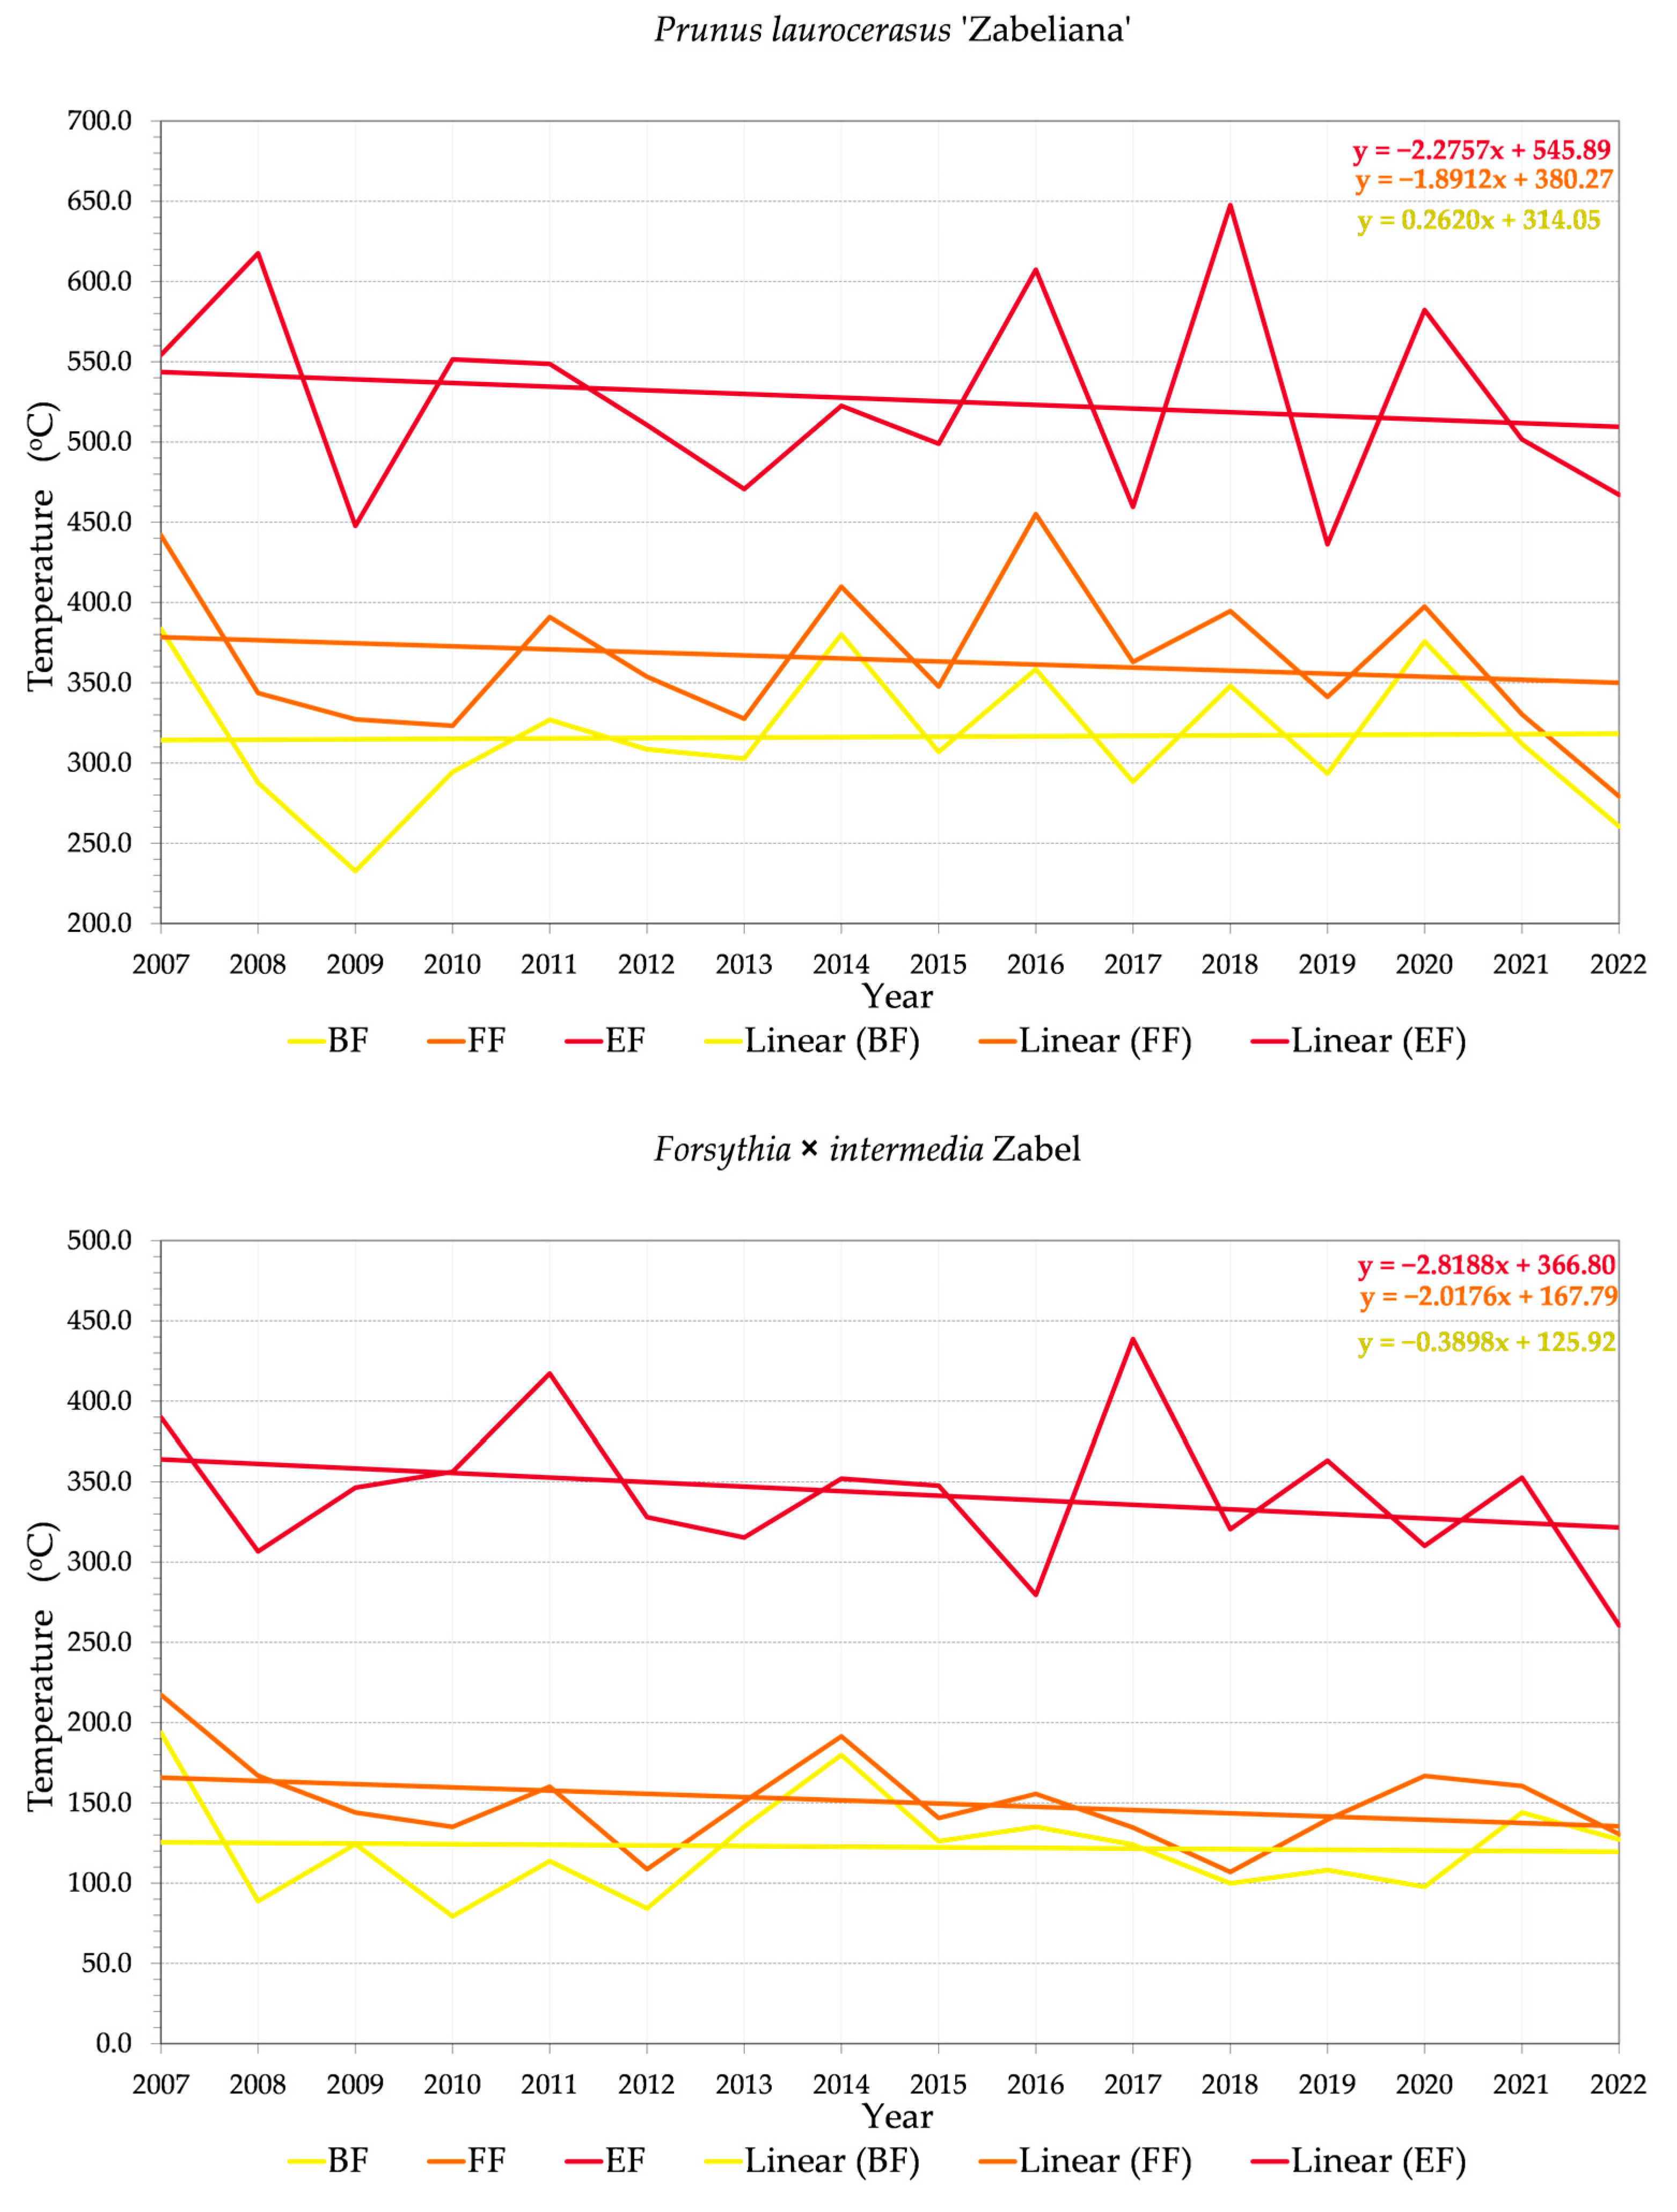
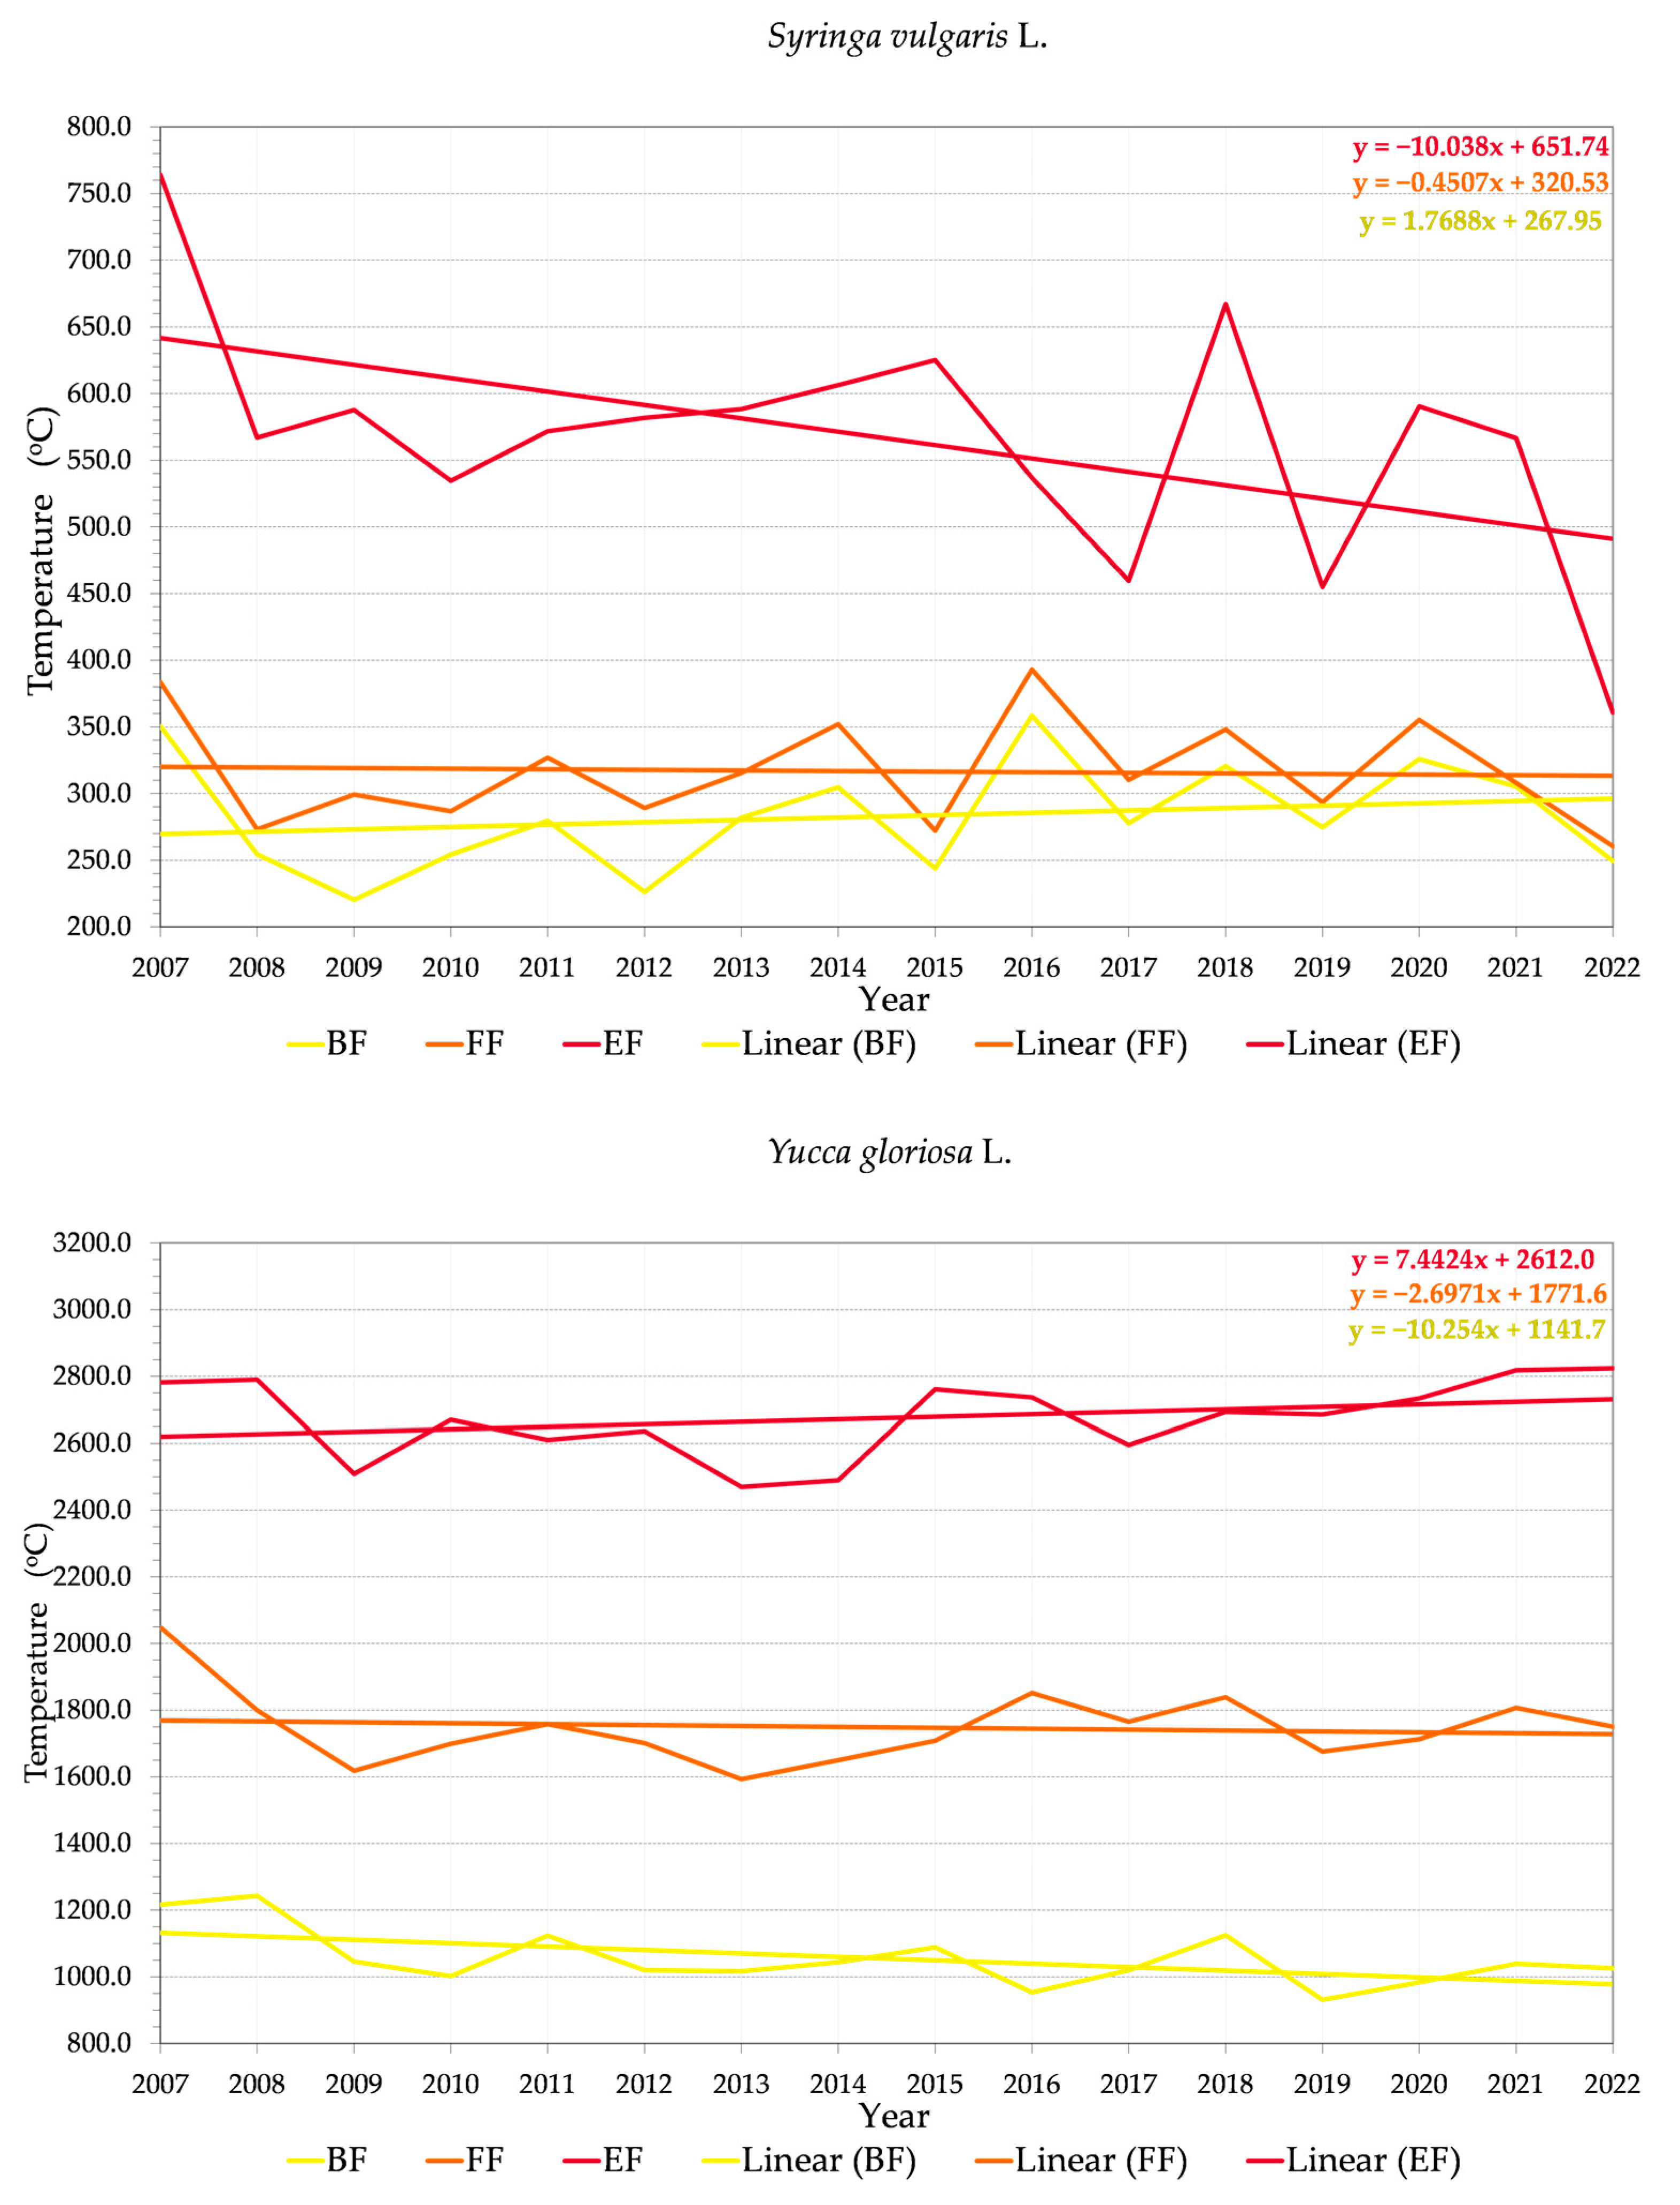
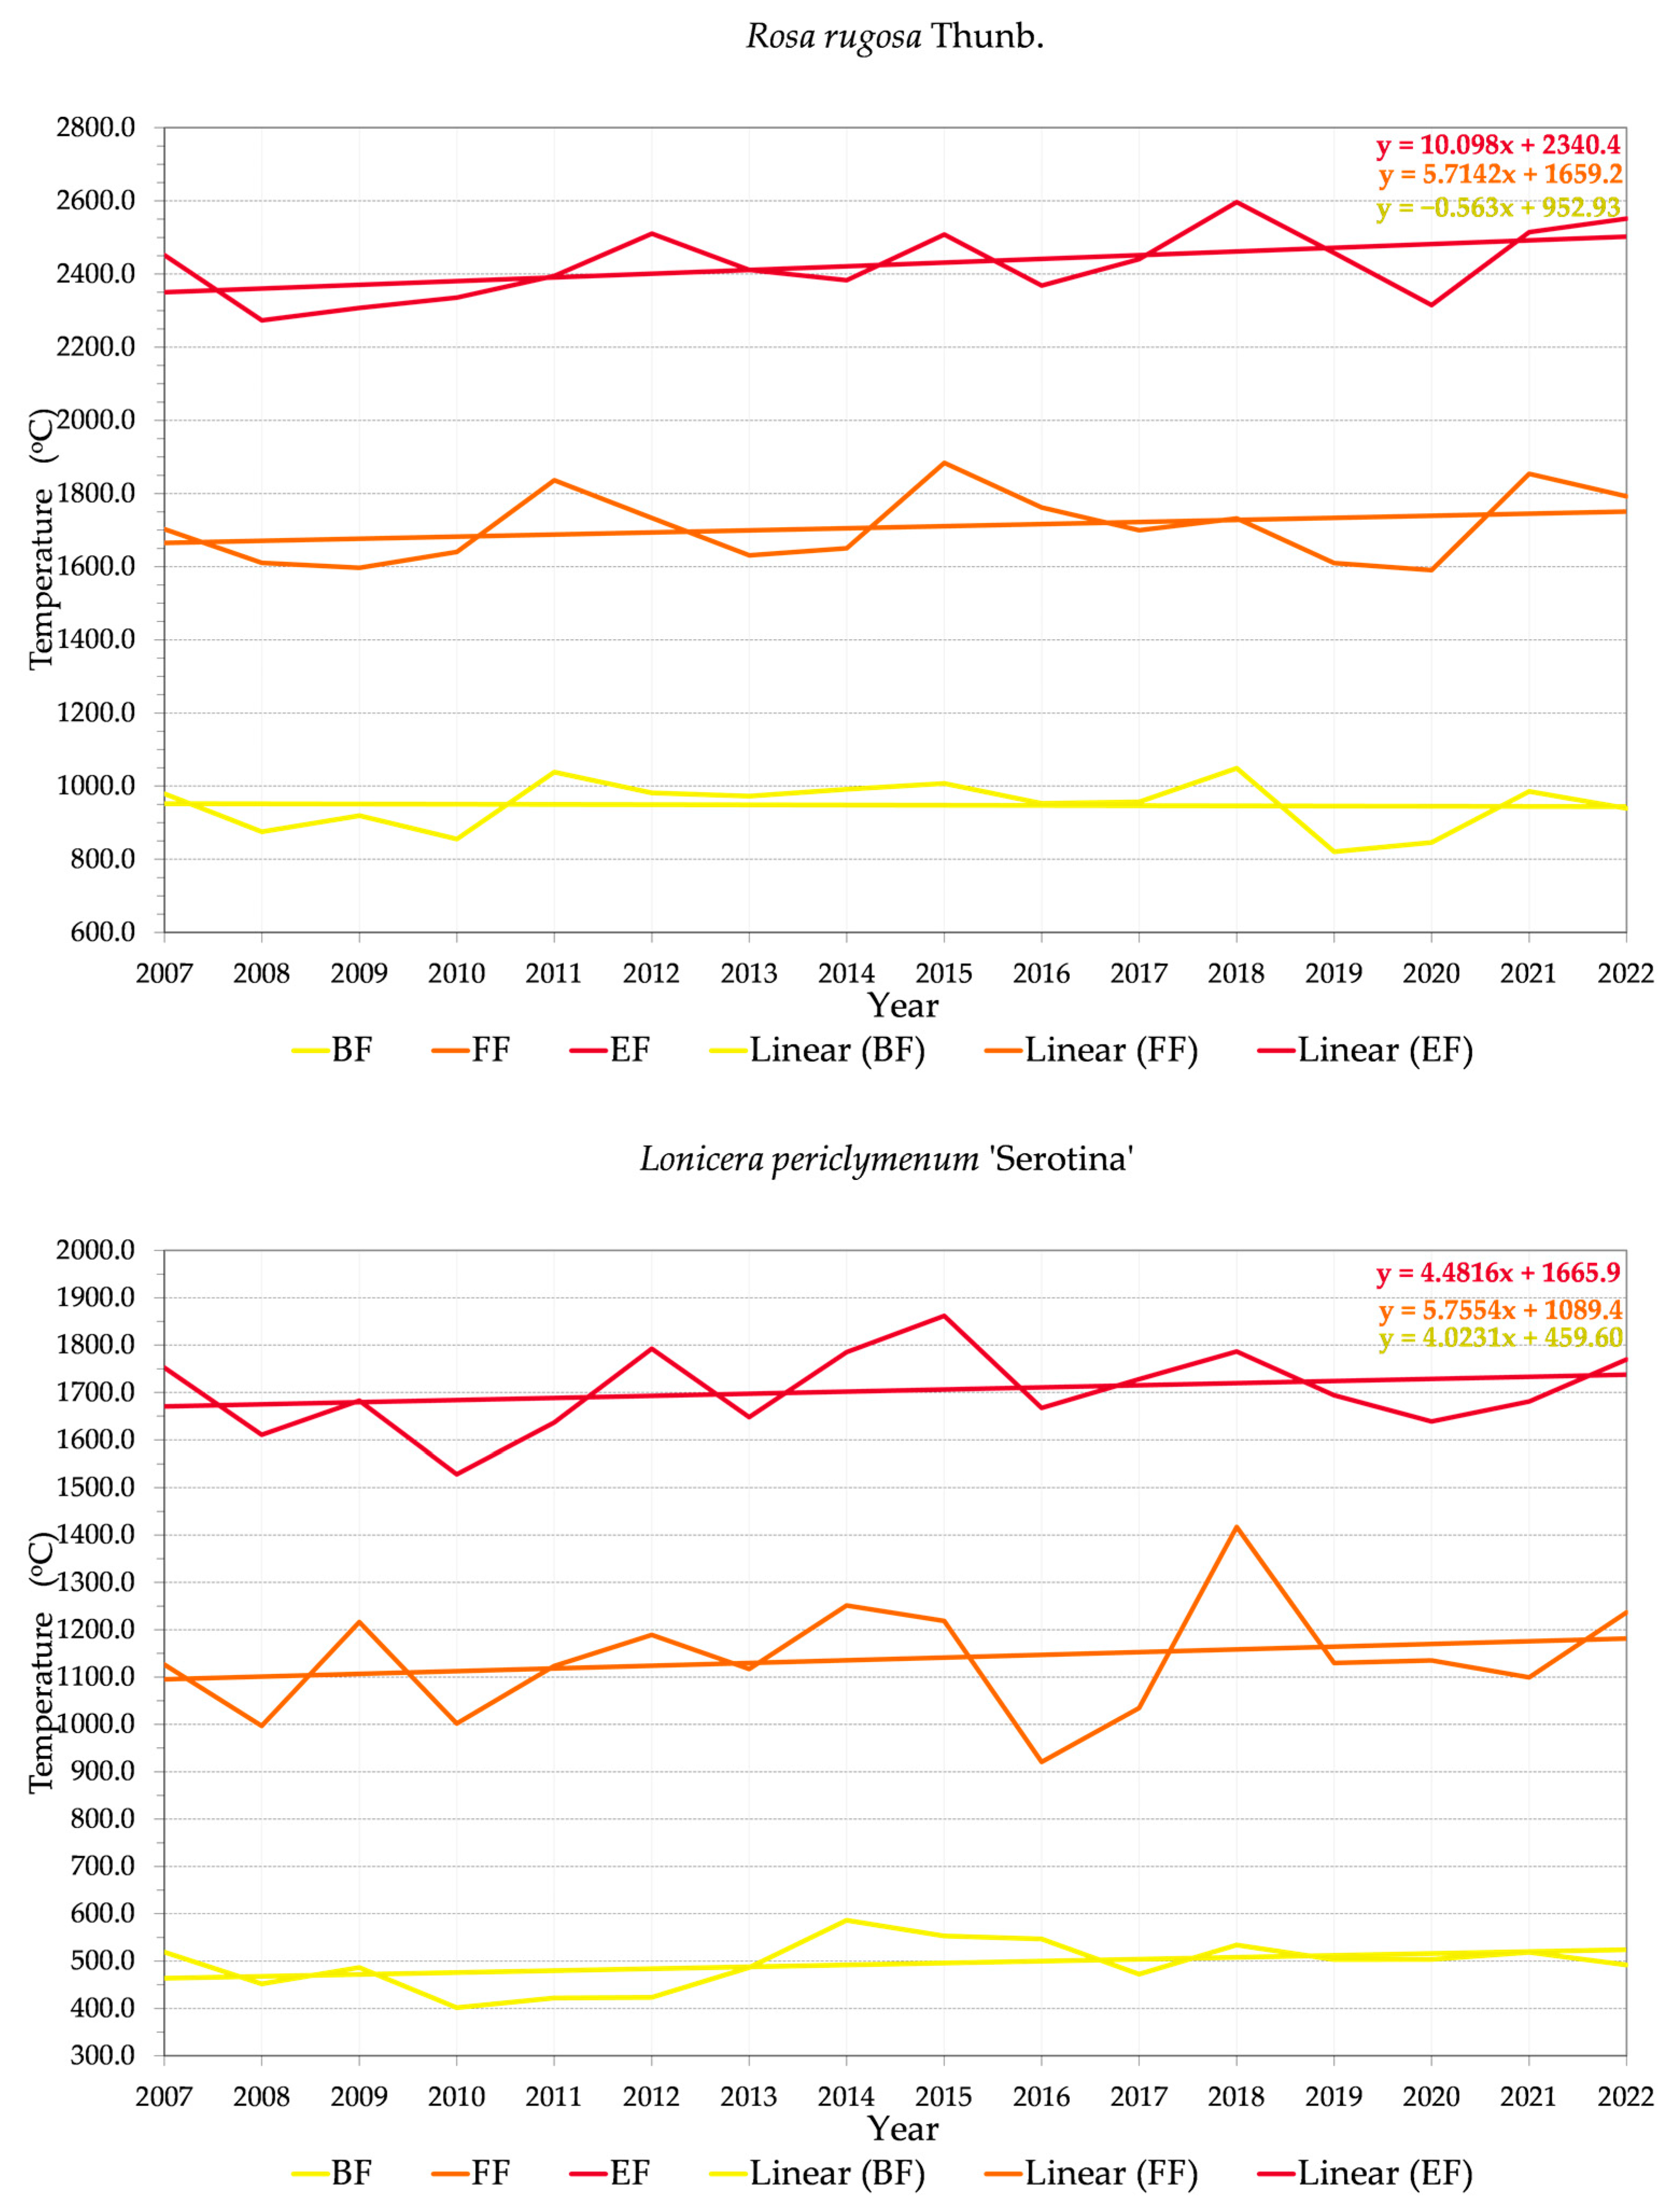
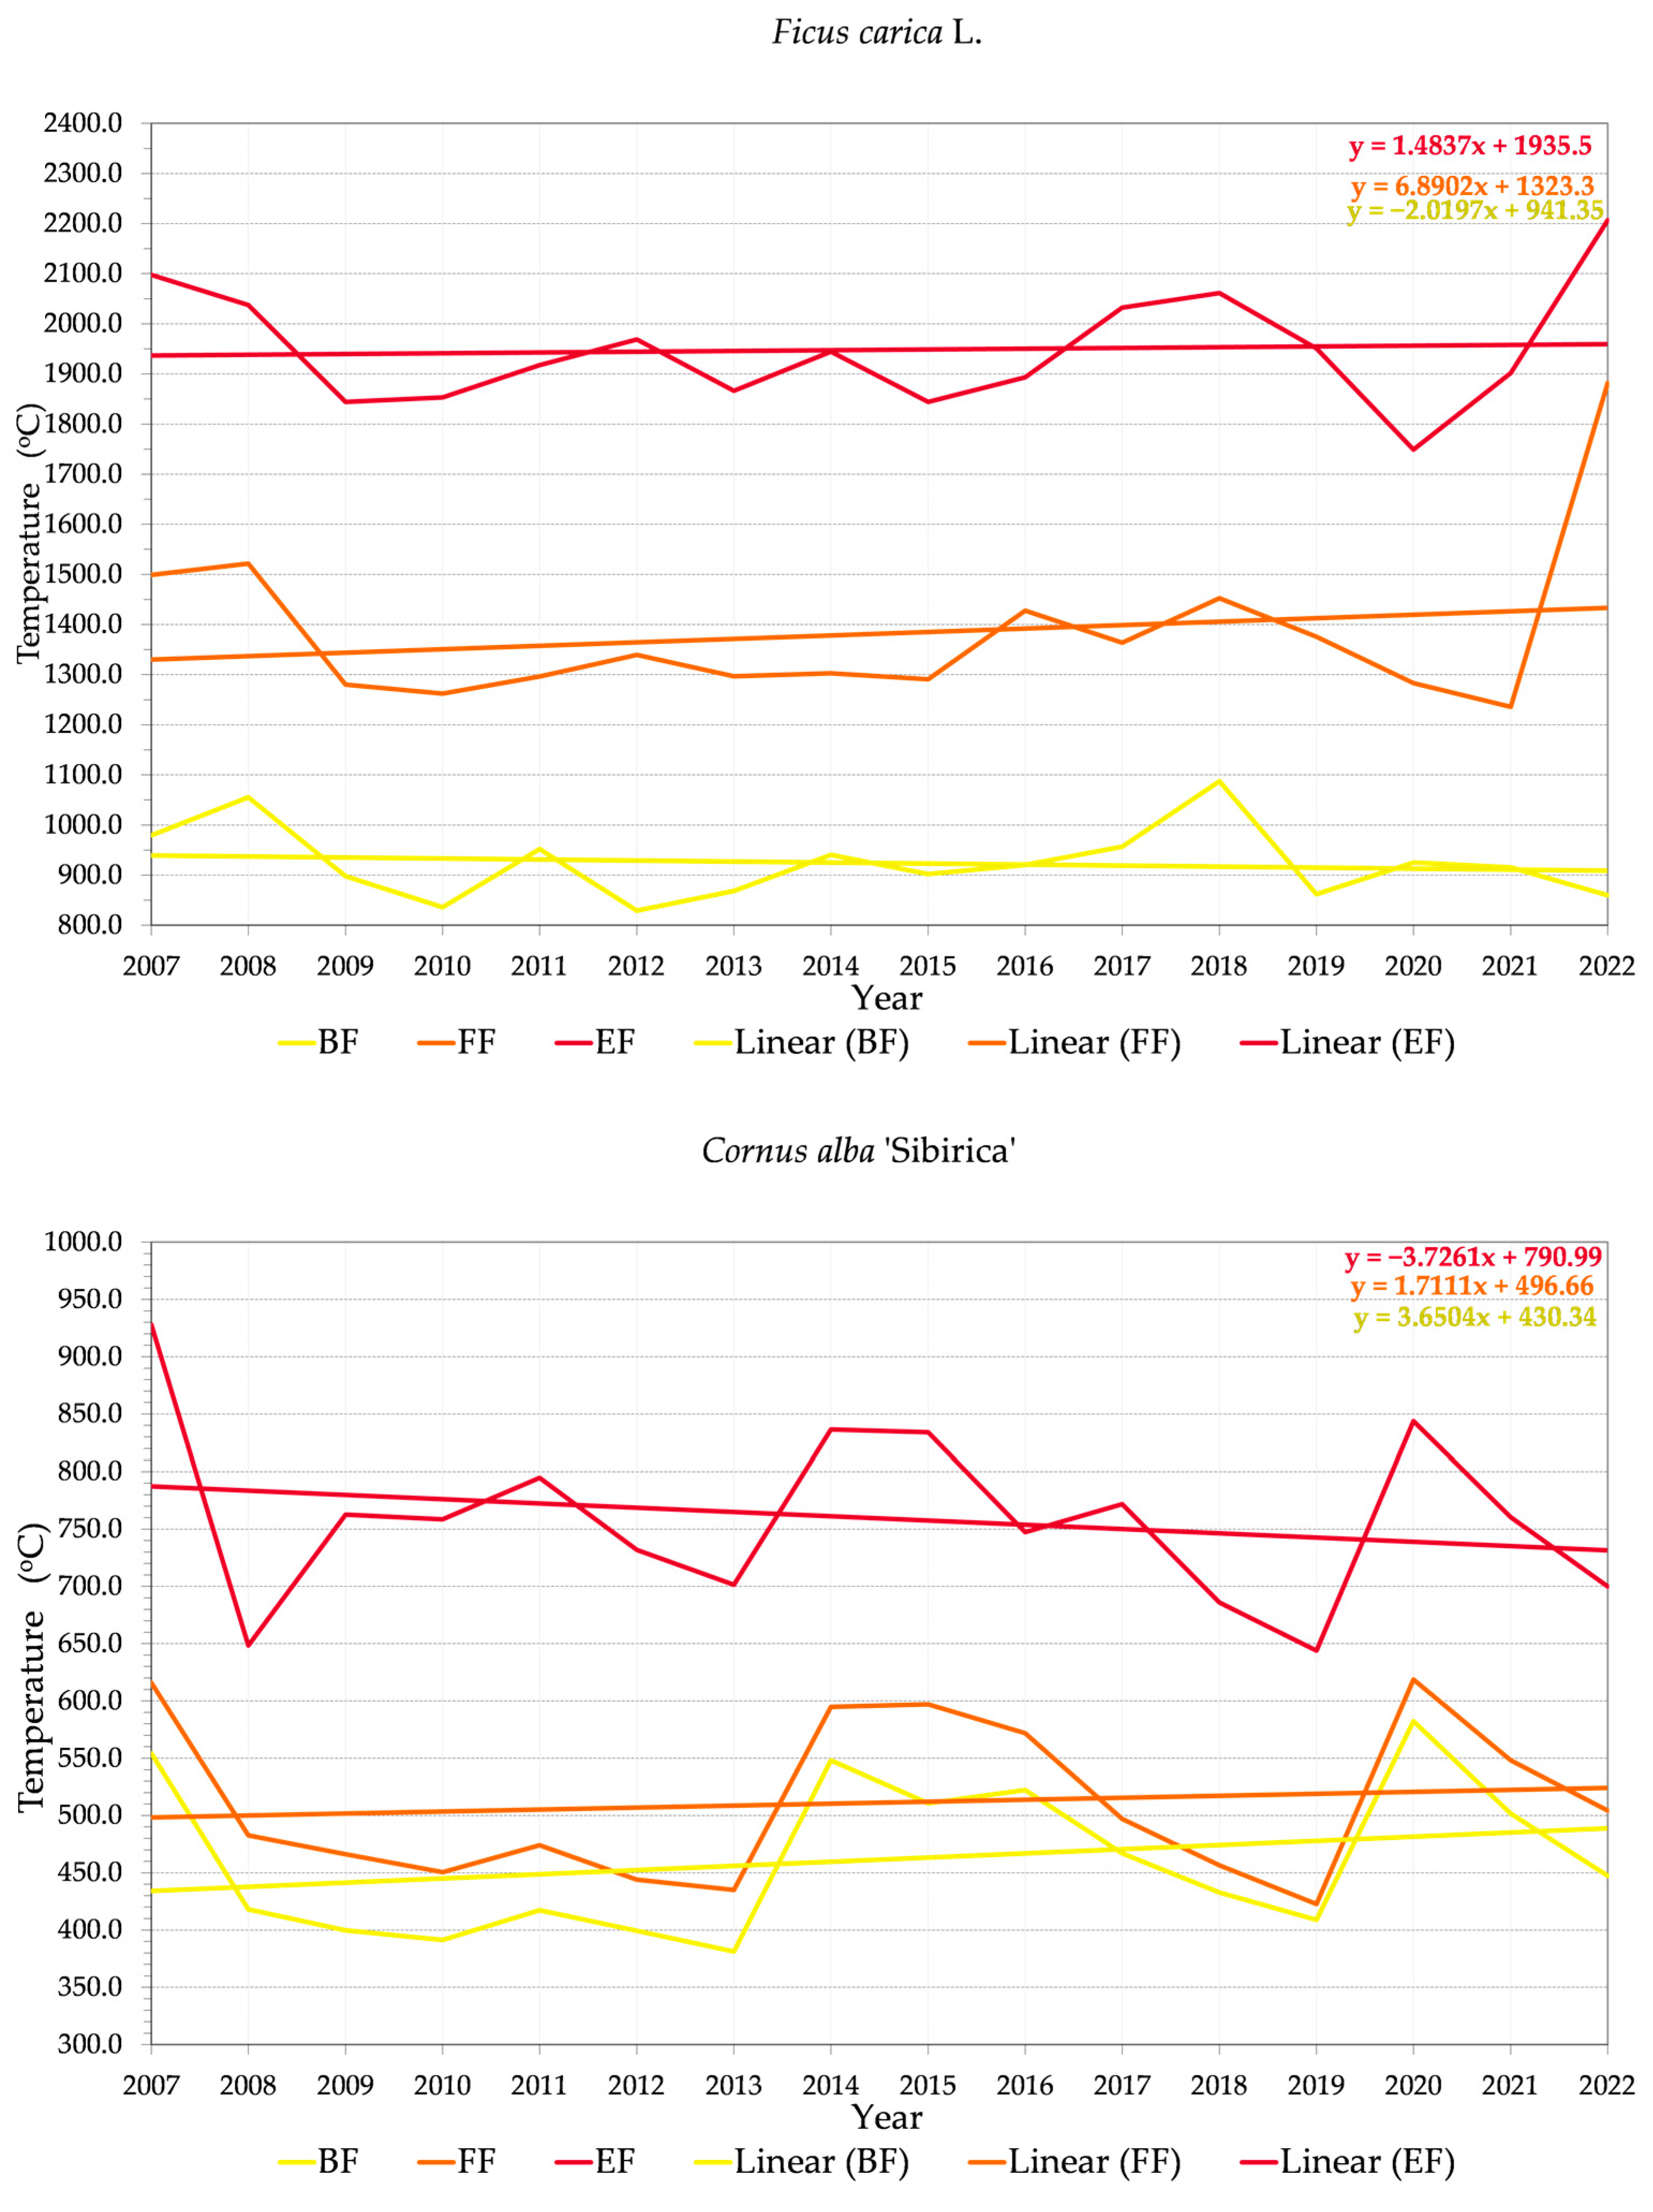
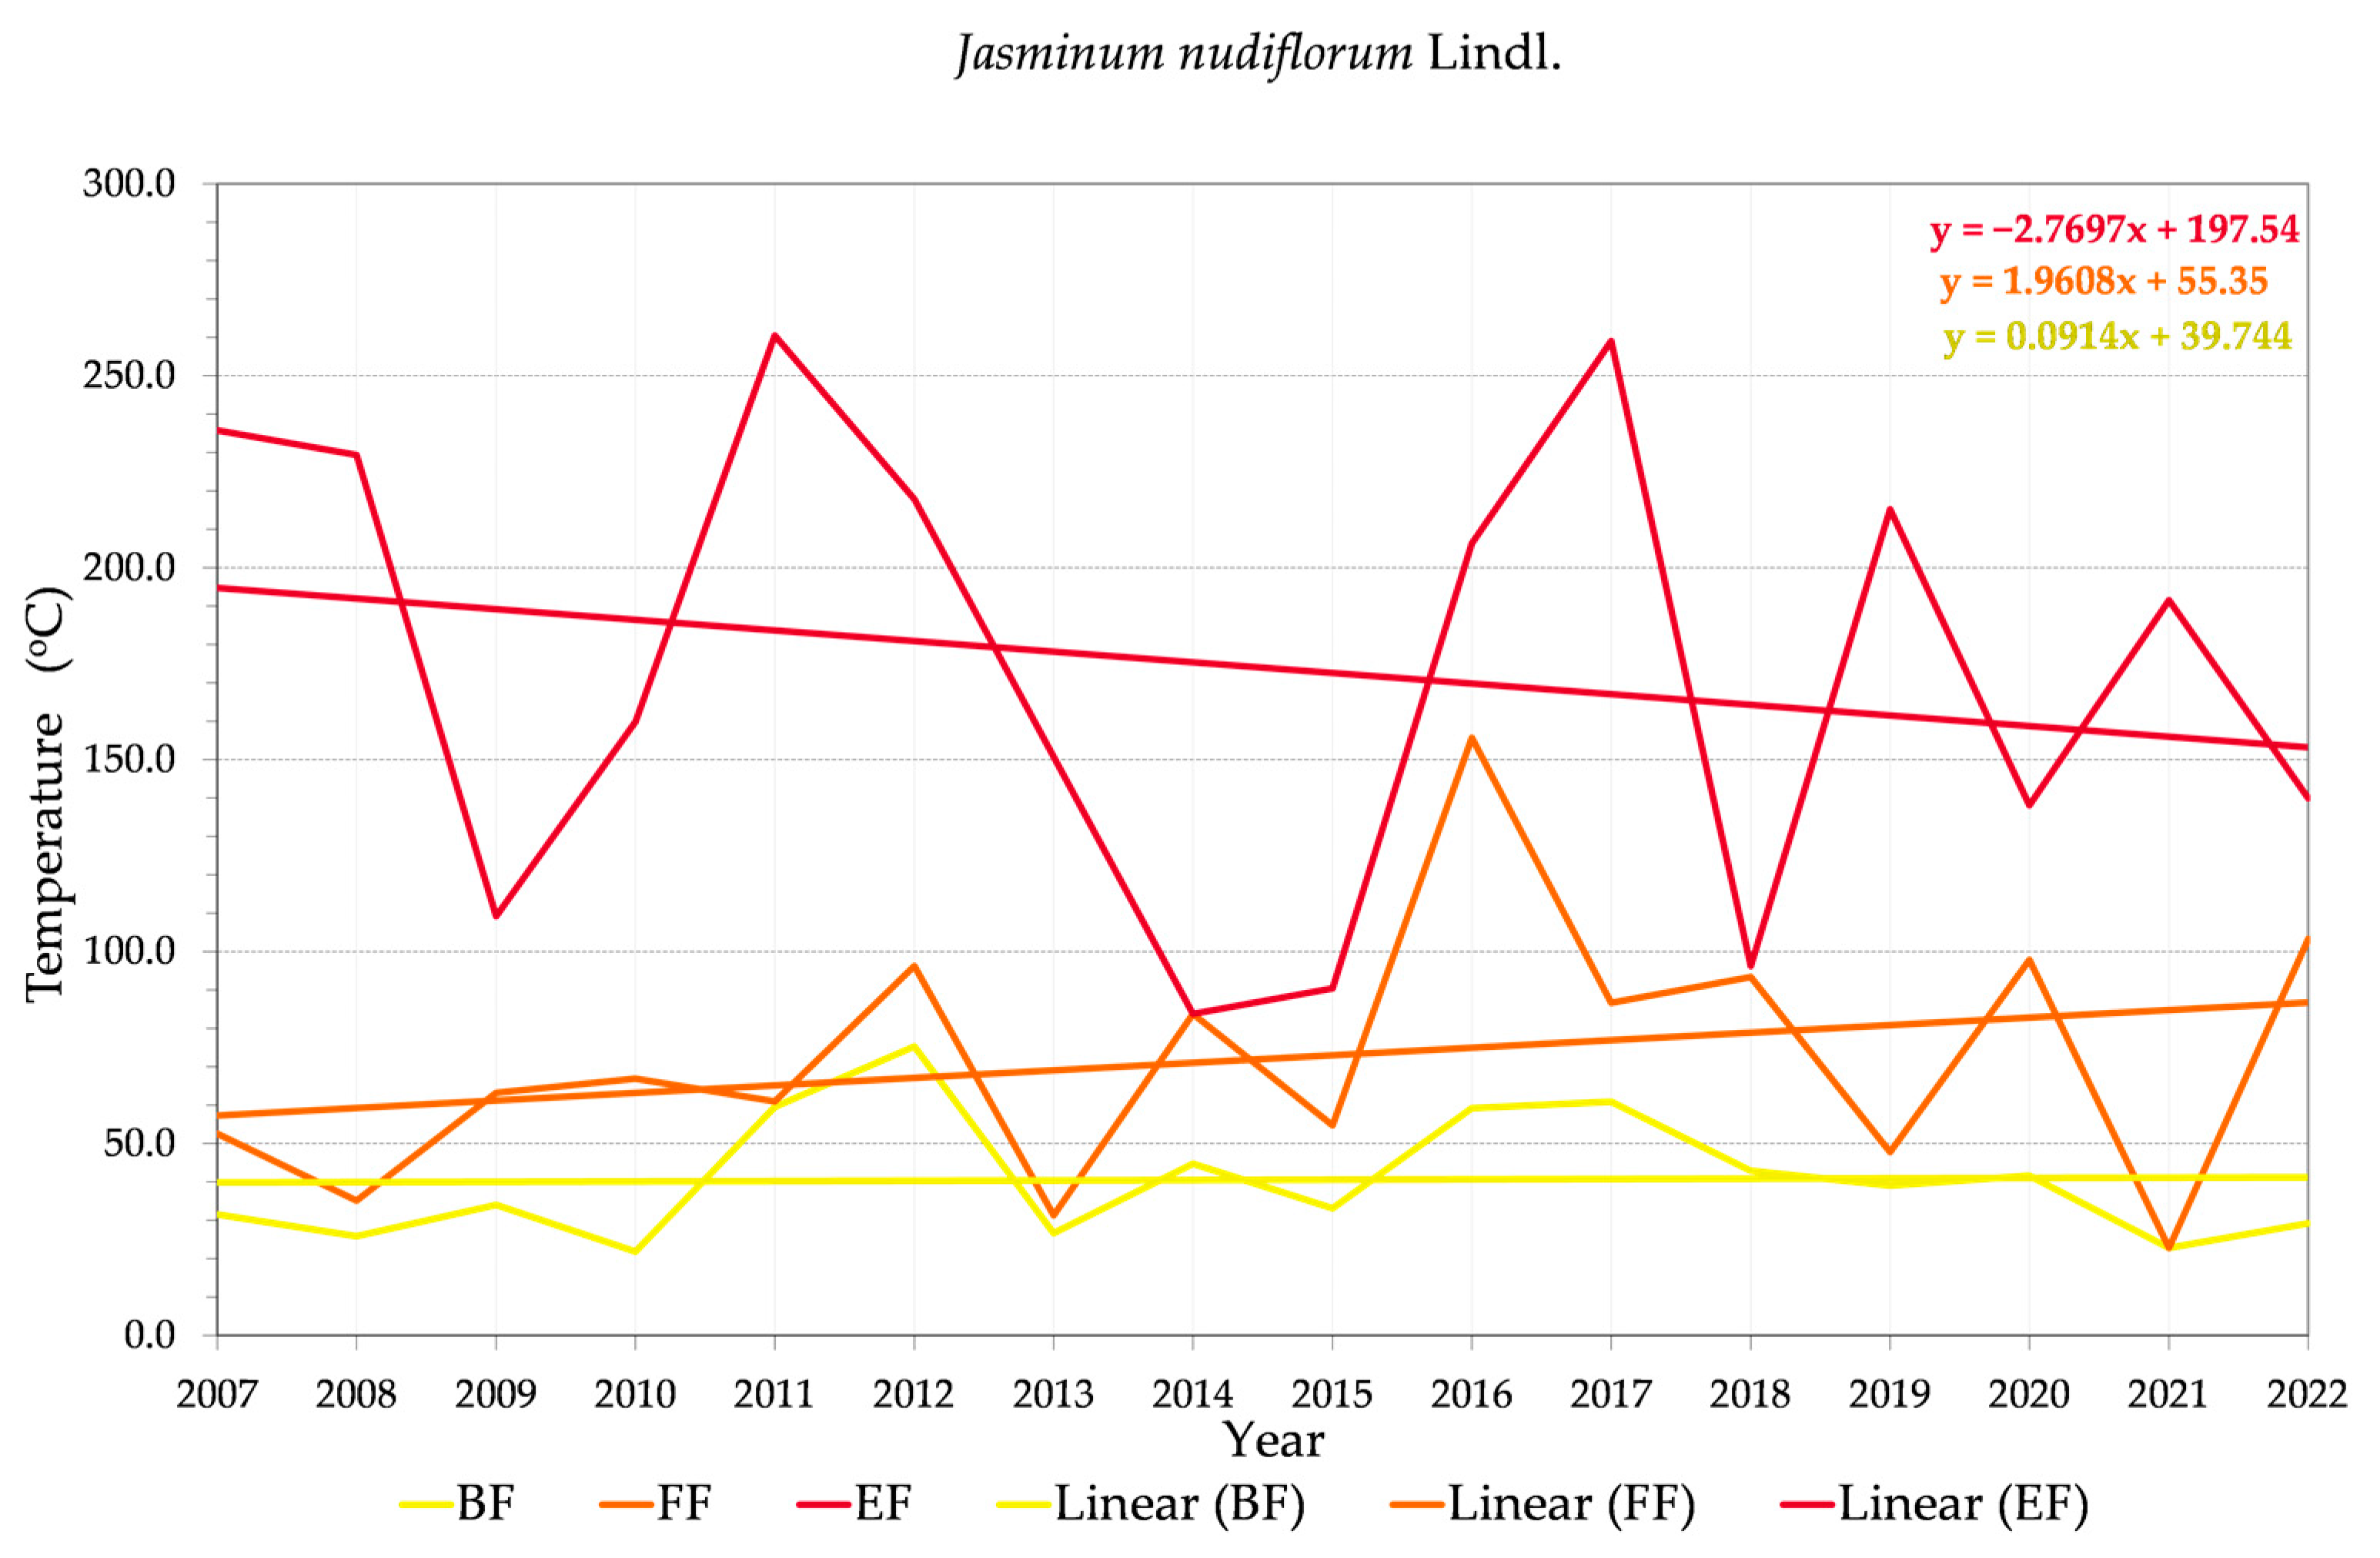
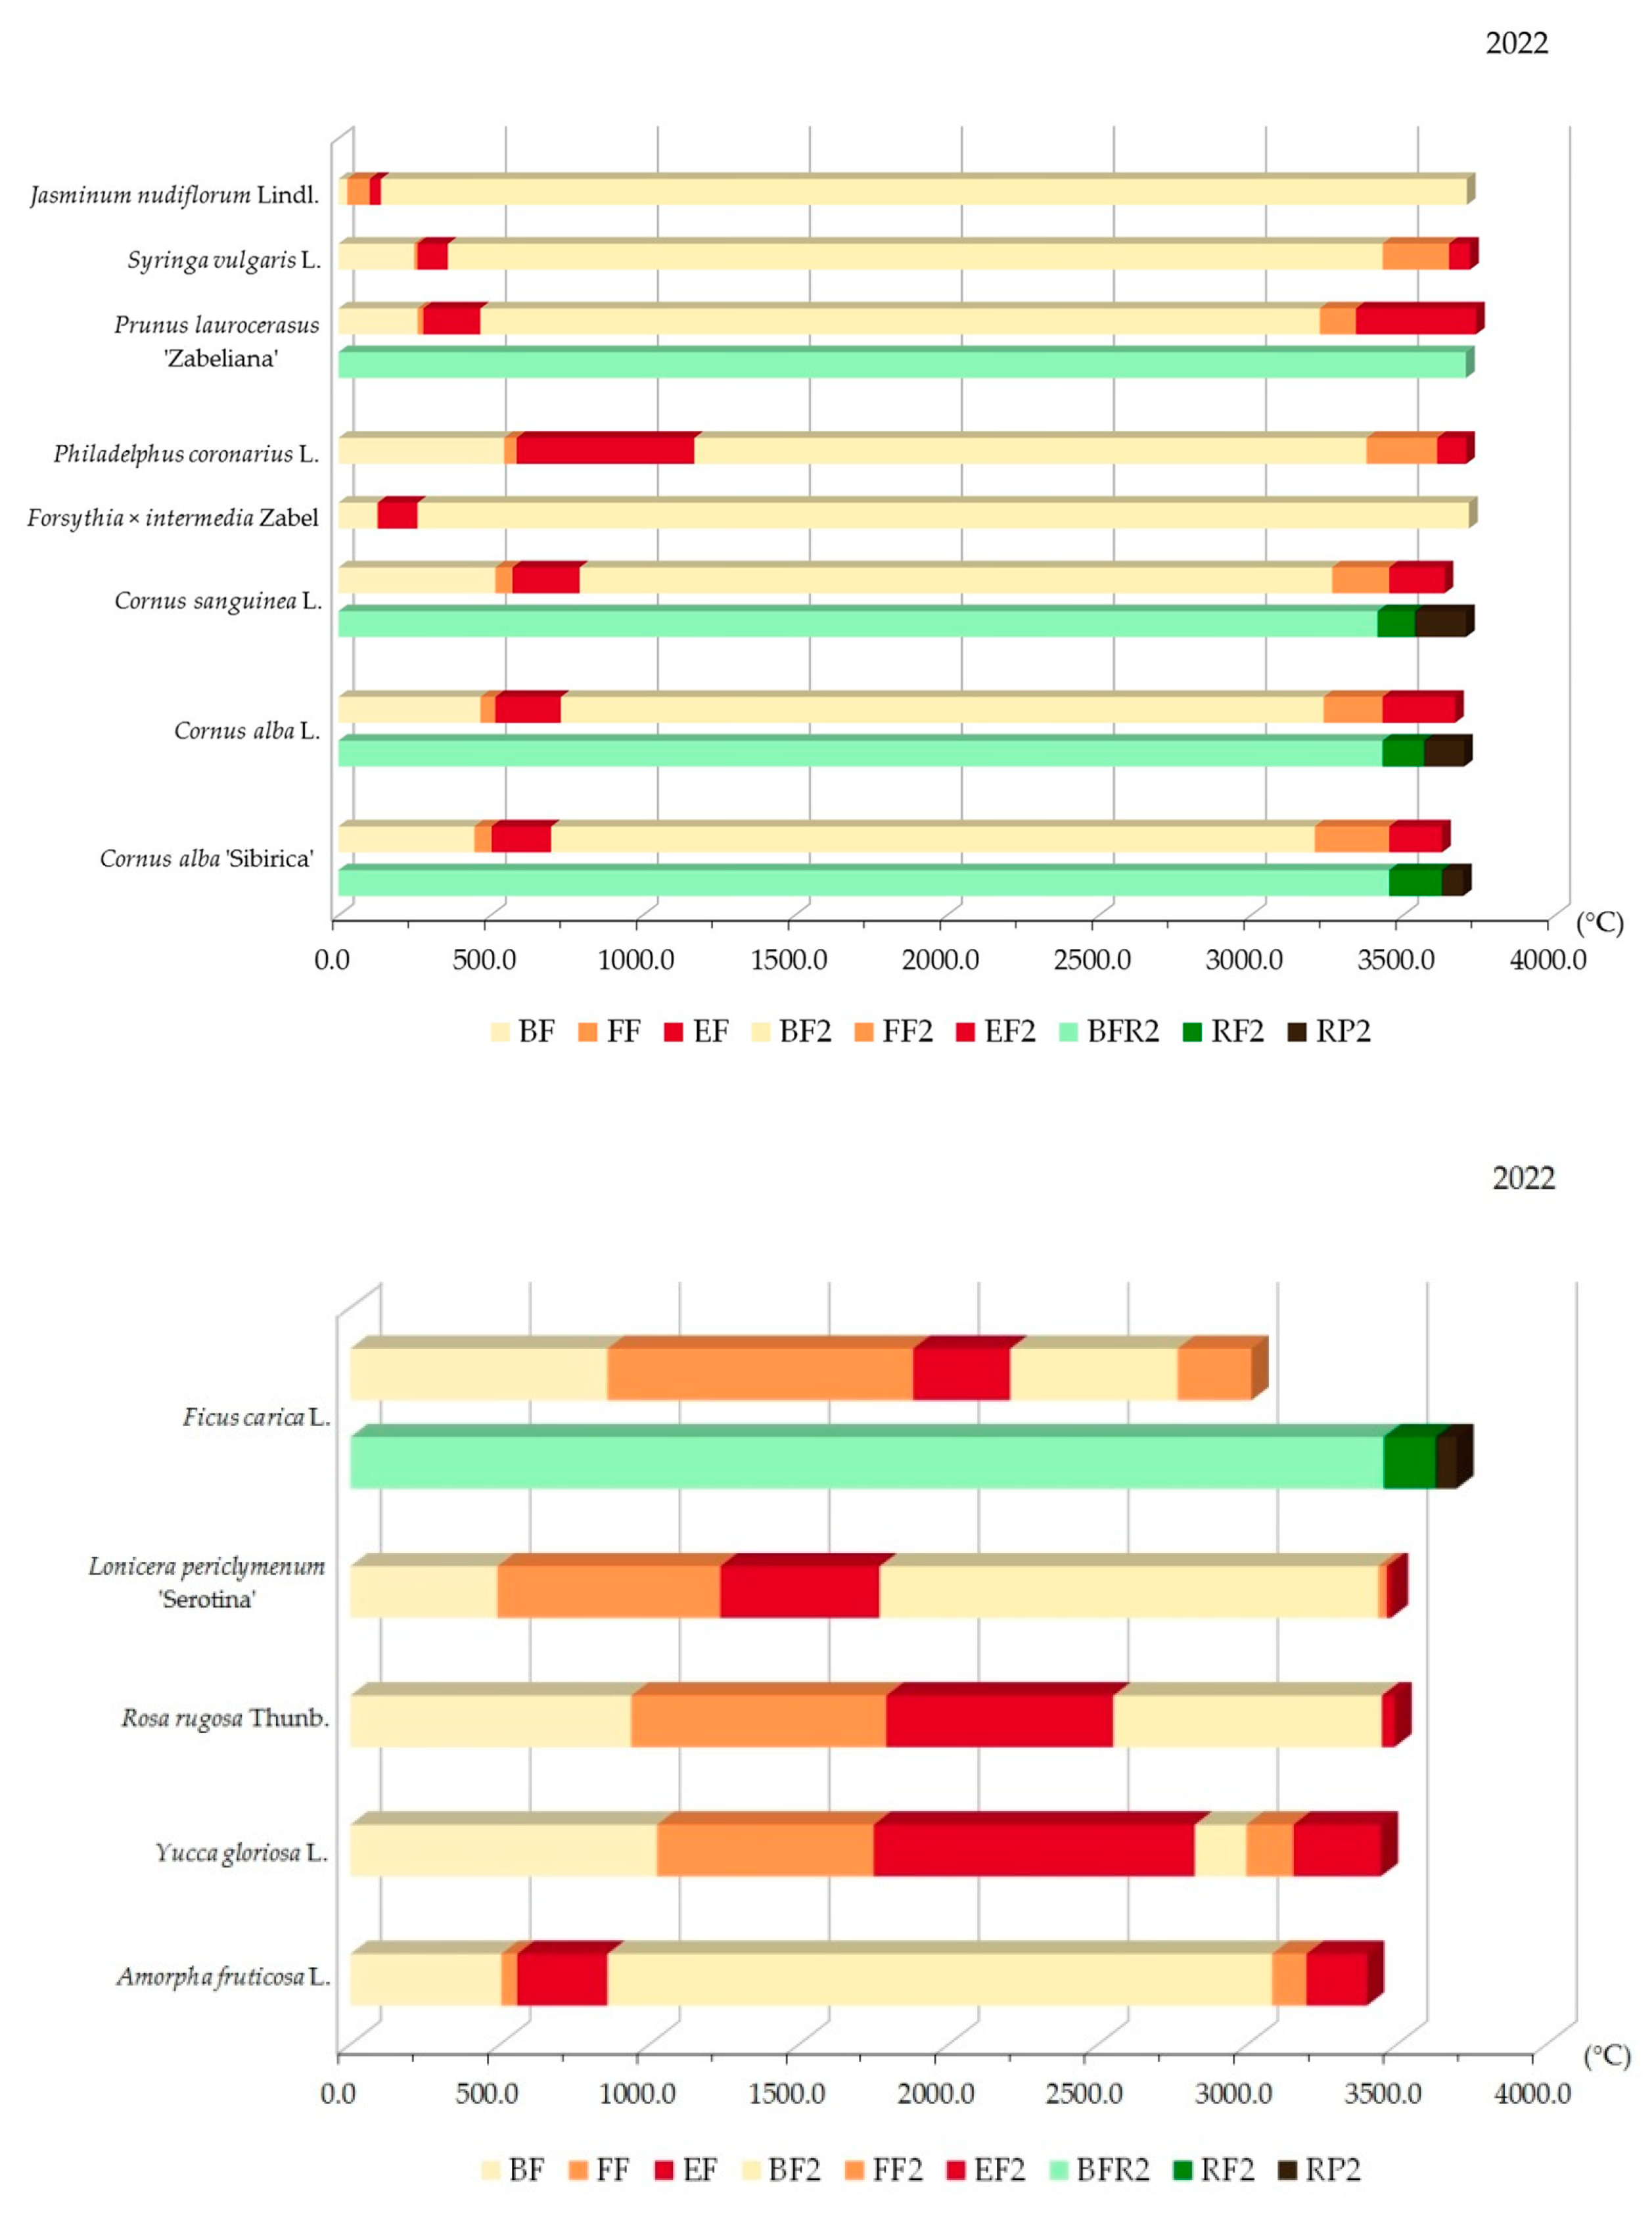
3.2.1. Variability of Relations between Flowering Phenophase and Sums of Temperatures (GDD)

To determine the accumulated heat from one phenophase to the next for 13 taxa from our study for the period 2007–2022, RHMZ data from the Belgrade and Surčin stations were used. Descriptive statistics such as average mean, minimum and maximum values, and standard deviation were calculated for each observed flowering phenophase and are shown in Supplementary Materials Table S5.
Plants that flowered in late winter or early spring required the smallest sum (Weeping Winter Jasmine and Border Forsythia), in early or mid-spring a larger sum (Common Lilac and Zabel’s Laurel), and in late spring and early summer the largest sum (Siberian Dogwood, Tartarian Dogwood, Common Dogwood, and European Mock-Orange). The mentioned taxa (native, autochthonous, hybrid, and cultivars) are located in central Belgrade parks. In the suburban zone, for which the data from the Surčin station were used, there are non-native species and a cultivar for which the beginning of flowering required sums from 493.8 °C to 1054.6 °C (Honeysuckle, Indigo Bush, Edible Fig, Rugosa Rose, and Spanish Dagger) and which flowered in late spring, early summer, and until the end of the growing season (Table S5).
Based on 16 annual records, it was determined that the minimum mean temperature sums for the beginning, full development, and the end of the first flowering are necessary for the species Jasminum nudiflorum Lindl. and the most for the species Yucca gloriosa L. (Figure 1). Data analysis (Table S5, Figure 1) shows low standard deviations that tend to be close to the mean value (expected value).
The Mann-–Kendall test determined linear trends (Figure 2, Table S6) for temperature sums (GDD) for each flowering phenophase for 13 taxa for 16 consecutive years. A positive value indicates an increasing trend and a negative value indicates a decreasing trend.
The determined negative and positive values of the trends are not statistically significant, except for the species Rosa rugosa Thunb., and only for the phenophase (EF) (the end of flowering) (Figure 3 bottom). The positive sign confirms the growth trend, i.e., greater accumulation of heat. The standard deviation is very low (Table S5), which confirms the trend of temperature growth during the summer in the period 2007–2020.

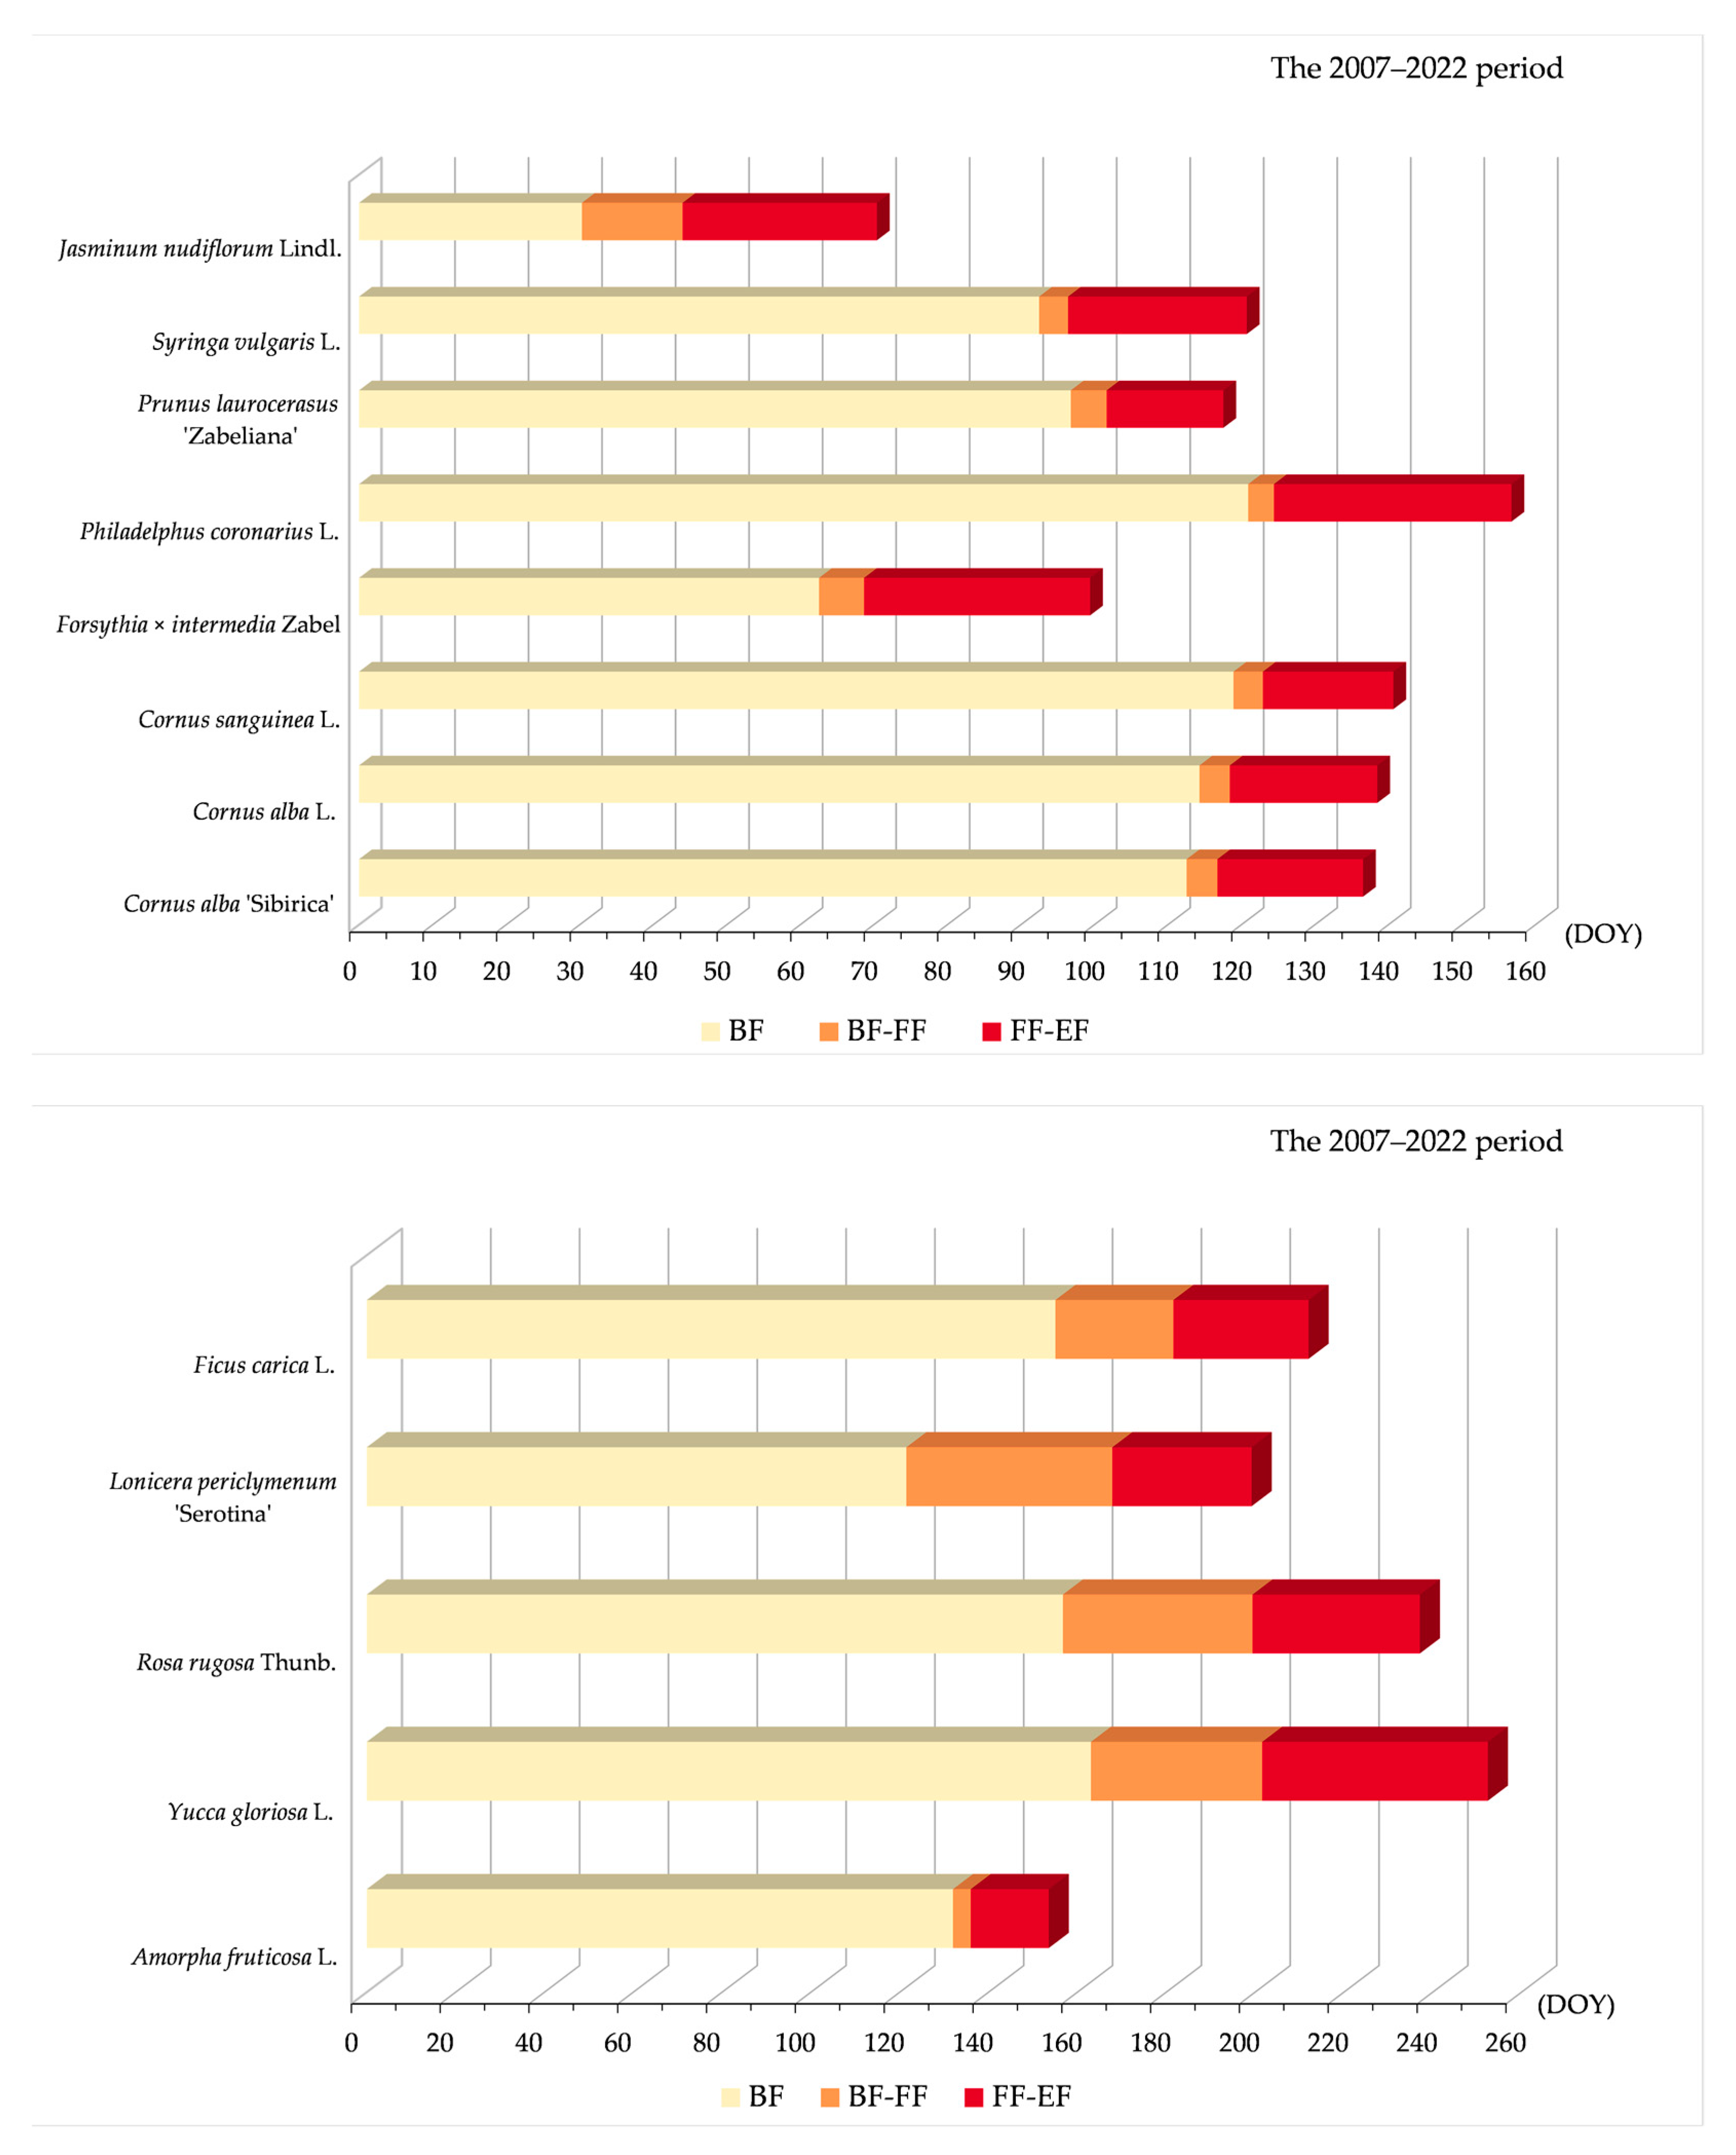
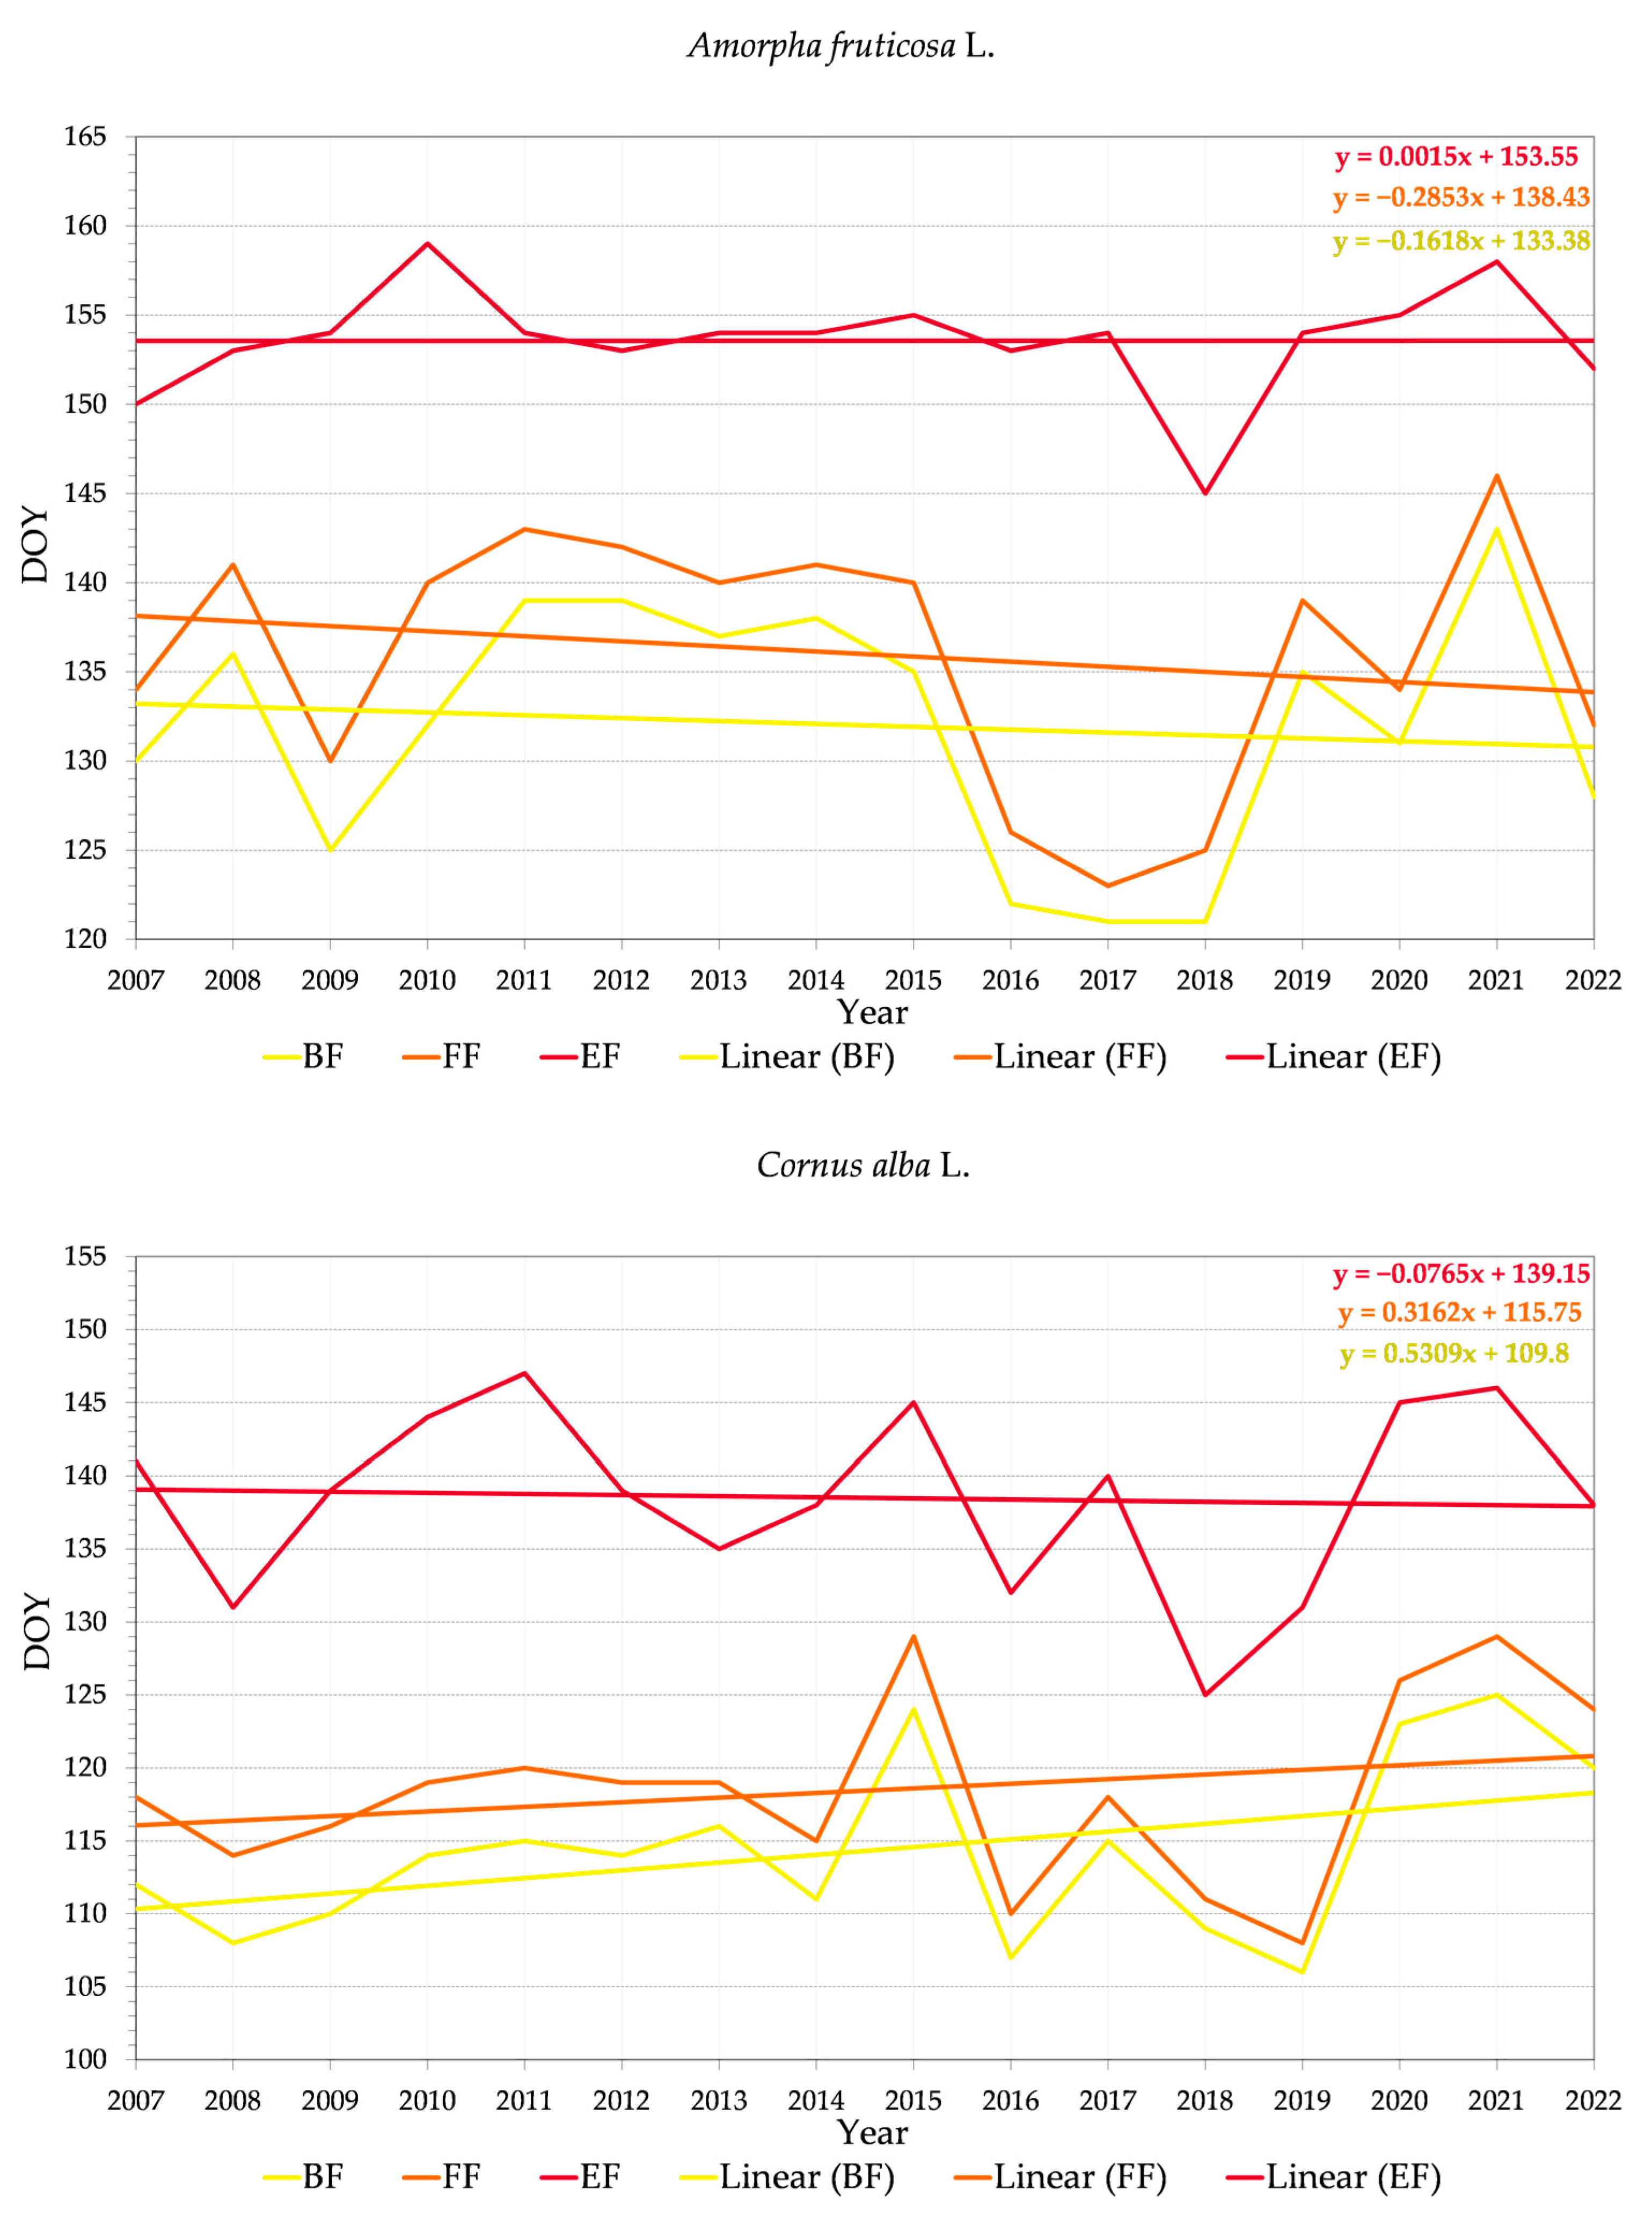
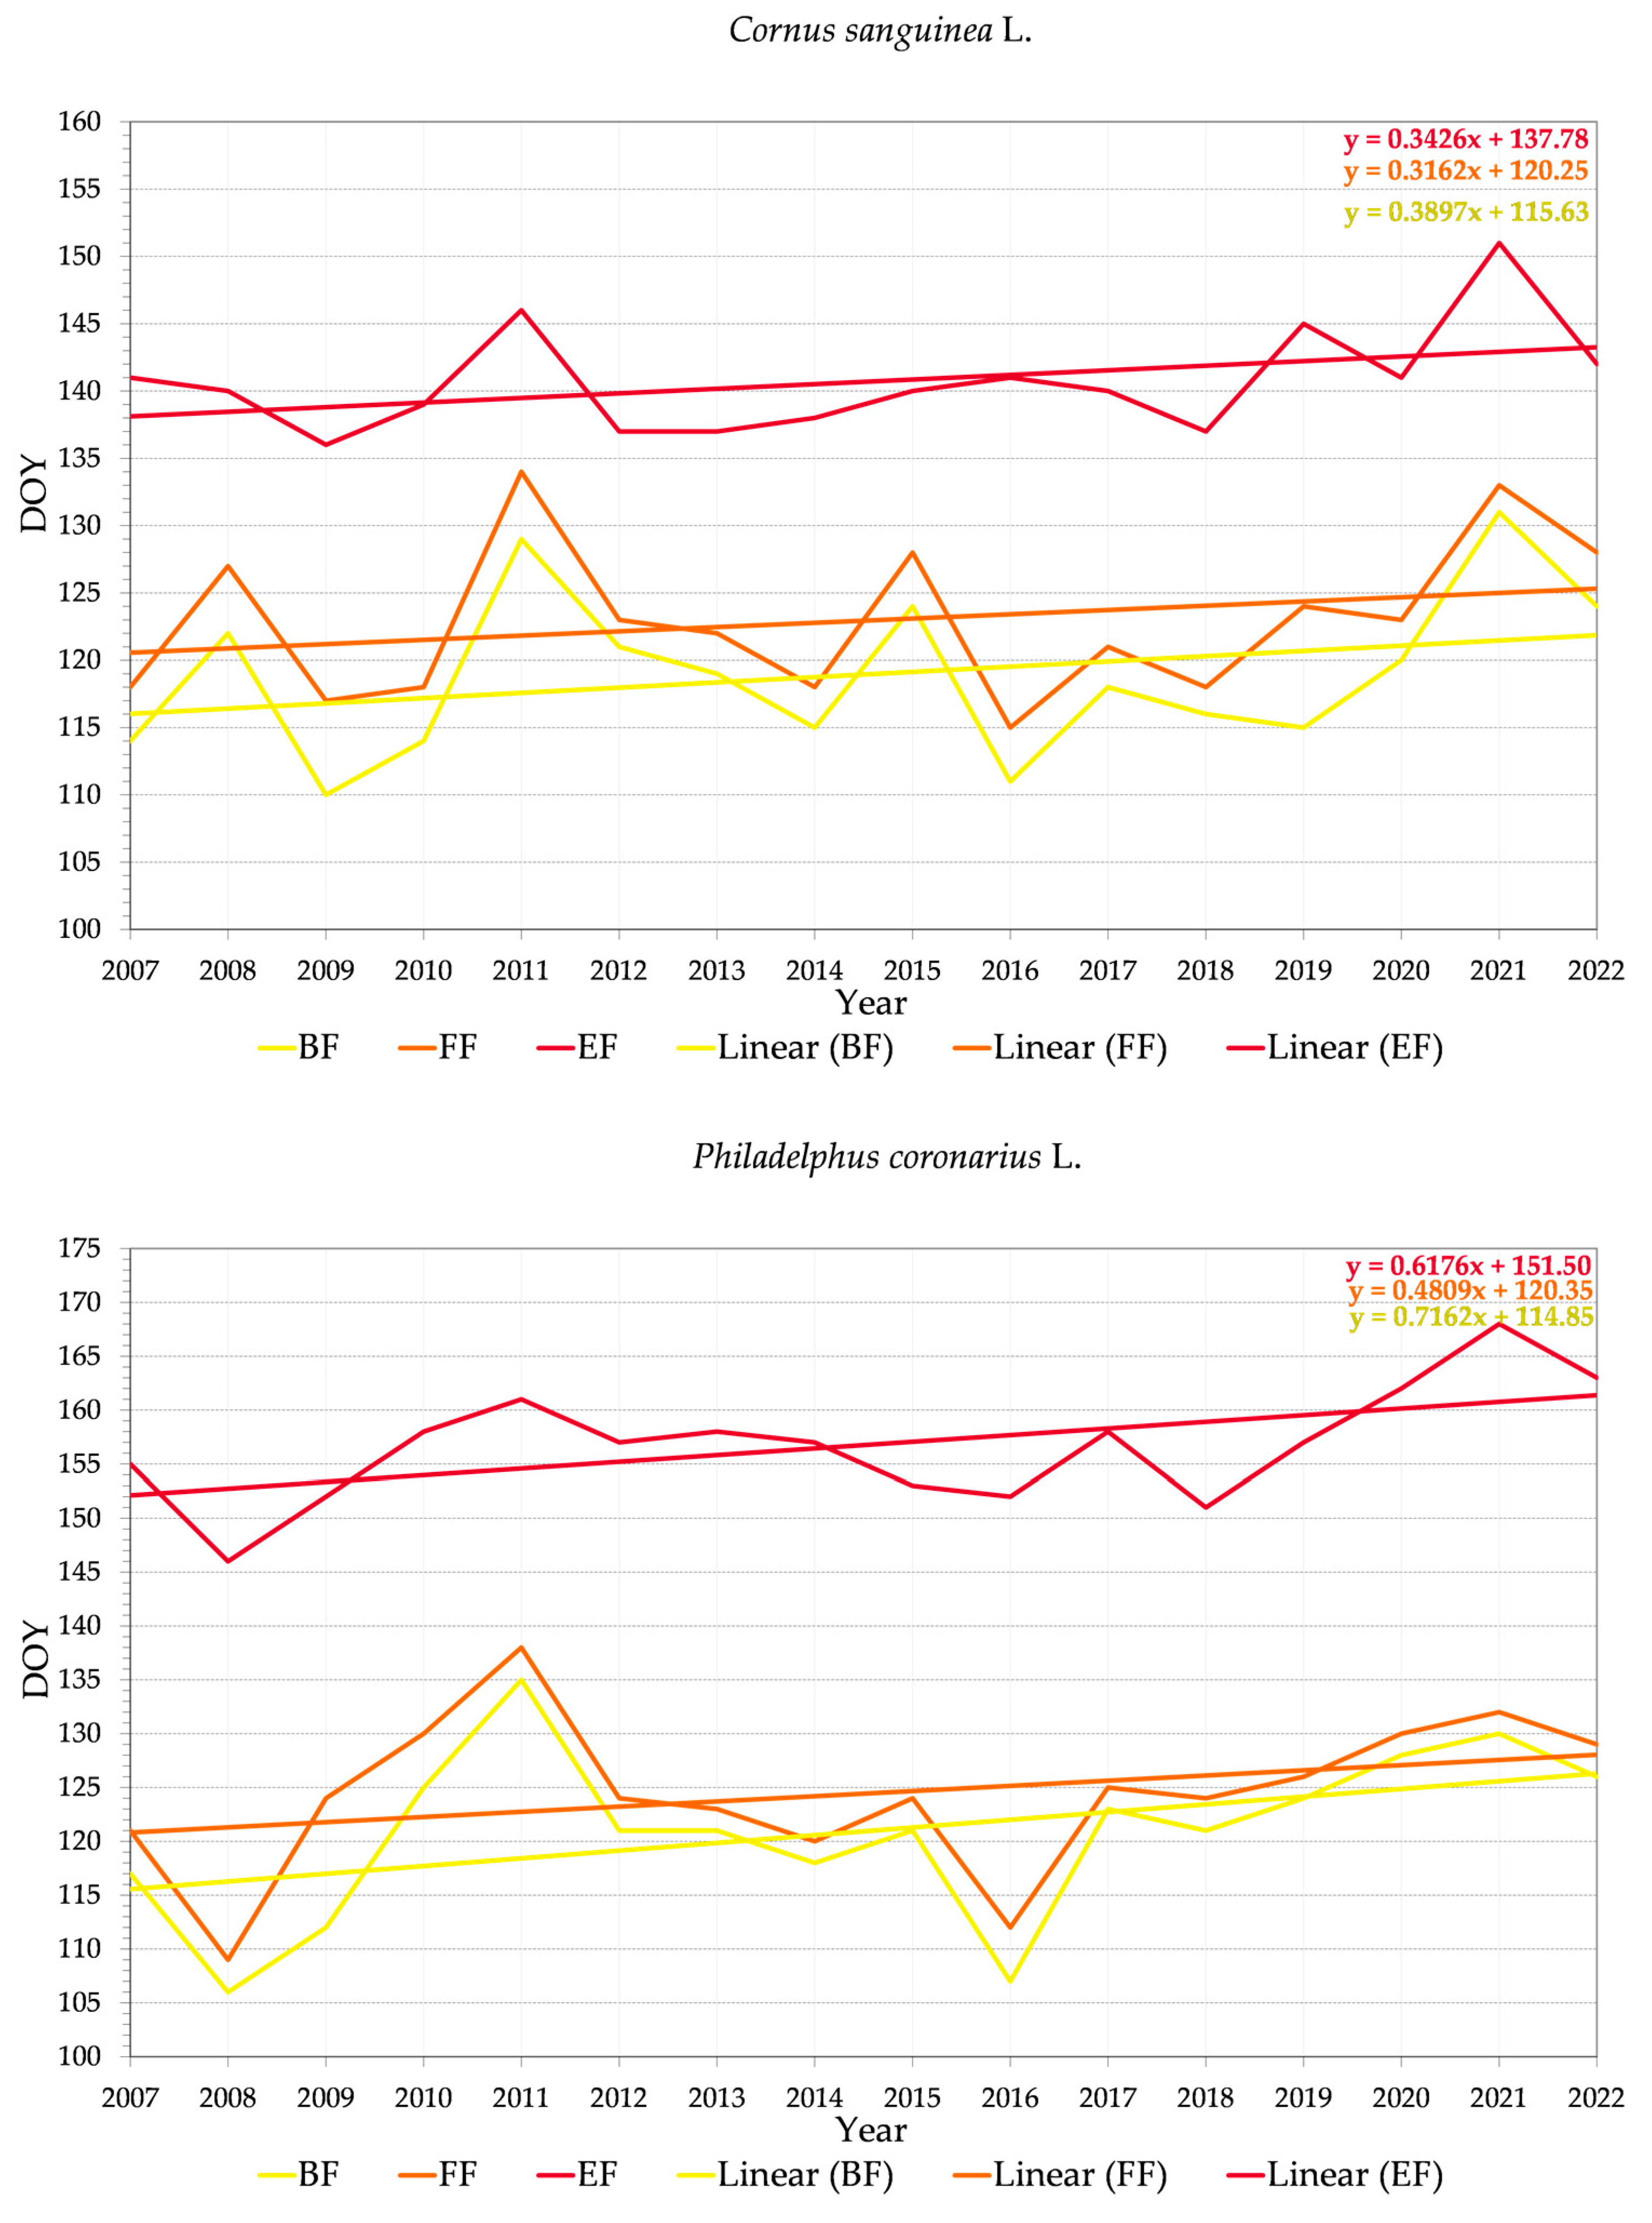
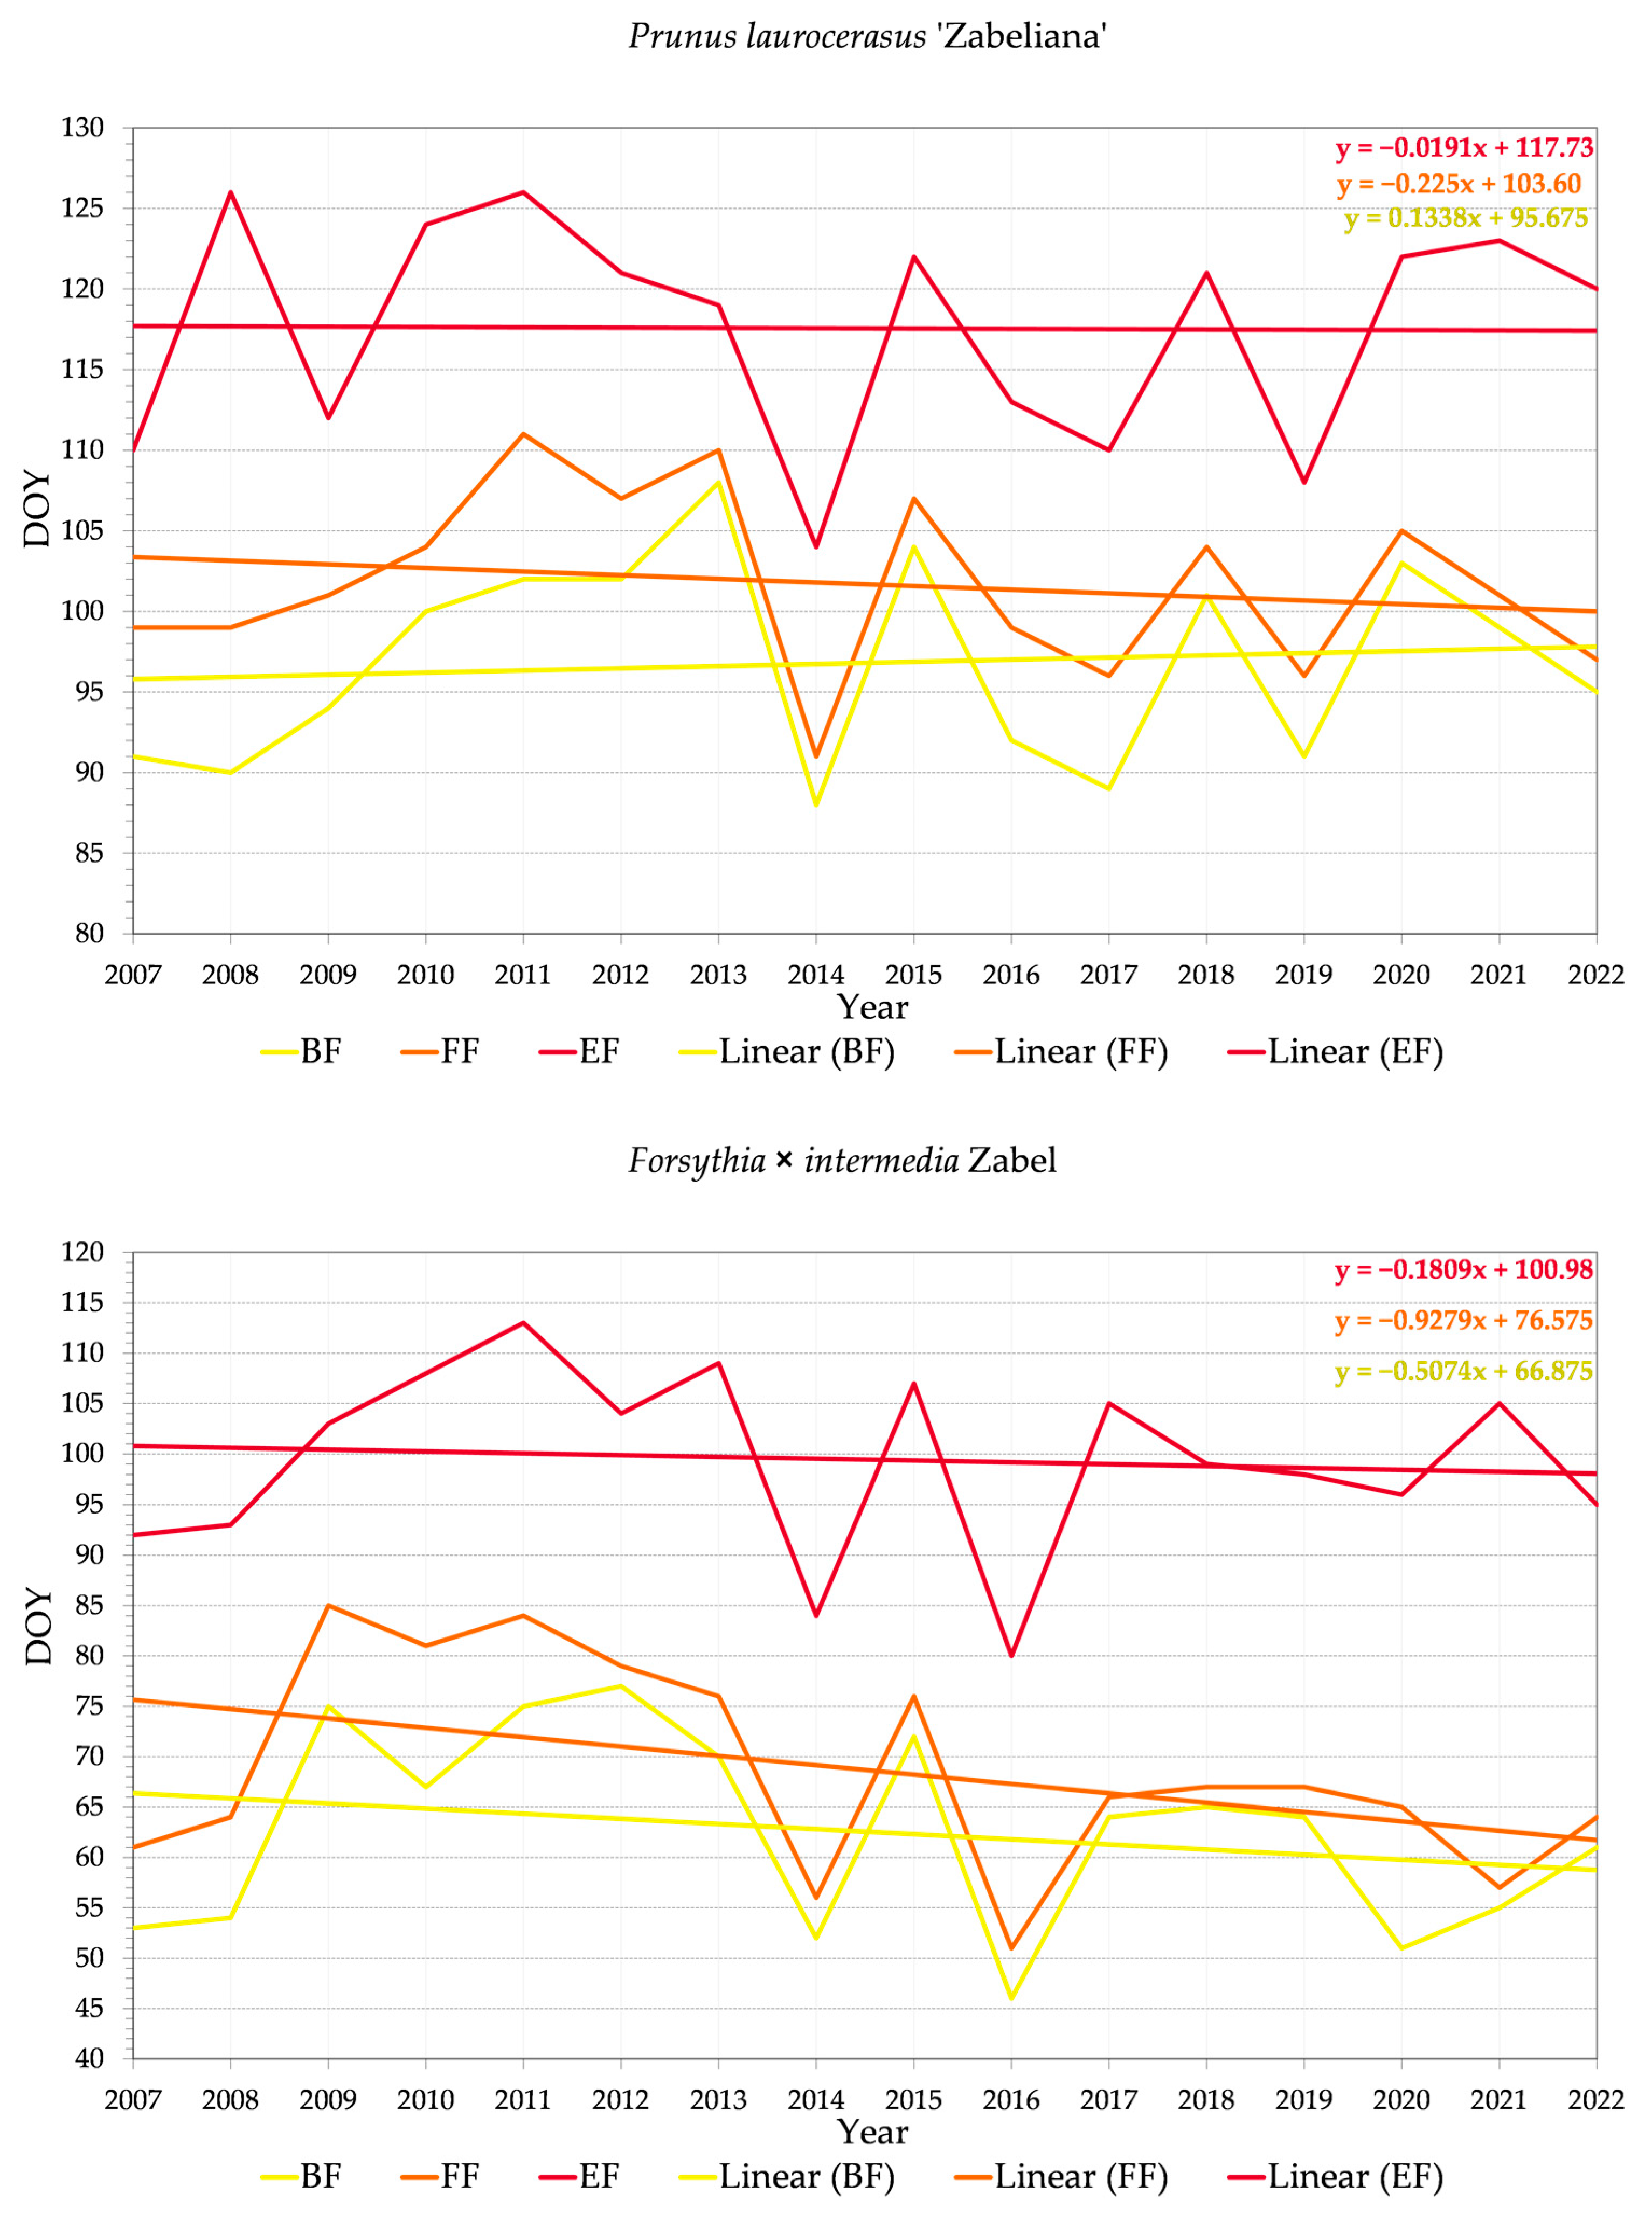
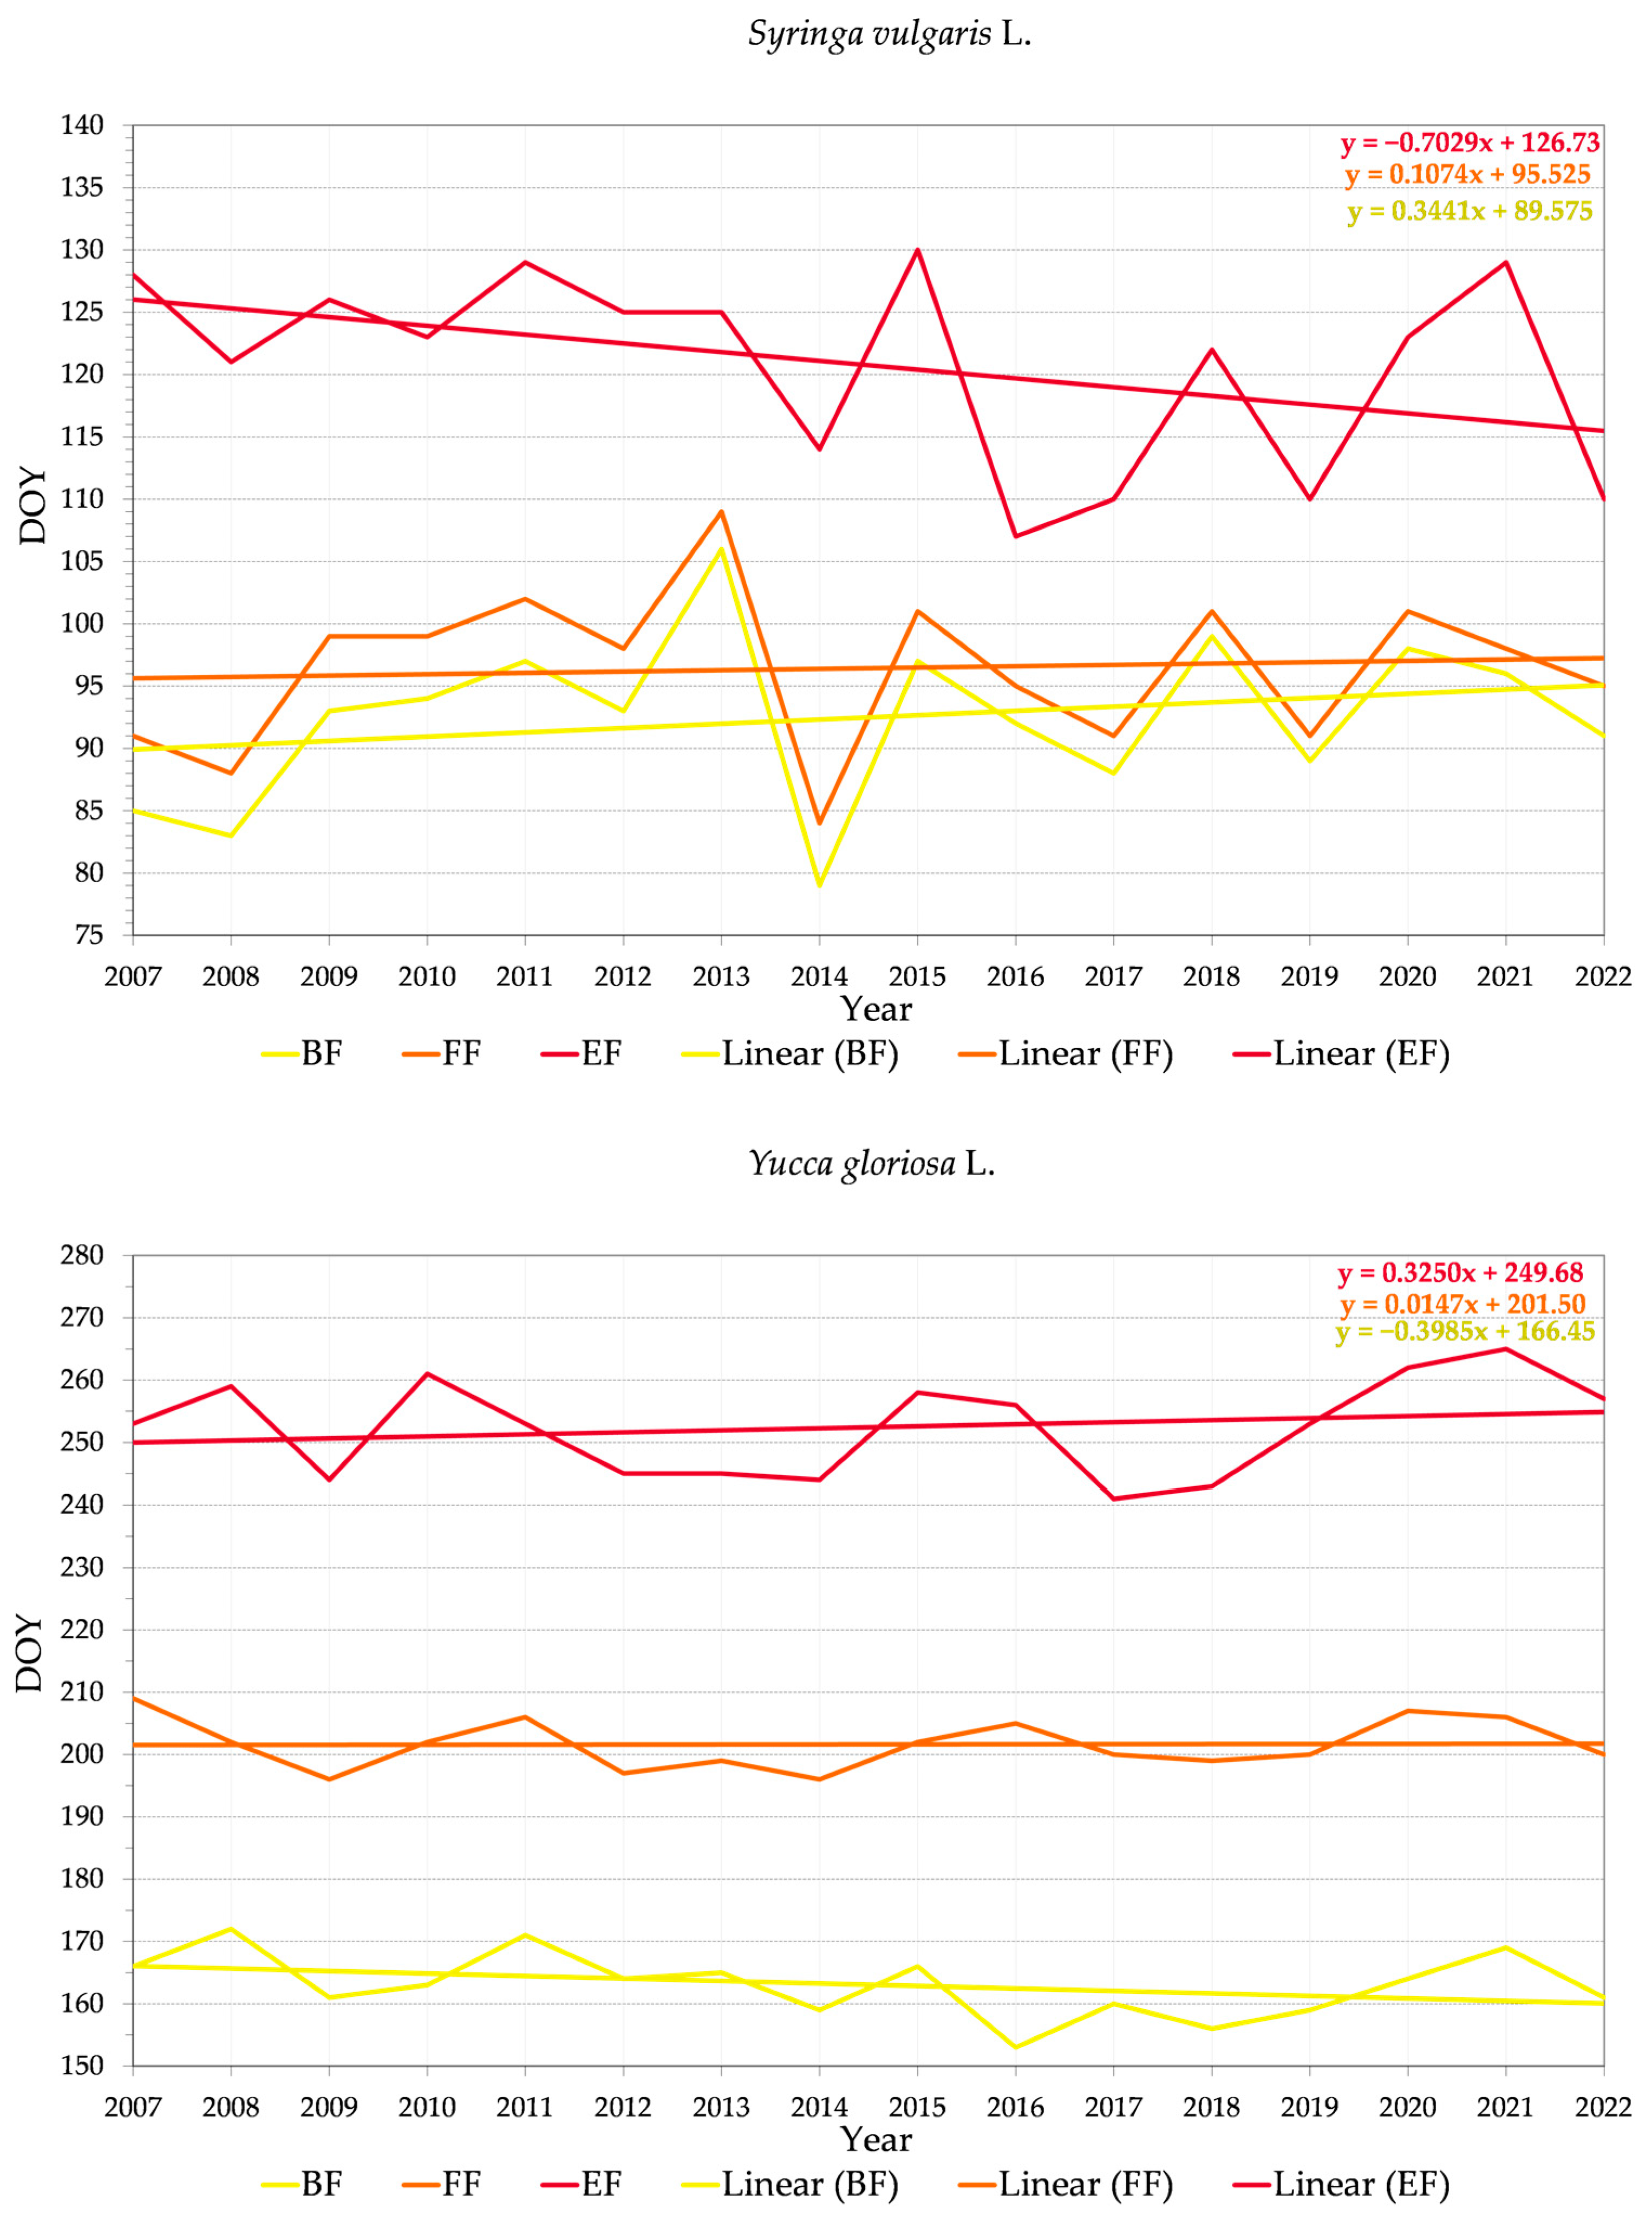
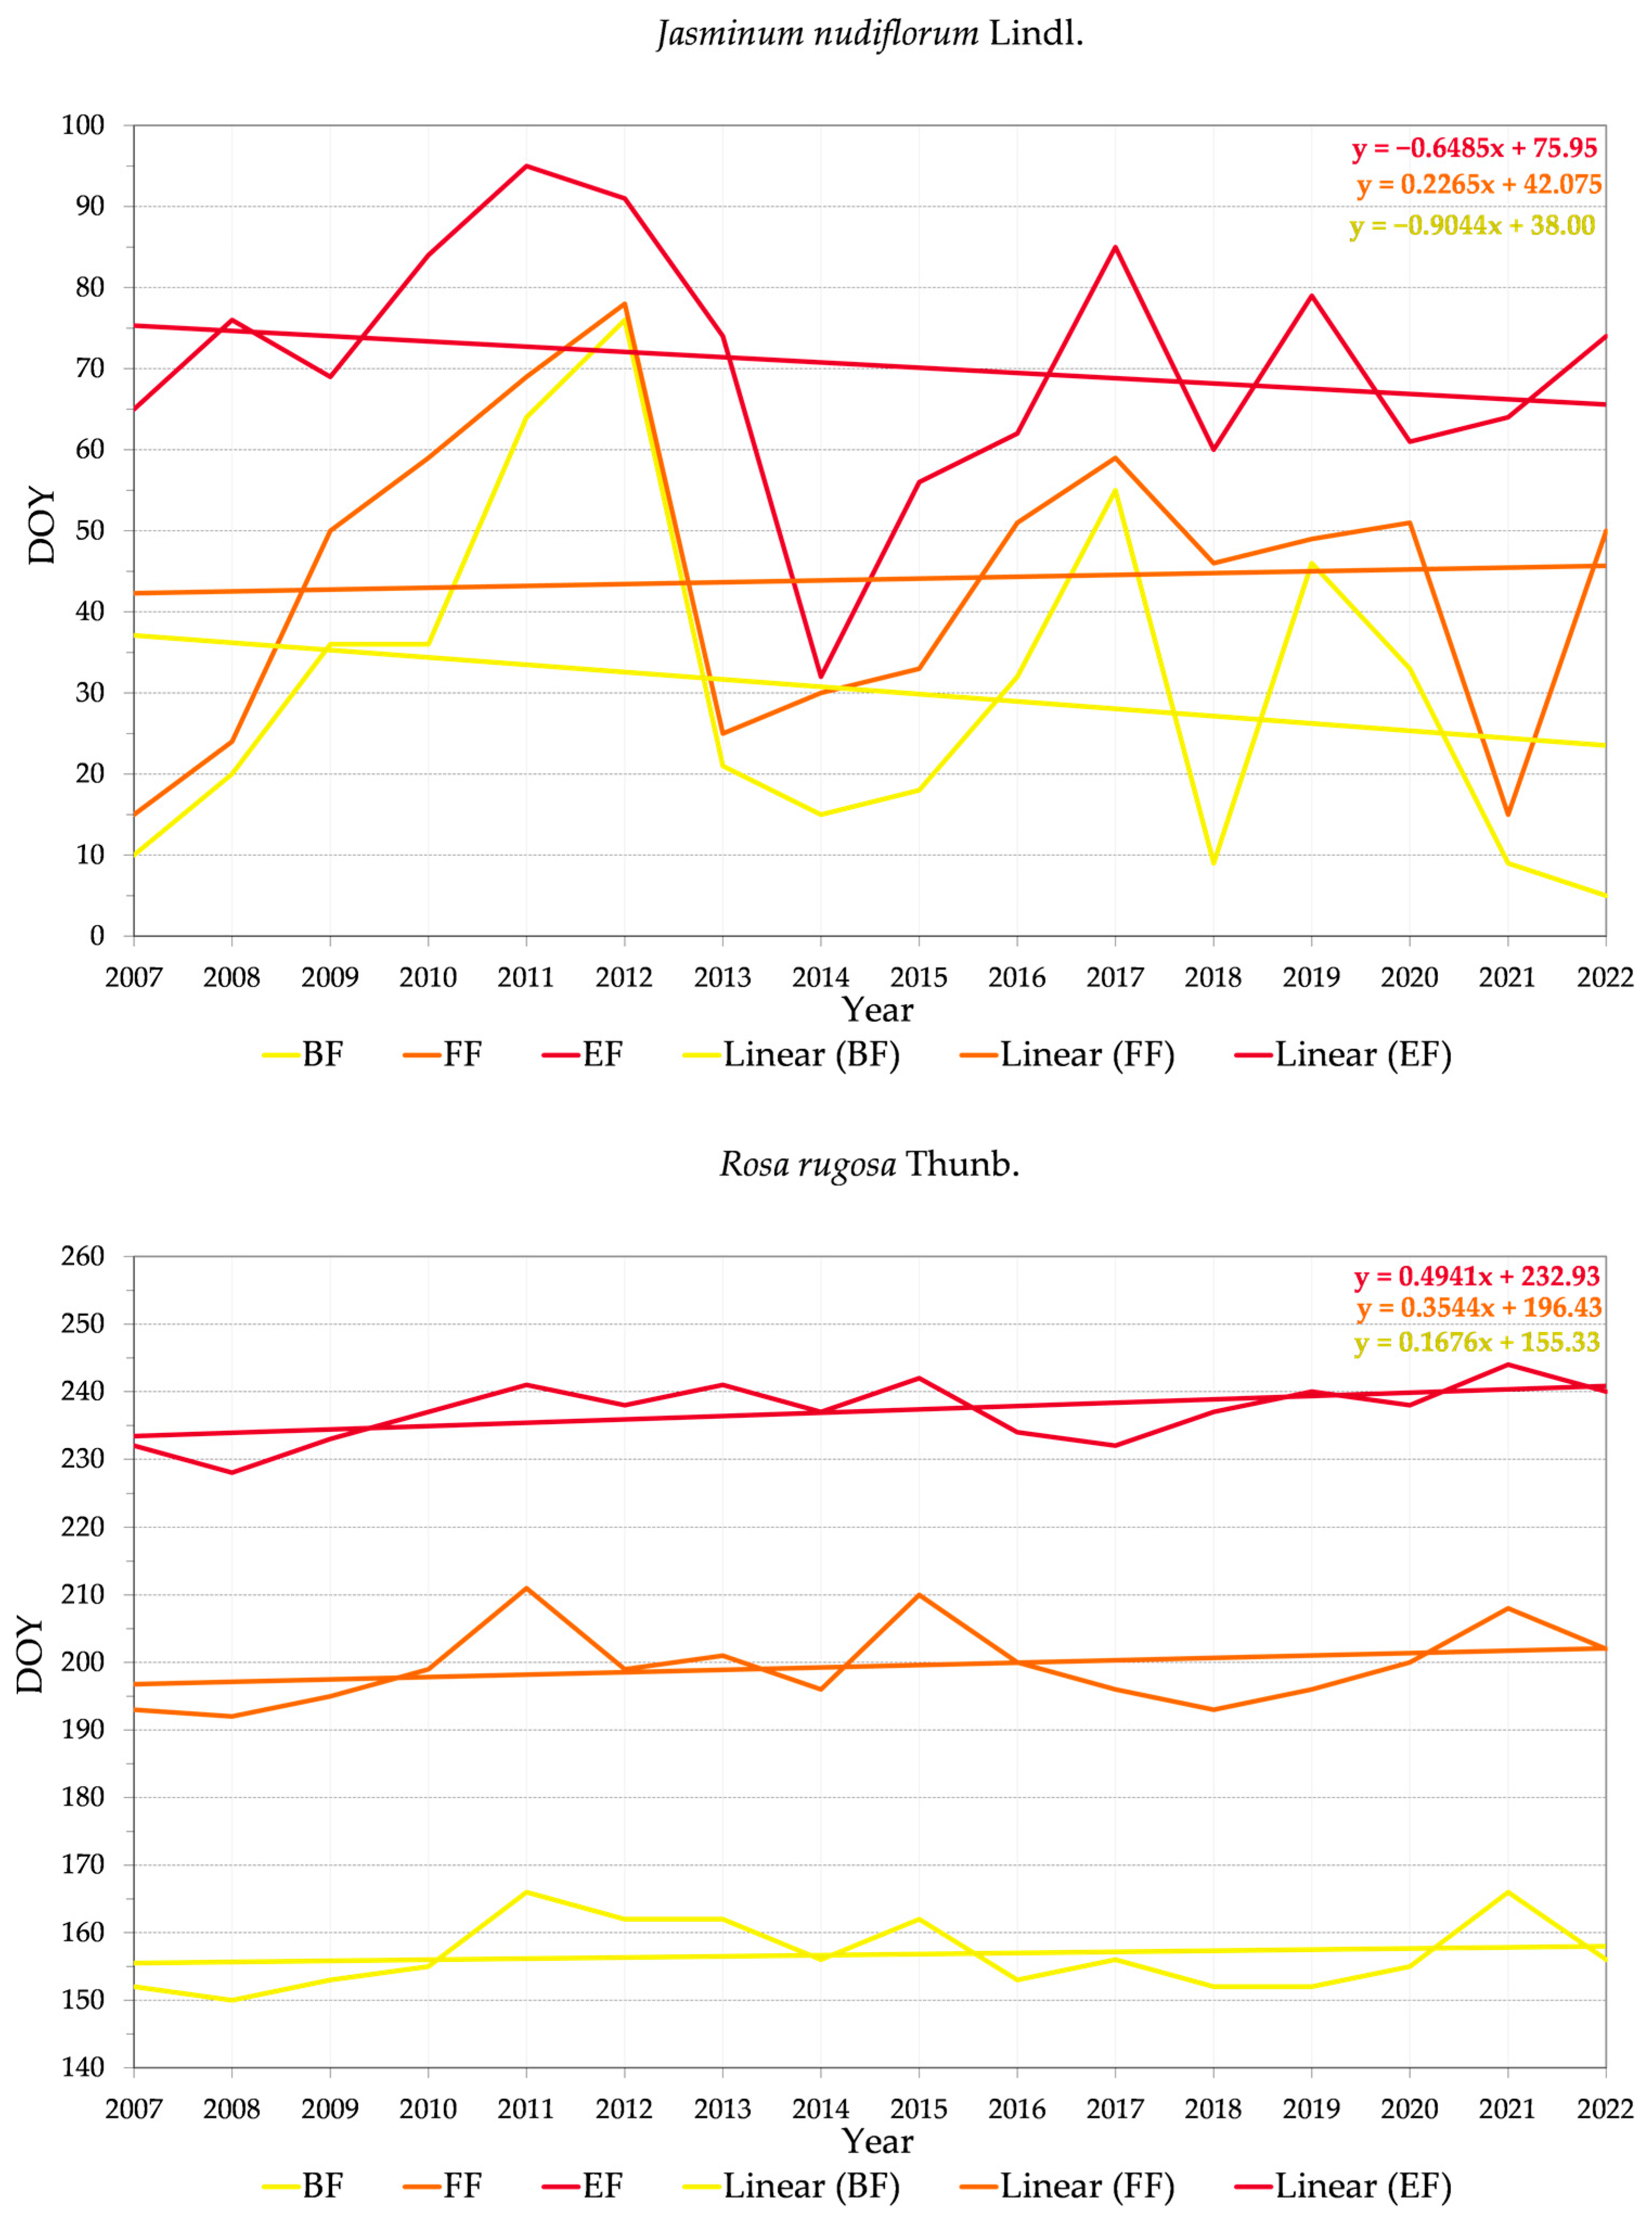
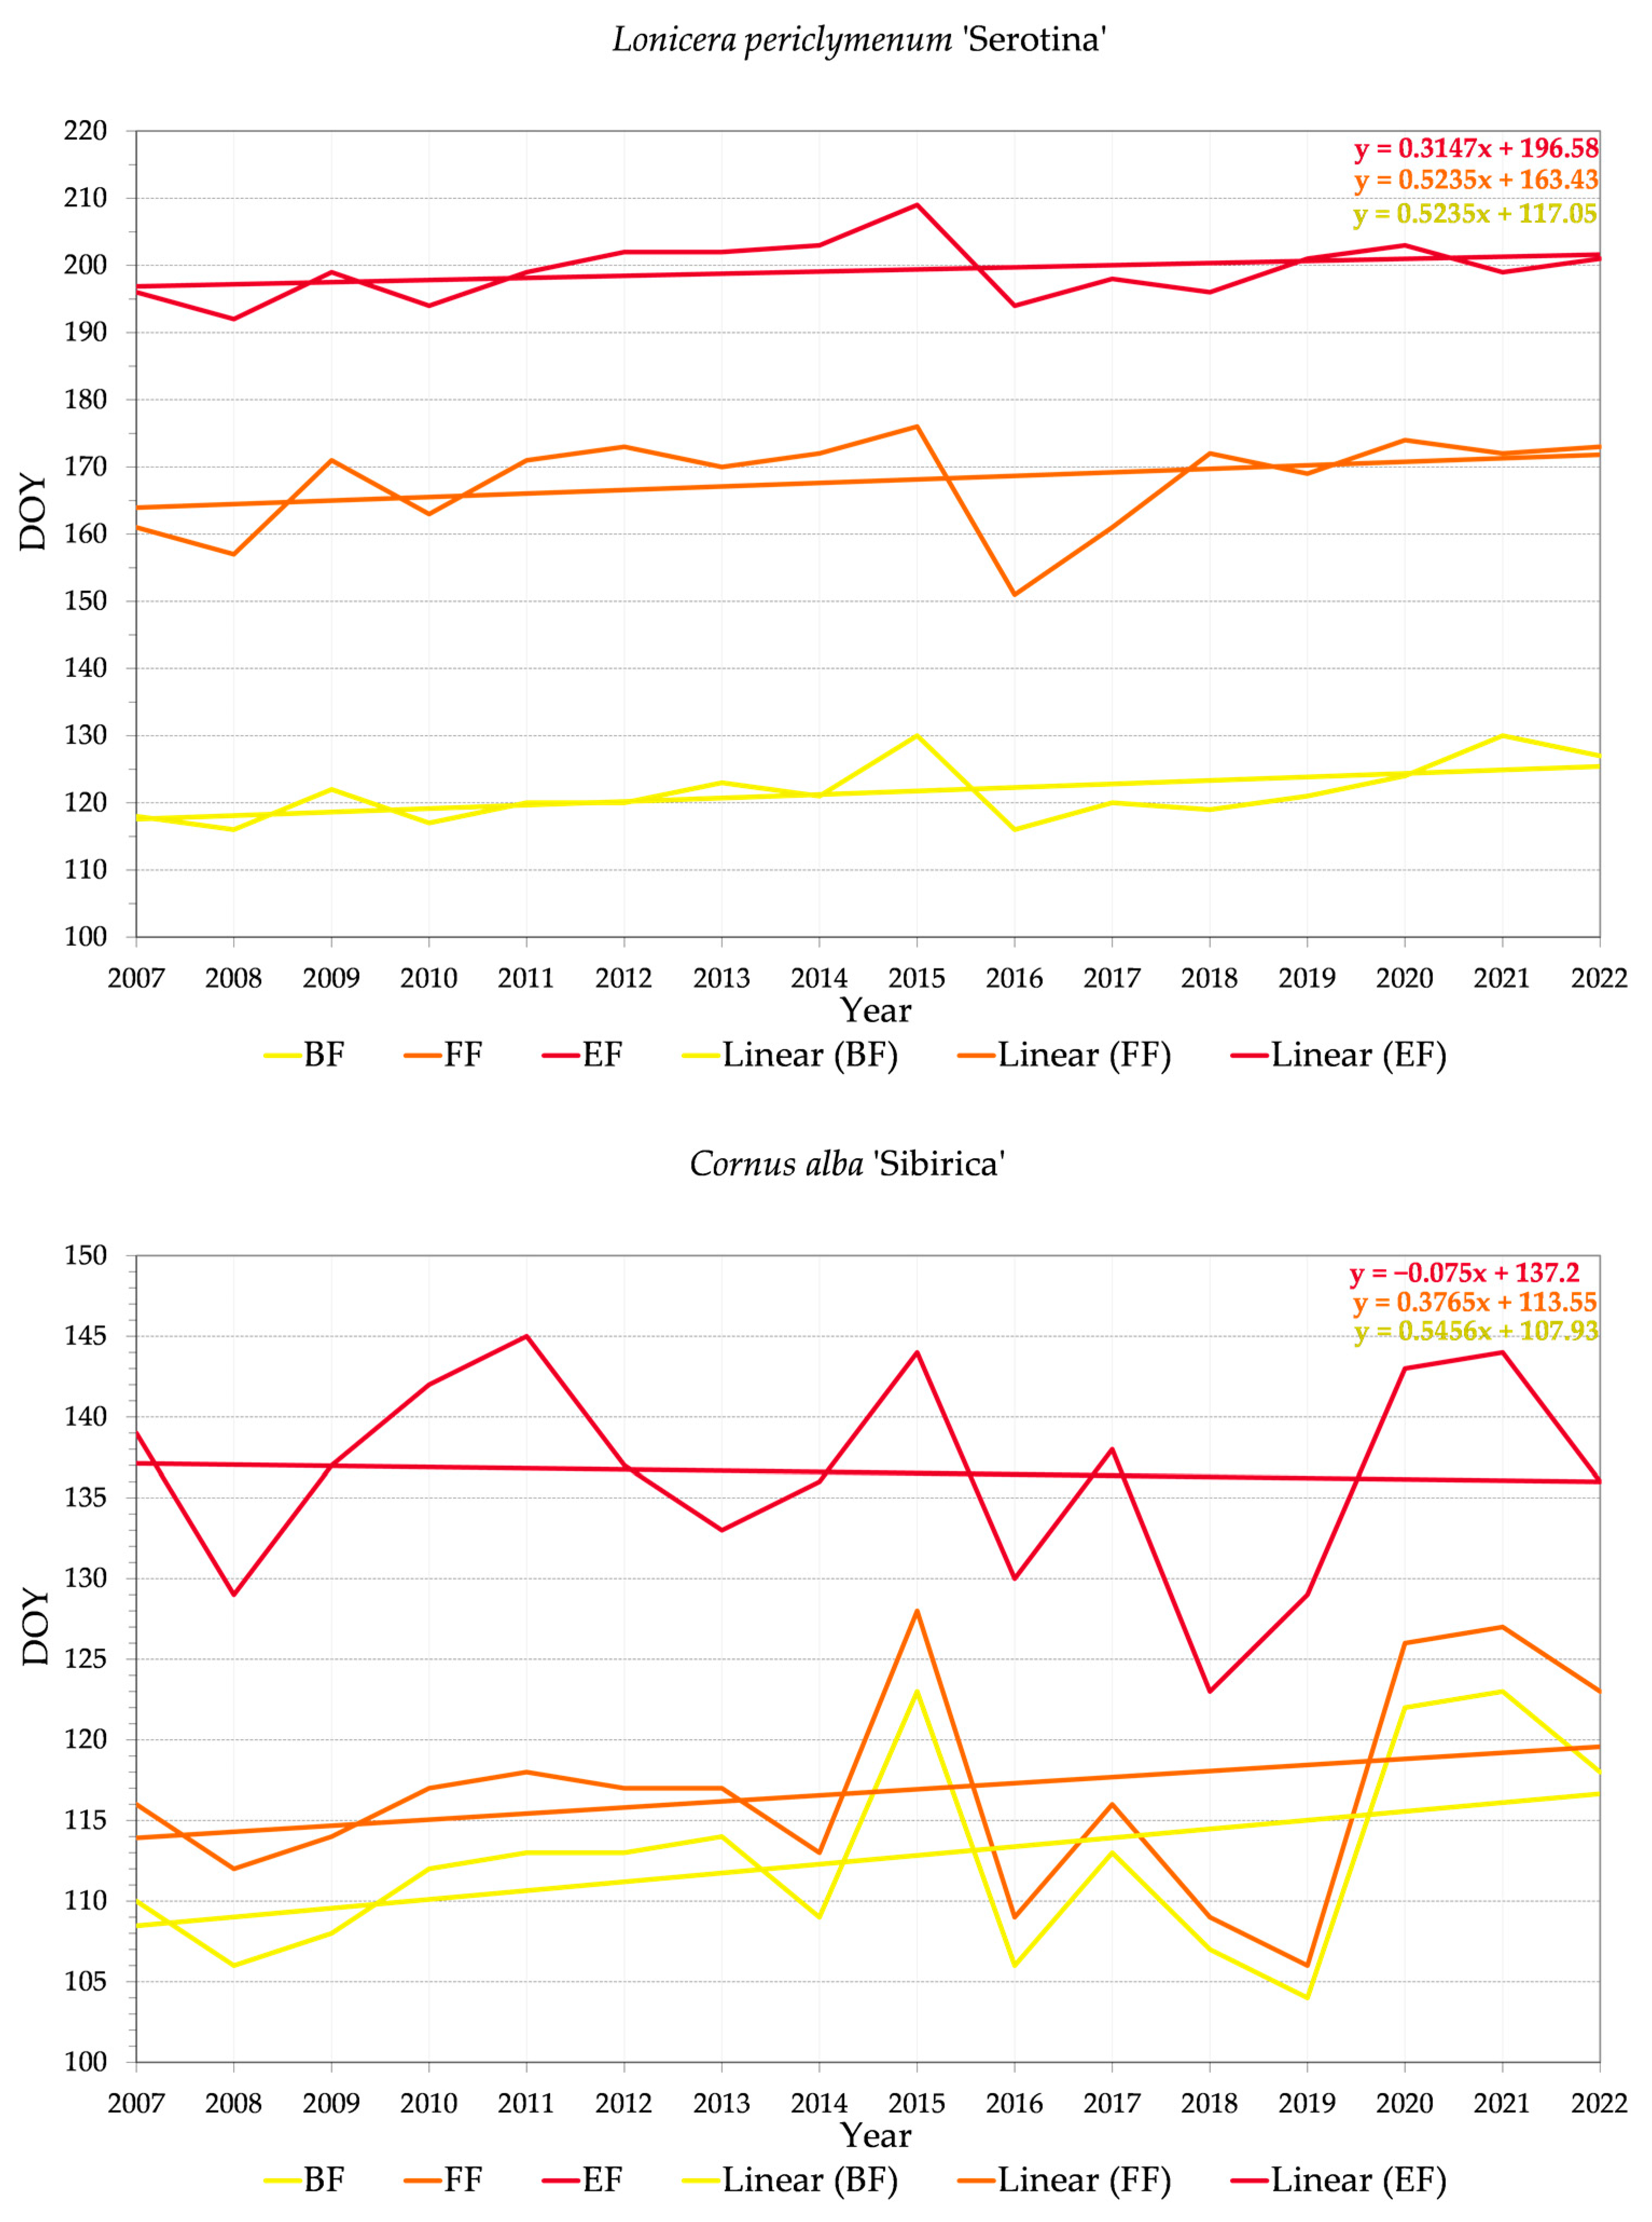
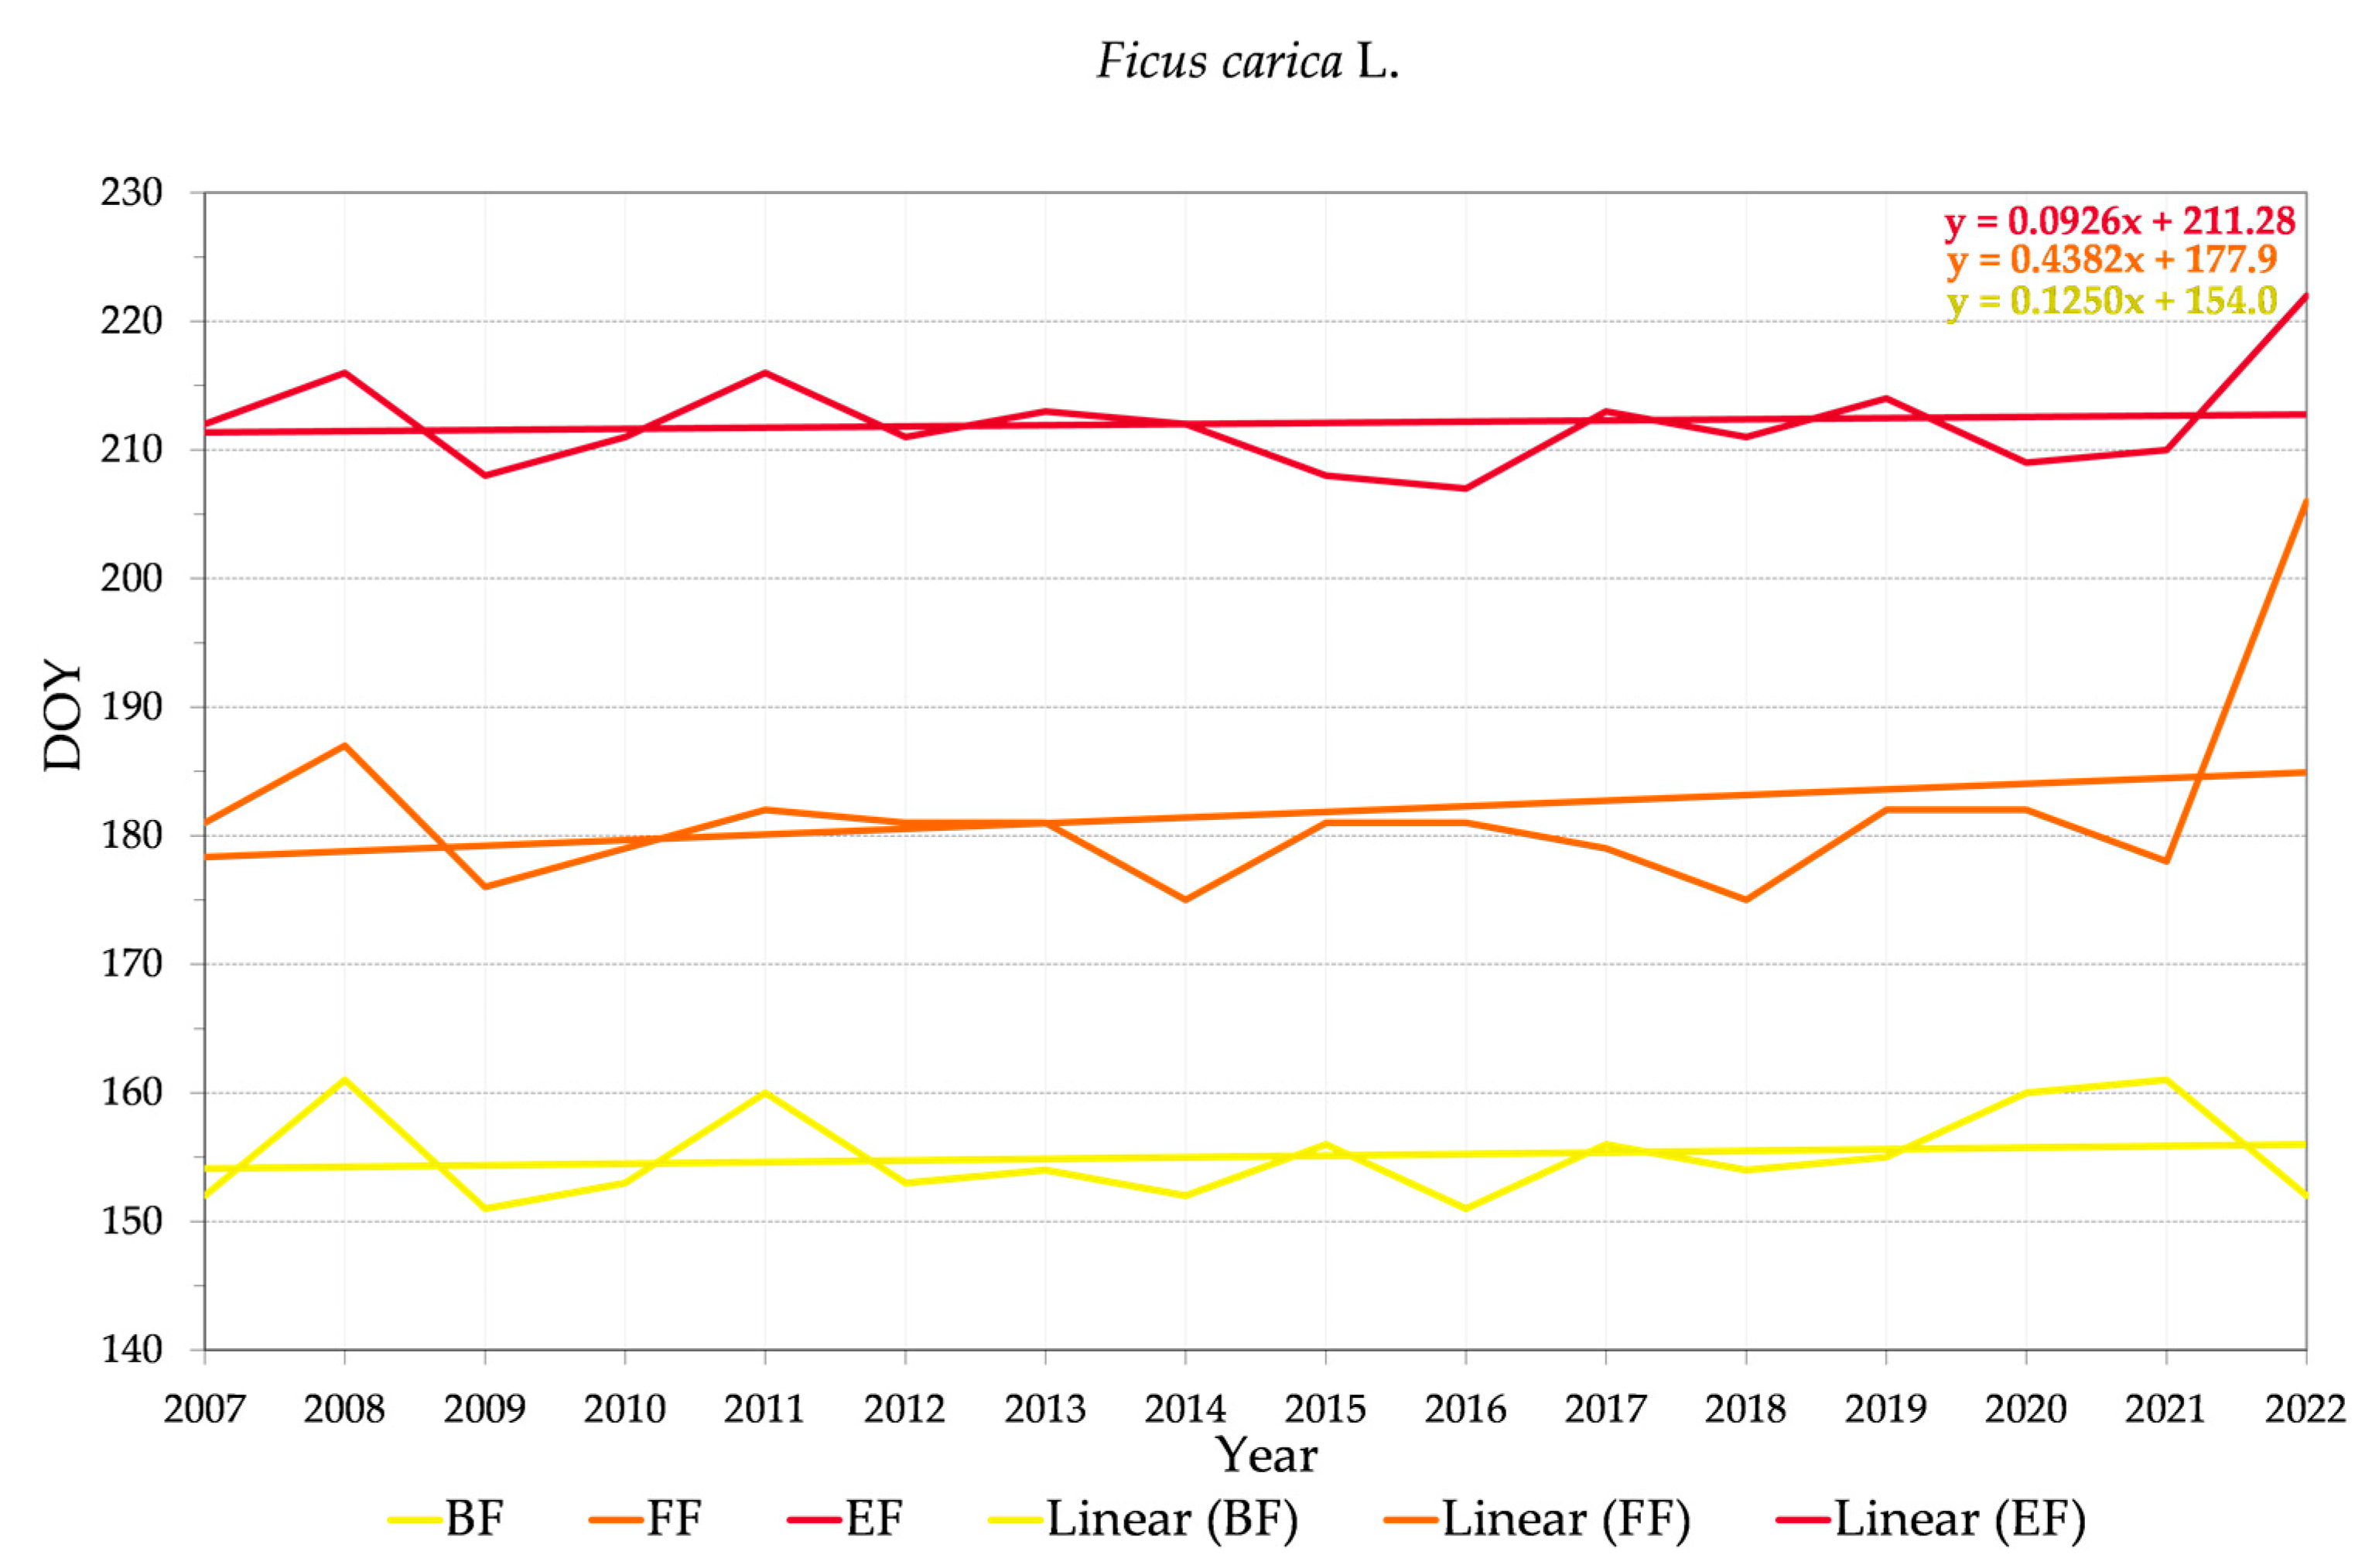
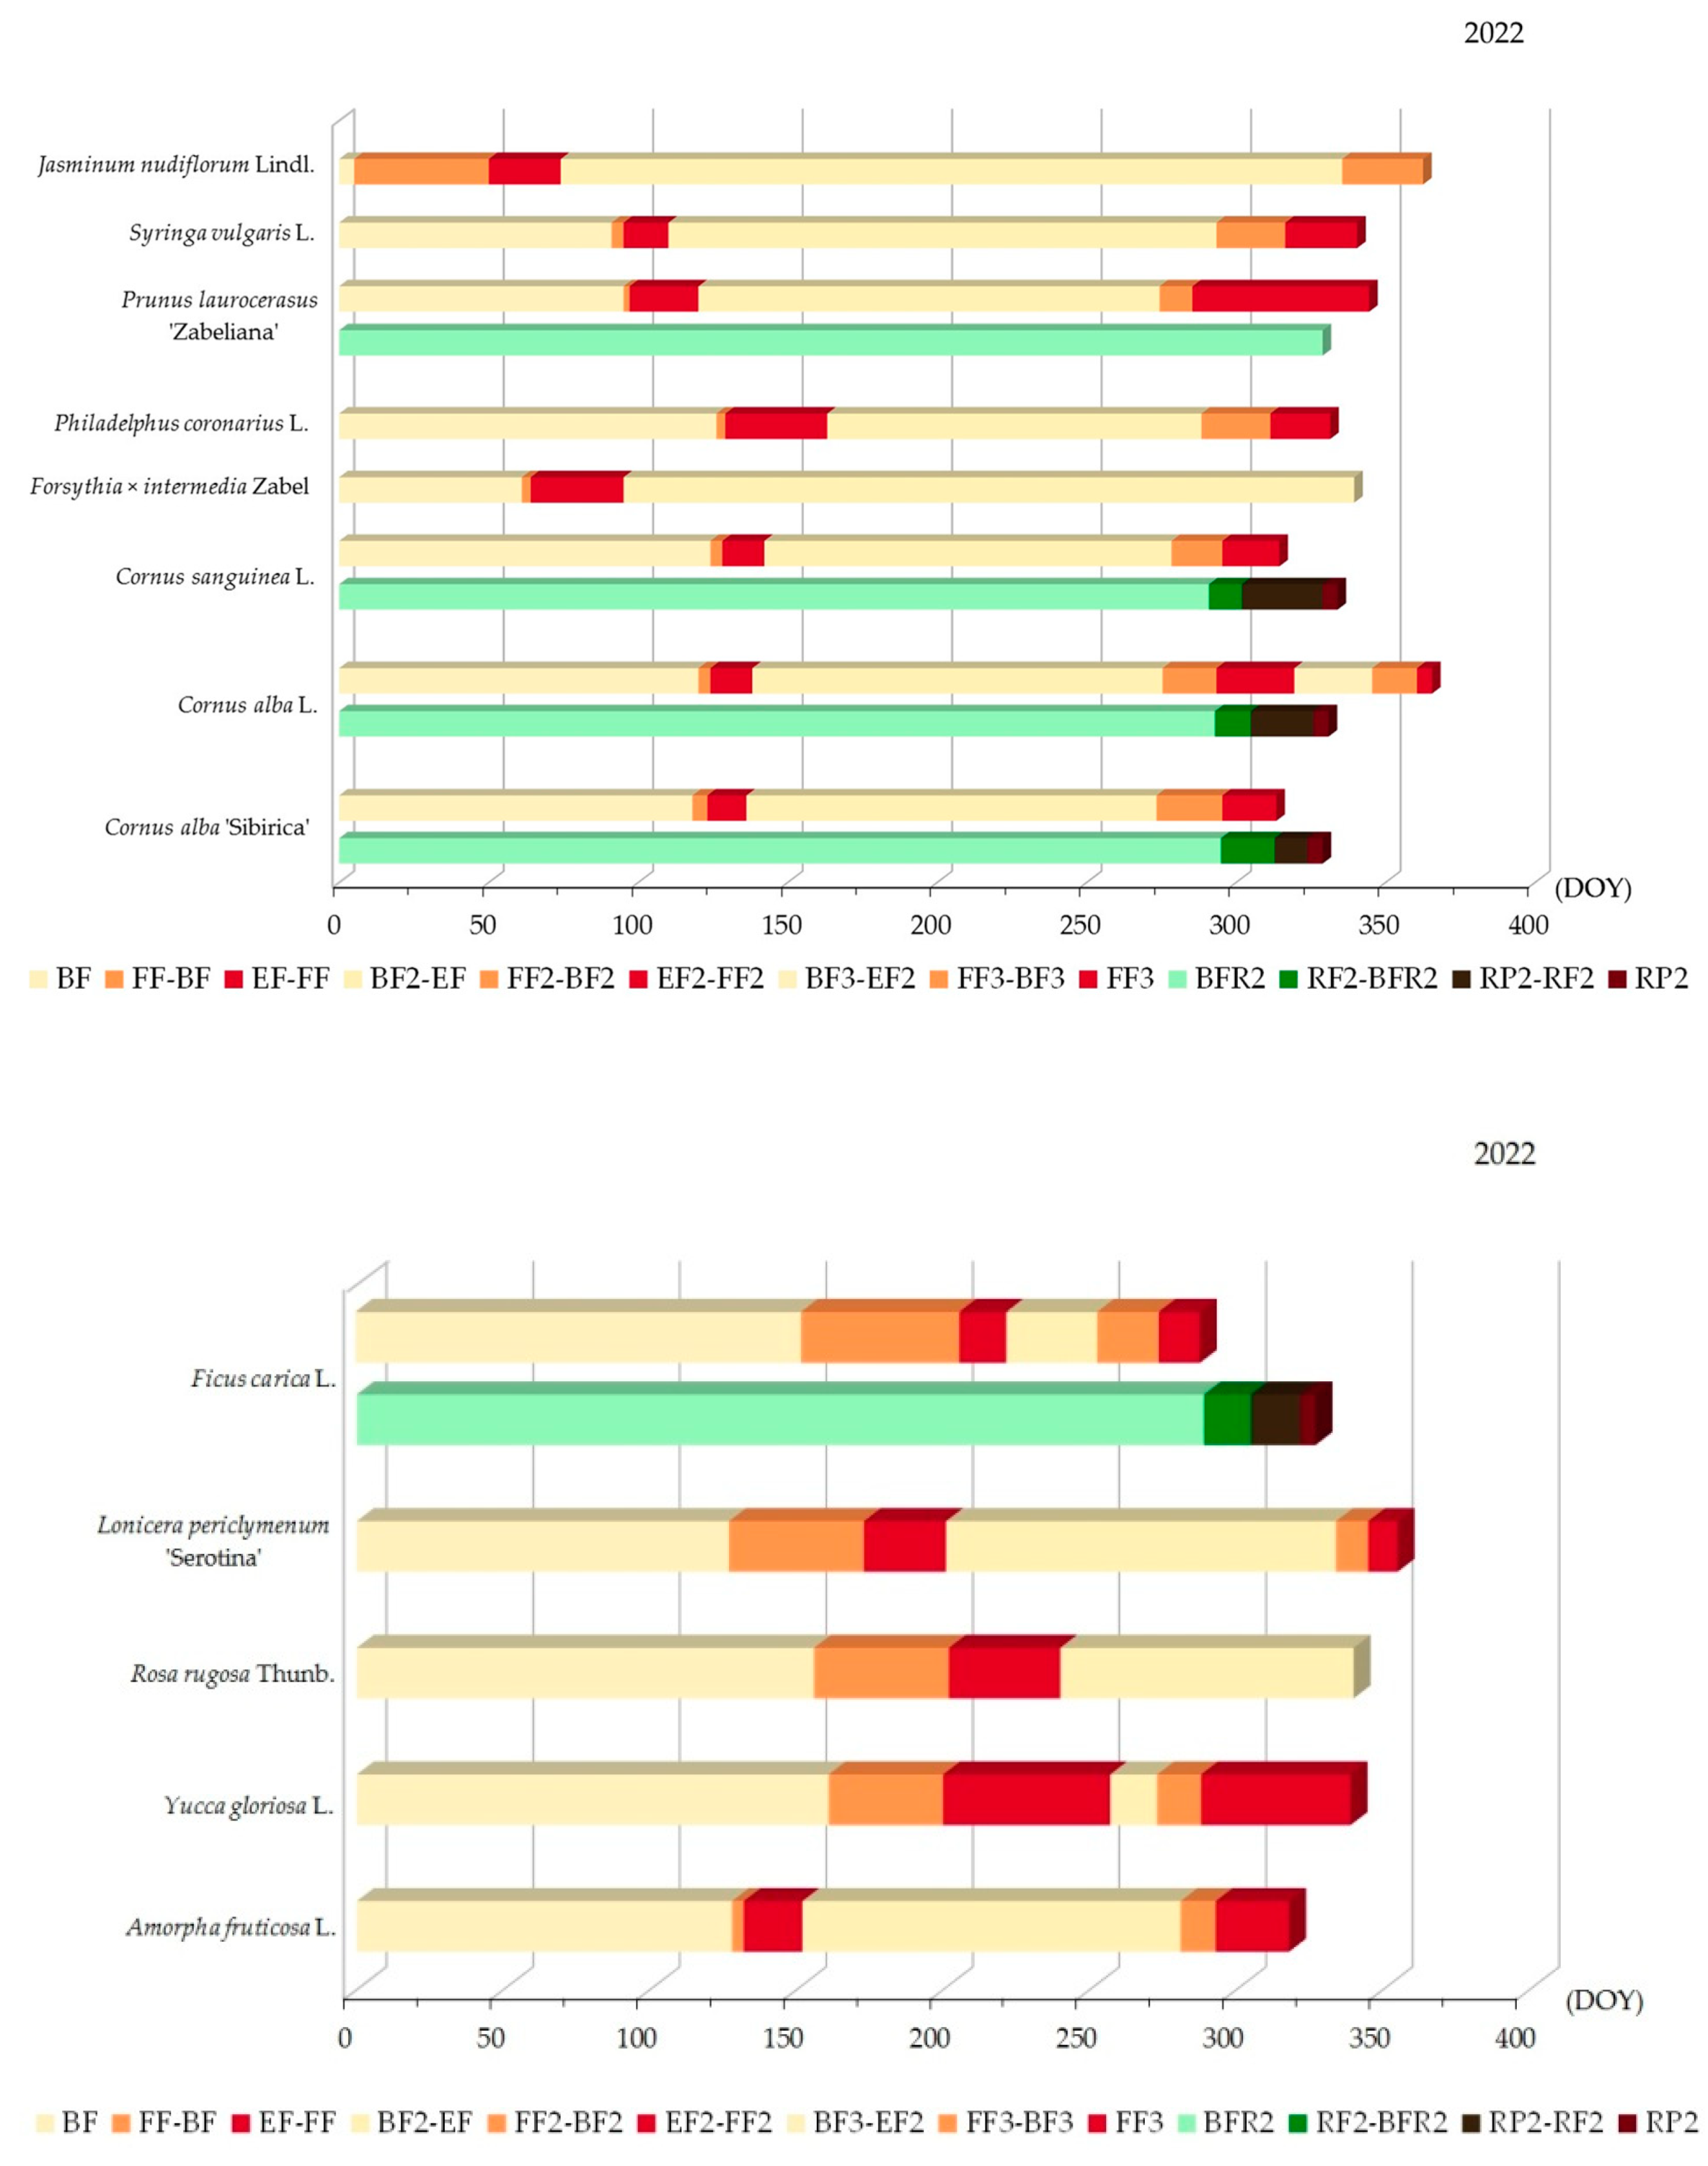
3.2.2. Variability of Relations between Flowering Phenophase and Day of the Year (DOY)

To determine the number of days from one phenological phase to another for 13 taxa from our study for the period 2007–2022, our own records were used. Descriptive statistics such as mean, minimum, and maximum values and standard deviation were calculated for each observed flowering phenophase and are shown in Table S7. To assess trends, mean value and standard deviation were calculated. The mean value provides information about the position of the phenophases in the calendar and the standard deviation illustrates the variability of the duration of the phenophase. The change in mean values indicates phenophase shifts and the standard deviation implies the duration of the phenophase. Our 13 taxa varied in the beginning of the flowering (BF) from 30th DOY for Jasminum nudiflorum Lindl. to 120 DOY for Philadelphus coronarius L., with the biggest standard deviation seen in the beginning of the flowering in Jasminum nudiflorum Lindl. (21.124).
Plants flowering in late winter or early spring had average DOYs (Supplementary Materials Table S7) for the onset of flowering of 30 and 63 (Weeping Winter Jasmine and Border Forsythia), in early or mid-spring of 93 and 97 (Common Lilac and Zabel’s Laurel), and in late spring and early summer 113, 114, 119, and 121 (Siberian Dogwood, Tartarian Dogwood, Common Dogwood, and European Mock-Orange). In the suburban zone, the lowest average DOYs (Table S7) for flowering initiation were 122, 132, 155, 157, and 163 (Honeysuckle, Indigo Bush, Edible Fig, Rugosa Rose, and Spanish Dagger). The high standard deviations (Table S7) were observed for all flowering phenophases of Weeping Winter Jasmine and from the beginning of the flowering to full flowering for Zabel’s Laurel and Border Forsythia. Apart from the case of Zabel’s Laurels, the standard deviations were low with a tendency to be close to the expected value. Based on 16 annual records, it was determined that flowering begins earliest in the species Jasminum nudiflorum Lindl. and latest in Yucca gloriosa L. From the beginning of flowering to full flowering, the smallest number of days (3.5) passes in Philadelphus coronarius L. and the largest (46.4) in Lonicera periclymenum ‘Serotina’. From full flowering to the end of flowering, at least 15.9 days pass (Prunus laurocerasus ‘Zabeliana’) and at most 50.8 days for Yucca gloriosa L. (Figure 4).
Linear trends for DOY determined by the Mann–Kendall test for the observed flowering phenophases for 13 taxa for the period 2007–2022 are shown in Figure 5 and Table S6.
Comparative analysis of Kendall’s tau, Sen’s slope test, and p-value for the average number of days (Table S6 and Figure 6) revealed significant changes in the number of days to the beginning of flowering (Philadelphus coronarius L. and Lonicera periclymenum ‘Serotina’), the period from the beginning to full flowering (Syringa vulgaris L., Prunus laurocerasus ‘Zabeliana’, Philadelphus coronarius L., Forsythia × intermedia Zabel, Cornus alba L., and Cornus alba ‘Sibirica’), and from full flowering to the end of flowering (Forsythia × intermedia Zabel). A decreasing trend indicates fewer days from the beginning of the flowering to full flowering in Common Lilac, Zabel’s Laurel, European Mock-Orange, Border Forsythia, Tartarian Dogwood, and Siberian Dogwood. The growing trend in Border Forsythia confirms the extended flowering phenophase, i.e., a greater number of days from full flowering to the end of flowering.
The values of the Spearman coefficient (ρ) for the mean values of temperature sums and DOY for the corresponding periods of the flowering phenophase for the 13 observed taxa are not statistically significant (at the p < 0.05 level), i.e., they show that, between the mean values of temperature sums and the mean DOY, there is no constantly increasing or constantly decreasing connectivity.

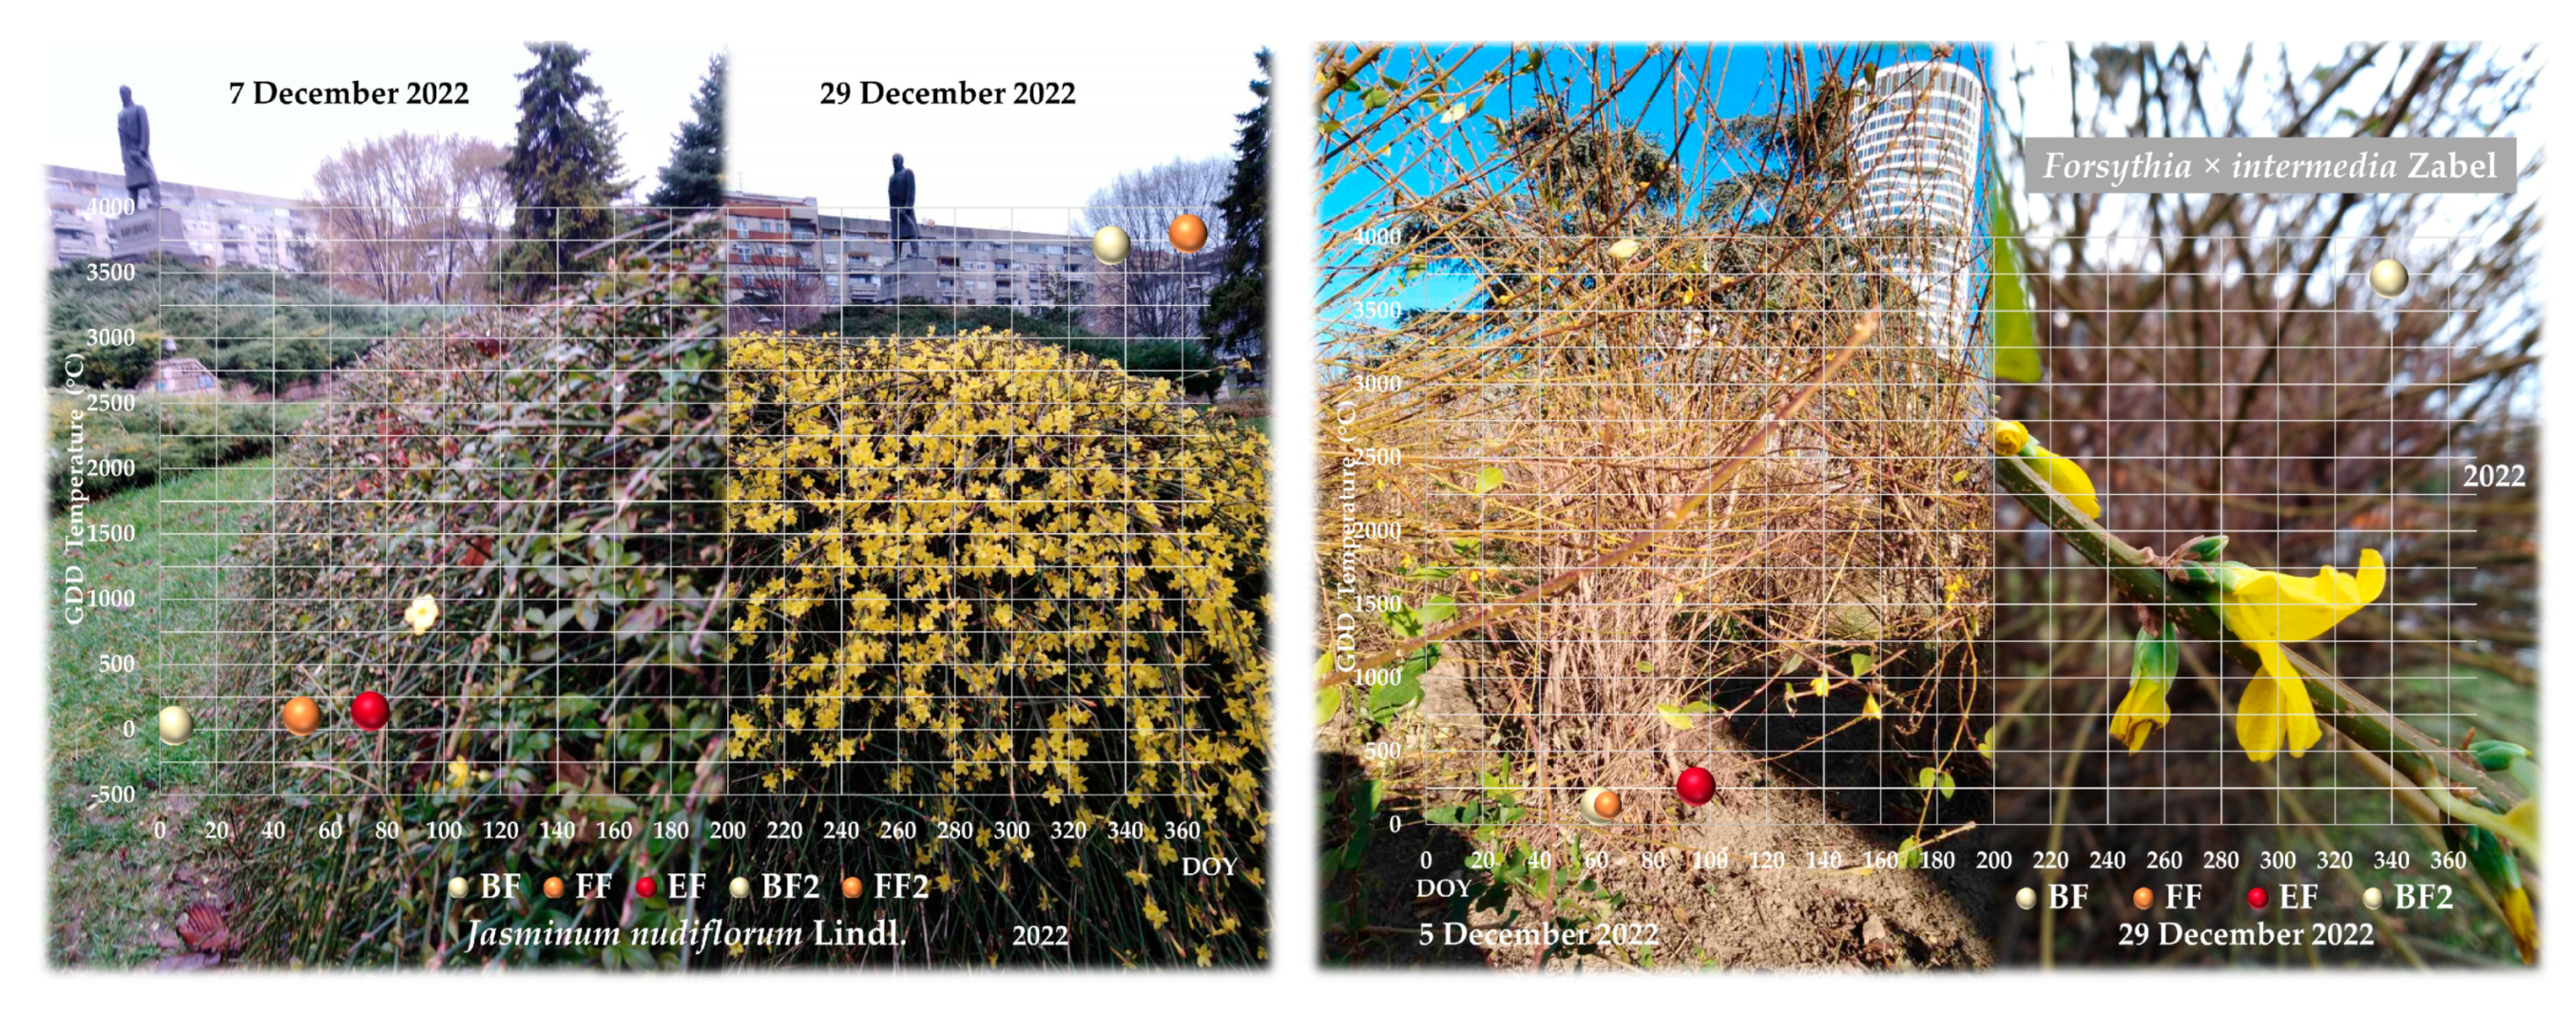
3.3. Relationships between Phenophases and Temperature during 2022

In the case study in 2022, the following temperature sums were necessary for the initiation of the first flowering (Figure 7): Jasminum nudiflorum Lindl. (29.2 °C), Forsythia × intermedia Zabel (127.2 °C), Syringa vulgaris L. (249.5 °C), Prunus laurocerasus ‘Zabeliana’ (260.6 °C), Cornus alba ‘Sibirica’ (447.4 °C), Cornus alba L. (467.1 °C), Lonicera periclymenum ‘Serotina’ (491.7 °C), Amorpha fruticosa L. (504.9 °C), Cornus sanguinea L. (516.6 °C), Philadelphus coronarius L. (545.1 °C), Ficus carica L. (859.8 °C), Rosa rugosa Thunb. (939.1 °C), and Yucca gloriosa L. (1025.5 °C).
The accumulated amounts of heat in 2022 were in the following DOY (Figure 8) for the initiation of the first flowering: Jasminum nudiflorum Lindl. (5), Forsythia × intermedia Zabel (61), Syringa vulgaris L. (91), Prunus laurocerasus ‘Zabeliana’ (95), Cornus alba ‘Sibirica’ (118), Cornus alba L. (120), Lonicera periclymenum ‘Serotina’ (127), Amorpha fruticosa L. (128), Cornus sanguinea L. (124), Philadelphus coronarius L. (126), Ficus carica L. (152), Rosa rugosa Thunb. (156), and Yucca gloriosa L. (161).
From the beginning to the end of the first flowering (duration of flowering), a different number of days passed depending on the taxon (Figure 8): Jasminum nudiflorum Lindl. (69), Forsythia × intermedia Zabel (34), Syringa vulgaris L. (19), Prunus laurocerasus ‘Zabeliana’ (25), Cornus alba ‘Sibirica’ (18), Cornus alba L. (18), Lonicera periclymenum ‘Serotina’ (74), Amorpha fruticosa L. (24), Cornus sanguinea L. (18), Philadelphus coronarius L. (37), Ficus carica L. (70), Rosa rugosa Thunb. (84), and Yucca gloriosa L. (96).
In 2022, Weeping Winter Jasmine, Border Forsythia, Common Lilac, Zabel’s Laurel, European Mock-Orange, Edible Fig, Rugosa Rose, and Spanish Dagger had an earlier onset of first flowering by one to 25 days and, later, in 4 to 6 days: Siberian Dogwood, Tartarian Dogwood, Honeysuckle, Indigo Bush, and Common Dogwood.
The phenophase to first flowering in 2022 compared with the sixteen-year average for the taxa, for which data from the Surčin station were used, was longer for Indigo Bush (2 days), Edible Fig (13 days), Rugosa Rose (4 days), and Spanish Dagger (7 days) and shorter with Honeysuckle by 4 days. For the taxa for which data from the Belgrade station were used, it was longer for European Mock-Orange (1), Zabel’s Laurel (4 days), and Weeping Winter Jasmine (29 days) and shorter for Border Forsythia (3 days), Common Lilac (9 days), Siberian Dogwood (6 days), Tartarian Dogwood (8 days), and Common Dogwood (4 days).
For Jasminum nudiflorum Lindl., in 2022, for BF the DOY was 5, which means that it started flowering 25 days earlier compared with the period 2007–2022 (Figure 9). In the comparison of the first and second flowering in 2022, it was observed that the period from the beginning to the full second flowering was longer by 15 days compared with the 16-year annual average for the first flowering.
In 2022, the BF DOY of Forsythia × intermedia was 61 (Figure 9), which means that it started flowering 2 days earlier compared with the period 2007–2022. Repeated flowering was recorded for 338 days and duration was up to 365 days.
For Syringa vulgaris Lindl., in 2022, for BF DOY was 91, which means it started flowering 2 days earlier compared with the period 2007–2022 (Figure 10). In the comparison of the first and second flowering in 2022, it was observed that the period from the beginning to the full second flowering was 9 days longer compared with the 16-year annual average for the first flowering; from the full flowering to the end of the second flowering is identical to the average value for the first flowering in Belgrade.
In 2022, the BF DOY of Prunus laurocerasus ‘Zabeliana’ was 95 (Figure 10), so it started flowering 2 days earlier compared with the period 2007–2022. By comparing the first and second flowering in 2022, it was observed that the period from the beginning to the full second flowering was shorter by 3 days compared with the 16-year average for the first flowering; from full flowering to the end of the second flowering was longer by 7 days. The beginning of the second fruiting of BFR2 was recorded at the 361st day and lasted until 365 days, while no fruit ripening was recorded. In 2022, the cultivar had a completely repeated flowering lasting 73 days, fruits were formed for the second time, and flower buds were formed for the third time at the end of December.
For Cornus alba ‘Sibirica’, in 2022, for BF the DOY was 118, which means that it started flowering 5 days later compared with the period 2007–2022 (Figure 11). In the comparison of the first and second flowering in 2022, it was observed that the period from the beginning to the full second flowering was longer by 17 days compared with the 16-year annual average for the first flowering; from full flowering to the end of the second flowering was shorter by 2 days. A second fruiting was noted and was completed and 18 days passed from the appearance of ripe fruits to the second fruit ripening. Our research recorded repeated complete flowering and fruiting in late autumn and early winter 2022.
In 2022, the BF DOY of Cornus alba L. was 120 (Figure 11), i.e., it started flowering 6 days later compared with the period 2007–2022. By comparing the first and the second flowering in 2022, it was observed that the period from the beginning to the full development of the second flowering was longer by 6 days compared with the 16-year annual average for the first flowering; from full flowering to the end of the second flowering was longer by 7 days. The beginning of the third flowering was recorded on 344 DOY and the full third flowering on 359 DOY, which also lasted until the 365th day of 2022. The second fruiting had all three phases and 33 days passed until the fruits fully ripened. In Belgrade, in 2022, a complete second flowering and fruiting appeared and, at the beginning of winter, the phenophase of the third full flowering happened, which lasted for 365 days.
For Lonicera periclymenum ‘Serotina’, in 2022, for BF the DOY was 127, which means it started flowering 5 days later compared with the period 2007–2022 (Figure 12). In the comparison of the first and the second flowering in 2022, it was observed that the period from the beginning to the full second flowering was shorter by 35 days compared with the 16-year annual average for the first flowering and from full flowering to the end of the second flowering by 9 days. Research has confirmed the repeat flowering of Honeysuckle in late autumn and early winter in 2022, even after the formation of a one-day snow cover on 346 DOY; it lasted until day 363.
In 2022, for Amorpha fruticosa L., BF DOY was 128 (Figure 12), so it started flowering 4 days later compared with the period 2007–2022. By comparing the first and the second flowering in 2022, it was observed that the period from the beginning to the full second flowering was longer by 8 days compared with the 16-year annual average for the first flowering; from full development to the end of the second flowering was longer by 5 days. Our study confirmed a repeated full flowering during the fall of 2022.
For Cornus sanguinea L., in 2022, BF DOY was 124, which means that it started flowering 6 days later compared with the period 2007–2022 (Figure 13). In the comparison of the first and the second flowering in 2022, it was observed that the period from the beginning to the full second flowering was longer by 13 days compared with the 16-year annual average for the first flowering; from full development to the end of the second flowering was shorter by 5 days. A second fruiting was also identified that was complete and 38 days passed from the appearance of ripe fruits to the second fruit ripening. In Belgrade, in 2022, a complete second flowering and a second ripening of the fruits were recorded.
In 2022, for Philadelphus coronarius L., BF DOY was 126 (Figure 13), so it started flowering 5 days earlier compared with the period 2007–2022. By comparing the first and the second flowering in 2022, it was observed that the period from the beginning of the flowering to the full second flowering was 20 days longer compared with the 16-year annual average for the first flowering; from full flowering to the end of the second flowering was shorter by 14 days. In addition to the first flowering, the study also recorded a second full flowering in the fall of 2022.
For Ficus carica L., in 2022, for BF the DOY was 152, which means that it started flowering 3 days earlier compared with the period 2007–2022 (Figure 14). In the comparison of the first and the second flowering in 2022, it was observed that the period from the beginning to the full second flowering was shorter by 34 days compared with the 16-year annual average for the first flowering and from full to the end of the second flowering was shorter by 1 day. A second fruiting was also identified that was completed and 33 days passed from the appearance of ripe fruits to the second ripening. Edible Fig bloomed longer in Belgrade, with fruits ripening in November 2022.
In 2022, for Rosa rugosa Thunb., BF DOY was 156 (Figure 14), so it started blooming a day earlier compared with the period 2007–2022. Rugosa Rose bloomed in Belgrade, in 2022, for the first time until August, while the beginning of the second flowering was recorded at the end of autumn, which lasted for 365 days.
For Yucca gloriosa L., in 2022, BF DOY was 161, which means that it started flowering 2 days earlier compared with the period 2007–2022 (Figure 15). In the comparison of the first and the second flowering in 2022, it was observed that the period from the beginning to the full second flowering was shorter by 24 days compared with the 16-year annual average for the first flowering and from full flowering to the end of the second flowering was shorter by 6 days. The research showed that during autumn in Belgrade, Spanish Dagger had a complete second phenophase of flowering.

4. Discussion

The importance of phenological observations is reflected in the number of studies across species, regions, and time. Phenology is represented by a set of events that are of utter importance for landscape sustainability on the one hand and the provision of ecosystem services on the other hand. Landscape design with design processes and landscape composition represents a base necessary for strengthening the sustainability of the landscape [58]. Landscape design provides a basis for interpreting processes and patterns of interactions, indicating the need for adaptive planning and management [59]. Changes in the landscapes across the globe are already thoroughly described but are best represented in changes in phenology [8]. Long-term datasets are now also provided by remote sensing technologies [60] that allow the creation of objective long-time series gradually improving in spatial and temporal resolution. However, detailed ground-truth data are still crucial for the validation of the data and thorough analysis of phenological events. The quality of ecosystem services is directly affected by changes in phenology, as the plants are starting points in the provision for pollinators as well as for nutrients in the total environment. The spatial quality, dynamics, structure, and texture of plants in certain phases of phenology influence the global image of the landscape but also the microclimate; therefore, another aspect of the importance of phenology is a landscape design that is dependent on the shifts in phenology, which is tightly related to climate change.

4.1. Climate and Phenology

The explanation of the data recorded during the phenological observations is not possible without climatic data, since the average or most frequent beginnings of the duration of phenophases in sites are a reflection of the local climate, and the spatial distribution of the dates of the beginning or duration of phenological events reflects the spatial change of climate and microclimate [61]. The delay or earlier appearance of some phenophases, and especially the repeated flowering and fruiting during autumn in the year, confirm that before or at that time the climatic variables differed from the usual ones [23]. Phenological data in the form of dates do not provide more specific information due to increasingly significant climate changes, which is why phenological data in our research were combined with meteorological data to obtain more specific information, i.e., to determine their variation, which can be as long as several weeks [17]. Furthermore, the majority of studies relate the advancement of spring events to global warming within the same framework, but little attention is given to other variables such as increasing carbon dioxide and shifts in precipitation [8]. Therefore, our study included several climatic variables such as various aspects of precipitation, temperatures, humidity, and solar radiation (eight parameters in total).
The autumn in Serbia in 2022 was outstandingly warm and rainy. A Heat wave was registered at the end of December and the beginning of January, average air temperatures were higher in December, and fewer frosty days were noted than usual. According to percentile methodology, the temperatures were in categories warm and extremely warm. The obtained results are in line with predictions that global warming will reach 1.5 °C between 2030 and 2052 [62] if the period 1991–2020 is observed in relation to 1961–1991. Indeed, if we look at the previous year, it is noticeable that the temperature has already exceeded the value specified by the IPCC Special Report on the impacts of global warming of 1.5 °C by 1.1 °C (Belgrade) and 1.0 °C (Surčin). These data are consistent with evidence that greater warming than the global annual average has been observed in many regions and during different seasons [63]. Results confirmed a very strong positive correlation between mean monthly temperatures for 2022 and the period 1991–2020, i.e., their growth. No statistically significant correlation or association was confirmed between the other two variables. The findings of our study are in accordance with the statements of Vujović and Todorović [64] and WMO [10]. Furthermore, for plants, a decrease in the number of days with precipitation ≥ 1.0 mm is much more significant. Interestingly, similar results were found in different climates such as tropical ecosystems, where phenology proved to be less sensitive to temperatures and photoperiods and more tuned to seasonal shifts in precipitation [65,66,67]. Some taxa continued flowering even after the formation of snow cover. Snow interrupted second flowering in some species mid-December, but December 2022 was the warmest December in Belgrade since 1887.

4.2. Phenological Relation to DOY and GDD

The onset of phenophases in the literature is often quantified by the day of the year (DOY). Results indicated the high standard deviations for all observed flowering phenophases of Weeping Winter Jasmine from the beginning of the flowering to full flowering; for Zabel’s Laurel and Border Forsythia, over 16 years, DOYs for these taxa varied widely. For Jasminum nudiflorum Lindl., in 2022, for BF the DOY was earlier compared with the period 2007–2022; the period from the beginning to the full second flowering was longer. In our research, taxa that flowered the earliest in the season (i.e., Jasminum nudiflorum Lindl.) proved to be the most sensitive to changes in the temperatures, as this species had the biggest standard deviation in the DOY. The growth trend of DOY BF in our results confirmed that European Mock-Orange and Honeysuckle species have a later onset of the flowering phenophase. By comparison with the seasonal temperatures of the referential period and the earlier time series for both stations (taxa belong to different stations for the calculation of temperature sums), it was determined that the temperatures were lower in spring for both stations. The mentioned DOY of the beginning of flowering phenophase changes is for taxa that, according to the literature [68,69], have a flowering phenophase during spring. The results showed that, between the mean values of temperature sums and the mean DOY, there was no constantly increasing or constantly decreasing connectivity. This finding confirms that the day of the year is not significant for flowering phenophases, that is, there is no significant correlation between DOY and temperature sums.
Our research went beyond the beginning of the flowering phenophase and analyzed its duration. The duration of the flowering phenophase was also significantly affected in DOY. Late winter and early spring species had an onset ranging from 30–63 DOY (Weeping Winter Jasmine and Border Forsythia, respectively). Variations were far lower for early to mid-spring species (93 in Common Lilac to 97 in Zabel’s Laurel). Finally, late spring and early summer had a flowering phenophase until DOY (113 for Siberian Dogwood to 121 for European Mock-Orange). These DOYs are much different in suburban species. Flower initiation started in DOY 122 for Honeysuckle until DOY 163 in Spanish Dagger. The phenophase of Weeping Winter Jasmine during 16 years of observations varied for all key events, while Zabel’s Laurel and Border Forsythia had somewhat lower standard deviations but also varied in the DOY from the beginning of the flowering to full flowering. The latest flowering was recorded in Yucca gloriosa L., although its variation in DOY as well as of other species was within the expected frame. Philadelphus coronarius L. was the fastest to reach the full flowering phenophase (within 3.5 days) and Lonicera periclymenum ‘Serotina’ took the longest (46.4). The most attractive part of phenophase for landscape design is definitely from full flowering to the end of flowering. Therefore, it is important to notice that for Prunus laurocerasus ‘Zabeliana’ it lasted only 15.9 days, while Yucca gloriosa L. had fully developed flowers for almost 2 months (50.8 days).
A comparative analysis of (Kendall’s tau, Sen’s slope test) for the average DOY showed significant changes in DOY for the beginning of flowering (in two species), the period from the beginning to full flowering (half of the taxa were affected), and from full flowering to the end of flowering (recorded in only one species). As the temperature was lower compared with the referential period, it is not surprising that the growth trend of DOY BF was shifted and appeared later in the year. However, there was a decreasing trend of fewer days from the beginning of the flowering to full flowering in half of the species (Common Lilac, Zabel’s Laurel, European Mock-Orange, Border Forsythia, Tartarian Dogwood, and Siberian Dogwood). The process of flowering was accelerated. The significant prolonging of the flowering season (calculated in DOY) was seen only in one species. It is interesting to notice that the DOY shifts were registered in taxa that normally have a flowering phenophase during spring.
An important element in planning and designing a visually attractive and environmentally pleasant green area is the use of decorative species that bloom throughout the vegetative season. Our work included taxa that bloom from February to October, but, during our observations, they shifted the flowering by extending the flowering period, advancing its onset, or repeating the flowering phenophase once or twice. Further implications for ecosystem services and landscape design are analyzed further in the discussion.
On the other hand, the influence of heat on plant and animal life was noticed as early as the 18th century. Namely, a study [70] introduced the concept of heat units for predicting plant development (growth degree day). In fact, the accumulated heat units make up the temperature sums that link the growth, development, and maturity of plants. They are a measure of heat accumulation above the temperature threshold during 24 h. Already at that time, Réaumur indicated that plant development is proportional to the sum of the air temperature and not to the temperature value during the duration of the phenophase. The beginning of flowering is directly correlated with crossing the temperature threshold, after which flowering begins and, in taxa with inflorescences, inflorescence growth also begins. In inflorescences, after bud opening, growth is slow and is affected by temperature, which can cause faster growth [71]. For the flowering phenophase, in addition to crossing the temperature threshold, it is necessary for the plants to have certain GDD (amounts of accumulated heat) [17]. Calculated in this way, the beginning and duration of the flowering phenophase are in direct correlation with the temperatures, so the shortening or prolongation of flowering is recorded when the temperature conditions are not optimal.
The low standard deviation in our data confirmed that the temperature sum initiated the development of plants, that is, the observed phenophase. The obtained results are in accordance with the literature reports that analyzed 13 taxa bloom in different periods of the year that have a short or long flowering phenophase [68,72]. It is important to highlight that not all species are affected equally. While DOY of the occurrence of the flowering events shifted significantly, GDD significantly changed only for the end of flowering of Rosa rugosa Thunb. The same species, on the other hand, had the smallest variating in the end of the flowering phenophase GDD. Therefore, our research confirmed that GDD is a more reliable tool for predicting phenological events than DOY.
This is related to climate change, as warming up reflects in the onset of the phenophase and the sum of temperature (GDD) reaches its thresholds earlier in the year (DOY). Such changes have repercussions for both landscape design and ecosystem services. Therefore, planning and designing green areas should consider earlier green-up in the year and the possible appearance of the second flowering with the changes in the global climate. Visual changes through the seasons, as well as the length and abundance of flowering, are of great importance for effective design, but also for the quality of life with colors, smells, and a pleasant ambiance that can be achieved with the appropriate application of flower-decorative woody species. Apart from an aesthetical point of view, planners should dedicate their design to fulfilling ecosystem services, primarily to pollinators as key enablers for the ecosystem in total. For the functioning of their organisms, mutual relationships between providers of nutrition and the consumers are important, as biological interactions within ecological communities, especially in urban coenoses, are necessary. GDD for the onset of pollinators is not influenced by climate change in the same manner as plants and this creates discrepancies between the providers and consumers.

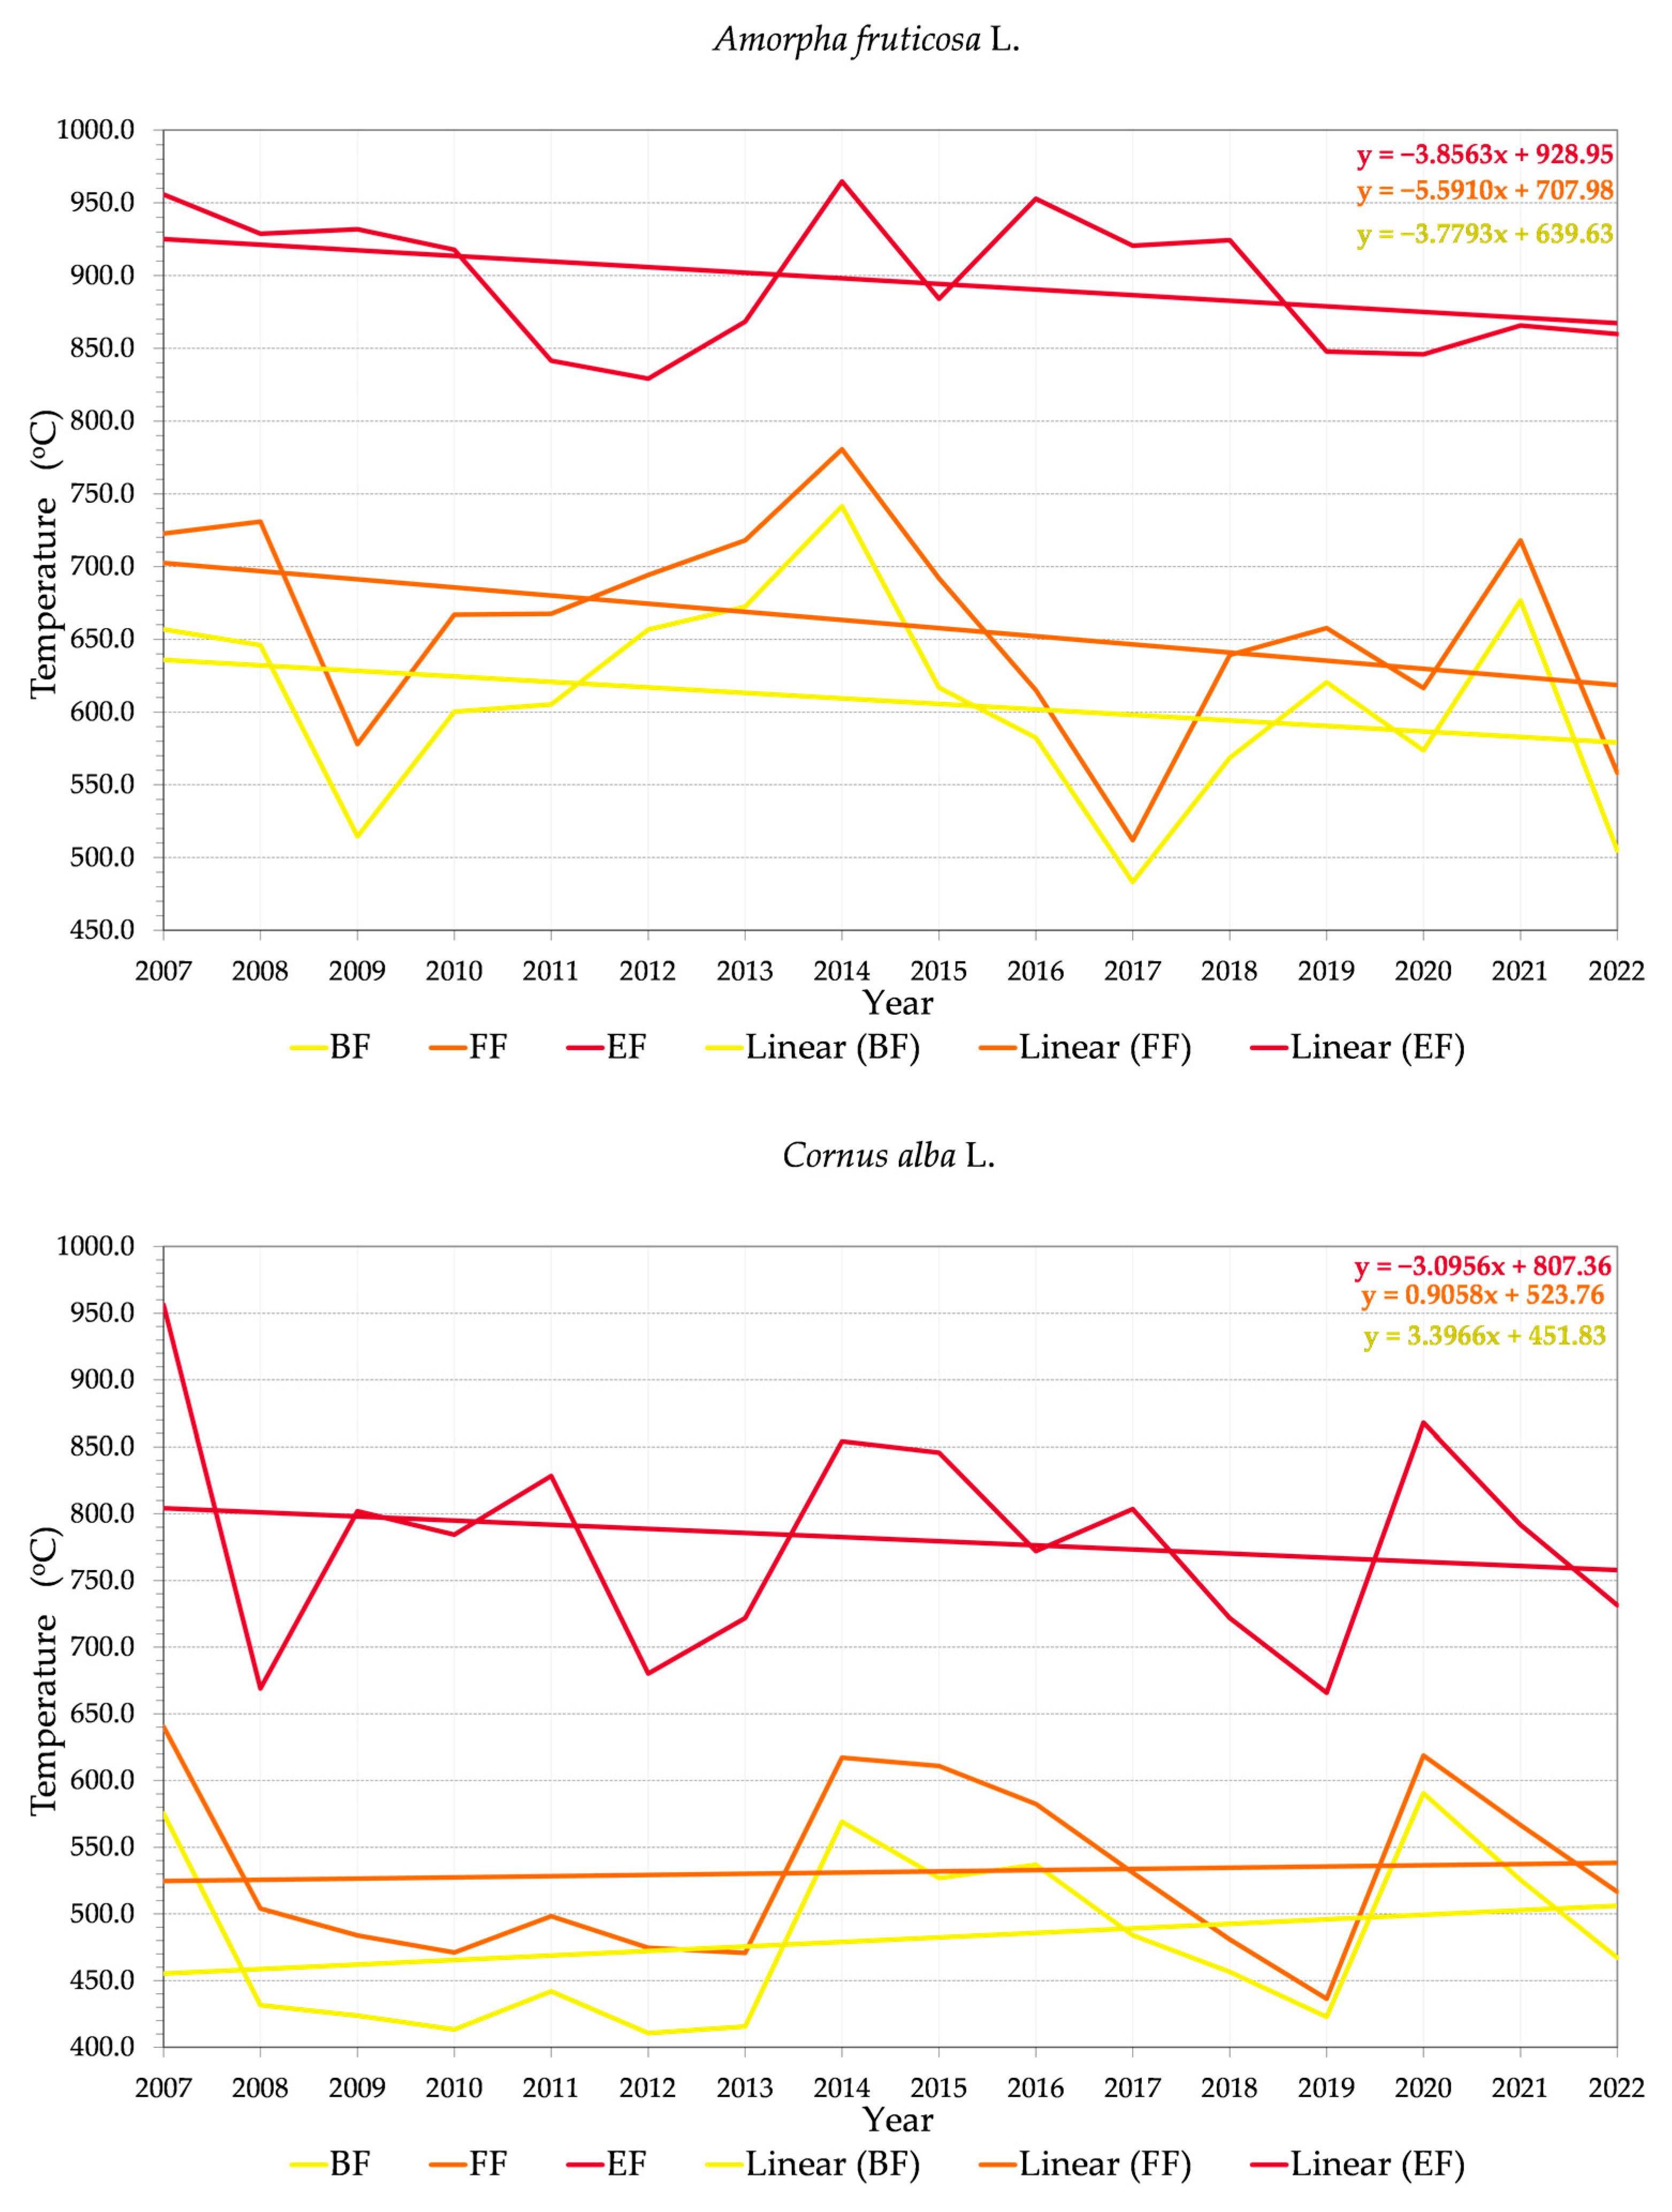
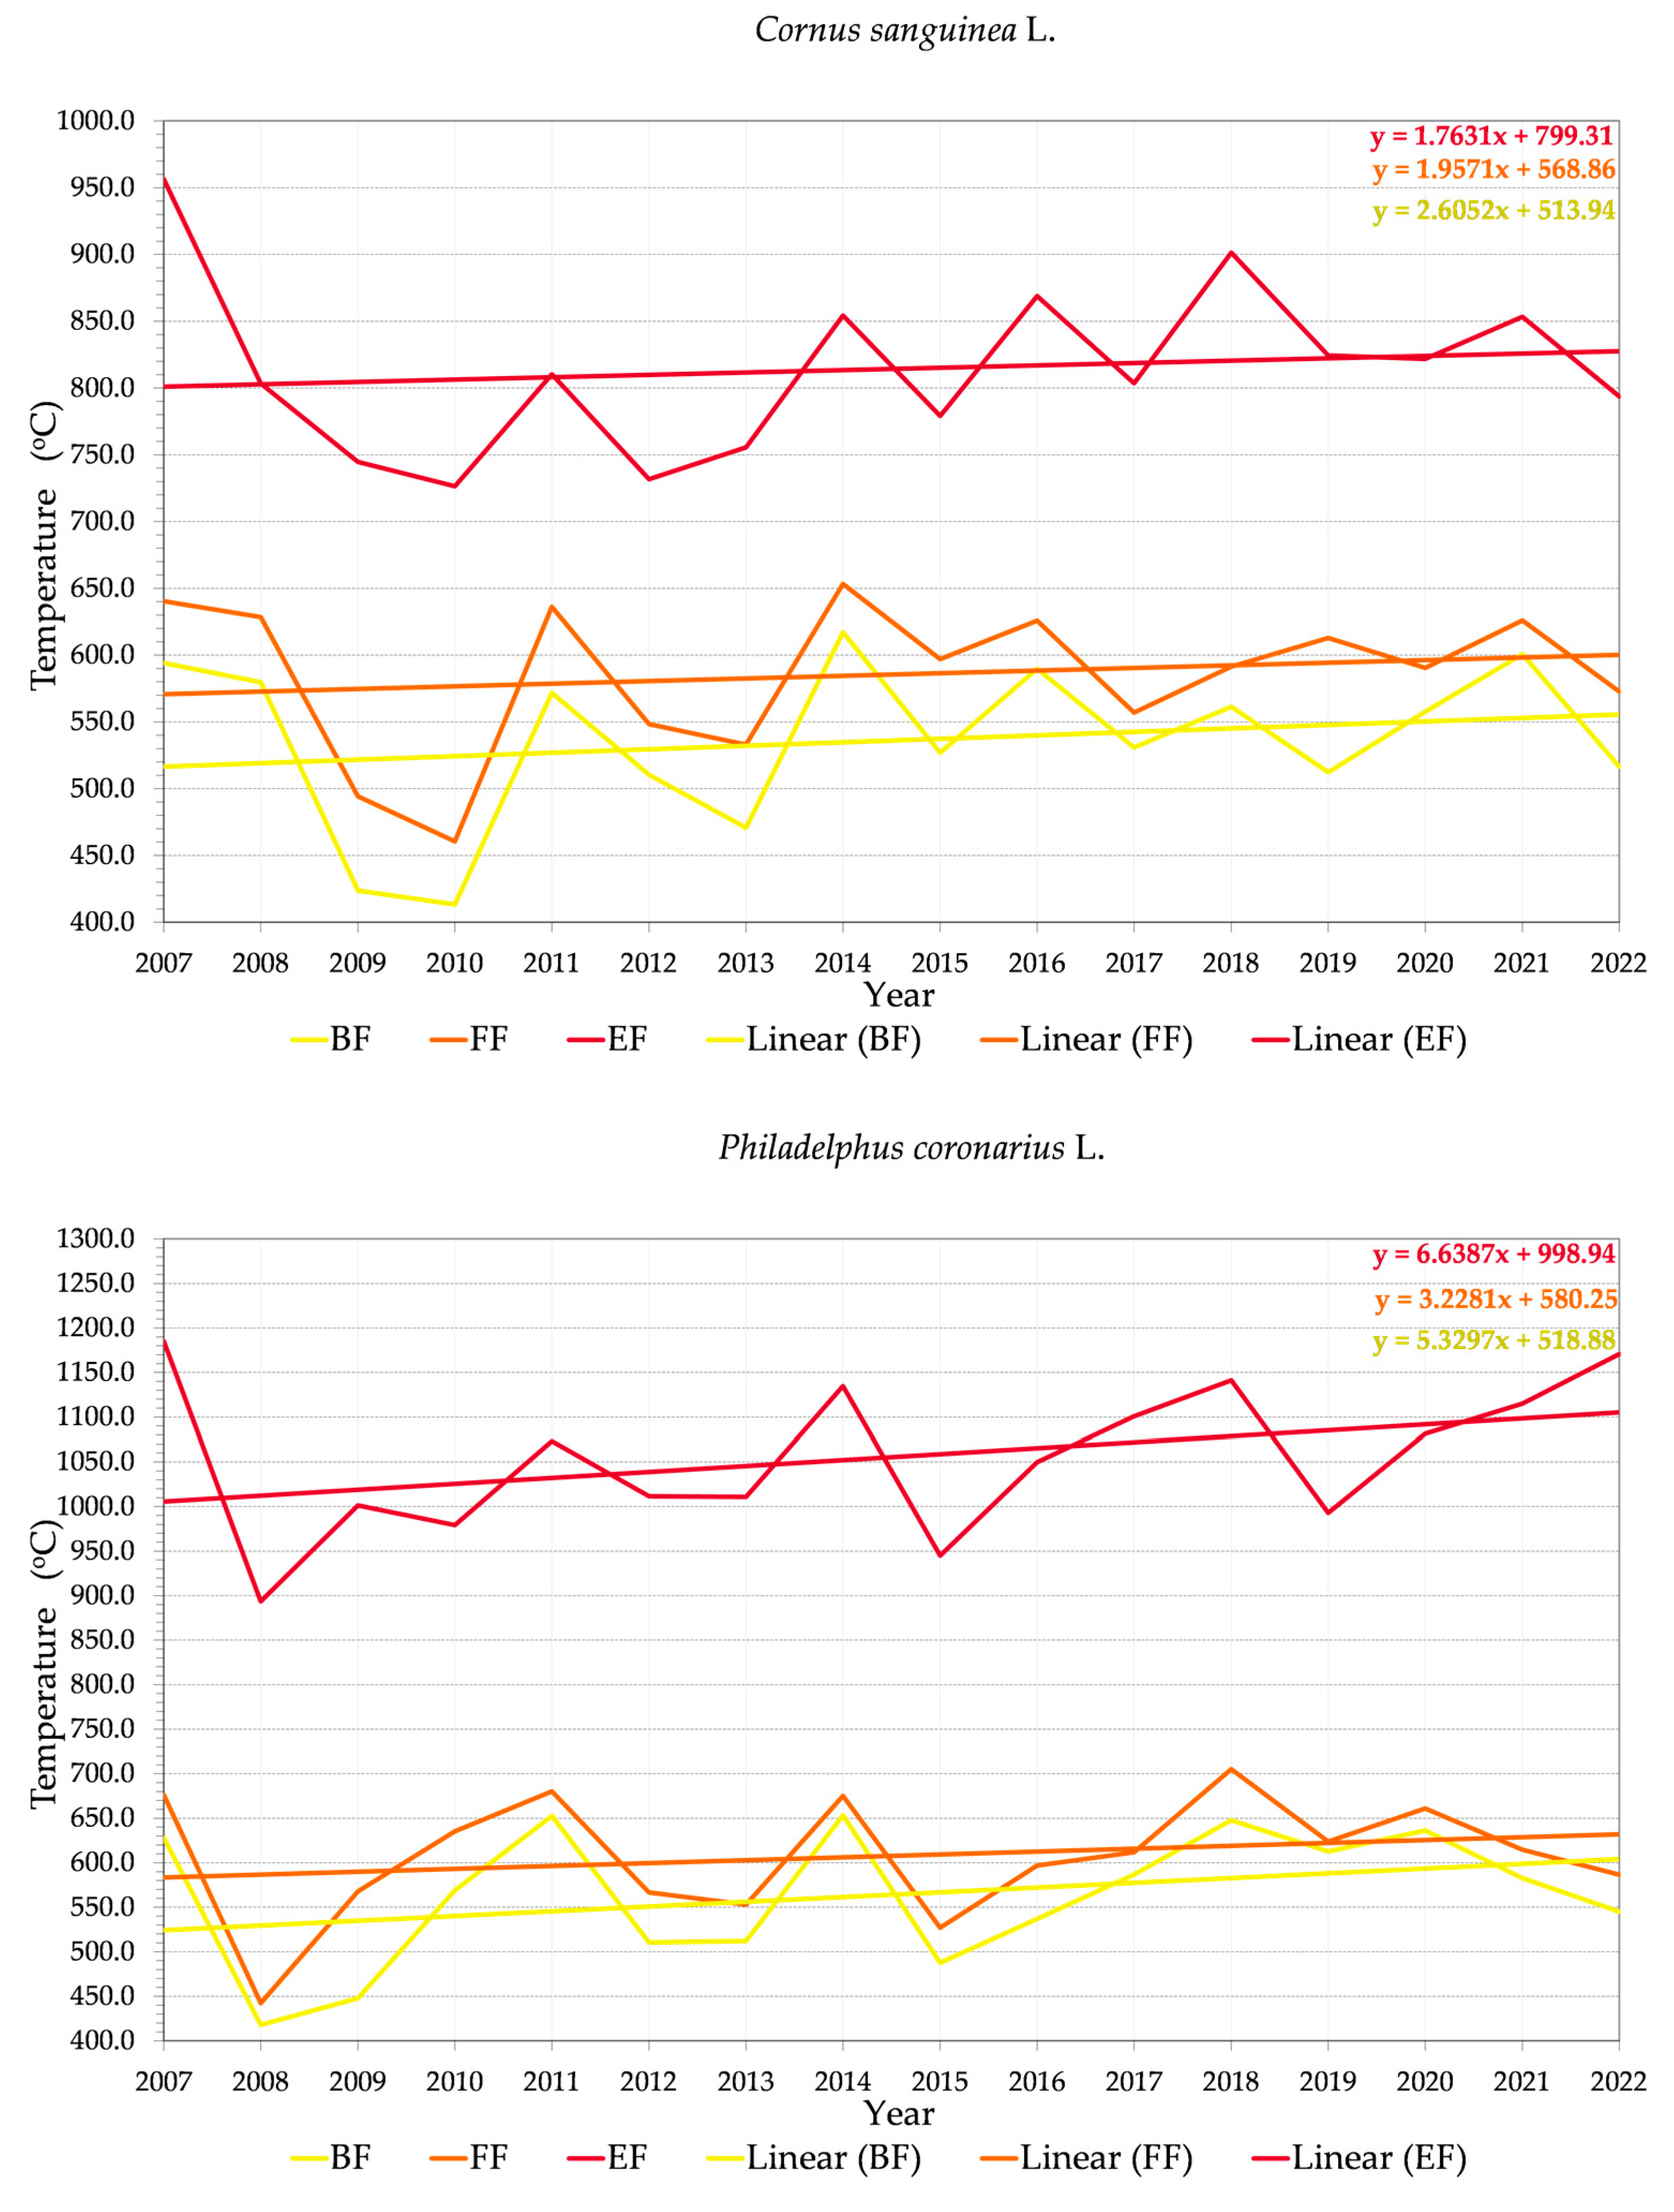
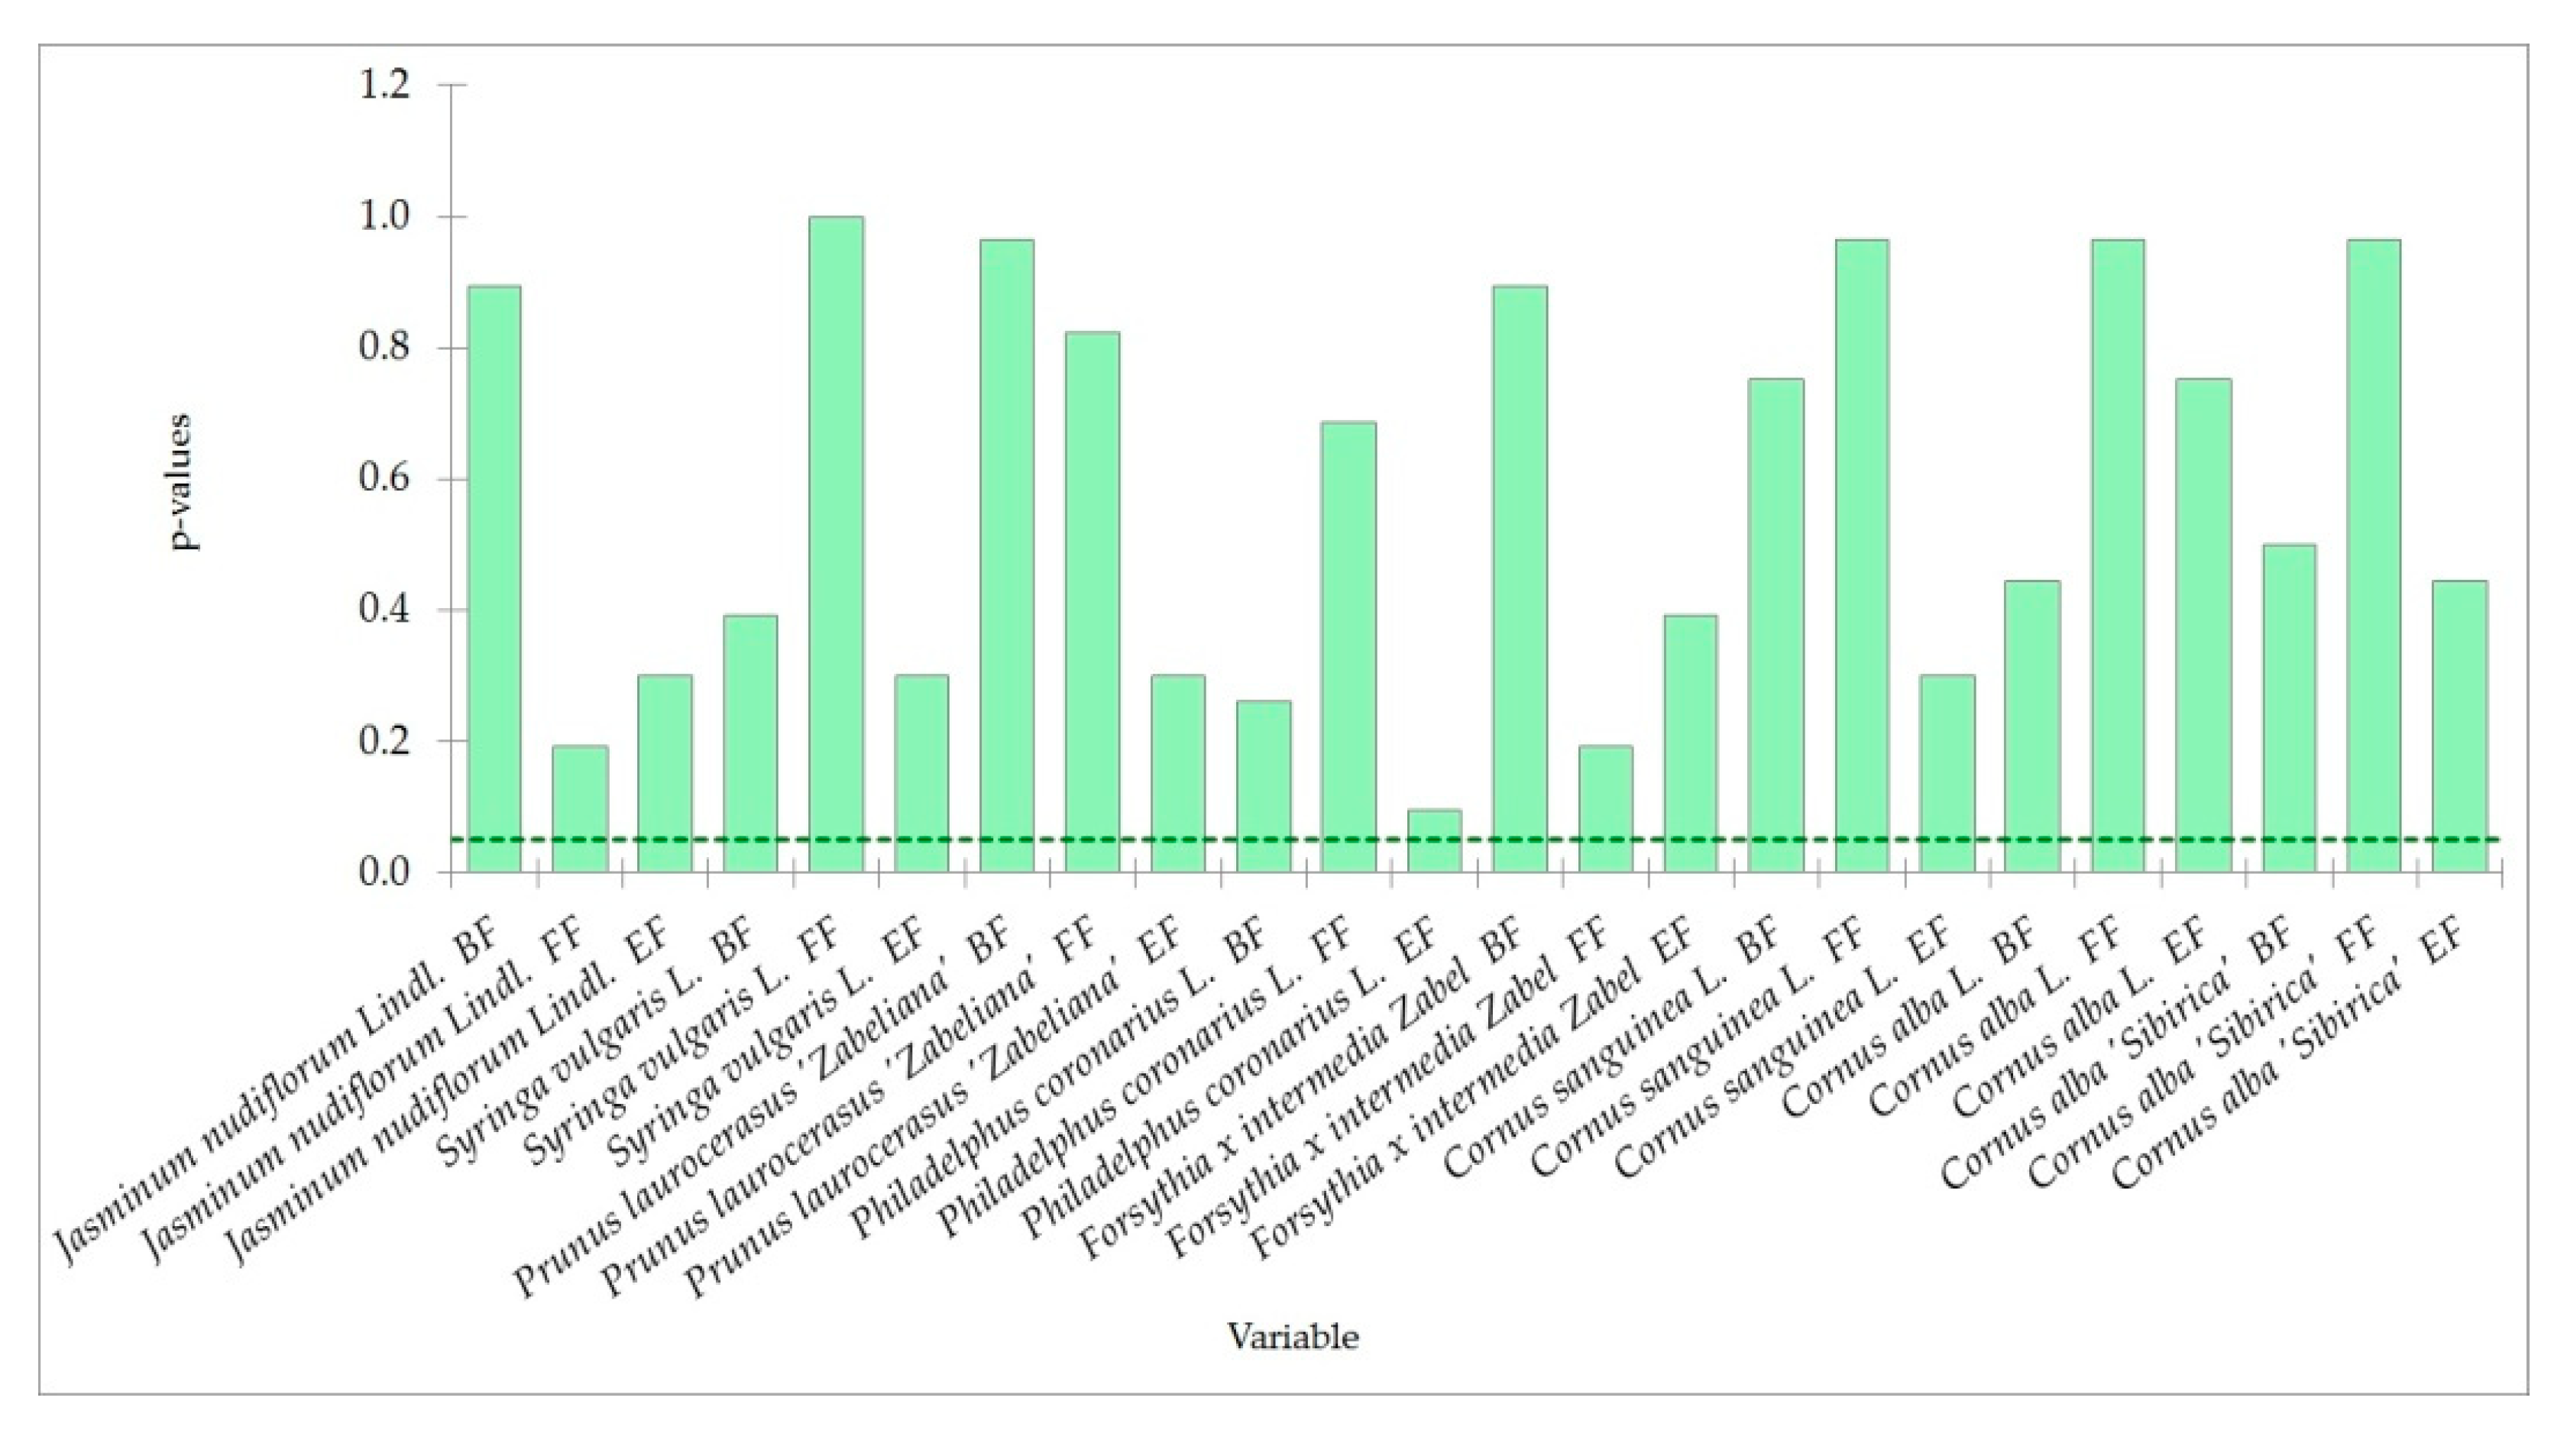
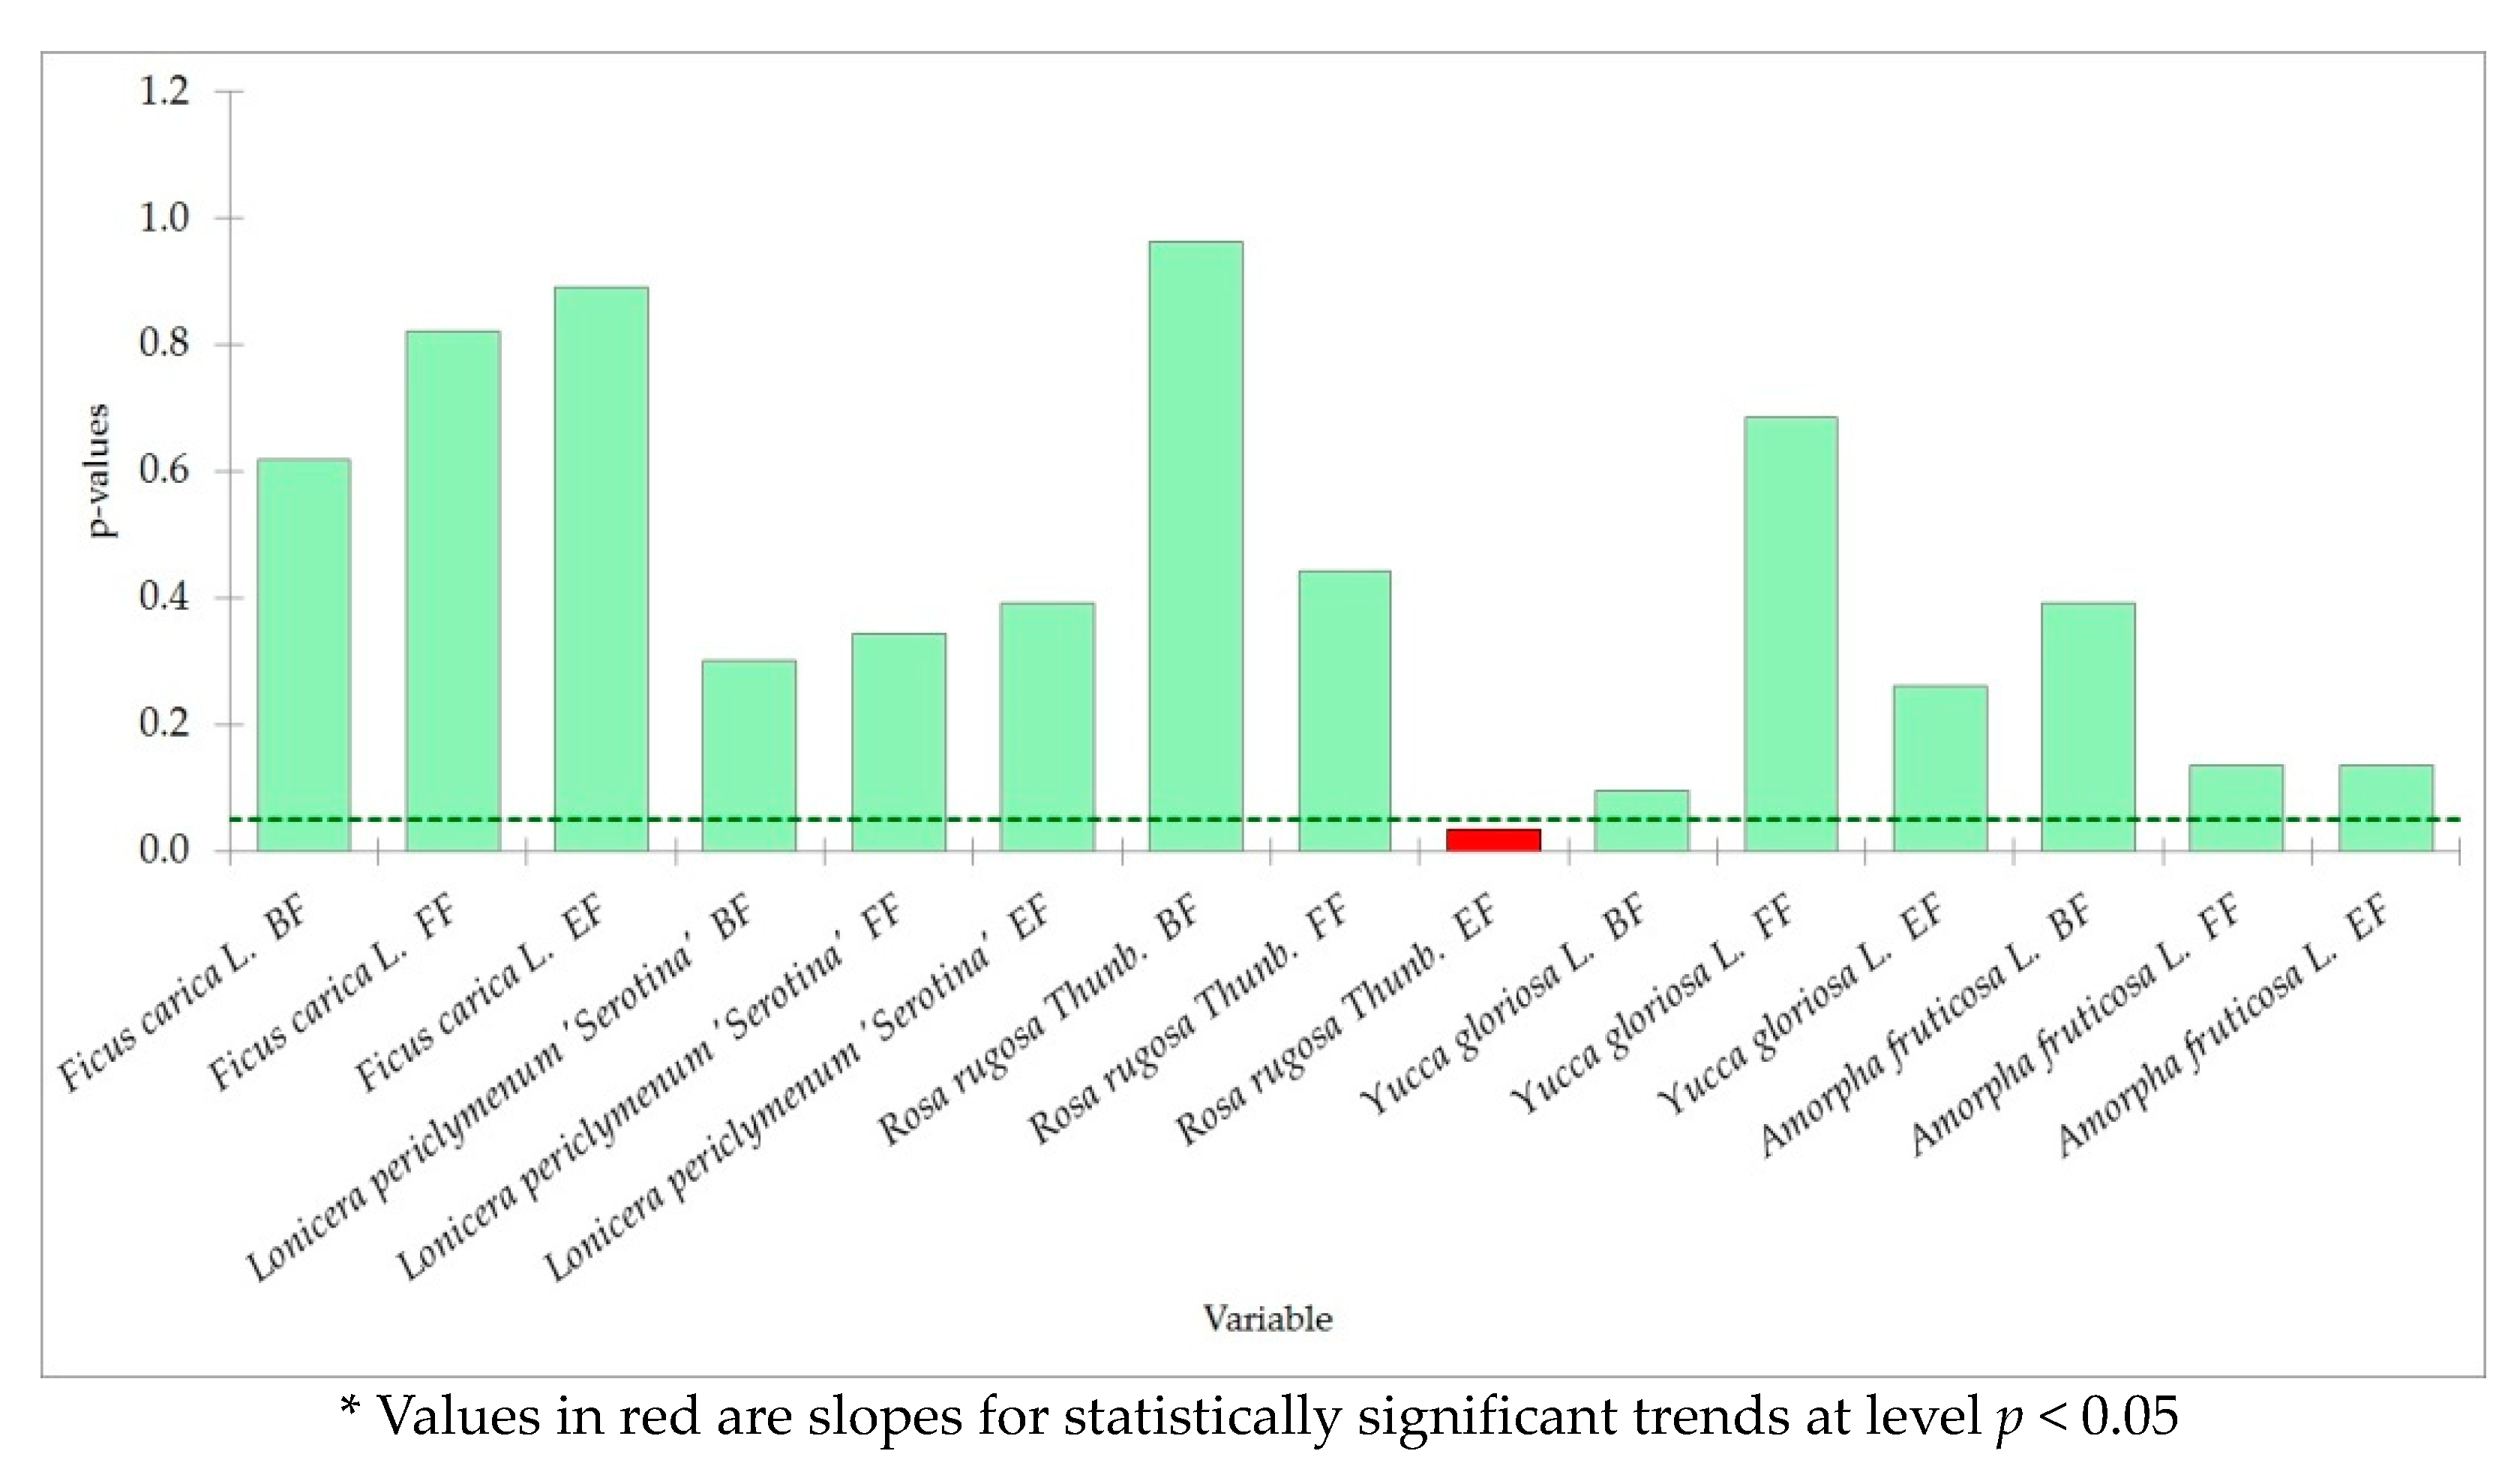
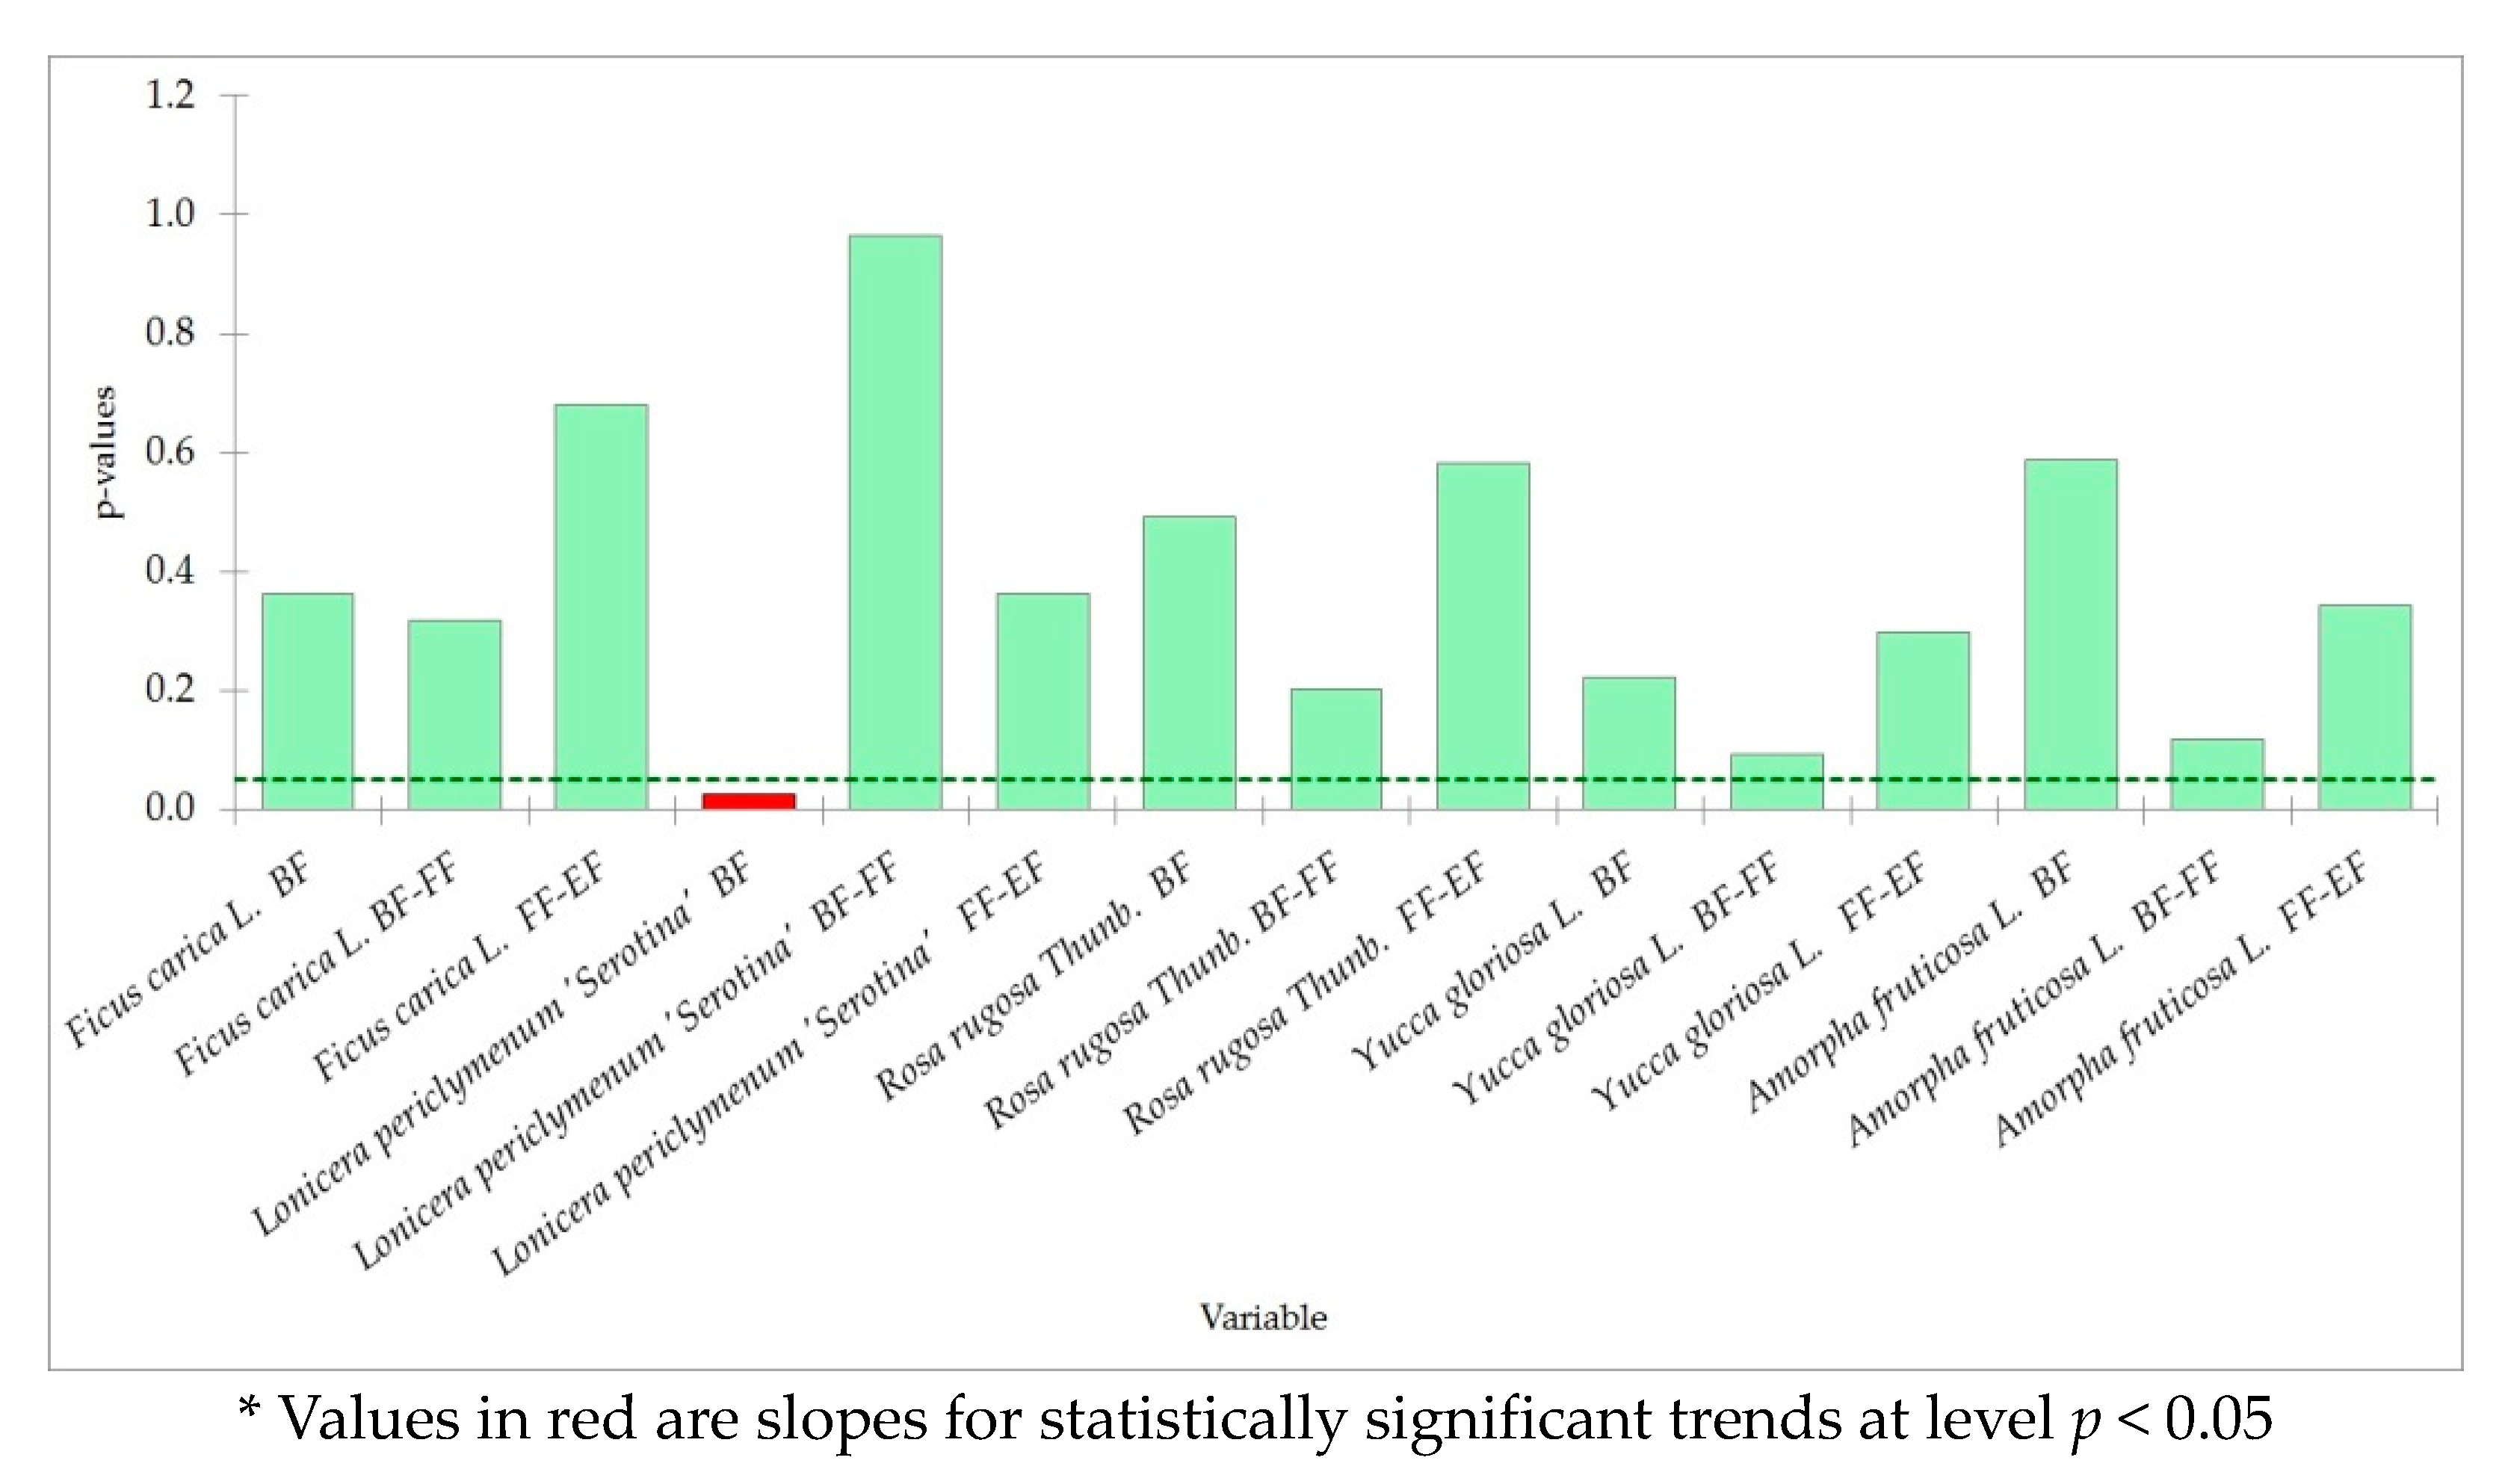
4.3. Trends in Phenology

The values of the trends in our research are not statistically significant, which confirms that the phenophases took place within the framework of the expected temperature sums during all 16 years of research. The greater accumulation of heat caused the shortening of the period and the end of flowering in the species due to high summer temperatures. The trend of temperature growth during the summer in the period 2007–2020 was determined. However, it should be considered that the most important thing is to understand the biophysical feedbacks between the land surface and the atmosphere that directly and indirectly affect the phenology of plants [72].
During the year, plants go through a series of different phenophases that occur in certain periods of the year, which is determined not just by the taxon but also by climatic parameters, as confirmed by our research. After the flowering phenophase, dormancy is provided by hormones and the termination of dormancy is conditioned by the taxon’s requirement for low temperatures. In the temperate climate zone, the demand for such temperatures is realized by the end of November [73]. The phenology of plants and species dependent on the plants either for food or other services that the flowering phenophase provides is not affected equally by climate change. Therefore, a mismatch in demand and supply can happen due to various dependencies on environmental changes [74]. Filipiak et al. [75] explain that there is no ideal mix of plants for feeding pollinators, but the focus should be on the mismatches between the nutrient contents found in flora and the requirements of pollinators. So, while some species are more affected than others in our research, extending the variability of species in landscape design does not guarantee the sustainability of the ecosystem.

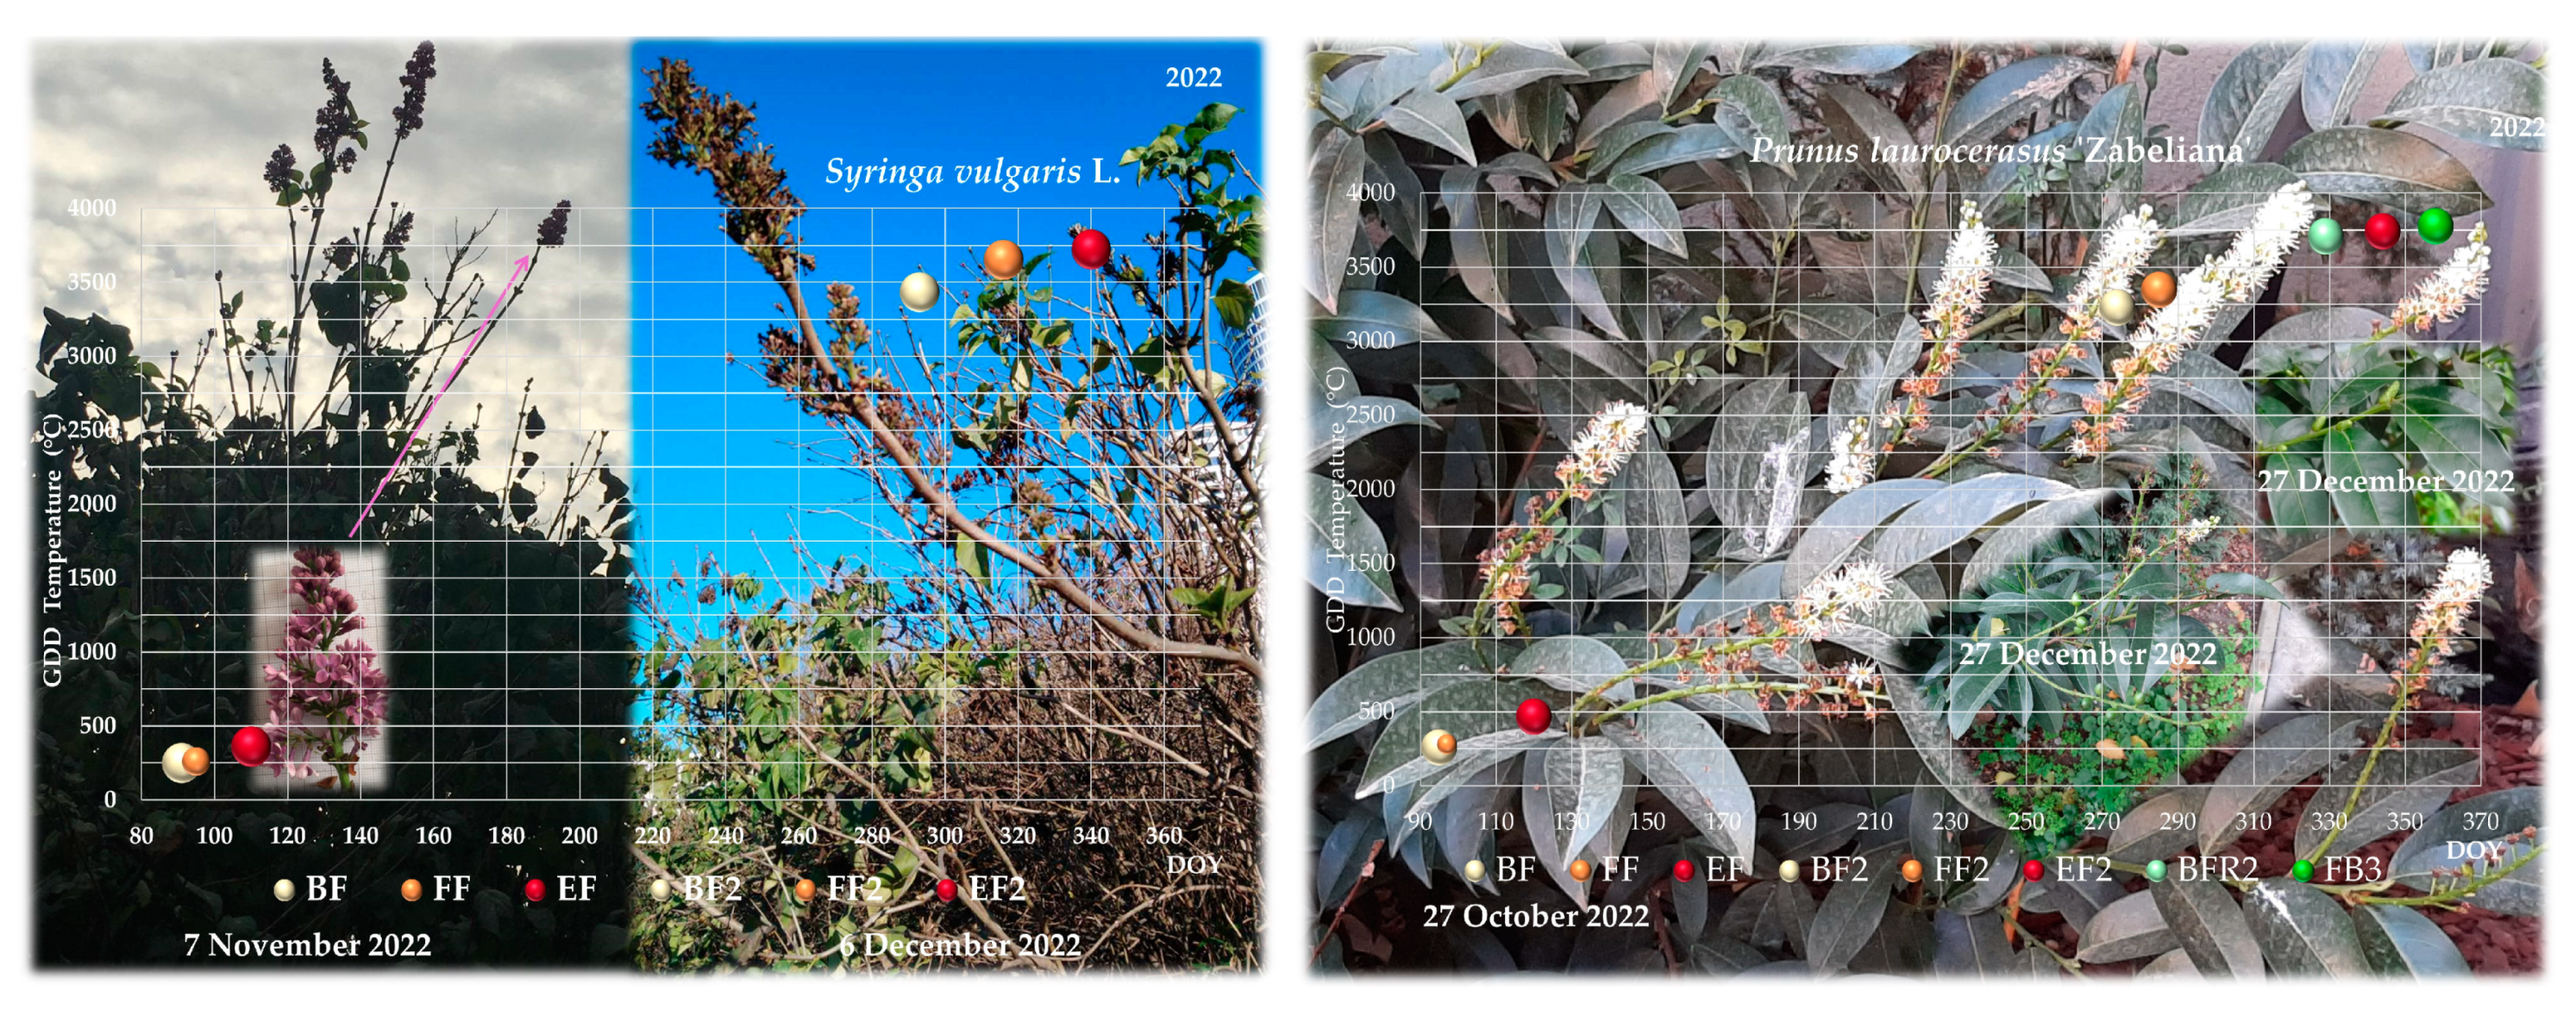
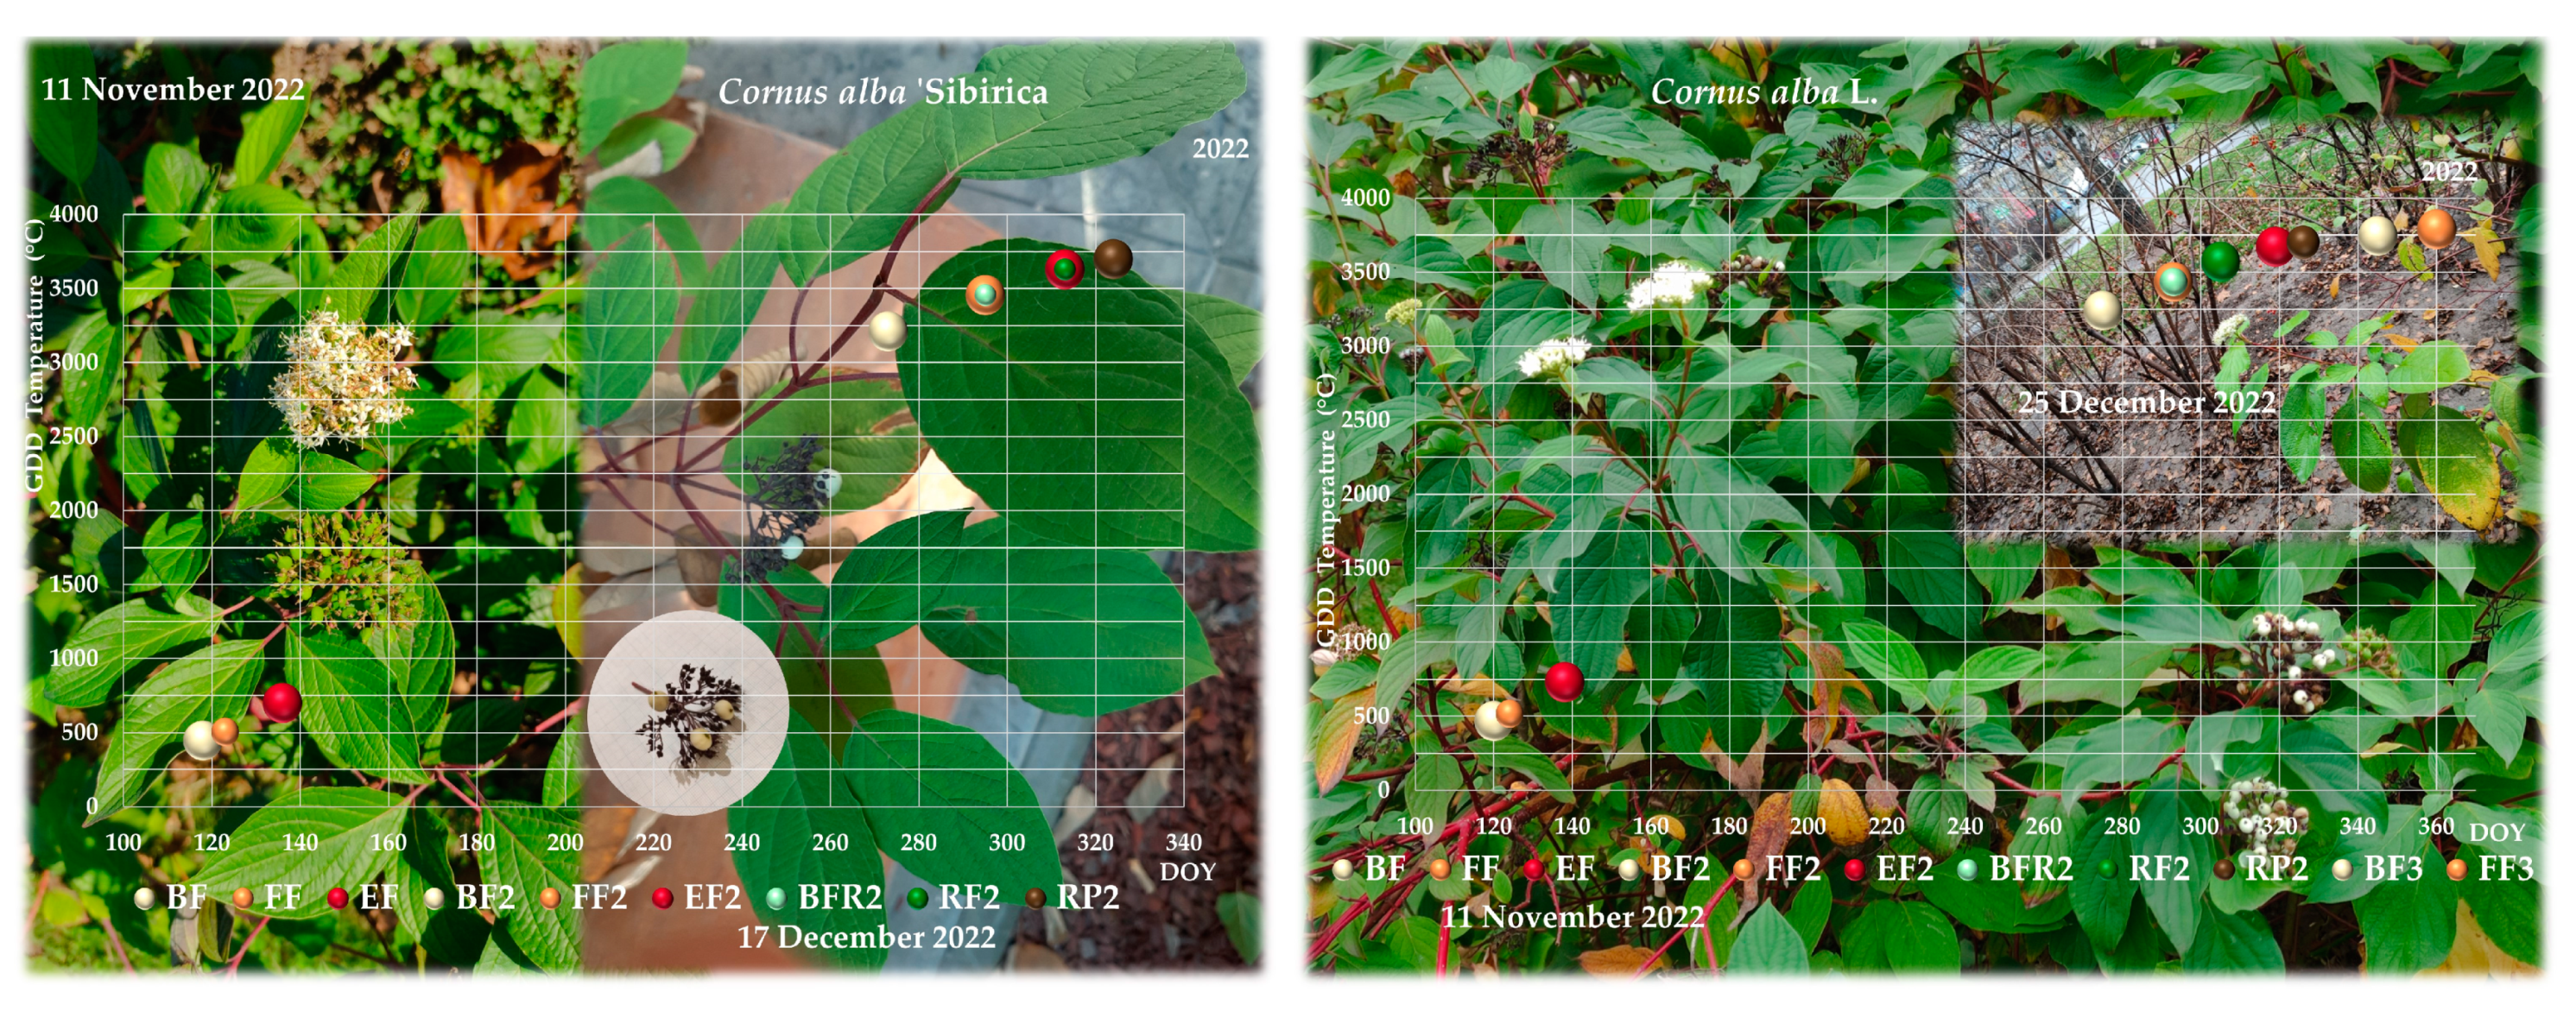
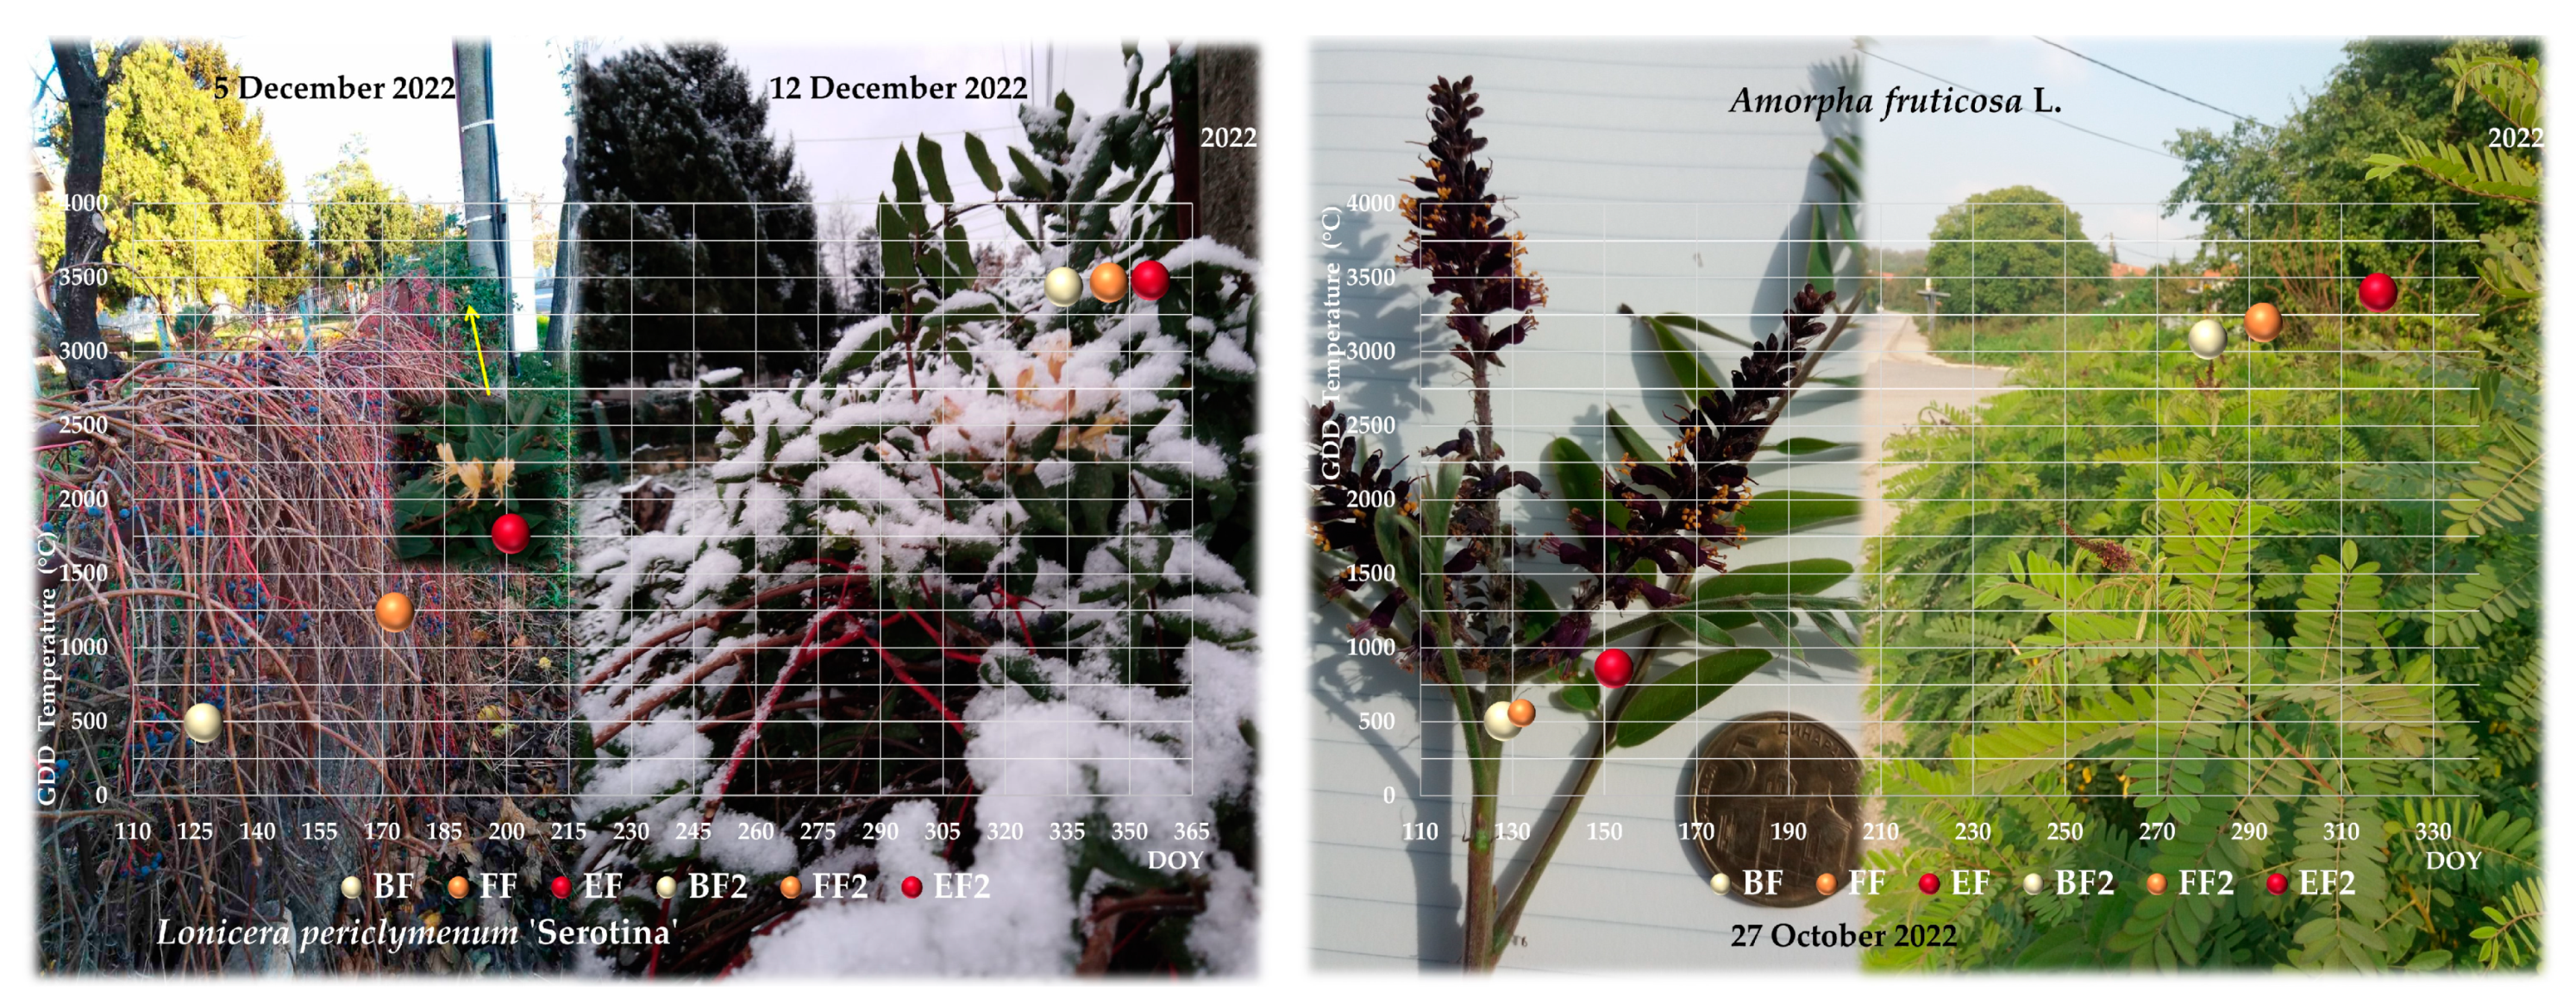
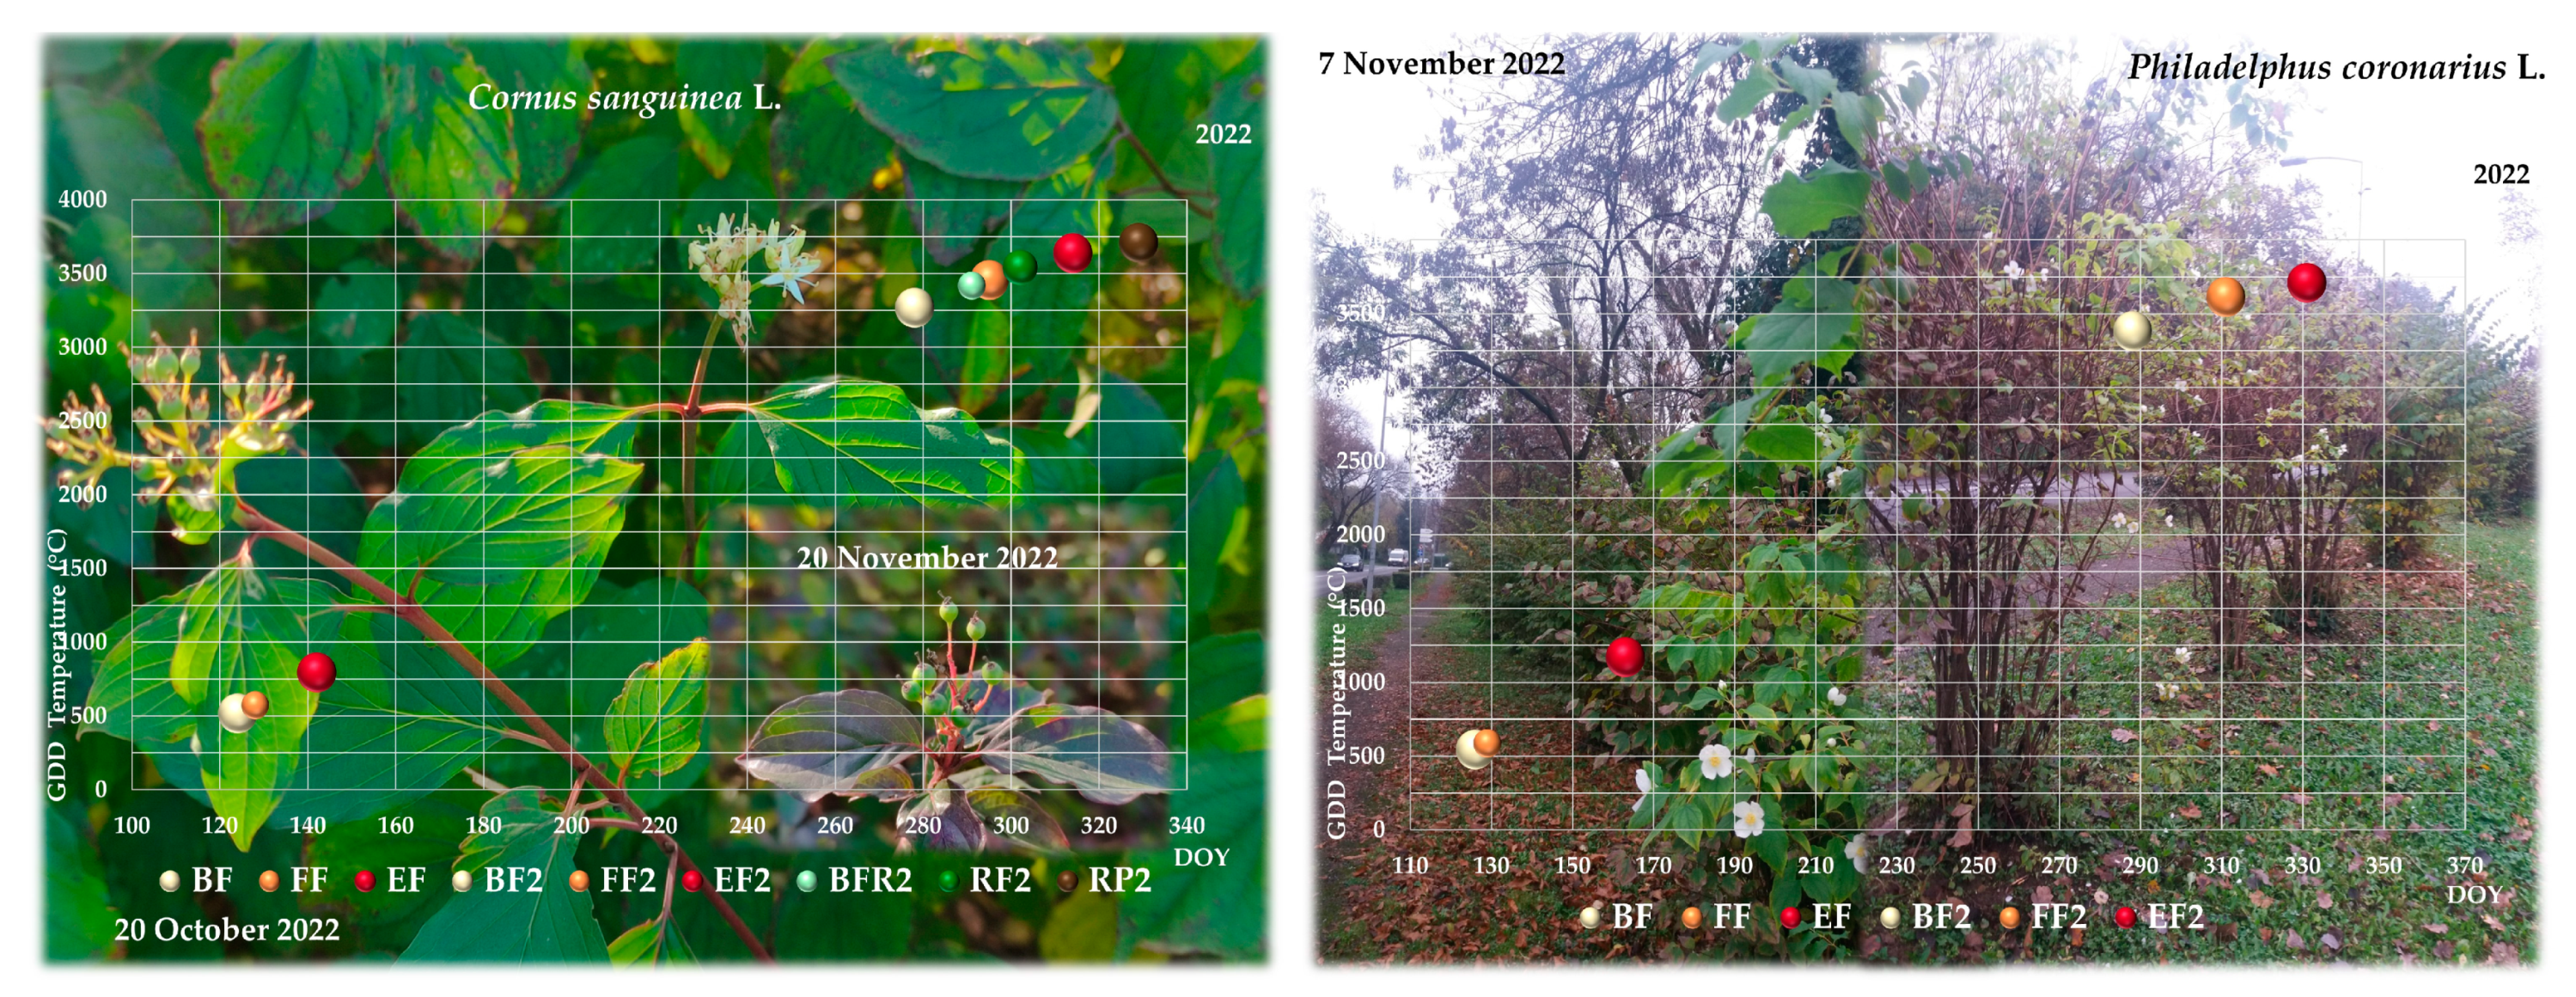
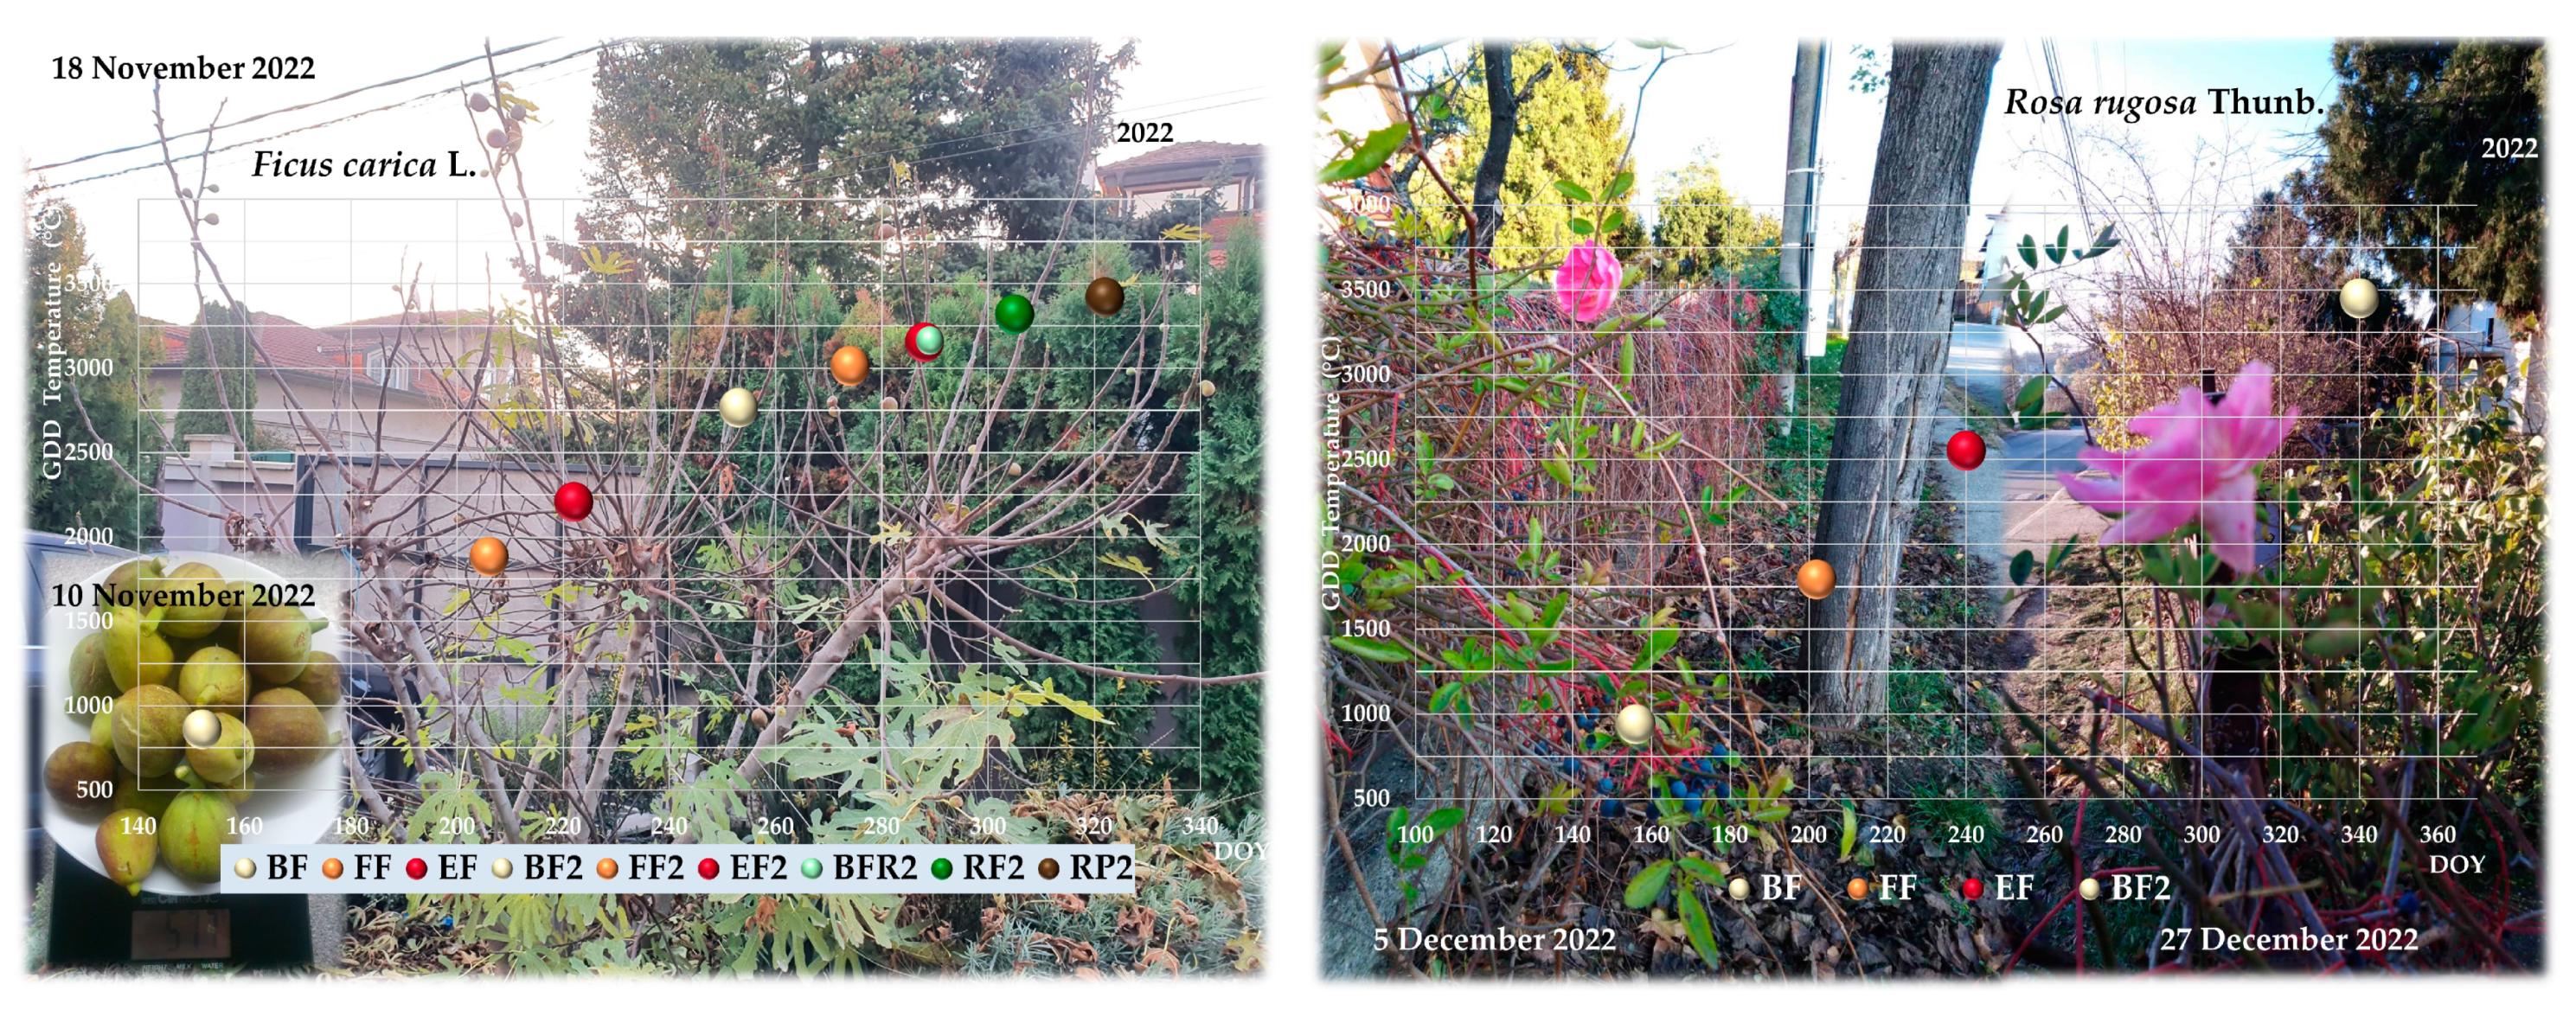
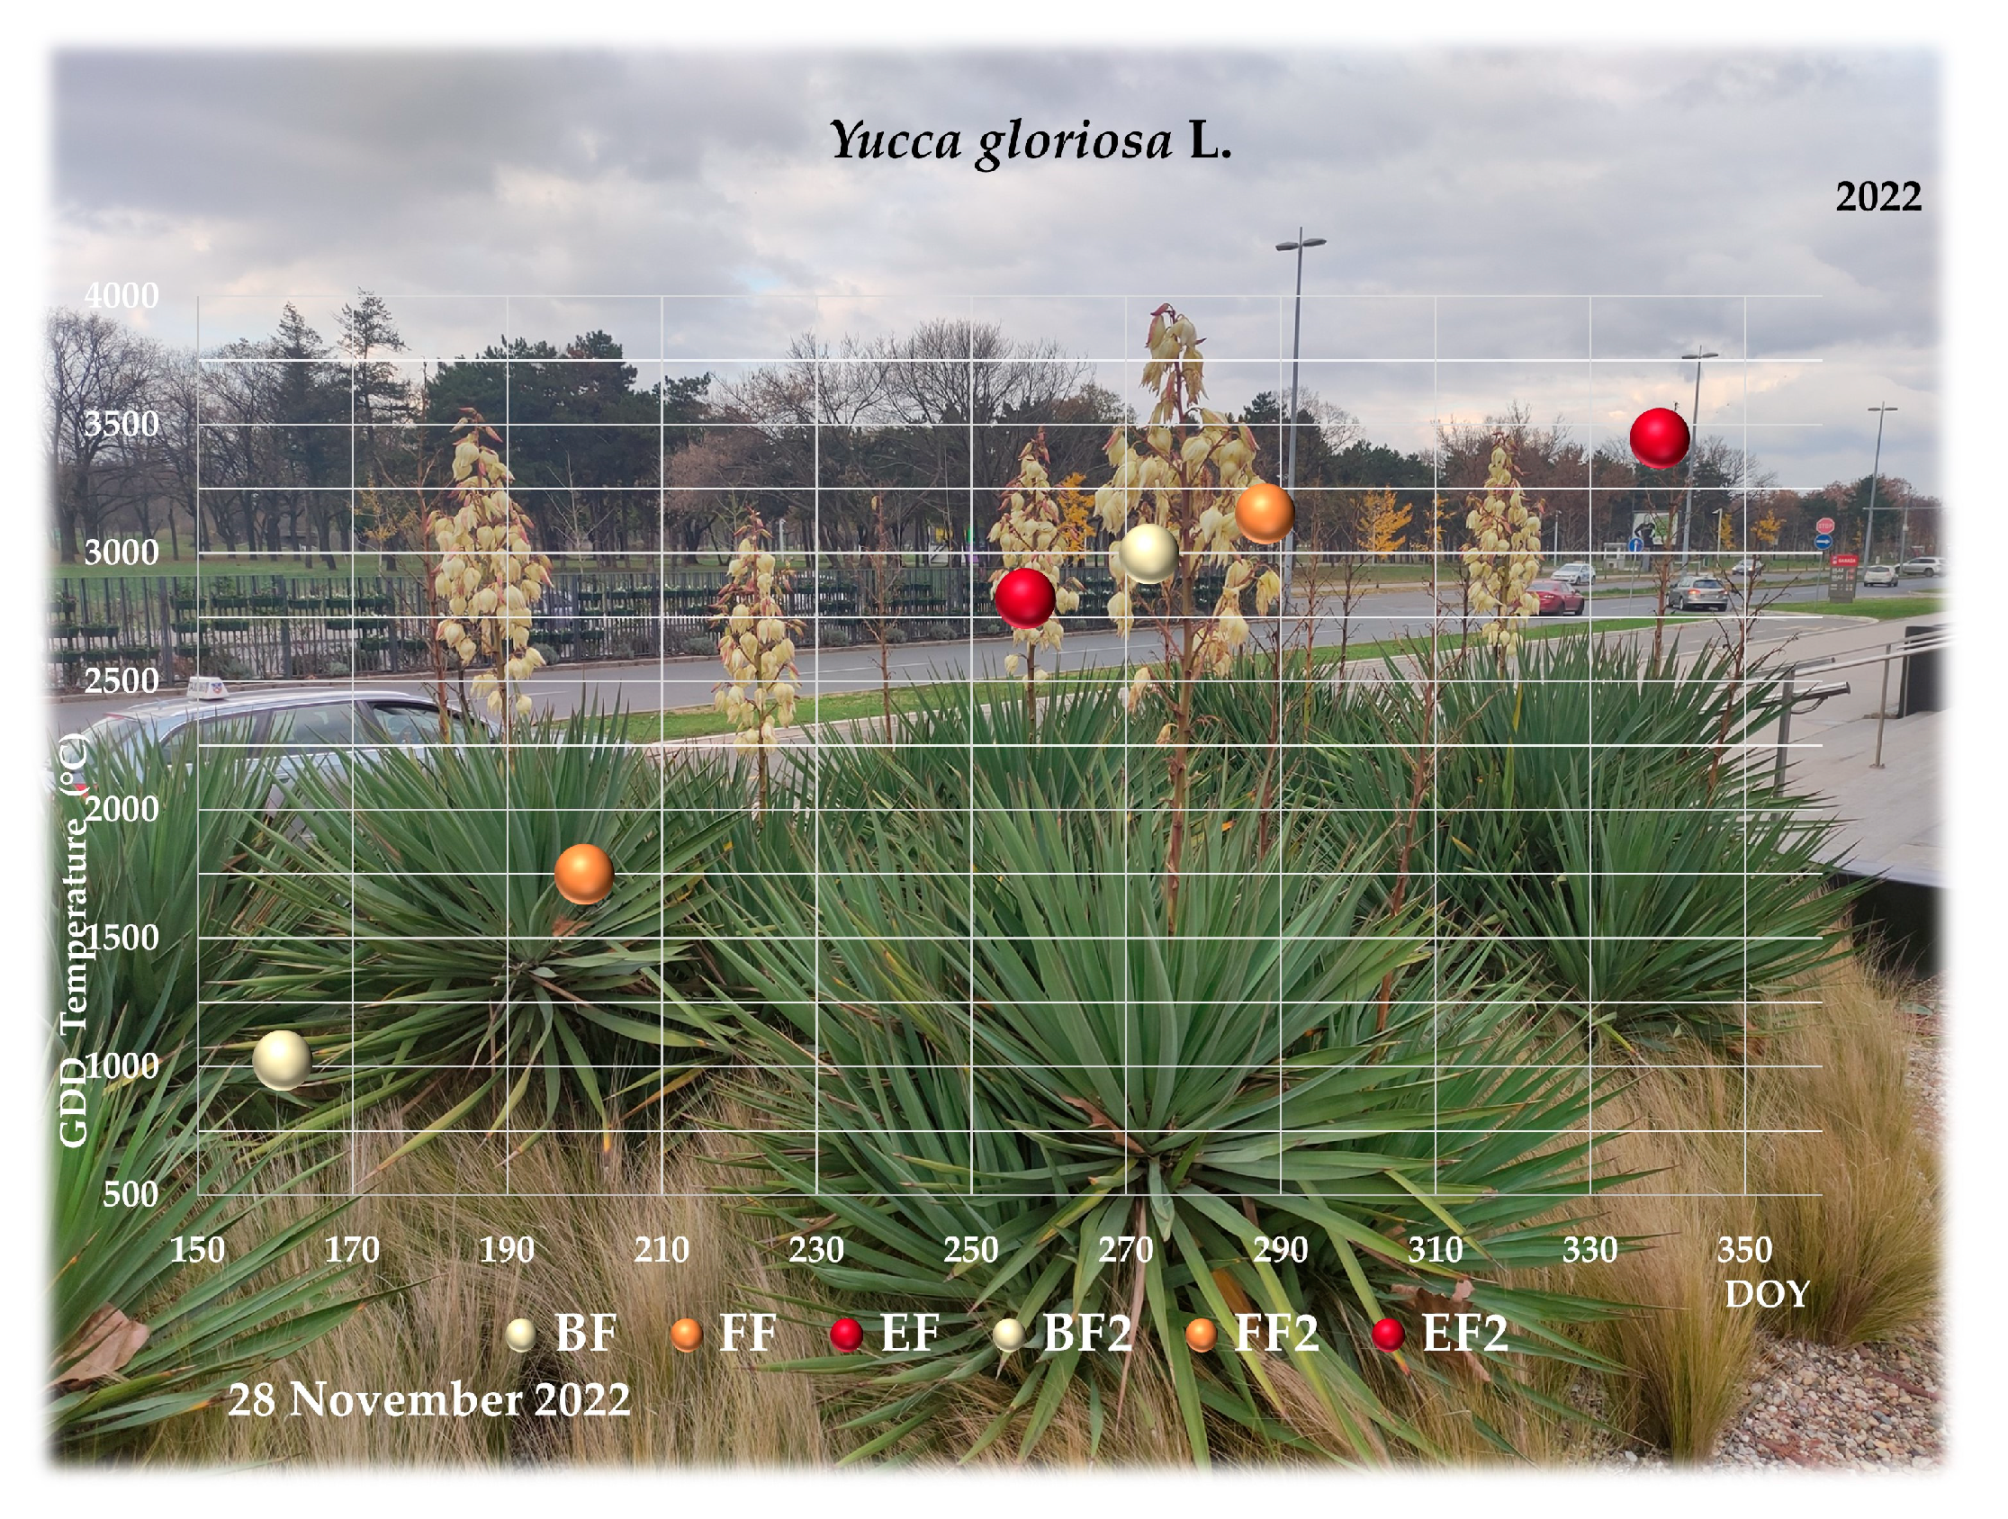
4.4. Repeated Flowering (and Fruiting)

Analysis by species showed varieties in phenological shifts among species, although all of the analyzed taxa were affected. The obtained data indicate that, in Belgrade, Common Lilac flowered for longer (4 weeks); in the literature, it is stated that it flowers in mid-spring for 3 weeks [76]. Zabel’s Laurel normally blooms in April and May [77], but had, on average, a flowering phenophase of 21 days in Belgrade. Edible Fig is one of the species found in both locations—Belgrade and Surčin—but it bloomed longer in Belgrade, with fruits ripening in November 2022; the literature states that fruits ripen unevenly from June to autumn [78]. A good example of significant shifts in phenology is Jasminum nudiflorum Lindl. (introduced from China in the 1840s), which was characterized by a late winter/early spring flowering phenophase [79]. Variation in its flowering phenophase was the greatest in our data and this implies changes in both its ornamental use and the species depending on this species for food. Another extreme example is Border Forsythia, which, according to the literature [80], blooms 1–2 weeks from the end of March to mid-April, but had an average flowering phenophase of 37 days in Belgrade. According to Brickell et al. [81], Siberian Dogwood blooms in late spring and may bloom sporadically in late summer, but our research recorded repeated complete flowering and fruiting in late autumn and early winter 2022. Common Dogwood, which usually blooms during May and June and develops fruits in September-October [82], had a complete second flowering and a second ripening of the fruits. Results also confirmed repeated flowering of Honeysuckle in late autumn and early winter 2022, even after the formation of a one-day snow cover on 346 DOY, and it lasted until day 363, despite being reported in the literature that it flowers during May, June, and July [83]. Another example is the Indigo Bush, which flowers from April to July [84]; our study confirmed a repeated full flowering during the fall of 2022. Several more species differed from the states described in the literature: European Mock-Orange blooms in May and June [85], but, in addition to the first flowering, our study recorded a second full flowering in the fall of 2022; for Spanish Dagger, a complete second phenophase of flowering was recorded, while it is stated in the literature that it blooms during the summer [86]. Similarly, Rugosa Rose blooms abundantly in May and June [87], but, in Belgrade in 2022, the first phenophase of flowering lasted until August, while the beginning of the second flowering was recorded at the end of autumn and lasted until 365 DOY. Repeated flowering can be dangerous for the species because open flowers are not tolerant to temperatures below 0°C and flower buds can be destroyed (except when under snow cover) [88]. In some taxa, there is a second flowering at the end of the vegetation period, which leads to an extension of the duration of flowering, which has not been sufficiently investigated in previous research on woody plants. A second bloom is more likely if the duration of the first bloom is short. Our results indicate interesting data for the duration of the autumn reseated flowering; namely, the majority of species (Jasminum nudiflorum Lindl., Syringa vulgaris Lindl., Prunus laurocerasus ‘Zabeliana’, Cornus alba ‘Sibirica’, Cornus alba L., Amorpha fruticosa L., Cornus sanguinea L., and Philadelphus coronarius L.) had the second flowering longer than the first. The appearance of the second flowering can also cause unsuccessful pollination in the first flowering phenophase [13,25]. From the point of view of landscape design, so far, there is no evidence to prove whether second flowering events are characteristic of the taxon or are a consequence of specific abiotic and biotic conditions [25]. On the other hand, extensive sources used for repeated phenophase significantly determine the content of nutrients for pollinators and other consumers. These changes lead to the reduction of long-term productivity and reproductive potential of plants because there is an increased uptake of nutrient reserves [89,90,91,92]. The significance of such processes is reflected in the importance of phenological complementarity with the processes of the ecosystem, especially the capture and the productivity of nutrients [93].

4.5. Third Flowering

An even more extreme event occurred in the phenology of Tartarian Dogwood, which usually blooms in late spring and early summer with the possibility of repeated flowering in late summer or early autumn [68,94], but had a complete second flowering and fruiting and, at the beginning of winter in Belgrade 2022, the phenophase of the third full flowering happened and lasted until 365 DOY. Repeated flowering is especially detrimental to pollinators as they depend not only on the synchronization of the phenological events of plants but also on their nutrient content [30]. The same authors cite specific elements of nutrition (amino acids and sterols) as being essential in bee feeding and, therefore, more thoroughly relate phenological mismatches between pollinators and flowering plants, which is especially important if we bear in mind that the rates of phenological advancement are different for pollinators and various species of flowering plants [74]. The reduction in the demography of species nesting in flowering plants is the direct consequence of phenological mismatches between insects and the flowering phenophase of their host [26]. Consumers that use only one source or one species for food are more affected [34]. Even a full fruiting appeared in four taxa (Cornus alba ‘Sibirica’, Cornus alba L., Cornus sanguinea L., and Ficus carica L.), while the beginning of the flowering phenophase was noted in Prunus laurocerasus ‘Zabeliana’. These results are especially important for the provision of food for birds and other consumers.

4.6. Phenology and Landscape Design

The phenological shifts in species such as these should be considered when considering ornamental choices. Two recent meta-analyses of observational data have found that spring has advanced globally at a rate of 2.3 days per decade [95] and 5.1 days per decade [96], respectively. With a long list of species with repeated flowering or even occurrence of the three flowering events, we need to take into consideration the climatic projection in landscape design by taking into account the earlier flowering in spring species, the prolonged seasons, and the repetition of key phenological events. Due to climate change, there is a shorter list of plant species used in the modern design of urban spaces in Europe [97]. As a result, more and more non-native species are applied in public green areas; florally decorative woody plants stand out as such. To create an ecosystem that is not only aesthetically pleasing but also reaches its full potential in an ecological context, we would need to turn to landscape sustainability by providing mixed species for feeding the pollinators. As only abundance in species is not enough [75], we should take even more care about the maintenance of the ornamental taxa to provide good-quality nutrients for the consumers. Moreover, vegetation and plant diversity have many benefits for human well-being [98,99]. The goals of sustainable work design as urban planting should lead to increased well-being. Knowing the different benefits that flowering provides shows the importance it has in the practice of landscape architecture as well as in improving the creation of urban policies. Landscape policy implies the correct implementation of color decorative species. Hoyle et al. [99] point out that designers and managers of urban green infrastructure should give priority to mixtures of a great variety of colors.

4.7. Seasonal Shifts

In our research, as in previous studies, early-flowering species were affected by temperatures during winter and the first days of spring, that is, in the case of Zabel’s Laurel, fluctuating temperatures at the end of spring. Early-season species had the biggest acceleration in the studies of Menzel [100], Fitter and Fitter [101], and Sparks and Menzel [102]. These findings were further confirmed in experimental research that showed an acceleration of both flowering and growth [103,104,105], which also found that that early-spring flowering species are affected the most. During 2022, the deviation of phenophases and other flowering events occurred, as well as repeated flowering and fruiting during autumn and early winter 2022/23. Bearing in mind that all the taxa that are the subject of this study are located on different types of soil, exposures, altitudes, and the degree of urbanization, as well as that some are wild while others are purposefully planted, it is evident that the common factor was a significant advancement in average air temperatures, apart from other climatic variables that influenced the occurrence of repeated flowering events within the same vegetative season. The study of Menzel et al. [106] included a large amount of long observational series as well as plant and animal species across European countries [106] and had similar findings that the earlier flowering and fruiting appeared (2.5 and 2.4 days per decade, respectively). Global projections predict an increase in the variability of climate in most parts of the world [107]. This will have major implications on the phenology and the discrepancies between providers and consumers [36,108,109,110,111,112]. Further analysis of our data is crucial for the estimation of the changes in ecosystem services in the face of climate change. We will need to substantially adjust landscape design principles as well as prioritize landscape sustainability over aesthetics. To prolong the list of species used in landscape design in shifting seasonal trends and to face the changes in climate and phenology, professionals turn to introduced species. The application of introduced species in urban green areas can lead to a change in biodiversity because individuals can exhibit an invasive character. The application of a large number of introduced species also affects changes in insects, pollinators, as well as ecosystem services, because woody plants represent habitats for many small city animals. Due to these influences, many authors propose the use of only indigenous species to reduce the impact on green area ecology [113,114]. However, not all parties show the species of invasiveness and do not represent a problem for the conservation of biodiversity [97]. Salisbury et al. [115] point out that non-native plants also affect the ecosystem positively because, after the flowering of indigenous plant species, allochthonous plants can expand pollen and nectar availability. To design urban landscapes, the introduction of new species is encouraged due to aesthetic values as well as for the potential adaptability the species have under climate change [114].
The further steps are to evaluate the contribution of the urban heat island (UHI), soil sealing, and the degree of urbanization to the changes in phenology and balance with the aforementioned climatic parameters. Such analysis will provide even more specific methods and recommendations to improve landscape management and design based on these changes. With the improvement of spatial resolution, remote sensing techniques are now a viable methodology for the assessment of changes in land use alongside phenological changes.

5. Conclusions

A large variability of flowering phenology within genera, species, and lower taxa has been found, allowing them to evolve rapidly in response to local conditions. One of the adaptation models is flowering and fruiting ‘out of season’ in the annual cycle. The 13 analyzed taxa are varying in terms of phenological patterns and ecological requirements. This study is an example of ‘ongoing evolution’ for the listed taxa in a temperate continental climate. This has further implications for the sustainability and services of the ecosystem, as pollinators and nutrients as well as landscape planning and design depend on the shifts in phenology.
Statistical analysis confirmed that the temperature sum initiated the development of plants, i.e., observed phenological events. Although DOY was changed significantly as, due to global warming, the phenology of all taxa was shifted, GDD proved to be a better parameter for predicting phenological occurrences such as flowering and all the related key events. The year 2022 was extreme in comparison with the 16-year average and changes in phenology were noted in all the observed species. The earlier start of the first flowering was recorded for 60% of the studied species, ranging from 1 to 25 days. On the other hand, in the other third of the studied taxa, the flowering phenophase was postponed by 4 to 6 days. Thus, all the species had various adaptation mechanisms. The duration of the flowering phenophase was in direct correlation with temperatures, so shortening or lengthening of flowering was noted when the temperature conditions were not optimal.
Analyses of phenological data in the period 2007–2022 confirmed significant changes in the phenological patterns of flowering, namely in the number of days for the beginning of flowering (in two species), the period from the beginning to full flowering (found in almost ⅔ of analyzed taxa), and from full flowering to the end of flowering (found only in one species). The biggest number of species prolonged the period from the beginning to full flowering (half of the observed taxa), while the beginning and the end of flowering (one and two species, respectively). Similarly, regarding DOY, only one species extended a flowering period and half of the species had a shortened start-to-full flowering period. However, GDD was within the frame cited in the literature for almost all of the species. Within the 16-year-long observations, the year 2022 stands out in the earlier start of the season for most of the species, the extended season in total for a third of species, and shorter for only one species in a suburban area. In the urban area, climate variables affected the taxa differently and the season was shortened for five taxa and lengthened for four taxa. For all the aforementioned species, a common factor was an inadequate temperature, i.e., significantly different from average values for the studied period.
As the research on flowering species and their changes are very important for the dynamic change of the environment, we should consider the trends of both introduced and native species. The growth trend was confirmed for the later onset of flowering of some species and for extended flowering in one taxon. A decreasing trend indicated a shortening of the start-to-full flowering period for half of the species. Therefore, we can conclude that there is no clear trend for all the taxa, but the adaptations vary from species to species. As ornamental species are appreciated for their attractiveness, color, and length of flowering, their phenological patterns should provide guidelines for fulfilling their most important visual characteristics. Apart from their importance for the design, flowering species have a major role in landscape sustainability, where phenological shifts are reflected in the pollinators. The mismatching and asynchronicity of phenophases between insects and flowering taxa create disturbances in the ecosystem as a whole.
The study confirmed that monitoring phenophases is a good indicator of climate change and that phenological flowering patterns are a platform (database) for defining recommendations for landscape design; namely, the analyzed taxa are implemented in green spaces due to the formation of a composition of adequate structure, function (rest, relaxation, visual enjoyment, protection), form and meaning, contribution to the quality of the environment, and enrichment of biodiversity. The changes and the events recorded during autumn and December 2022, but also in the period 2007–2022, indicate the dominant influence of temperature, so it can be concluded that climatic extremes would inevitably change current practices in landscape design and prioritize the sustainability of ecosystems over aesthetics in green spaces.

Supplementary Materials

The following supporting information can be downloaded at: https://www.mdpi.com/article/10.3390/land12030706/s1, Figure S1: Location of the study area; Figure S1a: The degree of urbanization by municipalities; Table S1: Description of the study areas; Table S2: Climate variables for 2022, referential period 1991-2020 and previous time series: 1981-2010, 1971-2000 and 1961-1990, for the station Belgrade; Table S3: Climate variables for 2022, referential period 1991-2020 and previous time series: 1981-2010, 1971-2000 and 1961-1990 for the station Surčin; Table S4: Climate variables for 2022, for the reference period 1991-2020 and previous time series: 1981-2010, 1971-2000 and 1961-1990 for stations Belgrade and Surčin by season; Table S5: Statistical summary of mean minimum, maximum, and mean temperature sums (°C), for the beginning of flowering (BF), full flowering (FF), and the end of flowering (EF) and their standard deviations for 13 woody taxa based on data from station Belgrade and Surčin for the period 2007-2022; Table S6: Results of Mann-Kendall (Kendall‘s tau), p-value and Sen‘s slope test for the mean values of temperature sums GDD (°C) and day of the year DOY in the period 2007-2022 for the beginning of flowering (BF), full flowering ( FF), the end of flowering (EF), days from the beginning of the flowering to full flowering (BF-FF) and full flowering to the end of flowering (FF-EF) for 13 woody taxa; Table S7: Statistical summary of average minimum, maximum and mean DOY for the beginning of the flowering (BF), the period from the beginning to full flowering (BF-FF) and full flowering to the end of flowering (FF-EF), and their standard deviations for 13 woody taxa for the period 2007-2022.

Author Contributions

Conceptualization, M.O., D.P., N.G., and D.S.; methodology, M.O., D.P., N.G., D.S., O.K., and I.S.; formal analysis, M.O. and D.P.; investigation M.O., D.P., N.G., D.S., O.K., and I.S.; resources, M.O., D.P., N.G., D.S., O.K., and I.S.; data curation M.O., D.P., and O.K., visualization, N.G. and D.S.; writing—original draft preparation, M.O.; writing—review and editing M.O., D.P., and I.S.; supervision, M.O. All authors have read and agreed to the published version of the manuscript.

Funding

This research was funded by The Ministry of Education, Science and Technological Development which is financing the scientific research work of the University of Belgrade, Faculty of Forestry in 2023 on the basis of the agreement on the realization number: 451-03-47/2023-01/200169.

Institutional Review Board Statement

Not applicable.

Informed Consent Statement

Not applicable.

Data Availability Statement

Climatology data are freely available at https://www.hidmet.gov.rs/eng/meteorologija/klimatologija_produkti.php. Data from the Republic Hydrometeorolgical Service of Serbia cannot be published. accessed multiple times from 1 January 2020 to 20 January 2023.

Conflicts of Interest

The authors declare no conflict of interest.

References

  1. Forman, R.T.T. Urban Regions: Ecology and Planning Beyond the City; Cambridge University Press: Cambridge, UK, 2008; p. 478. [Google Scholar]
  2. Wu, J.G. Landscape sustainability science: Ecosystem services and human well-being in changing landscapes. Landsc. Ecol. 2013, 28, 999–1023. [Google Scholar] [CrossRef]
  3. Frazier, A.; Vadjunec, J.; Kedron, P.; Fagin, T. Linking landscape ecology and land system architecture for land system science: An introduction to the special issue. J. Land Use Sci. 2019, 14, 123–134. [Google Scholar] [CrossRef]
  4. Qiu, J.; Carpenter, S.R.; Booth, E.G.; Motew, M.; Zipper, S.C.; Kucharik, C.J.; Loheide, S.P., II; Turner, M.G. Understanding relationships among ecosystem services across spatial scales and over time. Environ. Res. Lett. 2018, 13, 054020. [Google Scholar] [CrossRef]
  5. Forman, R.T.T. Urban Ecology: Science of Cities; Cambridge University Press: Cambridge, UK, 2014; p. 478. [Google Scholar]
  6. de Vries, B.J.M. Sustainability Science; Cambridge University Press: Cambridge, UK, 2013; p. 605. [Google Scholar]
  7. Wu, J. Linking landscape, land system and design approaches to achieve sustainability. J. Land Use Sci. 2019, 14, 173–189. [Google Scholar] [CrossRef]
  8. Cleland, E.; Chuine, I.; Menzel, A.; Mooney, H.; Schwartz, M. Shifting plant phenology in response to global change. Trends Ecol. Evol. 2007, 22, 357–365. [Google Scholar] [CrossRef] [PubMed]
  9. Matthews, E.R.; Mazer, S.J. Historical changes in flowering phenology are governed by temperature x precipitation interactions in a widespread perennial herb in western North America. New Phytol. 2016, 210, 157–167. [Google Scholar] [CrossRef] [Green Version]
  10. WMO. State of the Global Climate 2021: WMO Provisional Report; WMO No. 1290; World Meteorological Organization (WMO), World Climate Data and Monitoring Programme: Geneva, Switzerland, 2021; p. 57. Available online: https://library.wmo.int/doc_num.php?explnum_id=10859 (accessed on 7 December 2022).
  11. Vitasse, Y.; Porté, A.J.; Kremer, A.; Michalet, R.; Delzon, S. Responses of canopy duration to temperature changes in four temperate tree species: Relative contributions of spring and autumn leaf phenology. Oecologia 2009, 161, 187–198. [Google Scholar] [CrossRef]
  12. Schuster, C.; Estrella, N.; Menzel, A. Shifting and extension of phonological periods with increasing temperature along elevational transects in southern Bavaria. Plant Biol. 2014, 16, 332–344. [Google Scholar] [CrossRef]
  13. Liang, L.; Schwartz, M.D.; Zhang, X. Mapping temperate vegetation climate adaptation variability using normalized land surface phenology. Climate 2016, 4, 24. [Google Scholar] [CrossRef] [Green Version]
  14. Stojicic, D.J. The Impact of Environmental Factors on Flowering of Woody Species from Magnoliophyta group in Belgrade. Ph.D. Thesis, Univerzitet u Beogradu-Šumarski fakultet, Belgrade, Serbia, 2014; p. 243. (In Serbian). [Google Scholar]
  15. Rathcke, B.; Lacey, E.P. Phenological patterns of terrestrial plants. Annu. Rev. Ecol. Syst. 1985, 16, 179–214. [Google Scholar] [CrossRef]
  16. Lindholm, G. Land and Landscape; Linking Use, Experience and Property Development in Urban Areas. Land 2019, 8, 137. [Google Scholar] [CrossRef] [Green Version]
  17. Lalić, B.; Ejcinger, J.; Dalamarta, A.; Orlandini, S.; Firanj Sremac, A.; Paher, B. Meteorology and Climatology for Agronomists. [Meteorologija i klimatologija za agronome]; Univerzitet u Novom Sadu-Poljoprivredni Fakultet: Novi Sad, Serbia, 2021; p. 219. (In Serbian) [Google Scholar]
  18. Waser, N.M.; Real, L.A. Effective mutualism between sequentially flowering plant species. Nature 1979, 281, 670. [Google Scholar] [CrossRef]
  19. Memmott, J.; Craze, P.G.; Waser, N.M.; Price, M.V. Global warming and the disruption of plant–pollinator interactions. Ecol. Lett. 2007, 10, 710–717. [Google Scholar] [CrossRef] [PubMed]
  20. Fitter, A.; Fitter, R.; Harris, I.; Williamson, M. Relationships between first flowering date and temperature in the flora of a locality in central England. Funct. Ecol. 1995, 9, 55–60. [Google Scholar] [CrossRef]
  21. Bock, A.; Sparks, T.H.; Estrella, N.; Jee, N.; Casebow, A.; Schunk, C.; Leuchner, M.; Menzel, A. Changes in first flowering dates and flowering duration of 232 plant species on the island of Guernsey. Glob. Chang. Biol. 2014, 20, 3508–3519. [Google Scholar] [CrossRef]
  22. König, P.; Tautenhahn, S.; Cornelissen, J.H.C.; Kattge, J.; Bönisch, G.; Römermann, C. Advances in flowering phenology across the northern hemisphere are explained by functional traits. Glob. Ecol. Biogeogr. 2018, 27, 310–321. [Google Scholar] [CrossRef]
  23. Büntgen, U.; Piermattei, A.; Krusic, P.J.; Esper, J.; Sparks, T.; Crivellaro, A. Plants in the UK flower a month earlier under recent warming. Proc. Biol. Sci. 2022, 289, 20212456. [Google Scholar] [CrossRef]
  24. Trunschke, J.; Stöcklin, J. Plasticity of flower longevity in alpine plants is increased in populations from high elevation compared to low elevation populations. Alp. Bot. 2017, 127, 41–51. [Google Scholar] [CrossRef] [Green Version]
  25. Bucher, S.; Römermann, C. Flowering patterns change along elevational gradients and relate to life-history strategies in 29 herbaceous species. Alp. Bot. 2020, 130, 41–58. [Google Scholar] [CrossRef] [Green Version]
  26. Vázquez, D.P.; Vitale, N.; Dorado, J.; Amico, G.; Stevani, E.L. Phenological mismatches and the demography of solitary bees. Proc. R. Soc. B Biol. Sci. 2023, 290, 20221847. [Google Scholar] [CrossRef]
  27. Roulston, T.; Goodell, K. The Role of Resources and Risks in Regulating Wild Bee Populations. Annu. Rev. Entomol. 2011, 56, 293–312. [Google Scholar] [CrossRef] [Green Version]
  28. Goulson, D.; Nicholls, E.; Botías, C.; Rotheray, E.L. Bee declines driven by combined stress from parasites, pesticides, and lack of flowers. Science 2015, 347, 1255957. [Google Scholar] [CrossRef]
  29. Belsky, J.; Joshi, N. Impact of biotic and abiotic stressors on managed and feral bees. Insects 2019, 10, 233. [Google Scholar] [CrossRef] [Green Version]
  30. Parreño, M.A.; Alaux, C.; Brunet, J.; Buydens, L.; Filipiak, M.; Henry, M.; Keller, A.; Klein, A.; Kuhlmann, M.; Leroy, C.; et al. Critical links between biodiversity and health in wild bee conservation. Trends Ecol. Evol. 2022, 37, 309–321. [Google Scholar] [CrossRef] [PubMed]
  31. Hobbie, S. Effects of plant species on nutrient cycling. Trends Ecol. Evol. 1992, 7, 336–339. [Google Scholar] [CrossRef] [PubMed]
  32. Morris, L.A. Soil Development and Properties | Nutrient Cycling. In Encyclopedia of Forest Sciences; Burley, J., Ed.; Elsevier: Amsterdam, The Netherlands, 2004; pp. 1227–1235. [Google Scholar]
  33. González de Andrés, E. Interactions between Climate and Nutrient Cycles on Forest Response to Global Change: The Role of Mixed Forests. Forests 2019, 10, 609. [Google Scholar] [CrossRef] [Green Version]
  34. Twining, C.W.; Shipley, J.R.; Matthews, B. Climate change creates nutritional phenological mismatches. Trends Ecol. Evol. 2022, 37, 736–739. [Google Scholar] [CrossRef]
  35. Patt, J.M.; Wainright, S.C.; Hamilton, G.C.; Whittinghill, D.; Bosley, K.; Dietrick, J.; Lashomb, J.H. Assimilation of carbon and nitrogen from pollen and nectar by a predaceous larva and its effects on growth and development. Ecol. Entomol. 2003, 28, 717–728. [Google Scholar] [CrossRef]
  36. Both, C.; van Asch, M.L.; Bijlsma, R.G.; van den Burg, A.B.; Visser, M.E. Climate change and unequal phenological changes across four trophic levels: Constraints or adaptations? J. Anim. Ecol. 2009, 78, 73–83. [Google Scholar] [CrossRef] [PubMed] [Green Version]
  37. Junker, R.R.; Blüthgen, N.; Brehm, T.; Binkenstein, J.; Paulus, J.; Martin Schaefer, H.; Stang, M. Specialization on traits as basis for the niche-breadth of flower visitors and as structuring mechanism of ecological networks. Funct. Ecol. 2013, 27, 329–341. [Google Scholar] [CrossRef]
  38. DeGrandi-Hoffman, G.; Corby-Harris, V.; Carroll, M.; Toth, A.L.; Gage, S.; Watkins de Jong, E.; Graham, H.; Chambers, M.; Meador, C.; Obernesser, B. The Importance of Time and Place: Nutrient Composition and Utilization of Seasonal Pollens by European Honey Bees (Apis mellifera L.). Insects 2021, 12, 235. [Google Scholar] [CrossRef] [PubMed]
  39. Miller-Rushing, A.J.; Inouye, D.W. Variation in the impact of climate change on flowering phenology and abundance: An examination of two pairs of closely related wildflower species. Am. J. Bot. 2009, 96, 1821–1829. [Google Scholar] [CrossRef] [PubMed]
  40. Forrest, J.; Inouye, D.W.; Thomson, J.D. Flowering phenology in subalpine meadows: Does climate variation influence community co-flowering patterns? Ecology 2010, 91, 431–440. [Google Scholar] [CrossRef] [PubMed] [Green Version]
  41. Smith, J.G.; Sconiers, W.; Spasojevic, M.J.; Ashton, I.W.; Suding, K.N. Phenological Changes in Alpine Plants in Response to Increased Snowpack, Temperature, and Nitrogen. Arct. Antarct. Alp. Res. 2012, 44, 135–142. [Google Scholar] [CrossRef]
  42. Wray, J.; Elle, E. Flowering phenology and nesting resources influence pollinator community composition in a fragmented ecosystem. Landsc. Ecol. 2014, 30, 261–272. [Google Scholar] [CrossRef]
  43. Flo, V.; Bosch, J.; Arnan, X.; Primante, C.; Martín González, A.M.; Barril-Graells, H.; Rodrigo, A. Yearly fluctuations of flower landscape in a Mediterranean scrubland: Consequences for floral resource availability. PLoS ONE 2018, 13, e0191268. [Google Scholar] [CrossRef] [PubMed] [Green Version]
  44. FHZ. Available online: https://www.fhmzbih.gov.ba/latinica/FENO/uputstvo.php (accessed on 12 October 2022).
  45. Koch, E.; Bruns, E.; Chmielewski, F.M.; Defila, C.; Lipa, W.; Menzel, A. Guidelines for Plant Phenological Observations; WMO Technical Commission for Climatology, Open Program Area Group on Monitoring and Analysis of Climate Variability and Change (OPAG2): Geneva, Switzerland, 2007; p. 39. [Google Scholar]
  46. Meier, U. BBCH-Monograph. Growth Stages of Plants. [Entwicklungsstadien von Pflanzen. Estadios de las Plantas. Stades De Développement des Plantes]; Blackwell Wissenschafts-Verla: Berlin, Germany; Vienna, Austria, 1997; p. 622. [Google Scholar]
  47. Meier, U. Growth Stages of Mono and Dicotyledonous Plants, BBCH Monograph, 2nd ed.; Federal Biological Research Centre for Agriculture and Forestry: Bonn, Germany, 2001; p. 158. [Google Scholar]
  48. Buttler, K.P.; Schmid, W. Guideline for the Phenological Observers of the German Meteorological Service (BAPH), 3rd ed.; Anleitung fur die phanologischen Beobachter des Deutschen Wetterdienstes, 3. Aufl; Deutscher Wetterdienst: Offenbach am Main, Germany, 1991; p. 191. (In German) [Google Scholar]
  49. Meier, U. Phenological growth stages. In Phenology: An Integrative Environmental Science; Schwartz, M.D., Ed.; Springer: Dordrecht, The Netherlands, 2003; Volume 39, pp. 269–283. [Google Scholar]
  50. Vučetić, V. Secular trend analysis of growing degree-days in Croatia. Idojаrаs 2009, 113, 39–46. [Google Scholar]
  51. McMaster, G.S.; Wilhelm, W.W. Growing degree-days one equation, two interpretations. Agric. For. Meteorol. 1997, 87, 291–300. [Google Scholar] [CrossRef] [Green Version]
  52. Vučetić, V.; Vučetić, M. Variations of phenological stages of olive-trees along the Adriatic coast. Period. Biol. 2005, 107, 335–340. [Google Scholar]
  53. Milovanović, B. Natural Causes of Climate Variability in Serbia. [Прирoдни фактoри кoлебања климе у Србији]; GI SASA–Special Editions 93; Geographical Institute Jovan Cvijić SASA: Belgrade, Serbia, 2017; p. 152. (In Serbian) [Google Scholar]
  54. Diress, S.A.; Bedada, T.B. Precipitation and Temperature trend analysis by Mann Kendall test: The case of Addis Ababa methodological station, Addis Ababa, Ethiopia. Afr. J. Land Policy Geospat. Sci. 2021, 4, 517–526. [Google Scholar]
  55. Rustum, R.; Adeloye, A.J.; Mwale, F. Spatial and temporal Trend Analysis of Long Term rainfall records in data-poor catchments with missing data, a case study of Lower Shire floodplain in Malawi for the Period 1953–2010. Hydrol. Earth Syst. Sci. Discuss. 2017, preprint. [Google Scholar] [CrossRef] [Green Version]
  56. Quade, D. Nonparametric Partial Correlation. In Measurement in the Social Sciences; Blalock, H.M., Ed.; North Carolina State University, Department of Statistics, Aldine: Chicago, IL, USA, 1974; pp. 369–399. [Google Scholar]
  57. Horvat, J.; Mijoč, J. Basic Statistics. [Osnove Statistike]; Naklada Ljevak: Zagreb, Croatia, 2012; p. 482. (In Croatian) [Google Scholar]
  58. Nassauer, J.I.; Opdam, P. Design in science: Extending the landscape ecology paradigm. Landsc. Ecol. 2008, 23, 633–644. [Google Scholar] [CrossRef]
  59. Liao, C.; Qiu, J.; Chen, B.; Chen, D.; Fu, B.; Georgescu, M.; He, C.; Jenerette, G.D.; Li, X.; Li, X.; et al. Advancing landscape sustainability science: Theoretical foundation and synergies with innovations in methodology, design, and application. Landsc. Ecol. 2020, 35, 1–9. [Google Scholar] [CrossRef] [Green Version]
  60. Borgogno-Mondino, E.; Fissore, V. Reading Greenness in Urban Areas: Possible Roles of Phenological Metrics from the Copernicus HR-VPP Dataset. Remote Sens. 2022, 14, 4517. [Google Scholar] [CrossRef]
  61. Penzar, I.; Penzar, B. Agrometeorology. [Agrometeorologija]; Školska knjiga: Zagreb, Croatia, 2000; p. 228. (In Croatian) [Google Scholar]
  62. IPCC. Global Warming of 1.5 °C. An IPCC Special Report on the Impacts of Global Warming of 1.5 °C above Pre-Industrial Levels and Related Global Greenhouse Gas Emission Pathways, in the Context of Strengthening the Global Response to the Threat of Climate Change, Sustainable Development, and Efforts to Eradicate Poverty; Masson-Delmotte, V., Zhai, P., Pörtner, H.-O., Roberts, D., Skea, J., Shukla, P., Pirani, A., Moufouma-Okia, W., Péan, C., Pidcock, R., et al., Eds.; Cambridge University Press: Cambridge, UK; New York, NY, USA, 2018; p. 616. [Google Scholar]
  63. IPCC. Climate Change and Land: An IPCC Special Report on Climate Change, Desertification, Land Degradation, Sustainable Land Management, Food Security, and Greenhouse Gas Fluxes in Terrestrial Ecosystems; Shukla, P.R., Skea, J., Buendia, E.C., Masson-Delmotte, V., Pörtner, H.-O., Roberts, D., Zhai, P., Slade, R., Connors, S., van Diemen, R., et al., Eds.; Cambridge University Press: Cambridge, UK; New York, NY, USA, 2019; p. 874. [Google Scholar]
  64. Vujović, D.; Todorović, N. Urban-rural fog differences in Belgrade area, Serbia. Theor. Appl. Climatol. 2018, 131, 889–898. [Google Scholar] [CrossRef]
  65. Reich, P. Phenology of tropical forests: Patterns, causes, and consequences. Can. J. Bot. 1995, 73, 164–174. [Google Scholar] [CrossRef]
  66. Morellato, C. South America. In Phenology: An Integrative Environmental Science; Schwartz, M.D., Ed.; Kluwer Academic Publishers: Dordrecht, The Netherlands, 2003; pp. 75–92. [Google Scholar]
  67. Sanchez-Azofeifa, A.; Kalacska, M.E.; Quesada, M.; Stoner, K.E.; Lobo, J.A.; Arroyo-Mora, P. Tropical dry climates. In Phenology: An Integrative Environmental Science; Schwartz, M.D., Ed.; Kluwer Academic Publishers: Dordrecht, The Netherlands, 2003; pp. 121–138. [Google Scholar]
  68. Ocokoljić, M.; Petrov, D.J. Decorative Dendrology. [Dekorativna dendrologija]; Univerzitet u Beogradu-Šumarski Fakultet: Belgrade, Serbia, 2022; p. 409. (In Serbian) [Google Scholar]
  69. Cvjetićanin, R.; Brujić, J.; Perović, M.; Stupar, V. Dendrology. [Dendrologija]; Univerzitet u Beogradu-Šumarski Fakultet: Belgrade, Serbia, 2016; p. 557. (In Serbian) [Google Scholar]
  70. De Réaumur, R.A.F. Observations of the Thermometer, Made in Paris during the Year 1735 Compared with Those Which Have Been Made under the Line at Ile de France, at Algiers and in Some of Our American Islands. [Observations du Thermomètre, Faites à Paris Pendant l´Année 1735 Comparées avec Celles qui ont été Faites sous la ligne à l′Ile de France, à Alger et en Quelques-unes de Nosîles de l′Amérique]; Mémoires de l’Academie Royale des Sciences de Paris: Paris, France, 1735; pp. 545–576. (In French) [Google Scholar]
  71. Menzel, A. Trends in phenological phases in Europe between 1951 and 1996. Int. J. Biometeorol. 2000, 44, 76–81. [Google Scholar] [CrossRef]
  72. Piao, S.; Liu, Q.; Chen, A.; Janssens, I.A.; Fu, Y.; Dai, J.; Liu, L.; Lian, X.; Shen, M.; Zhu, X. Plant phenology and global climate change: Current progresses and challenges. Glob. Chang. Biol. 2019, 25, 1922–1940. [Google Scholar] [CrossRef] [PubMed]
  73. Schüepp, W. Phänometrische Experimente über die Winter—(x) ruhe einiger. Pflanzen 1950, 2, 205–211. [Google Scholar]
  74. Stemkovski, M.; Pearse, W.D.; Griffin, S.R.; Pardee, G.L.; Gibbs, J.; Griswold, T.; Neff, J.L.; Oram, R.; Rightmyer, M.G.; Sheffield, C.S.; et al. Bee phenology is predicted by climatic variation and functional traits. Ecol. Lett. 2020, 23, 1589–1598. [Google Scholar] [CrossRef]
  75. Filipiak, Z.M.; Denisow, B.; Stawiarz, E.; Filipiak, M. Unravelling the dependence of a wild bee on floral diversity and composition using a feeding experiment. Sci. Total Environ. 2022, 820, 153326. [Google Scholar] [CrossRef]
  76. Vučetić, V. Does climate change influence on beginning of common lilac flowering? Croat. Meteorol. J. 2011, 46, 45–53. [Google Scholar]
  77. Cosmovision. Available online: http://www.cosmovisions.com/laurierscerises.htm (accessed on 15 December 2022).
  78. Moisescu, E.; Antoce, A.O. Figs (Ficus carica L.) used as raw material for obtaining alcoholic fermented beverages. Beverages 2022, 8, 60. [Google Scholar] [CrossRef]
  79. Kikuchi, M.; Yamauchi, Y.; Takahashi, Y.; Sugiyama, M. Studies on the constituents of syringa spp viii. isolation and structures of phenylpropanoid glycosides from the leaves of syringa reticulata blume hara. Yakugaku Zasshi 1989, 109, 366–371. [Google Scholar] [CrossRef]
  80. Washington State University, PNW Plants. Available online: http://pnwplants.wsu.edu/PlantDisplay.aspx?PlantID=191 (accessed on 15 December 2022).
  81. Brickell, C.D.; Alexander, C.; Cubey, J.J.; David, J.C.; Hoffman, M.H.A.; Leslie, A.C.; Malécot, V.; Hetterscheid, W.L.A.; Jin, X. International Code of Nomenclature for Cultivated Plants (ICNCP), 9th ed.; Scripta Horticulturae 18; International Society of Horticultural Science: Leuven, Belgium, 2016; p. 190. [Google Scholar]
  82. Kollmann, J.; Grub, P.J. Biological Flora of Central Europe: Cornus sanguinea L. Flora 2001, 196, 161–179. [Google Scholar] [CrossRef]
  83. Boonnour, K.; Wainwright, H.; Hicks, R.G.T. The micropropagation of Lonicera periclymenum L. (Hony-suckle). Acta Hortic. 1988, 226, 183–190. [Google Scholar] [CrossRef]
  84. Dirr, M.A. Dirr’s Hardy Trees and Shrubs: An Illustrated Encyclopedia; Timber Press: Portland, OR, USA, 1997; p. 494. [Google Scholar]
  85. Bean, W.J. Trees & Shrubs Hardy in the British Isles, 8th ed.; John Murray: London, UK, 1976; Volume 4, pp. 127–146. [Google Scholar]
  86. Höchstatter, F. Yucca II (Agavaceae). Indehiscent-Fruited Species in the Southwest, Midwest and East of the USA; Fritz Hochstatter: Mannheim, Germany, 2002; p. 340. [Google Scholar]
  87. Ribotta, S.; Liccari, F.; Muggia, L.; Pallavicini, A.; Bagnolini, F.; Tordoni, E.; Bacaro, G. Invasion at the Edge: The Case of Rosa rugosa (Rosaceae) in Italy. Diversity 2021, 13, 645. [Google Scholar] [CrossRef]
  88. Chiesura, A. The role of urban parks for the sustainable city. Landsc. Urban Plan. 2003, 68, 129–138. [Google Scholar] [CrossRef]
  89. Wookey, P.A.; Parsons, A.N.; Welker, J.M.; Potter, J.A.; Callaghan, T.V.; Lee, A.; Press, M.C. Comparative responses of phenology and reproductive development to simulated environmental change in sub-arctic and high arctic plants. Oikos 1993, 67, 490–502. [Google Scholar] [CrossRef]
  90. Chapin, F.S.; Shaver, G.R. Physiological and growth responses of arctic plants to a field experiment simulating climatic change. Ecology 1996, 77, 822–840. [Google Scholar] [CrossRef]
  91. Stenseth, N.C.; Mysterud, A. Climate, changing phenology, and other life history traits: Nonlinearity and match-mismatch to the environment. Proc. Natl. Acad. Sci. USA 2002, 99, 13379–13381. [Google Scholar] [CrossRef] [Green Version]
  92. Visser, M.E.; Both, C. Shifts in phenology due to global climate change: The need for a yardstick. Proc. R. Soc. Lond. Biol. Sci. 2005, 272, 2561–2569. [Google Scholar] [CrossRef] [PubMed]
  93. Hooper, D.U. The role of complementarity and competition in ecosystem responses to variation in plant diversity. Ecology 1998, 79, 704–719. [Google Scholar] [CrossRef]
  94. Church, G. Trees and Shrubs for Flowers, (The Woody Plant); A Fireflay Book: Richmond Hill, ON, Canada, 2020; p. 160. [Google Scholar]
  95. Parmesan, C.; Yohe, G. A globally coherent fingerprint of climate change impacts across natural systems. Nature 2003, 421, 37–424. [Google Scholar] [CrossRef] [PubMed]
  96. Root, T.L.; Price, J.T.; Hall, K.R.; Schneider, S.H.; Rosenzweig, C.; Pounds, J.A. Fingerprints of global warming on wild animals and plants. Nature 2003, 421, 57–60. [Google Scholar] [CrossRef]
  97. Hoyle, H.; Hitchmough, J.; Jorgensen, A. All about the ‘wow factor’? The relationships between aesthetics, restorative effect and perceived biodiversity in designed urban planting. Landsc. Urban Plan. 2017, 164, 109–123. [Google Scholar] [CrossRef]
  98. Clark, N.E.; Lovell, R.; Wheeler, B.W.; Higgins, S.L.; Depledge, M.H.; Norris, K. Biodiversity, cultural pathways, and human health: A framework. Trends Ecol. Evol. 2014, 29, 198–204. [Google Scholar] [CrossRef] [Green Version]
  99. Hoyle, H.; Norton, B.; Dunnett, N.; Richards, P.; Russell, J.; Warren, P. Plant species or flower colour diversity? Identifying the drivers of public and invertebrate response to designed annual meadows. Landsc. Urban. Plan. 2018, 180, 103–113. [Google Scholar] [CrossRef]
  100. Menzel, A. Plant phenological anomalies in Germany and their relation to air temperature and NAO. Clim. Chang. 2003, 57, 243–263. [Google Scholar] [CrossRef]
  101. Fitter, A.H.; Fitter, R.S.R. Rapid changes in flowering time in British plants. Science 2002, 296, 1689–1691. [Google Scholar] [CrossRef]
  102. Sparks, T.H.; Menzel, A. Observed changes in seasons: An overview. Int. J. Climatol. 2002, 22, 1715–1725. [Google Scholar] [CrossRef]
  103. Dunne, J.; Harte, J.; Taylor, K. Subalpine meadow flowering phenology responses to climate change: Integrating experimental and gradient methods. Ecol. Monogr. 2003, 73, 69–86. [Google Scholar] [CrossRef]
  104. Arft, A.M.; Walker, M.; Gurevitch, J.; Alatalo, J.; Bret-Harte, M.; Dale, M.; Diemer, M.; Gugerli, F.; Henry, G.; Jones, M.; et al. Responses of tundra plants to experimental warming: Meta-analysis of the international tundra experiment. Ecol. Monogr. 1999, 69, 491–511. [Google Scholar] [CrossRef]
  105. Price, M.V.; Waser, N.M. Effects of experimental warming on plant reproductive phenology in a subalpine meadow. Ecology 1998, 79, 1261–1271. [Google Scholar] [CrossRef]
  106. Menzel, A.; Sparks, T.; Estrella, N.; Koch, E.; Aasa, A.; Ahas, R.; Alm-Kübler, K.; Bissolli, P.; Braslavska, O.; Briede, A.; et al. European phenological response to climate change matches the warming pattern. Glob. Chang. Biol. 2006, 12, 1969–1976. [Google Scholar] [CrossRef]
  107. Meehl, G.A.; Stocker, T.; Collins, W.; Friedlingstein, P.; Gaye, A.; Gregory, J.M.; Kitoh, A.; Knutti, R.; Murphy, J.M.; Noda, A.; et al. Global climate projections. In Climate Change 2007: The Physical Science Basis; Contribution of Working Group I to the Fourth Assessment Report of the Intergovernmental Panel on Climate Change; Solomon, S., Qin, D., Manning, M., Chen, Z., Marquis, M., Averyt, K.B., Tignor, M., Miller, H.L., Eds.; Cambridge University Press: Cambridge, UK, 2007; pp. 747–846. [Google Scholar]
  108. Kerby, J.T.; Wilmers, C.C.; Post, E. Climate change, phenology and the nature of consumer–resource interactions: Advancing the match/mismatch hypothesis. In Trait-Mediated Indirect Interactions: Ecological and Evolutionary Perspectives; Ohgushi, T., Schmitz, O.J., Holt, R.D., Eds.; Cambridge University Press: Cambridge, UK, 2012; pp. 508–525. [Google Scholar]
  109. Thackeray, S.J.; Henrys, P.A.; Hemming, D.; Bell, J.R.; Botham, M.S.; Burthe, S.; Helaouet, P.; Johns, D.G.; Jones, I.D.; Leech, D.I.; et al. Phenological sensitivity to climate across taxa and trophic levels. Nature 2016, 535, 241–245. [Google Scholar] [CrossRef] [Green Version]
  110. Donoso, I.; Stefanescu, C.; Martínez-Abraín, A.; Traveset, A. Phenological asynchrony in plant-butterfly interactions associated with climate: A communitywide perspective. Oikos 2016, 125, 1434–1444. [Google Scholar] [CrossRef] [Green Version]
  111. Iler, A.M.; CaraDonna, P.J.; Forrest, J.R.K.; Post, E. Demographic consequences of phenological shifts in response to climate change. Ann. Rev. Ecol. Evol. Syst. 2021, 52, 221–245. [Google Scholar] [CrossRef]
  112. Vitale, N.; Torretta, J.P.; Durante, S.; Basilio, A.; Vázquez, D.P. Similarities and differences in the realized niche of two allopatric populations of a solitary bee under environmental variability. Apidologie 2020, 51, 439–454. [Google Scholar] [CrossRef]
  113. Davis, M.A.; Chew, M.K.; Hobbs, R.J.; Lugo, A.E.; John, J.; Ewel, J.J.; Vermeij, G.; Brown, J.; Rosenzweig, M.; Gardener, M.; et al. Don’t judge species on their origins. Nature 2011, 474, 153–154. [Google Scholar] [CrossRef] [PubMed]
  114. Hitchmough, J.D. Exotic plants and plantings in the sustainable, designed landscape. Landsc. Urban Plan. 2011, 100, 380–382. [Google Scholar] [CrossRef]
  115. Salisbury, A.; Armitage, J.; Bostock, H.; Perry, J.; Tatchell, M.; Thompson, K. Enhancing gardens as habitats for flower-visiting aerial insects (pollinators): Should we plant native or exotic species? J. Appl. Ecol. 2015, 52, 1156–1164. [Google Scholar] [CrossRef]
Figure 1. Phenological observations: periods and GDD (mean temperature sums) (°C) for the beginning of flowering (BF), full flowering (FF), and the end of flowering (EF) for 13 woody taxa based on data from the Belgrade (top) and Surčin (bottom) stations for the period 2007–2022.
Land 12 00706 g001
Figure 2. Linear trends of observed phenological phases based on temperature sums in the period 2007–2022 for the beginning of the flowering (BF), full flowering (FF), and the end of flowering (EF) for 13 woody taxa.
Land 12 00706 g002aLand 12 00706 g002bLand 12 00706 g002cLand 12 00706 g002dLand 12 00706 g002eLand 12 00706 g002fLand 12 00706 g002g
Figure 3. Graphical representation of p-value and Sen’s slope for temperature sums (°C) for the beginning of flowering (BF), full flowering (FF), and the end of flowering (EF) for 13 woody taxa in the period 2007–2022 for Belgrade (top) and Surčin (bottom).
Land 12 00706 g003aLand 12 00706 g003b
Figure 4. Phenological observations: periods and DOY for the beginning of flowering (BF), full flowering (FF), and the end of flowering (EF) for 13 woody taxa for the period 2007–2022.
Land 12 00706 g004
Figure 5. Linear trends of observed phenological stages for DOY in the period 2007–2022 for the beginning of flowering (BF), the period from the beginning of flowering to full flowering (BF-FF), and the period from full flowering to the end of flowering (FF-EF) for 13 woody taxa.
Land 12 00706 g005aLand 12 00706 g005bLand 12 00706 g005cLand 12 00706 g005dLand 12 00706 g005eLand 12 00706 g005fLand 12 00706 g005g
Figure 6. Graphical representation of Sen’s slope and p-value for the average number of days to the beginning of the flowering (BF), from the start to full flowering (BF-FF), and from the full flowering to the end of flowering (FF-EF) for 13 woody taxa in the period 2007–2022 for Belgrade (top) and Surčin (bottom).
Land 12 00706 g006aLand 12 00706 g006b
Figure 7. Phenological observations: periods and GDD (temperature sums) (°C) for the beginning of first flowering (BF), full first flowering (FF), the end of first flowering (EF), the beginning of second flowering (BF2), full second flowering (FF2), the end of second flowering (EF2), the beginning of third flowering (BF3), full third flowering (FF3), BFR2 (beginning of second fruit formation), RF2 (second appearance of first ripe fruits), and RP2 (second fruit ripening) for 13 woody taxa based on data from the Belgrade (top) and Surčin (bottom) stations for 2022.
Land 12 00706 g007
Figure 8. Phenological observations: periods and DOY for the beginning of first flowering (BF), full first flowering (FF), the end of first flowering (EF), the beginning of second flowering (BF2), full second flowering (FF2), the end of second flowering (EF2), the beginning of third flowering (BF3), full third flowering (FF3), BFR2 (beginning of second fruit formation), RF2 (second appearance of first ripe fruits), and RP2 (second fruit ripening) for 13 woody taxa in 2022.
Land 12 00706 g008
Figure 9. Phenological observations: GDD and DOY for the start of first bloom (BF), full first bloom (FF), the end of first bloom (EF), the start of second bloom (BF2), and full second bloom (FF2) for Weeping Winter Jasmine (left) and Border Forsythia (right) in 2022.
Land 12 00706 g009
Figure 10. Phenological observations: GDD and DOY for the beginning of first flowering (BF), full first flowering (FF), the end of first flowering (EF), beginning of second flowering (BF2), full second flowering (FF2), the end of second flowering (EF2), BFR2 (beginning of second fruit set), and flower bud set (FB3) for Common Lilac (left) and Zabel’s Laurel (right) in 2022.
Land 12 00706 g010
Figure 11. Phenological observations: GDD and DOY for the beginning of first flowering (BF), full first flowering (FF), the end of first flowering (EF), the beginning of second flowering (BF2), full second flowering (FF2), the end of second flowering (EF2), RF2 (second appearance of first ripe fruits), RP2 (second ripening of fruits), (EF2), the beginning of third flowering (BF3), and full third flowering (FF3) for Siberian Dogwood (left) and Tartarian Dogwood (right) in 2022.
Land 12 00706 g011
Figure 12. Phenological observations: GDD and DOY for the beginning of first flowering (BF), full first flowering (FF), the end of first flowering (EF), the beginning of second flowering (BF2), full second flowering (FF2), and the end of second flowering for Honeysuckle (left) and Indigo Bush (right) in 2022.
Land 12 00706 g012
Figure 13. Phenological observations: GDD and DOY for the beginning of first flowering (BF), full first flowering (FF), the end of first flowering (EF), the beginning of second flowering (BF2), full second flowering (FF2), the end of second flowering (EF2), RF2 (second appearance of first ripe fruits), and RP2 (second fruit ripening) for Common Dogwood (left) and European Mock-Orange (right) in 2022.
Land 12 00706 g013
Figure 14. Phenological observations: GDD and DOY for the beginning of first flowering (BF), full first flowering (FF), the end of first flowering (EF), the beginning of second flowering (BF2), full second flowering (FF2), the end of second flowering (EF2), RF2 (second appearance of first ripe fruits), and RP2 (second fruit ripening) for Edible Fig (left) and Rugosa Rose (right) in 2022.
Land 12 00706 g014
Figure 15. Phenological observations: GDD and DOY for the beginning of first flowering (BF), full first flowering (FF), the end of first flowering (EF), the beginning of second flowering (BF2), full second flowering (FF2), and the end of second flowering (EF2) for Spanish Dagger in 2022.
Land 12 00706 g015
Table 1. Plants considered in the study.
LocationScientific NameCommon NameClass *n **
1. Univerzijade Street 24, Novi Beograd, Ledine Ficus carica L.Edible FigD4.608
2. Ušće Street, Ušće shopping mallYucca gloriosa L.Spanish DaggerM5.424
3. Nikola Pašić Square, Pionirski Park Cornus alba L.Tartarian DogwoodD5.840
4. Beogradska Street, Tašmajdan Park Cornus alba L.
Cornus alba ‘Sibirica’
Tartarian Dogwood
Siberian Dogwood
D
D
5.840
5.008
5. Savska Street, Gazela ParkPhiladelphus coronarius L.
Forsythia × intermedia Zabel
Syringa vulgaris L.
European Mock-Orange
Border Forsythia
Common Lilac
D
D
D
5.296
5.424
5.440
6. Vojvode Mišića Boulevard, Topčider ParkPhiladelphus coronarius L.European Mock-OrangeD5.296
7. Mirosavljeva Street, Banovo brdoCornus alba ‘Sibirica’
Prunus laurocerasus ‘Zabeliana’
Siberian Dogwood
Zabel’s Laurel
D
D
5.008
5.840
8. Vinogradski venac, CerakCornus sanguinea L.Common DogwoodD5.024
9. Obrenovački Road, Ada CiganlijaYucca gloriosa L.Spanish DaggerD5.424
10. Savska Street, OstružnicaAmorpha fruticosa L.Indigo BushD5.088
11. Ive Lole Ribara Street, Ostružnica Lonicera periclymenum ‘Serotina’
Rosa rugosa Thunb.
Honeysuckle
Rugosa Rose
D
D
5.068
5.440
12. Nebojšina Street, Park of St. Sava’s Temple Jasminum nudiflorum Lindl.Weeping Winter ЈasmineD5.792
* M—monocotyledon; D—dicotyledon, n ** number of observations per particular taxa.
Disclaimer/Publisher’s Note: The statements, opinions and data contained in all publications are solely those of the individual author(s) and contributor(s) and not of MDPI and/or the editor(s). MDPI and/or the editor(s) disclaim responsibility for any injury to people or property resulting from any ideas, methods, instructions or products referred to in the content.

