1. Introduction
Place-based polices have been widely used in countries worldwide, aiming to achieve some specific economic goals within a country by establishing special economic zones isolated from other regions and accompanied by special policies [
1,
2].
1 The implementation of place-based policies is often associated with the reallocation of resources, among which the urban land allocation acts as one of the most important policy tools [
3,
4]. As the core input of urban economic and social activities, the green and efficient use of urban land can not only support industrial upgrading, but also be an important practice for countries to combat global climate change [
5,
6]. Therefore, exploring how the place-based policy affects urban land green use efficiency (ULGUE) and improving the strategy of ULGUE is of great practical significance for countries to promote their sustainable development.
In recent years, China has implemented a series of place-based policies such as the high-tech industrial development zone [
7] and the development zone [
8]. Among these policies, the pilot free-trade zone (PFTZ) is a classical and special one that has been established with both external and domestic policy targets. For the external aspect, the PFTZ aims to cultivate new advantages for international competition and explore new paths and models of opening up [
9]. For the domestic aspect, the PFTZ intends to change the economic growth mode and optimize the economic structure [
10]. The PFTZ has specifically deployed the intensive and the sustainable mode of urban land use. For example, the Shanghai PFTZ took the lead in launching a pilot in multi-purpose mixed land use. The Qingdao PFTZ innovatively introduced a 1.5-stage land development pattern. The Sichuan PFTZ implemented the leasing and flexible tenure of industrial land. The Hainan PFTZ proposed to implement the requirements of ecological civilization and green development and comply with the overall plan of “multiple regulations” and the demand for land conservation. In view of this, did the PFTZ establishment improve the ULGUE or not? The investigation of this issue is of great relevance for the further implementation of related place-based polices and the improvement of ULGUE.
In the above context, this study exploits the PFTZ establishment as a perspective to explore the effect of place-based policy on ULGUE. Specifically, we first measure the ULGUE of 279 cities in China from 2011 to 2019 based on the super-efficiency slacks-based measure (SBM) model, and then explore the causality effect of the PFTZ establishment on ULGUE using the multi-period difference-in-differences (DID) method. The heterogeneity effect and the spatial effect of the PFTZ on ULGUE are also discussed in this study. Our result show that the PFTZ significantly promoted ULGUE, especially in the eastern cities, the coastal cities, and the cities with high levels of economic development. This positive effect remains significant after a series of robustness tests, such as the propensity score matching and DID (PSM-DID) method, the entropy-balancing estimation, and the placebo test. Additionally, the PFTZ also effectively improved the ULGUE of the surrounding cities within 100 km.
Our contributions are mainly reflected in two aspects: the research topic and research significance. Specifically, in terms of the research topic, existing studies focused mainly on the effect of the PFTZ on trade and economic development (e.g., [
10,
11,
12,
13]). A few studies concerned the sustainable development effect of the PFTZ (e.g., [
14,
15,
16]). Meanwhile, there was no study that specifically investigated the land use efficiency effect of the PFTZ establishment, especially the ULGUE effect. This study therefore enriches the existing literature on the impacts of the PFTZ establishment and the factors influencing ULGUE. In terms of the research significance, as the main carrier of economic and social activities, the improvement of ULGUE is of great significance for realizing carbon reduction goals [
17,
18]. Moreover, with the advancement of urbanization, the imbalance between land supply and demand has intensified. Reasonable use of land space is the premise to support high-quality green development of cities [
19]. Exploring whether place-based policy can effectively improve ULGUE can provide important implications for the deployment of related policies and the promotion of ULGUE.
The remainder of this study proceeds as follows.
Section 2 presents the literature review.
Section 3 describes the policy background and theoretical analysis.
Section 4 presents the methodology, variables, and data.
Section 5 reports the empirical results and robustness tests, while
Section 6 provides further analysis. We conclude with discussions and conclusions in
Section 7 and
Section 8, respectively.
2. Literature Review
2.1. The Impacts of Place-Based Policy
From a global perspective, the evaluation of place-based policies has received extensive attention. Existing studies mainly focused on the effect of place-based polices on regional development [
20], economic opportunity in rural communities [
21], ecological cost [
22], and regional innovation governance [
23]. Further, a few studies investigated the place-based polices’ effect on green development. For example, Devine-Wright [
24] investigated the relationship between place-based policies and industrial decarbonization and found that it is easier for the UK to develop clean energy in declining industrial areas, thereby reducing carbon emissions. Kiesel et al. [
25] examined the corn policy in the Zambezi River region of Namibia and found that this place-based policy can adjust the agricultural structure and promote local green sustainable development. Grillitsch and Hansen [
26] divided regions into four types: peripheral regions, specialized in a green industry, specialized in a dirty industry, and metropolitan region; they further analyzed the impact of place-based policies on the development of green industry in different types of regions.
Focusing on China, the place-based policies are also of concern to Chinese scholars. The PFTZ is an important one. Existing studies mainly focused on the effect of the PFTZ on trade efficiency [
11], trade patterns [
10], the entry of foreign-investment enterprises [
9], port-listed enterprise performance [
27], income disparity [
28], and economic growth rate and quality [
12,
13]. Further, a few studies investigated the relationship between the PFTZ establishment and green development. For example, using the PSM-DID method, Wang et al. [
17] investigated the effect of the PFTZ on environment pollution, finding that the environmental improvement effect will gradually increase with the gradual maturity of the PFTZ. Wang et al. [
14] estimated the effect of the PFTZ on urban green total-factor productivity (GTFP) by the DID model, finding that the PFTZ promoted GTFP through increasing the technological innovation and human capital level and reducing government intervention. Jiang et al. [
15] specifically explored the effect of the Shanghai PFTZ on GTFP by the synthetic control method (SCM); the result also showed a positive effect. While the studies above all suggested that the establishment of the PFTZ was conducive to improving environmental performance, there were also studies suggested that the PFTZ may form a policy trap that exacerbates environmental constraints [
16].
2.2. The Measurement of ULGUE
The measurement of land use efficiency has generally undergone a transformation from single-index evaluation to multi-index comprehensive evaluation, and then to non-parametric measurement. To be specific, the single indicators include, but are not limited to, the land use density or the value-added of secondary and tertiary industries per unit of construction land [
29,
30,
31]. In order to overcome the one-sidedness of single-index evaluation, the multi-index comprehensive evaluation method arises. However, it still contains problems such as arbitrariness in the selection of indicators and subjectivity in the determination of indicator weights, which will affect the general applicability of its evaluation results [
28]. Under this background, non-parametric methods based on the combined evaluation of multiple inputs and multiple outputs are widely used. For example, Gao et al. [
32] applied a two-stage data envelopment analysis (DEA) method without undesirable output to measure the use efficiency of urban construction land. Xiao et al. [
33] and Zhou et al. [
6] measured land use efficiency using environment pollution and carbon emission as the undesirable outputs, respectively. Overall, this literature has gradually reached a consensus that ULGUE measurement should not only take into account the land-use outputs of economic, social, and ecological benefits, but also consider the undesired outputs. This consensus provides important support for this study to measure ULGUE.
2.3. Factors Influencing ULGUE
The ULGUE incorporates the economic, social and ecological benefits of urban land use, combined with a range of non-desired outputs that are not beneficial to sustainable development [
34]. Existing studies discussed the factors influencing land use efficiency mainly from the perspectives of economic development [
35], industrial structure [
36], technical progress [
37], urban characteristics [
7,
38], government behaviors and policies [
17,
39], land system [
40], and land finance [
41]. Some of these studies focused on the green use efficiency of urban land. For example, using the DID model, Wang et al. [
17] explored the effect of smart city construction on ULGUE in China; the result presented a positive effect. Using panel data from 31 provincial regions from 2006 to 2020 in China, Li et al. [
36] found that the rationalization of industrial structure improved the green efficiency of industrial land use. Additionally, Zhou et al. [
42] specifically evaluated the land use performance of the Shanghai PFTZ. The result presented that the development time, land use degree, leading function, industrial land structures, and employment structures contributed to the difference in land use intensification level of the Shanghai PFTZ.
In summary, prior studies have discussed the impacts of the PFTZ establishment and the factors influencing ULGUE, of which the most relevant to this study is Zhou et al. [
42]. However, this study only evaluated land-intensive use of the sub-zones in the Shanghai PFTZ. Further, there was no study specifically investigating ULGUE effects of the PFTZs in China.
3. Policy Background and Theoretical Analysis
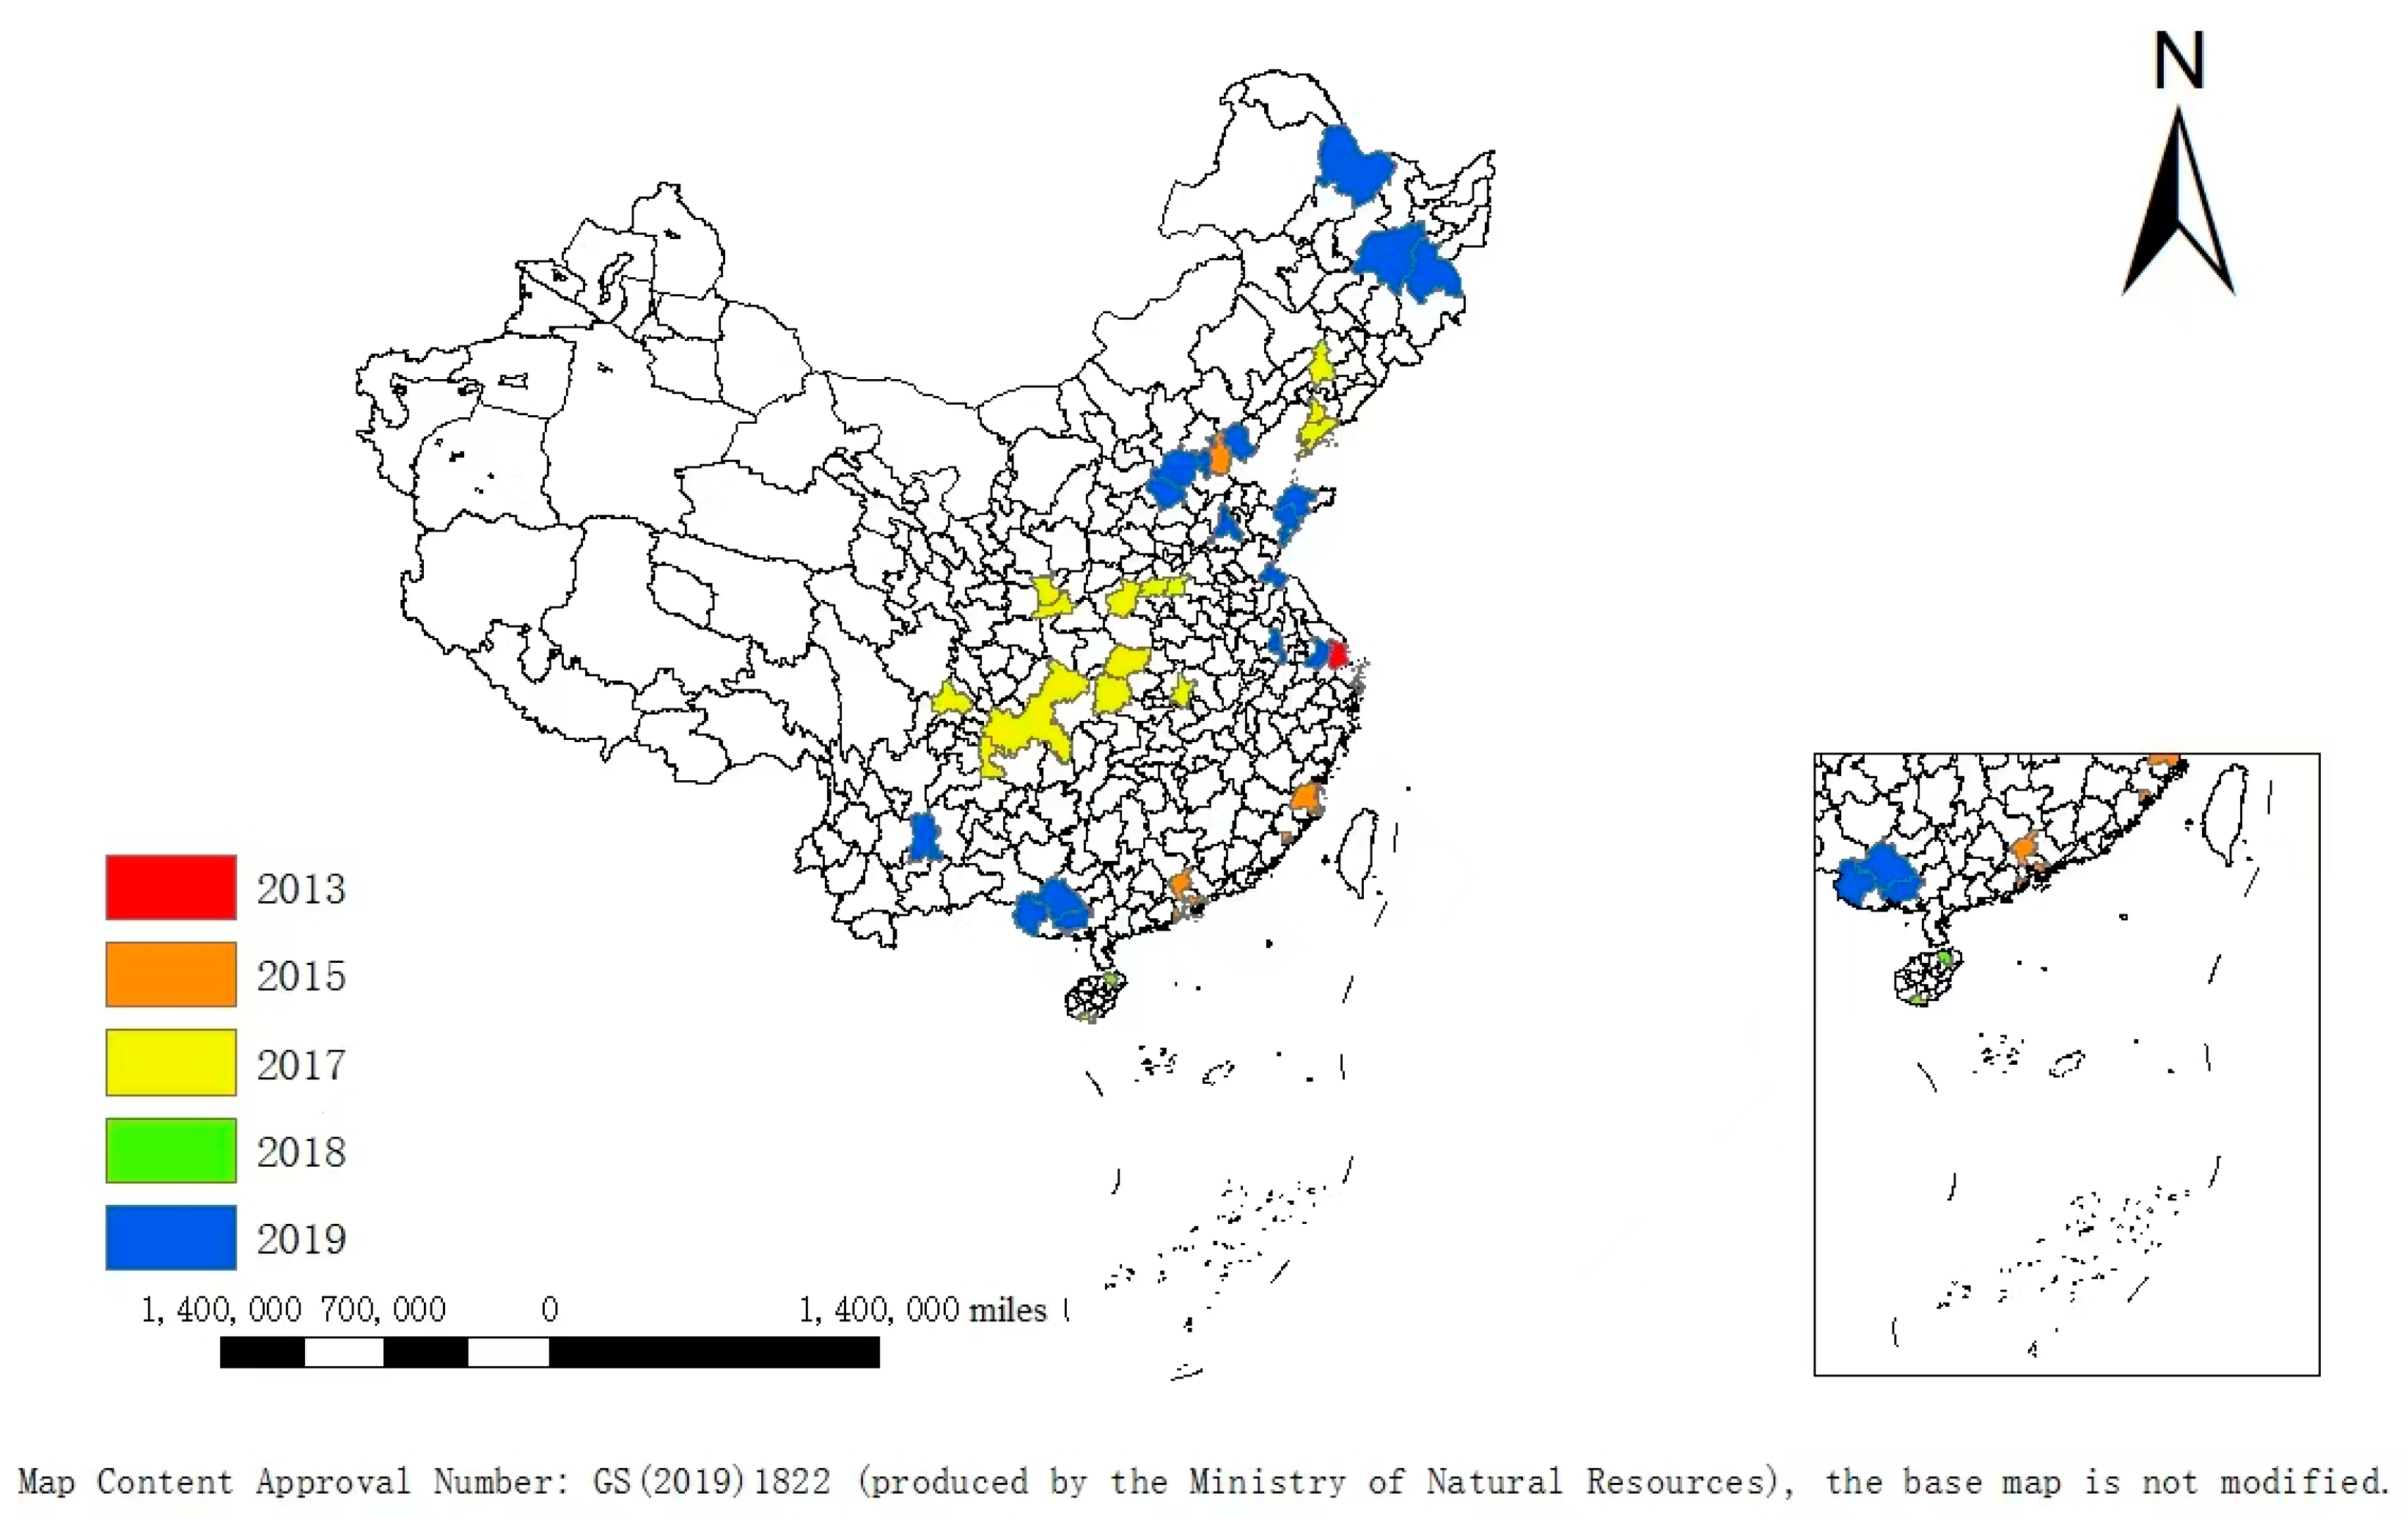
Since China joined the World Trade Organization (WTO) in 2001, the opening-up has made great contribution to China’s rapid economic growth. Meanwhile, after the financial crisis in 2008, the international economic and trade order has been restructured. Along with the wave of “anti-globalization” and the rise of trade protectionism in recent years, China has committed to finding replicable and scalable experience in reform and opening up to meet the external and internal challenges. In this context, the Shanghai PFTZ was officially launched in Sep 2013. A total of 21 PFTZs has been established in six batches to now, covering four municipalities and seventeen provinces. Specifically, there were one (i.e., Shanghai), three (i.e., Guangdong, Tianjin, Fujian), seven (i.e., Liaoning, Zhejiang, Henan, Hubei, Chongqing, Sichuan, Shanxi), one (i.e., Hainan), six (i.e., Shandong, Jiangsu, Guangxi, Hebei, Yunnan, Heilongjiang), and three (i.e., Beijing, Hunan, Anhui) PFTZs established in 2013, 2015, 2017, 2018, 2019, and 2020, respectively. PFTZ construction has formed a strategic framework from coastal to central and then to western China. Each PFTZ contains multiple sub-zones distributed in different regions. The specific spatial distribution pattern of the PFTZs is shown in
Figure 1 2.
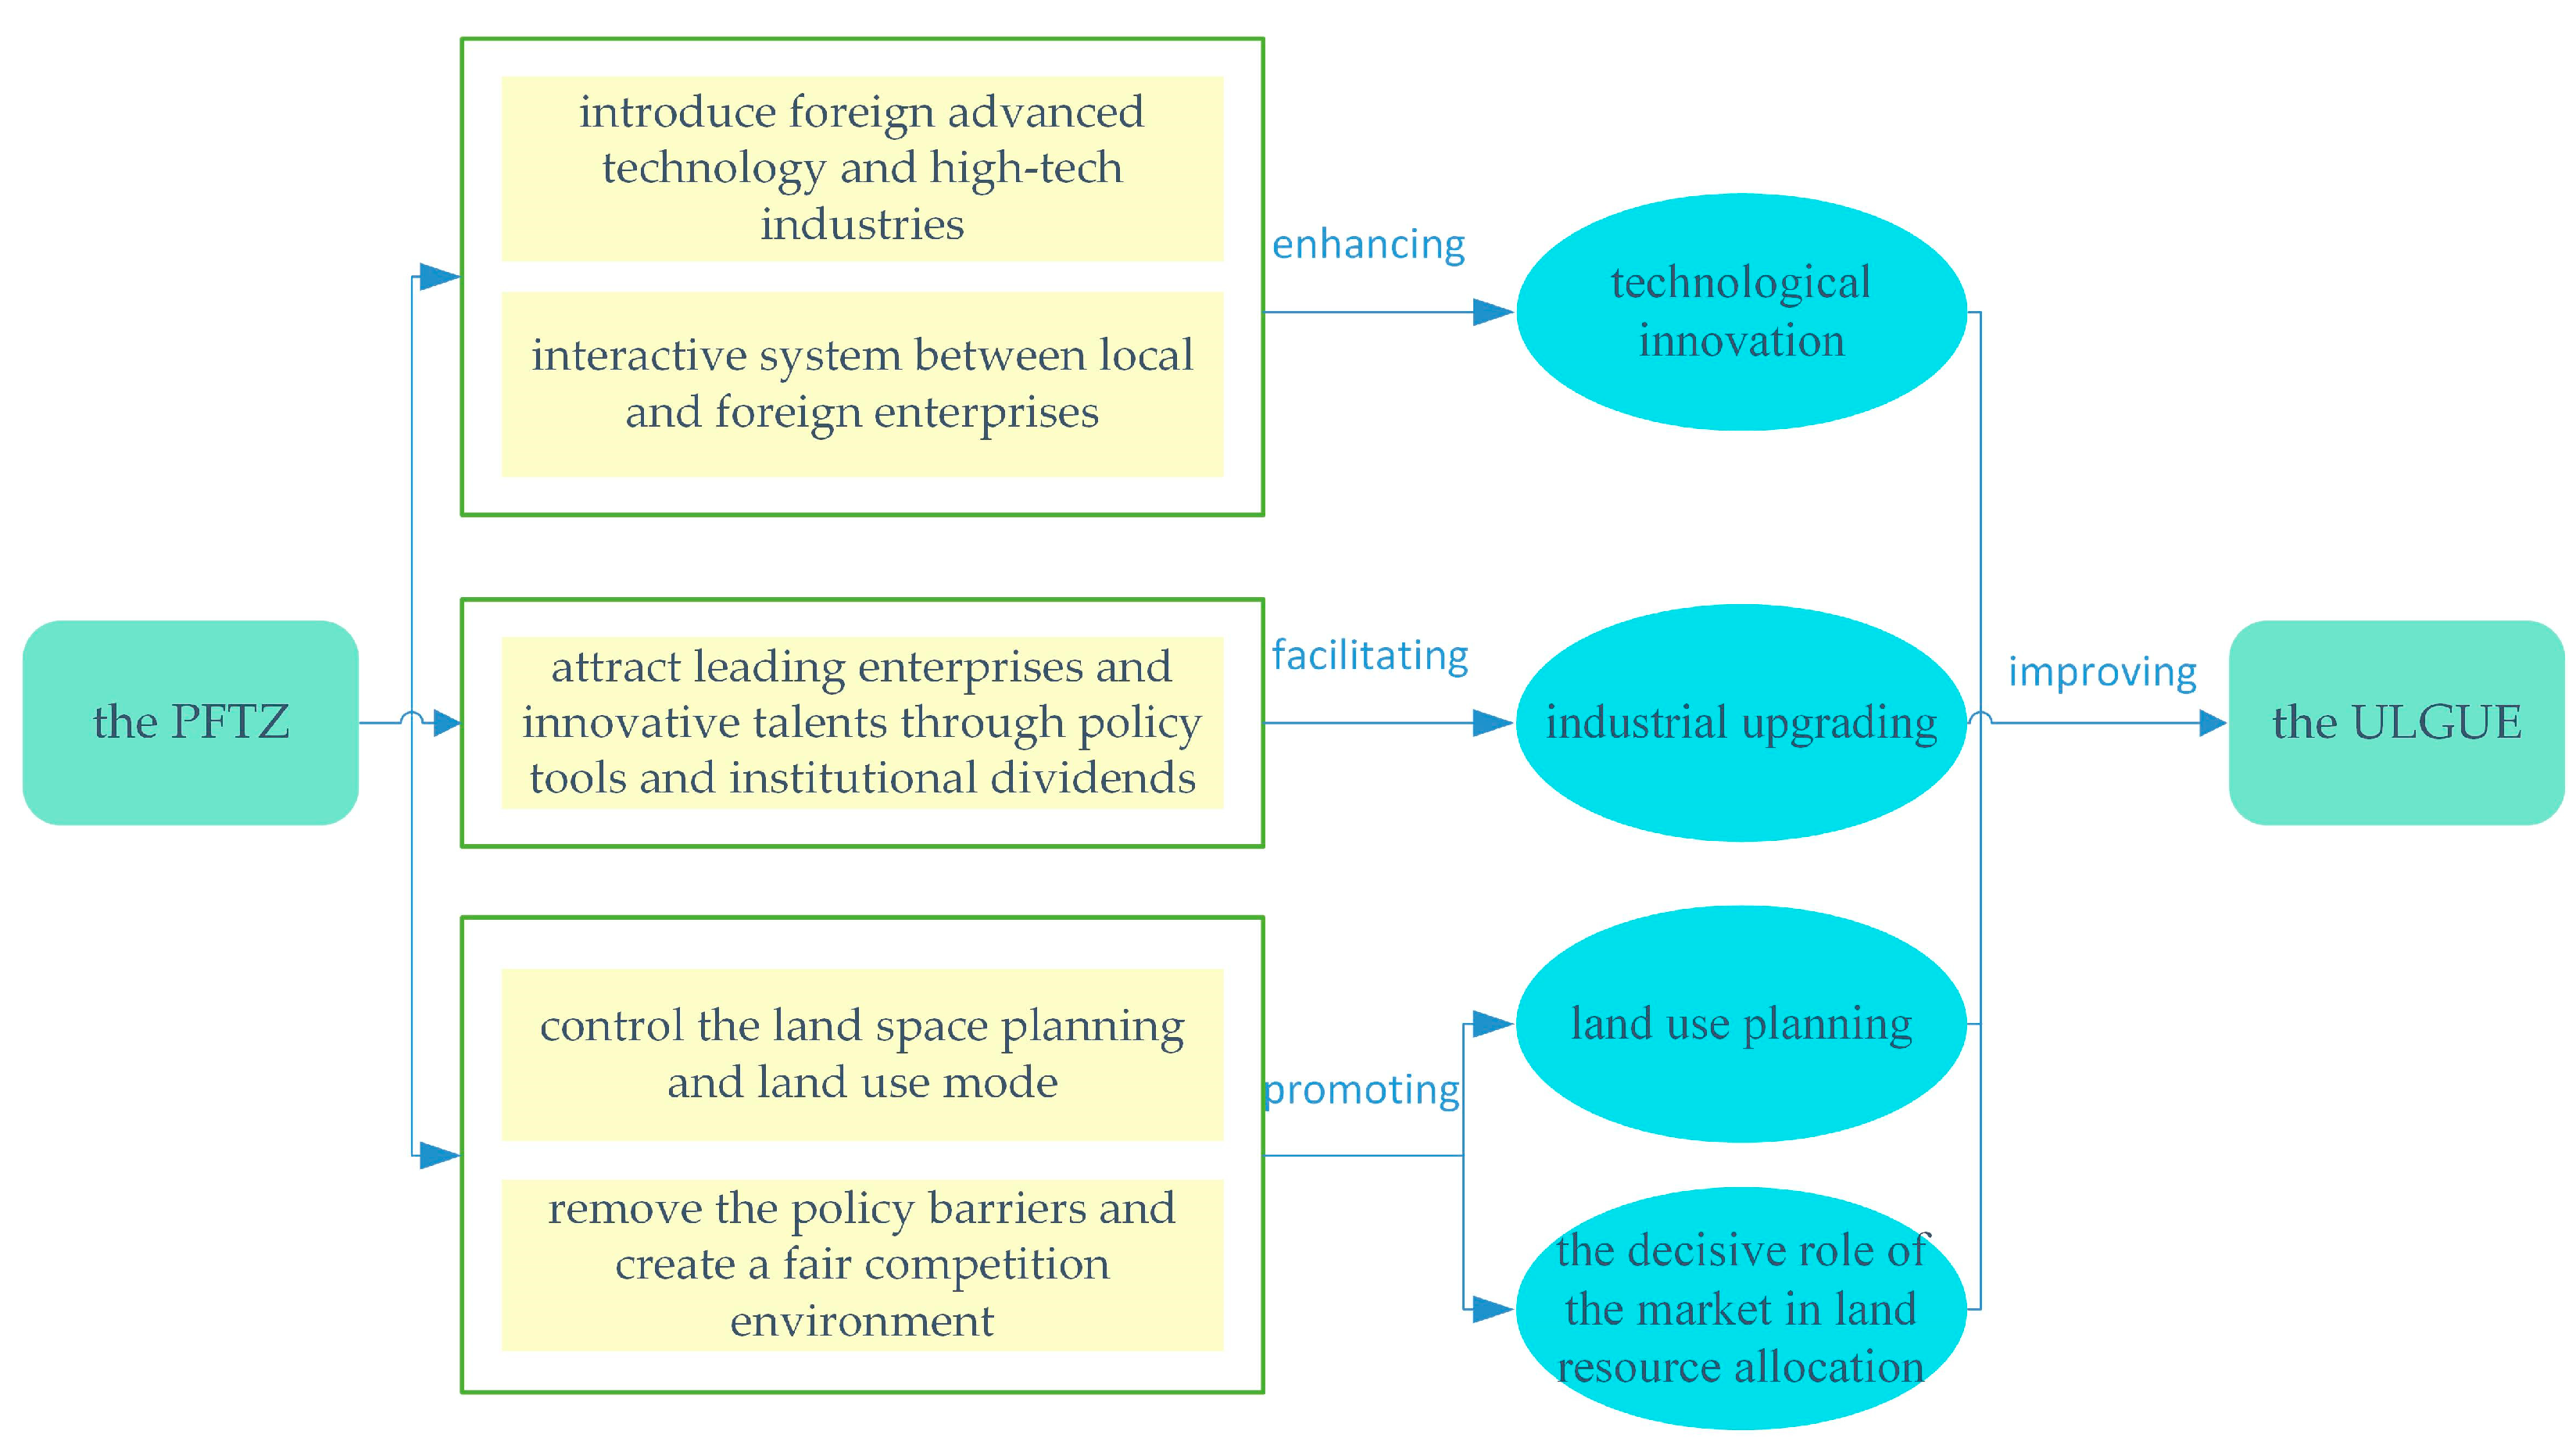
As the experimental field of China’s reform and opening up, the PFTZ can take full advantage of the policy dividend and liberalized market environment to achieve the improvement in ULGUE.
First, the PFTZ establishment is conducive to promoting technological innovation [
43,
44], thus forcing the improvement of ULGUE. Trade liberalization in the PFTZ can increase trade efficiency [
11], which can help to introduce foreign advanced technology and high-tech industries. The interactive system between local and foreign enterprises, such as networking, learning, and competition, is conducive to motivate and force enterprises to increase their R&D intensity and promote their innovation capability [
45]. For example, the Beijing PFTZ focused on the development of science and technology services and created a demonstration area for innovation and reform. The Sichuan PFTZ improved the level of digital management through an online registration system and efficiency collaboration, thus improving the level of innovation liberalization.
Second, the PFTZ establishment is conducive to facilitating industrial upgrading [
46], and thus accelerating the development of ULGUE. The PFTZ can also attract leading enterprises and innovative talents through policy tools and institutional dividends to achieve industrial upgrading. To be specific, in order to “recruit”, “gather”, and “retain” talents, construct the talent-gathering heights, and form a “reservoir” of highly skilled talents, the PFTZ introduced a series of relevant policies. For example, the Yunnan PFTZ actively attracted leading enterprises by increasing financial support, tax incentives, and tax relief policies for enterprises in the region. The Qingdao PFTZ provided living subsides and incentives for talents and financial support for their innovation and entrepreneurship activities. The Lin-gang Special Area of the Shanghai PFTZ improved the rental and sales simultaneously in the housing system and created a public service system “sample”, including education, health care, childcare and pension.
Third, the PFTZ can effectively improve ULGUE through land use planning and the decisive role of the market in land resource allocation [
44,
47]. To be specific, in order to guide industrial upgrading, the local government will control the land space planning and land use mode of the PFTZ, which will directly affect the ULGUE. As demonstrated in the Introduction section, in order to build and adapt to the new industrial pattern, the PFTZ has been exploring the economical and intensive use mode of urban land, which is mainly reflected in the high elasticity of land use and the joint development of incremental and stock land. For example, the Anhui PFTZ proposed to implement an industrial land supply chain and realize overall supply of multiple land parcels involved in key links and core projects of the industrial chain. The Hainan PFTZ implemented a differentiated land supply model for industrial projects, which improves the level of intensive land use. On the other hand, by removing policy barriers and creating a fair competition environment, the PFTZ establishment gives full play to the decisive role of the market in the allocation of land resources. With the improvement of marketization, the land allocation efficiency can be continuously improved; thus, ULGUE can be promoted.
Figure 2 depicts the theoretical framework of this study.
4. Methodology, Variables, and Data
4.1. Methodology
As in Feng et al. [
48] and considering that the PFTZ policy was implemented over several years, we employ the multi-period DID method to estimate the effect of the PFTZ policy on ULGUE.
where the subscript
i and
t represent the city and year, respectively. The dependent variable
ULGUEit is the urban land green use efficiency of city
i in year
t. The independent variable
PFTZit represents the PFTZ establishment; when city
i established a PFTZ in year
t, it equals to 1, otherwise it equals to 0. The cities with a PFTZ are the treatment group, and the remaining cities are the control group.
Controlit refers a lot of control variables.
μi and
γt denote city and year dummy variables that account for city and year fixed effects.
εit is the error term.
4.2. Variables
4.2.1. Dependent Variable (ULGUE)
We measure
ULGUE based on the super-efficiency SBM model, which was proposed by Tone [
49]. This model combines the advantages of the super-efficiency model and the SBM model. It allows for the incorporation of non-desired outputs and the decomposition of efficient decision units with an efficiency value of 1, which can avoid the loss of information on efficient decision units. The model is formulated as follows:
Supposing that there are
n decision-making units. Each unit is composed of input
m, expected output
r1, and undesired output
r2.
x,
yd, and
yu are the elements of the input matrix, the desired output matrix, and the undesired output matrix, respectively.
ρ is the value of
ULGUE. According to the definition of
ULGUE and previous studies [
5,
17], we selected the following indicators to evaluate
ULGUE: (1) The inputs. Inputs include land, capital, and labor. To be specific, as the built land is the basis of urban production and consumption activities, we apply the area of land used for urban construction to reflect the land input. The capital input is presented by total investment in fixed assets of the whole society. Additionally, as the urban economic activity consists mainly of secondary and tertiary industries, the labor input is measured by the number of employees in secondary and tertiary industries. (2) The desired output. We measure it from the three dimensions of economic benefits, social benefits, and ecological benefits. The economic benefits reflect the economy of urban land use, characterized by the value-added of secondary and tertiary industries. The social benefits reflect the social benefits that citizens obtained in the process of urbanization, measured by the local general public budget revenue. The ecological benefits reflect the ecologically friendly development degree, characterized by green covered area as % of completed area. (3) The undesired output. The undesired output refers to the negative impact on the environment, which is described by the pollutant emissions and carbon emissions. Specifically, the pollutants include industrial wastewater, industrial soot (dust), and SO
2. Carbon emission is calculated by the standard coal quantity converted from various energy types and the corresponding emission coefficient. The details about these indicators and measurement variables are represented in
Table 1.
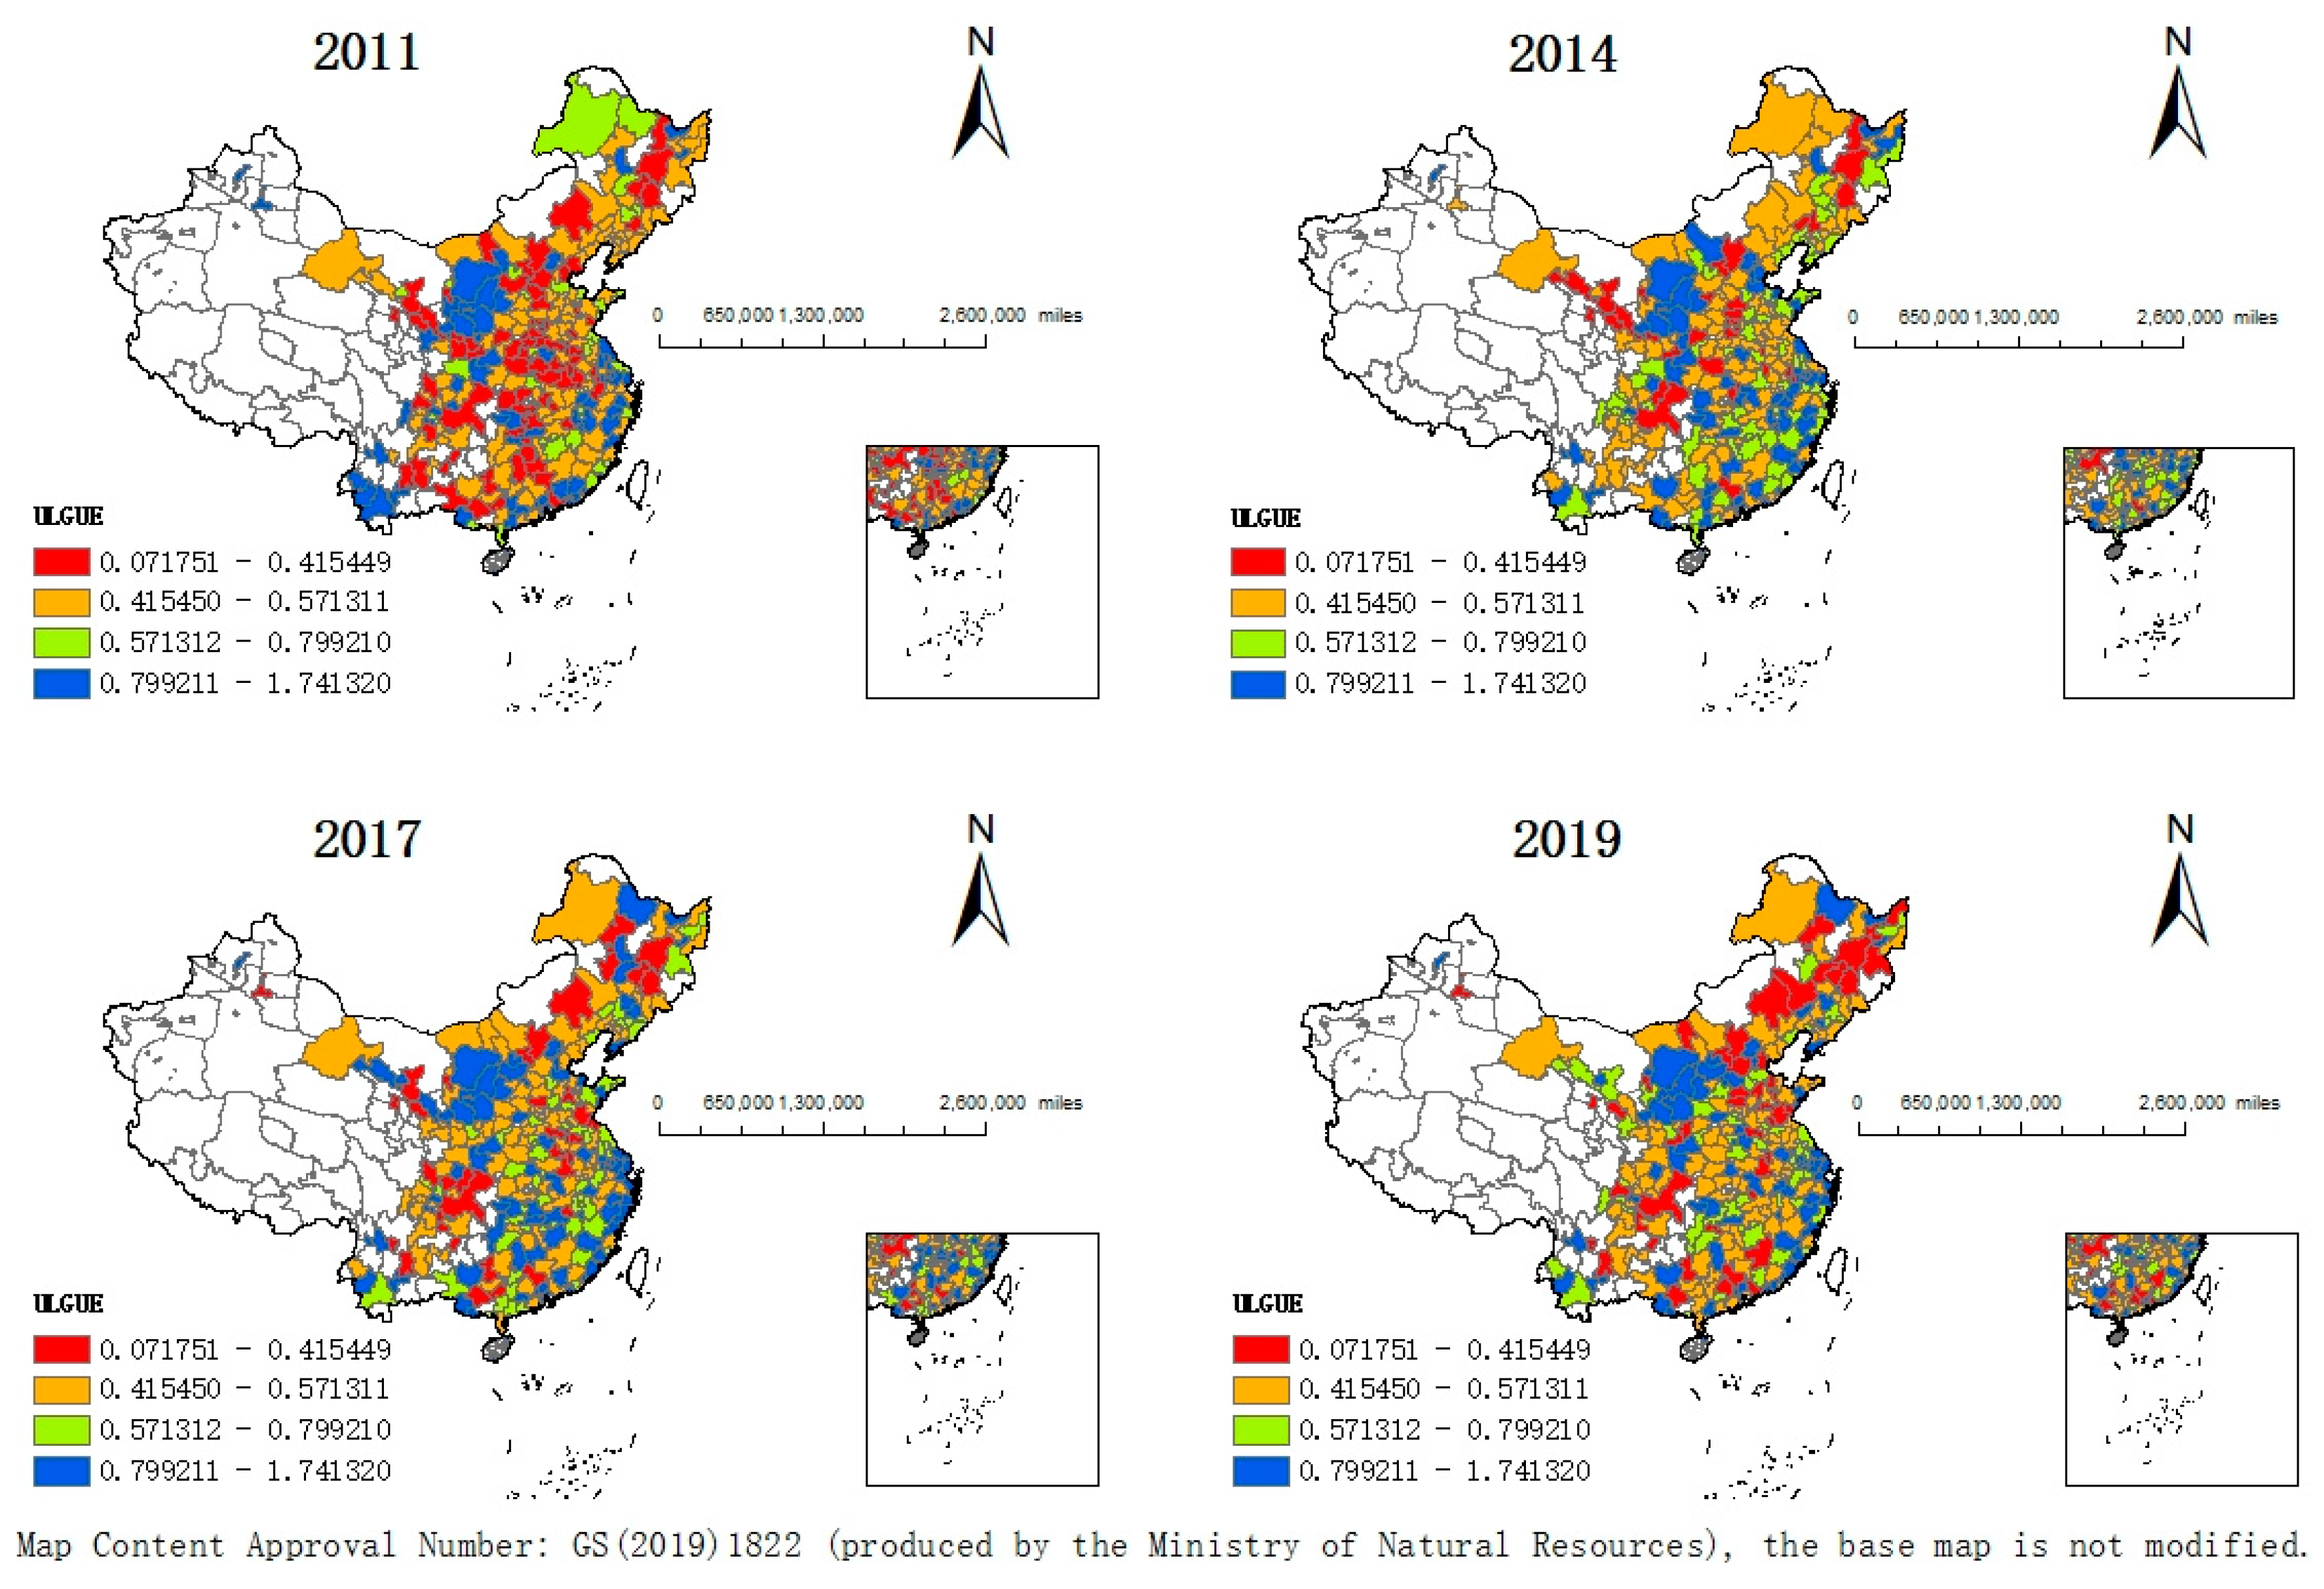
Figure 3 shows the spatial distribution of ULGUE in 2011, 2014, 2017, and 2019. In terms of trends over time, ULGUE is fluctuating upward, with its average value rising from 0.607 to 0.648 during 2011–2019. From the spatial viewpoint, ULGUE of cities like Beijing and Shanghai is always in the forefront, which may be due to their relatively developed economies and high resource allocation efficiency. At the same time, we also find that ULGUE shows obvious spatial agglomeration. Areas with high ULGUE are mainly distributed in the southeast coastal and northwest China, while low ULGUE areas are mainly distributed in north China, northeast China and southwest China.
4.2.2. Independent Variable (PFTZ)
The core explanatory variable of this study is PFTZ. Since 2013, the Chinese government has initiated a total of 21 PFTZs. Specifically, there were 1, 3, 7, 1, 6, and 3 PFTZs established in 2013, 2015, 2017, 2018, 2019, and 2020, respectively. Each PFTZ contains several zones distributed in different cities (see
Figure 1), with 1, 6, 15, 4, 19, and 7 cities distributed with a PFTZ in 2013, 2015, 2017, 2018, 2019, and 2020, respectively. Due to the data limitation, our research period is limited to 2019; we only explore the policy effect of the first five batches of PFTZs (i.e., from 2013 to 2019). The variable is set as follows: if the PFTZ is established in city
i at year
t, then variable PFTZ equals to 1 since year
t, and 0 otherwise.
4.2.3. Control Variables
Referring to the existing literature, we introduced the following control variables in the model. (1) Economic development level (GDP). We used the logarithm of GDP per capita to reflect the level of economic development. The improvement of the economic development level is often accompanied by an increase in land use efficiency. (2) Industrial structure level (IND). The ratio of value-added of tertiary industry to secondary industry is used to measure the industrial structure level. The evolution of industrial structure leads to changes in land use structure and patterns, resulting in the difference in land allocation efficiency. In general, the upgrading of industrial structure is conducive to achieving an increase in land use efficiency. (3) Population size (POP). The population size is measured by the logarithm of total urban population. The crowding effect produced by population agglomeration may have a negative impact on land carrying capacity, which may make the urban land use efficiency decline accordingly. (4) Government intervention (GOV). We exploit the ratio of fiscal expenditure to GDP to reflect the degree of government intervention. Urban land use planning is compiled by the government, and a certain degree of government intervention is conducive to promoting the efficiency of urban land use. (5) Human capital level (HUM). The number of university students per capita is used to reflect the level of urban human capital. The human capital is also one of the important factors affecting land use efficiency. (6) Opening-up level (OPEN). The ratio of foreign direct investment to GDP is taken to reflect urban opening-up level. The greater opening-up level can lead to an interactive system between local and foreign enterprises, such as networking, learning, and competition, which may promote the technical progress and land use efficiency.
4.3. Data
We use panel data from 279 cities on the Chinese Mainland during 2011–2019 as the research sample to evaluate the net effect of the PFTZ on ULGUE. The data are mainly collected from the
China City Statistical Yearbook,
the China Urban Construction Statistical Yearbook, and the Chinese Research Data Services Platform (CNRDS). The summary statistics of variables are presented in
Table 2. As can be seen from
Table 2, there were 2511 sample observations; the mean value of the dependent variable
ULGUE is 0.65, and the sample values are between 0.06 and 1.75.
5. Empirical Results and Robustness Tests
5.1. Parallel Trend Test
The prerequisite for using the DID method is to satisfy the parallel trend test. It requires a consistent trend of the ULGUE between the treatment group and control group before the PFTZ establishment. Referring to Beck et al. [
50], we applied the event-study strategy as follows to test the parallel trend:
where
PFTZi±k represents a series of dummy variables relative to the establishment year of the PFTZ. When city
i is in the
kth year before (after) the PFTZ establishment,
PFTZi -k (
PFTZ k) takes the value of 1, and 0 otherwise. The definitions of all other variables are the same as in Equation (1). We treat the 8th year (i.e.,
PFTZi−8) before the PFTZ establishment as the benchmark year. Insignificant
β1, …, and
β7 indicate that the parallel trend hypothesis is satisfied.
Figure 4 plots the time trend described by
β1, …, and
β14 within the 90% confidence interval
3. The confidence intervals before the policy implementation all contain 0, which means that the coefficients are all insignificant before the PFTZ establishment, and there were no consistent trends in ULGUE prior to the PFTZ policy. The parallel trend hypothesis is supported.
5.2. Basic Regression
As the parallel trend hypothesis was satisfied, we assessed the impact of the PFTZ policy on ULGUE using Equation (1).
Table 3 presents the basic regression results of Equation (1). In
Table 3, the coefficients of PFTZ are all positive and at least significant at the 5% level, indicating that the PFTZ policy had a positive impact on ULGUE. In addition, the coefficients of
GDP and
GOV are positive and statistically significant, indicating the important role of economic development level and local government behavior in promoting ULGUE. Further, the coefficient of
POP and
HUM are negative and significant; this partly reflects the pressure on land resource use caused by the crowding effect of an expanding population.
5.3. Robustness Tests
5.3.1. PSM-DID Estimation
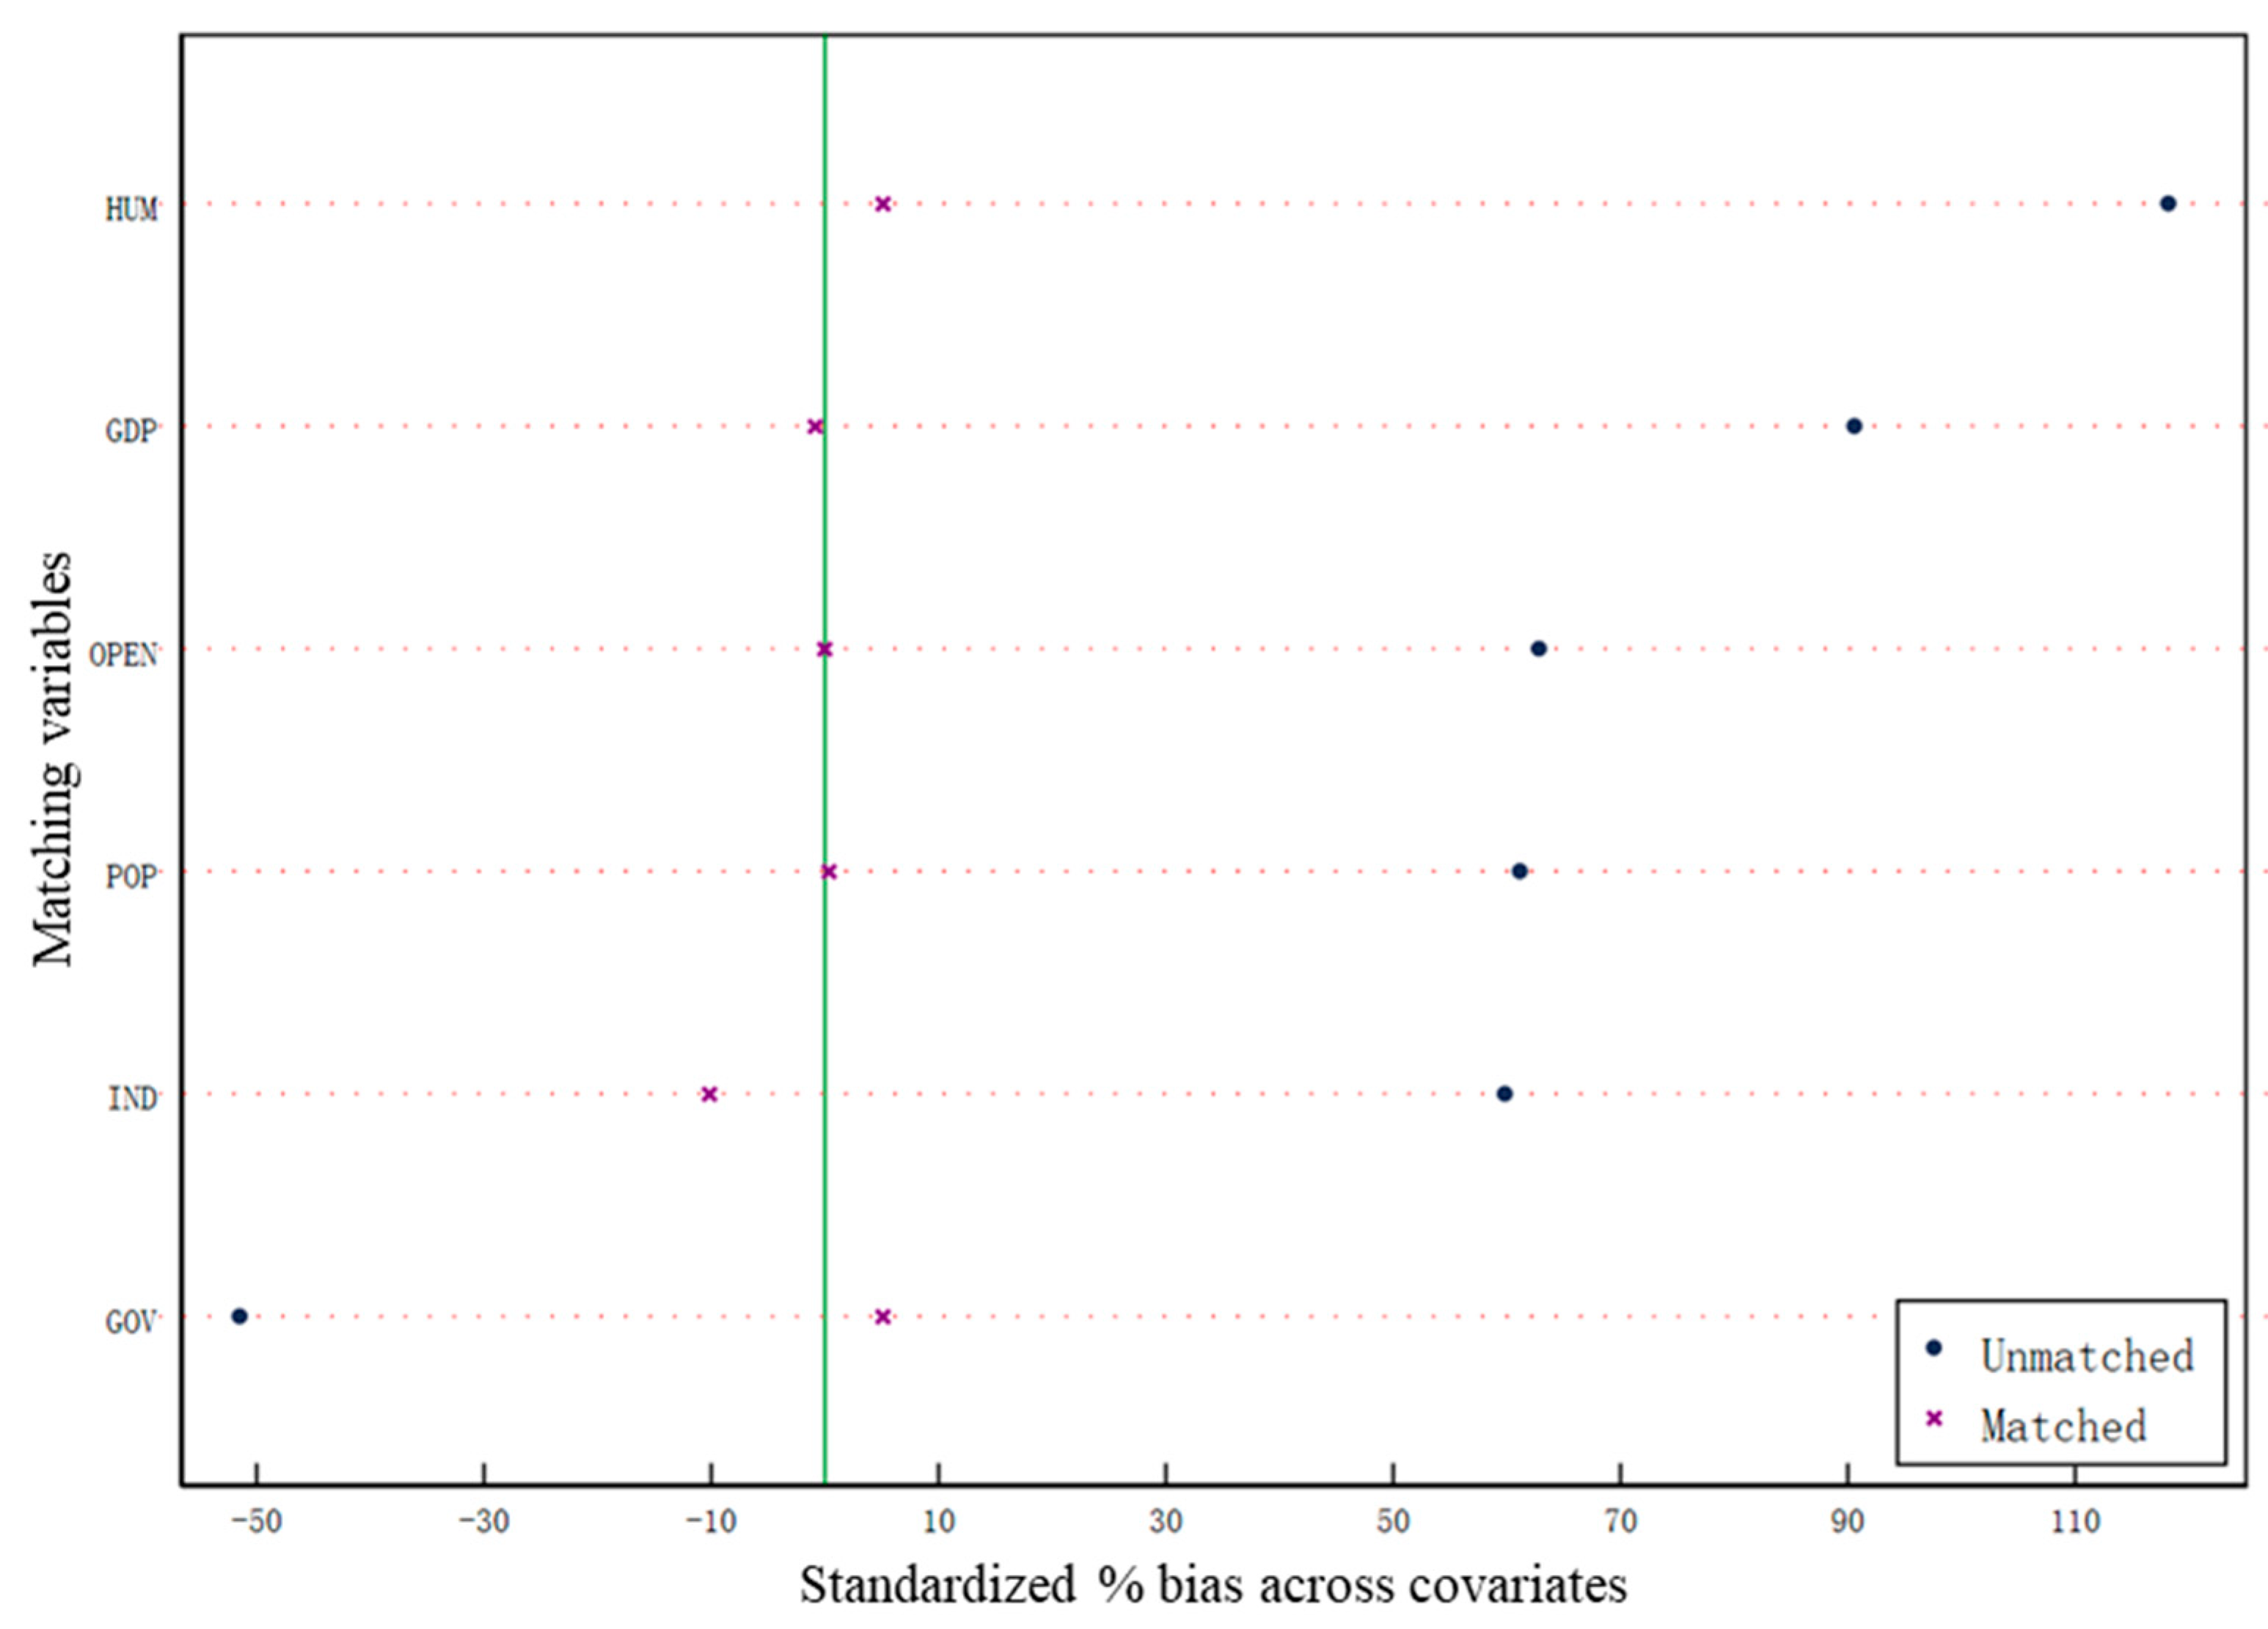
PFTZ establishment is a national strategy in China; there may therefore exist the problem of sample-selection bias. This study applied the PSM method to match the sample with the least-neighbor matching method.
Figure 5 presents the balancing test results. We can find that the absolute values of the standardized bias of all matching variables between the experimental and control cities do not exceed 10% after matching. This indicates that the sample distribution of the experimental group and the control group has good consistency, and the matching effect is good. Based on the matched sample, we further conducted the basic regression; the result is shown in
Table 4. The coefficient of PFTZ remains significantly positive at the 1% level, further supporting the basic regression results.
5.3.2. Entropy-Balancing Estimation
The entropy-balancing method can be employed to realize higher dimensional sample equilibrium between the treatment and control groups, which can minimize the influence of selective bias without causing sample loss [
48,
51]. We further used this method to alleviate the impacts of selective bias. The estimate result is shown in
Table 5. The coefficients of PFTZ remain positive and significant at the 1% level, which further indicates the robustness of the basic regression.
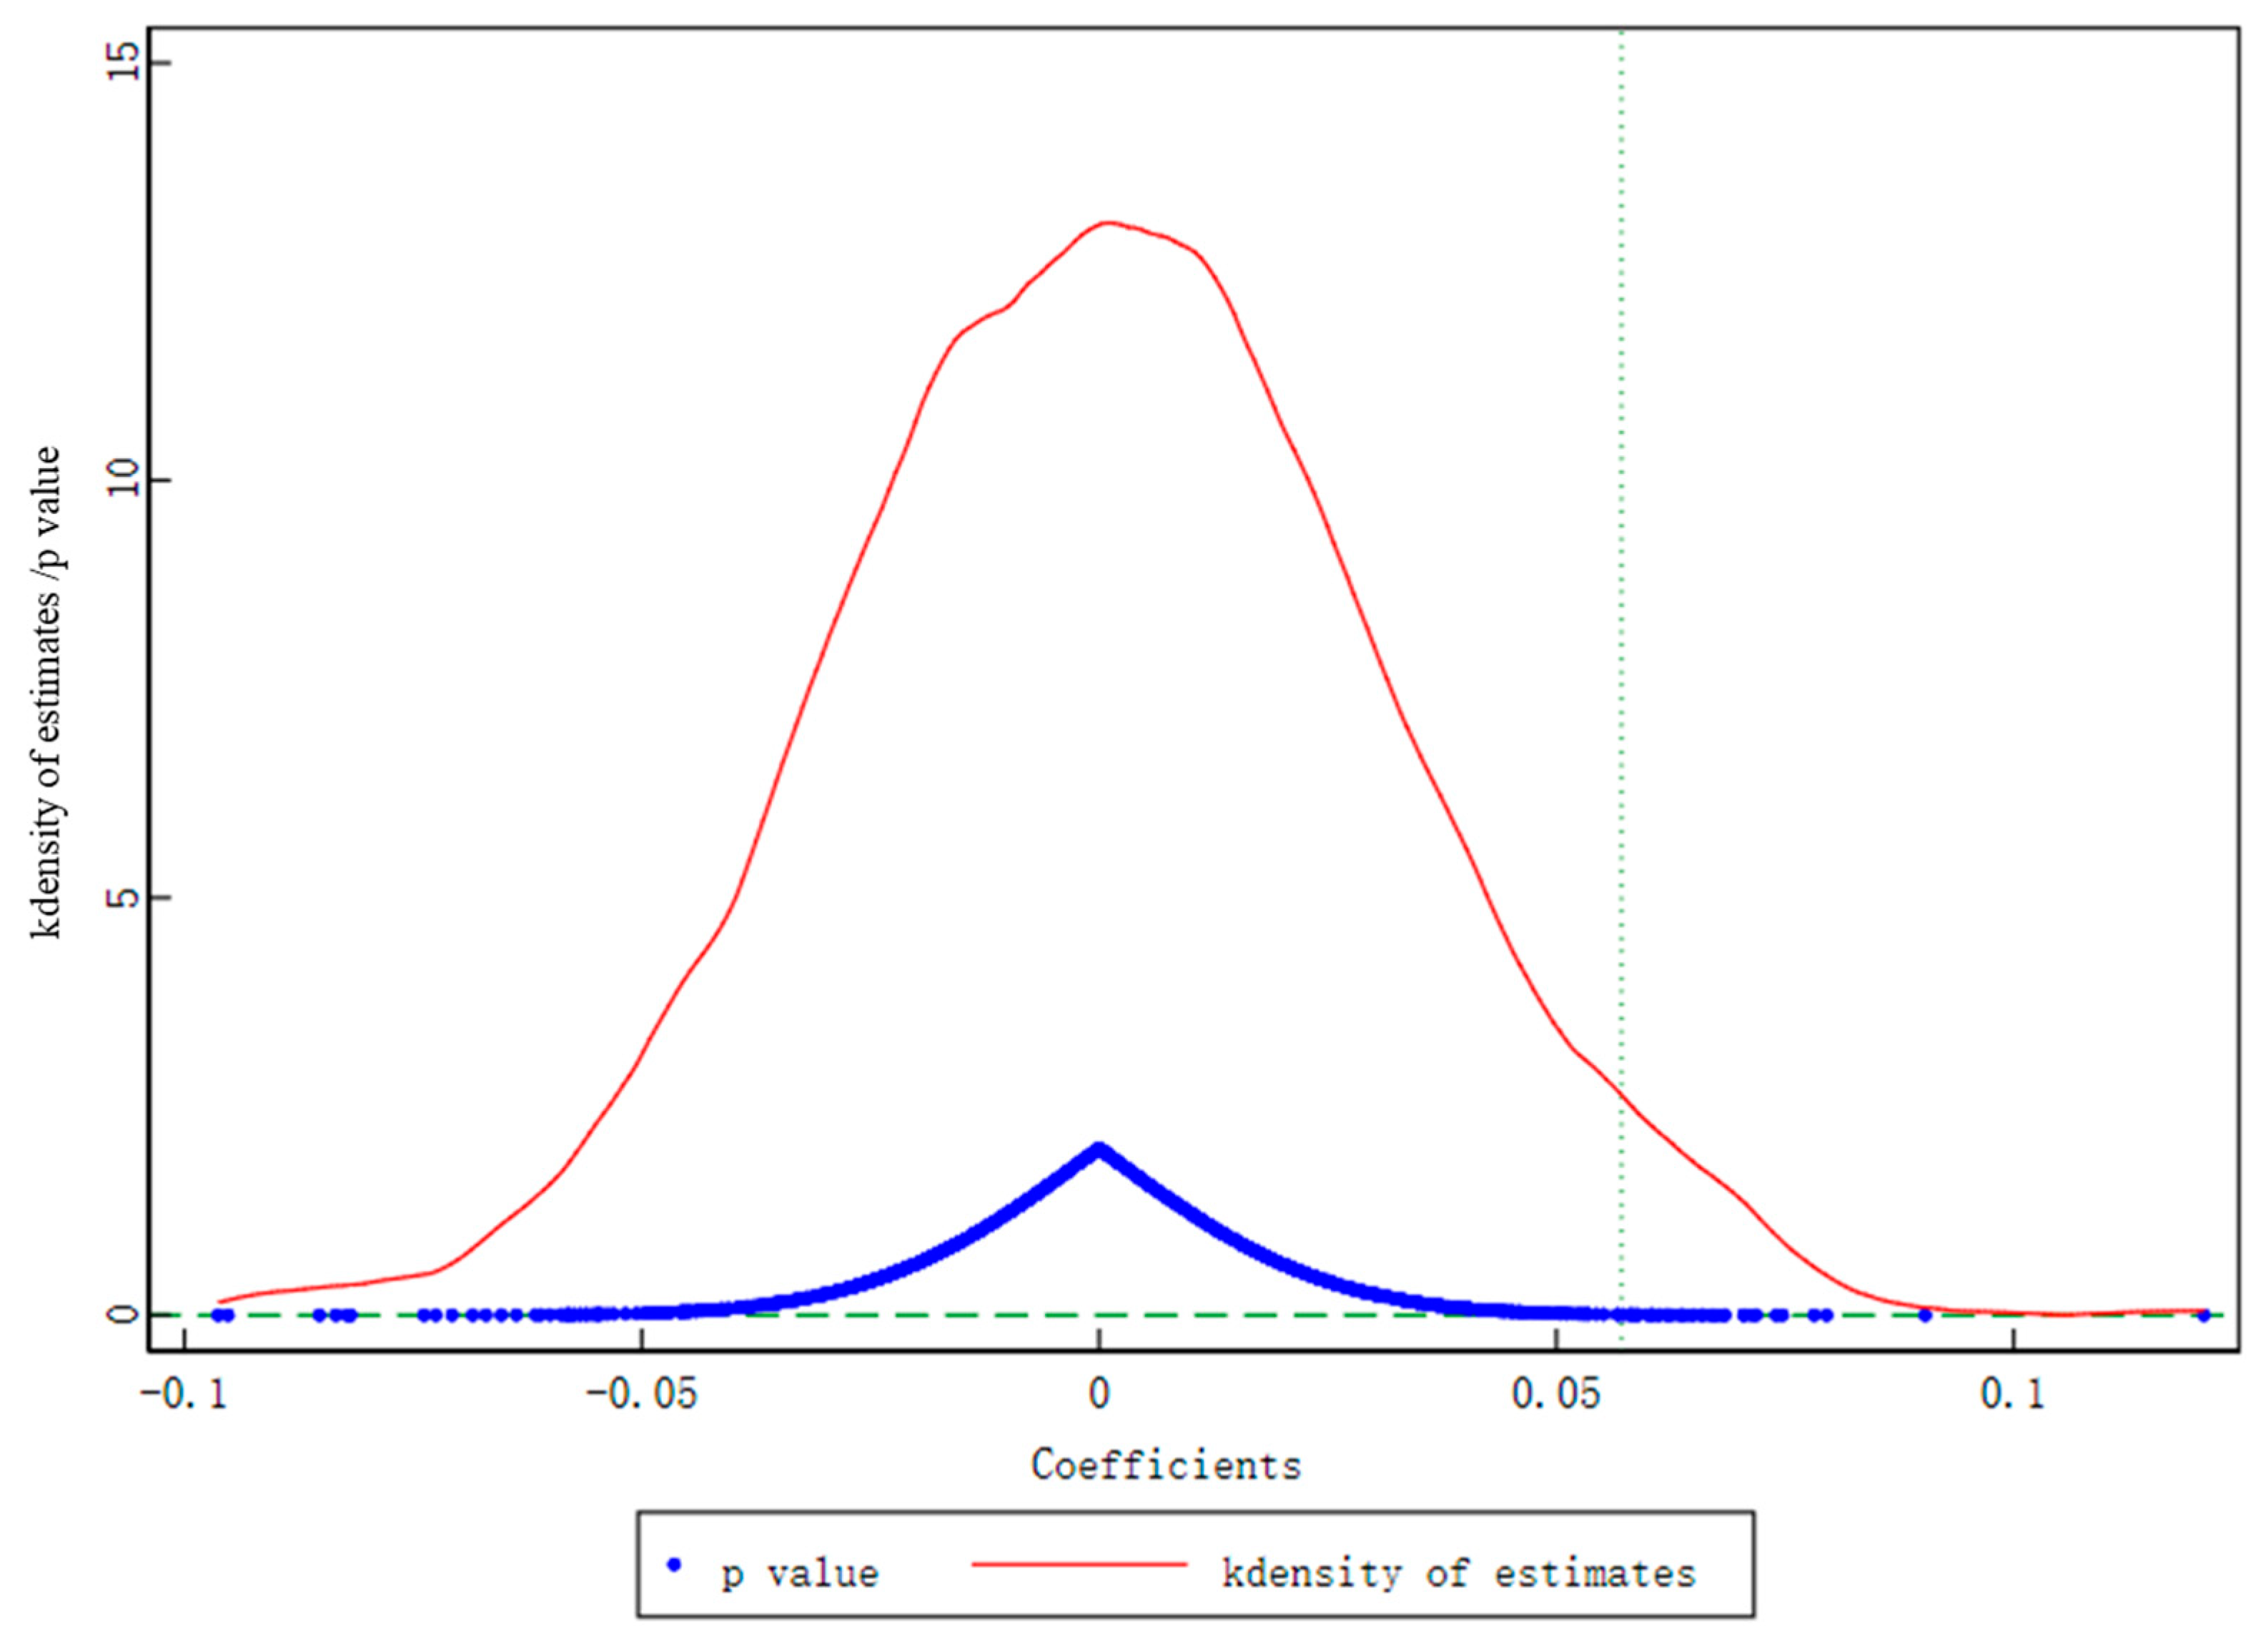
5.3.3. Placebo Test
We further conducted a placebo test to alleviate the interference of the unobservable factors [
52]. First, we randomly selected 1, 6, 15, 4, and 19 cities in 2013, 2015, 2017, 2018, and 2019, respectively, as the cities in which the PFTZs were distributed. Second, we constructed a virtual variable to represent the virtual variable PFTZ and conducted the basic regression again. The processes above were repeated 1000 times, and we could obtain 1000 “spurious” estimated coefficients of variable PFTZ.
Figure 6 depicts the coefficient nuclear density and the corresponding
p-value distribution. The mean values of the coefficients are close to 0 with the
p-value mostly greater than 0.1, meaning that the basic result is not disturbed by unobservable factors.
5.3.4. Change the Research Sample
There were also several new PFTZs established in 2020; to eliminate the interference caused by this, we excluded cities with PFTZs established in 2020 from our research sample and conducted the basic regression again. Column (1) and (2) in
Table 6 show the results. The coefficients of PFTZ are remaining positive and significant. Additionally, considering that the administrative level of the municipalities in China is higher than the prefecture-level cities, to prevent the potential influence, we excluded the four municipalities of Beijing, Tianjin, Shanghai, and Chongqing from the sample and conducted the basic regression again. Column (3) and (4) in
Table 6 present the results. The coefficients of PFTZ are still positive and statistically significant. The above analysis can provide further support for our main conclusion.
5.3.5. Control for the Impact of Other Policies
Other policies implemented during 2011–2019 may also affect ULGUE, which may generate biased estimation results. To deal with this problem, we further controlled for related policies in the empirical model. First, we controlled for the policy of industrial structure transformation and upgrading demonstration zones (ISTU). The main reason for us to control for the ISTU policy is that it is a classic place-based policy implemented in China since 2017. More specifically, the ISTU policy concentrated on the industrial structure transformation and upgrading of the old industries cities and resource-based cities, which have a high reliance on traditional energy and heavily polluting industries. The result is shown in column (1) and (2) in
Table 7. Second, we controlled for the policy of low-carbon city construction (LC) and carbon emissions trading (CT), as these two policies are two typical environmental regulation policies, which were proven to be effective in promoting green innovation and improving environmental performance [
53,
54,
55]. The results are presented in columns (3) to (6) of
Table 7. The coefficients of PFTZ are all positive and statistically significant, meaning that the positive impact of the PFTZ policy on ULGUE still exists.
6. Further Analysis
6.1. Heterogeneity Analysis
China has a massive land mass with wide disparities in the economic development level of different regions, and the impacts of the PFTZs may vary in different regions. Additionally, the functional positioning of the PFTZs distributed in different regions is also different. Heterogeneity analysis of the ULGUE effect of the PFTZ is therefore particularly necessary. We conducted heterogeneity analysis from the following three aspects: (i) The eastern, the central, and the western cities. (ii) The inland and the coastal cities. (iii) Cities with different economic development levels.
6.1.1. The Eastern, the Central, and the Western Cities
The differences between the eastern, the central, and the western regions have been widely discussed in the existing literature (e.g., [
52,
56]). Referring to these studies, we divided the sample cities into three groups: the eastern cities, the central cities, and the western cities
4. The results are shown in
Table 8. We can find that the coefficient of PFTZ is only positive and statistically significant in column (1). This result indicates that the PFTZ only promoted the ULGUE of the eastern cities. This may be due to the fact that the eastern cities have a relatively profound socio-economic foundation, combined with the institutional dividend of the PFTZ, making the policy effect in the eastern cities prominent. Moreover, in order to promote coordinated regional development, the central government of China began to increase the land supply quota to the central and western regions since 2003, which reduced the land supply to the eastern region relatively [
3,
4]. As a result, the establishment of the PFTZs in the eastern cities has higher requirements for the improvement of ULGUE.
6.1.2. The Inland and the Coastal Cities
The cities in which the PFTZs are distributed include the coastal cities and the inland cities. Considering the differences in natural resources and economic advantages between these two types of cities, we further divided the research into two groups: the inland cities and the coastal cities. The estimation result is presented in
Table 9. It can be found that the coefficients of PFTZ in column (1) and (2) are both positive and statistically significant. This means that the PFTZ can improved the ULGUE of both two types of cities. Moreover, the magnitude and significance in the coastal cities are both greater than those in the inland cities. This indicates that compared with the inland cities, the PFTZ exerted a greater driving effect on the ULGUE of the coastal cities. Similar to the eastern, the central, and the western cities, this result may be due to the difference in economic foundation and geographical location between coastal cities and inland cities. Moreover, compared to the inland cities, the coastal cities have a higher level of opening-up, making them more able to fully realize the policy dividend of the PFTZ establishment.
6.1.3. Cities with Different Economic Development Level
The economic development level varies considerably between cities. As demonstrated above, compared with other cities, the effect of the PFTZ is greater in the eastern cities and the coastal cities. The variation in this effect is certainly correlated with the difference in economic development levels of the cities. Therefore, we divide the sample cities into two groups: high-level and low-level economic levels. The estimation result is shown in
Table 10. We can find that the coefficients of PFTZ are both positive in these two groups, while only statistically significant in the high-level economic development cities. This finding is consistent with the above analyses, indicating that the positive effect of the PFTZ establishment on ULGUE is more prominent in cities with higher economic development levels.
6.2. Spatial Effect: Radiation or Siphon Effect
The above analyses confirm that the PFTZs significantly promoted ULGUE. Meanwhile, the PFTZ is not simply for the development of itself, but to play a leading role for other regions and form a model that can be replicated and extended, so that other regions can learn from its construction experience and improve their ULGUE. Meanwhile, as a pilot exploration zone for a new round of opening-up, the PFTZ is bound to have a certain degree of policy impact on the surrounding cities, due to the spatial, economic, and trade exchanges between cities. Therefore, the surrounding cities may realize the improvement of ULGUE by absorbing the positive externalities of the PFTZ.
In that case, did the establishment of the PFTZ really exert a spatial effect on the surrounding cities or not? If the spatial effect exists, is it a radiation or a siphon effect, and what is the spatial distance range over which there is a spatial effect? To explore these issues, we refered to the study of Li et al. [
28], and constructed a model as follows:
where
s indicates the spherical distance between cities (units in kilometers,
s >= 100). If there is a PFTZ within a spatial distance of (
s-100,
s] from city
i in year
t 5,
Diss = 1; otherwise
Diss =0. For example,
Dis100 indicates whether there is a PFTZ within the spatial distance of (0, 100] from city
i in year
t. We judged the spatial spillover effect of the PFTZ according to the magnitude and significance of coefficient
δs. The definition of other variables is the same as Equation (1).
Specifically, we report the estimation results of Equation (5) in
Table 11. We can find that the coefficient of
Dis100 is positive and significant at the 1% level, while the coefficients of
Dis200,
Dis300, and
Dis400 are all insignificant. This estimate result suggests that the PFTZ also exerted a positive spillover effect on the ULGUE of surrounding cities, while this radiation effect only exists within a spatial distance of 100 km.
7. Discussion
From a global perspective, place-based policies have been widely utilized as a policy tool to achieve place-specific development goals in China, America, Australia, etc. From the existing literature, the evaluation of place-based policies has also been a hot topic in economic research. However, the studies mainly focused on the location development and innovation effects of place-based policies. There was little literature on the ULGUE effect. With the help of the PFTZ, we evaluate the ULGUE effect of place-based policies, which makes a good supplement to the existing literature.
From the perspective of China’s PFTZ deployment, China’s pilot cities have made special arrangements for intensive and efficient land use. First, the PFTZ establishment effectively promoted ULGUE; this conclusion is valid after a series of robustness tests, including the PSM-DID estimation, the entropy-balancing estimation, the placebo test, changing the research sample, and controlling for the impact of other policies. Second, comparing the central and eastern cities with the inland cities and cities with lower economic development levels, the positive effect of the PFTZ on ULGUE is more prominent in the eastern cities, the coastal cities, and the cities with higher economic development levels. Third, as a place-based policy, the PFTZ indeed exerted a spatial radiation effect on the ULGUE of surrounding cities, though this spatial spillover effect only exists within a spatial distance of 100 km. Our research provides evidence for place-based policies to promote ULGUE.
Although our results confirm the significance of place-based policies in improving ULGUE, this finding mainly comes from Chinese samples, and the implementation system of place-based policies has specific characteristics. Therefore, our conclusions cannot be directly applied to other countries and may not be fully established in other countries. For example, the land in Chinese cities is owned by the state, and the power of the Chinese government is relatively strong, which is not the case in other countries. However, the problem explored in this article is universal and deserves the attention of all countries. Further, the method used in this research can also apply to the evaluation of the effects of other place-based policies.
8. Conclusions
Urban land allocation is an important policy tool to guide industrial development; the promotion of ULGUE can lead to the green development of industries. As a typical place-based policy, the PFTZ construction can yield direct effect on land allocation and further affect ULGUE. Using the panel data of 279 cities in China during 2011–2019, this study explores the effect of the PFTZ establishment on ULGUE by the DID method. Our study confirms that the PFTZ can indeed improve ULGUE. Moreover, the effect of the PFTZ on ULGUE is more prominent in the eastern cities, the coastal cities, and the cities with higher economic development levels. Furthermore, the PFTZ also exerted a spatial spillover effect on the ULGUE of surrounding cities.
There are several policy implications of the above conclusions. First, we should expand the spatial scope of the PFTZ establishment and further emphasize the importance of optimizing urban land allocation in the implementation process of the PFTZ. Second, the establishment of the PFTZ cannot be accomplished at once. The PFTZs distributed in different cities need to consider their natural resources, financial support, and location conditions. We should differentiate the PFTZ establishments and form their own development characteristics to prevent the waste of resources caused by homogeneous competition. Third, we should effectively strengthen the collaboration and communication between the PFTZs and other regions, expanding the radiation effect on neighboring cities to achieve a greater incremental effect on ULGUE.


