Article

Fractal Features of Soil Particles as an Index of Land Degradation under Different Land-Use Patterns and Slope-Aspects

1
School of Logistics and Management Engineering, Yunnan University of Finance and Economics Kunming, Kuming 650221, China
2
Department of Geography and Geospatial Sciences, Kansas State University, 920 N17th Street, Manhattan, KS 66506-2904, USA
3
School of Water, Energy and Environment, Cranfield University, College Rd, Cranfield MK43 0AL, UK
4
Department of Soil Science, College of Agriculture, Shiraz University, Shiraz 1352467891, Iran
*
Author to whom correspondence should be addressed.
Land 2023, 12(3), 615; https://doi.org/10.3390/land12030615
Submission received: 31 January 2023 / Revised: 2 March 2023 / Accepted: 3 March 2023 / Published: 4 March 2023

Abstract

:
This study examines the effects of land use and slope aspect on soil erodibility (K-factor) and the fractal dimension (D) of soil particle size distribution (PSD) in calcareous soils at the watershed scale in western Iran. The study analyzed 113 soil samples collected from four land uses (slope-farmland, farmland, pasture, and woodland) at a depth of 0–20 cm, measuring common soil properties such as soil texture, soil organic matter (SOM), calcium carbonate (CaCO3), pH, and cation exchange capacity (CEC). The PSD of soil samples was measured using the international system of soil size fractions, and the D for PSD was calculated. The K-factor was calculated using the RUSLE model. The results showed that the K-factor was highest in slope farmlands with SOM at 1.6% and lowest in woodlands at 0.02 Mg h MJ−1 mm−1 with SOM at 3.5%. The study also found that there were significant correlations between D and clay content (r = 0.52), sand content (r = −0.29), and CEC (r = 0.36). Woodland soils had the highest SOM content, with a mean D value of 2.895, significantly higher than the mean D value of slope farmland soils, which had the lowest SOM at 1.6%. The study concludes that woodland soils retain finer particles, particularly clay, resulting in lower soil loss and land degradation compared to other land uses. Finally, the study suggests that shady slope aspects (south aspect) contain more organic matter due to less solar radiation and higher soil water content, resulting in lower soil erodibility (0.02 Mg h MJ−1 mm−1) and higher D values compared to other slope aspects.

1. Introduction

As a consequence of soil loss caused by water, land degradation is estimated to be a significant problem in many parts of the world, especially in semi-arid regions such as Iran [1,2]. Soil erodibility (K-factor) can be regarded as a key indicator of soil sensitivity to land degradation, which can predict soil erosion (soil loss) [3,4]. The term soil erodibility refers to soil surface erosion caused by raindrops and runoff. To estimate the K-factor and ultimately generate high-accuracy soil loss predictions, standard plots are considered the most accurate method for determining this parameter. Due to the difficulty and expense of fieldwork, researchers have developed models indicating a relationship between specific soil parameters and accessible soil properties [1,2,3]. Because soil erodibility is a key parameter for estimating erosion, studying how this varies spatially will help better understand the mechanisms that drive soil erosion, improve the accuracy of the empirical soil erosion model, and characterize the effects of environmental factors, such as topography, on land degradation [3,4].
Soil particle size distribution (PSD) is a crucial factor that affects soil hydraulic properties, soil fertility, productivity, and soil erosion [5,6]. Alternatively, PSD serves as a crucial index for evaluating soil and its contribution to soil functions [7,8]. Furthermore, PSD can be used to model soil characteristics such as the distribution of water, heat, and solutes [9]. The concept of fractals is used to illustrate systems that have non-definitive scales and are self-similar. In recent decades, there has been increased interest in the fractal dimension (D); it has been used to specify soil PSD and soil physical processes at a low cost [10]. Tyler and Wheatcraft [11] developed a mass-based model to estimate the D of PSD and illustrate the limitations of the fractal concept and application to PSD. As a time-domain mathematical analysis of soil properties, the D has been employed for the identification of soil hydraulic properties [12,13]. D has also been used as an index for soil degradation [14,15] and soil salinity [9,16]. The use of D to identify organic carbon and soil structures has been the subject of extensive existing research [14,17,18], and it has also been studied for indicating soil nutrients [19] and for evaluating soil moisture and soil evapotranspiration [18].
Using data obtained from the Yellow River in China as an example, recently Peng et al. [7] found that D was heavily influenced by land use; high D was found in grassland, which corresponded to soil rich in silt. According to Deng et al. [8], the D in orchards was the highest among all land uses in a hilly region of southern China. As reported by Qi et al. [20], oak forestland showed the highest D value. There has been a lack of understanding of the fractal dimension in spite of extensive research studies, and there is limited research on the relationship between land use and particularly topography on D and the K-factor.
There are numerous factors related to topography that affect land degradation, soil sedimentation, soil erodibility factor, and nutrient availability. Topography affects the underlying process and intensity of land degradation and soil sedimentation on the hillslopes [1,2]. It controls the redistribution of light, heat, water, and sediments in the mountainous landscape. Aspect can influence soil organic matter, and hence consequently, soil aggregate stability and soil erodibility factor, by modifying solar radiation intensity and by creating the microclimates [5,6]. Soils on the steepest slopes are mainly shallow and have low soil organic matter content, which leads to creating weak and small aggregates; consequently they are more sensitive to erosive factors. Sedimentary material eroded from topsoil was transported downslope and deposited at the slope toe rather than being transported outside the watershed. Considering the fact that environmental conditions such as land use and topography significantly influence soil properties, it is extremely beneficial to consider topography as a vital factor for the assessment of other factors such as land use on soil properties.
There is an interconnected relationship between soil erosion in the western regions of Iran, such as Kermanshah Province, which is known as Zagros, and topography attributes that influence soil physiochemical properties. In this province, desertification and land use changes have accelerated over 30 years. We are not aware of any previous research that has examined the effects of land use and topography on the D of soil PSD and soil erodibility factor. As previously mentioned, D and K-factor can be easy, reliable, time-saving and cheap indicators of soil degradation instead of the direct measurement of soil erosion in the field, which is expensive, time consuming, and labor-intensive. Hence, the aim of this study was to assess how different land uses and aspect-slopes might affect the soil erodibility factor (K-factor) and fractal dimension (D) of soil particle size distribution. Once these relationships have been determined, they can then be utilized to better understand and evaluate land degradation across the entire watershed where land-use and slope-aspect is known.

2. Material and Methods
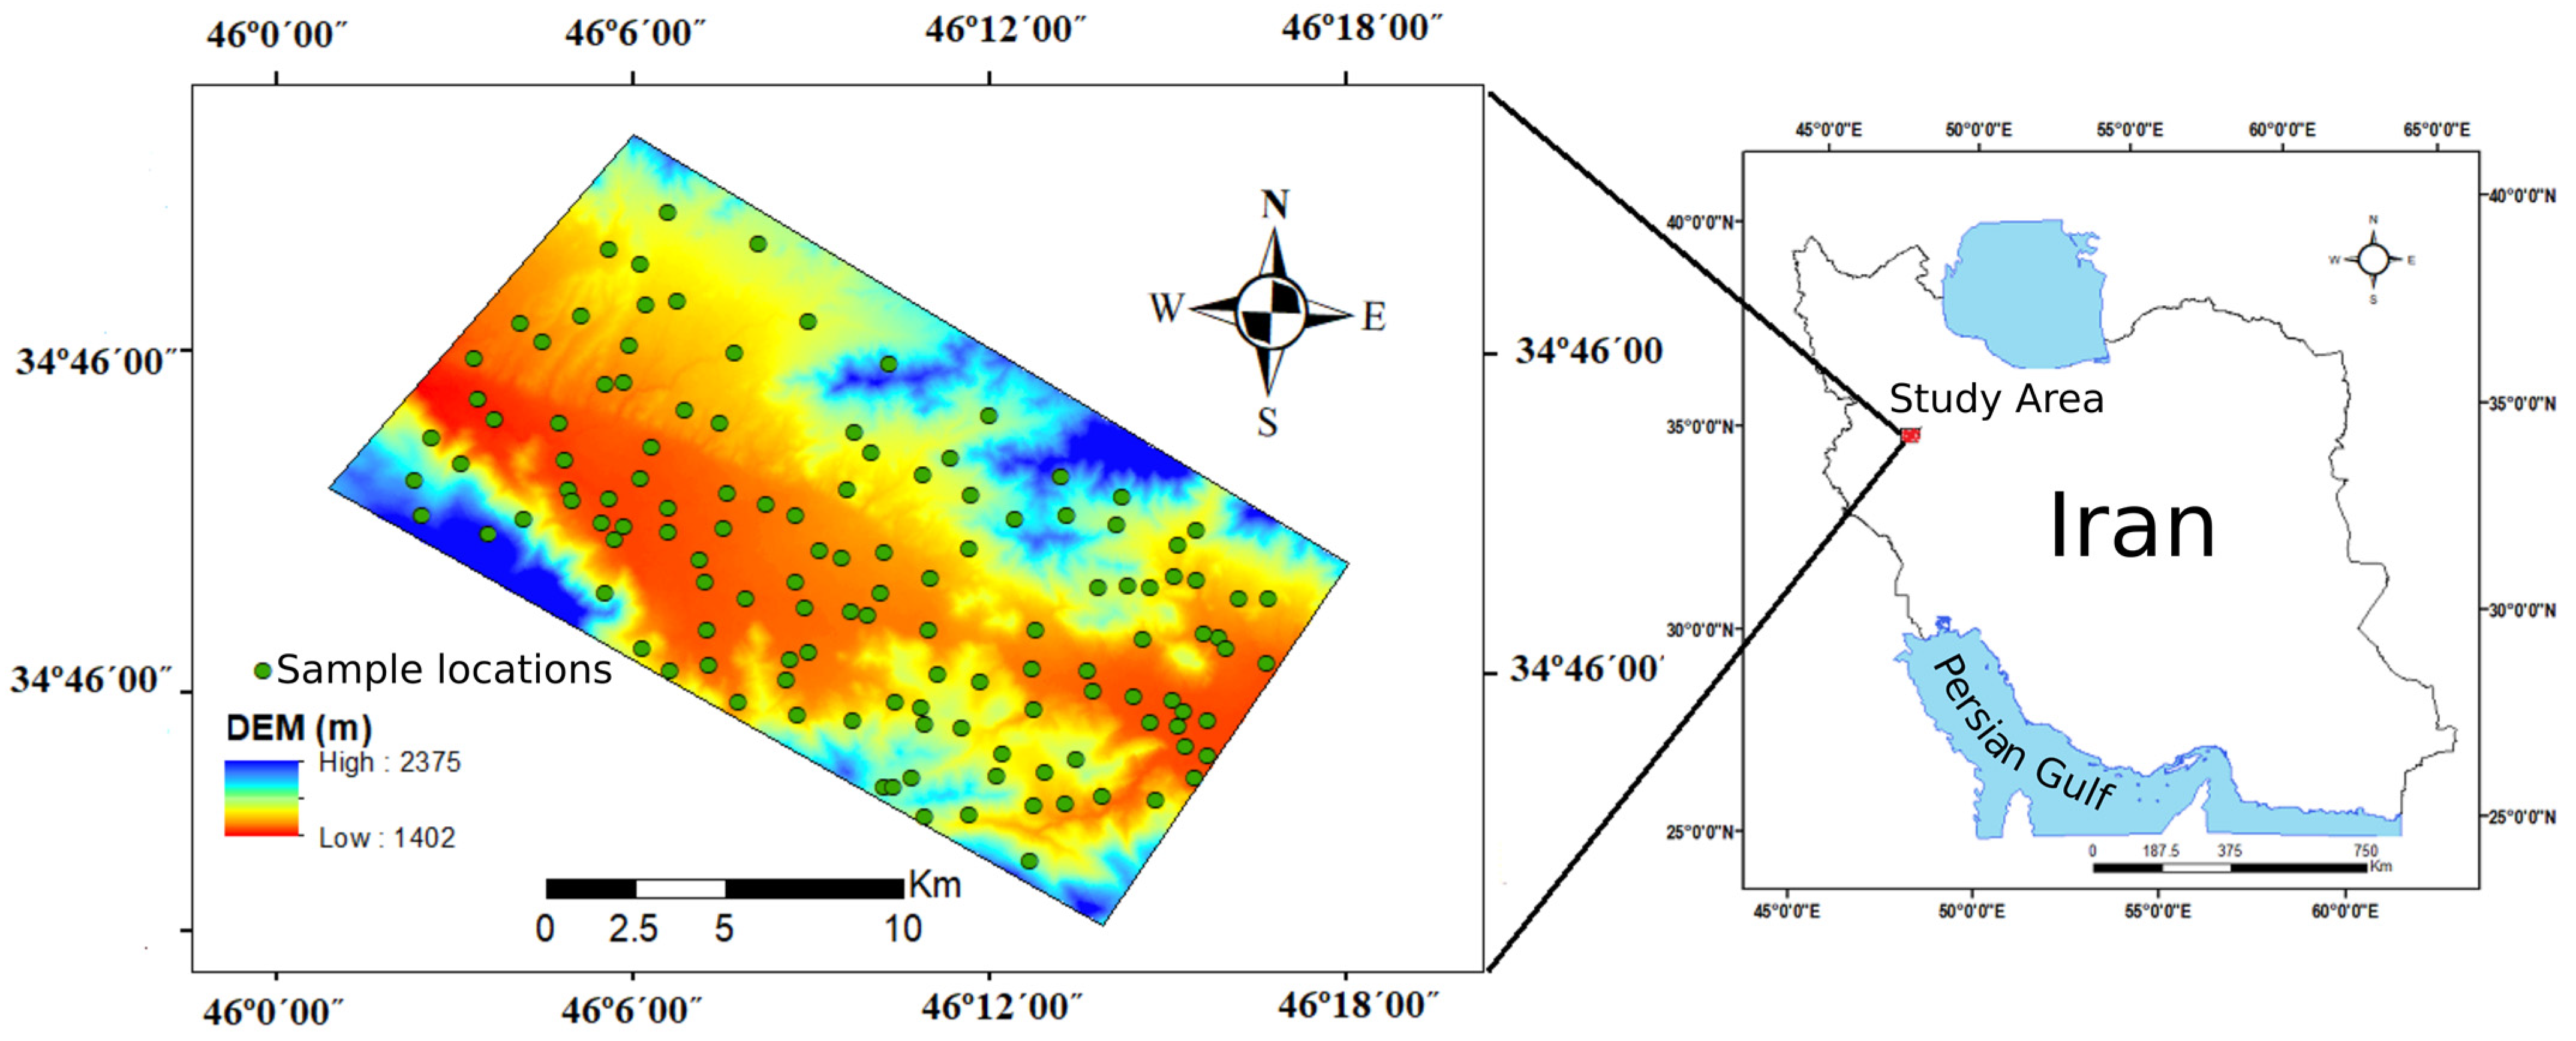
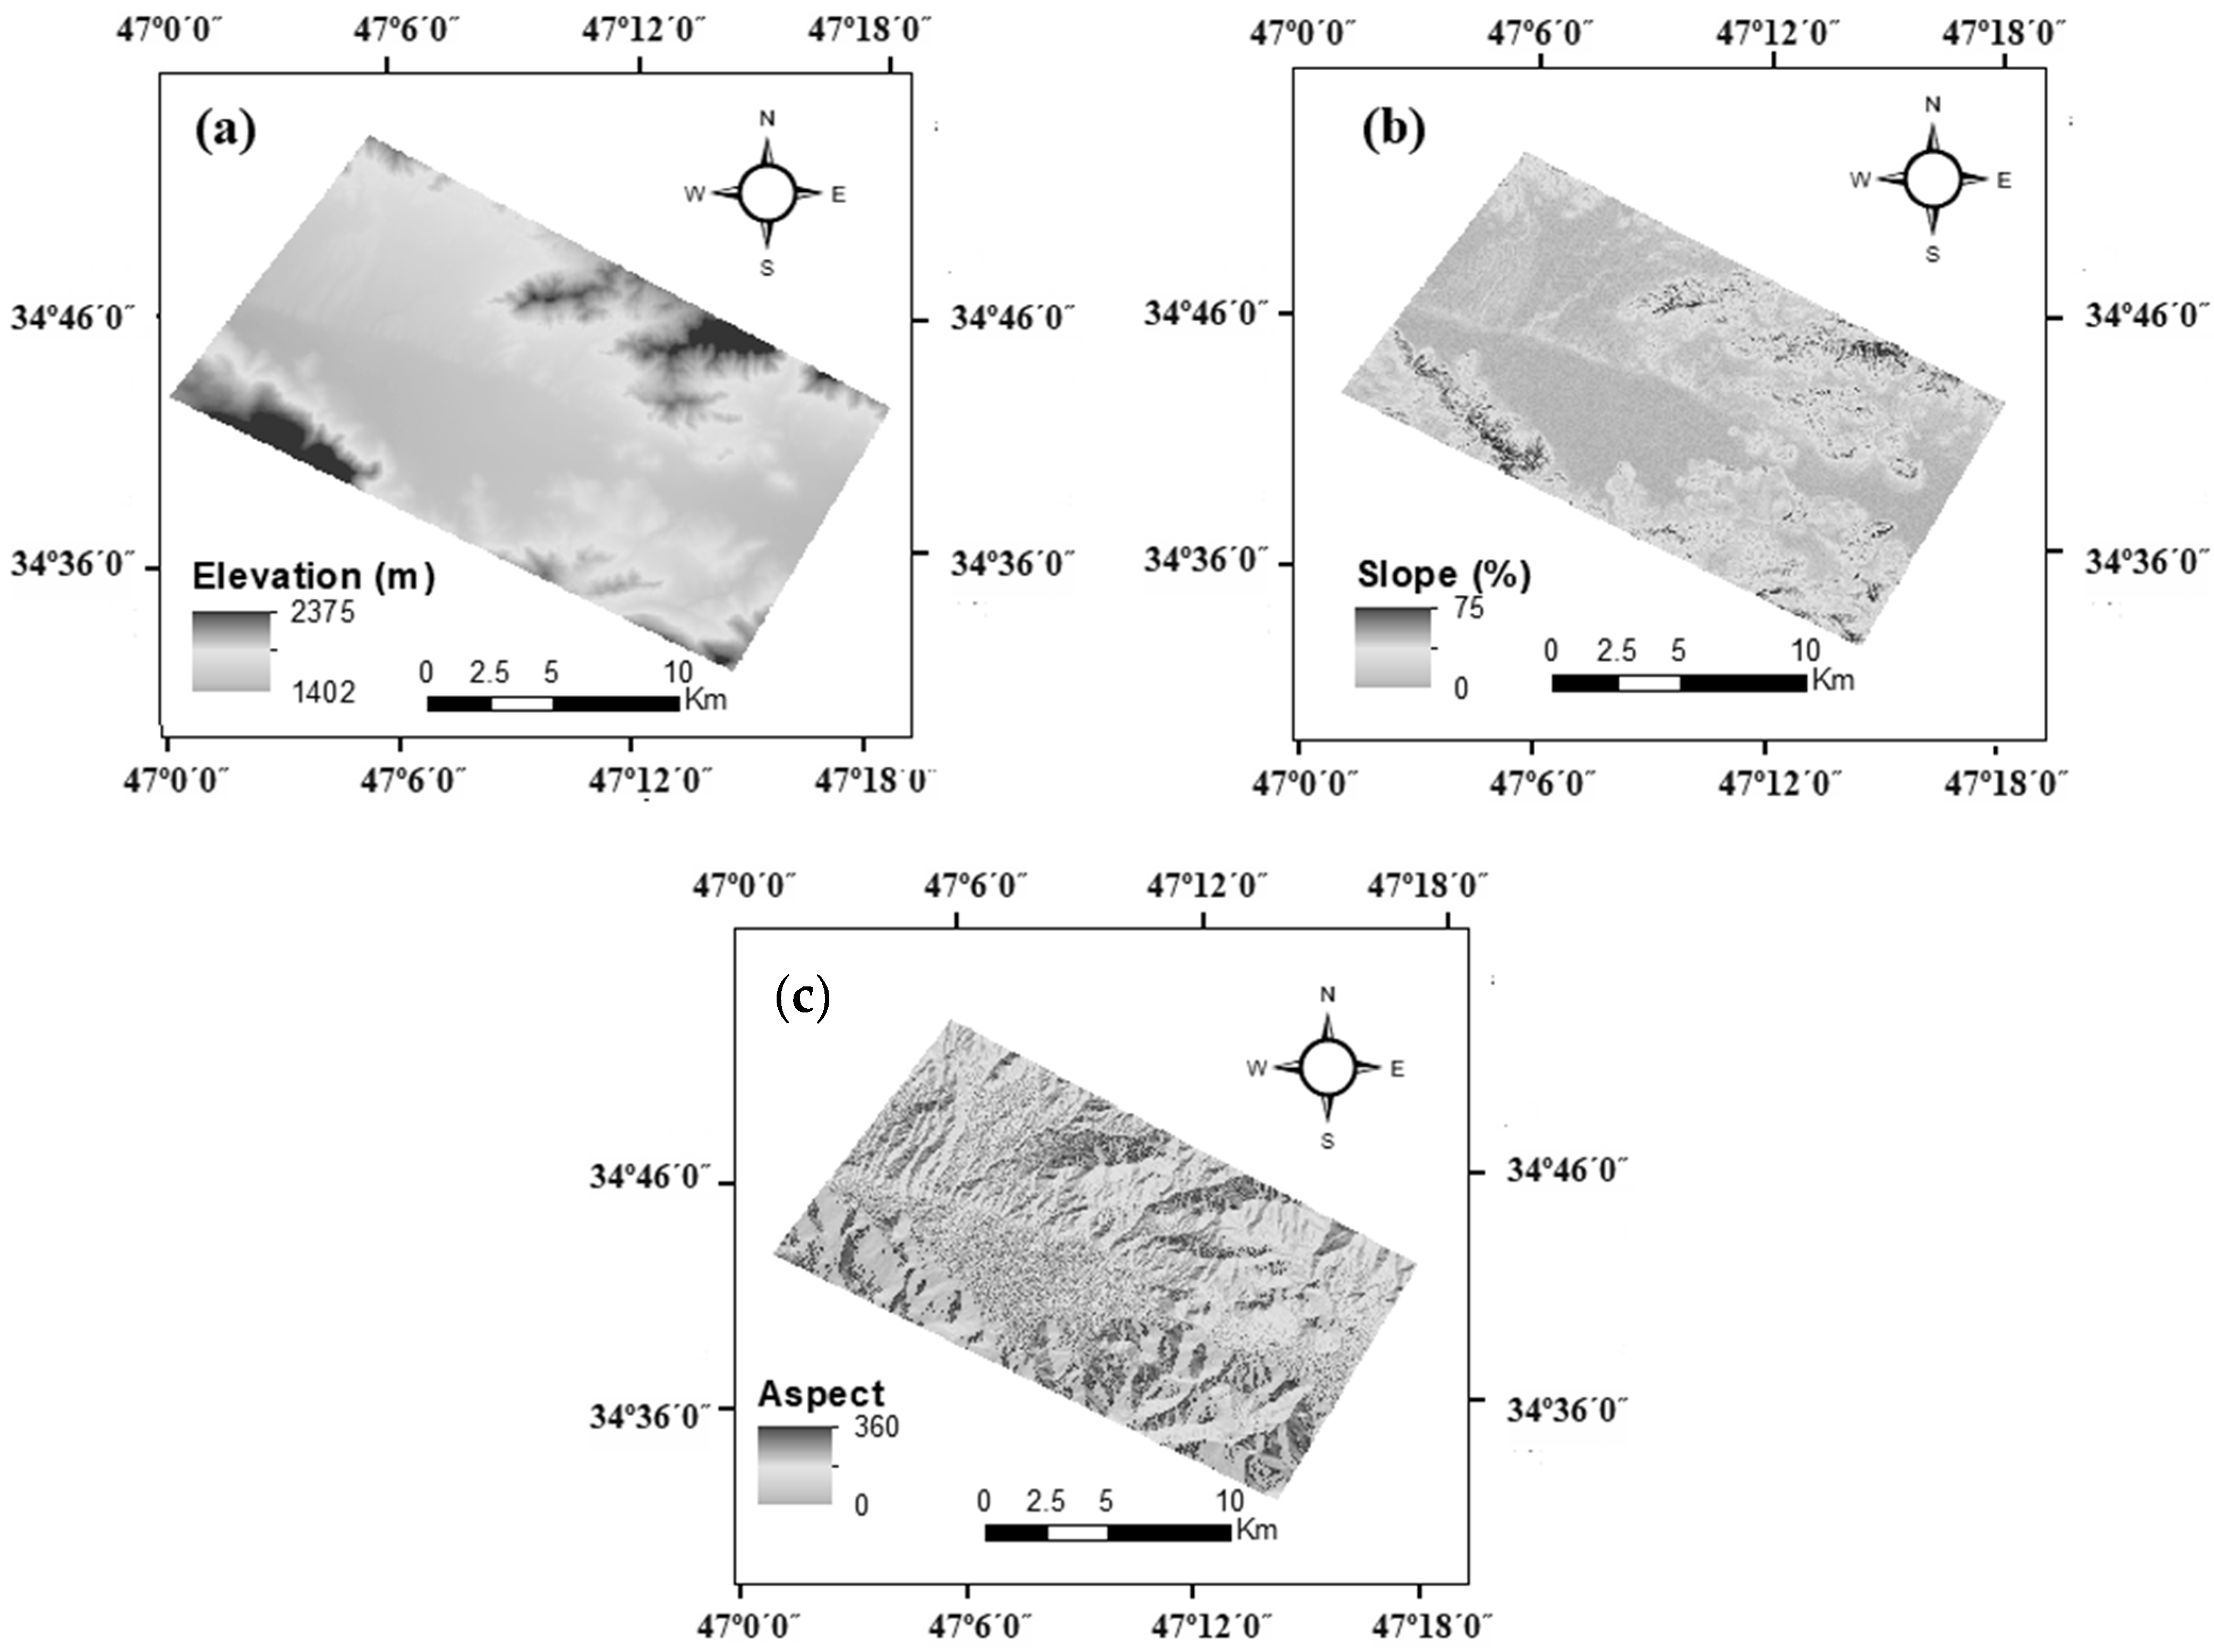
2.1. Study Area

The study area covers an area of 330.75 km2 in the east of Kermanshah Province, Iran, between 34°29′–34°33′ North and 45°46′–47°13′ East. The area has a semi-humid climate, where annual average precipitation is 291.7 mm and the annual average temperature is 17.5 °C. Winters (December to February) are generally rainy and cold, while summers (June to July) are hot [3]. The majority of soils in the area are calcareous, with the three most common soil orders being Entisols, Inceptisols, and Alfisols [3]. Agriculture is the predominant land use throughout the study area, with barley, wheat, and potato being the main crops grown.

2.2. Soil Sampling and Analysis

Using aerial imagery for an initial reconnaissance survey, areas within the study area were identified as candidate locations for collecting soil samples that would ensure a sufficient quantity of samples were collected, representative of each aspect-slope and land use combination and trying to balance the soil samples across combinations. The number of soil samples was limited by budgetary constraints; in total 113 samples from the soil surface layer (0–20 cm) were collected across the study area, which was considered sufficient for the size of the study area (Figure 1). The sample collection survey was carried out in summer 2021. Because an up-to-date land use map was unavailable, land use was verified and determined at the sampling location. The soil samples were collected from four land-uses as follows: 34 samples from slope-farming, 27 samples from farmland, 28 samples from rangeland, and 24 samples from woodland. In addition, the samples were also classified into four main aspect-slopes: north aspect (38 samples), east aspect (23 samples), west aspect (24 samples), and south aspect (27 samples). After air-drying, grinding, and sieving the samples, they were then analyzed to evaluate some general soil physicochemical properties. Soil texture was determined using a hydrometer [21,22]. The Walkley-Black method was used to quantify soil organic matter. CaCO3 was determined with HCL 1 mol L−1 [21]. The soil EC and pH were obtained using a portable pH/EC machine.

2.3. Fractal Dimension

The methodology of Gee et al. [22] was followed to determine the distribution of particle sizes in soil. As part of the experimental setup, 50 g of sieved soils were used, and SOM was omitted by adding a 30% solution of H2O2 to the sieved soils. Sodium-hexamethyl-phosphate 5% was employed as a chemical dispersant to disperse the soil samples. Mechanical dispersion of the soils was performed with a shaking machine, for 5 min, to disperse the soils. A sedimentation method was used to measure the mass of particles less than 0.05 mm with an ASTM 152H hydrometer, or more specifically an ASTM 152H hydrometer was used to determine the density of suspension after 2, 5, and 10 min, and 1, 3, 6, and 24 h [22]. The following equations were used to compute the percentage of each fraction based on hydrometer readings and the temperature of the solution:
R C = R r C + 0.36 ( T 20 )
P < D = ( R C - D m s ) × 100
where RC represents the adjusted hydrometer reading, Rr represents the non-adjusted hydrometer reading, C represents the hydrometer reading referring to the sodium-hexamethyl-phosphate 5% applied (5.5% in this study), and T represents the temperature at the time the hydrometer measurement was recorded (°C). In addition, ms is the mass of dry soil (50 g) and RC-D and P<D adjusted hydrometer readings correspond to the falling time of soil particles with diameters < D and their proportion, respectively. At each reading time, falling height was obtained using:
x = 0.164   R r + 16.3
where x is the falling height (L) [22]. To calculate the radius of particles at the exact moment when measured, Stock’s law was applied as follows:
V = 2   g   r 2 ( d P d F ) 9   η
V = x t
where V, r, g, dF, dP, η, t, and x are the velocity of particles falling in fluid (L T−1), radius of particle (L), gravity acceleration (L T−2), density of fluid (W L−3), density of particles (W L−3), viscosity of fluid (W L−1 T−1), the time needed for the particle to fall from a height of x, and height of falling (L), respectively. Furthermore, pore diameters of 1, 0.5, 0.15, and 0.05 mm were considered for measuring the mass fractions of sand using wet sieves [5].
Using the PSD data, a power equation was tested for the calculation of the fractal dimension [11]:
M < x M T = ( x x max ) 3 D
where M <x is cumulative mass, smaller than specific size x, MT refers to total soil mass, xmax is the maximum size of soil particles, and D is the fractal dimension. It is possible to determine D using linear and non-linear regression approaches. The linear method was used in this study; hence, the natural logarithm was used and gives the equation:
Ln ( M < x M T ) = ( 3 D ) Ln ( x ) a
a = ( 3 D ) Ln ( x max )
where a is constant for each soil. Then, the values were plotted and D was calculated by determining the slope of the line. STATISTICA 8 software was used for the statistical analyses.

2.4. K-Factor

By applying the RUSLE model [23,24], the K-factor was calculated using the two following equation:
K = 0.0034 + 0.0405   exp [ 1 2 ( log ( D g ) + 1.659 0.710 ) 2 ]
D g = exp [ 0.01 ( P s a n d . ln 1 + P s i l t . ln 0.025 + P c l a y . ln 0.001 ) ]
where Dg refers mean geometric diameter of soil particles, and Psand, Psilt, and Pclay are sand content, silt content, and clay content, respectively. Both Ostovari et al. [23] and Vaezi et al. [24] have studied the application of the RUSLE K-factor in Iran and found it to give very good results. A conversion to the standard international unit was made by dividing the equation results by 0.1318 (i.e., Mg h MJ−1 mm−1). A digital elevation model (DEM) with a resolution of 12.5 m from USGS [25] was used to create three environmental layers: elevation (Figure 2a), slope (Figure 2b), and slope aspect (Figure 2c) using ArcMap 10.6. Figure 2a shows the altitude of the sampling location sites ranged from 1402 to 2375 m. Figure 2b shows the slope ranging from 0 to 75%. The aspect-slope varied from 0 to 360, indicating a variety of aspects (Figure 2c).

2.5. Statistical analyses

An analysis of variance (ANOVA) was conducted to determine whether land use and topography affected the D and the K-factor. In order to assess the relationship between soil properties and the K-factor and D, Pearson correlation coefficients with a 95.0% confidence level were applied. Descriptive statistics of soil properties including minimum, maximum, mean, standard deviations (SD), and coefficients of variation (CV) were calculated by STATISTICA 8 software (Table 1). The graphs were produced using Microsoft Excel 2016.

3. Result and Discussion

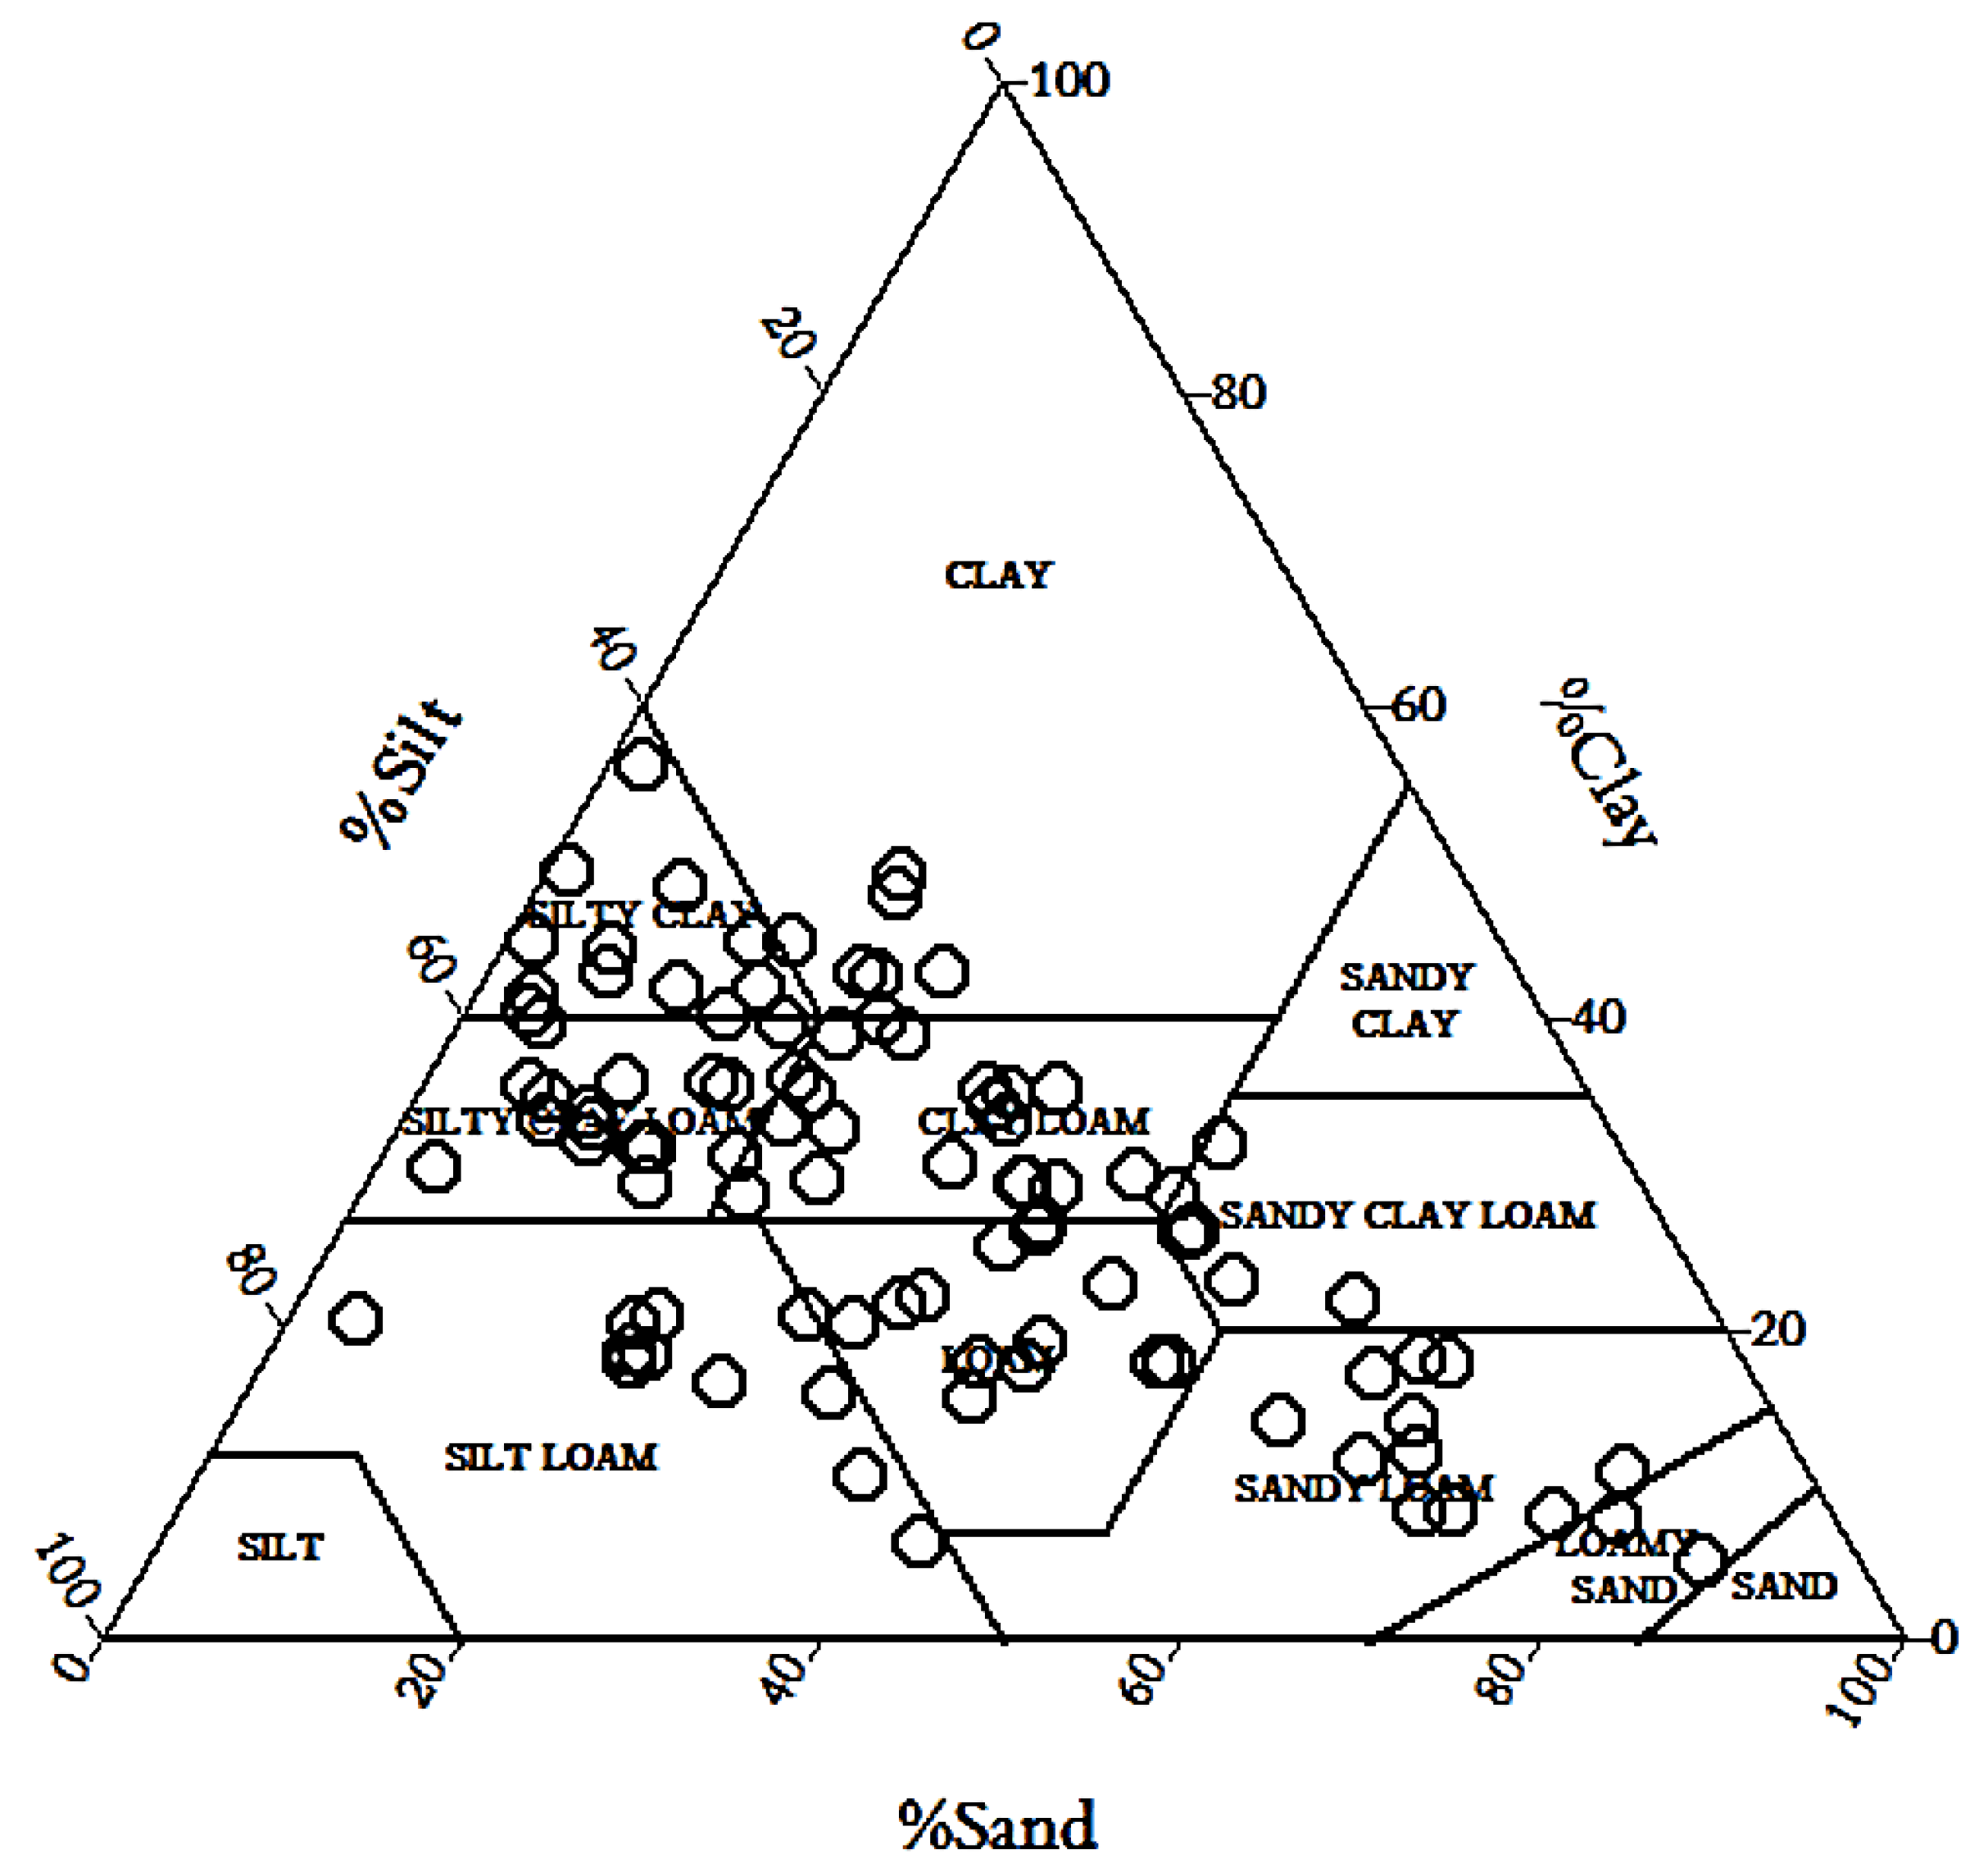
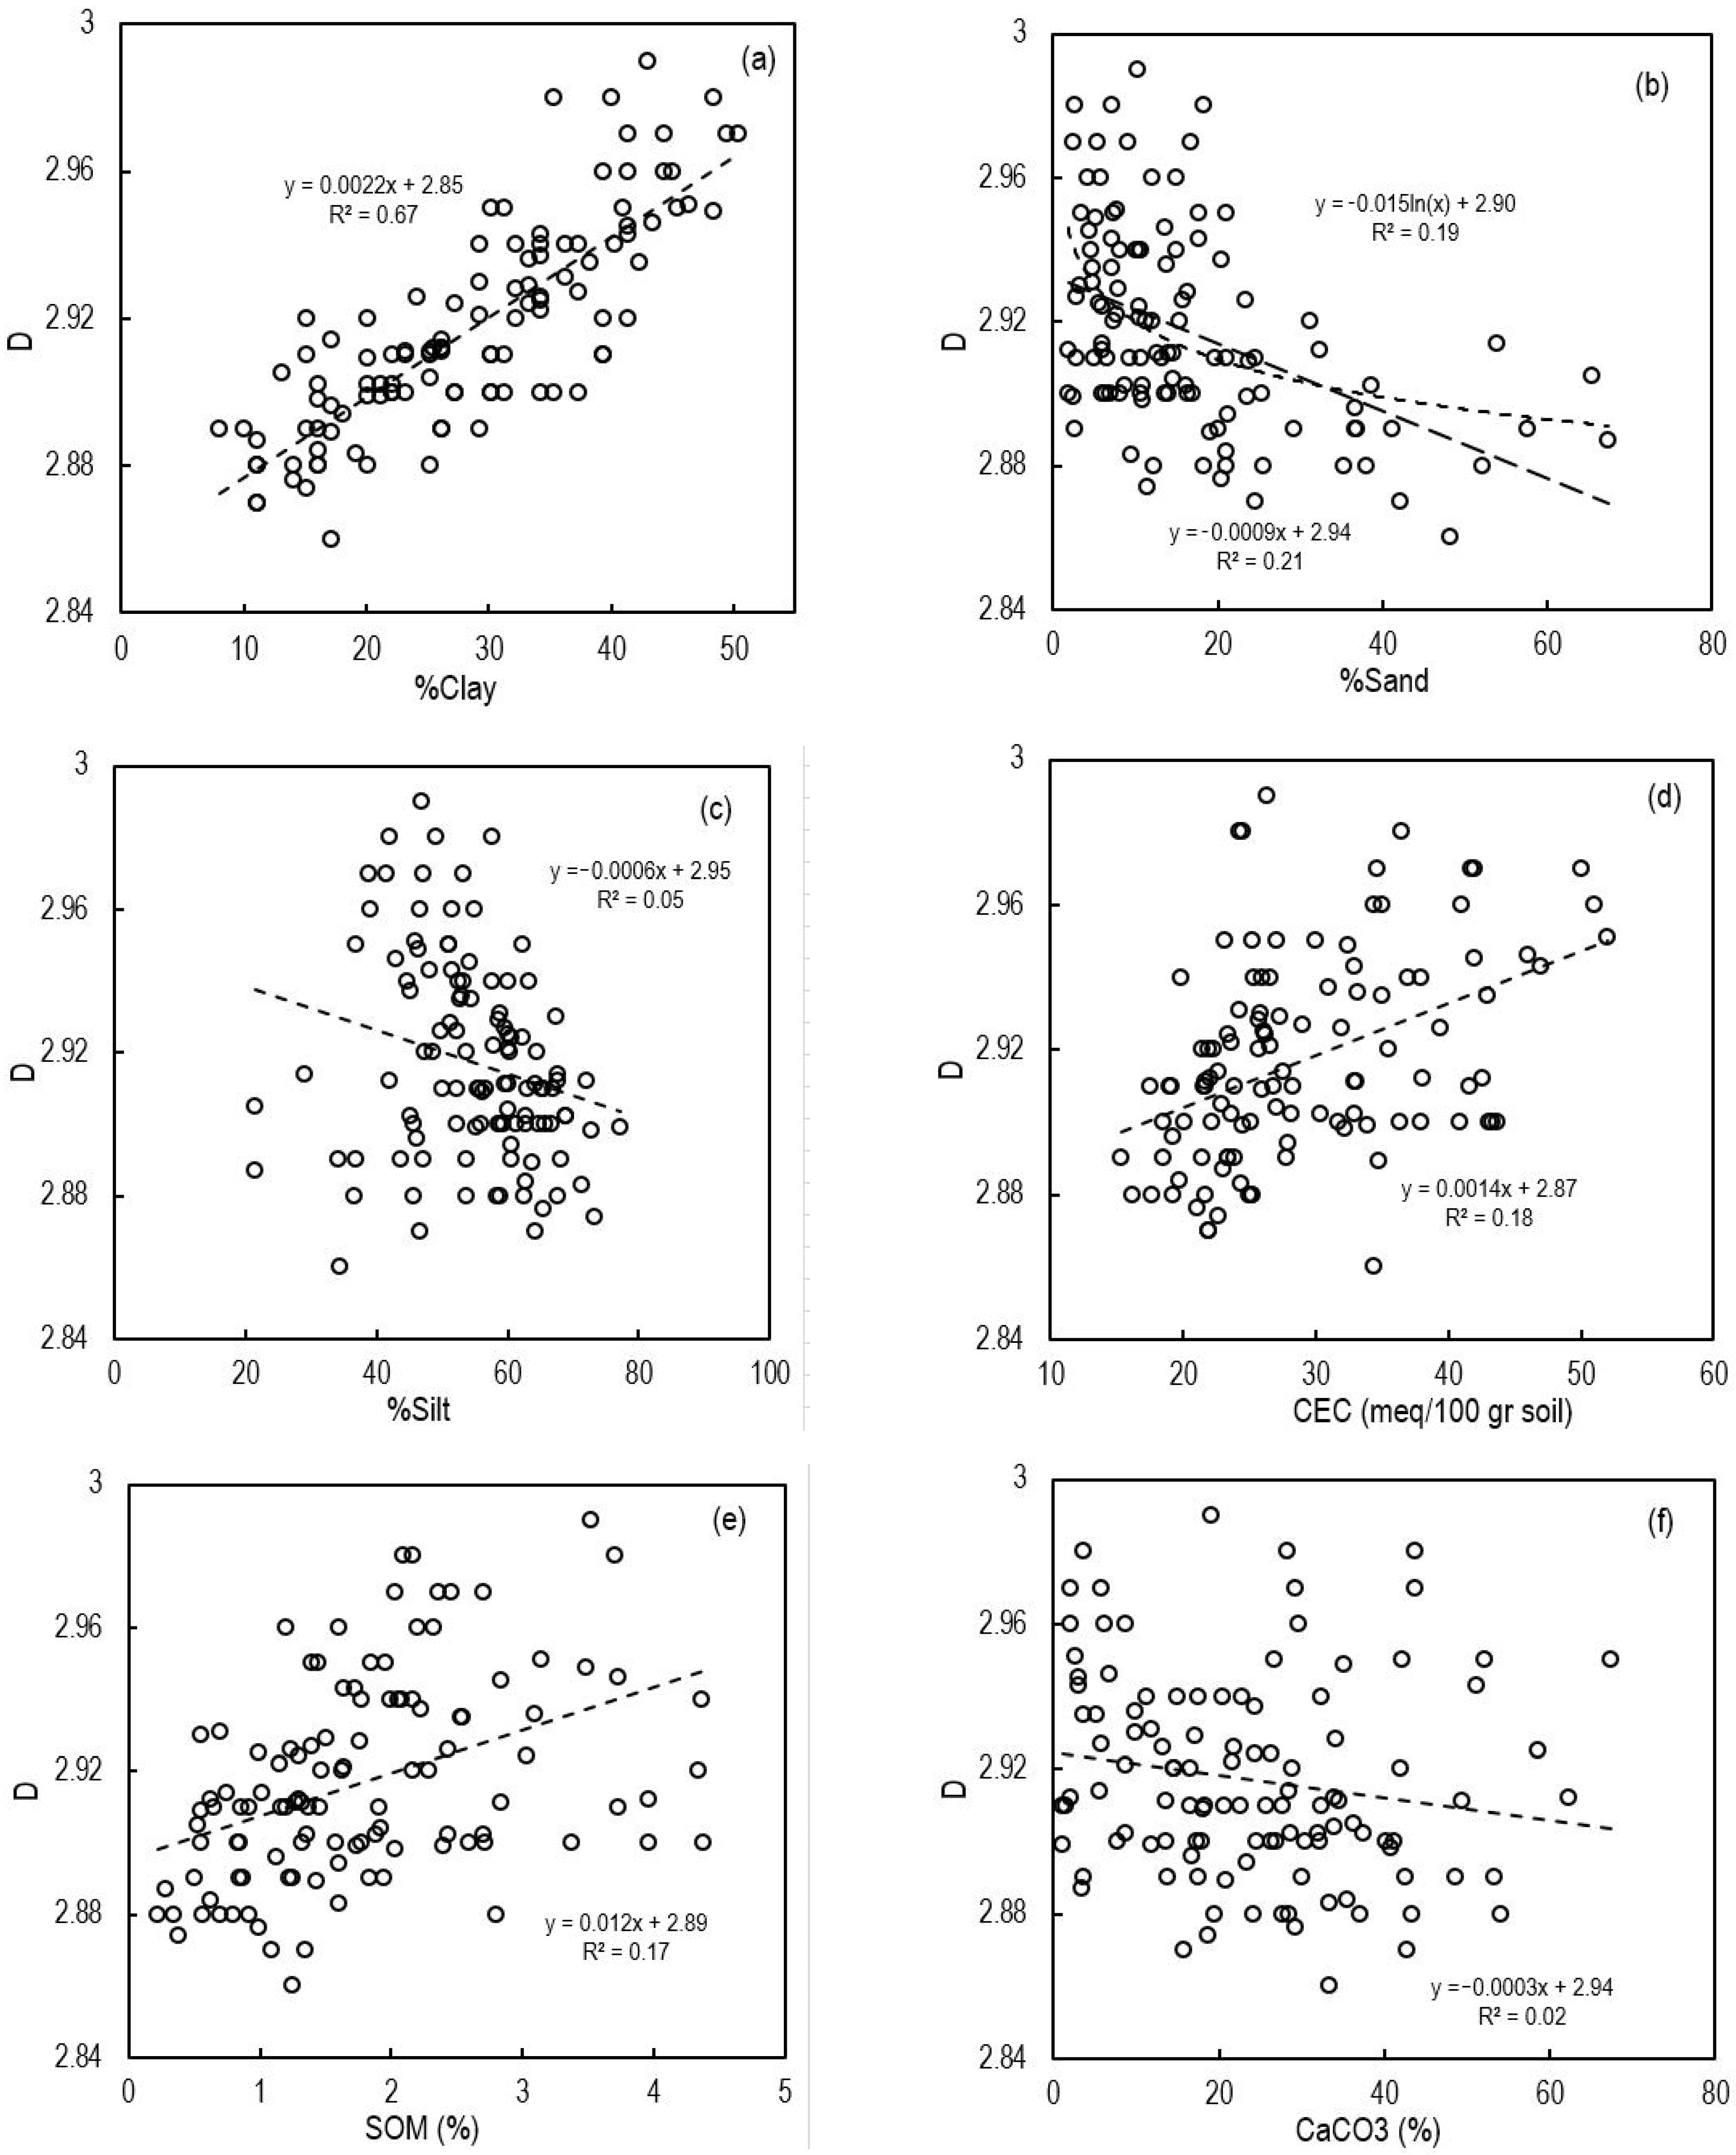
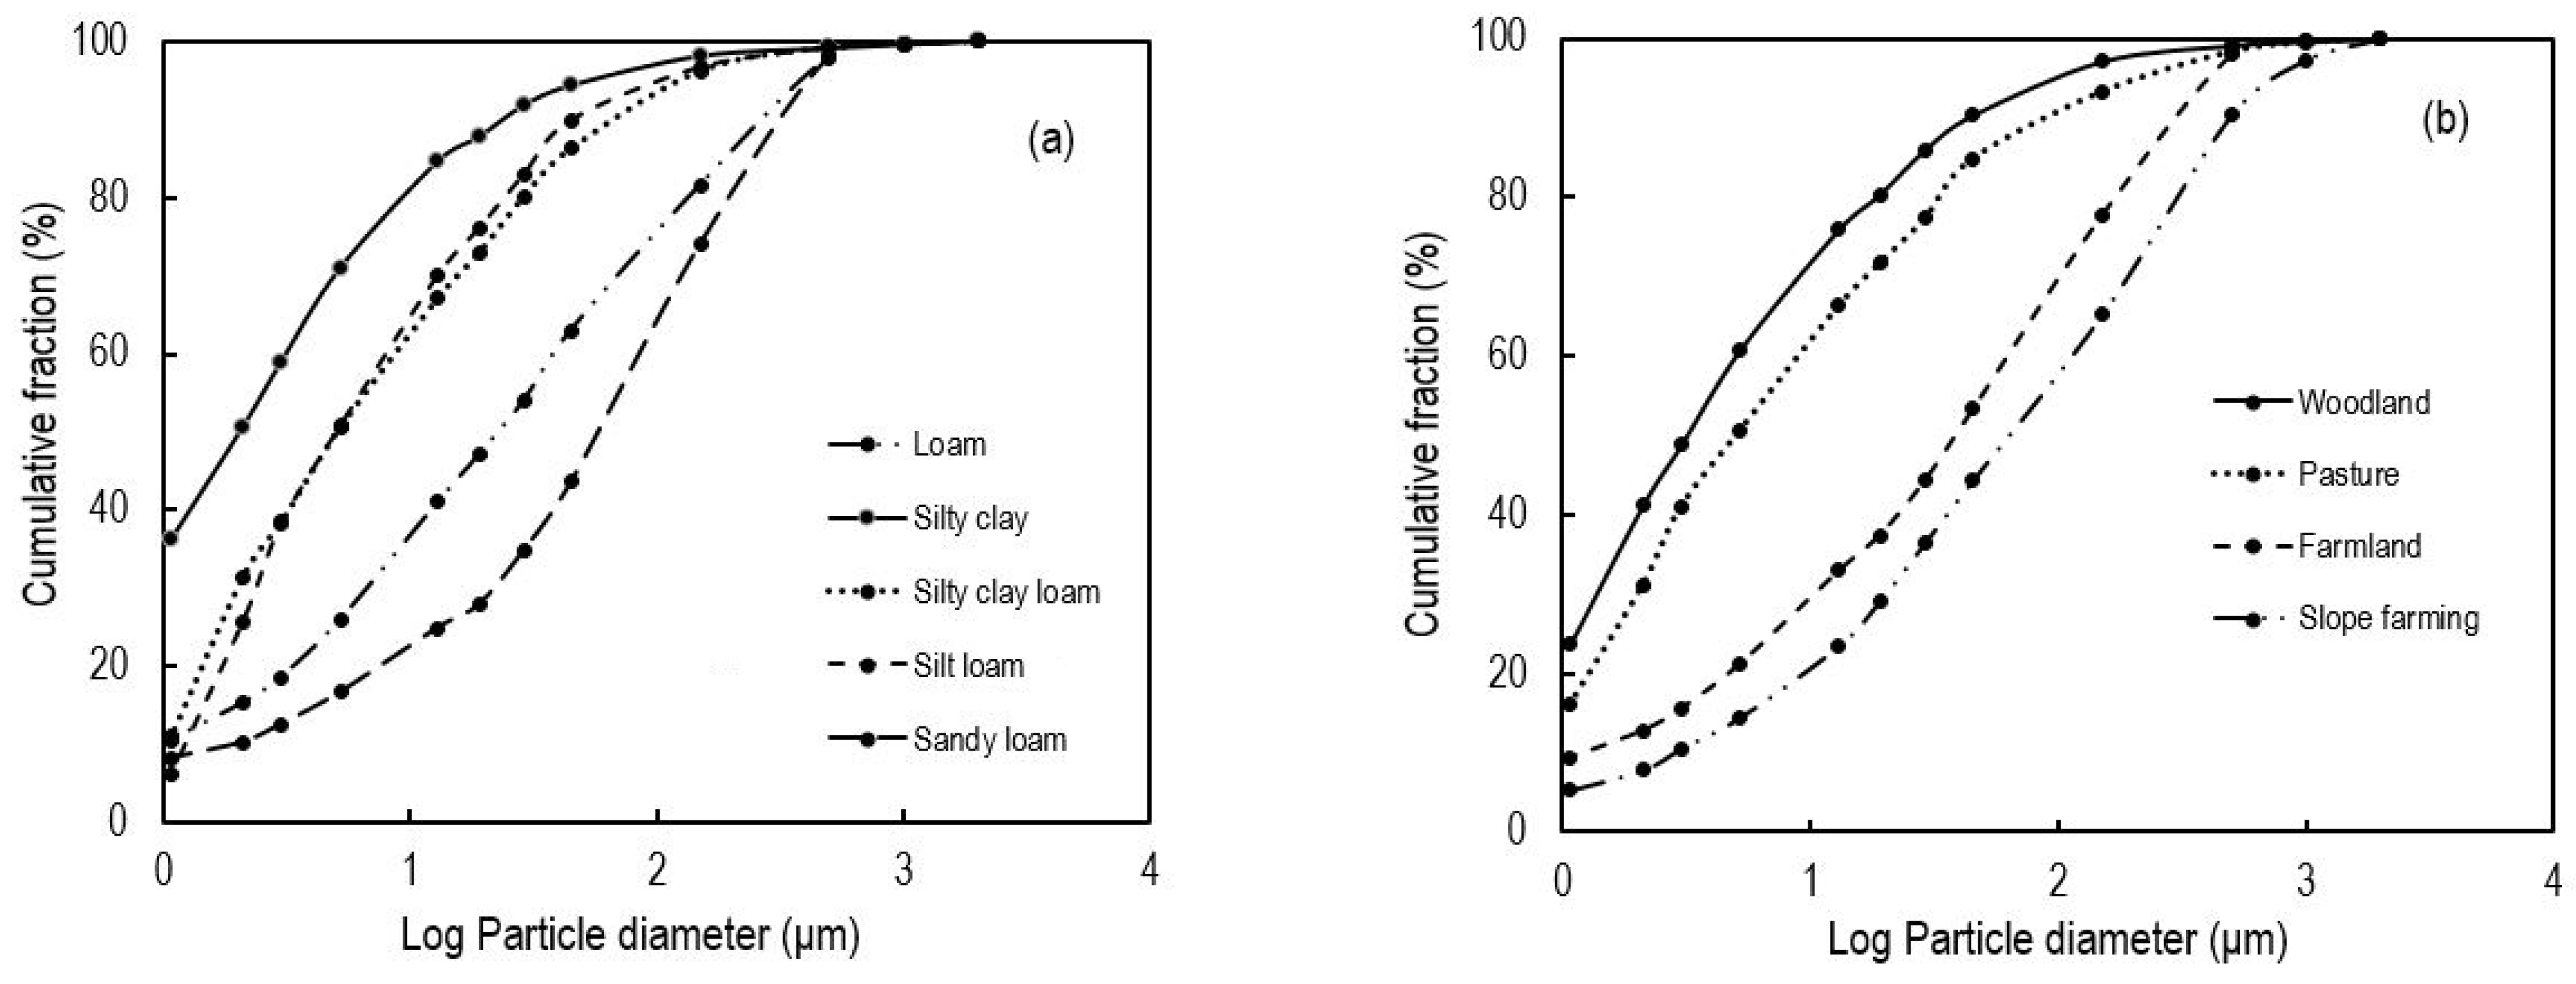
3.1. Description of Soil Properties

A description of soil properties is presented in Table 1. The mean pH value of the soils indicates that they are alkaline, likely due to the high content of calcium carbonate (CaCO3 = 44.9%). This can be explained by the high content of lime in the soil samples. The electrical conductivity (EC) of the soils ranged from 0.67 to 4.5 mS cm−1, with a mean value of 2.35 mS cm−1. Soil organic matter (SOM) values ranged from 11.5 to 66.5%, with an average of 2.2%. The soil samples also exhibited a wide range of particle sizes, with clay loam and loam being the most commonly occurring soil texture classes (as shown in Figure 3). Table 1 provides additional descriptive statistics for soil properties, including minimum and maximum values, standard deviations, and coefficients of variation.
These particles range from 5.1 to 56.2% clay, 2.1 to 86.1% sand, and 8.5 to 75.6% silt. There is the highest variability in the sand with CV values of 60.3, followed by clay content (CV = 39.7), and the lowest variability in EC, pH, and Bd with CV values of 3.5, 4.2, and 12.13, respectively. There was a range of K-factors from 0.02 to 0.15 thMJ−1 mm−1 with a mean of 0.09 thMJ−1 mm−1. This is consistent with the results of two studies conducted in the calcareous soils of Iran by Vaezi et al. [24] and Ostovari et al. [23]. The K-factor values reported in Bonilla and Johnson [26] and Addis and Klik [27] are within the range of 0.02 to 0.039. A range of D values was found between 2.851 and 2.690, with a mean of 2.916. These results are consistent with those found in the Iranian calcareous soils by Mahdi and Dahmardeh Ghaleno [12], Omidvar [13], and Mohammadi et al. [6].
Figure 4 illustrates the correlation between D, K-factor, and general soil parameters. The strongest positive relationship found was between K-factor and silt particle content (r = 0.84, p < 0.05). Those soils that contain high amounts of silt, which are very sensitive to erosive factors (wind and water) [26], do not have robust aggregates, which in turn increase the K-factor sequentially over time. It was also found that there was a significant positive contribution between OM and carbonate (r = 0.49, p < 0.05, n = 113). It has been reported by Ostovari et al. [28,29] that there is a correlation of 0.36 between OM and CaCO3. In addition, CaCO3 contains a large number of calcium ions that contribute to the creation of big and robust aggregates by rolling a glue agent in the flocculation process of soil minerals, thereby lowering the K-factor and increasing the resistance of soil aggregates to soil erosivity factors (runoff and raindrops). It is well-established that Bulk density is negatively influenced by the K-factor (r = −0.46, p < 0.05, n = 113), which is supported by the findings of Ostovari et al. [30], who point out that bulk density and soil loss tolerance have a negative and positive correlation, respectively.
As a sensitive indicator of changes in soil properties, the D of PSD is used to quantify those changes [14]. The relationship between D and soil properties has been found to be both linear and non-linear [15]. An illustration of the relationship between soil parameters and D is shown in Figure 5. There was an increase in the D with an increase in clay content (Figure 5a). A logarithmic regression model revealed a tight fit (R2 = 0.67) between clay content and D, which has been supported by previous research [8,13,14,15]. In contrast, sand and silt showed negative correlations with D (Figure 5b,c), as these fractions are relatively inert in soil compared to clay [31,32]. Nevertheless, no significant relationship was observed between silt content and D (R2 = 0.16), whereas sand content showed a slightly stronger negative linear relationship with D (R2 = 0.21). These findings are consistent with existing research such as Su et al. [31], Zhao et al. [9], Deng et al. [8], Li et al. [17], and Omidvar [13], who all reported a negative relationship between sand content and D.
However, our findings differ from those of Deng et al. [8] and Peng et al. [7], who found a positive correlation between D and %silt. A positive non-linear relationship was also observed between SOM and D (R2 = 0.17), whereas CaCO3 did not show a clear correlation with D (Figure 5d). However, it should be noted that CaCO3 was positively related to SOM (r = 0.49; Figure 4). The D increased with increasing CEC (linear relationship with R2 = 0.18.

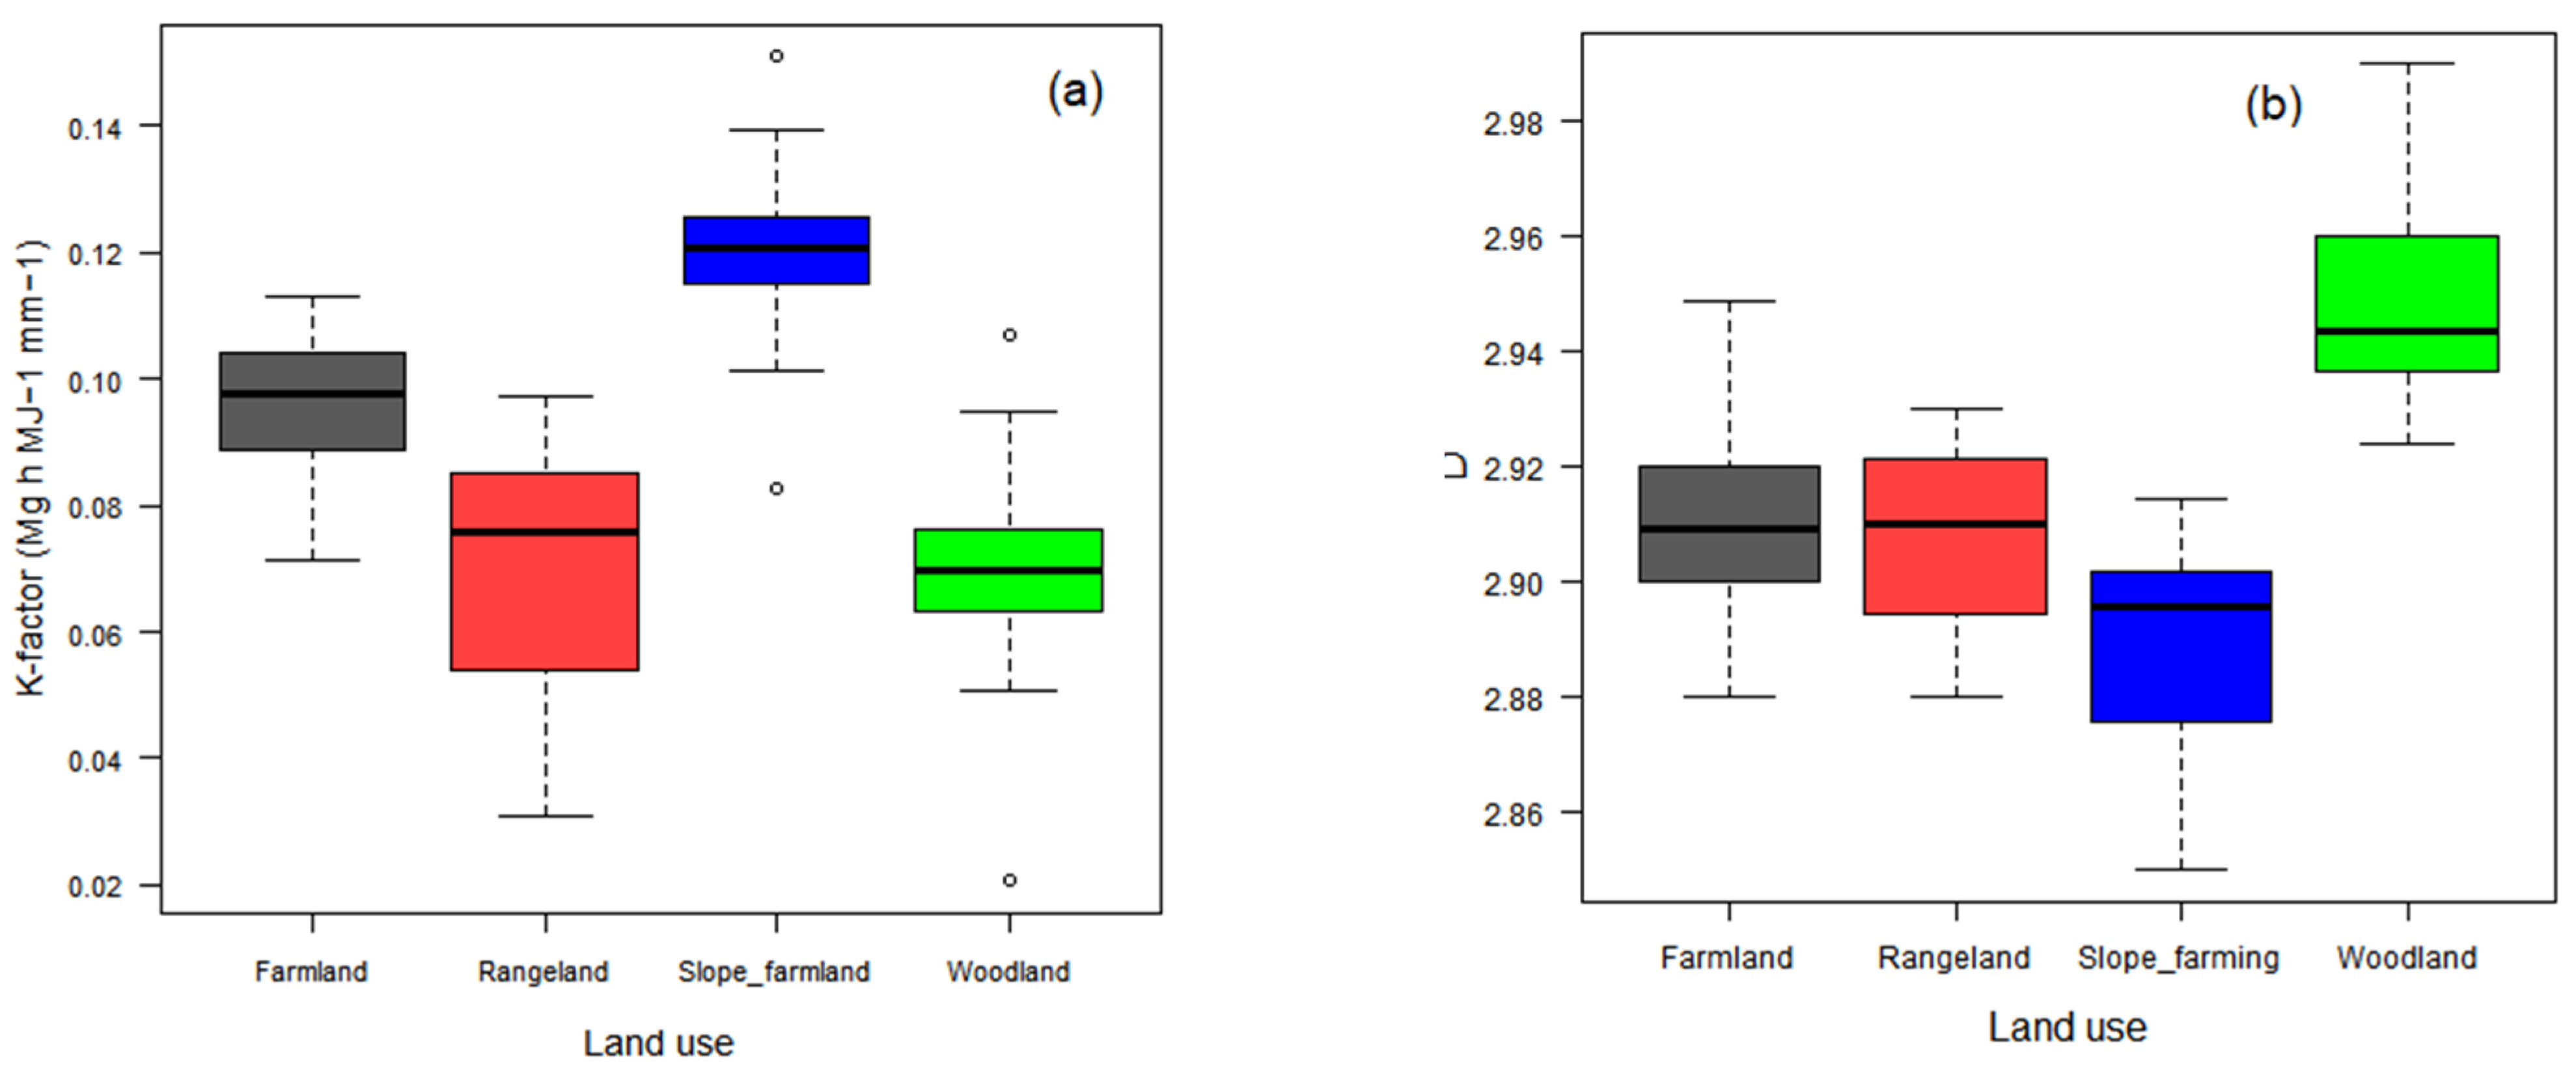
3.2. K-Factor, D, and Land Use

The K-factor varied depending on the land use of the soil, as shown in Figure 6a. Slope farmland had the highest mean K-factor and the lowest variation, which is consistent with Jiang et al. [33]. Farmland had a mean K-factor of 0.09 Mg h MJ−1 mm−1 and a variation of 11%. Slope-farmlands tend to be found in highlands or mountainous areas with steep slopes, which result in thin soils with very little SOM (1.6%) and are generally plowed in the slope directions, which leads to soil erosion. Woodland land use had the lowest K-factor (0.07 Mg h MJ−1 mm−1), a finding that was also reported by Jiang et al. [33]. In wooded areas, where soils are deep and are Inceptisols, organic matter is the highest (3.5%) when compared to other types of land use considered in this study. It is interesting to note that no significant difference was found in the K-factor between woodlands and rangelands, but SOM content was higher in woodlands (2.9%).
It can be seen how D varies according to land use (Figure 6b). It was found that D of soil PSD varied significantly among the four different land use types in this study. There was no noticeable difference between the mean D value of the woodland (D = 2.951), farmland (D = 2.915), and pasture (D = 2.914), but there was a marked difference between the mean D values of woodland and slope-farming (D = 2.895). In soils with a high D, the clay content will be higher (there will be a larger specific clay surface area), which will result in a stronger bond between particles, which will result in a larger soil aggregate, and hence more nutrients will be present in the soil [34]. As shown in Figure 6b, the woodland land use was the most clay-rich when compared with the other land uses, indicating that woodlands had a lower degradation potential (a greater D) than farmland and pastures because of their high clay content. Additionally, the SOM of the soil in the woodland land use was greater than that found in agricultural lands and pastures. However, no significant differences were observed between organic material on agricultural land and pastures.
In terms of the cumulative soil fraction of the textural classes, silty clay had the largest value, followed by silt loam and silty clay loam (Figure 7a). The cumulative soil fraction of the sandy loam class was the lowest. Based on the cumulative soil fraction, it seems that soils with a greater number of fine particles, such as clays and fine silts, tend to have the greatest fractions. The higher clay content in woodland soils is also suggested by a higher D, as shown in Figure 7b, when compared to farmland, pasture, and slope-farming soils. It is also significant to mention that on the other hand, woodland soils had higher clay and lower sand contents than soils from other land uses, indicating that woodlands are less prone to land degradation compared to other land uses. Slope farming, with a high risk of clay loss due to water erosion, had the lowest cumulative fraction. The results demonstrate that if woodland soils have a higher clay content, then D would also be higher, whereas if there is a higher sand content, then D would be lower. The findings of this study are consistent with the results from the studies of Song et al. [35], Deng et al. [8], and Tahmoures et al. [5].
As a result of rill and inter-rill erosive factors on agricultural land, it is often the clay content that accounts for the larger proportion of the soil loss [36]. The value of D decreased with decreasing clay content, which is an indication of severe soil erosion. This suggests that, in some cases, the D is a reliable indicator of soil erosion, particularly surface soil loss. There is evidence to suggest that D can be considered as an index of soil erosion, within a certain range of values. Additionally, the woodland soils were mostly classified as silty clay and silty clay loam, which are fine-textured soil classes (Figure 2). Based on these results, clay can be seen to influence the D value, which is also affected by the maximum number of particles. Similar findings have been reported in China by Li et al. [17], Su et al. [15], and Tahmoures et al. [5]. The planting approaches and heat flow contribute to humus formation in agricultural lands by varying fertilization applications and vegetative residuals, resulting in a decrease in clay particles and a change in soil particle distribution [8,37].
As already mentioned, SOM is characterized by a large surface area that has the potential to hold finer particles on the surface, to prevent soil erosion and increase the D. Soil organic matter is an indicator of soil quality that provides an indication of soil fertility and soil nutrients, as well as a parameter that can be utilized to assess the impact of different land use on soil quality [7]. Furthermore, land use could be an extremely useful indicator of the value of soils on agricultural lands from a user perspective. A significant increase in finer soil particles (clay and silt) can be observed in arable lands with a higher D, whereas the D was found to be low in slope farming and pasture lands, indicating that farmland is more effective at controlling these fine particles than woodland and pasture lands. The size of soil particles may be able to provide a clue as to how well the soil maintains plant nutrition. Fine particles contain a wide range of nutrients that are essential for plant life. These nutrients are released slowly so that plants can consume them. There is a significant positive relationship between soil OM and D, which suggests that finer soil particles have the ability to promote the binding of soil OM to soil particles, which is an important variable that strongly influences soil quality [17,34].

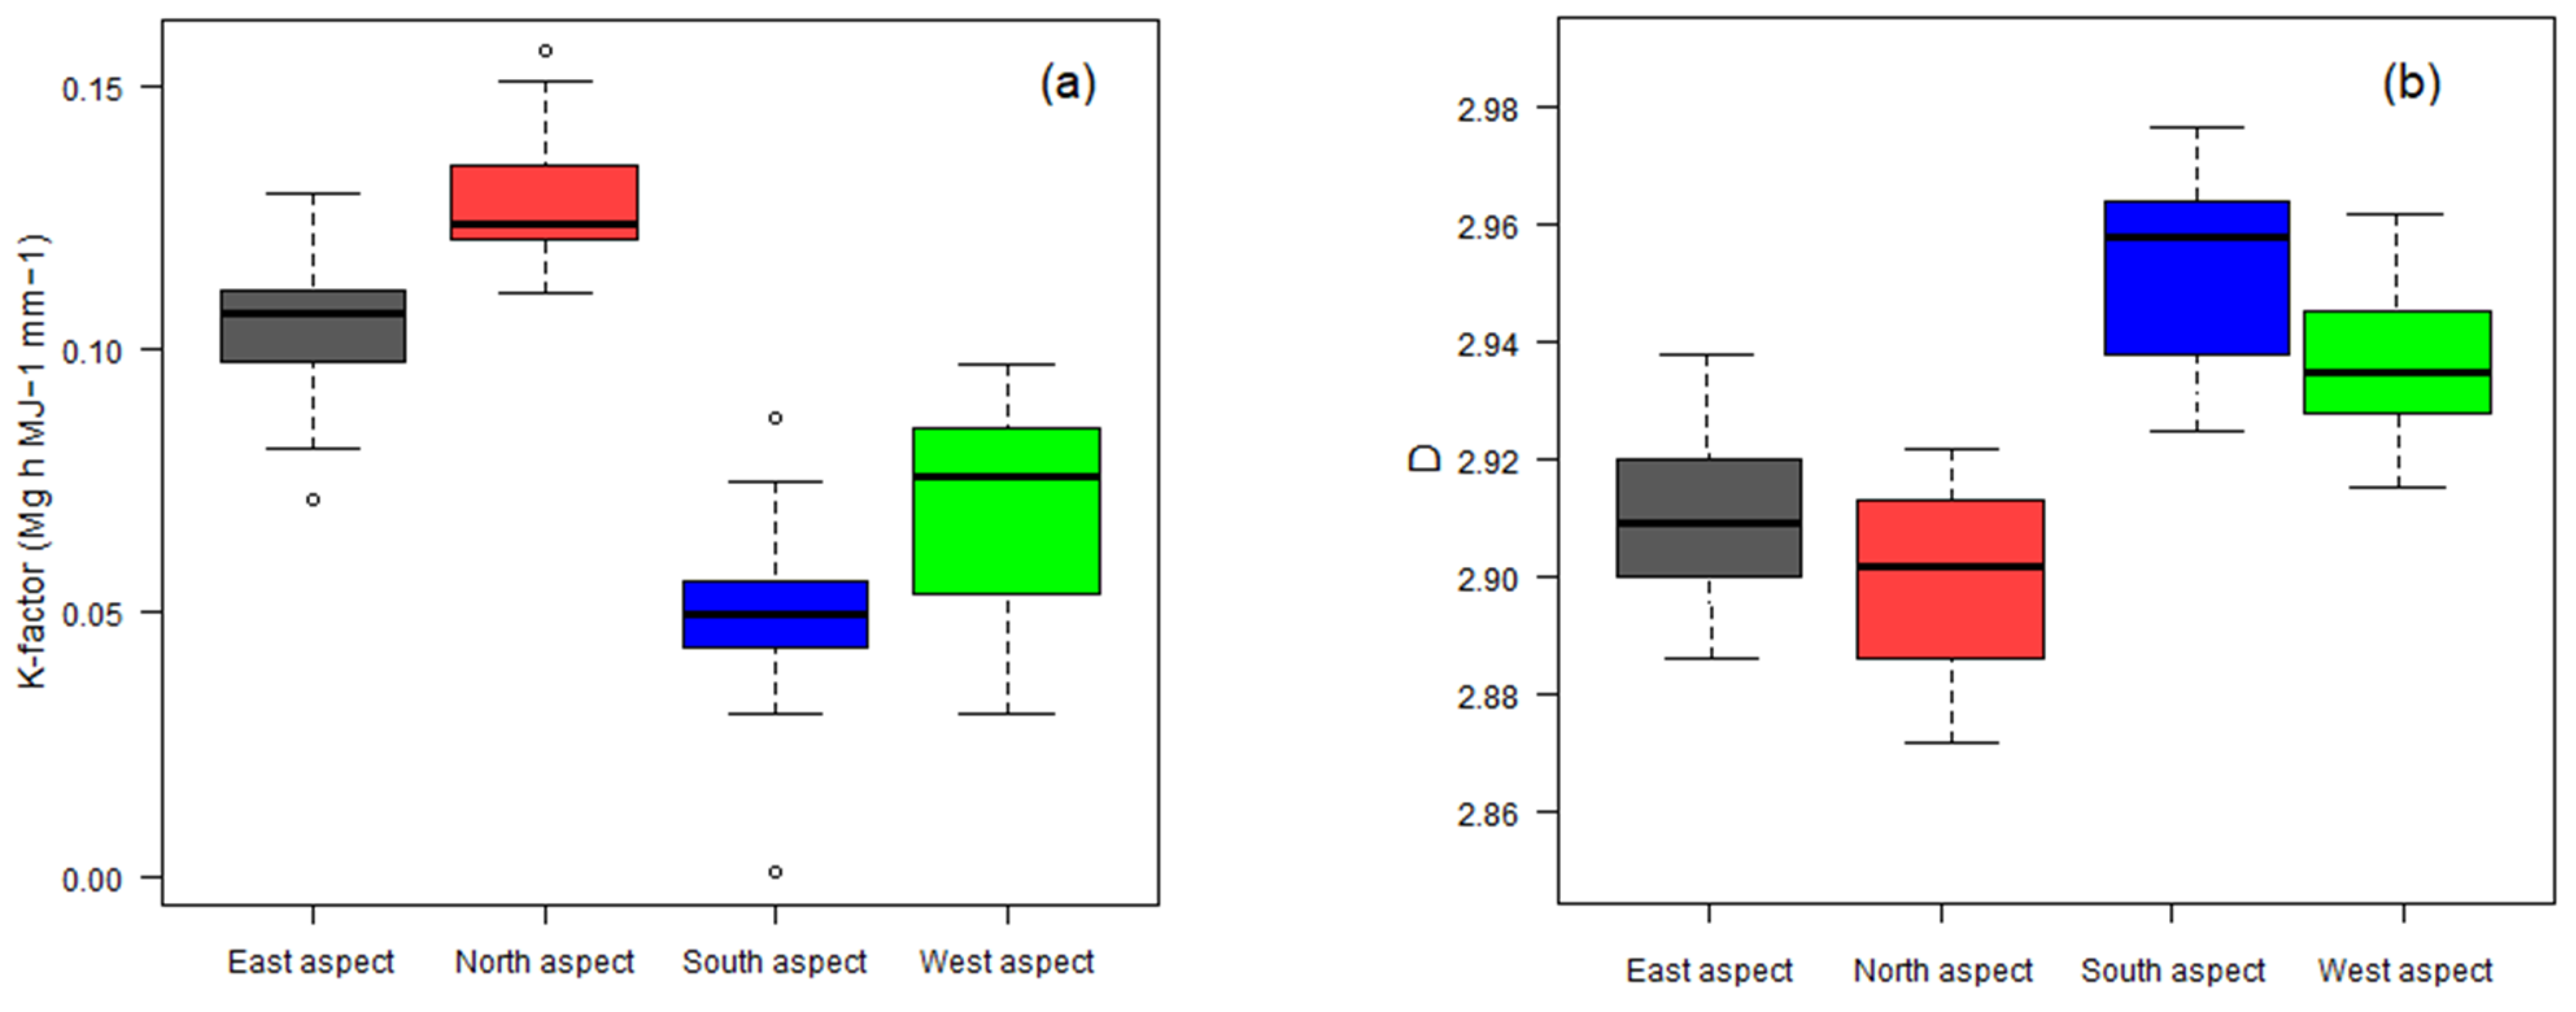
3.3. K-Factor, D and Aspect

Figure 8 shows the D and K-factor values summary for each of the main four aspect slopes. As shown in Figure 8, the north aspect (south-facing aspect) had the highest K-factor (0.156 Mg h MJ−1 mm−1) and the lowest D value compared to other aspects. In contrast, the south aspect (north-facing aspect) has the lowest K-factor and the highest D value among the aspects. Generally, soils in the south and west aspects on average had a higher soil water content than north and east aspects which can decrease soil temperature, consequently decreasing soil microbial activities, resulting in a decrease in soil organic matter decomposition and an enhanced soil aggregate size and stability [38]. In addition, the vegetation intensity increased from the north aspects to the south aspects. The differences in the land cover might be related to SOC distribution patterns along the different aspects. It is important to note that changes in soil properties and crop growth can also occur on slopes that are long and gentle due to the spatial heterogeneity of soil erosion intensity with slope length. Aspects with lower cover vegetation are more sensitive to erosion and suffered land degradation, which can lead to SOC distribution. Zhu et al. [39] showed that SOC content increased from south aspects to north aspects at each soil depth along the soil depth. The topographic aspect leads to differences in micro-climate and intensity of vegetation and community, which induces significant variation in SOC concentration, soil aggregate stability, and K-factor [36,39]. In this study, the D value was found to be higher in shaded and semi-shaded areas (south and west aspects) when compared with the D value in sunny areas (north and east aspects), which is in the line with the results reported by Yimer et al. [40] and Yu et al. [41]. Sunny slopes retain less soil water content due to being exposed to higher solar radiation and soil evaporation. Hence, plants on these slopes are more likely to be in drought conditions and radiation-resistance, affecting the carbon fluxes and dynamics [4,42], resulting in a decrease in robust soil aggregates and a potentially increased risk of clay loss (decreased D value). As far as soil erosion is concerned, slope is a crucially important factor to consider. The soils on steep slopes are shallow and have low SOM.

4. Conclusions

This study investigated how land use and topographic aspect impacted the fractal dimension (D) of soil particle size distributions (PSD) and soil erodibility factors (K-factor) across a watershed in western Iran. There was a significant correlation of 0.52 between D and clay content in our study, followed by a correlation of −0.29 for sand content and a correlation of 0.36 for CEC, which shows that clay particles with a higher specific surface area have the highest impact on the fractal dimension. In addition, soil organic matter (SOM) was found to have a significant impact on both soil erodibility factor and soil particle size distribution (PSD), as it affects the size and stability of soil aggregates, and consequently, the fractal dimension (D) of the soil. Additionally, the results showed that woodlands, which had the largest amount of SOM, also had the highest D values (D = 2.951) when compared to other types of land use. This shows that the woodland soils have higher clay and finer particles content when compared to other land uses, indicating lower soil loss and land degradation for this land use. As revealed in the study, the slope farmlands with the lowest SOM content had the highest K-factor (0.156 Mg h MJ−1 mm−1) as well as the lowest D, which indicated that these land uses were exposed to a high degree of land degradation over time. Based on the results, it is concluded that soil particles, particularly fine particles, are significantly affected by land use; the woodlands with the lowest disturbance level and the highest organic matter (OM) showed the highest D as well as the lowest degree of land degradation as compared with other types of land use. It is also worth mentioning that soils under shady aspects (south aspects) had a lower soil erodibility factor (0.02 Mg h MJ−1 mm−1) and a higher D (2.951), indicating a lower risk of soil erosion. This could be due to the fact that soils in south aspects are exposed to less solar radiation and have higher soil moisture content and fewer microbial activities, resulting in increased soil aggregate stability and a decreased soil erodibility factor.

Author Contributions

Conceptualization, F.H., N.M., M.S. and Y.O.; methodology, F.H., N.M., M.S. and Y.O.; software, Y.O. and N.M.; validation, F.H., N.M., M.S., B.I. and Y.O.; formal analysis F.H., N.M. and M.S.; investigation, F.H., N.M., M.S., Y.O. and B.I.; resources, N.M. and M.S.; data curation, N.M. and M.S.; writing—original draft preparation, F.H., N.M., M.S. and Y.O.; writing—review and editing, Y.O. and B.I.; visualization, F.H., N.M., M.S., B.I. and Y.O.; supervision, Y.O. and F.H.; project administration, N.M. and M.S. All authors have read and agreed to the published version of the manuscript.

Funding

This research received no external funding.

Institutional Review Board Statement

Not applicable.

Informed Consent Statement

Not applicable.

Data Availability Statement

Not applicable.

Conflicts of Interest

The authors declare no conflict of interest.

References

  1. Mirzaee, S.; Ghorbani-Dashtaki, S.; Kerry, R. Comparison of a Spatial, Spatial and Hybrid Methods for Predicting Inter-Rill and Rill Soil Sensitivity to Erosion at the Field Scale. Catena 2020, 188, 104439. [Google Scholar] [CrossRef]
  2. Mirzaee, S.; Ghorbani-Dashtaki, S.; Mohammadi, J.; Asadi, H.; Asadzadeh, F. Spatial Variability of Soil Organic Matter Using Remote Sensing Data. Catena 2016, 145, 118–127. [Google Scholar] [CrossRef]
  3. Salehi-Varnousfaderani, B.; Honarbakhsh, A.; Tahmoures, M.; Akbari, M. Soil Erodibility Prediction by Vis-NIR Spectra and Environmental Covariates Coupled with GIS, Regression and PLSR in a Watershed Scale, Iran. Geoderma Reg. 2022, 28, e00470. [Google Scholar] [CrossRef]
  4. Panagos, P.; Meusburger, K.; Alewell, C.; Montanarella, L. Soil Erodibility Estimation Using LUCAS Point Survey Data of Europe. Environ. Model. Softw. 2012, 30, 143–145. [Google Scholar] [CrossRef]
  5. Tahmoures, M.; Honarbakhsh, A.; Afzali, S.F.; Abotaleb, M.; Ingram, B.; Ostovari, Y. Fractal Features of Soil Particles as an Indicator of Land Degradation under Different Types of Land Use at the Watershed Scale in Southern Iran. Land 2022, 11, 2093. [Google Scholar] [CrossRef]
  6. Mohammadi, M.; Shabanpour, M.; Mohammadi, M.H.; Davatgar, N. Characterizing Spatial Variability of Soil Textural Fractions and Fractal Parameters Derived from Particle Size Distributions. Pedosphere 2019, 29, 224–234. [Google Scholar] [CrossRef]
  7. Peng, G.; Xiang, N.; Lv, S.; Zhang, G. Fractal Characterization of Soil Particle-Size Distribution under Different Land-Use Patterns in the Yellow River Delta Wetland in China. J. Soils Sediments 2014, 14, 1116–1122. [Google Scholar] [CrossRef]
  8. Deng, Y.; Cai, C.; Xia, D.; Ding, S.; Chen, J. Fractal Features of Soil Particle Size Distribution under Different Land-Use Patterns in the Alluvial Fans of Collapsing Gullies in the Hilly Granitic Region of Southern China. PLoS ONE 2017, 12, e0173555. [Google Scholar] [CrossRef] [Green Version]
  9. Zhao, W.; Cui, Z.; Ma, H. Fractal Features of Soil Particle-Size Distributions and Their Relationships with Soil Properties in Gravel-Mulched Fields. Arab. J. Geosci. 2017, 10, 211. [Google Scholar] [CrossRef]
  10. Wang, X.; Li, M.-H.; Liu, S.; Liu, G. Fractal characteristics of soils under different land-use patterns in the arid and semiarid regions of the Tibetan Plateau, China. Geoderma 2006, 134, 56–61. [Google Scholar] [CrossRef]
  11. Tyler, S.W.; Wheatcraft, S.W. Fractal Scaling of Soil Particle-Size Distributions: Analysis and Limitations. Soil Sci. Soc. Am. J. 1992, 56, 362–369. [Google Scholar] [CrossRef]
  12. Mahdi, C.M.; Dahmardeh Ghaleno, M.R. Evaluating Fractal Dimension of the Soil Particle Size Distributions and Soil Water Retention Curve Obtained from Soil Texture Components. Arch. Agron. Soil Sci. 2020, 66, 1668–1678. [Google Scholar] [CrossRef]
  13. Omidvar, E. Fractal Analysis of the Infiltration Curve and Soil Particle Size in a Semi-Humid Watershed. Eur. J. Soil Sci. 2021, 72, 1373–1394. [Google Scholar] [CrossRef]
  14. Fu, H.; Pei, S.; Wan, C.; Sosebee, R.E. Fractal Dimension of Soil Particle Size Distribution Along an Altitudinal Gradient in the Alxa Rangeland, Western Inner Mongolia. Arid Land Res. Manag. 2009, 23, 137–151. [Google Scholar] [CrossRef]
  15. Su, Y.Z.; Zhao, H.L.; Zhao, W.Z.; Zhang, T.H. Fractal Features of Soil Particle Size Distribution and the Implication for Indicating Desertification. Geoderma 2004, 122, 43–49. [Google Scholar] [CrossRef]
  16. Li, Z.; Wang, Z. Experimental Study on the Relation between the Fractal Characteristics and Solute Transport Parameters of Sandy Soil. J. Soils Sediments 2020, 20, 3181–3191. [Google Scholar] [CrossRef]
  17. Li, K.; Yang, H.; Han, X.; Xue, L.; Lv, Y.; Li, J.; Fu, Z.; Li, C.; Shen, W.; Guo, H.; et al. Fractal Features of Soil Particle Size Distributions and Their Potential as an Indicator of Robinia Pseudoacacia Invasion1. Sci. Rep. 2018, 8, 7075. [Google Scholar] [CrossRef] [Green Version]
  18. Zhang, H.; Xie, J.; Han, J.; Nan, H.; Guo, Z. Response of Fractal Analysis to Soil Quality Succession in Long-Term Compound Soil Improvement of Mu Us Sandy Land, China. Math. Probl. Eng. 2020, 2020, e5463107. [Google Scholar] [CrossRef]
  19. Bai, Y.; Qin, Y.; Lu, X.; Zhang, J.; Chen, G.; Li, X. Fractal Dimension of Particle-Size Distribution and Their Relationships with Alkalinity Properties of Soils in the Western Songnen Plain, China. Sci. Rep. 2020, 10, 20603. [Google Scholar] [CrossRef] [PubMed]
  20. Qi, F.; Zhang, R.; Liu, X.; Niu, Y.; Zhang, H.; Li, H.; Li, J.; Wang, B.; Zhang, G. Soil Particle Size Distribution Characteristics of Different Land-Use Types in the Funiu Mountainous Region. Soil Tillage Res. 2018, 184, 45–51. [Google Scholar] [CrossRef]
  21. Nelson, D.W.; Sommers, L.E. Total Carbon, Organic Carbon, and Organic Matter. In Methods of Soil Analysis; John Wiley & Sons, Ltd.: New York, NY, USA, 2018; pp. 961–1010. ISBN 978-0-89118-977-0. [Google Scholar]
  22. Gee, G.W.; Bauder, J.W. Particle-Size Analysis. In Methods of Soil Analysis; John Wiley & Sons, Ltd.: New York, NY, USA, 1986; pp. 383–411. ISBN 978-0-89118-864-3. [Google Scholar]
  23. Ostovari, Y.; Ghorbani-Dashtaki, S.; Bahrami, H.-A.; Abbasi, M.; Dematte, J.A.M.; Arthur, E.; Panagos, P. Towards Prediction of Soil Erodibility, SOM and CaCO3 Using Laboratory Vis-NIR Spectra: A Case Study in a Semi-Arid Region of Iran. Geoderma 2018, 314, 102–112. [Google Scholar] [CrossRef]
  24. Vaezi, A.R.; Sadeghi, S.H.R.; Bahrami, H.A.; Mahdian, M.H. Modeling the USLE K-Factor for Calcareous Soils in Northwestern Iran. Geomorphology 2008, 97, 414–423. [Google Scholar] [CrossRef]
  25. U.S. Geological Survey. USGS 01646500 Potomac River near Wash, DC Little Falls Pump Sta. In USGS Water Data for the Nation: U.S. Geological Survey National Water Information System Database; 2020. Available online: https://waterdata.usgs.gov/nwis (accessed on 12 January 2020). [CrossRef]
  26. Bonilla, C.A.; Johnson, O.I. Soil Erodibility Mapping and Its Correlation with Soil Properties in Central Chile. Geoderma 2012, 189–190, 116–123. [Google Scholar] [CrossRef]
  27. Addis, H.K.; Klik, A. Predicting the Spatial Distribution of Soil Erodibility Factor Using USLE Nomograph in an Agricultural Watershed, Ethiopia. Int. Soil Water Conserv. Res. 2015, 3, 282–290. [Google Scholar] [CrossRef] [Green Version]
  28. Ostovari, Y.; Ghorbani-Dashtaki, S.; Bahrami, H.-A.; Naderi, M.; Dematte, J.A.M.; Kerry, R. Modification of the USLE K Factor for Soil Erodibility Assessment on Calcareous Soils in Iran. Geomorphology 2016, 273, 385–395. [Google Scholar] [CrossRef]
  29. Ostovari, Y.; Ghorbani-Dashtaki, S.; Kumar, L.; Shabani, F. Soil Erodibility and Its Prediction in Semi-Arid Regions. Arch. Agron. Soil Sci. 2019, 65, 1688–1703. [Google Scholar] [CrossRef]
  30. Ostovari, Y.; Moosavi, A.A.; Pourghasemi, H.R. Soil Loss Tolerance in Calcareous Soils of a Semiarid Region: Evaluation, Prediction, and Influential Parameters. Land Degrad. Dev. 2020, 31, 2156–2167. [Google Scholar] [CrossRef]
  31. Li, J.; Sang, C.; Yang, J.; Qu, L.; Xia, Z.; Sun, H.; Jiang, P.; Wang, X.; He, H.; Wang, C. Stoichiometric Imbalance and Microbial Community Regulate Microbial Elements Use Efficiencies under Nitrogen Addition. Soil Biol. Biochem. 2021, 156, 108207. [Google Scholar] [CrossRef]
  32. Paz-Ferreiro, J.; Vázquez, E.V.; Miranda, J.G.V. Assessing Soil Particle-Size Distribution on Experimental Plots with Similar Texture under Different Management Systems Using Multifractal Parameters. Geoderma 2010, 160, 47–56. [Google Scholar] [CrossRef]
  33. Jiang, Q.; Chen, Y.; Hu, J.; Liu, F. Use of Visible and Near-Infrared Reflectance Spectroscopy Models to Determine Soil Erodibility Factor (K) in an Ecologically Restored Watershed. Remote Sens. 2020, 12, 3103. [Google Scholar] [CrossRef]
  34. Liu, Y.; Gong, Y.; Wang, X.; Hu, Y. Volume Fractal Dimension of Soil Particles and Relationships with Soil Physical-Chemical Properties and Plant Species Diversity in an Alpine Grassland under Different Disturbance Degrees. J. Arid Land 2013, 5, 480–487. [Google Scholar] [CrossRef] [Green Version]
  35. Song, Z.; Zhang, C.; Liu, G.; Qu, D.; Xue, S. Fractal Feature of Particle-Size Distribution in the Rhizospheres and Bulk Soils during Natural Recovery on the Loess Plateau, China. PLoS ONE 2015, 10, e0138057. [Google Scholar] [CrossRef]
  36. Che, M.; Gong, Y.; Xu, M.; Kang, C.; Lv, C.; He, S.; Zheng, J. Effects of Elevation and Slope Aspect on the Distribution of the Soil Organic Carbon Associated with Al and Fe Mineral Phases in Alpine Shrub–Meadow Soil. Sci. Total Environ. 2021, 753, 141933. [Google Scholar] [CrossRef] [PubMed]
  37. Chen, W.; Chang, H.; Liu, R. Fractal Features of Soil Particle Size Distributions and Their Implications for Indicating Enclosure Management in a Semiarid Grassland Ecosystem. Pol. J. Ecol. 2020, 68, 132–144. [Google Scholar] [CrossRef]
  38. Xue, R.; Yang, Q.; Miao, F.; Wang, X.; Shen, Y.; Xue, R.; Yang, Q.; Miao, F.; Wang, X.; Shen, Y. Slope Aspect Influences Plant Biomass, Soil Properties and Microbial Composition in Alpine Meadow on the Qinghai-Tibetan Plateau. J. Soil Sci. Plant Nutr. 2018, 18, 1–12. [Google Scholar] [CrossRef] [Green Version]
  39. Zhu, M.; Feng, Q.; Qin, Y.; Cao, J.; Li, H.; Zhao, Y. Soil Organic Carbon as Functions of Slope Aspects and Soil Depths in a Semiarid Alpine Region of Northwest China. CATENA 2017, 152, 94–102. [Google Scholar] [CrossRef]
  40. Yimer, F.; Ledin, S.; Abdelkadir, A. Soil Organic Carbon and Total Nitrogen Stocks as Affected by Topographic Aspect and Vegetation in the Bale Mountains, Ethiopia. Geoderma 2006, 135, 335–344. [Google Scholar] [CrossRef]
  41. Yu, H.; Zha, T.; Zhang, X.; Nie, L.; Ma, L.; Pan, Y. Spatial Distribution of Soil Organic Carbon May Be Predominantly Regulated by Topography in a Small Revegetated Watershed. CATENA 2020, 188, 104459. [Google Scholar] [CrossRef]
  42. Mozaffari, H.; Moosavi, A.A.; Ostovari, Y.; Cornelis, W. Comparing visible-near-infrared spectroscopy with classical regression pedotransfer functions for predicting near-saturated and saturated hydraulic conductivity of calcareous soils. J. Hydrol. 2022, 613 Pt A, 128412. [Google Scholar] [CrossRef]
Figure 1. Location of the study area and collected soil samples.
Land 12 00615 g001
Figure 2. Maps of the (a) elevation, (b) slope, and (c) aspect of the study area.
Land 12 00615 g002
Figure 3. Textural composition of studied soils (USDA texture classification).
Land 12 00615 g003
Figure 4. Pearson correlation coefficient (r) between D, K-factor, and soil properties.
Land 12 00615 g004
Figure 5. Relationship between D and (a) %clay, (b) %sand, (c) %silt, (d) CEC, (e) SOM, and (f) CaCO3 (n = 113).
Land 12 00615 g005
Figure 6. Summary box plots of (a) K-factor and (b) D, under different land-use (n = 113).
Land 12 00615 g006
Figure 7. Log–log plots of (a) particle size distributions of soil samples based on soil class (b) and land use.
Land 12 00615 g007
Figure 8. Summary box plots of (a) K-factor and (b) D, under different aspects (n = 113).
Land 12 00615 g008
Table 1. Soil property summary statistics (n = 120).
Land UsePropertyUnitMeanMinimumMaximumStd.Dev.Coef.Var.
FarmlandpH-7.767.358.350.243.11
SOM%1.340.234.381.0437.31
CECMeq/100 g24.8316.2443.306.7827.29
CaCO3%23.823.5162.2712.2521.42
Sand%26.064.5867.3215.7213.33
Clay%21.018.0648.369.1843.70
Silt%52.8921.6073.4112.1723.01
D-2.902.862.950.020.80
K-factorMg h MJ−1 mm−10.100.070.140.0215.12
Slope farmingpH-7.837.358.480.303.86
SOM%1.680.283.961.0432.12
CECMeq/100 g30.6015.3043.697.6525.02
CaCO3%32.023.5162.2713.9043.42
Sand%21.442.5067.3217.2630.52
Clay%25.5110.0850.3812.0147.08
Silt%53.0421.4073.4113.8126.04
D-2.912.862.980.031.06
K-factorMg h MJ−1 mm−10.120.080.150.0110.94
RangelandpH-7.677.208.100.243.17
SOM%1.540.564.340.7528.83
CECMeq/100 g25.0817.5338.004.2717.01
CaCO3%23.261.0367.4316.3032.07
Sand%11.131.8236.969.0531.31
Clay%28.9815.1141.316.8423.60
Silt%59.8936.8477.298.3713.98
D-2.912.882.950.020.57
K-factorMg h MJ−1 mm−10.080.030.110.0227.37
WoodlandpH-7.507.087.900.222.92
SOM%1.980.763.730.6934.56
CECMeq/100 g33.6722.2252.008.9926.70
CaCO3%19.932.0867.4316.5132.86
Sand%11.232.9836.966.6629.36
Clay%35.2819.1446.356.7819.21
Silt%53.5036.8471.327.9314.82
D-2.932.882.990.030.92
K-factorMg h MJ−1 mm−10.070.020.110.0225.29
Disclaimer/Publisher’s Note: The statements, opinions and data contained in all publications are solely those of the individual author(s) and contributor(s) and not of MDPI and/or the editor(s). MDPI and/or the editor(s) disclaim responsibility for any injury to people or property resulting from any ideas, methods, instructions or products referred to in the content.

