Article

Drivers of Degradation of Croplands and Abandoned Lands: A Case Study of Macubeni Communal Land in the Eastern Cape, South Africa

by
Silindile Sibiya
1,*,
Jai Kumar Clifford-Holmes
2 and
James Gambiza
1
1
Department of Environmental Science, Rhodes University, Grahamstown 6139, South Africa
2
Institute for Water Research (IWR), Rhodes University, Makhanda 6139, South Africa
*
Author to whom correspondence should be addressed.
Land 2023, 12(3), 606; https://doi.org/10.3390/land12030606
Submission received: 9 December 2022 / Revised: 27 January 2023 / Accepted: 6 February 2023 / Published: 3 March 2023

Abstract

:
Soil erosion is a global environmental problem and a pervasive form of land degradation that threatens land productivity and food and water security. Some of the biggest sources of sediment in catchments are cultivated and abandoned lands. However, the abandonment of cultivated fields is not well-researched. Our study assesses the level of degradation in cultivated and abandoned lands using a case study in South Africa. We answer three main questions: (1) What is the extent of crop field degradation on used, partly used, and abandoned fields? (2) What are the drivers of field abandonment in relation to land degradation? (3) Can proposed sustainable land management interventions tackle the dynamics of land abandonment and associated degradation? To answer these questions, cultivated and abandoned lands were mapped in a pilot catchment with ArcGIS tools and assigned severity codes and classified according to status, degradation, and encroachment. Systems diagrams were developed to show the interactions between agricultural land use and the level of degradation and leverage points in the system, with interventions assessed via a multi-criteria analysis. The results revealed that 37% of the total mapped area of croplands in the pilot site was abandoned and 20% of those lands were highly degraded. We argue that the innovative application of systems thinking through causal loop diagrams (CLDs) and leverage point analysis, combined with spatial and multi-criteria analyses, can assist with planning SLM interventions in similar contexts in the developing world.

1. Introduction

Degradation in the form of soil erosion is a major environmental problem globally [1,2]. Although it is a natural process, it is often exacerbated by human activities such as intensive agricultural practices that lack conservation techniques, e.g., inappropriate cultivation and overgrazing [3,4]. Hence, 52% of the world’s agricultural land is moderately to severely degraded [1]. The African continent is considered the most vulnerable and severely affected by land degradation, with desertification threatening over 45% of the region [5]. Most degradation in Africa occurs on agricultural lands, with a ruinous effect on food security for a large portion of the population [5].
Most croplands contribute to land degradation in the form of soil erosion that differs in severity according to whether they are currently being used or abandoned [6]. With the exception of a zero tillage technique, the soil is disturbed during cultivation and remains that way for a long time even after all agricultural activities have been halted. Therefore, the sediment yield often increases, and abandoned lands become erosion hotspots, which increases gully formation [6]. Sedimentation from croplands negatively affects water availability and ecosystem health due to high siltation [7].
The number of abandoned fields has been growing throughout southern Africa [8,9]. Hebinck et al. [10] argue that this is due to the overall strengthening of rural–urban connections, while Shackleton and Luckert [11] attribute it to globalisation and modernisation. Some studies suggest that increasingly diversified household incomes and activities [12] and changes to ‘agrarian’ identities [10] also play a role in increasing the extent of abandoned lands. The range of factors influencing the abandonment of cultivated land illustrates the complexity of the system and thus the utility of systems thinking as a framework for approaching these interconnections.
Although there is a wealth of research on gully systems [4,13,14], little has been done in conjunction with currently or previously cultivated fields. Our study assessed the level of degradation in cultivated and abandoned fields using a case study in South Africa, addressing three main research questions: (1) What is the extent of crop field degradation on used, partly used, and abandoned fields? (2) What are the drivers of field abandonment in relation to land degradation? (3) Can proposed sustainable land management interventions tackle the dynamics of land abandonment and associated degradation?

1.1. Conceptual Framework

In this paper, we apply a systems thinking approach to assess the interconnections and feedbacks [15] between land abandonment, degradation, and sustainable land management. Leverage points are a component of the systems thinking framework to explore the relative strengths and weaknesses of interventions in the system [16]. The methods section later illustrates how qualitative systems modelling [17] was used to describe and analyse the problem and associated interventions, nested inside of a multi-method approach. First, we define land degradation, land abandonment, and leverage points to conceptually frame our study.

1.1.1. Land Degradation

Land degradation is defined as the reduction or loss of land productivity (biological or economic) through habitat patterns or human activities such as soil erosion or long-term loss of natural vegetation [18,19]. Soil erosion is particularly prevalent as a form of land degradation in relation to cultivated lands. The risk of sheet erosion increases on cultivated lands due to the soil structure being disturbed and soil being exposed to the erosive effects of rainfall [3,6]. As water flows across the soil surface, erosional features (such as rills) form [20]. If the erosion persists, the rills develop into gullies [21]. Multiple studies have found that abandoned cultivated lands are both causes and symptoms of land degradation: as gullies form on abandoned fields, the fields become more likely to be permanently abandoned and act as major sources of sediment, increasing the sediment load in the catchment’s water bodies with negative effects on water availability and water quality [22,23]. Land degradation in many parts of the developing world has been associated with a range of factors, including unsustainable agricultural practices, inappropriate fire management, bush encroachment, drought, overgrazing, and ineffective land use planning [24,25].

1.1.2. Land Abandonment

As highlighted by Blair et al. [26], the natural and socio–economic aspects of agricultural activities are interconnected at various scales, which often creates difficulties in defining abandoned lands. For instance, farmlands temporarily cleared or left fallow for short periods due to factors such as drought or a temporary lack of labour may be mischaracterised as abandoned lands [10]. In this study, the term abandoned fields, as defined by Blair et al. [26], refers to a parcel of land on which all crop agricultural activities have ceased. There are various implications of these abandoned fields. From an ecological perspective, they broadly include the alteration of ecosystem services, habitats, biodiversity, hydrological regimes, carbon sequestration, and soil fertility [27]. Moreover, there is a wide range of reasons across countries around the world for the existence of abandoned fields. These include factors such as lack of draught power, rainfall variability and droughts, and cultural and socio–economic shifts such as increasingly modernised youth shifting away from the agrarian lifestyle [26]. Unsustainable and inappropriate agricultural practices also play a role in land abandonment in many countries. In South Africa, unsustainable agricultural practices include inappropriate irrigation, which can raise the water table level and, following evaporation and evapotranspiration, result in soil salinisation, reducing the land productivity [28], and inappropriate cultivation, which disturbs the soil structure, increasing the vulnerability of crop fields to erosion [6]. Poor (or non-existent) grazing management can also result in livestock destroying in-use crop fields and grazing on abandoned lands, resulting in soil compaction and sheet erosion [29]. The range of factors influencing the abandonment of cultivated land further highlights the complexity of the system and thus the need to use a systems thinking approach.

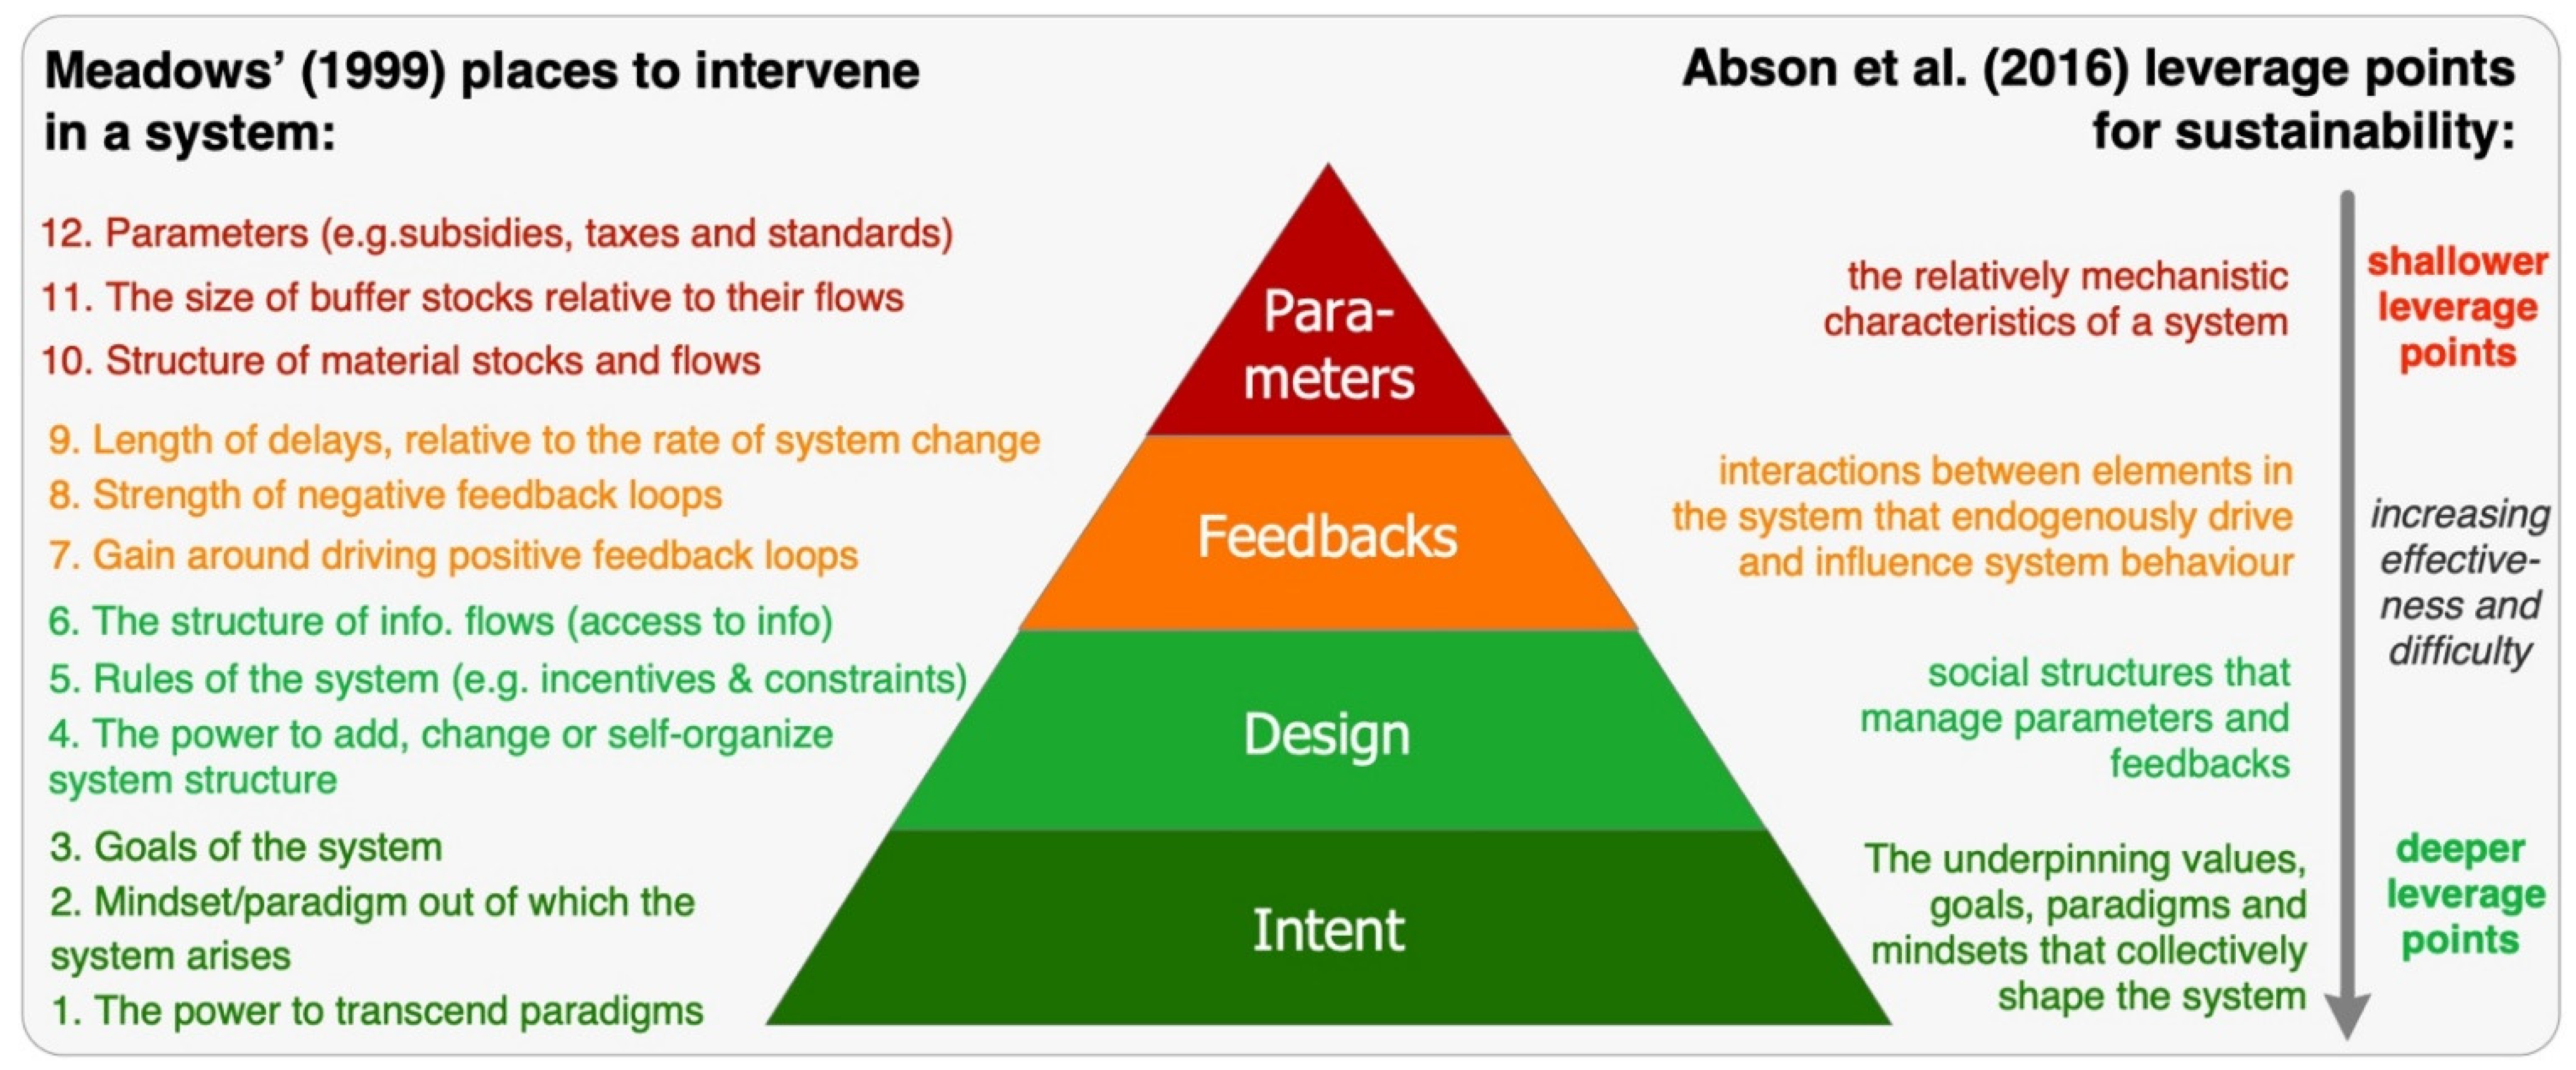
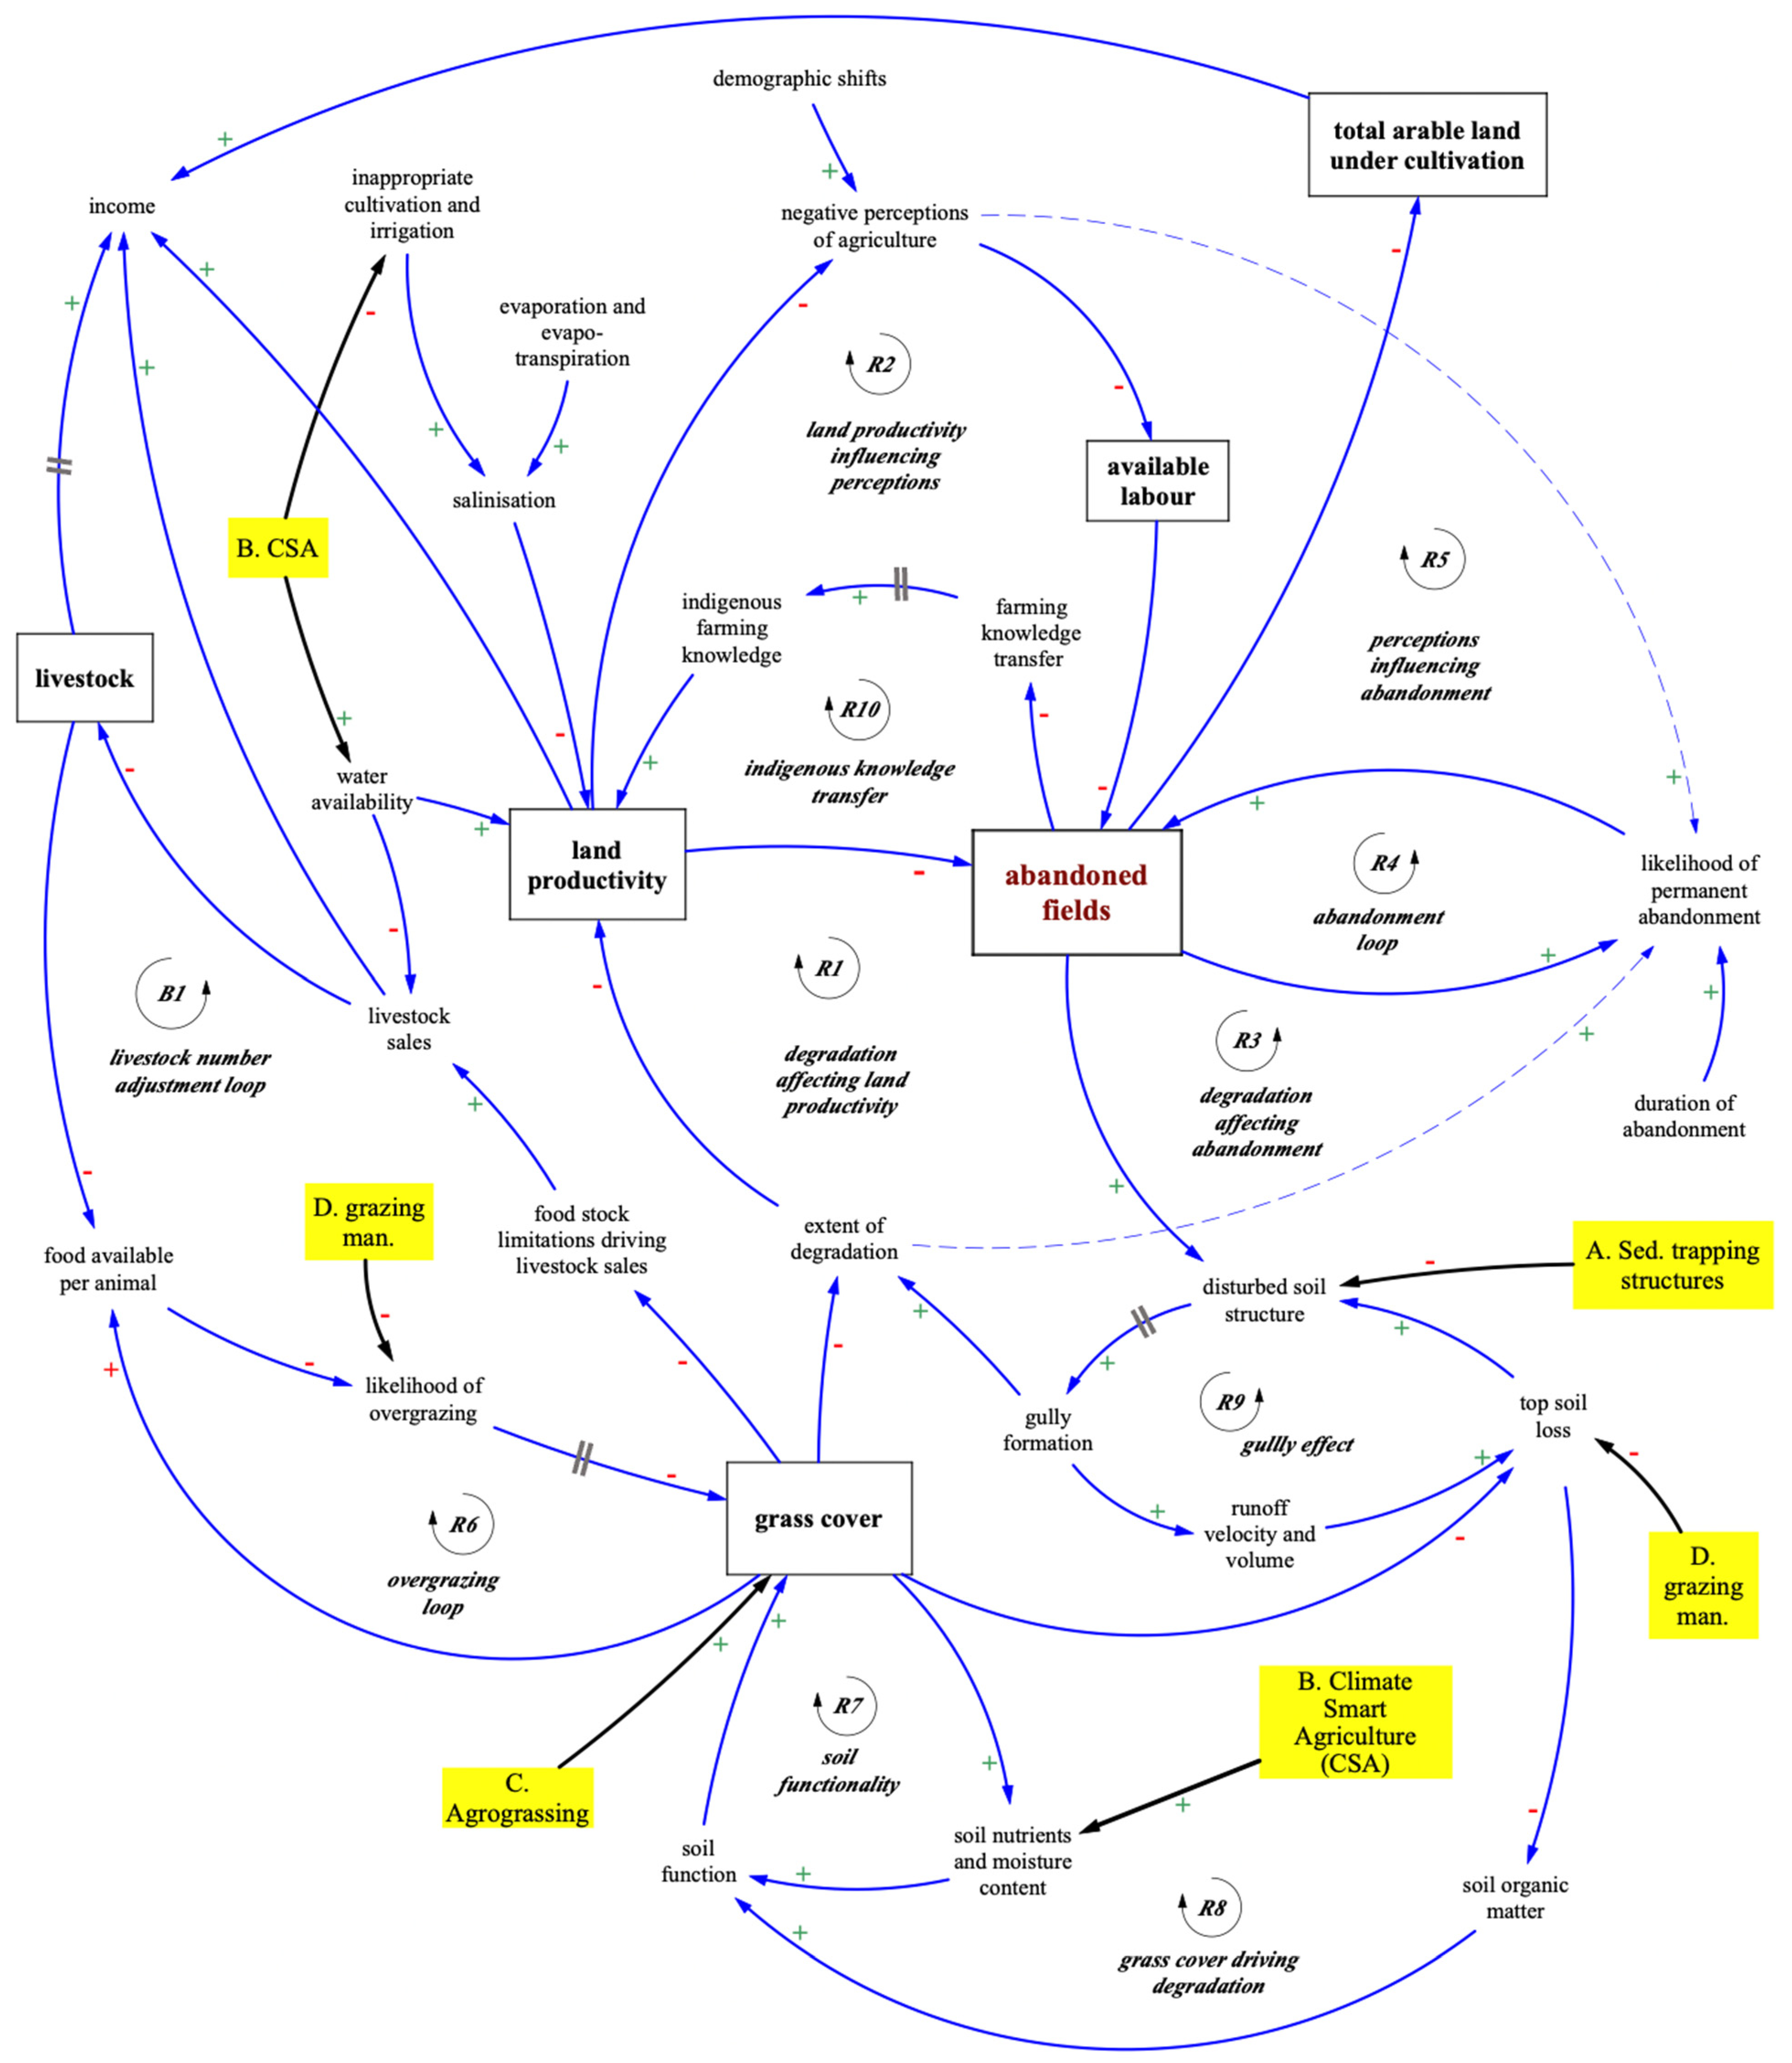
1.1.3. Leverage Points and Interventions

Meadows [16] defined leverage points as places in a complex system where a small change made in a specific part results in a big change in the whole system. Meadows [16] listed 12 places to intervene in a system. The points of lowest leverage are not the least important. However, they are often short-term oriented and least likely to cause a significant long-term change in the system [16]. In essence, higher points of leverage in a system tend to have more impacts on future outcomes than the present because they are vision-based [30]. It is also emphasised in the literature that knowing the root causes of a problem makes it easier to deal with and possibly reverse said problem [31,32]. Therefore, we focused on system drivers of field abandonment, the way in which field abandonment influences degradation more broadly, and whether interventions are capable of tackling the root causes of field abandonment (as per research question 3).
Meadows’ list of leverage points has been adapted over the years by different studies. Drawing from Meadows’ list, Abson et al. [33] argue that sustainability interventions frequently target places in the system that hold low leverage and thus have very limited potential for transformational change. By conceptualizing and analyzing the dynamic interrelationships between system variables and systems thinking, modelling supports the identification of high leverage points in the system that seek to avoid siloes [33]. In this study, we draw from Abson et al. [33] and Meadows’ [16] systems framework for leverage points for sustainability (as summarised in Figure 1).

2. Materials and Methods
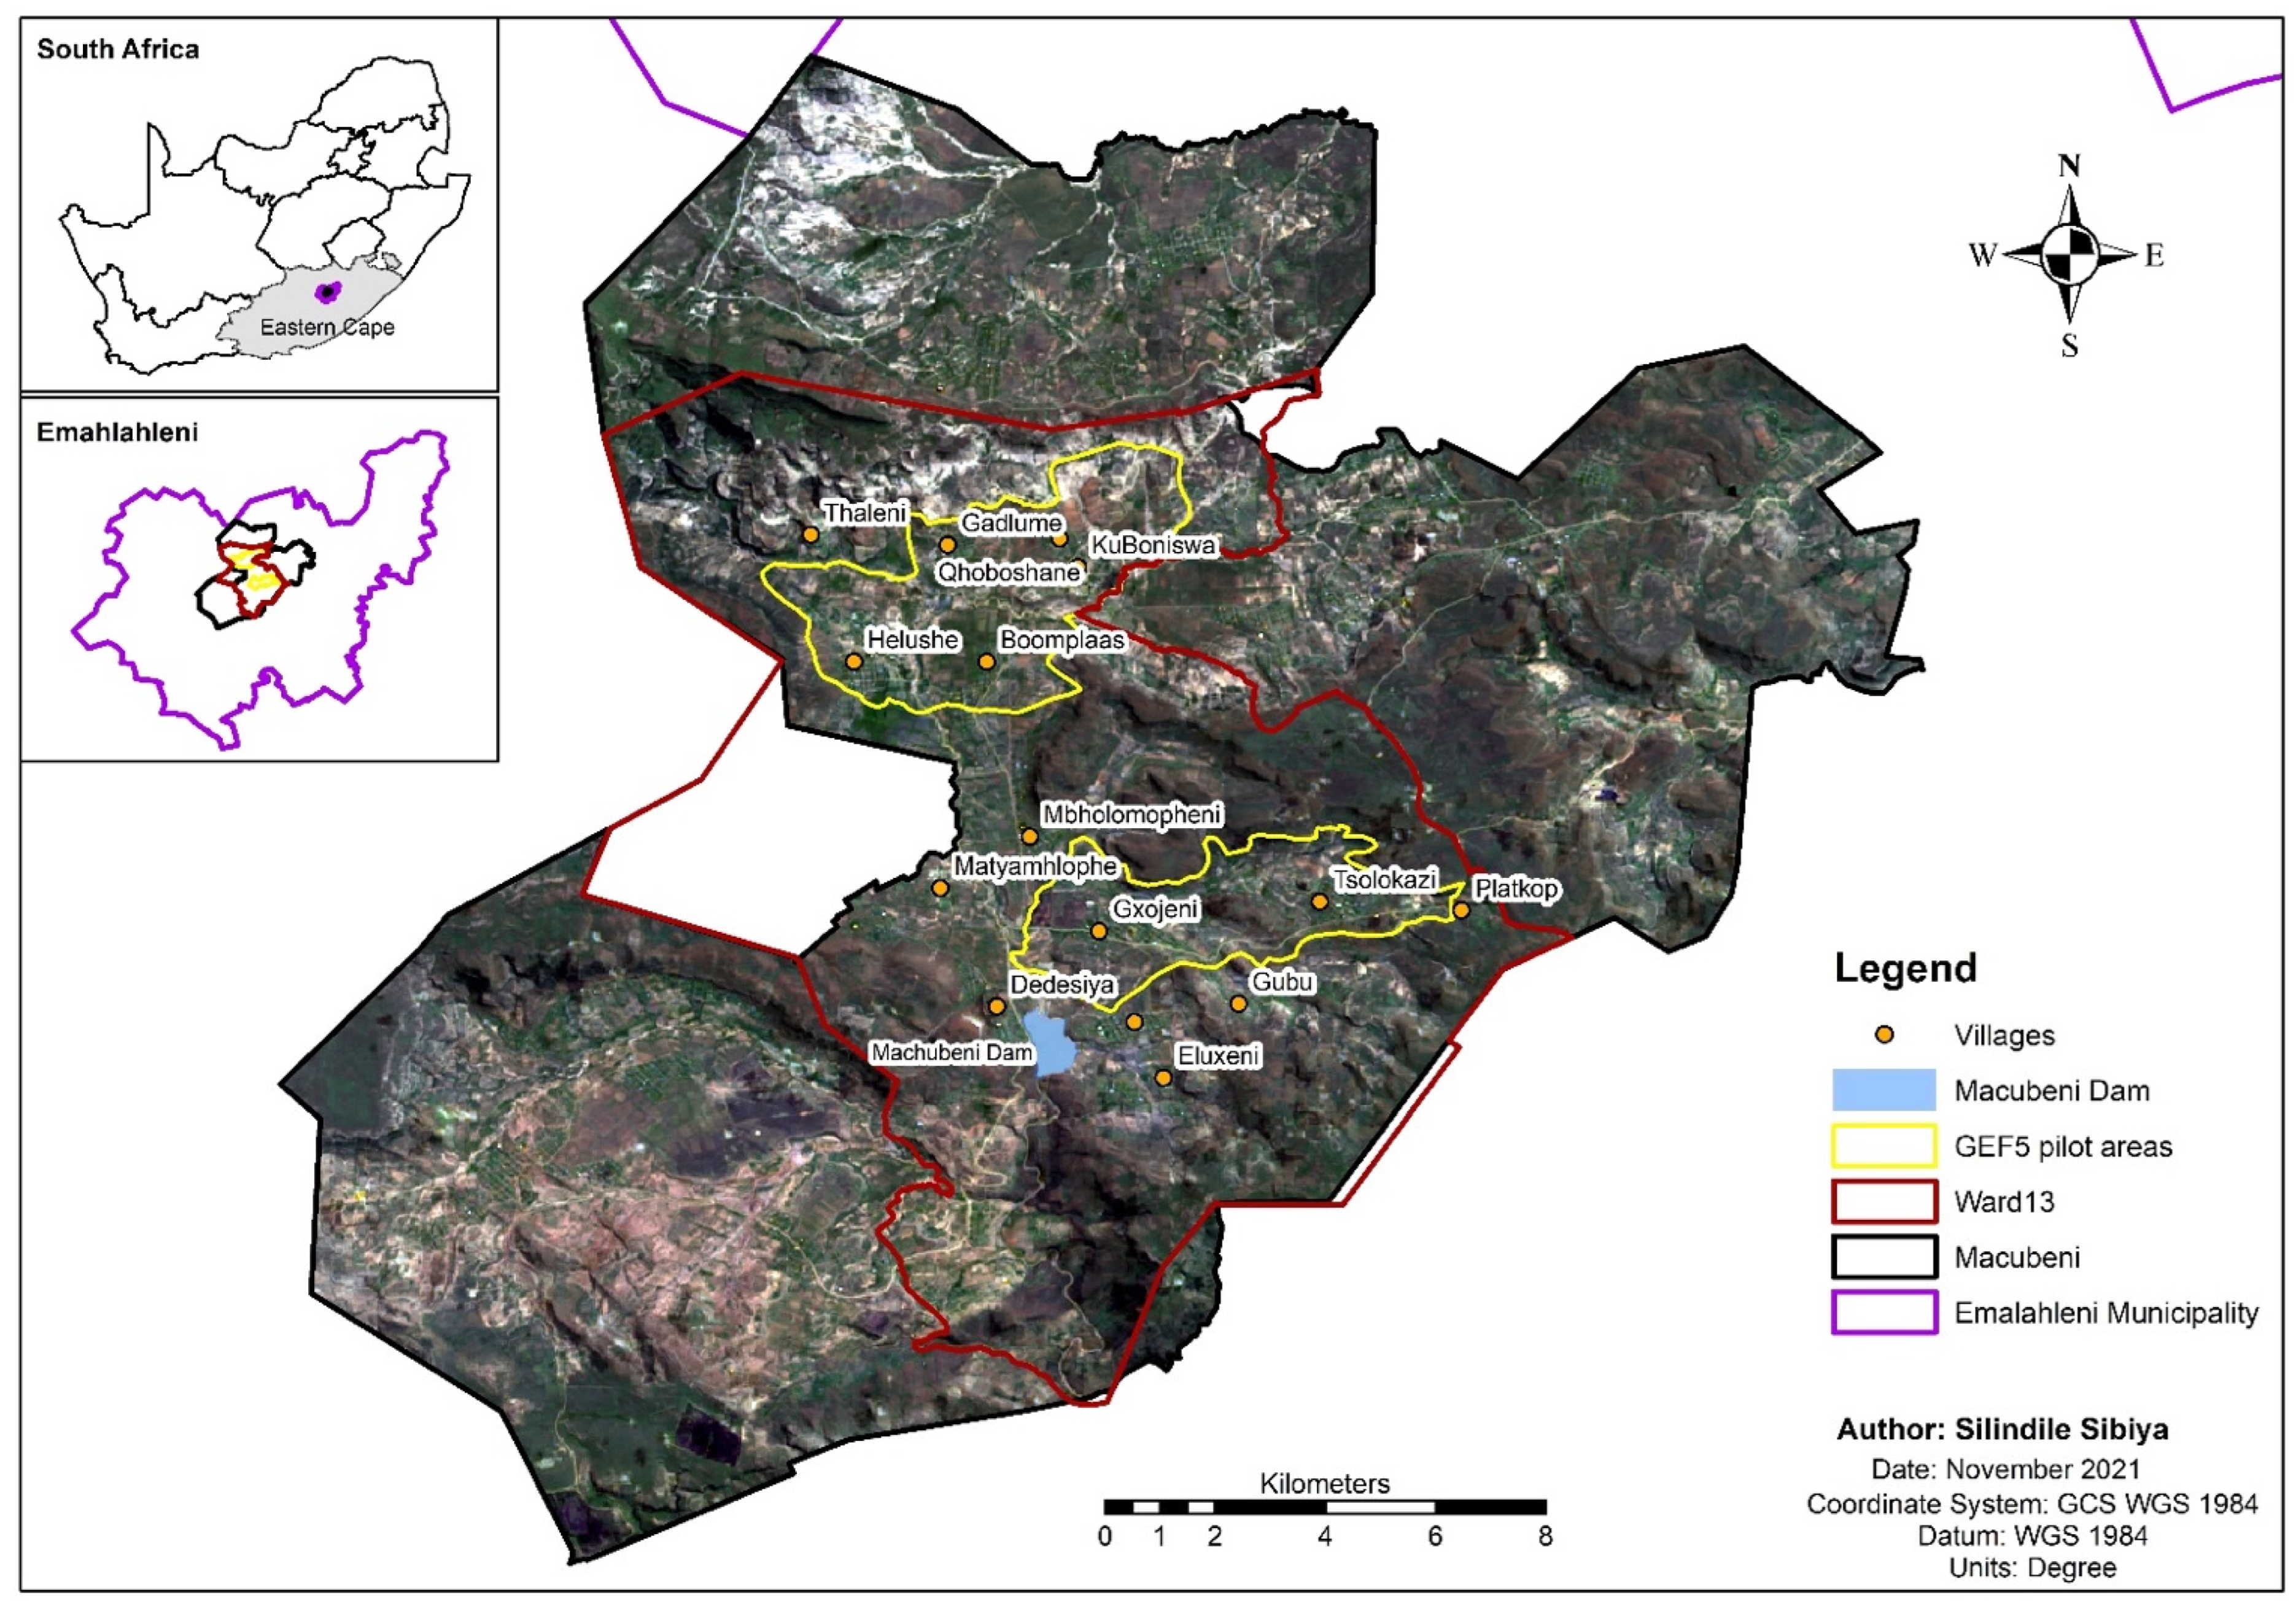
2.1. The Study Area

Macubeni catchment, South Africa, is used as a case study for assessing the level of degradation in croplands and the drivers of land abandonment in relation to degradation. The Macubeni communal land (31°30′53.92″ S; 27°9′53.49″ E) is located within the Emalahleni Local Municipality in the Eastern Cape Province, covering 16,150 ha of land in the upper reaches of the Cacadu River catchment (Figure 2) [34].
The altitude of the hilly and mountainous terrain of Macubeni ranges between 1300 and 2100 m above sea level. Macubeni generally possesses stony and shallow soils [34], which makes it susceptible to erosion.
As a result, it falls within what is considered the most degraded communal lands in the Eastern Cape, and possibly in South Africa as a whole [24]. Gully erosion has been documented to be a major challenge in the Eastern Cape, with the soil erosion rate exceeding 12 t/ha/yr [35] and the eroded soil being deposited into rivers in the catchment, which drives the sedimentation of dams and reduces water availability for downstream stakeholders [24]. This is of particular concern in Macubeni because the Macubeni Dam, which is downstream of many agricultural fields, is the primary water supply source for the town of Cacadu (previously called ‘Lady Frere’) and the surrounding villages. Cacadu is the seat of the Emalahleni Local Municipality and the fact that the Macubeni Dam is silting up, with implications for the dam’s capacity and for the water quality, has been a longstanding issue and a primary motivator for SLM interventions in the region [36].
The relationship between cultivated lands, degradation, and sedimentation in the Eastern Cape is informed by multiple other studies in the region [5,29,37,38]. Livestock grazing and crop-based agriculture are the most extensive land uses, creating the conditions for further soil erosion [34]. Thus, the abundant visible erosion on the hillslopes in Macubeni, in the form of sheet, rill, and gully erosion, is mostly attributed to the combination of erodible soils and poor land management practices, such as overgrazing [39] and inappropriate cultivation [6].
The Tsomo Grassland type and Southern Drakensberg Highland Grassland is Macubeni’s natural dominant vegetation type [40]. These have high basal cover and are generally dense grasslands with low grazing potential. The area has an average of 600 mm of rainfall per year and temperatures ranging around 27 °C in summer and 11 °C in winter [41]. More than 70% of the rainfall in the catchment occurs during the summer season, while only 30% of it occurs in winter [36]. Summer rains are often in the form of heavy thunderstorms, reaching up to 50 mm/hour, which have a high soil erosive effect [36].
There are 17 villages within the communal area and 1700 households, with a total population of 7800 people [42]. This study focused on Ward 13 of the Macubeni area and used five villages that a development project, funded by the Global Environment Facility 5th funding cycle (GEF5), worked with between 2015 and 2022, namely: Boomplaas, Helushe, Qhoboshane, Gxojeni, and Platkop. The GEF5 Sustainable Land Management (SLM) Project, out of which this study emerged, aimed to enable the adoption of SLM practices and ecosystem rehabilitation in support of the green economy and resilient livelihoods. The GEF5 project’s activities were broadly structured into five hubs: (i) Land rehabilitation hub; (ii) Livestock and Rangeland management hub; (iii) Conservation agriculture hub; (iv) livelihoods hub, and (v) natural resource governance hub (drawing from and building upon suggestions made by Macubeni community members for improved land management and possible solutions to land degradation [43]). For this paper, we have excluded explicitly referring to the livelihoods and governance hubs because they are functionally nested within the other three hubs. The co-authors worked in this GEF5 SLM project and are therefore intimately acquainted with the drivers of degradation in the Macubeni catchment and have drawn from this first-hand experience in conducting this study.

2.2. Overview of the Multi-Method Approach

The problem of abandoned fields as a driver of land degradation was investigated using a multi-method approach of three interconnected processes (Figure 3), undertaken using a single case study approach. The first step in the research process was a spatial analysis that mapped and classified the agricultural lands in the study site and ascribed levels of degradation to them, shown as Step 1 in Figure 3 and detailed methodologically in Section 2.3 below. The second step was qualitative systems modelling in the form of systems diagramming, which conceptualised the drivers of cropland abandonment and, in turn, the way in which abandoned fields are a driver of degradation (Step 2 in Figure 3 and detailed in Section 2.4). The third step was a Multi-Criteria Analysis (MCA) of the interventions undertaken in the study site in relation to abandoned fields (Step 3 in Figure 3, detailed in Section 2.5), which led to a review of the systems diagrams (Step 4) in an iterative loop. These three processes were synthesised using a leverage points analysis (Step 5), which drew from the results of the Spatial analysis, the MCA, and the qualitative system dynamics modelling (as described in Section 2.6). The leverage points analysis was used to refine the systems diagrams (Step 6), leading to the final discussion and recommendations emanating from this study (Step 7).

2.3. Mapping and Assessing Crop Fields in Macubeni

A digitising tool on ArcMap 10.6 was used to map the crop fields and categorise them according to their use status and degradation. This method was adapted from Schlegel et al. [37], which was developed for the Tsitsa River Catchment, which is another Eastern Cape site with similar biophysical and socio–economic characteristics to the Macubeni catchment. The images of Ward 13 that were used for digitising croplands were sourced from the National Geo-Spatial Information, Pretoria. They are captured at a scale of 1:10,000 with 0.5 m resolution. A total of 840 crop fields were mapped. All the mapped cultivated fields in the study area were classified according to the usage status as the first step in determining the state that each crop field was in. Status refers to the usage of the cultivated land where: Used = currently cultivated, Partly used = part of the field is under cultivation, Abandoned = no longer being cultivated or has not been cultivated for several years. Degradation levels were assessed via the current condition of the cultivated land in terms of visible erosional features, such as rills, gullies, and lack of vegetation cover, where: Low degradation = little or no sheet erosion, with no gullies; Moderate degradation = rills/small gullies/lack of vegetation, and/or sheet erosion; High degradation = abundant erosion/large gullies/visibly abandoned fields. Each degradation class was additionally subdivided into three vulnerability codes. These refer to the probability of the future degradation of the land through erosion or degradation in the absence of any mitigation measures. Further methodological detail on the spatial mapping is provided in the Supplementary Materials.

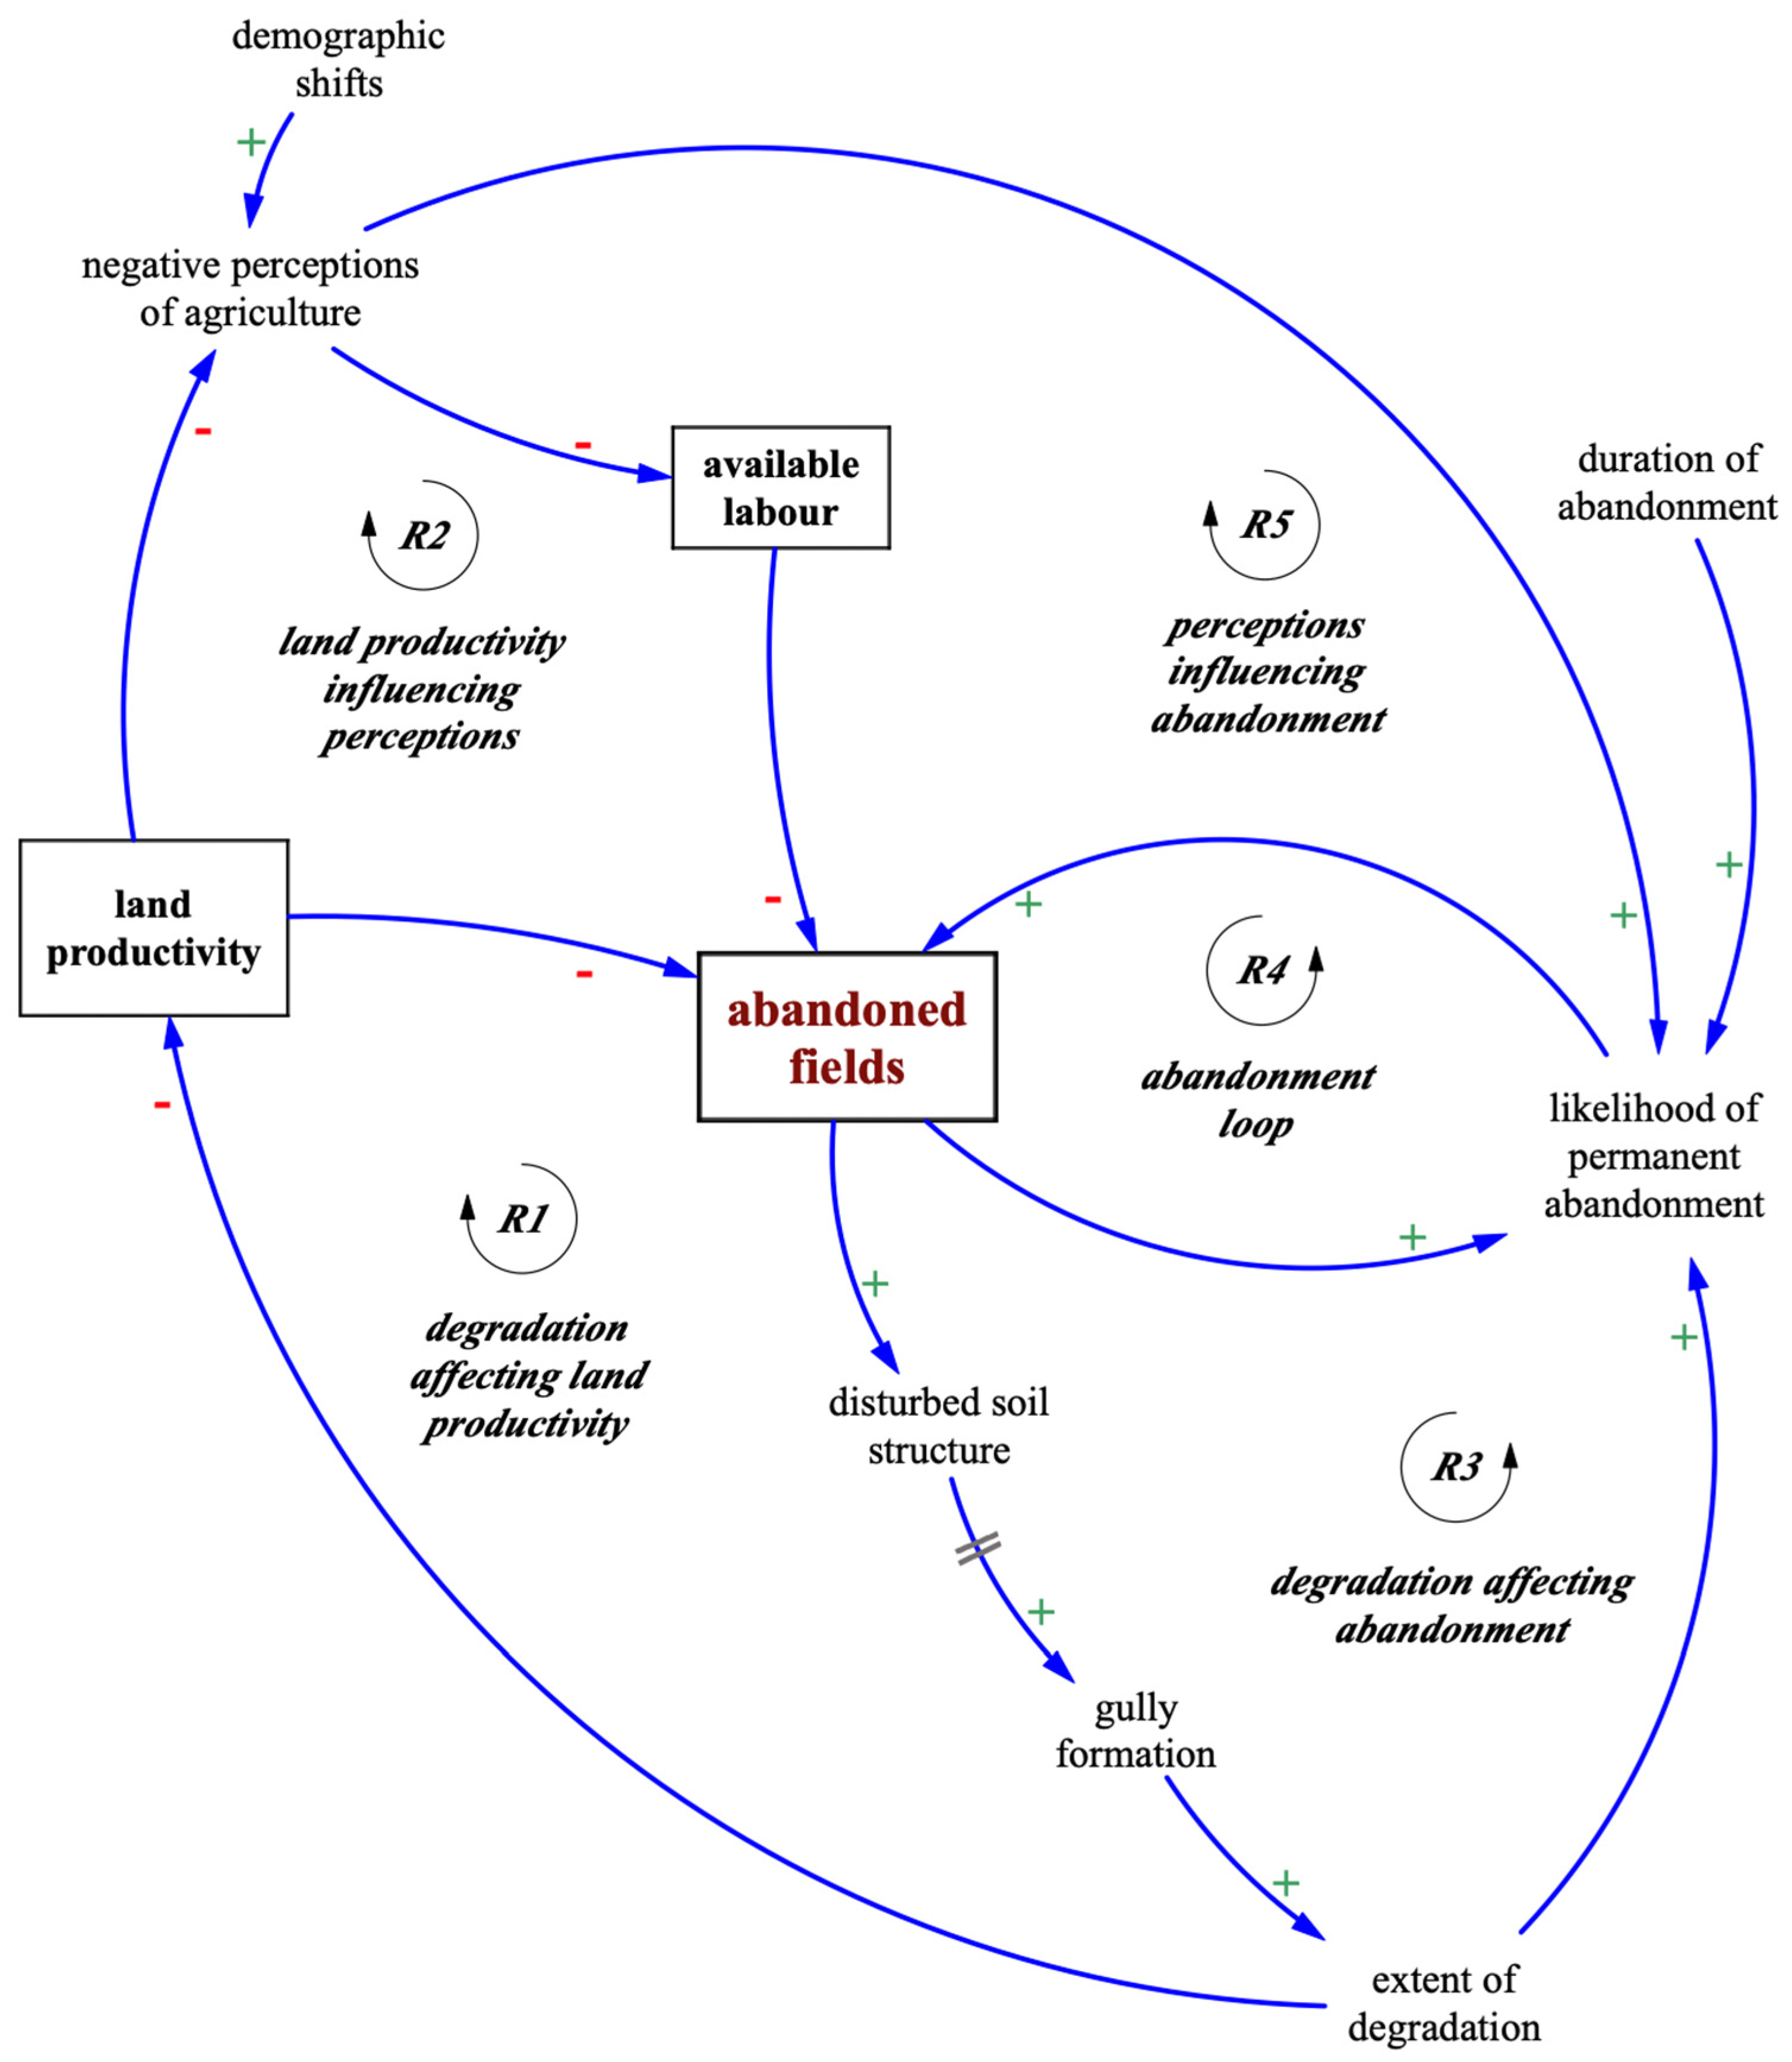
2.4. System Dynamics Modelling

The potential drivers of degradation and field abandonment were drawn from Macubeni as a case study with stakeholder engagement as part of the GEF-5 SLM project and the literature with case studies of similar catchment characteristics to those of Macubeni. These characteristics include a common nationality (i.e., all case studies are South African) and a common factor of being rural landscapes. Other similarities that were considered for case study comparison were biophysical similarity (including elevation, vegetation, and soil types) and socio–economic similarity (including the socio–economic context and the combination of existing land tenure arrangements and types of land uses).
Drivers of cropland abandonment in South Africa are part of a complex system that includes socio–cultural, bio–physical, and economic factors [29]. System Dynamics Modelling enables a holistic view of the problem in order to better represent, analyse, and understand it [29]. To this end, Vensim © v.9.1 2019 (Ventana Systems) was used to develop causal loop diagrams (CLDs) to describe and present the interconnections between different drivers in the system, along with the balancing and reinforcing feedback loops driving system behaviour [15]. The resulting qualitative systems model was used to explore and visualise the interactions among agricultural land use, the level of degradation, and SLM interventions that are aimed at reducing degradation and building green livelihoods.

2.5. Multi-Criteria Analysis

Multi-Criteria Analysis (MCA) is a broad category used to describe formal and structured approaches for individuals and groups to determine overall preferences among alternative options, accounting for economic, environmental, social, and technological aspects of problems [44]. As a class of approach, MCA can bring a degree of structure, transparency, and flexibility that lie beyond the practical reach of Cost–Benefit Analysis (CBA) [45]. In this study, a simple form of MCA was applied as part of the multi-method approach, complementing the spatial analysis and the systems diagramming methods. The input was solicited during a stakeholder virtual workshop, hosted in December 2021, with seven of the GEF5 SLM project team leaders, including representatives of each of the five project hubs introduced earlier.
Drawing from the approaches outlined by CLG [45] and Mellville-Shreeve et al. [46], the following steps were employed: (1) the problem definition and the decision context were defined by drawing on the initial results of the analyses from the preceding steps (see Figure 3); (2) the options to be compared against one another were then defined as the interventions in the case study site; (3) the objectives and criteria were subsequently defined [45]; (4) the performance matrix was populated with the MCA results, which were calculated from a combination of cost data and stakeholder input and then converted into consistent numerical values (i.e., normalised); and finally, (5) the performance of the interventions were evaluated against the criteria.
Table 1 shows a generic performance matrix, as used in the MCA step (4). In this example, three interventions (A,B,C) were assessed against two criteria (1,2). The criteria were weighted according to perceived relative importance (Criterion 1 was weighted at 30% and Criterion 2 was 70%). The direction of each criterion corresponds with whether higher values of a criterion are desirable (+1) or undesirable (−1). In the case of costs, for example, the lower the cost the better, and so a higher cost is undesirable (hence, the direction is −1). Each intervention was then scored, with the performance multiplied against the weighting and the direction (e.g., for Criterion 1, Intervention A’s score was 2, with the weighted performance calculated as 2 × 0.3 × −1, for the result of −0.6).
Further details about the MCA are available in the Supplementary Materials.

2.6. Leverage Points Analysis

The final step of the multi-method process was to synthesise the results of the spatial analysis, the MCA, and the qualitative system dynamics modelling using a leverage points analysis (Step 5 in Figure 3). The leverage points analysis was used to review the systemic conceptualisation to further refine the systems diagrams by capturing additional variables and feedback loops that were surfaced through the preceding steps (this refinement is labelled as ‘review 2’, Step 6, in Figure 3). The leverage points framework, summarised in Figure 1, was used to structure the discussion of the interventions, the implications of which form the basis of the final discussion and the recommendations emanating from this study (Step 7 of Figure 3).

3. Results

We present our results in four parts. First, the results of the spatial analysis on the use and levels of degradation of crop fields are presented (Section 3.1). Next, the dynamics of land abandonment in relation to degradation are presented in the form of systems diagrams (Section 3.2), followed by the results of the multi-criteria analysis, which assessed the relative strengths and weaknesses of the different interventions aimed at improving sustainable land management in Macubeni (Section 3.3). The results are then synthesised using the leverage points framework, with the existing sustainable land management (SLM) interventions assessed in relation to the dynamics of land abandonment and degradation (Section 3.4).

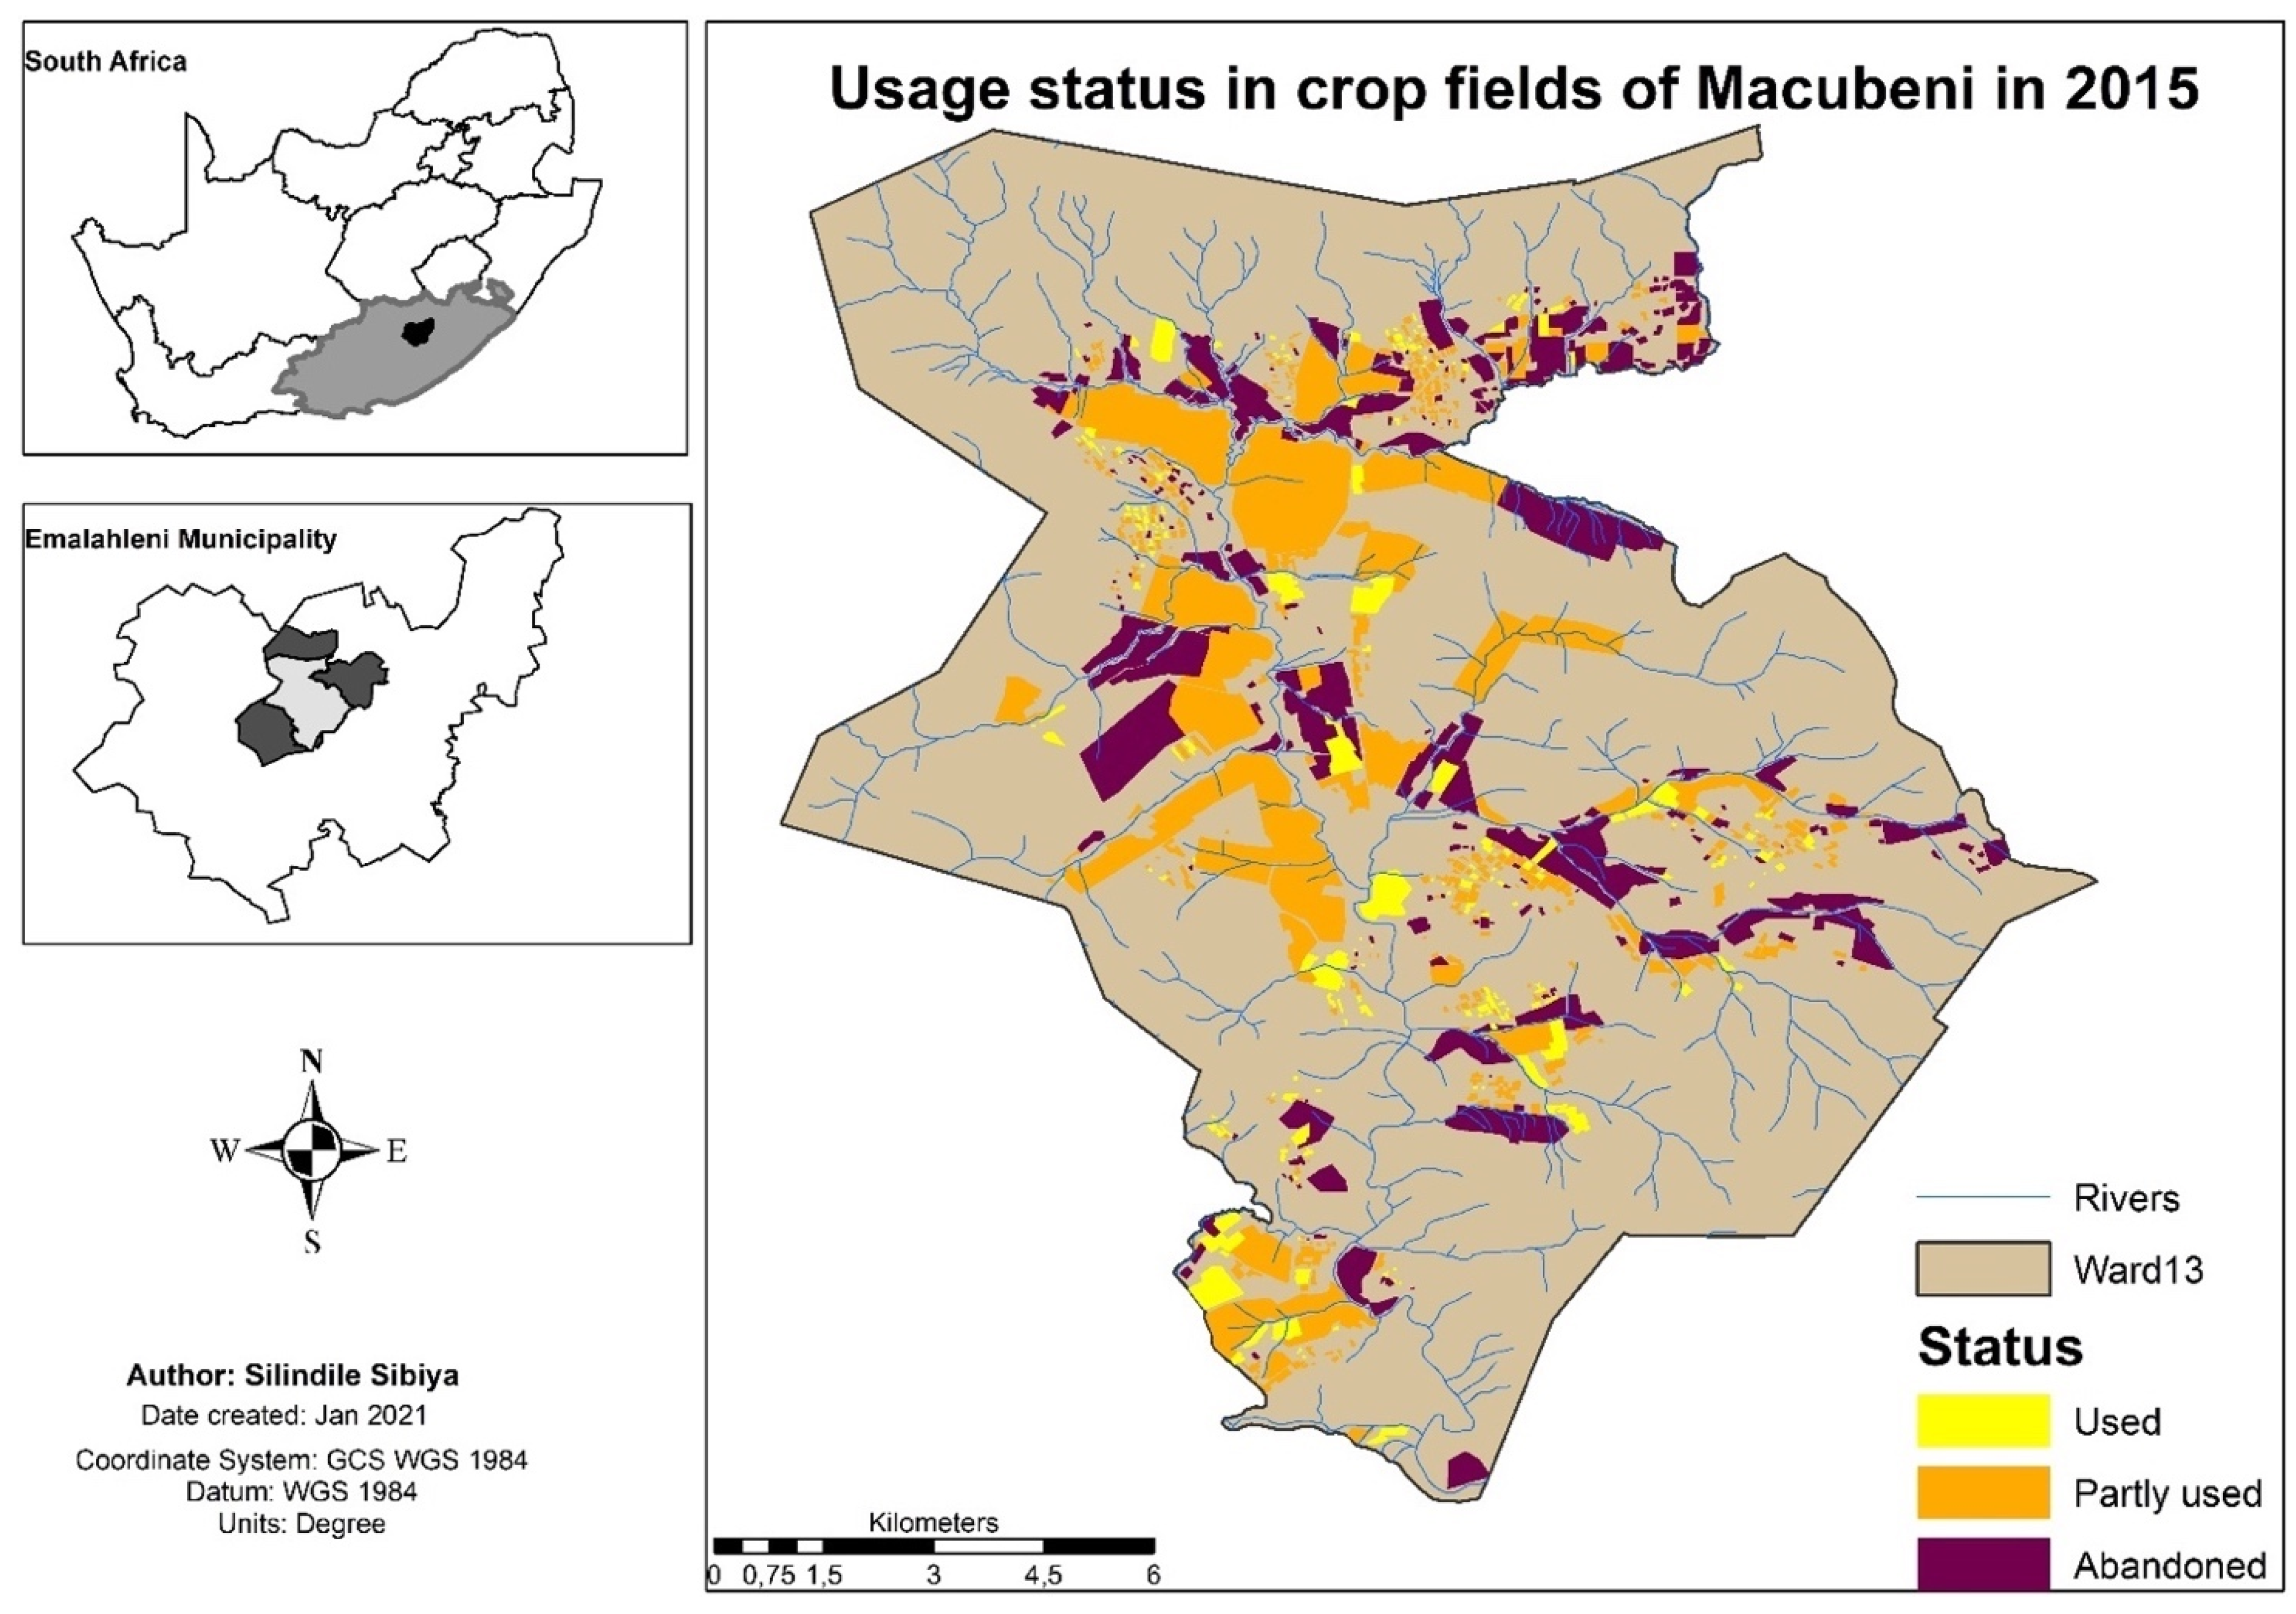
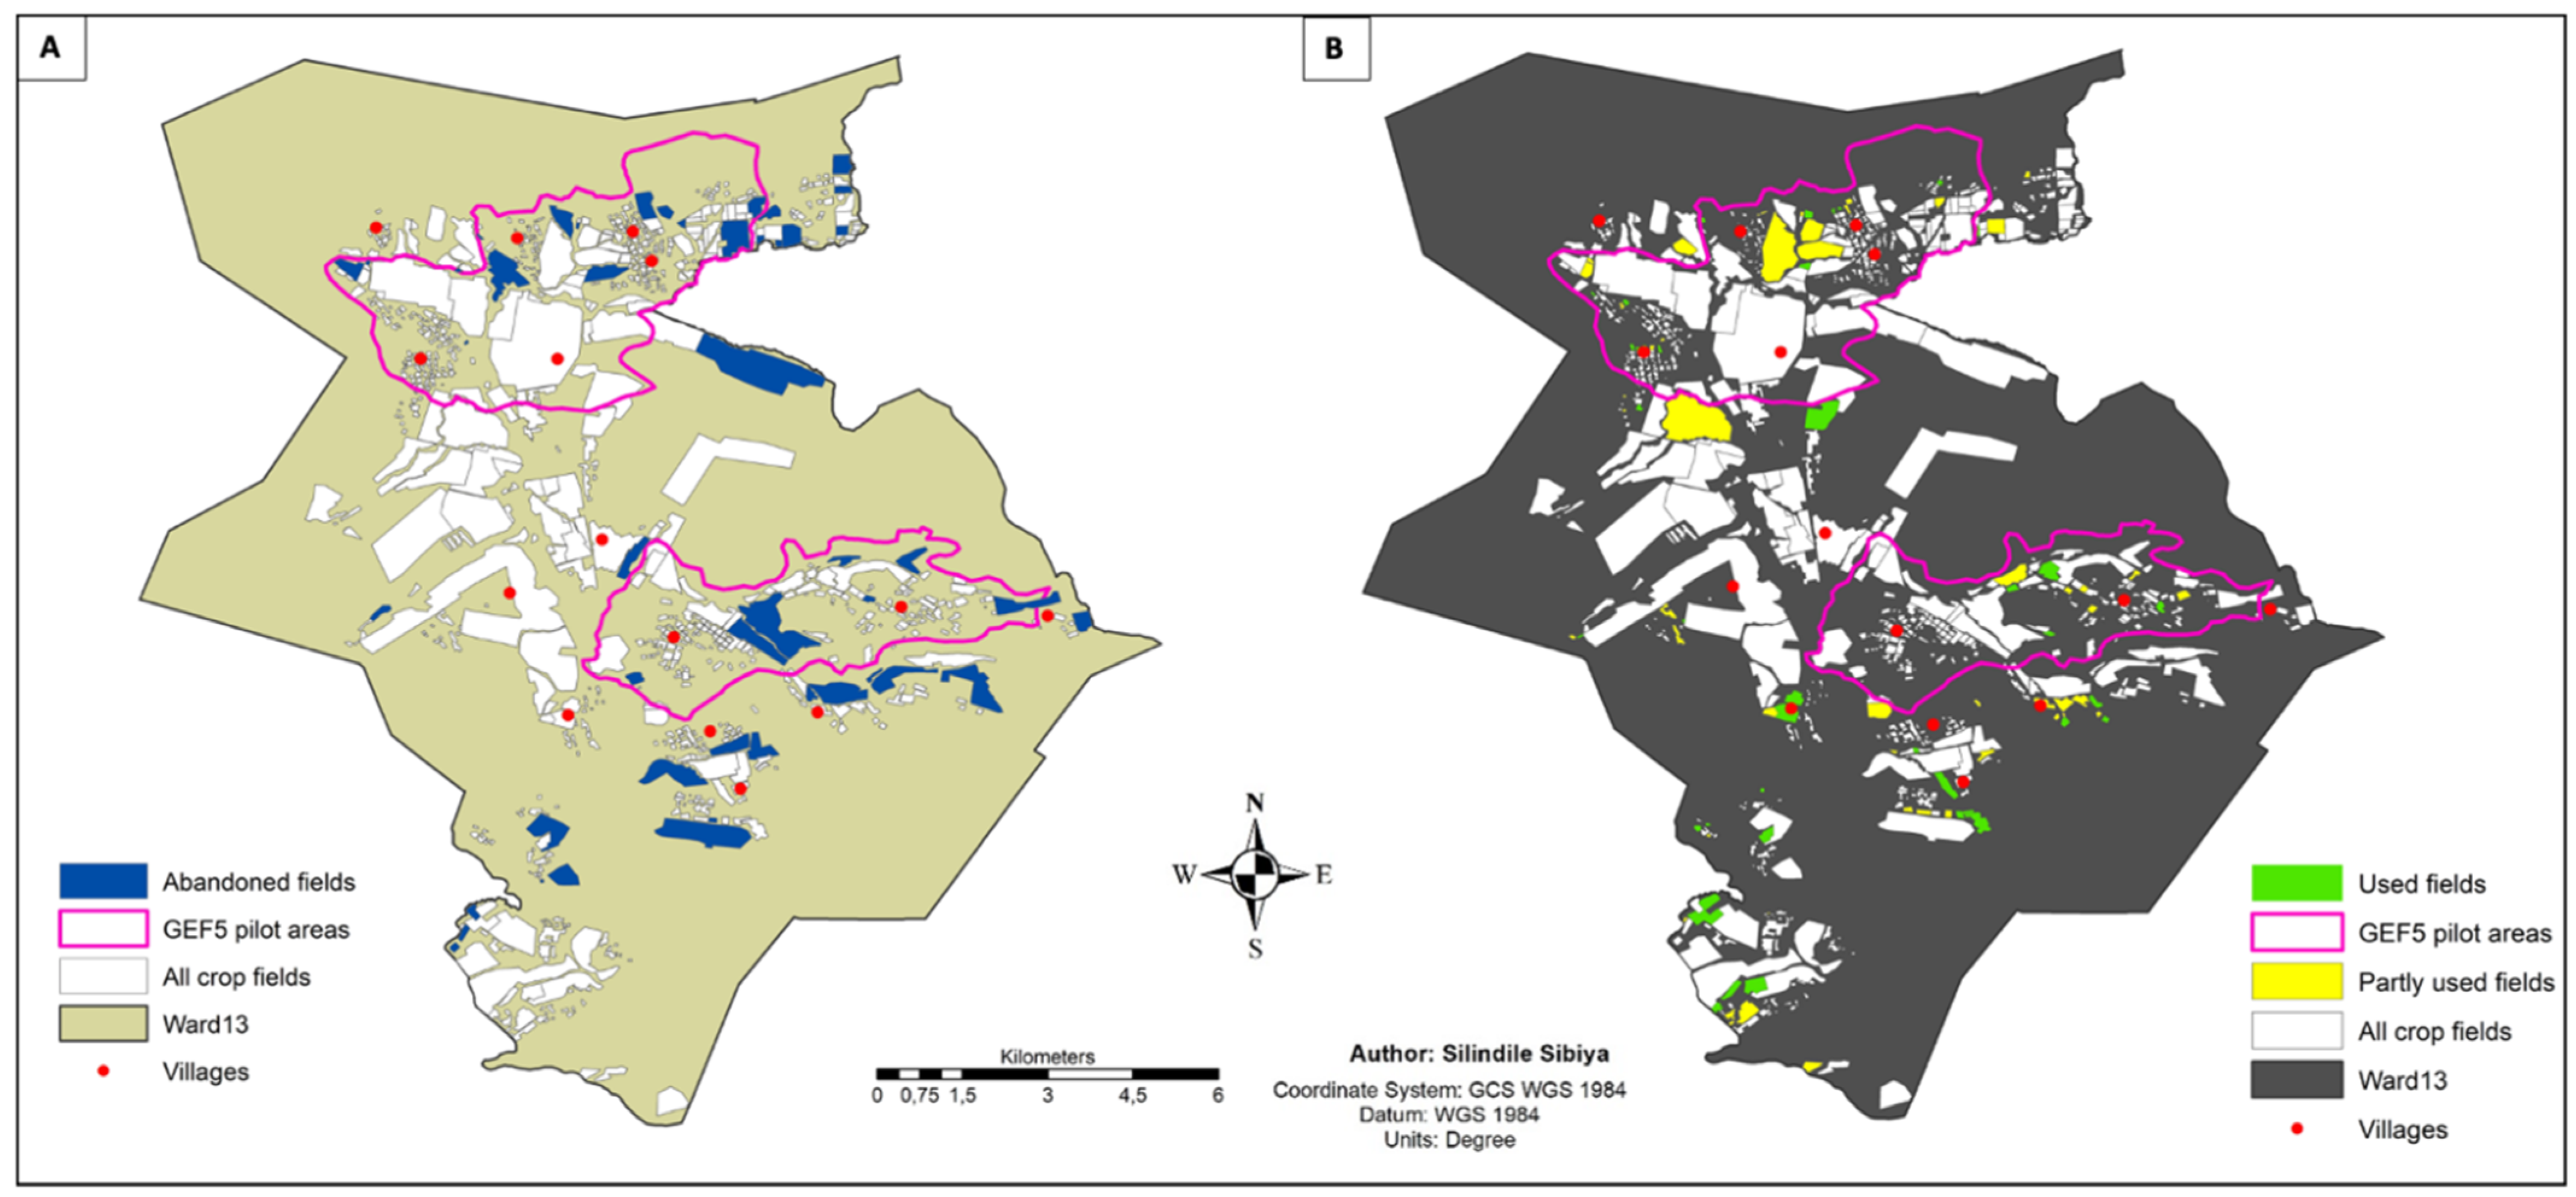
3.1. Use and Degradation of Crop Fields in Macubeni

A total of 840 crop fields were mapped, covering an area of 3160 hectares (ha) (see Figure 4). Almost half of the number of mapped fields (395 out of 840, or 47%) were partly used (orange-shaded fields in Figure 4); abandoned fields accounted for 30% of the fields (purple-shaded), with the smallest percentage of fields (23%) in use (yellow-shaded).
As seen in Figure 5A, almost half of the fields were highly degraded, accounting for 47% of the area of all the crop fields. The highly degraded fields were mostly located around drainage lines where the fields are especially susceptible to erosion (and where, in turn, the degraded fields increase sedimentation into the river systems, reducing dam capacity downstream). Fields with moderate degradation constituted 36% of the total area, while those with low degradation covered the smallest area of only 16.5%.
The vulnerability level of crop fields, shown in Figure 5B, speaks to the potential risk that the area will be degraded in the future, judging by the features already exhibited by the crop field itself or degradation-related landscape characteristics in the surrounding area. About 65% of the crop fields were categorised as highly vulnerable to further erosion, with about 34% rated as moderately vulnerable and <1% rated at a low level of vulnerability. Further details, including tables containing the exact results, can be found in Sections S.3–S.6 in the Supplementary Materials.
In summary, the relationships between field abandonment, land productivity, soil conditions, and erosion point to a range of interconnecting factors and dynamics that drive abandonment and suggest a relationship between the way in which abandonment, in turn, drives degradation. This is explored in the following sub-section.

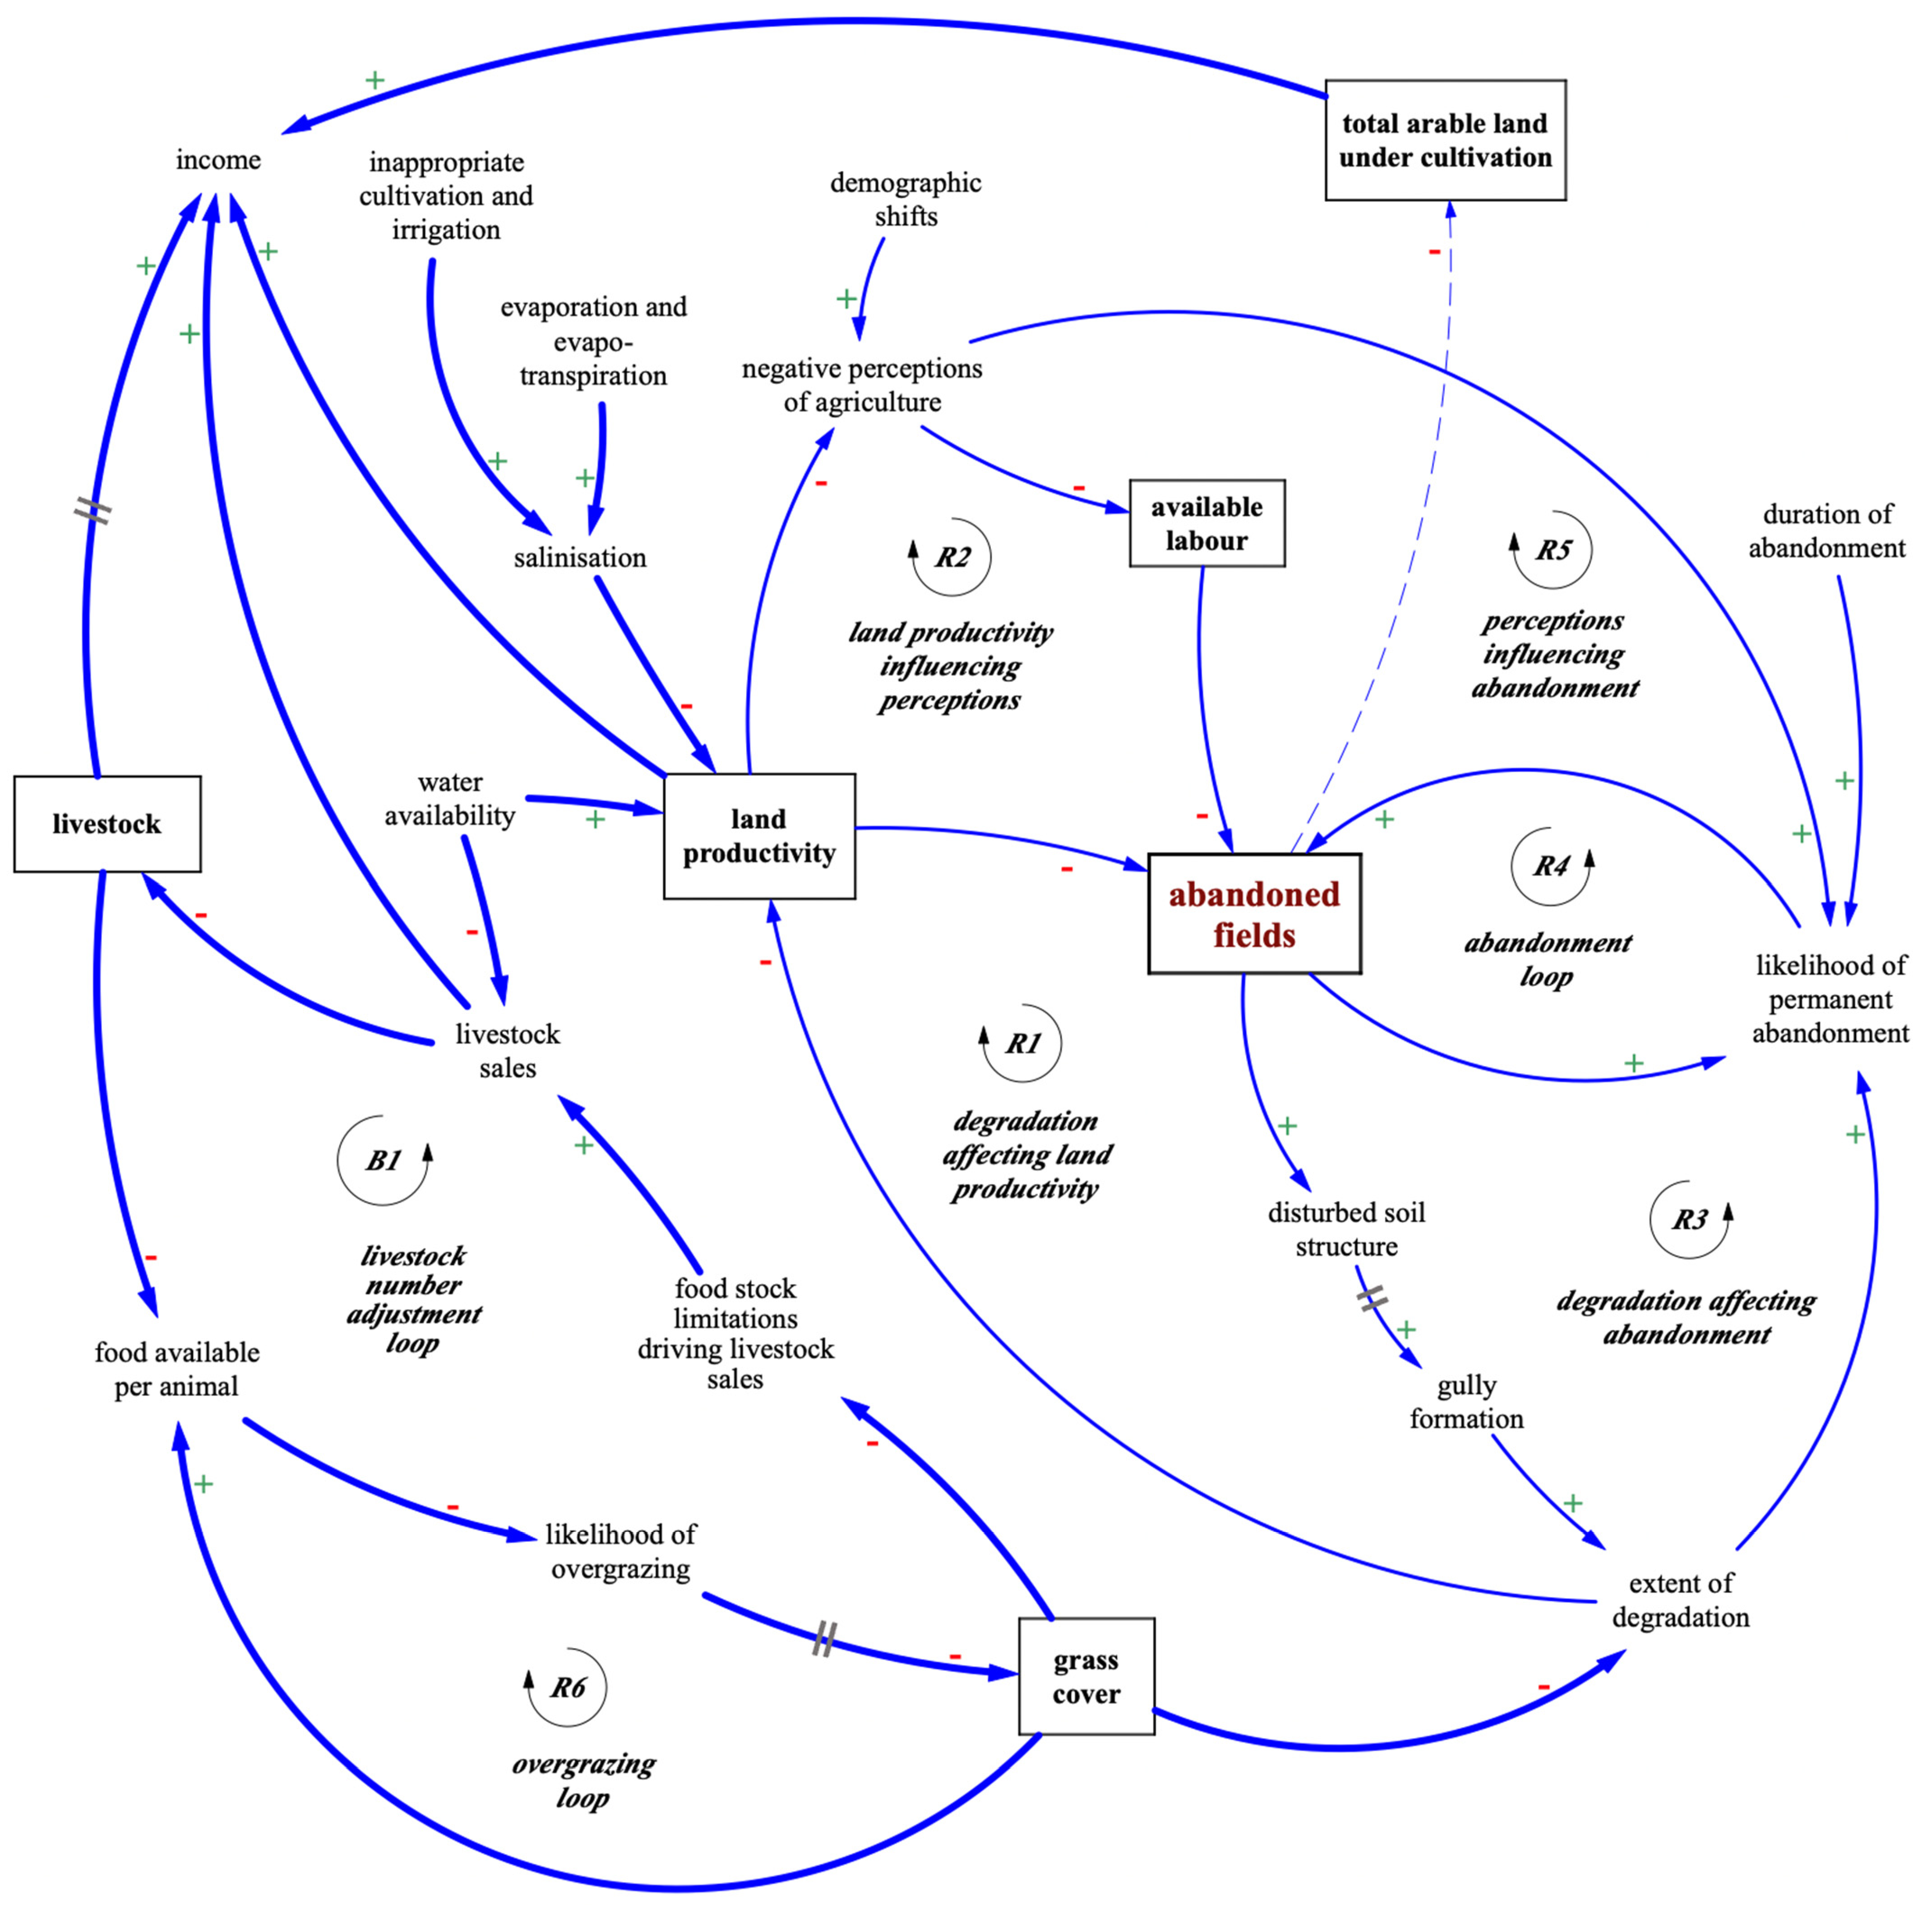
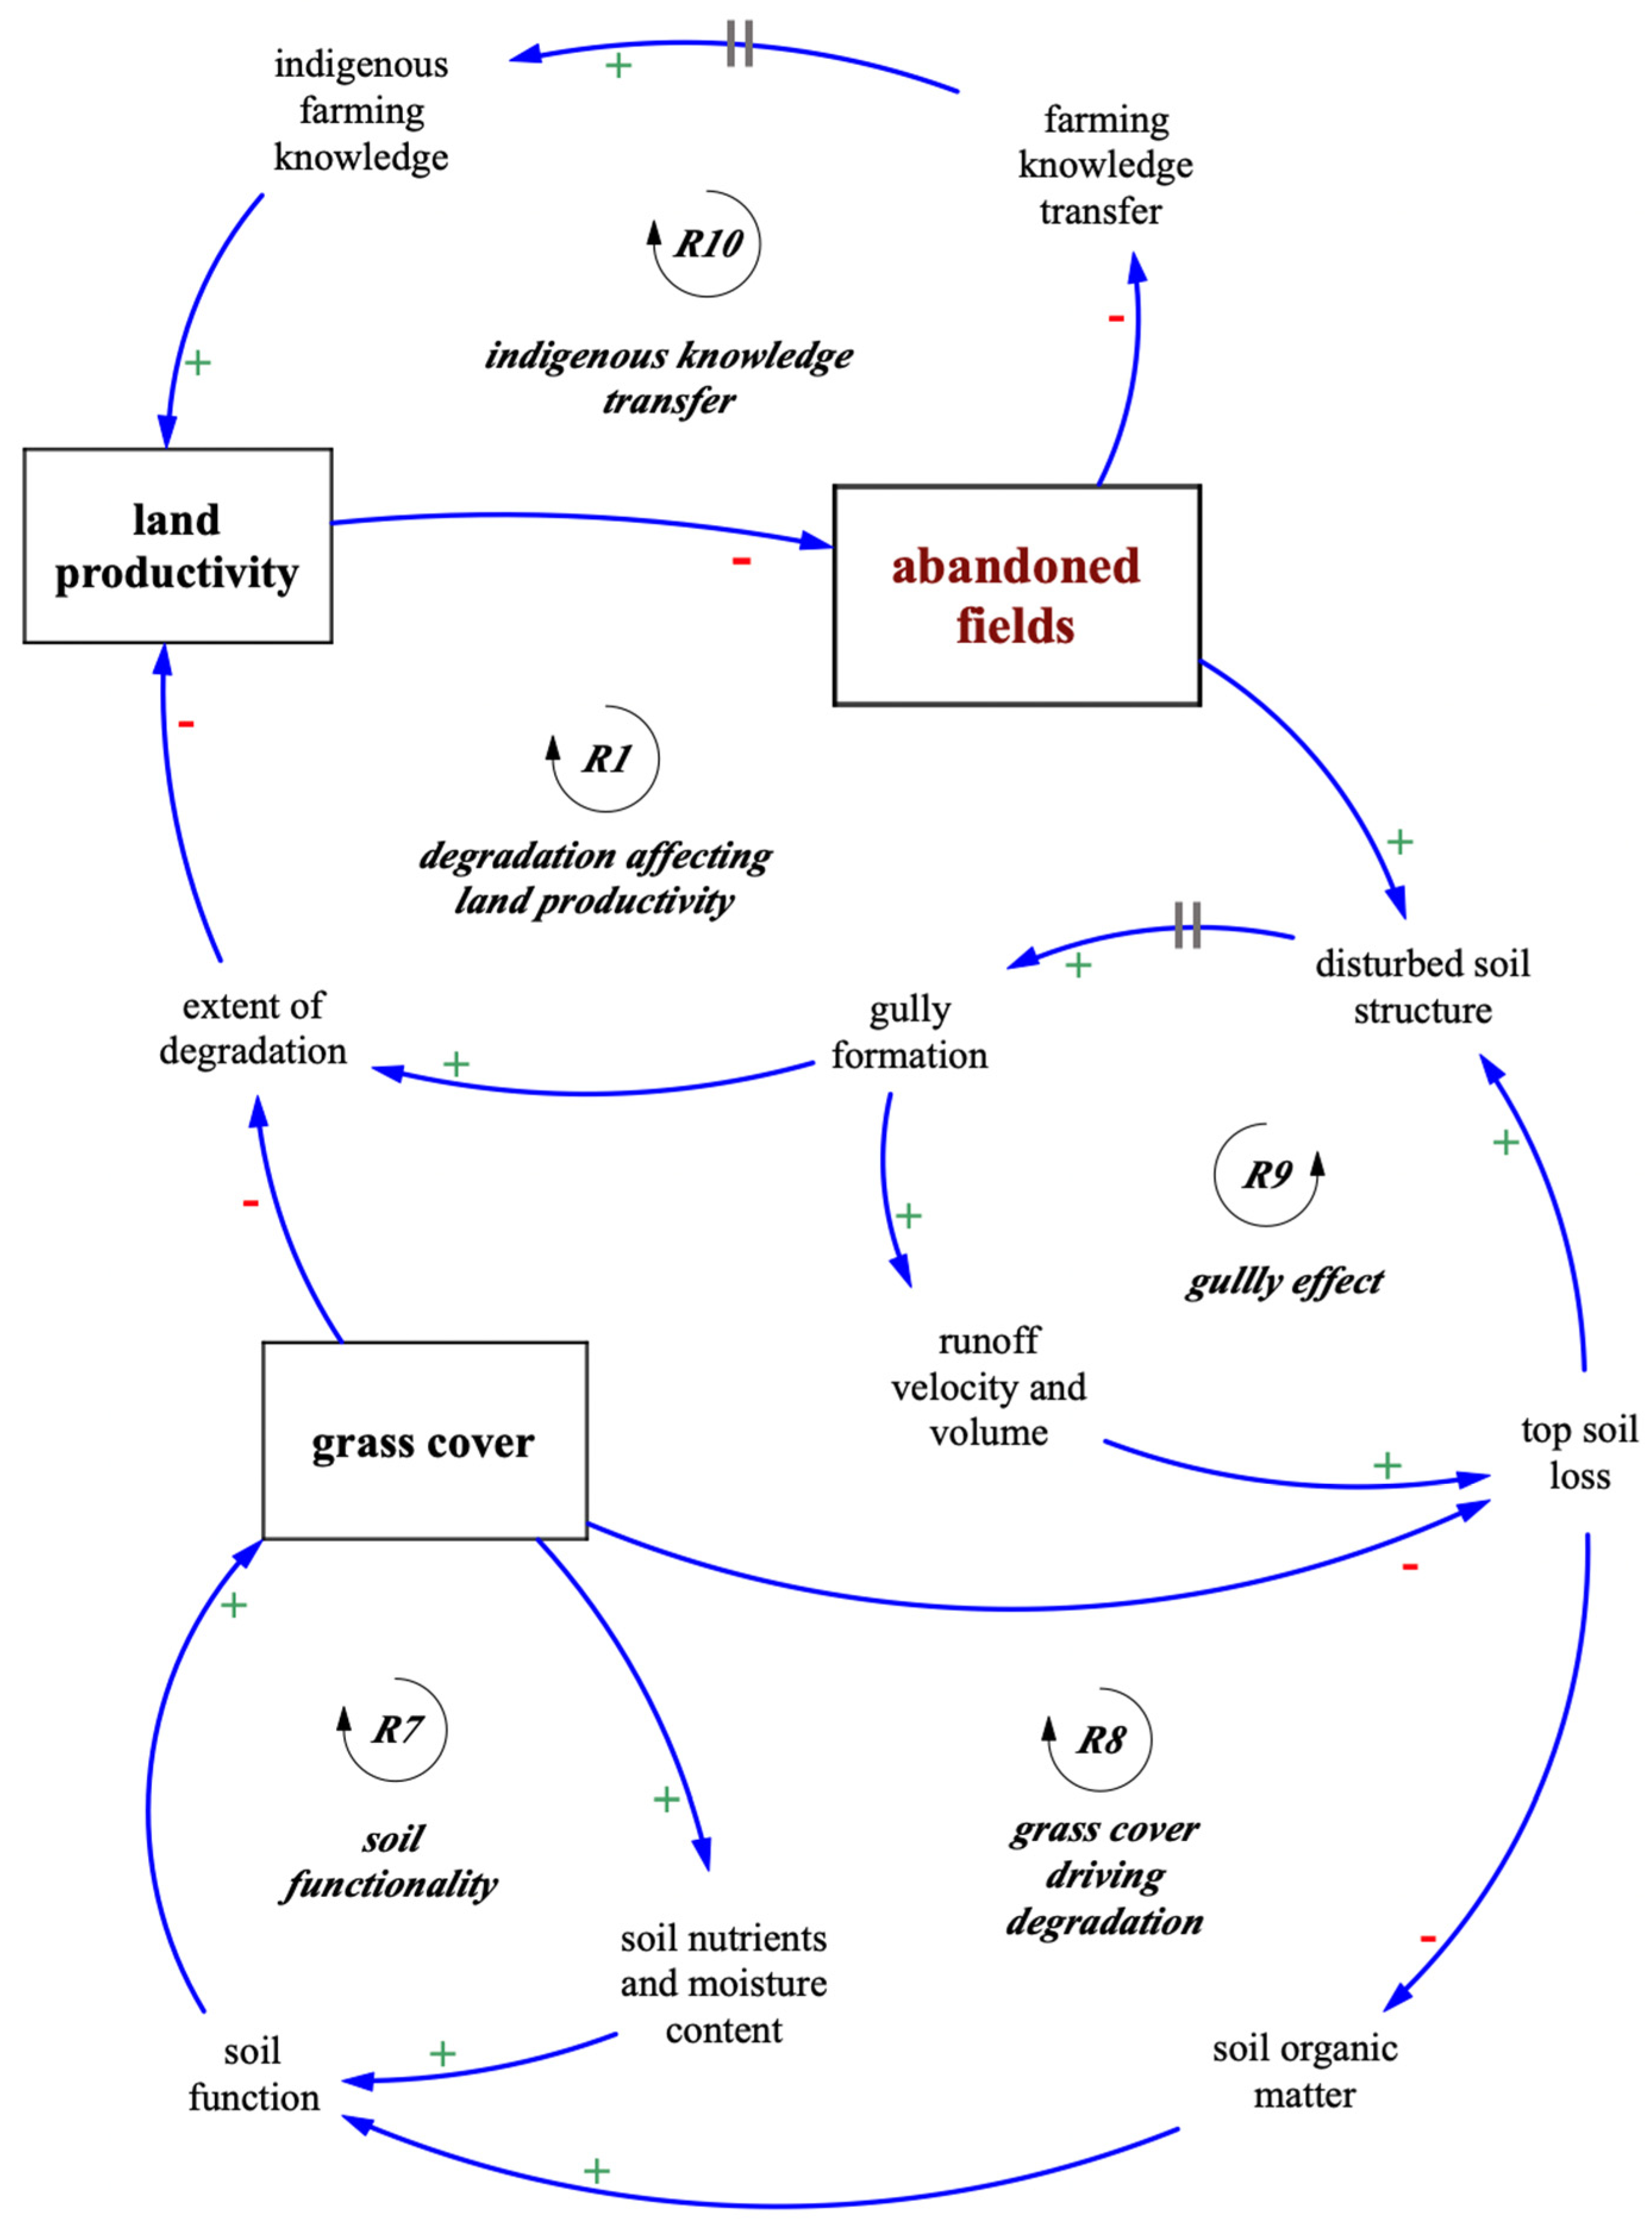
3.2. The Dynamics of Land Abandonment in Relation to Degradation

This section presents the authors’ conceptualisation of the drivers of cropland abandonment and the way in which abandoned fields are a driver of degradation, which is jointly referred to here as ‘the dynamics of land abandonment’. The conceptualisation is represented with systems diagrams, using the diagrammatic conventions of causal loop diagrams (CLDs (see Table 2). A single CLD is presented, with the feedback loops and variables unfolded in a stepwise fashion over three stages (Figure 6, Figure 7 and Figure 8).
The first version of the CLD (Figure 6) introduces the drivers of cropland abandonment via a central stock of abandoned fields, which is impacted by the dynamics of two other stocks, namely land productivity and the available labour (which represents the overall labour pool for working croplands in the region). If abandoned lands increase, there will be more land with disturbed soil structure, which, over time, creates the conditions for gullies to form, increasing the overall extent of degradation (note that the double-lined mark on the arrow between ‘disturbed soil structure’ and ‘gully formation’ signifies a delay between cause and effect). This negatively impacts land productivity [42,43,44], further increasing the number of abandoned fields, closing the first reinforcing feedback loop (R1) (degradation affecting land productivity). With land productivity decreasing, many people’s perceptions of agriculture become more pessimistic, given that they see agriculture as being unable to generate income and sustain livelihoods [9,47]. This reduces the available labour pool, further driving field abandonment and forming the second reinforcing feedback loop (R2) (land productivity influencing perceptions).
Negative perceptions of agriculture are also being driven by demographic shifts in the area. As with many rural parts of South Africa, most fields are owned by the older generation and lack a willing and able youth population to take over the farming of the fields [47]. The proportion of younger people in the villages is increasing, with migration to cities increasing as people leave rural areas in search of urban employment opportunities [9]. Another important variable determining the quantity of abandoned lands is whether people are inclined to reclaim the abandoned lands and start farming them again or whether people are more inclined to permanently abandon the fields. This is captured in Figure 6 with the variable ‘likelihood of permanent abandonment’, which is impacted by four factors. First, if the extent of degradation is high, then the likelihood of permanent abandonment will be high, which, in turn, further increases abandoned fields via two reinforcing feedback effects (R3) (degradation affecting abandonment) and R4 (abandonment loop). The abandonment loop (R4) captures the vicious cycle that can develop whereby people see their neighbours and friends permanently abandoning their fields, and this discouraging pattern serves to increase the likelihood of individuals and families permanently abandoning their own fields. Third, the likelihood of permanent abandonment increases along with the increasing negative perceptions of agriculture (R5) (perceptions influencing abandonment). Finally, the likelihood of permanent abandonment increases with the duration of abandonment, following the logic that the longer the current field has been abandoned, the greater the existing level of degradation, and therefore the more likely this field is to be permanently abandoned.
Version 2 of the CLD (Figure 7) expands on the initial drivers of abandoned lands to include three new stock variables, two additional feedback loops, and two water-related drivers (the connections between these new variables are shown via the emboldened arrows in Figure 7). A high-level system indicator is included in the form of income, which is primarily derived from livestock sales, the total arable land under cultivation, and from land productivity (all of which are positively related so that if livestock sales, land productivity, and the total arable land under cultivation all increase, then the total income will increase). Livestock sales affect income in both direct and indirect ways. An increase in livestock sales will directly increase income in the short-term, but it will decrease the stock of livestock. Given that livestock is a form of capital held by catchment residents as an asset class, selling livestock means foregoing the income derived from the sale of livestock products (such as milk) as well as reducing the capital stock held by catchment residents, which, over time, can be converted into income through future livestock sales. The delay mark on the arrow between livestock and income shows that the relationship between livestock and income is delayed by the time it takes to convert livestock into income.
The total arable land under cultivation is reduced by the extent of abandoned fields. The more the abandoned fields, the less the total arable land under cultivation and the less the possible income from agriculture. The positive relationship between land productivity and income counters the increase (or decrease) in total arable land under cultivation: if land productivity is high but the total arable land is low, then the productivity of existing arable land can offset the lower quantity of land under cultivation. Conversely, if the total arable land is high but land productivity is low, then the income earned from agriculture will reduce.
Land productivity is impacted by water-related variables in two main ways. Firstly, inappropriate cultivation and irrigation promote poor drainage, which leads to more infiltration and an increased water table level [48]. The raised water table increases the concentration of salt content in the soil as evaporation and evapotranspiration takes place, resulting in salinisation, which reduces land productivity [28].The variable water availability recognises that, in the case of rainfed crops, land productivity is heavily reliant on rainfall [49]. Water availability also captures the reliance of livestock owners on rainfall for livestock watering and for maintaining natural forage in the grazing areas. In times of drought, when water availability reduces, livestock farmers will often increase livestock sales in order to reduce their water and forage requirements, which increases income at the expense of reducing the stock of livestock (which is one of the most important forms of household capital in the area [50]. The adjusting of livestock numbers in relation to food availability is shown by the balancing loop 1 (B1). If the number of livestock increases, the food available per animal decreases, which increases the likelihood of overgrazing occurring, which in turn reduces the overall stock of grass cover in the region [4]. As with water availability in relation to livestock watering, food stock limitations can drive livestock sales, which reduces the overall livestock numbers and increases the food available per animal in an overall balancing loop (B1). Overgrazing also has a reinforcing effect, where a reduction in the food available per animal (due to a growth in livestock population) increases the likelihood of overgrazing, which decreases the grass cover, which further decreases the food available per animal (R6) (overgrazing loop).
Version 3 of the CLD (Figure 8) further expands on the drivers of abandoned lands. Decreasing grass cover reduces soil nutrients and moisture content. One way in which this driver manifests in Macubeni and similar ecosystems is through decreasing grass cover resulting in an increase in invasive and expansive woody species, which have a higher nutrient uptake from the soil, with an associated net decline in soil function, which has a negative knock-on effect on grass cover. This relationship between grass cover and soil functionality is captured in the seventh reinforcing feedback loop (R7).
Soil functionality is also impacted by soil organic matter, which is reduced by topsoil loss. An increase in gullies increases the overall velocity and volume of rainfall runoff on the landscape (as rainfall flows through the channels formed by the gullies), which drives topsoil loss and, via decreasing soil organic matter and an associated reduction in soil function, this further reduces grass cover. This feeds into overall degradation, impacting land productivity and abandoned fields and forming the eighth feedback loop (R8) (grass cover driving degradation). Topsoil loss also drives disturbed soil structure, which increases gullies, driving runoff velocity and volume, creating further topsoil loss. This forms the ninth feedback loop (R9) (gully effect). As noted in Section 2.1, heavy summer thunderstorms are a feature of the rainfall patterns in Macubeni. These thunderstorms are typically of short duration, with high intensity and large raindrops, constituting erosive rainfall events that drive topsoil loss and contribute to land degradation [49,51], interacting with feedbacks R7 (soil functionality), R8 (grass cover driving degradation), and R9 (gully effect).
As more farmers abandon their crop fields, the transfer of indigenous knowledge from the older to the younger generation declines [48]. Over time, decreasing farmer knowledge transfer perpetuates the loss of indigenous knowledge from the older generation and reduces land productivity, with an associated increase in field abandonment, forming R10 (indigenous knowledge transfer).
Having structured the drivers of land abandonment in the form of a CLD, unfolded in three steps between Figure 6 and Figure 8, we now assess the interventions that are aimed at improving sustainable land management in Macubeni.

3.3. Assessing Interventions Using a Multi-Criteria Analysis (MCA)

As noted in the introduction, the GEF5 SLM Project’s activities in the Macubeni catchment are grouped into three main hubs: (i) the Land Rehabilitation hub; (ii) the Livestock and Rangeland Management hub; and (iii) the Conservation Agriculture hub. Table 3 summarises the interventions in Macubeni that have a direct or indirect impact on abandoned fields, relating each intervention to its associated ‘hub’ within the GEF5 SLM Project.
The results of the MCA are detailed here in Table 4, Table 5 and Table 6 (with supporting information in the Supplementary Materials). The criteria used in the MCA were the following: Criterion 1—cost—which drew from relevant financial data; Criterion 2—reliance on external funding—which acted as a proxy for the relative robustness of each intervention; and Criterion 3—efficacy—which provided a measure of stakeholders’ perceptions of the impact of an intervention.
The interventions’ scores in relation to their relative cost are summarised in Table 4, where the most cost-effective intervention was B. Climate Smart Agriculture at ZAR 305,500, and the most expensive intervention was D. Agrograssing at ZAR 1,782,240.
The results of the interventions’ scores in relation to the next two criteria are summarised in Table 5. GEF5 project managers were asked to rate each of the intervention options in relation to criteria 2 and 3. In terms of criterion 2, the stakeholders rated Intervention B (Climate Smart Agriculture) as being the least reliant upon external funding, with the average score of each of the seven respondents being 2.6, with a normalised score of 0.52. The other three interventions all scored similarly against this criterion, with both Intervention A (sediment trapping structures) and Intervention D (grazing management) having normalised scores of 0.40 and Intervention C (agrograssing) having a slightly higher normalised score of 0.42. In terms of criterion 3, the stakeholders rated Intervention D (Grazing management) as having the greatest perceived efficacy, with a normalised score of 0.64. Intervention A (Sediment trapping structures) ranked last, with the lowest normalised score of 0.46.
The normalised scores for each of the interventions, in relation to each of the criteria, were then used as inputs into the MCA Performance Matrix (Table 6). As noted with reference to the generic performance matrix (Table 1), each criterion was weighted according to perceived relative importance. Criteria 1 (cost) and 3 (efficacy) were weighted equally to account for 40% of the total score each. Criterion 2 (funding reliance) was weighted at half of the other two criteria (i.e., 20% of the total score)—see the Supplementary Materials for further details. Given that costs should be preferably lower rather than higher, the direction of the cost criterion is −1, so that the higher the costs, the worse the normalised score. The normalised score is included in Table 6 as the performance (Perf.) of each intervention in relation to each criterion. The weighted performance (Wt’d perf.) is then calculated as the product of the score, the weight (Wt), and the direction (hence, for Intervention A. Sediment trapping structures, the normalised score of 0.3 is the performance of Intervention A against Criteria 1 (cost), with the weighted performance of −0.12 being the product of 0.3, 0.4, and −1). The total scores are the sum of weighted performances.

3.4. Leverage Points Synthesis Analysis

The spatial analysis has highlighted the extent of degradation across the Macubeni crop fields and the requirement for SLM interventions. Given the extent of degradation and the pervasiveness of abandoned fields, along with the interconnectedness of the drivers of abandonment (as shown in the systems diagrams), SLM interventions should aim to reduce the drivers of degradation and field abandonment in a way that maximises desirable outcomes, with long-term sustainability in mind, whilst using as few resources as possible. This is where Meadows’ [16] leverage points framework is applicable (as introduced in Section 1.1.3 and Figure 1). The four interventions introduced in the preceding section align with particular leverage points. The interventions are shown in Table 7 in relation to their associated leverage points and to their relative MCA ranking.
Building on Meadows’ proposed framework, Abson et al. [33] emphasise that leverage points in a complex system are typically interdependent rather than independent of each other. Hence, applying an intervention in one part of the system, affecting a particular leverage point, can have knock-on effects elsewhere in the system that undermine or support the efficacy of another intervention. For this reason, a holistic view of the problem context is required alongside a systemic understanding of the interventions in relation to one another [52]. In Figure 9, the four interventions are located in relation to the systemic conceptualisation of the dynamics of land abandonment in the form of a synthesis of the preceding three CLDs (Figure 6, Figure 7 and Figure 8). An analysis of each intervention follows.
Grazing management aims to influence community behaviours via rules and incentives and therefore falls within a deeper leverage point (point 5—the rules of the system). Community members drafted a list of bylaws that everyone needed to agree with and to abide by. This involved the traditional authorities as it included penalties for infringements of the bylaws. The practical activities forming part of this intervention included establishing grazing camps and promoting the rotational resting of camps in the rangelands. These practices enable the community to control the grazing patterns of livestock by only opening certain camps in one season while closing the other for the next season. This intervention impacts the system in several key places. Grazing management reduces the likelihood of overgrazing, which increases grass cover, maintaining and increasing the food available per animal throughout the year, which further reduces the likelihood of overgrazing (loop R6, Figure 9). Increasing grass cover also reduces a primary reason for farmers to sell livestock (namely due to food stock limitations leading to fear of livestock dying or becoming unhealthy). The less reason farmers have to sell, the fewer the livestock sales and the more the livestock. However, maintaining or increasing the number of livestock reduces the food available per animal, which increases the likelihood of overgrazing, driving a decrease in grass cover, which leads to farmers selling livestock in response to food stock limitations. This shows the interaction between the balancing feedback loop B1 and the reinforcing loop R6.
Grazing management also helps reduce topsoil loss both directly and indirectly, via maintaining and increasing grass cover, which reduces soil erosion. Minimizing topsoil loss reduces disturbed soil structure, which reduces the formation of gullies, helping to reduce the impact of rainfall runoff, reducing further topsoil loss (loop R9). An increase in grass cover and a decrease in the formation of gullies both serve to reduce the overall extent of degradation, which positively impacts land productivity (loop R1). Grazing camps constrain the allowable grazing terrain of livestock, which assists with preventing free-roaming livestock from trampling crops. By decreasing the extent of degradation, this intervention could also reduce the likelihood of permanent crop field abandonment.
In principle, the grazing management intervention holds high leverage because the incentives are direct and clear to all the stakeholders and should, therefore, be sustained by the community with little to no external assistance. Yet, the GEF5 project team recognised that, while they had tried to communicate the direct benefits of grazing management to community members, the community members continued to request payment from the project, which explains the low ‘external reliance’ score for grazing management in the MCA (see Table 5).
Intervention B: Climate smart agriculture (CSA) aligns with leverage point 6, the structure of information flows, which involves restoring or delivering new information into the system that can drive a change in people’s behaviors [16]. Introducing improved and more adaptable agricultural practices can shift the reinforcing loop R1 from continuously decreasing land productivity to improving it after some time. Under the GEF5 Conservation Agriculture Hub, 25 agricultural champions were appointed [53] with the idea being that, over time, the visible benefits of increased land productivity in the fields tended by the agricultural champions would persuade other farmers in the region to adopt sustainable agricultural methods. As land productivity increases, the visible benefits of agriculture could also reduce the negative perceptions of agriculture, increasing available labour and decreasing field abandonment (loop R2). Particular CSA practices promoted by the Conservation Agriculture Hub included mulching in order to increase soil cover, which helps to maintain soil nutrients and soil moisture content. This benefits the catchment more broadly as soil functionality improves, which increases grass cover (loop R7), reducing the overall extent of degradation in the catchment and feeding into loop R3. The CSA practice can be implemented with little funding and can deliver more immediate results, meaning that as an intervention it is less reliant on external funding (which is why it scores highest on criteria 2 of the MCA).
Intervention C: Agrograssing aims to improve vegetation cover by planting grass in areas where soil is exposed and erosion rates are high. Considering the difficulties surrounding the successful implementation of this intervention, such as roaming livestock grazing on the grass at an early stage of its growth (if seeds are used) and the slow process of planting and selling Vetiver grass (Chrysopogon zizanioides), the length of delays relative to the rate of change in the system through soil erosion are longer. The Livestock and Rangeland Management Hub’s activities could support agrograssing via grazing management practices, such as rotational resting, that would help reduce the likelihood of livestock grazing on or trampling upon the grass in early growth stages. A further advantage of Vetiver grass for the purpose of agrograssing in Macubeni is that it is unpalatable to livestock, which reduces the likelihood of livestock grazing on the grass (although grazing management would still be required to prevent trampling) [43]. Improving grass cover can increase soil nutrients, thus positively influencing loop R7. While participating in the MCA, stakeholders noted that if the community were to embrace agrograssing at a larger scale, then the intervention could be more effective, but currently, the scale is too small to be effective for the whole catchment (hence agrograssing having the second lowest score for criterion 2, effectiveness, in the MCA).
The sediment trapping structure SLM intervention (D) is situated higher up at leverage point 10 as it involves physical structures that need to be constructed and installed in order to mitigate soil erosion. This intervention for land rehabilitation influences the disturbed soil structure variable, affecting the whole ‘gully effect’ feedback loop (R9). Sediment trapping structures include stone lining and stone packs built in gullies to stabilise them and silt traps on bare surfaces to trap sediments. Twenty five local residents, trained as land conservation activists under the GEF5 Land Rehabilitation Hub, continuously work on these structures in the degraded landscape [51]. The mitigation of topsoil loss in turn reduces the loss of the organic matter and increases soil function. This change has the potential to shift both the R7 and R8 loops into virtuous cycles as soil functionality impacts grass cover, decreasing the overall extent of degradation and further topsoil loss. Sediment trapping structures face a similar scaling issue to that of agrograssing. At the paddock scale, sediment trapping structures can be effective, but the trapping structures require a lot of resources to be implemented throughout the catchment. There is an additional issue of high external funding reliance: as one project stakeholder noted in the MCA, although the material costs of the structures are minimal (because locally sourced materials are used), the community has stated that they will not continue making any structures without payment.

4. Discussion

4.1. Assessing the Extent of Crop Field Degradation (Research Question 1)

Our spatial analysis found that the majority of the mapped crop fields in Macubeni can be categorised as either “partly used” (47%) or “abandoned” (30%). Almost half of the total number of crop fields were highly degraded (47%), with 65% of the fields categorised as being highly vulnerable to further erosion. Other studies in the Eastern Cape of South Africa conducted in similar catchments found that abandoned fields were correlated with poor land management and/or a lack of land management strategies [54,55]. Some of the consequences of field abandonment include indigenous perennial vegetation species being replaced with arid condition shrubs, biophysical properties of the soil being compromised, and accelerated erosion [38,54]. Accelerated erosion, in turn, influences the overall land productivity. For example, farmers in Didimana, an area of the Eastern Cape adjacent to Macubeni with a similar historical, biophysical, climatic, and socio–political context, indicated that they lose more than 21% of their crops yearly due to erosion [56]. The reinforcing feedback loops conceptualised through and represented in the causal loop diagram (CLD) highlight the way in which multiple vicious cycles interact between land productivity, field abandonment, and degradation.

4.2. Assessing the Drivers of Field Abandonment in Relation to Degradation (Research Question 2)

Multiple studies have tracked the increase in abandoned fields and gully development in South Africa [8,9]. This is especially evident in rural, under-developed and poor areas, such as Macubeni [22,23]. Our systemic analysis of the Macubeni case developed the dynamic hypothesis that field abandonment is driven by diverse factors that include environmental (e.g., erosion and poor soil quality), socio–economic (e.g., land productivity and poor agricultural practices), and social factors (negative perceptions of agriculture and availability of labour) [9,26,47,48]. These diverse factors are inter-related, influenced by feedback effects, and are drivers of field abandonment and degradation that act on the system simultaneously and in interaction with one another, as illustrated in the CLDs (Figure 6, Figure 7, Figure 8 and Figure 9). The combination of these factors and their dynamics demonstrates the value of a systemic approach towards understanding the complex interrelationship between field abandonment and degradation. The systemic interactions between variables also demonstrate the value of employing a leverage points-based analysis of sustainable land management (SLM) interventions, as discussed below.

4.3. Assessing Management Interventions in Relation to the Dynamics of Land Abandonment and Degradation (Research Question 3)

In this paper, we answered research question 3 (whether SLM interventions are capable of tackling the dynamics of land abandonment in relation to degradation) by firstly describing the SLM interventions operating in the case study (Section 3.3). In order to assess the efficacy of the SLM interventions as a means of tackling the dynamics of land abandonment, we used a multi-criteria analysis (MCA), which drew from stakeholders and project managers leading the SLM interventions (Section 3.3), and finally, we incorporated the MCA results in a synthetic discussion of the SLM interventions in relation to the systems leverage points (Section 3.4).
In summary, the SLM interventions encapsulated under the category of ‘climate smart agriculture’ scored the highest on the MCA, with grazing management interventions scoring the second highest (0.26 and 0.22, respectively—see Table 6). By our analysis, grazing management seeks to influence the system at the points of greatest leverage compared to the other SLM interventions (namely, ‘the rules of the system’, point 5 of Meadows’ leverage points framework (see Table 7)). Climate smart agriculture, which scored highest on the MCA, seeks to influence the structure of information flows (leverage point 6), with the other interventions aligned with leverage points 9 and 10. This raises the question of what interventions or actions could possibly address the deeper leverage points that influence “the underpinning values, goals, paradigms, and mindsets that collectively shape the system” (i.e., leverage points 1–4) [33]. One such leverage point is the ‘perceptions of agriculture’ variable, which we discuss in the following sub-section.

4.4. Addressing Negative Perceptions of Agriculture

As shown in Figure 9, negative perceptions of agriculture influence the dynamics of land abandonment via three reinforcing feedback loops: (1) increasing negative perceptions of agriculture reduce available labour, increasing field abandonment and decreasing land productivity, forming the reinforcing cycle R2 (land productivity influencing perceptions); (2) increasing negative perceptions of agriculture also increase the likelihood of permanent abandonment, creating reinforcing loop R5 (perceptions influencing abandonment); and (3) increasing the likelihood of permanent abandonment is both a cause and effect of abandoned fields, via the reinforcing loop R4 (abandonment loop). Apart from the crucial variable of land productivity, the only other variable affecting perceptions of agriculture is ‘demographic shifts’. Demographic shifts in Macubeni that affect land abandonment include ongoing urbanisation and a change in the fraction of youth alongside an aging older generation of existing farmers. At this stage, there are no interventions directly aimed at decreasing the negative perceptions of agriculture in Macubeni. A possible intervention is directly championing and promoting agriculture to the youth, which could serve to shift these three reinforcing feedback loops from their current, undesirable direction (where they are vicious cycles that perpetuate field abandonment and declining land productivity) towards a desirable direction in which decreasing field abandonment and increasing land productivity continually reduces the negative perceptions of agriculture, forming a virtuous cycle. Interventions aimed at shifting these negative perceptions address several leverage points. First, shifting the current dynamic of where field abandonment and land productivity reinforce in a vicious cycle, towards having these same dynamics reinforce as a virtuous cycle, addresses point 7 (the ‘gain around driving positive [i.e., reinforcing] feedback loops’) in the leverage points framework (Figure 1). Second, directly aiming to address the negative perceptions of agriculture is about engaging current paradigms and trying to change peoples’ worldviews, which is positioned at point 2 (intent) in the leverage points framework (Figure 1). However, as Meadows [16] notes, “the higher the leverage point, the more the system will resist changing it” (p. 19). Sources of change resistance against proposed interventions aimed at improving peoples’ perceptions of agriculture, drawn from the literature, include the overall strengthening of rural–urban connections [10]; increasing diversity in household incomes along with declining dependency on agriculture for income [12]; changes to agrarian identities [10]; and broader factors of globalisation, modernisation, and urbanisation [11]. These multiple sources of change resistance show why this particular challenge is likely to remain persistently problematic in the way in which it will continue to drive land abandonment and, in turn, degradation. Based on our analysis, we refer to this as one of two persistent challenges, the second of which we discuss in the following sub-section.

4.5. Using the Multi-Method Approach to Assess Spatial Prioritisation Strategies

As noted in Section 3.3, in the MCA component of this study, we assessed SLM interventions in terms of three criteria (cost, the reliance on external funding, and perceived efficacy of the intervention as a means of tackling land abandonment and associated degradation). In the synthetic leverage points-based analysis (Section 3.4), we discussed the MCA results in relation to the systemic conceptualisation of the dynamics of land abandonment. A persistent challenge that was raised is the difficulty of achieving and maintaining local-level commitment to the required SLM interventions based on evident positive change in relation to the scale of the challenges. As a historically disadvantaged and underdeveloped area, SLM projects in Macubeni are subject to resource constraints and high levels of poverty where the needs greatly outweigh the available resources. For this reason, areas must be prioritised based on a range of factors including cost, projected benefit, and feasibility. Here, we discuss how this study’s combination of spatial analysis, systems analysis, and multi-criteria analysis, drawn together using the synthetic leverage points analysis, can be used to assess different spatial prioritisation strategies in a relatively simple way.
Crop fields could be prioritised using the spatial analysis by overlaying the three spatial layers for ‘usage status’, ‘degradation level’, and ‘vulnerability status’ to explore different prioritisation strategies. We compare and contrast two strategies here (A and B). Strategy A is to prioritise the worst-of-the-worst crop fields that are the largest contributors to degradation by focusing on the fields that are abandoned, with an existing level of degradation ranked as ‘high’ and with a ‘high’ vulnerability status for future degradation occurring (see Table 8). Figure 10a shows the location of these abandoned, highly degraded, and highly vulnerable fields in relation to the villages in the region and the GEF5 pilot areas. As an alternative, Strategy B departs from the rationale that it is better to focus on fields that are currently in-use or partly used, rather than abandoned, because there is more existing investment from the farmers’ sides in the used and partly used fields. Instead of focusing on the used and partly used fields that are already heavily degraded, Strategy B could focus on fields that are moderately degraded, given that it is often quicker and more cost-effective to rehabilitate a landscape that is only partially degraded rather than one that is in a state of complete ruin. Finally, to have some degree of urgency and evidence of why rehabilitation efforts are required, Strategy B could focus on the moderately degraded fields that are rated as ‘highly vulnerable’ to future degradation. The number of fields meeting these criteria for Strategy B is shown in Table 8, with the relative location of these fields in relation to the villages in the region and the GEF5 pilot areas, shown in the map in Figure 10b.
Some immediate differences between the two strategies are evident in Table 8. With Strategy A (prioritising the abandoned fields), a small number of fields could be focused on, which are larger on average than the fields prioritised in Strategy B (an average field size of 11.8 ha for the Strategy A fields, versus an average of 3.7 ha/field for the Strategy B fields). This difference favours prioritizing fields as per Strategy A, given that economies of scale could be gained by having a fewer number of larger fields to rehabilitate for which resources could be pooled. Furthermore, focusing on the abandoned, heavily degraded, and highly vulnerable fields (Strategy A) could address an almost 80% greater area covered by all the crop fields than Strategy B (18% for abandoned fields, versus 10% for used and partly used). However, concerns could be raised that the abandoned fields are already too damaged to make rehabilitation economically viable and, given the fields’ currently abandoned status, farmers could be less likely to buy-in to rehabilitation efforts.
The alternative strategy of prioritizing used and partly used fields (i.e., Strategy B) advocates for focusing on interventions on smaller parcels of land in order to benefit from synergistic interactions between the interventions. For example, a combination of agrograssing and sediment trapping structures could be deployed on the fields to control physical soil structure damage via reducing gullies and stabilizing grass cover; grazing management on the surrounding rangelands could then prevent free-moving livestock from exacerbating the existing gullies and from trampling the crop fields; and CSA practices could increase land productivity in sustainable ways, via increasing water availability and improving soil health via mulching and similar practices. The above examples of harnessing the interactions between these interventions would seek to influence leverage point number 7 (the ‘gain around driving positive feedback loops’) on Meadows’ framework [16]. These positive (i.e., reinforcing) feedback loops are evident in Figure 9 as follows: agrograssing directly affects the grass cover stock; CSA practices address soil functionality, indirectly affecting the grass stock (loop R7); by reducing overgrazing, grass cover can be managed (loop R6); sediment trapping structures can reduce gullies, stabilizing soil (loop R9) and supporting soil functionality (loops R8 and R7).
All development projects operating in historically disadvantaged and underdeveloped areas like Macubeni in South Africa are subject to resource constraints and high levels of poverty where the needs greatly outweigh the available resources, requiring some degree of prioritisation. Prioritisation has many benefits, including increases in efficiency (for example, in a large-scale analysis of rehabilitation in the Brazilian Atlantic Forest, Strassburg et al. [57] showed how strategic prioritisation can triple the conservation gains while halving the costs). One of the main considerations between our prioritisation strategies was whether to focus on heavily degraded or moderately degraded fields. Our systemic analysis of the associated feedback loops supports Strassburg et al.’s [57] argument that, as degradation proceeds, more ecosystem benefits are lost, with the degree of loss of individual benefits increasing. The reinforcing (vicious) cycles continue to drive the system in a destructive direction, towards poorer land productivity, increased land abandonment, and increased degradation. All these factors mean that self-recovery (i.e., recovery without interventions) will be slower and the impact of external interventions (such as those driven by the GEF5 project) will be reduced. This can be mitigated by focusing on a smaller number of fields, as per Strategy B.
Despite the opportunities for positive synergies, focusing the full range of SLM interventions on a smaller number of fields could face pressure from both external sources (such as the GEF funding agency) and internal forces (such as community leaders) to spread the project resources as widely as possible. These pressures can be especially strong when evaluative criteria for a project emphasises ‘number of people affected’ rather than ‘ecosystem change’. It is also important to recognise that ecosystem recovery time is typically longer than a project time frame: where a project may last 3–7 years, the ecosystem recovery of grasslands and wetlands, for example, can run into the decades [58,59]. This emphasises the challenges involved with stakeholders seeing evident change in the landscape from ecosystem restoration and other SLM activities as being a primary motivator to continue performing these activities after the lifespan of a project.

4.6. Study Limitations

This study was limited in a few different respects, which apply to all three of the core methods (the spatial, systems, and multi-criteria analysis) as well as to the systemic analysis. The aerial photographs used for the spatial analysis were from 2015. Although satellite imagery from 2020 was available (via Sentinel and Landsat), the pixel quality of this imagery was inadequate for the accurate mapping of crop fields (hence the choice of aerial photographs which, although older, were of a higher resolution and therefore more appropriate for field mapping). Ideally, aerial photographs captured between 2018 and 2021 could have been used to analyse changes over time (i.e., between 2015 and 2021). This is one possible area for future research.
A second study limitation was the fact that the systemic analysis remained at the qualitative level and that the conceptual understanding of the problem that was gained from developing the CLDs did not then form the basis of a quantitative simulation model [17]. The limitations of CLDs include that they can fail to capture the details of system change in terms of the amplitude/intensity of changes [15]. Qualitative modelling using CLDs is also limited in the way in which temporal dimensions can be assessed. There were multiple temporal dimensions raised in this study which, given the qualitative methodology deployed for the systems analysis, were not analysed in detail. These include the ecosystem recovery times associated with the interventions, which, if modelled quantitatively, could be assessed against a baseline ‘self-recovery’ period. A second temporal dimension is raised by the hypothesis that highly degraded fields have been abandoned for longer periods than others because, as per Koulouri and Giourga [60], longer periods of field abandonment (measured in years to decades) are associated with an intensification of soil erosion and gullies. The time associated with the fields’ abandonment was excluded from the analysis but could be included in a future study. One approach for exploring the temporal dimensions of land abandonment in relation to degradation would be to develop a quantitative system dynamics (SD) model, using the qualitative systems model (as presented in this paper) for the initial conceptualisation. An SD model could simulate different combinations of interventions under multiple scenarios. Developing such a model is therefore another area for future research.
The value of including the Multi-Criteria Analysis (MCA) in this study lay in the way in which the different interventions assessed in the paper could be compared against one another, simultaneously considering economic, environmental, social, and technological aspects [44]. The MCA was also used as a way of structuring stakeholder input, using qualitative variables (such as stakeholders’ perceptions of efficacy) alongside quantitative variables (the financial costs of the interventions). A limitation of MCA is that it cannot show that an action adds more welfare than it detracts. In this respect, MCA is inferior to alternative approaches, such as Cost Benefit Analysis (CBA), given that the former contains no explicit rationale that benefits should exceed costs [45,61]. For this reason, some scholars recommend caution in the use of MCA for policy formulation and policy analysis [41]. Future studies could benefit from a greater inclusion of analyses that account for relative costs and benefits of both acting and not acting (for example, by including the costs of not intervening in the landscape, which were not calculated in our study).
A primary limitation in the systems bounding of this study is the limited incorporation of climate change dynamics. In many parts of southern Africa, climate change is increasing the likelihood of both heavy rainfall and drought [62] (amongst other impacts) with multiple negative implications for the magnitude of soil erosion. As illustrated in the CLD in this paper, heavy rainfall directly increases soil erosion and gully formation; extended drought does the same thing indirectly via decreasing ground cover and vegetation (including grass cover) [29]. Case studies undertaken within Macubeni record that extended drought is perceived by community members to be one of the dominant drivers of land degradation [43]. The interactions between the multiple vectors of climate change, the specific human activities in Macubeni, and the dynamics of soil erosion, is a further area for future research.

5. Conclusions

Degradation in agricultural lands is one of the biggest environmental problems facing the rural regions of South Africa, with implications for land productivity, development, and livelihoods. This is especially true for communal areas such as Macubeni, in the rural Eastern Cape province, where there has been an increase in degradation and cropland abandonment for decades. In this study, GIS tools were used to determine the usage status and level of degradation in Macubeni and were coupled with qualitative systems modelling and a multi-criteria analysis to investigate the drivers of abandoned lands. The study found that most crop fields in Macubeni were either used or abandoned and that the abandoned lands were highly degraded. The increase in abandoned lands was attributed to a complex mix of socially, economically, and environmentally based drivers that are interconnected. The multi-method approach followed in this study enabled a combination of sustainable land management (SLM) interventions to be analysed in relation to the identified system’s leverage points. We suggest that the innovative application of systems thinking through systems diagramming and leverage point analysis, combined with spatial analysis and a multi-criteria analysis, can assist with planning SLM interventions in similar contexts in the developing world.

Supplementary Materials

The following supporting information can be downloaded at: https://www.mdpi.com/article/10.3390/land12030606/s1. Detailed results for the spatial analysis and the multi-criteria analysis, along with further methodological detail, can be found in the Supplementary Materials.

Author Contributions

The co-authors’ individual contributions were as follows: Conceptualisation, S.S., J.K.C.-H. and J.G.; methodology, S.S. and J.K.C.-H.; modelling software, J.K.C.-H. and S.S.; GIS software, S.S.; formal analysis, S.S. and J.K.C.-H.; investigation and data curation, S.S.; writing—original draft preparation, S.S. and J.K.C.-H.; writing—review and editing, S.S., J.K.C.-H. and J.G.; supervision, J.K.C.-H. and J.G.; Funding, J.G. All authors have read and agreed to the published version of the manuscript.

Funding

This research was funded under the Global Environment Facility 5th funding cycle (GEF5) Sustainable Land Management (SLM) Project (GEF5 SLM Project, number 00095288).

Data Availability Statement

The data collected by the authors of this study are available on request from the corresponding author. The data are not publicly available. Data obtained through the GEF5 SLM Project reports and documentation are available upon request with the permission of the project leader.

Acknowledgments

The GEF5 SLM Project for providing access to project documents for analysis. The Tsitsa Project for the spatial analysis methodology. We thank the project team members of the GEF5 SLM project for their input into the MCA; Mary Rose Santillan’s assistance with the MCA is also gratefully acknowledged.

Conflicts of Interest

The authors declare no conflict of interest.

References

  1. Sepuru, T.K.; Dube, T. Remote Sensing Applications: Society and Environment An Appraisal on the Progress of Remote Sensing Applications in Soil Erosion Mapping and Monitoring. Remote Sens. Appl. Soc. Environ. 2018, 9, 1–9. [Google Scholar] [CrossRef]
  2. Orr, B.; Cowie, A.; Castillo Sanchez, V.; Chasek, P.; Crossman, N.; Erlewein, A.; Louwagie, G.; Maron, M.; Metternicht, G.; Minelli, S.; et al. Scientific Conceptual Framework for Land Degradation Neutrality. A Report of the Science-Policy Interface; United Nations Convention to Combat Desertification (UNCCD): Bonn, Germany, 2017. [Google Scholar]
  3. Seutloali, K.E.; Dube, T.; Mutanga, O. Assessing and Mapping the Severity of Soil Erosion Using the 30-m Landsat Multispectral Satellite Data in the Former South African Homelands of Transkei. Phys. Chem. Earth 2017, 100, 296–304. [Google Scholar] [CrossRef]
  4. Valentin, C.; Poesen, J.; Li, Y. Gully Erosion: Impacts, Factors and Control. Catena 2005, 63, 132–153. [Google Scholar] [CrossRef]
  5. ELD Initiative & UNEP. The Economics of Land Degradation in Africa. Benefits of Action Outweigh the Costs. 2015. Available online: https://www.eld-initiative.org/fileadmin/ELD_Filter_Tool/Publication_The_Economics_of_Land_Degradation_in_Africa__Reviewed_/ELD-unep-report_07_spec_72dpi.pdf (accessed on 9 November 2022).
  6. Huchzermeyer, N.; Sibiya, S.; Schlegel, P.; Van der Waal, B. Cultivated Lands in the Upper Tsitsa River Catchment T35 A-E; Department of Environmental Affairs: Grahamstown, South Africa, 2018.
  7. Le Roux, J.J.; Sumner, P.D.; Lorentz, S.A.; Germishuyse, T. Connectivity Aspects in Sediment Migration Modelling Using the Soil and Water Assessment Tool. Geosciences 2013, 3, 1–12. [Google Scholar] [CrossRef]
  8. Jewitt, D.; Goodman, P.S.; Jewitt, D. Systematic Land-Cover Change in KwaZulu-Natal, South Africa: Implications for Biodiversity. S. Afr. J. Sci. 2015, 111, 1–9. [Google Scholar] [CrossRef] [Green Version]
  9. de la Hey, M.; Beinart, W. Why Have South African Smallholders Largely Abandoned Arable Production in Fields ? A Case Study. J. S. Afr. Stud. 2017, 43, 753–770. [Google Scholar] [CrossRef]
  10. Hebinck, P.; Mtati, N.; Shackleton, C. More than Just Fields: Reframing Deagrarianisation in Landscapes and Livelihoods. J. Rural Stud. 2018, 61, 323–334. [Google Scholar] [CrossRef]
  11. Shackleton, S.; Luckert, M. Changing Livelihoods and Landscapes in the Rural Eastern Cape, South Africa: Past Influences and Future Trajectories. Land 2015, 4, 1060–1089. [Google Scholar] [CrossRef]
  12. Twyman, C.; Sporton, D.; Thomas, D.S.G. “Where Is the Life in Farming?”: The Viability of Smallholder Farming on the Margins of the Kalahari, Southern Africa. Geoforum 2004, 35, 69–85. [Google Scholar] [CrossRef]
  13. Poesen, J.; Nachtergaele, J.; Verstraeten, G.; Valentin, C. Gully Erosion and Environmental Change: Importance and Research Needs. Catena 2003, 50, 91–133. [Google Scholar] [CrossRef]
  14. Hassen, G.; Bantider, A. Assessment of Drivers and Dynamics of Gully Erosion in Case of Tabota Koromo and Koromo Danshe Watersheds, South Central Ethiopia. Geoenviron. Disasters 2020, 7, 1–13. [Google Scholar] [CrossRef]
  15. Sterman, J.D. System Dynamics Modeling: Tools For Learning In A Complex World. Calif. Manag. Rev. 2001, 43, 8–25. [Google Scholar] [CrossRef]
  16. Meadows, D. Places to Intervene in a by Donella Meadows. Sustain. Inst. 1999, 19. [Google Scholar]
  17. Turner, B.L.; Menendez, H.M.; Gates, R.; Tedeschi, L.O.; Atzori, A.S. System Dynamics Modeling for Agricultural and Natural Resource Management Issues: Review of Some Past Cases and Forecasting Future Roles. Resources 2016, 5, 40. [Google Scholar] [CrossRef] [Green Version]
  18. Ma, H.; Zhao, H. United Nations: Convention to combat desertification in those countries experiencing serious drought and/or desertification, particularly in Africa. Int. Legal Mater. 1994, 33, 1328–1382. [Google Scholar]
  19. IPBES. Summary for Policymakers of the Thematic Assessment of Land Degradation and Restoration; IPBES: Bonn, Germany, 2018; pp. 1–44. [Google Scholar]
  20. Pretorius, S.N. Sediment Yield Modelling in the Upper Tsitsa Catchment; University of Pretoria: Eastern Cape, South Africa, 2016. [Google Scholar]
  21. Bull, L.J.; Kirkby, M.J. Gully Processes and Modelling. Prog. Phys. Geogr. 1997, 21, 354–374. [Google Scholar] [CrossRef]
  22. Kakembo, V.; Xanga, W.W.; Rowntree, K. Topographic Thresholds in Gully Development on the Hillslopes of Communal Areas in Ngqushwa Local Municipality, Eastern Cape, South Africa. Geomorphology 2009, 110, 188–194. [Google Scholar] [CrossRef]
  23. Kakembo, V. A Reconstruction of the History of Land Degradation in Relation to Land Use Change and Land Tenure in Peddie District, Former Ciskei. Master’s Thesis, Rhodes University, Makhanda, South Africa, 1997. [Google Scholar]
  24. Fabricius, C.; Cundill, G. Building Adaptive Capacity in Systems beyond the Threshold: The Story of Macubeni, South Africa. In Adaptive Capacity and Environmental Governance; Armitage, D., Plummer, R., Eds.; Springer: Berlin/Heidelberg, Germany, 2010; pp. 43–68. [Google Scholar]
  25. Shackleton, R.; Shackleton, C.; Shackleton, S.; Gambiza, J. Deagrarianisation and Forest Revegetation in a Biodiversity Hotspot on the Wild Coast, South Africa. PLoS ONE 2013, 8, e76939. [Google Scholar] [CrossRef] [Green Version]
  26. Blair, D.; Shackleton, C.M.; Mograbi, P.J. Cropland Abandonment in South African Smallholder Communal Lands: Land Cover Change (1950–2010) and Farmer Perceptions of Contributing Factors. Land 2018, 7, 121. [Google Scholar] [CrossRef] [Green Version]
  27. Munroe, D.K.; van Berkel, D.B.; Verburg, P.H.; Olson, J.L. Alternative Trajectories of Land Abandonment: Causes, Consequences and Research Challenges. Curr. Opin. Environ. Sustain. 2013, 5, 471–476. [Google Scholar] [CrossRef]
  28. Shrivastava, P.; Kumar, R. Soil Salinity: A Serious Environmental Issue and Plant Growth Promoting Bacteria as One of the Tools for Its Alleviation. Saudi J. Biol. Sci. 2015, 22, 123–131. [Google Scholar] [CrossRef] [PubMed] [Green Version]
  29. Itzkin, A.; Scholes, M.C.; Clifford-Holmes, J.K.; Rowntree, K.; van der Waal, B.; Coetzer, K. A Social-Ecological Systems Understanding of Drivers of Degradation in the Tsitsa River Catchment to Inform Sustainable Land Management. Sustainability 2021, 13, 516. [Google Scholar] [CrossRef]
  30. Kim, D.H. Introduction to Systems Thinking; Pegasus Communications, Inc.: Arcadia, CA, USA, 1999. [Google Scholar]
  31. Hoffman, M.T.; Todd, S. A National Review of Land Degradation in South Africa: The Influence of Biophysical and Socio-Economic Factors. J. S. Afr. Stud. 2000, 26, 743–758. [Google Scholar] [CrossRef]
  32. Nguyen, N.C.; Bosch, O.J.H. A Systems Thinking Approach to Identify Leverage Points for Sustainability: A Case Study in the Cat Ba Biosphere Reserve, Vietnam. Syst. Res. Behav. Sci. 2013, 30, 104–115. [Google Scholar] [CrossRef] [Green Version]
  33. Abson, D.J.; Fischer, J.; Leventon, J.; Newig, J.; Schomerus, T.; Vilsmaier, U.; Von Wehrden, H.; Abernethy, P.; Ives, C.D.; Jager, N.W.; et al. Leverage Points for Sustainability Transformation. Ambio 2016, 46, 30–39. [Google Scholar] [CrossRef] [PubMed] [Green Version]
  34. Shackleton, C.M.; Gambiza, J. Social and Ecological Trade Offs in Combating Land Degradation: The Case of Invasion by a Woody Shrub (Euryops Floribundus) at Macubeni, South Africa. Land Degrad. Dev. 2008, 19, 454–464. [Google Scholar] [CrossRef]
  35. Bergsma, E.; Charman, P.; Gibbons, F.; Hurni, H.; Moldenhauer, W.C.; Panichapong, S. Terminology for Soil Erosion and Conservation; International Society of Soil Science: Vienna, Austria, 1996. [Google Scholar]
  36. Department of Agriculture & LandCare South Africa. Macubeni Key Resource Areas: Land Care Project Plan 2007–2009; Prepared by Carsten Riedel & Michelle Terblanche of RuLiV; Department of Agriculture and LandCare SA: London, UK, 2009.
  37. Schlegel, P.; Huchzermeyer, N.; Van der Waal, B. Biophysical Monitoring Plan, Tsitsa River T35 A-D; Department of Environmental Affairs: Grahamstown, South Africa, 2018.
  38. Kakembo, V.; Rowntree, K.M. The Relationship between Land Use and Soil Erosion in the Communal Lands near Peddie Town, Eastern Cape, South Africa. Land Degrad. Dev. 2003, 14, 39–49. [Google Scholar] [CrossRef]
  39. Cundill, G. Learning, Governance and Livelihoods: Toward Adaptive Co-Management under Resource Poor Conditions in South Africa. Ph.D. Thesis, Rhodes University, Makhanda, South Africa, 2008. [Google Scholar]
  40. Mucina, L.; Rutherford, M.C. The Vegetation of South Africa, Lesotho and Swaziland; Ladislav, M., Rutherford, M.C., Eds.; South African National Biodiversity Institute: Pretoria, South Africa, 2006. [Google Scholar]
  41. World Weather. Available online: https://www.worldweatheronline.com/macubeni-weather/eastern-cape/za.aspx (accessed on 28 May 2021).
  42. Statistics South Africa. Migration Dynamics of Women, Children and the Elderly in South Africa; Statistics South Africa: Pretoria, South Africa, 2020.
  43. Chappel, A. Extent, Drivers and Perceptions of Land Degradation across Three Villages in the Communal Lands of Machubeni, Eastern Cape. BSc Honours Thesis, Rhodes University, Makhanda, South Africa, 2018. [Google Scholar]
  44. Kurka, T.; Blackwood, D. Selection of MCA Methods to Support Decision Making for Renewable Energy Developments. Renew. Sustain. Energy Rev. 2013, 27, 225–233. [Google Scholar] [CrossRef]
  45. Dodgson, J.S.; Spackman, M.; Pearman, A.; Phillips, L.D. Multi-Criteria Analysis: A Manual; Report for the Department of Communities and Local Government; CLG: London, UK, 2009.
  46. Melville-Shreeve, P.; Ward, S.; Butler, D. Rainwater Harvesting Typologies for UK Houses: A Multi Criteria Analysis of System Configurations. Water 2016, 8, 129. [Google Scholar] [CrossRef] [Green Version]
  47. Manyevere, A.; Muchaonyerwa, P.; Laker, M.C.; Mnkeni, P.N.S. Farmers’ Perspectives with Regard to Crop Production: An Analysis of Nkonkobe Municipality, South Africa. J. Agric. Rural Dev. Trop. Subtrop. 2014, 115, 41–53. [Google Scholar]
  48. FAO. The Role of Agriculture and Rural Development in Revitalizing Abandoned/Depopulated Areas; FAO: Rome, Italy, 2006. [Google Scholar]
  49. Ruliv. Macubeni Land Use Plan Assessment Report; Ruliv Household Survey; Ruliv: East Londo, South Africa, 2004. [Google Scholar]
  50. Bahta, Y.T. Smallholder Livestock Farmers Coping and Adaptation Strategies to Agricultural Drought. AIMS Agric. Food 2020, 5, 964–982. [Google Scholar] [CrossRef]
  51. Le Roux, J.J. Monitoring Soil Erosion in South Africa at a Regional Scale; SAEON: Pretoria, South Africa, 2011. [Google Scholar]
  52. Newell, B. Simple Models, Powerful Ideas: Towards Effective Integrative Practice. Glob. Environ. Chang. 2012, 22, 776–783. [Google Scholar] [CrossRef]
  53. GEF5 SLM; Project Deliverables, Unpublished Report; Rhodes University: Grahamstown, South Africa, 2020.
  54. Kakembo, V.; Rowntree, K.; Palmer, A.R. Topographic Controls on the Invasion of Pteronia Incana (Blue Bush) onto Hillslopes in Ngqushwa (Formerly Peddie) District, Eastern Cape, South Africa. Catena 2007, 70, 185–199. [Google Scholar] [CrossRef] [Green Version]
  55. Itzkin, A.; Clifford-Holmes, J.K.; Scholes, M.; Coetzer, K. Approaches to Enhance Integration and Monitoring for Social-Ecological Systems. Land 2022, 11, 1848. [Google Scholar] [CrossRef]
  56. Ighodaro, I.D.; Lategan, F.S.; Mupindu, W. The Impact of Soil Erosion as a Food Security and Rural Livelihoods Risk in South Africa. J. Agric. Sci. 2016, 8, 1–12. [Google Scholar] [CrossRef] [Green Version]
  57. Strassburg, B.B.N.; Beyer, H.L.; Crouzeilles, R.; Iribarrem, A.; Barros, F.; de Siqueira, M.F.; Sánchez-Tapia, A.; Balmford, A.; Sansevero, J.B.B.; Brancalion, P.H.S.; et al. Strategic Approaches to Restoring Ecosystems Can Triple Conservation Gains and Halve Costs. Nat. Ecol. Evol. 2019, 3, 32–70. [Google Scholar] [CrossRef] [Green Version]
  58. Bullock, J.M.; Aronson, J.; Newton, A.C.; Pywell, R.F.; Rey-Benayas, J.M. Restoration of Ecosystem Services and Biodiversity: Conflicts and Opportunities. Trends Ecol. Evol. 2011, 26, 541–549. [Google Scholar] [CrossRef]
  59. UNCCD. Global Land Outlook: First Edition; Report of the United Nations Convention to Combat Desertification (UNCCD); UNCCD: Bonn, Germany, 2017. [Google Scholar]
  60. Koulouri, M.; Giourga, C. Land Abandonment and Slope Gradient as Key Factors of Soil Erosion in Mediterranean Terraced Lands. Catena 2007, 69, 274–281. [Google Scholar] [CrossRef]
  61. Dobes, L.; Bennett, J. Multi-Criteria Analysis: “Good Enough” for Government Work? Agenda A J. Policy Anal. Reform 2009, 16, 7–29. [Google Scholar] [CrossRef]
  62. Kusangaya, S.; Warburton, M.L.; Archer van Garderen, E.; Jewitt, G.P.W. Impacts of Climate Change on Water Resources in Southern Africa: A Review. Phys. Chem. Earth 2014, 67–69, 47–54. [Google Scholar] [CrossRef]
Figure 1. Visual summary of Meadows’ twelve leverage points (left) and Abson et al.’s [33] reframing of the leverage points as four categories of system characteristics (right). Adapted from Abson et al. [33] and Meadows [16].
Land 12 00606 g001
Figure 2. Map showing the location of Macubeni area as the study site of the Global Environmental Facility 5th funding cycle (GEF5) Sustainable Land Management project.
Land 12 00606 g002
Figure 3. Summary of the research process. The rectangles represent the main steps, with the numbered circles showing the overall sequence. The thick coloured arrows between the research steps denote the primary process flow, with the solid black arrows denoting the main iterations in the form of ‘reviews’. Finally, the dashed arrow shows one-way input from the spatial analysis into the leverage points analysis.
Land 12 00606 g003
Figure 4. The spatial distribution of used, partly used, and abandoned crop fields in Macubeni.
Land 12 00606 g004
Figure 5. (A) Level of degradation in the croplands of Macubeni, Ward 13; (B) vulnerability to degradation.
Land 12 00606 g005
Figure 6. Introductory diagram for drivers of abandoned lands (Version 1 of 3 causal loop diagrams (CLDs)), showing three stock variables (in boxes) and five reinforcing® feedback loops. See Table 1 for full explanations of the diagrammatic conventions.
Land 12 00606 g006
Figure 7. Version 2 of three CLDs showing reinforcing loop (R1) poor agricultural practices, loop (R2) for land productivity, loop (R3) of labour, and loop (R4) for degradation. Note that the dashed arrow between ‘abandoned fields’ and ‘total arable land under cultivation’ is only for presentation purposes to differentiate overlapping arrows.
Land 12 00606 g007
Figure 8. Expanded CLD (version 3).
Land 12 00606 g008
Figure 9. Full causal loop diagram (v.4) indicating intervention points in the system (highlighted in yellow). See Figure 6, Figure 7 and Figure 8 for a breakdown of the variables and loops shown in an integrated format here. Dashed arrows are for maintaining diagrammatic clarity only in the case of overlapping arrows (and do not, therefore, have a specific meaning). Double-lines on select arrows = delays.
Land 12 00606 g009
Figure 10. (A) = abandoned fields that are highly degraded and highly vulnerable; (B) = crop fields that are used, moderately degraded, and highly vulnerable (in green); and partly used, moderately degraded, and highly vulnerable (in yellow).
Land 12 00606 g010
Table 1. Generic performance matrix. Wt = weight; Wt’d perf. = weighted performance.
Interventions
Intervention AIntervention BIntervention C
WtDirectionPerf.Wt’d
Perf.
Perf.Wt’d
Perf.
Perf.Wt’d
Perf.
Criterion 10.3−12−0.61−0.34−1.2
Criterion 20.7132.12.51.753.52.45
Score---1.5 1.45 1.25
Table 2. Diagrammatic conventions of Causal Loop Diagrams.
SymbolDescription
Land 12 00606 i001Positive relationship (where a change in the cause results in a change in the effect in the same direction—i.e., an increase in the cause results in an increase in the effect, and vice versa)
Land 12 00606 i002Negative relationship (where a change in the cause results in a change in the effect in the opposite direction—i.e., where an increase in the cause results in a decrease in the effect, and vice versa)
Land 12 00606 i003Delayed effect
Land 12 00606 i004Reinforcing feedback loop
Land 12 00606 i005Balancing feedback loop
Land 12 00606 i006Stock variables can be anything that accumulates and de-accumulates (both material, such as water in a dam or total agricultural land, and non-material, such as trust). All feedback loops must include at least one stock.
Table 3. Summary of the interventions.
InterventionDescriptionAssociated GEF5 SLM Programme
A. Sediment trapping structuresReducing sediment yield from rill and gully erosion, using stone lines, brush silt traps, and stone packsLand Rehabilitation
Hub
B. Climate Smart
Agriculture
Improving agricultural adaptation to climate change, including improving tillage practices, increasing soil cover via mulching, and crop rotation to increase plant diversityConservation Agriculture
Hub
C. AgrograssingRevegetating bare patches of land, focusing on gully headsLand Rehabilitation
Hub
D. Grazing managementShifting from open-access grazing regimes, to using camps and rotational grazingLivestock and Rangeland Management Hub
Table 4. Summary cost data for Criteria 1 (C.1) of the Multi-Criteria Analysis. All costs are represented in South African Rand (ZAR), calculated on an annual basis. Costs are normalized against the highest cost intervention (C. Agrograssing). Cross-references to Tables S2–S5 refer to the supporting information in Supplementary Materials.
InterventionTotal Cost (ZAR)Normalised CostSupporting Information
A. Sediment trapping structures526,5000.30See Table S2
B. Climate Smart Agriculture305,5000.17See Table S3
C. Agrograssing1,782,2401.00See Table S4 and Figure S1
D. Grazing management518,0000.29See Table S5
Table 5. Stakeholder (SH) workshop ratings for criteria 2 (C.2) and 3 (C.3) of the MCA. Avg. = average score; Max. = maximum score.
Stakeholder (SH)Scores
CriteriaIntervention OptionsSH #1SH #2SH #3SH #4SH #5SH #6SH #7Avg.Max.Norm-alised
Reliance on external funding (5 = no reliance;
1 = completely reliant)
A. Sed. Trapping structures11233312.050.40
B. Climate Smart Agriculture23332232.650.52
C. Agrograssing22223222.150.42
D. Grazing management22241122.050.40
Perceived efficacy
(10 = very effective;
0 = completely ineffective)
A. Sed. Trapping structures55552.5554.6100.46
B. Climate Smart Agriculture5557.557.555.7100.57
C. Agrograssing555557.555.4100.54
D. Grazing management57.557.557.57.56.4100.64
Table 6. MCA Performance Matrix. Perf. = performance; Wt’d perf = weighted performance.
Performance
Matrix
Interventions
A.
Sed. Trapping Structures
B.
Climate Smart Agric.
C.
Agrograssing
D.
Grazing Management
WtDirectionPerf.Wt’d
Perf.
Perf.Wt’d
Perf.
Perf.Wt’d
Perf.
Perf.Wt’d
Perf.
C1. Cost0.4−10.3−0.1200.17−0.0681−0.4000.29−0.116
C2. Funding reliance0.210.40.0800.520.1040.420.0840.40.080
C3. Efficacy0.410.460.1840.570.2280.540.2160.640.256
Total1 0.144 0.264 −0.100 0.220
Table 7. Summary of the interventions’ performance on the MCA in relation to each intervention’s associated leverage point, ranked in order from highest to lowest leverage points.
InterventionRanking on the Multi-Criteria Analysis (MCA)Associated Leverage Point (Abson et al., 2016 [33] and Meadows, 1999 [16])
D. Grazing management2Point 5: Rules of the System
(e.g., incentives and constraints)
B. Climate smart agriculture1Point 6: The structure of information flows
C. Agrograssing4Point 9: The length of delays relative to the rate of system change
A. Sediment trapping structures3Point 10: The structure of material stocks and flows and nodes of intersection
Table 8. Comparative scenarios for spatial prioritisation of interventions.
Usage StatusDegradation LevelVulnerability StatusNo. of Crop Fields (Fields)Area (ha)Avg Field Size (ha/Field)% Area Covered (All Crop Fields)
(a)
Abandoned
HighHigh48566.6711.817.93
(b)
Used + partly used
ModerateHigh88328.003.710.38
Disclaimer/Publisher’s Note: The statements, opinions and data contained in all publications are solely those of the individual author(s) and contributor(s) and not of MDPI and/or the editor(s). MDPI and/or the editor(s) disclaim responsibility for any injury to people or property resulting from any ideas, methods, instructions or products referred to in the content.

