
Exploring the Application of a Debris Flow Likelihood Regression Model in Mediterranean Post-Fire Environments, Using Field Observations-Based Validation


Abstract
:1. Introduction
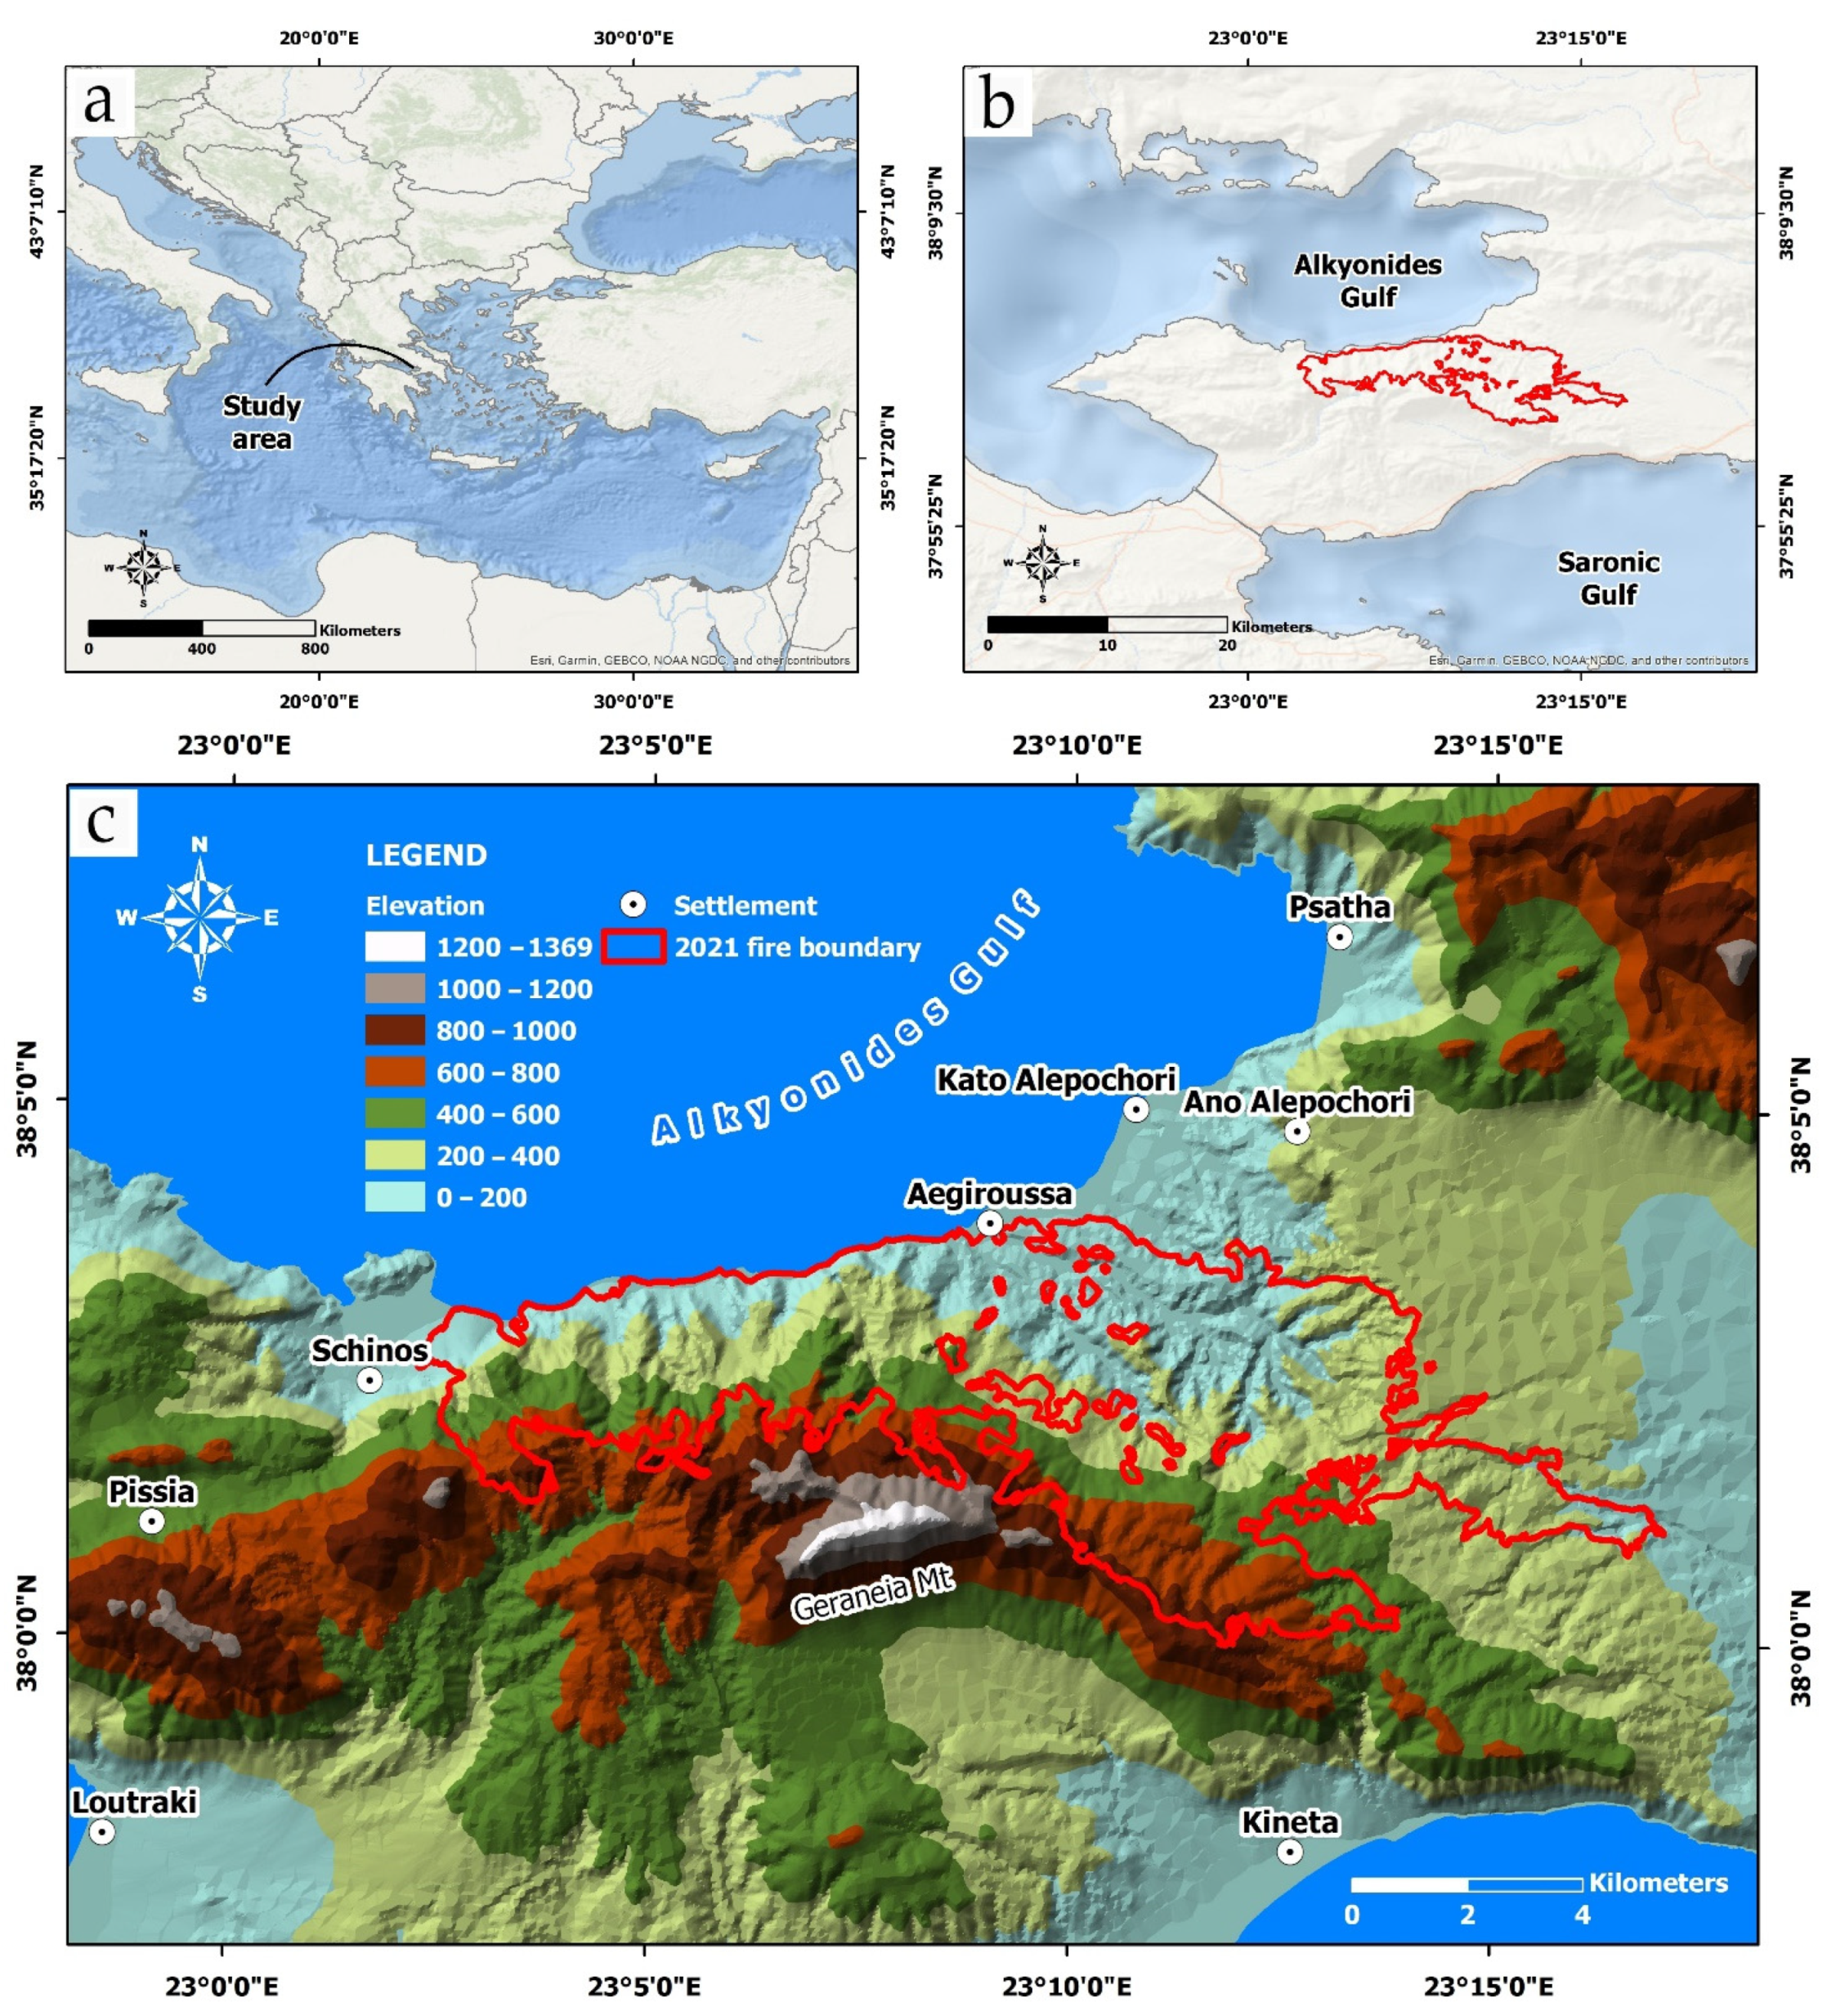
2. Study Area
2.1. Setting
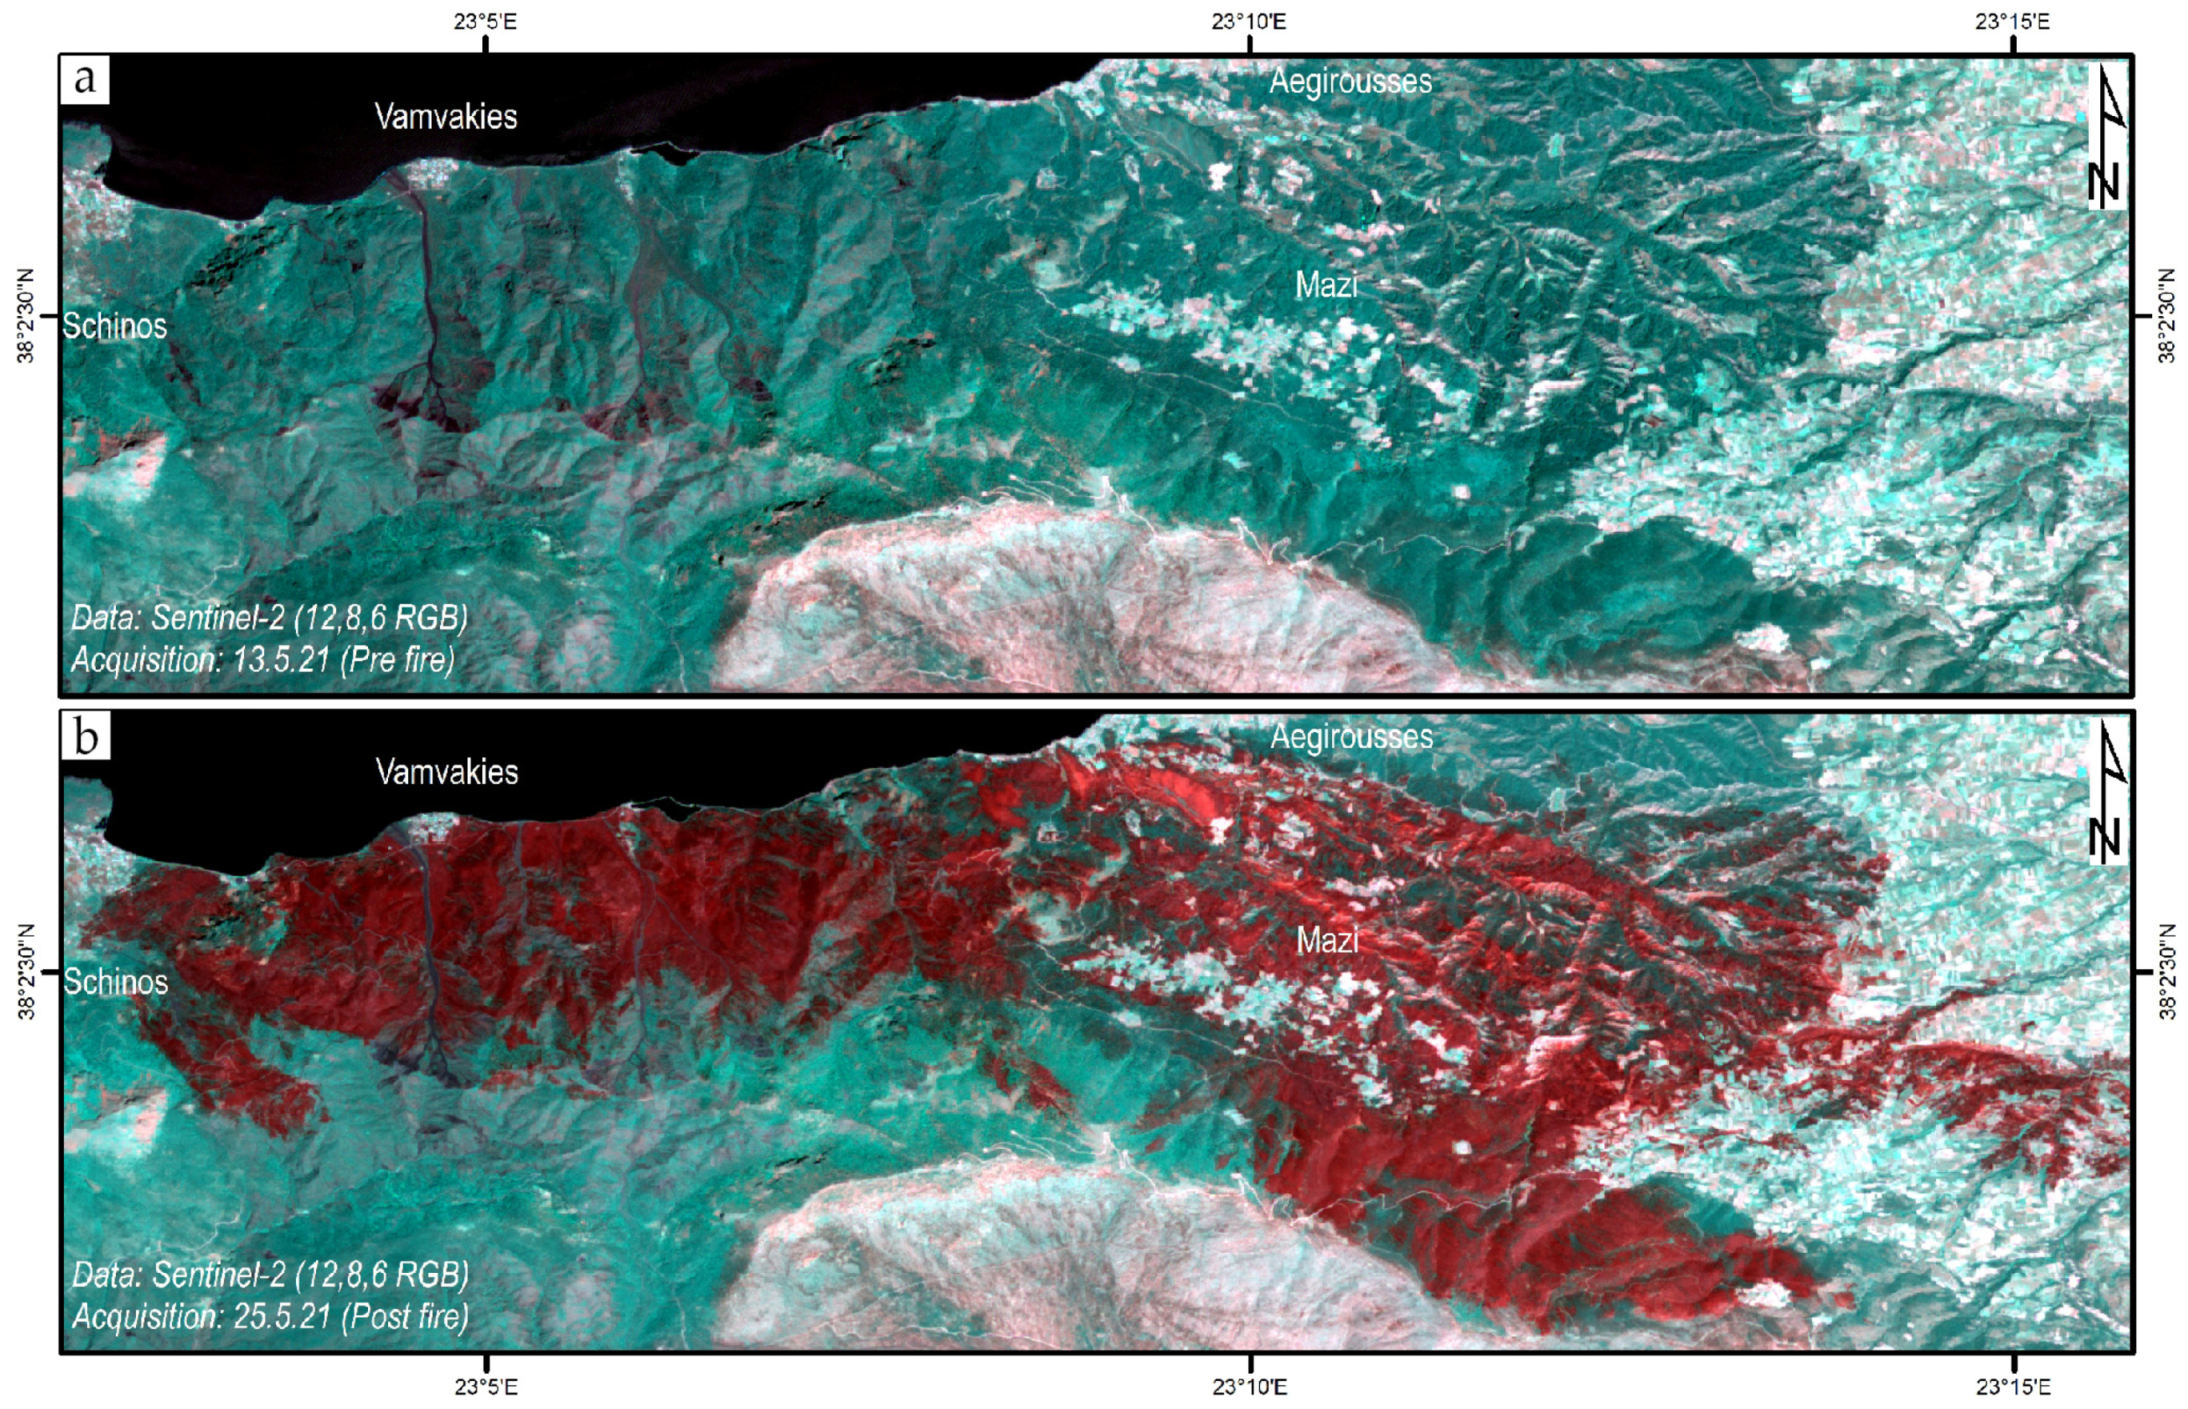
2.2. The 2021 Fire Event
3. Materials and Methods
3.1. Approach
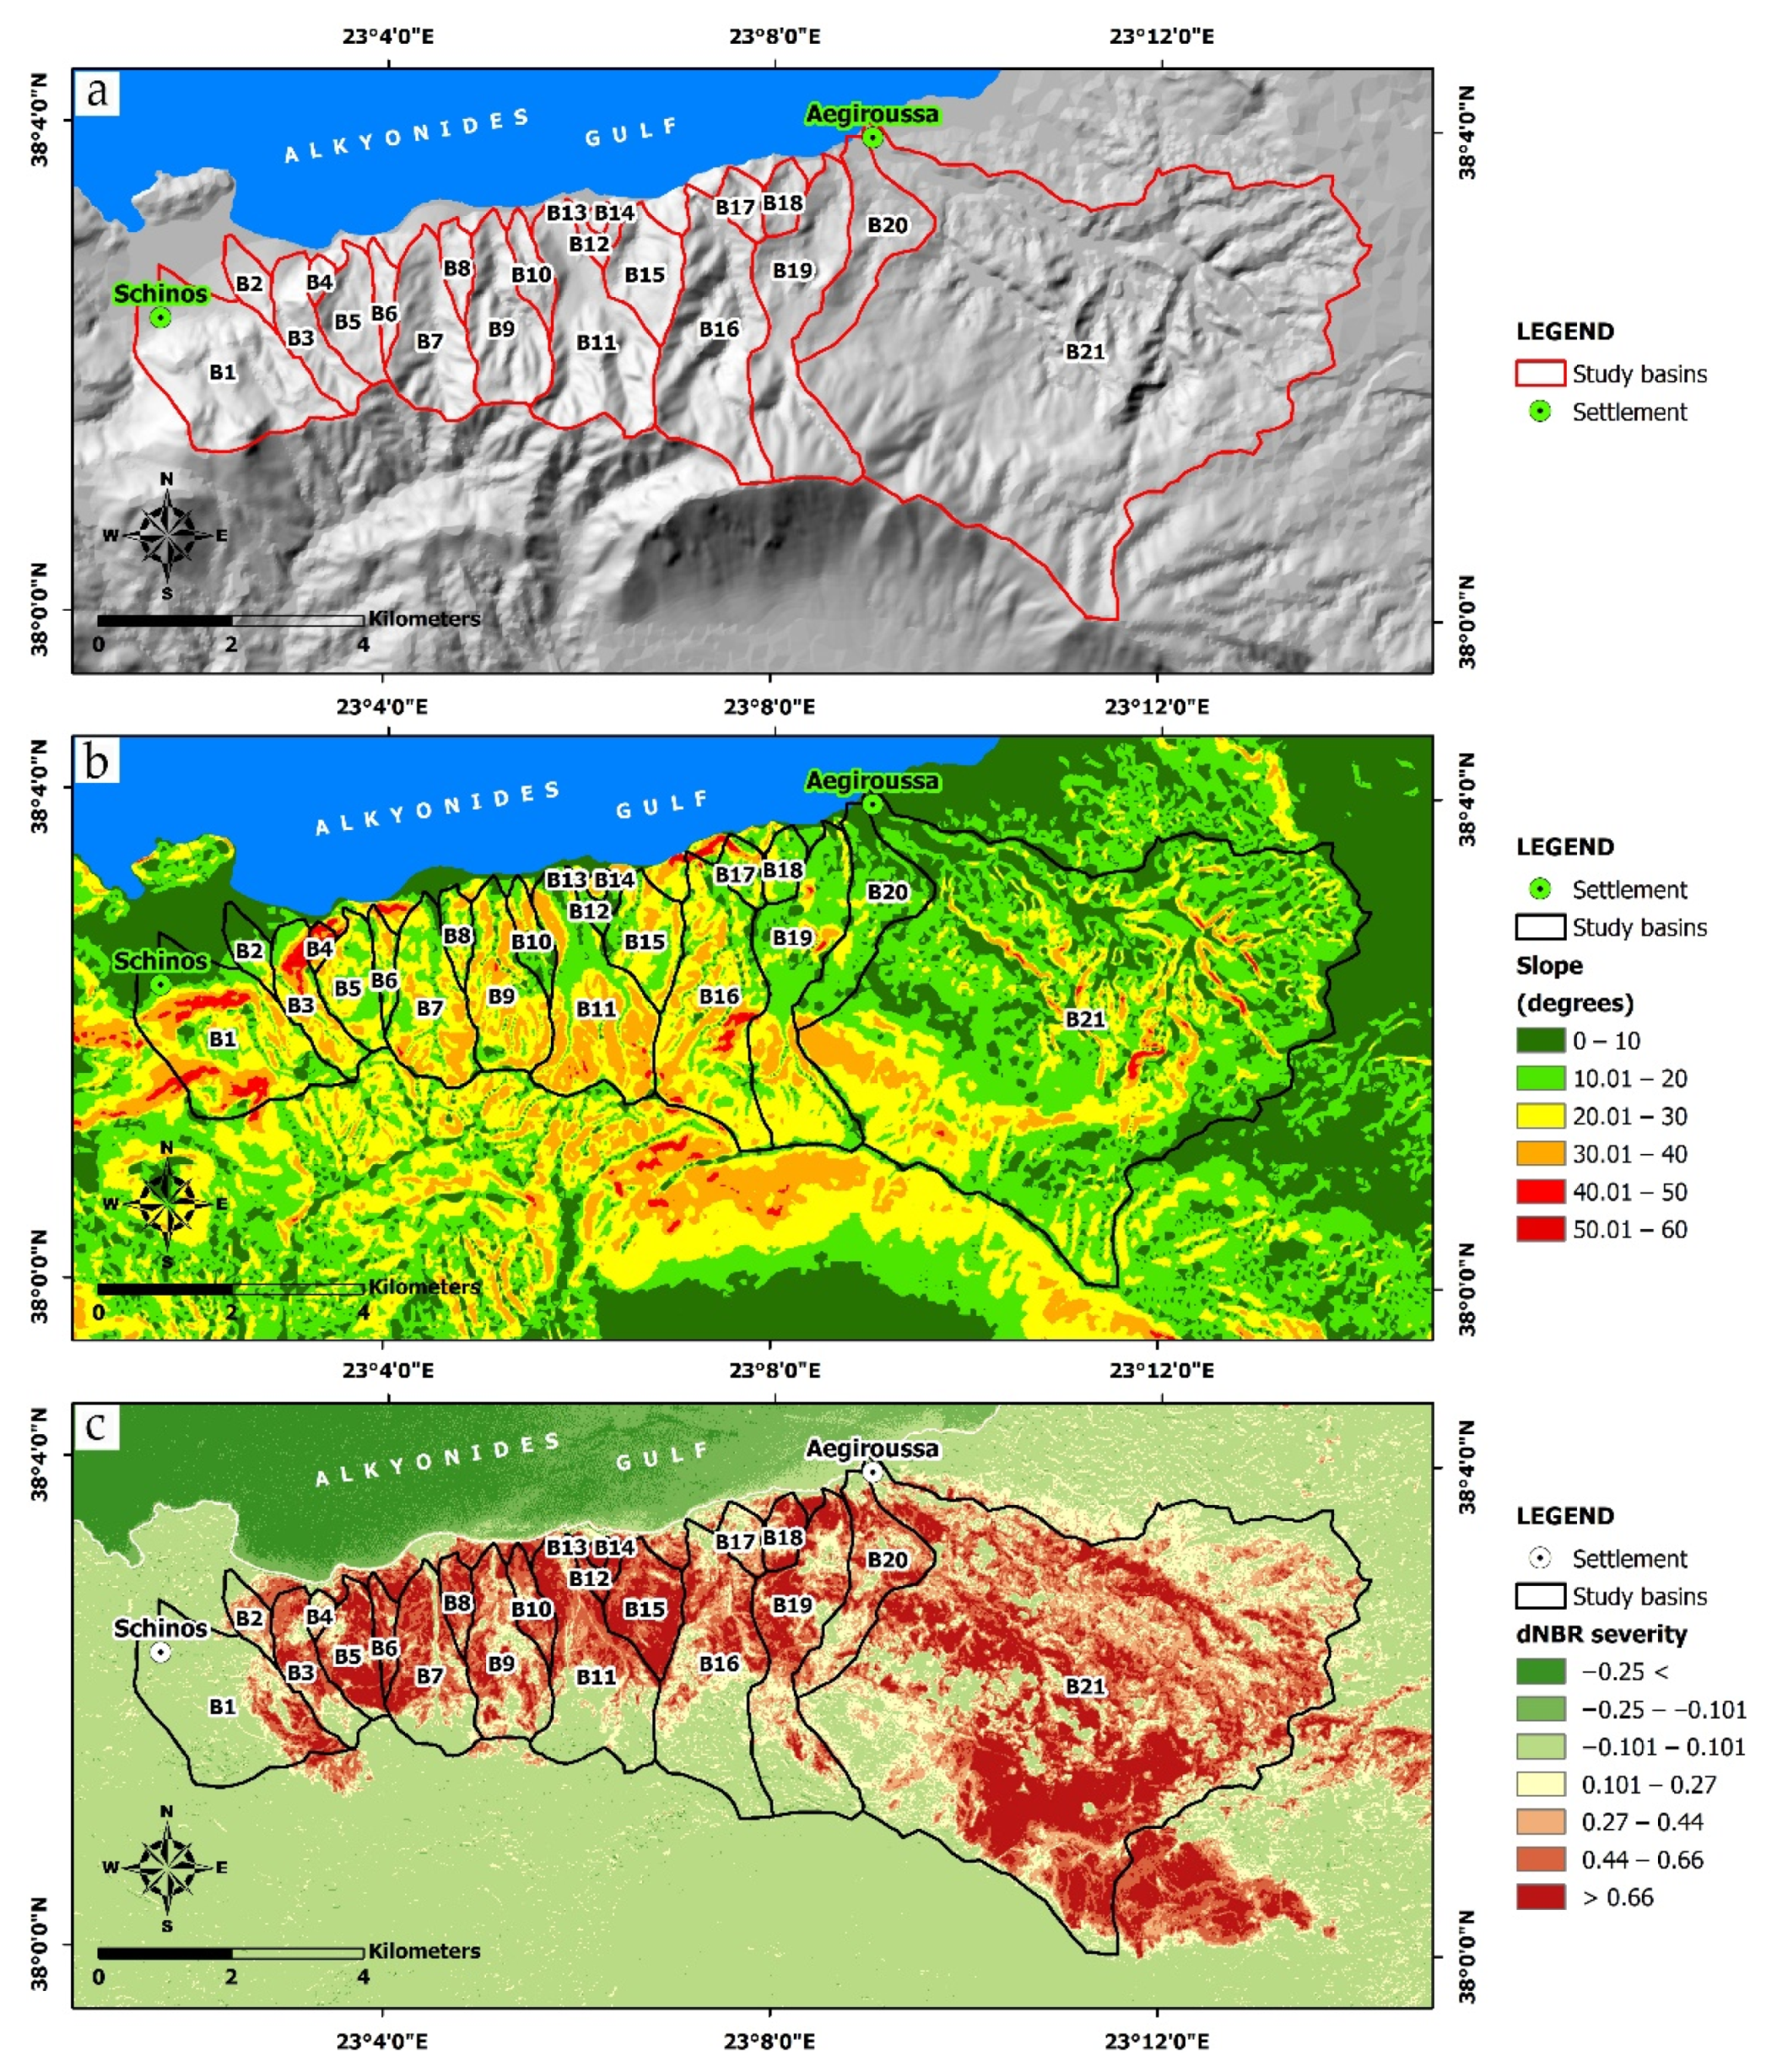
3.2. Data Collection
- Collection of elevation and slope raster data, 15 min design rainfall data, and soil erodibility factor raster data of the study area;
- Calculation of the dNBR index using satellite imagery of the burnt area and calculation of BARC4 soil burn severity raster data (based on the dNBR index);
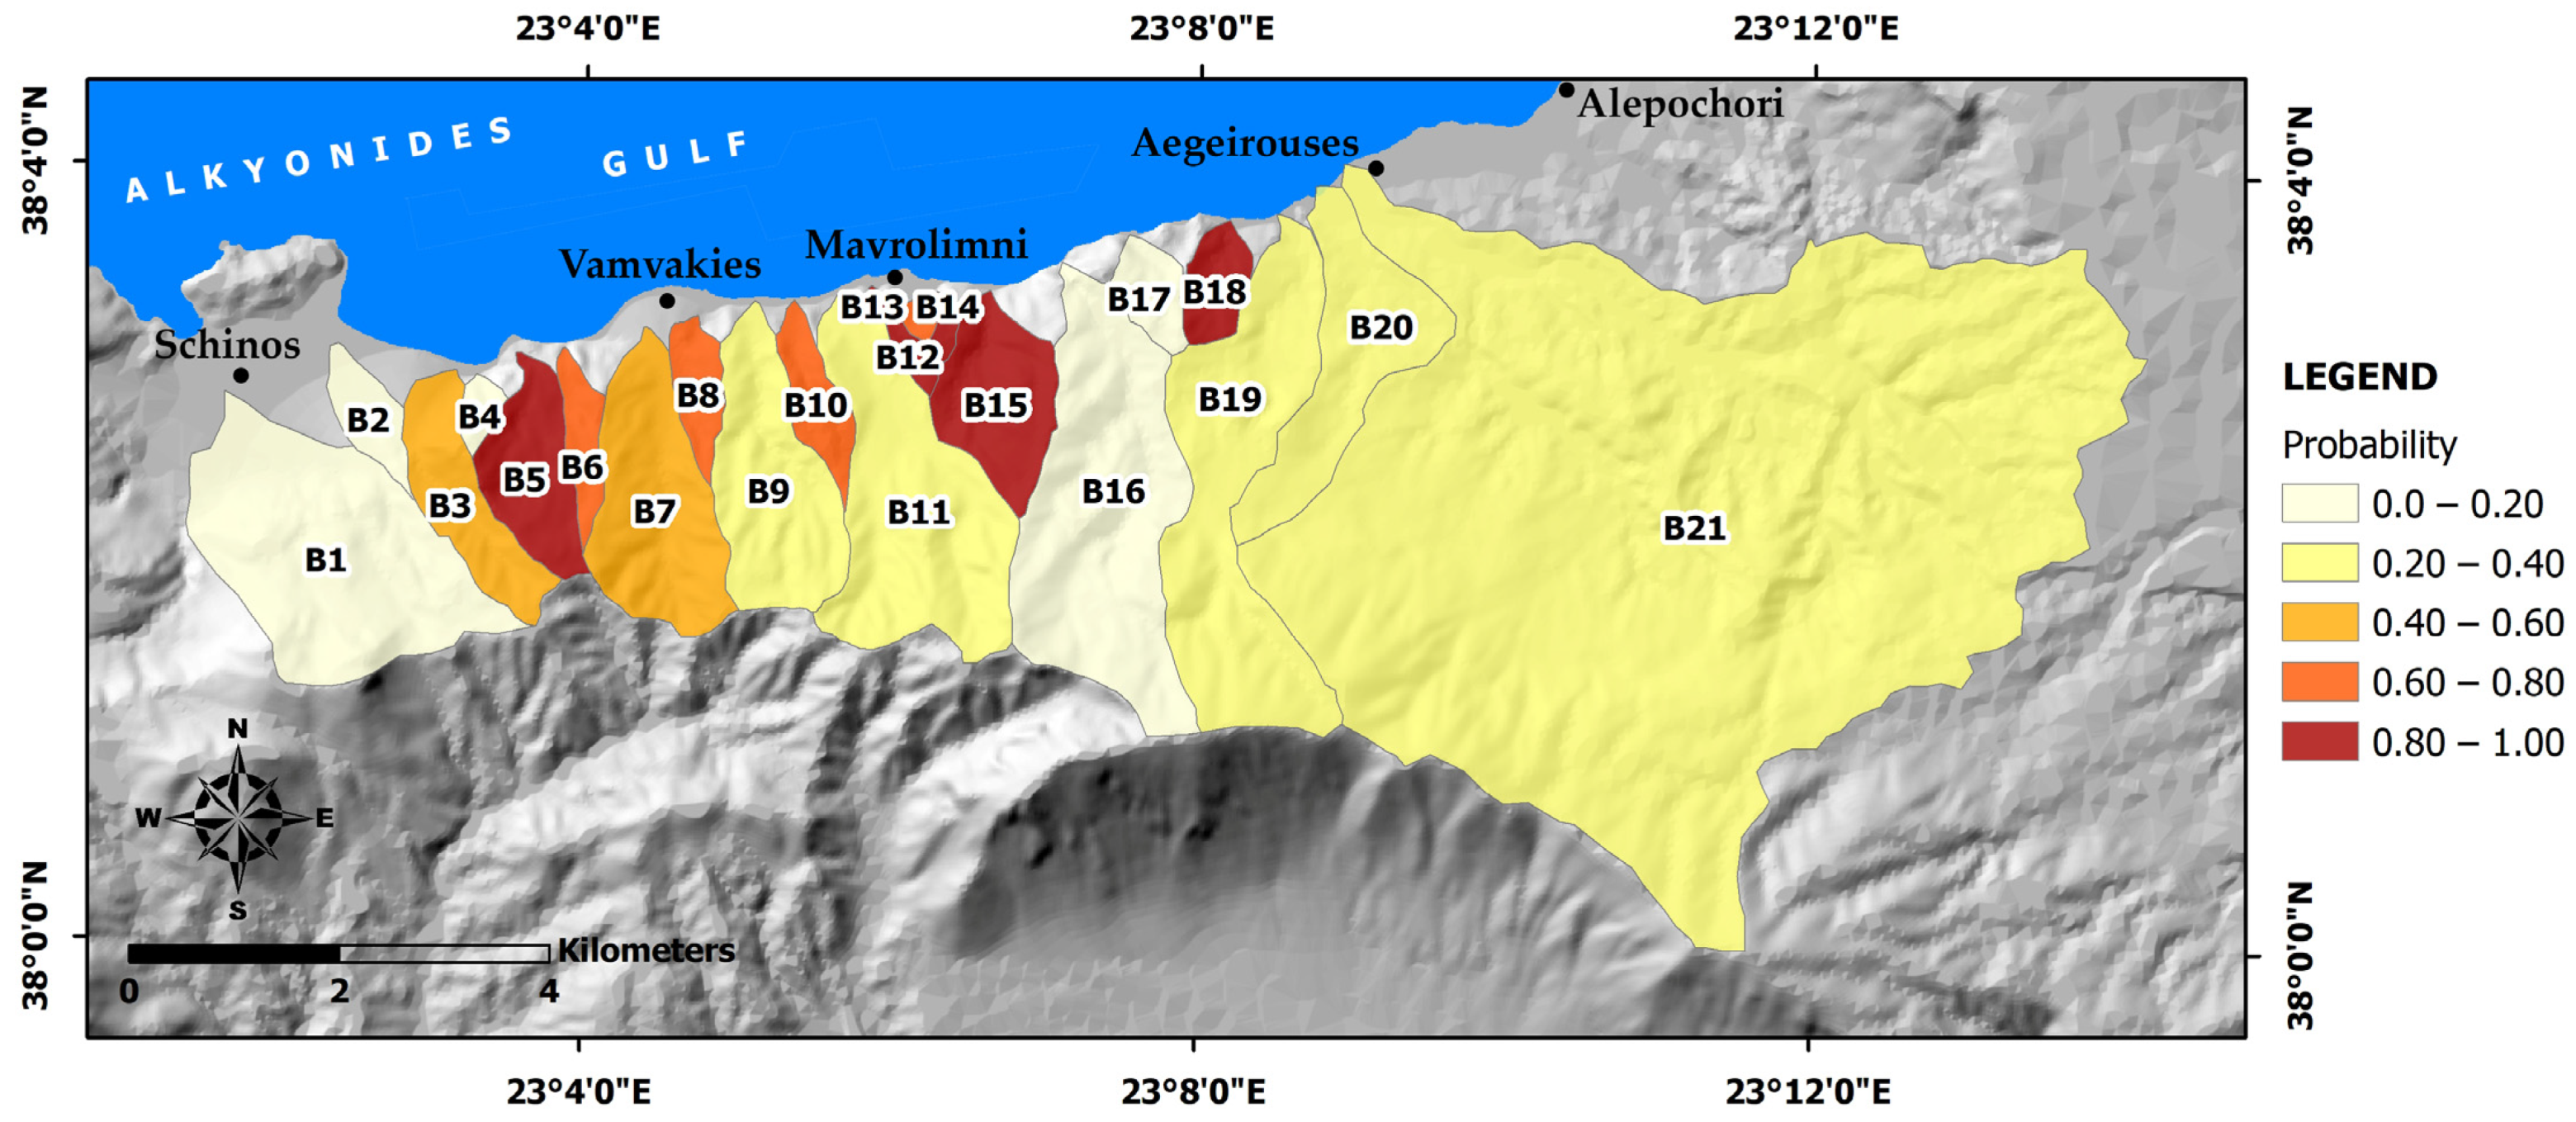
- Calculation of probability value for each basin by applying the Staley et al. [50] model (i.e., Equations (1)–(3));
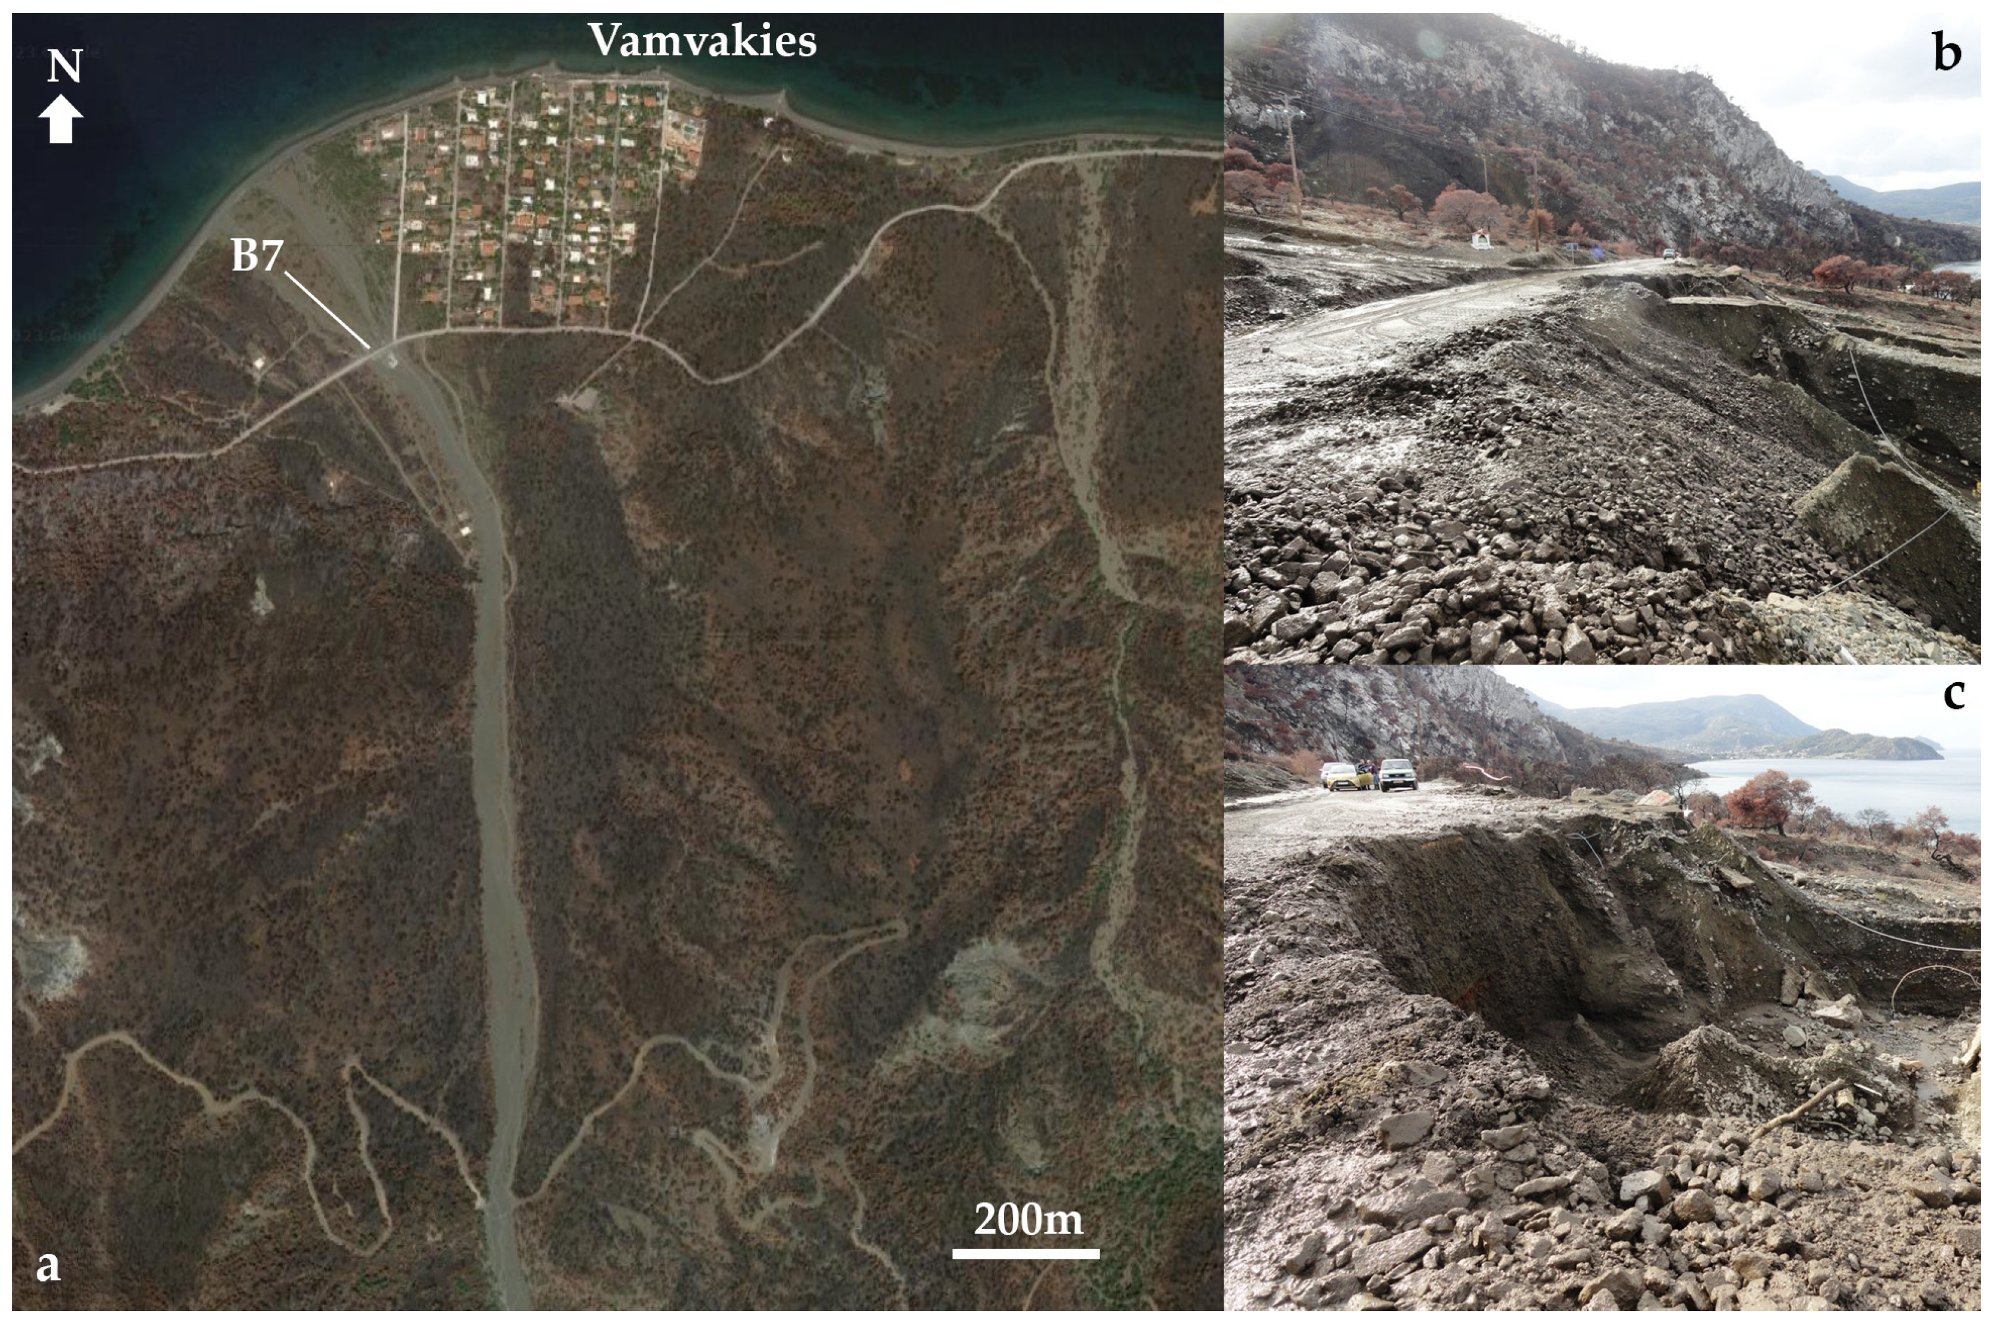
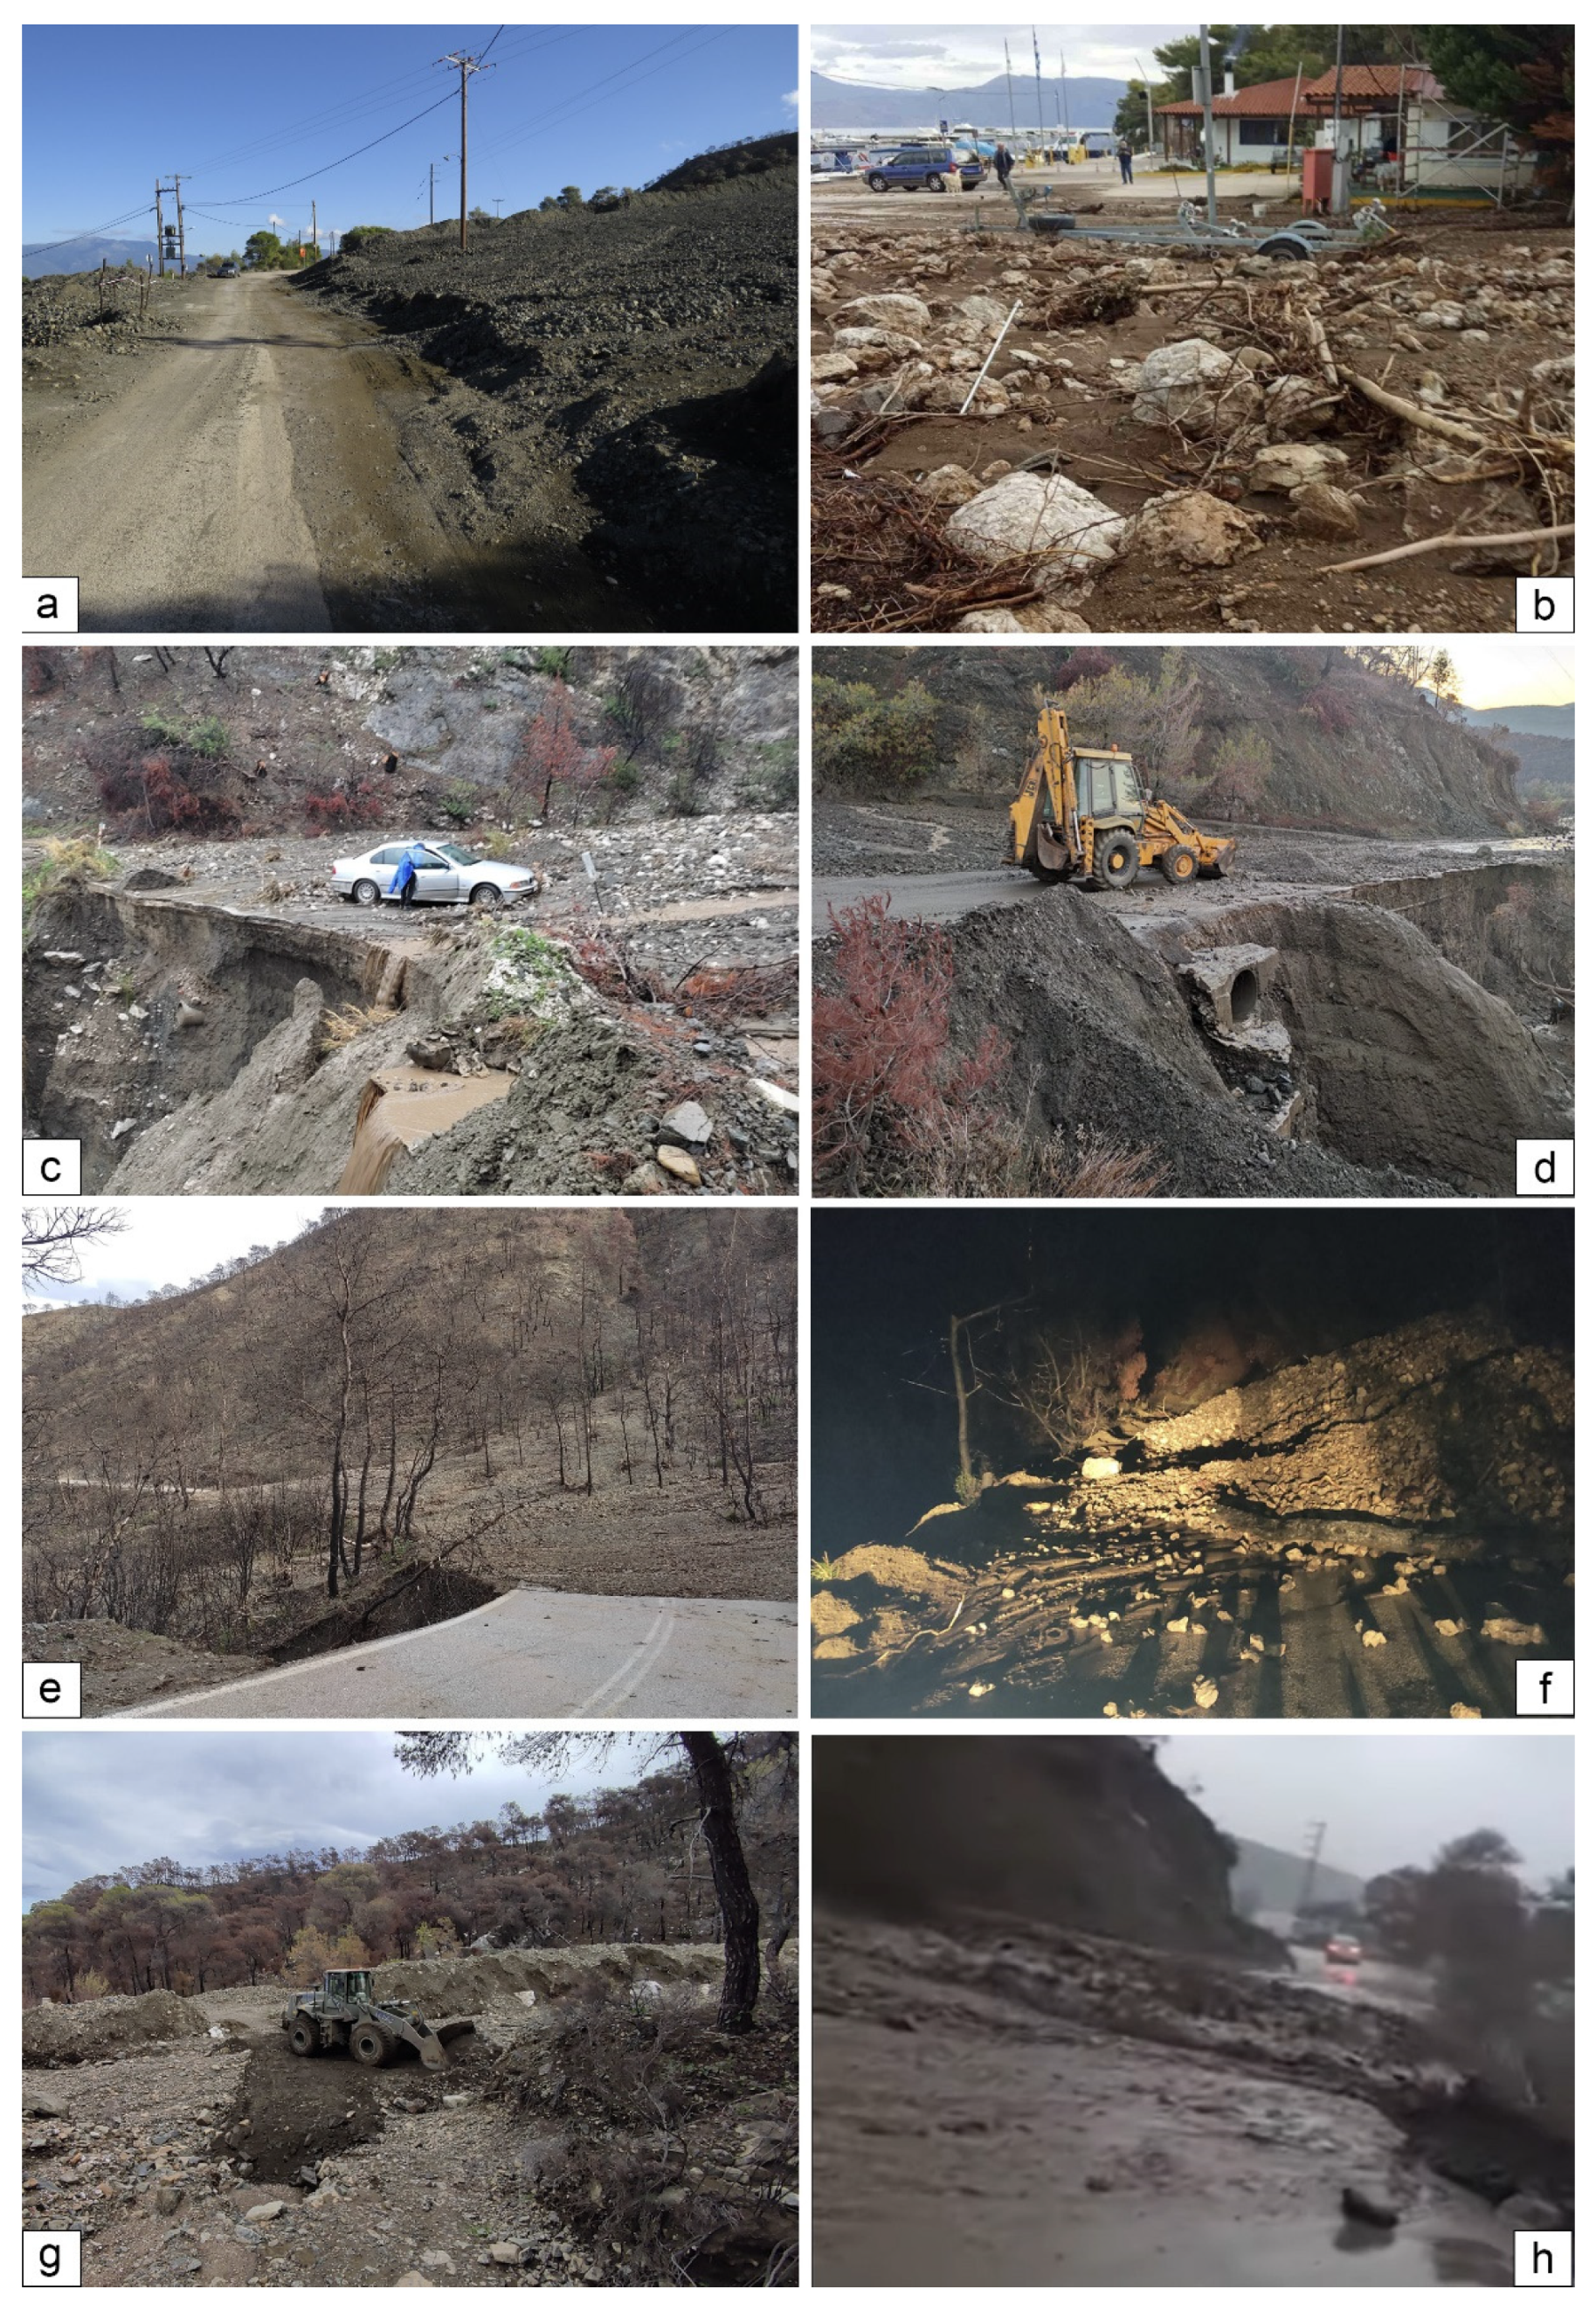
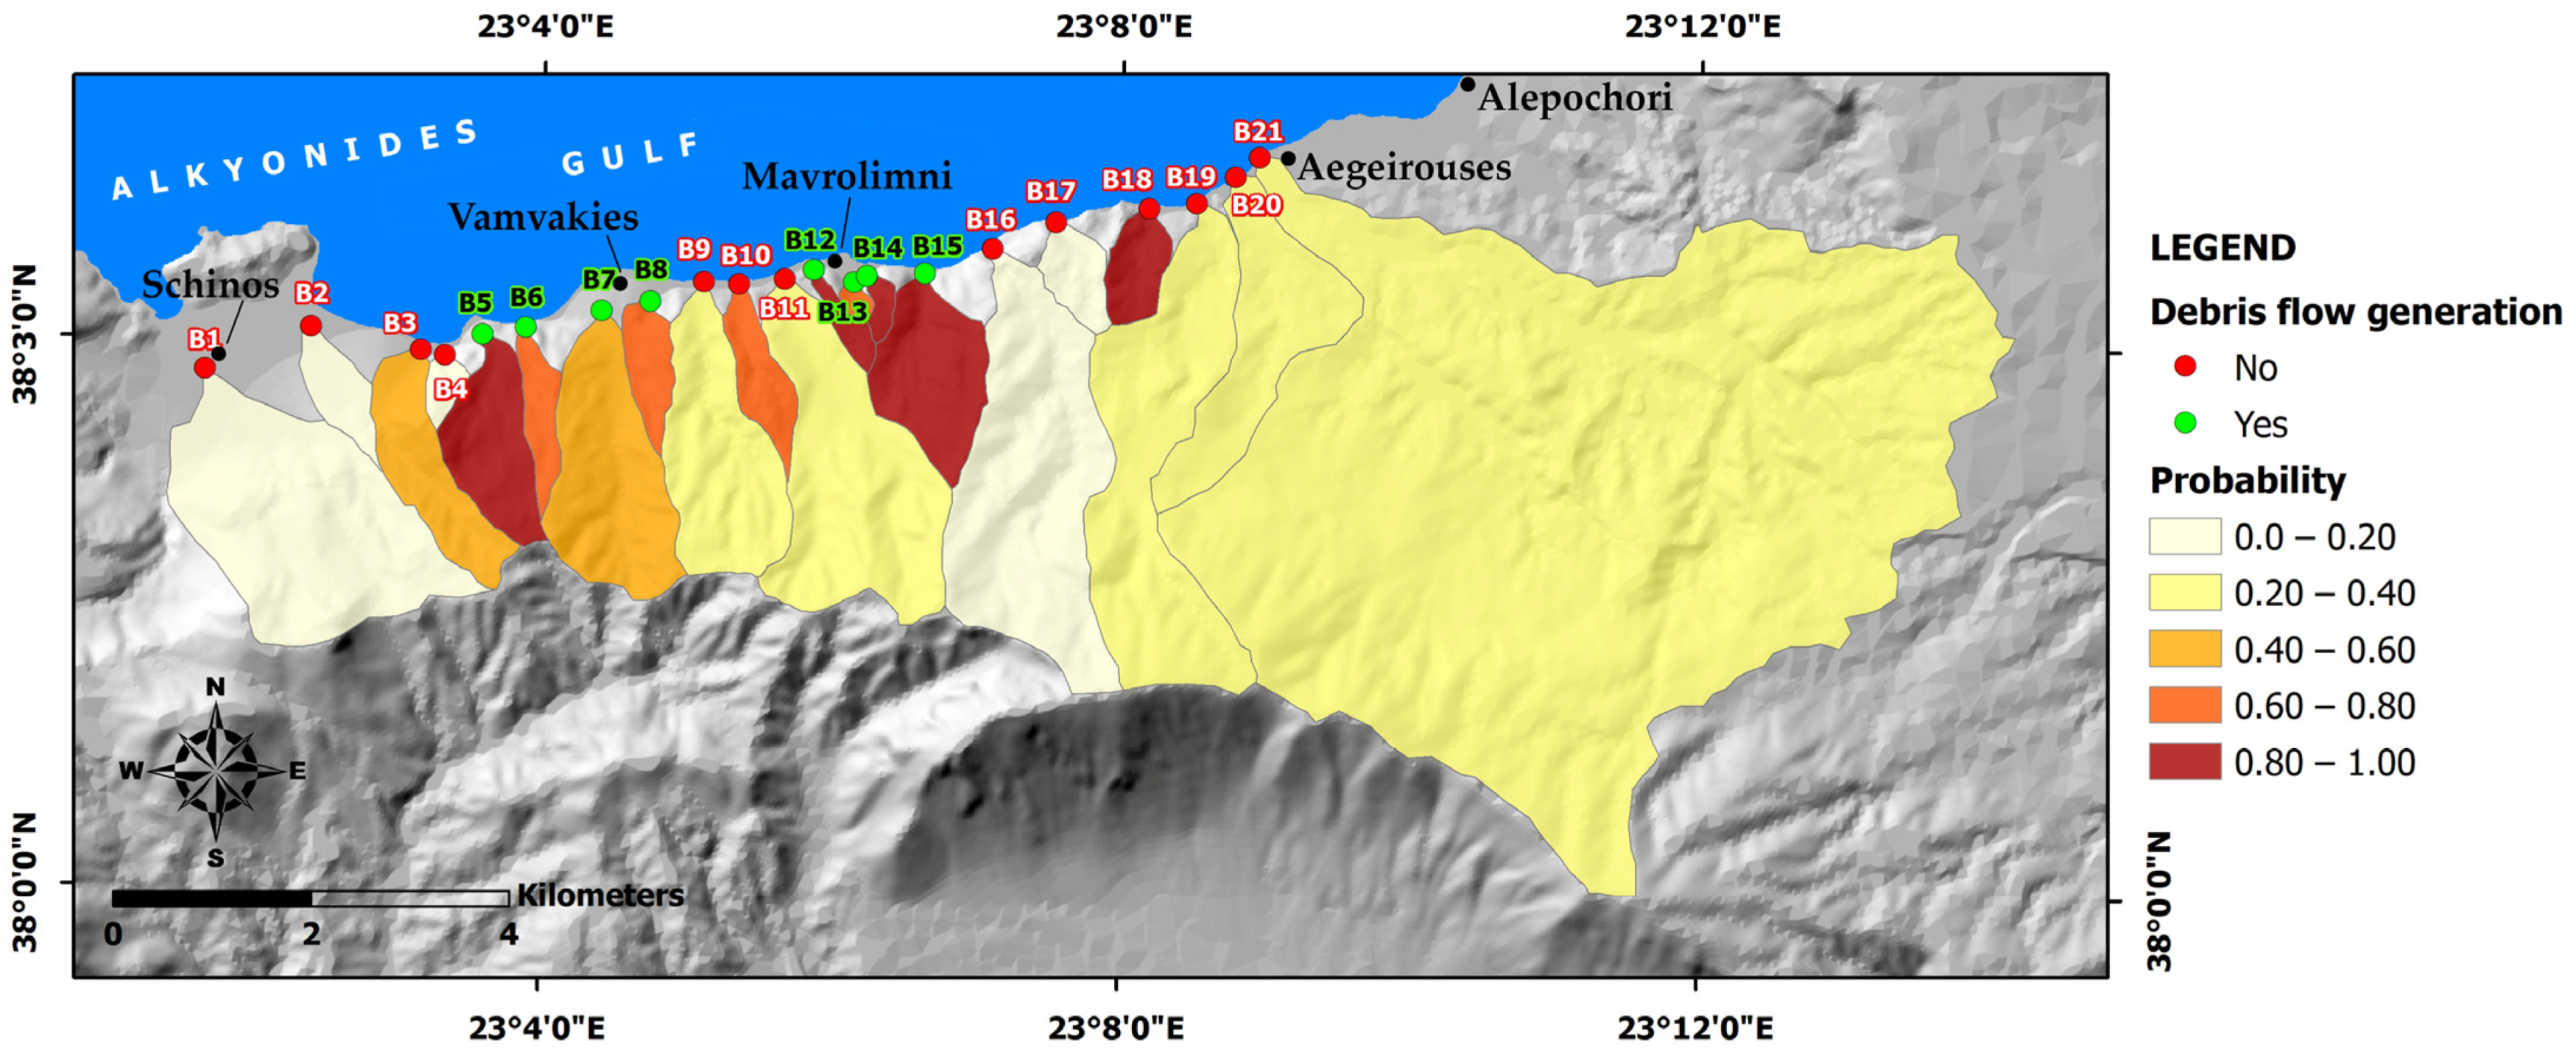
- Identification of debris flow generation through field survey;
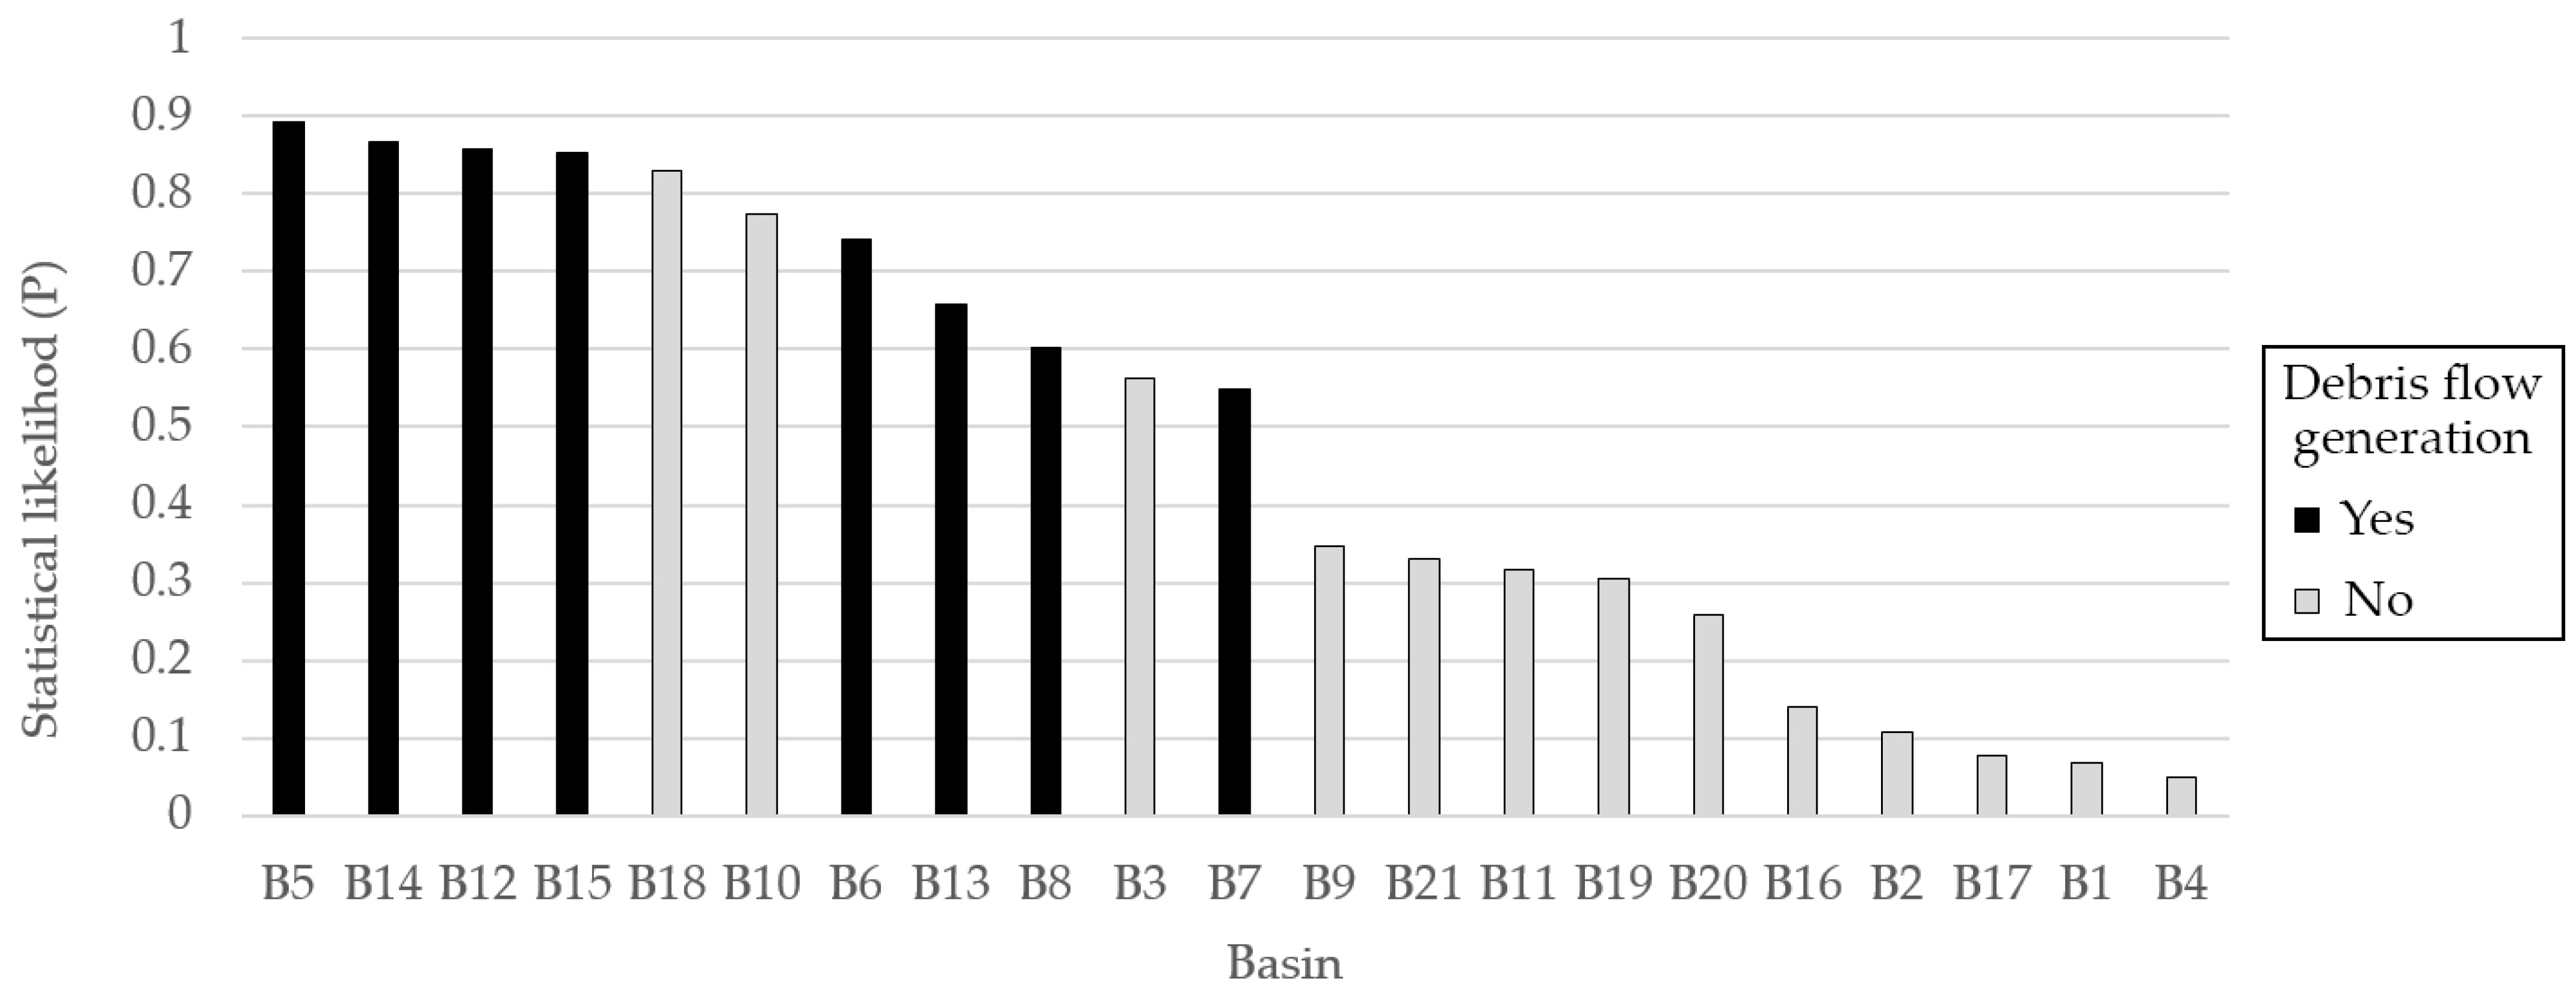
- Statistical tests and ROC analysis to explore a potential statistical association between the calculated probability and the actual debris flow occurrences identified in the field (step 4).
4. Results
5. Discussion
6. Conclusions
Supplementary Materials
Author Contributions
Funding
Data Availability Statement
Conflicts of Interest
References
- Shakesby, R.A. Post-wildfire soil erosion in the Mediterranean: Review and future research directions. Earth-Sci. Rev. 2011, 105, 71–100. [Google Scholar] [CrossRef]
- Moody, J.A.; Shakesby, R.A.; Robichaud, P.R.; Cannon, S.H.; Martin, D.A. Current research issues related to post-wildfire runoff and erosion processes. Earth-Sci. Rev. 2013, 122, 10–37. [Google Scholar] [CrossRef]
- Neary, D.G. Wildfire contribution to desertification at local, regional, and global scales. Desertif. Past Curr. Future Trends 2018, 10, 199–222. [Google Scholar]
- Neary, D.G. Post-wildland fire desertification: Can rehabilitation treatments make a difference? Fire Ecol. 2009, 5, 129–144. [Google Scholar] [CrossRef]
- Diakakis, M.; Nikolopoulos, E.I.; Mavroulis, S.; Vassilakis, E.; Korakaki, E. Observational evidence on the effects of mega-fires on the frequency of hydrogeomorphic hazards. The case of the Peloponnese fires of 2007 in Greece. Sci. Total Environ. 2017, 592, 262–276. [Google Scholar] [CrossRef]
- Jong-Levinger, A.; Banerjee, T.; Houston, D.; Sanders, B.F. Compound Post-Fire Flood Hazards Considering Infrastructure Sedimentation. Earth’s Future 2022, 10, 848–866. [Google Scholar] [CrossRef]
- De Graff, J.V. Improvement in quantifying debris flow risk for post-wildfire emergency response. Geoenviron. Disasters 2014, 1, 1–10. [Google Scholar] [CrossRef] [Green Version]
- Parise, M.; Cannon, S.H. Wildfire impacts on the processes that generate debris flows in burned watersheds. Nat. Hazards 2012, 61, 217–227. [Google Scholar] [CrossRef]
- Nyman, P.; Smith, H.G.; Sherwin, C.B.; Langhans, C.; Lane, P.N.J.; Sheridan, G.J. Predicting sediment delivery from debris flows after wildfire. Geomorphology 2015, 250, 173–186. [Google Scholar] [CrossRef]
- Cannon, S.H.; Gartner, J.E. Wildfire-related debris flow from a hazards perspective. In Debris-Flow Hazards and Related Phenomena; Springer: Berlin/Heidelberg, Germany, 2005; pp. 363–385. [Google Scholar]
- Zhao, L.; He, J.W.; Yu, Z.X.; Liu, Y.P.; Zhou, Z.H.; Chan, S.L. Coupled numerical simulation of a flexible barrier impacted by debris flow with boulders in front. Landslides 2020, 17, 2723–2736. [Google Scholar] [CrossRef]
- Jakob, M.; Stein, D.; Ulmi, M. Vulnerability of buildings to debris flow impact. Nat. Hazards 2012, 60, 241–261. [Google Scholar] [CrossRef]
- Scheidl, C.; Chiari, M.; Kaitna, R.; Müllegger, M.; Krawtschuk, A.; Zimmermann, T.; Proske, D. Analysing Debris-Flow Impact Models, Based on a Small Scale Modelling Approach. Surv. Geophys. 2013, 34, 121–140. [Google Scholar] [CrossRef] [Green Version]
- Santi, P.M.; Hewitt, K.; VanDine, D.F.; Cruz, E.B. Debris-flow impact, vulnerability, and response. Nat. Hazards 2011, 56, 371–402. [Google Scholar] [CrossRef]
- Nam, D.H.; Kim, M.-I.; Kang, D.H.; Kim, B.S. Debris flow damage assessment by considering debris flow direction and direction angle of structure in South Korea. Water 2019, 11, 328. [Google Scholar] [CrossRef] [Green Version]
- Lancaster, J.T.; Swanson, B.J.; Lukashov, S.G.; Oakley, N.S.; Lee, J.B.; Spangler, E.R.; Hernandez, J.L.; Olson, B.P.E.; DeFrisco, M.J.; Lindsay, D.N.; et al. Observations and Analyses of the 9 January 2018 Debris-Flow Disaster, Santa Barbara County, California. Environ. Eng. Geosci. 2021, 27, 3–27. [Google Scholar] [CrossRef]
- Shakesby, R.A.; Doerr, S.H. Wildfire as a hydrological and geomorphological agent. Earth-Sci. Rev. 2006, 74, 269–307. [Google Scholar] [CrossRef]
- Dorn, R.I. Boulder weathering and erosion associated with a wildfire, Sierra Ancha Mountains, Arizona. Geomorphology 2003, 55, 155–171. [Google Scholar] [CrossRef]
- Ice, G.G.; Neary, D.G.; Adams, P.W. Effects of Wildfire on Processes. J. For. 2004, 102, 16–20. [Google Scholar]
- Cardenas, M.B.; Kanarek, M.R. Soil moisture variation and dynamics across a wildfire burn boundary in a loblolly pine (Pinus taeda) forest. J. Hydrol. 2014, 519, 490–502. [Google Scholar] [CrossRef]
- Doerr, S.H.; Shakesby, R.A.; Walsh, R.P.D. Soil water repellency: Its causes, characteristics and hydro-geomorphological significance. Earth Sci. Rev. 2000, 51, 33–65. [Google Scholar] [CrossRef]
- Woods, S.W.; Balfour, V.N. The effect of ash on runoff and erosion after a severe forest wildfire, Montana, USA. Int. J. Wildl. Fire 2008, 17, 535–548. [Google Scholar] [CrossRef]
- Larsen, I.J.; Pederson, J.L.; Schmidt, J.C. Geologic versus wildfire controls on hillslope processes and debris flow initiation in the Green River canyons of Dinosaur National Monument. Geomorphology 2006, 81, 114–127. [Google Scholar] [CrossRef]
- Tiranti, D.; Cremonini, R.; Sanmartino, D. Wildfires effect on debris flow occurrence in italian western alps: Preliminary considerations to refine debris flow early warnings system criteria. Geosciences 2021, 11, 422. [Google Scholar] [CrossRef]
- Pellegrino, A.M.; Schippa, L. Rheological modeling of macro viscous flows of granular suspension of regular and irregular particles. Water 2017, 10, 21. [Google Scholar] [CrossRef] [Green Version]
- Alfieri, L.; Salamon, P.; Pappenberger, F.; Wetterhall, F.; Thielen, J. Operational early warning systems for water-related hazards in Europe. Environ. Sci. Policy 2012, 21, 35–49. [Google Scholar] [CrossRef]
- Tiranti, D.; Rabuffetti, D. Estimation of rainfall thresholds triggering shallow landslides for an operational warning system implementation. Landslides 2010, 7, 471–481. [Google Scholar] [CrossRef]
- Guzzetti, F.; Peruccacci, S.; Rossi, M.; Stark, C.P. The rainfall intensity-duration control of shallow landslides and debris flows: An update. Landslides 2008, 5, 3–17. [Google Scholar] [CrossRef]
- Bezak, N.; Mikoš, M. Changes in the rainfall event characteristics above the empirical global rainfall thresholds for landslide initiation at the pan-European level. Landslides 2021, 18, 1859–1873. [Google Scholar] [CrossRef]
- Molina-Terrén, D.M.; Xanthopoulos, G.; Diakakis, M.; Ribeiro, L.; Caballero, D.; Delogu, G.M.; Viegas, D.X.; Silva, C.A.; Cardil, A. Analysis of forest fire fatalities in Southern Europe: Spain, Portugal, Greece and Sardinia (Italy). Int. J. Wildl. Fire 2019, 28, 85–98. [Google Scholar] [CrossRef] [Green Version]
- Efthimiou, N.; Psomiadis, E.; Panagos, P. Fire severity and soil erosion susceptibility mapping using multi-temporal Earth Observation data: The case of Mati fatal wildfire in Eastern Attica, Greece. Catena 2020, 187, 104320. [Google Scholar] [CrossRef]
- Diakakis, M.; Xanthopoulos, G.; Gregos, L. Analysis of forest fire fatalities in Greece: 1977–2013. Int. J. Wildl. Fire 2016, 25, 797–809. [Google Scholar] [CrossRef]
- Abatzoglou, J.T.; Kolden, C.A. Climate change in Western US deserts: Potential for increased wildfire and invasive annual grasses. Rangel. Ecol. Manag. 2011, 64, 471–478. [Google Scholar] [CrossRef]
- Canuti, P.; Margottini, C.; Fanti, R.; Bromhead, E.N. Cultural Heritage and Landslides: Research for Risk Prevention and Conservation; Springer: Berlin/Heidelberg, Germany, 2009; ISBN 9783540699668. [Google Scholar]
- Di Virgilio, G.; Evans, J.P.; Blake, S.A.P.; Armstrong, M.; Dowdy, A.J.; Sharples, J.; McRae, R. Climate Change Increases the Potential for Extreme Wildfires. Geophys. Res. Lett. 2019, 46, 8517–8526. [Google Scholar] [CrossRef]
- Cannon, S.H.; DeGraff, J. The Increasing Wildfire and Post-Fire Debris-Flow Threat in Western USA, and Implications for Consequences of Climate Change. In Landslides–Disaster Risk Reduction; Sassa, K., Canuti, P., Eds.; Springer: Berlin/Heidelberg, Germany, 2009; pp. 177–190. [Google Scholar]
- Hoch, O.J.; McGuire, L.A.; Youberg, A.M.; Rengers, F.K. Hydrogeomorphic Recovery and Temporal Changes in Rainfall Thresholds for Debris Flows Following Wildfire. J. Geophys. Res. Earth Surf. 2021, 126. [Google Scholar] [CrossRef]
- Mayor, A.G.; Bautista, S.; Llovet, J.; Bellot, J. Post-fire hydrological and erosional responses of a Mediterranean landscpe: Seven years of catchment-scale dynamics. Catena 2007, 71, 68–75. [Google Scholar] [CrossRef]
- Cannon, S.H.; Gartner, J.E.; Wilson, R.C.; Bowers, J.C.; Laber, J.L. Storm rainfall conditions for floods and debris flows from recently burned areas in southwestern Colorado and southern California. Geomorphology 2008, 96, 250–269. [Google Scholar] [CrossRef]
- Staley, D.M.; Kean, J.W.; Cannon, S.H.; Schmidt, K.M.; Laber, J.L. Objective definition of rainfall intensity-duration thresholds for the initiation of post-fire debris flows in southern California. Landslides 2013, 10, 547–562. [Google Scholar] [CrossRef]
- Berti, M.; Bernard, M.; Gregoretti, C.; Simoni, A. Physical Interpretation of Rainfall Thresholds for Runoff-Generated Debris Flows. J. Geophys. Res. Earth Surf. 2020, 125, e2019JF005513. [Google Scholar] [CrossRef]
- Marra, F.; Nikolopoulos, E.I.; Creutin, J.D.; Borga, M. Space–time organization of debris flows-triggering rainfall and its effect on the identification of the rainfall threshold relationship. J. Hydrol. 2016, 541, 246–255. [Google Scholar] [CrossRef]
- Staley, D.M.; Negri, J.A.; Kean, J.W.; Laber, J.L.; Tillery, A.C.; Youberg, A.M. Prediction of spatially explicit rainfall intensity–duration thresholds for post-fire debris-flow generation in the western United States. Geomorphology 2017, 278, 149–162. [Google Scholar] [CrossRef]
- D’Amato Avanzi, G.; Giannecchini, R.; Puccinelli, A. The influence of the geological and geomorphological settings on shallow landslides. An example in a temperate climate environment: The June 19, 1996 event in northwestern Tuscany (Italy). Eng. Geol. 2004, 73, 215–228. [Google Scholar] [CrossRef]
- Zhang, Y.; Ge, T.; Tian, W.; Liou, Y.-A. Debris Flow Susceptibility Mapping Using Machine-Learning Techniques in Shigatse Area, China. Remote Sens. 2019, 11, 2801. [Google Scholar] [CrossRef] [Green Version]
- Destro, E.; Amponsah, W.; Nikolopoulos, E.I.; Marchi, L.; Marra, F.; Zoccatelli, D.; Borga, M. Coupled prediction of flash flood response and debris flow occurrence: Application on an alpine extreme flood event. J. Hydrol. 2018, 558, 225–237. [Google Scholar] [CrossRef]
- Nikolopoulos, E.I.; Destro, E.; Bhuiyan, A.E.; Borga, M.; Anagnostou, E.N. Evaluation of predictive models for post-fire debris flow occurrence in the western United States. Nat. Hazards Earth Syst. Sci. 2018, 18, 2331–2343. [Google Scholar] [CrossRef] [Green Version]
- Wall, S.; Murphy, B.P.; Belmont, P.; Yocom, L. Predicting post-fire debris flow grain sizes and depositional volumes in the Intermountain West, United States. Earth Surf. Process. Landf. 2023, 48, 179–197. [Google Scholar] [CrossRef]
- Cannon, S.H.; Gartner, J.E.; Rupert, M.G.; Michael, J.A.; Rea, A.H.; Parrett, C. Predicting the probability and volume of postwildfire debris flows in the intermountain western United States. Bull. Geol. Soc. Am. 2010, 122, 127–144. [Google Scholar] [CrossRef]
- Staley, D.M.; Negri, J.A.; Kean, J.W.; Laber, J.M.; Tillery, A.C.; Youberg, A.M. Updated Logistic Regression Equations for the Calculation of Post-Fire Debris-Flow Likelihood in the Western United States, Open-File Report 2016-1106; USGS: Denver, CO, USA, 2016; 13p. [CrossRef] [Green Version]
- Rupert, M.G.; Cannon, S.H.; Gartner, J.E.; Michael, J.A.; Helsel, D.R. Using Logistic Regression to Predict a Probability of Debris Flows in Areas Burned by Wildfires, Southern California, 2003–2006. Open-File Report 2008-1370; USGS: Denver, CO, USA, 2008. [CrossRef] [Green Version]
- Bornovas, I.; Spyridopoulos, A.; Gaitanakis, P. Geological Map of Greece, Scale 1:50.000, Perachora Sheet; Institute of Geological and Mineral Exploration: Athens, Greece, 1984. [Google Scholar]
- Bornovas, I.; Eleftheriou, A.; Gaitanakis, P.; Rondoyanni, T.; Simaeakis, K. Geological Map of Greece, Scale 1:50.000, Kaparellion Sheet; Institute of Geological and Mineral Exploration: Athens, Greece, 1984. [Google Scholar]
- Gaitanakis, P.; Mettos, A.; Fytikas, M. Geological Map of Greece, Scale 1:50.000, Sofiko Sheet; Institute of Geological and Mineral Exploration: Athens, Greece, 1985. [Google Scholar]
- Jackson, J.A.; Houseman, G.G.; King, G.C.P.; Papadimitriou, P.; Soufleris, C.; Virieux, J. Seismicity, normal faulting, and the geomorphological development of the Gulf of Corinth (Greece)” the Corinth earthquakes. Earth Planet. Sci. Lett. 1982, 57, 377–397. [Google Scholar] [CrossRef]
- Sakellariou, D.; Lykousis, V.; Papanikolaou, D. Neotectonic Structure and Evolution of the Gulf of Alkyonides, Central Greece. Bull. Geol. Soc. Greece 1998, 32, 241–250. [Google Scholar]
- Leeder, M.R.; Collier, R.E.L.; Aziz, L.H.A.; Trout, M.; Ferentinos, G.; Papatheodorou, G.; Lyberis, E. Tectono-sedimentary processes along an active marine/lacustrine half-graben margin: Alkyonides Gulf, E. Gulf of Corinth, Greece. Basin Res. 2002, 14, 25–41. [Google Scholar] [CrossRef]
- Taymaz, T.; Eyidog̃an, H.; Jackson, J. Source parameters of large earthquakes in the East Anatolian Fault Zone (Turkey). Geophys. J. Int. 1991, 106, 537–550. [Google Scholar] [CrossRef] [Green Version]
- Antonaki, R.; Vlachos, I.; Staurakakis, G.; Taflamba, I.; Tokas, I.; Chatziandreou, S.; Smpokos, I.; Karydis, P.; Kaleuras, B. Earthquake economic impact—Insurance; Report of Earthquake Planning and Protection Organization: Athens, Greece, 1988. [Google Scholar]
- Mariolakos, I.; Papanikolaou, D. The neogene basins of the Aegean Arc from the paleogeographic and the geodynamic point of view. In Proceedings of the International Symposium Hellenic Arc and Trench (HEAT), Athens, Greece, 8–10 April 1981; Volume 1, pp. 383–399. [Google Scholar]
- Pirazzoli, P.A.; Stiros, S.C.; Arnold, M.; Laborel, J.; Laborel-Deguen, F.; Papageorgiou, S. Episodic uplift deduced from Holocene shorelines in the Perachora Peninsula, Corinth area, Greece. Tectonophysics 1994, 229, 201–209. [Google Scholar]
- Dafis, S. Classification of Forest Vegetation in Greece; Agricultural and Forestry School, Aristotle University of Thessaloniki: Thessaloniki, Greece, 1973. [Google Scholar]
- Kalliris, P.A. Final Study of Erosion and Flood Control Measures for Burnt Forest Areas in the Area of Schinos Settlement of Schinou of the Pissia Community of the Loutraki-Perachora-Agioi Theodoroi Municipality of the Corinthia Regional Unit from the 19 May 2021 Fire; Korinthos Forest Service: Corinth, Greece, 2021.
- Lekkas, E.; Andreadakis, E.; Diakakis, M.; Spyrou, N.-I.; Kranis, H.; Vassilakis, E.; Katsetsiadou, K.-N.; Carydis, P.; Kosmopoulos, E.; Stamati, E.; et al. The May 19, 2021, Schinos, Greece, Forest Fire; University of Athens: Athens, Greece, 2021. [Google Scholar]
- PANACEA PANhellenic Infrastructure for Atmospheric Composition and Climate Change (PANACEA). Available online: https://air-quality.gr/ (accessed on 20 May 2021).
- Copernicus Emergency Management. Copernicus Emergency Management Service EMSR510: Fire in Peloponnese and Attika Regions, Greece. Available online: https://emergency.copernicus.eu/mapping/list-of-components/EMSR510 (accessed on 4 January 2023).
- Planet. Planet PlanetScope Imagery 2021; Planet: San Fransisco, CA, USA, 2021. [Google Scholar]
- Heckmann, T.; Gegg, K.; Gegg, A.; Becht, M. Sample size matters: Investigating the effect of sample size on a logistic regression susceptibility model for debris flows. Nat. Hazards Earth Syst. Sci. 2014, 14, 259–278. [Google Scholar] [CrossRef] [Green Version]
- Achour, Y.; Garçia, S.; Cavaleiro, V. GIS-based spatial prediction of debris flows using logistic regression and frequency ratio models for Zêzere River basin and its surrounding area, Northwest Covilhã, Portugal. Arab. J. Geosci. 2018, 11, 550. [Google Scholar] [CrossRef]
- U.S. Geological Survey Emergency Assessment of Post-Fire Debris-Flow Hazards: U.S. Geological Survey Landslide Hazards Program Web Page. Available online: http://landslides.usgs.gov/hazards/postfire_debrisflow/ (accessed on 4 January 2023).
- Shmida, A. Mediterranean vegetation in california and israel: Similarities and differences1. Isr. J. Bot. 1981, 30, 105–123. [Google Scholar] [CrossRef]
- Polade, S.D.; Gershunov, A.; Cayan, D.R.; Dettinger, M.D.; Pierce, D.W. Precipitation in a warming world: Assessing projected hydro-climate changes in California and other Mediterranean climate regions. Sci. Rep. 2017, 7, 1–10. [Google Scholar] [CrossRef] [Green Version]
- Verheye, W.; Rosa, D. De Mediterranean Soils. In Land Use, Land Cover and Soil Sciences; Verheye, W., Ed.; UNESCO: Paris, France, 2006; Volume VII, pp. 1–10. [Google Scholar]
- Goudie, A.S. Arid and Semi-Arid Geomorphology; Cambridge University Press: Cambridge, UK; New York, NY, USA, 2013. [Google Scholar]
- Hellenic Cadastre. Digital Elevation Model-DEM of the Large Scale Orthophotos Project. Open Data Portal; Hellenic Cadaste: Athens, Greece, 2021.
- Environmental Systems Research Institute. ESRI ArcGIS Desktop—Release 10.7 2017; Environmental Systems Research Institute: Redlands, CA, USA, 2017. [Google Scholar]
- Special Secretariat for Water. Flood Risk Management Plan. Stage I. 1st Phase–Deliverable No2. Intensity Duration Frequency Curves; Ministry of Environment and Energy: Athens, Greece, 2018.
- Lutes, D.C.; Keane, R.E.; Caratti, J.F.; Key, C.H.; Benson, N.C.; Sutherland, S.; Gangi, L.J. Fire Effects Monitoring and Inventory System. Gen. Tech. Rep. RMRS-GTR-164-CD; USDA: Fort Collins, CO, USA, 2006.
- Ebel, B.A.; Romero, O.C.; Martin, D.A. Thresholds and relations for soil-hydraulic and soil-physical properties as a function of burn severity 4 years after the 2011 Las Conchas Fire, New Mexico, USA. Hydrol. Process. 2018, 32, 2263–2278. [Google Scholar] [CrossRef]
- Key, C.H.; Bensons, N.C. Landscape Assessment (LA) Sampling and Analysis Methods; USDA Forest Service: Washington, DC, USA, 2006.
- Keeley, J.E. Fire intensity, fire severity and burn severity: A brief review and suggested usage. Int. J. Wildl. Fire 2009, 18, 116–126. [Google Scholar] [CrossRef]
- Robichaud, P.R.; Lewis, S.A.; Laes, D.Y.M.; Hudak, A.T.; Kokaly, R.F.; Zamudio, J.A. Postfire soil burn severity mapping with hyperspectral image unmixing. Remote Sens. Environ. 2007, 108, 467–480. [Google Scholar] [CrossRef] [Green Version]
- Banister, K.; Chan, D.; Driscoll, J.M.; Fullerton, C.; Lien, A.; Lacroix, K.M. Atlas of the Upper Gila River Wastershed; University of Arizona: Tuscon, AZ, USA, 2014. [Google Scholar]
- Romero, O.C.; Ebel, B.A.; Martin, D.A.; Buchan, K.W.; Jornigan, A.D. Postwildfire measurement of soil physical and hydraulic properties at selected sampling sites in the 2011 Las Conchas wildfire burn scar, Jemez Mountains, north-central New Mexico. Sci. Investig. Rep. 2018, 48. [Google Scholar] [CrossRef]
- Schwartz, G.E.; Alexander, R.B. State Soil Geographic (STATSGO) Data Base for the Conterminous United States Open-File Report 95-449; USGS: Denver, CO, USA, 1995.
- Panagos, P.; Meusburger, K.; Ballabio, C.; Borrelli, P.; Alewell, C. Soil erodibility in Europe: A high-resolution dataset based on LUCAS. Sci. Total Environ. 2014, 479–480, 189–200. [Google Scholar] [CrossRef]
- Fawcett, T. An introduction to ROC analysis. Pattern Recognit. Lett. 2006, 27, 861–874. [Google Scholar] [CrossRef]
- Swets, J.A. Measuring the Accuracy of Diagnostic Systems. Science 1988, 240, 1285–1293. [Google Scholar] [CrossRef] [Green Version]
- Youberg, A.M. Modern and Ancient Debris Flows in Arizona. Ph.D. Thesis, University of Arizona, Tucson, AZ, USA, 2014; p. 236. [Google Scholar]
- Mavroulis, S.; Diakakis, M.; Kranis, H.; Vassilakis, E.; Kapetanidis, V.; Spingos, I.; Kaviris, G.; Skourtsos, E.; Voulgaris, N.; Lekkas, E. Inventory of Historical and Recent Earthquake-Triggered Landslides and Assessment of Related Susceptibility by GIS-Based Analytic Hierarchy Process: The Case of Cephalonia (Ionian Islands, Western Greece). Appl. Sci. 2022, 12, 2895. [Google Scholar] [CrossRef]
- Moreira, F.; Arianoutsou, M.; Vallejo, V.R.; de las Heras, J.; Corona, P.; Xanthopoulos, G.; Fernandes, P.; Papageorgiou, K. Setting the Scene for Post-Fire Management. In Post-Fire Management and Restoration of Southern European Forests; Moreira, F., Arianoutsou, M., Corona, P., de las Heras, J., Eds.; Springer: Dordrecht, The Netherlands; Berlin/Heidelberg, Germany; London, UK; New York, NY, USA, 2012; pp. 1–20. ISBN 9789400722071. [Google Scholar]
- Jordan, P. Post-wildfire debris flows in southern British Columbia, Canada. Int. J. Wildl. Fire 2016, 25, 322–336. [Google Scholar] [CrossRef]
- Mavsar, R.; Varela, E.; Corona, P.; Barbati, A.; Marsh, G. Economic, Legal and Social Aspects of Post-Fire Management. In Post-Fire Management and Restoration of Southern European ForestsForests; Moreira, F., Arianoutsou, M., Corona, P., de las Heras, J., Eds.; Springer: Dordrecht, The Netherlands; Heidelberg, Germany; London, UK; New York, NY, USA, 2012; pp. 45–78. [Google Scholar]
- Li, C.; Ding, L.; Fang, Q.; Chen, K.; Castro-Lacouture, D. Risk-informed knowledge-based design for road infrastructure in an extreme environment. Knowl.-Based Syst. 2021, 216, 106741. [Google Scholar] [CrossRef]
- Ellingwood, B.R. Risk-informed condition assessment of civil infrastructure: State of practice and research issues. Struct. Infrastruct. Eng. 2005, 1, 7–18. [Google Scholar] [CrossRef]
- Dransch, D.; Rotzoll, H.; Poser, K. The contribution of maps to the challenges of risk communication to the public. Int. J. Digit. Earth 2010, 3, 292–311. [Google Scholar] [CrossRef]
- Tillery, A.C.; Darr, M.J.; Cannon, S.H.; Michael, J.A. Estimated Probability of Postwildfire Debris Flows in the 2012 Whitewater–Baldy Fire Burn Area, Southwestern New Mexico; US Department of the Interior, US Geological Survey: Reston, VA, USA, 2012.
- Verdin, K.L.; Dupree, J.A.; Elliot, J.G. Probability and Volume of Potential Postwildfire Debris Flows in the 2012 Waldo Canyon Burn Area near Colorado Springs, Colorado; US Geological Survey: Reston, VA, USA, 2012.
- Kean, J.W.; Staley, D.M.; Cannon, S.H. In situ measurements of post-fire debris flows in southern California: Comparisons of the timing and magnitude of 24 debris-flow events with rainfall and soil moisture conditions. J. Geophys. Res. Earth Surf. 2011, 116, 1–21. [Google Scholar] [CrossRef]


Disclaimer/Publisher’s Note: The statements, opinions and data contained in all publications are solely those of the individual author(s) and contributor(s) and not of MDPI and/or the editor(s). MDPI and/or the editor(s) disclaim responsibility for any injury to people or property resulting from any ideas, methods, instructions or products referred to in the content. |
© 2023 by the authors. Licensee MDPI, Basel, Switzerland. This article is an open access article distributed under the terms and conditions of the Creative Commons Attribution (CC BY) license (https://creativecommons.org/licenses/by/4.0/).
Share and Cite
Diakakis, M.; Mavroulis, S.; Vassilakis, E.; Chalvatzi, V. Exploring the Application of a Debris Flow Likelihood Regression Model in Mediterranean Post-Fire Environments, Using Field Observations-Based Validation. Land 2023, 12, 555. https://doi.org/10.3390/land12030555
Diakakis M, Mavroulis S, Vassilakis E, Chalvatzi V. Exploring the Application of a Debris Flow Likelihood Regression Model in Mediterranean Post-Fire Environments, Using Field Observations-Based Validation. Land. 2023; 12(3):555. https://doi.org/10.3390/land12030555
Chicago/Turabian StyleDiakakis, Michalis, Spyridon Mavroulis, Emmanuel Vassilakis, and Vassiliki Chalvatzi. 2023. "Exploring the Application of a Debris Flow Likelihood Regression Model in Mediterranean Post-Fire Environments, Using Field Observations-Based Validation" Land 12, no. 3: 555. https://doi.org/10.3390/land12030555