2. Materials and Methods
In accordance with the objectives of the study, the Bialystok Functional Area located in north-eastern Poland was selected. It consists of the City of Bialystok, a capital city of 300,000 inhabitants with all the functions and institutions typical of such cities. In addition, the area includes 9 urban and rural municipalities, which are included within the boundaries of a formally separate functional area. For this area, data is available and strategic documents are produced. This area also forms a zone within which there are strong and close functional, social and economic relations. It is an area of strategic planning and co-operation between municipalities in terms of public transport services, the creation of social infrastructure, the creation of support for residents’ initiatives, and the creation of energy partnerships.
The Open Street Map data and Space Syntax and Spatial Design Network analysis software for ArcGIS analysis software were used to conduct the study.
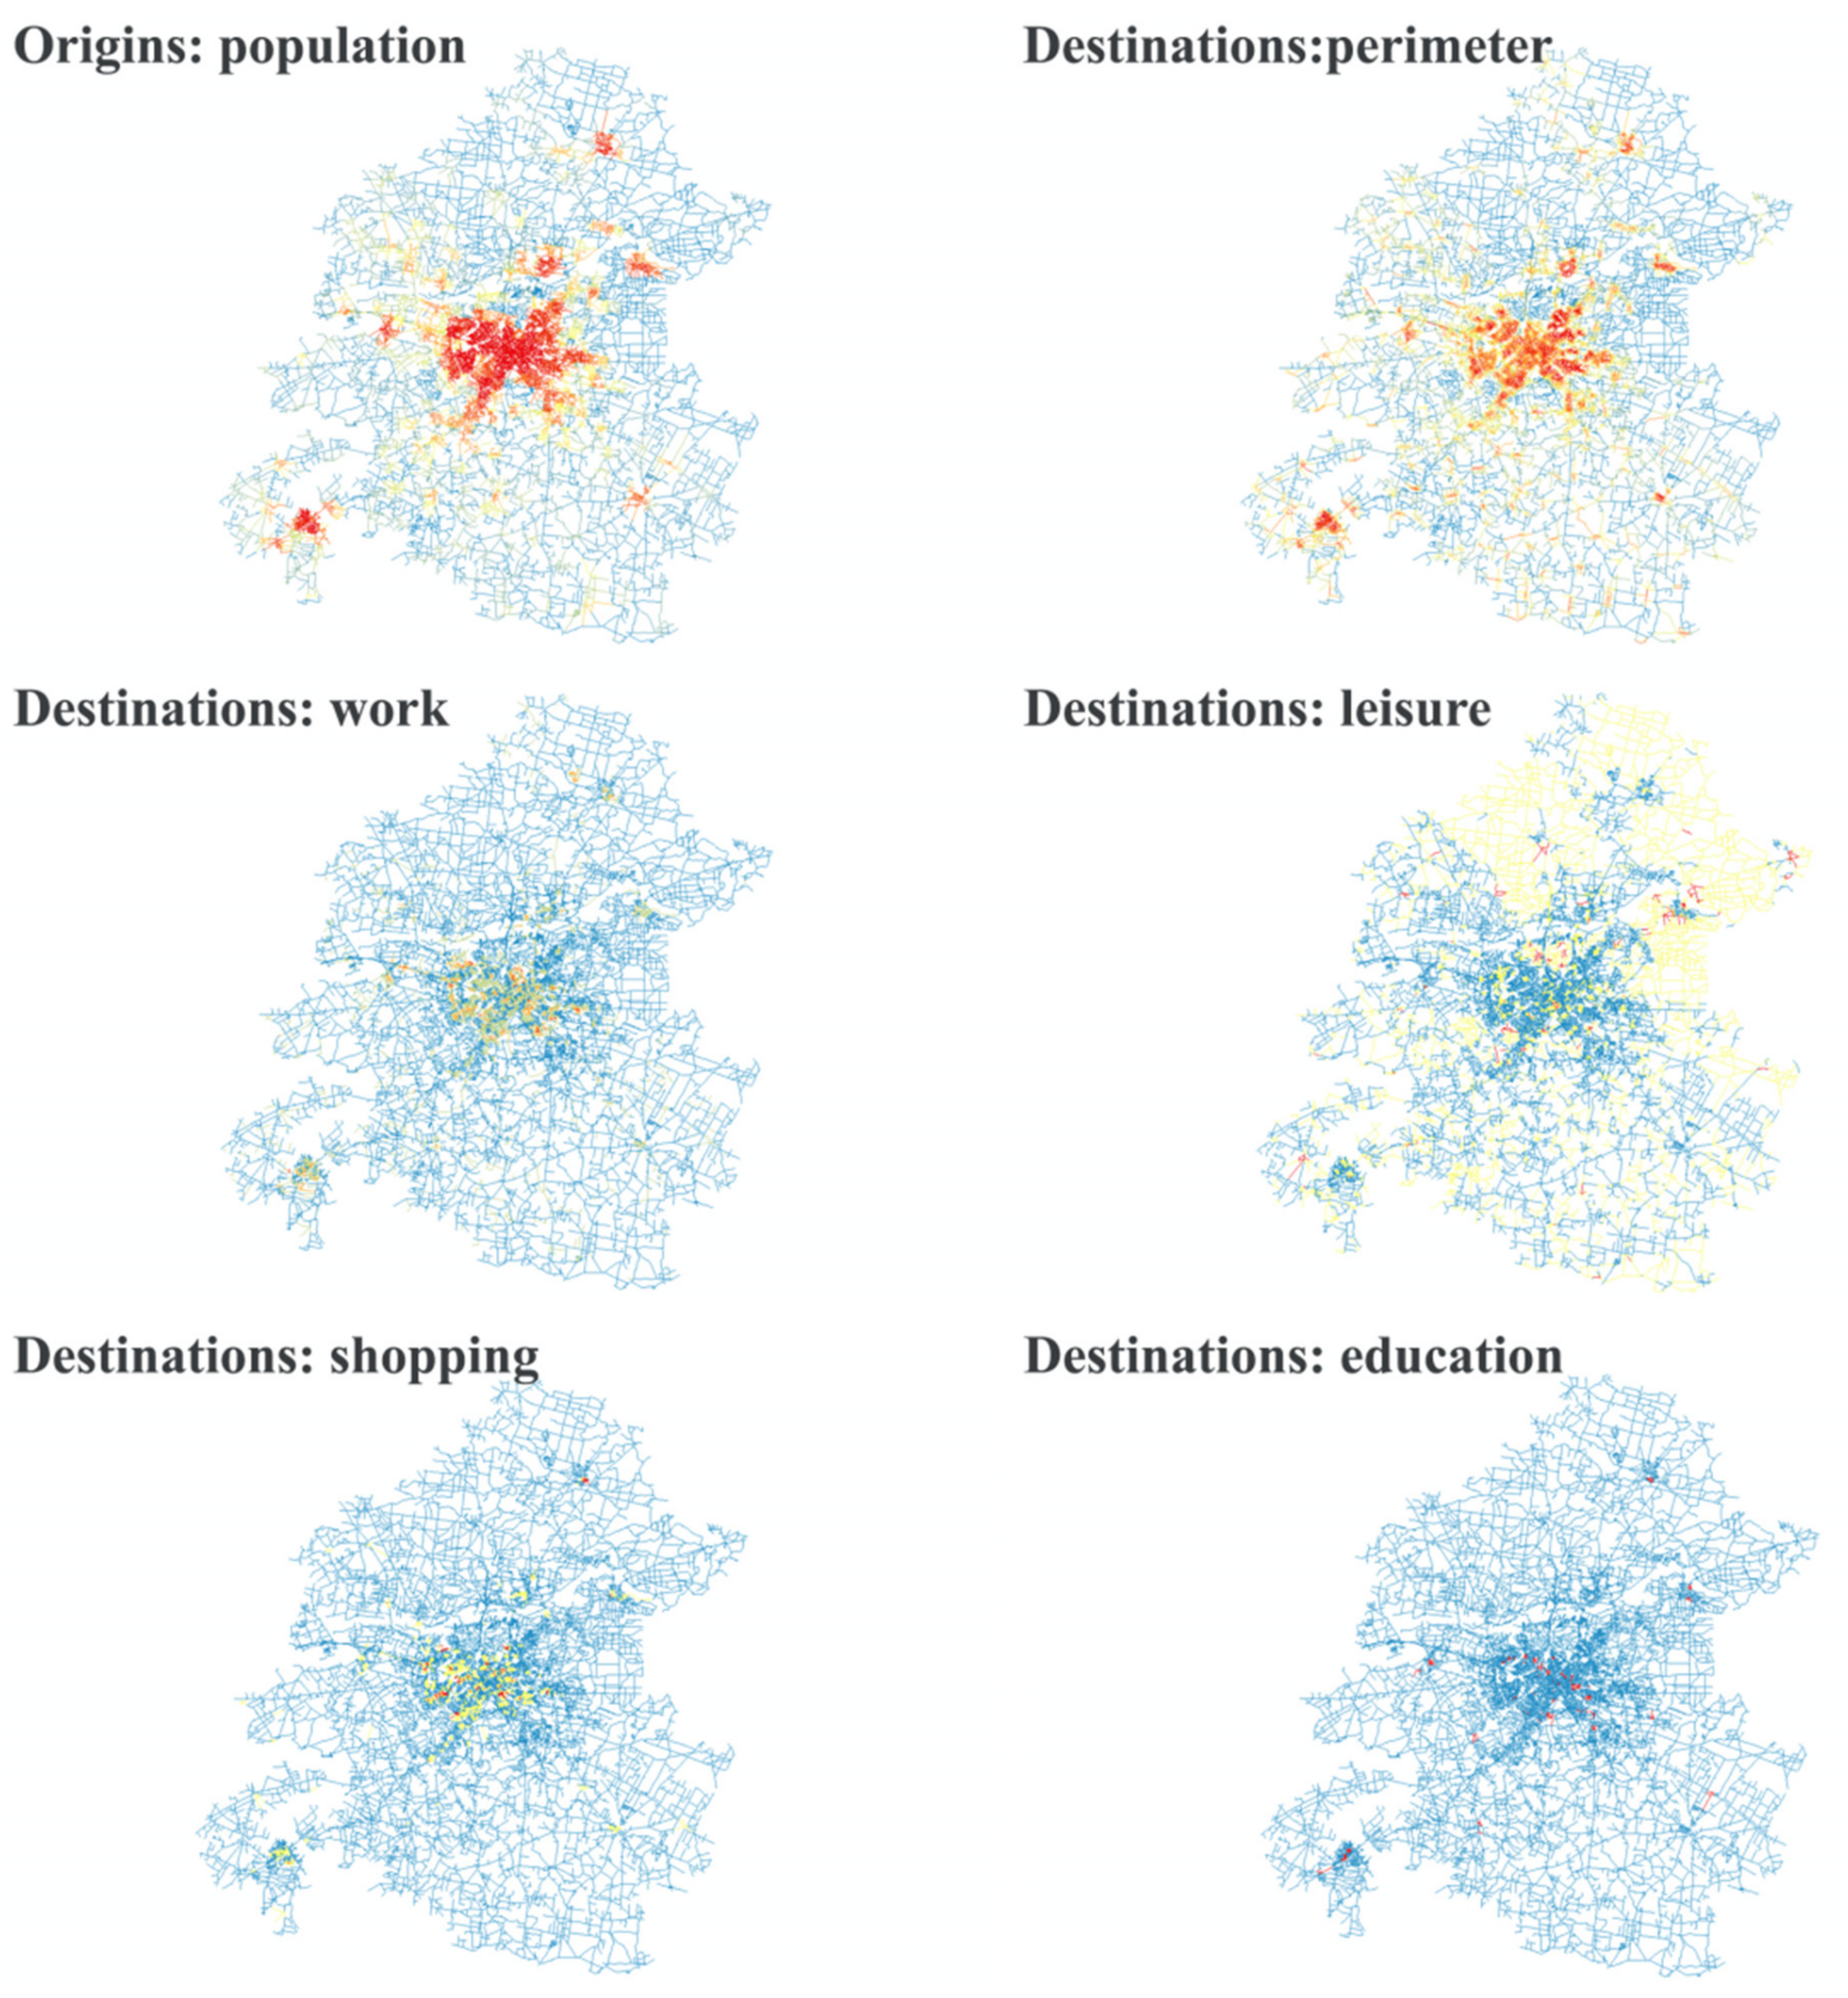
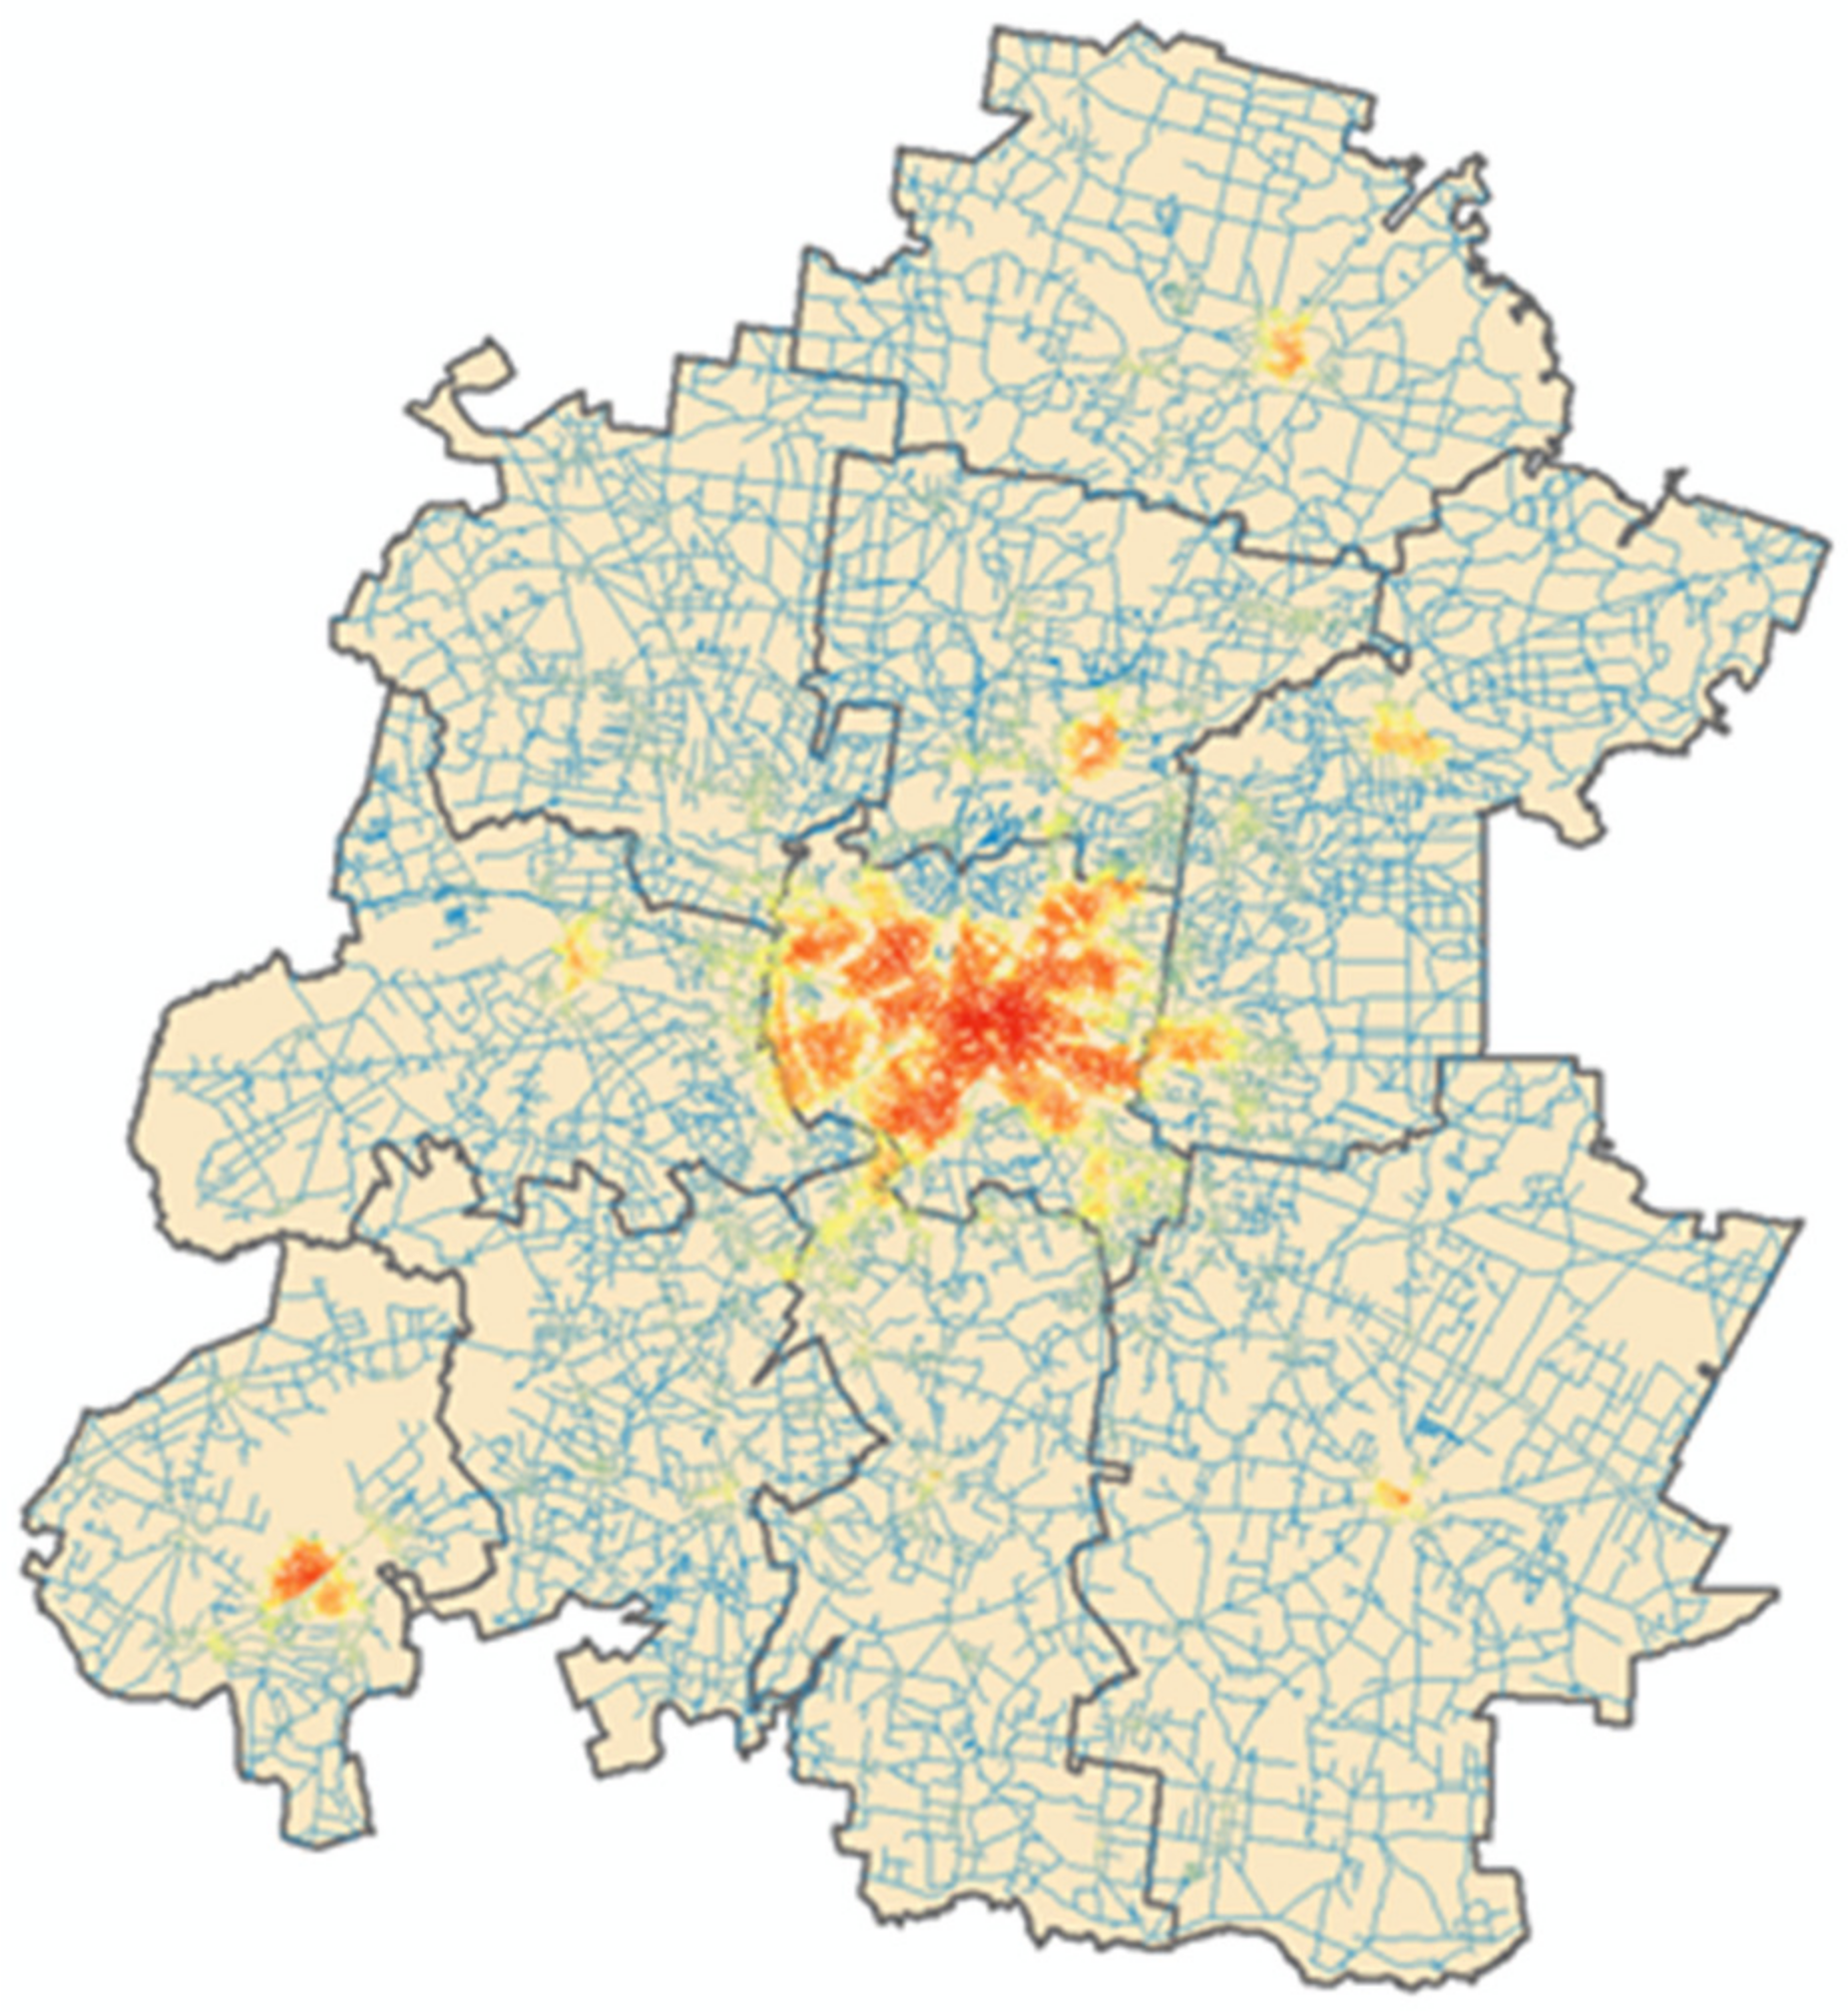
A street network model was created for the entire area and simulation modeling was performed, while using a mathematical graph model approach as the space syntax. All possible origins and destinations for the simulative model were identified (
Figure 1). Next step: trips within two radiuses (1 km and 5 km) between origins and destinations were modeled based on the shortest route principle. The modeling allowed us to see the highest potential concentration of people travelling with four different purposes and compare the concentrations between them. The concentration of people while performing different journeys could be seen as an indicator of multifunctionality in either neighborhood or the whole investigated area level. Multifunctionality on its own is named as one of the important aspects of New Urbanism [
9] or a sustainable urban form [
10] of higher energy consumption; then, either positive or negative synergy between the concentrations could show entropy of energy consumption during the day as well, at least indirectly.
The essence of modeling—simulating the movement of people by taking the shortest routes from each street segment to every other segment to determine the most achievable zones and transit flows—was used. In the initial model, every street segment was seen as both origin and destination of all trips and there is no other data, as density of inhabitants or allocation of real destinations of trips (e.g., shops) was not evaluated.
The model was used for validation of simulative approach—if model is working, it was tested while calculating correlations (Spearman’s rho) between results of simulative calculation and density of points of the interest from Open Street Map (OSM) and density of populations within 1 × 1 km grid (
Table 1). As described earlier, based on the concept of the movement economy [
3], correlations between spatial configurations of the road network, described by the results of simulative modeling and both density of POIs and inhabitants, could be seen as proof of working model.
Next step was identification of more precise origins and destinations of simulated journeys. As origins were considered places where people live, data of inhabitants’ density were used.
For destinations, the following data from OSM were used:
For work journeys (names taken from the OSM attribute list): ‘archaeological’, ‘arts_centre’, ‘bakery’, ‘bank’, ‘bar’, ‘beauty_shop’, ‘beverages’, ‘bicycle_rental’, ‘bicycle_shop’, ‘biergarten’, ‘bookshop’, ‘butcher’, ‘cafe’, ‘car_dealership’, ‘car_rental’, ‘car_wash’, ‘castle’, ‘chemist’, ‘cinema’, ‘clinic’, ‘clothes’, ‘college’, ‘community_centre’, ‘computer_shop’, ‘convenience’, ‘dentist’, ‘department_store’, ‘doctors’, ‘doityourself’, ‘embassy’, ‘fast_food’, ‘fire_station’, ‘florist’, ‘food_court’, ‘furniture_shop’, ‘garden_centre’, ‘general’, ‘gift_shop’, ‘greengrocer’, ‘guesthouse’, ‘hairdresser’, ‘hospital’, ‘hostel’, ‘hotel’, ‘jeweller’, ‘kindergarten’, ‘kiosk’, ‘laundry’, ‘library’, ‘mall’, ‘market_place’, ‘mobile_phone_shop’, ‘museum’, ‘nightclub’, ‘optician’, ‘outdoor_shop’, ‘pharmacy’, ‘police’, ‘post_office’, ‘pub’, ‘restaurant’, ‘school’, ‘shoe_shop’, ‘sports_centre’, ‘sports_shop’, ‘stationery’, ‘supermarket’, ‘swimming_pool’, ‘theatre’, ‘toilet’, ‘tourist_info’, ‘town_hall’, ‘toy_shop’, ‘travel_agent’, ‘university’, ‘veterinary’, ‘video_shop’.
For leisure journeys: ‘alpine_hut’, ‘archaeological’, ‘arts_centre’, ‘artwork’, ‘attraction’, ‘bar’, ‘bench’, ‘bicycle_rental’, ‘biergarten’, ‘cafe’, ‘camp_site’, ‘car_rental’, ‘caravan_site’, ‘castle’, ‘cinema’, ‘community_centre’, ‘drinking_water’, ‘fast_food’, ‘food_court’, ‘fountain’, ‘guesthouse’, ‘hostel’, ‘hotel’, ‘monument’, ‘museum’, ‘nightclub’, ‘observation_tower’, ‘park’, ‘picnic_site’, ‘pitch’, ‘playground’, ‘pub’, ‘restaurant’, ‘ruins’, ‘sports_centre’, ‘stadium’, ‘swimming_pool’, ‘theatre’, ‘tourist_info’, ‘viewpoint’, ‘wayside_shrine’.
For shopping journeys: ‘atm’, ‘bakery’, ‘beauty_shop’, ‘beverages’, ‘bicycle_shop’, ‘bookshop’, ‘butcher’, ‘chemist’, ‘clothes’, ‘computer_shop’, ‘convenience’, ‘department_store’, ‘doityourself’, ‘florist’, ‘furniture_shop’, ‘garden_centre’, ‘general’, ‘gift_shop’, ‘greengrocer’, ‘jeweller’, ‘kiosk’, ‘mall’, ‘market_place’, ‘mobile_phone_shop’, ‘optician’, ‘outdoor_shop’, ‘pharmacy’, ‘shoe_shop’, ‘sports_shop’, ‘stationery’, ‘supermarket’, ‘toy_shop’, ‘video_shop’.
For education journeys: ‘college’, ‘kindergarten’, ‘library’, ‘mall’, ‘museum’, ‘school’, ‘swimming_pool’, ‘university’.
The movement from origins to destinations was simulated within 1000 m and 5000 m in order to see where majority of people are attracted during the day within own neighborhood or at the whole investigated area scale. The results for various types of trips were compared between themselves as well as to location of living places. Synergy was measured as correlations between calculation results within radius 1000 (higher correlations: more multifunctional neighborhood) and between radius 1000 and 5000 (higher correlations: more synergy between local and global) or whole area structure or pervasiveness which shows sustainability of urban form according to Hillier [
11].
Correlations were obtained in an Excel spreadsheet. As the main and only indicator, we used so-called gravity or network quantity penalized by distance (Integration in Space Syntax).
The formula was following [
12]:
where:
NQPD(x)—indicator calculated for the node x (segment street) of the graph-network of the streets;
x—origin of every simulated journey and only segments where people live nearby were used for calculation;
∑y∈Rx—sum of the values of all destinations y which could be reached from x within radius R
W(y)—weight of destination (if there is an object to travel to, weight is 1; if not, 0)
d(x,y)—distance between x and every y in meters (for 1000 radius) and in angles of road network (for 5000 radius)
Finally, the pervasiveness evaluation was performed. The idea was that urban structure by itself and allocation of people and working/leisure/shopping/education places create a kind of “gravity fields” which attract people during the day. Fluctuations of differences between those “gravity fields” demonstrate either multifunctionality (smaller fluctuations) or mono-functionality (bigger fluctuations) of the investigated urban structure. Smaller fluctuations, as it was argued earlier, demonstrate higher correspondence to the New Urbanism neighborhood idea at the local level or radius 1000 m. Smaller fluctuations between the simulations results with radius 1000 m and 5000 m demonstrated higher pervasiveness of urban structure. Both models—New Urbanism and pervasiveness—demonstrate sustainability of urban form and, at least indirectly, could demonstrate entropy of energy consumptions. Synergy between these gravity fields was counted as Spearman’s correlations between space syntax values, while allocation of destinations (work, leisure, shopping, education) as weight for destination. Weak correlations of low synergy mean entropy of both functions and energy consumption in the area.
3. Results
The simulated journeys on the base space syntax model within selected radiuses in the investigated area allowed us to identify the probable zones of the highest concentration of people or so-called human load while travelling to shops, educational facilities, for leisure purposes, and work. The overlap of these zones was evaluated by means of the statistical analysis—the identified Spearman’s correlation coefficients could be seen not only as a mathematical indicator of the degree of overlap between the allocation of the four types of the objects (work, leisure, education, and commerce) but as a synergy between a kind of field of gravity generated by various objects within the urban network. In terms of energy consumption and load on the urban infrastructure, the higher synergies and bigger correlations mean the lower fluctuation of human load and therefore, more stable and predictable patterns of energy consumption. The usage of correlation between various zones of gravity works as a kind of normalization, thus allowing us to perform a comparison between different neighborhoods in the investigated area or even smaller pieces of territory if needed. It is important to point out that, because of the simulative nature, the space syntax modeling could be conducted not only for the present, but for the past and future situations as well. In the first case, the modeling results can help us to see and understand the evolution of the area and, if applicable, learn from the past. In the second case, the presented model could serve as a part of the decision support system or even background for parametric modeling for future solutions.
Despite the fact that the presented research was focused primarily on the analysis and comparison of fluctuations of human load on urban energy infrastructure, it should be pointed out the identified synergy between different gravity fields generated by four types of travel destinations within three different radiuses in the urban network demonstrated a degree of multifunctionality of the areas. As such, it could be related to the concept of pervasiveness as an indicator of the sustainability of the urban structure, offered by Hillier. According to him, “pervasive centrality refers to the function of centrality in cities that pervades the urban grid in a more intricate way than has been thought, and that multi-scale centrality should be seen as a pervasive function in cities, with clear spatial correlates, and not simply as a hierarchy of locations.” [
11]. In this case, the results of the presented investigation could be used for the analysis and comparison of urban sustainability in a similar way or besides such tools as urban sustainability compass [
13].
The validation of the modeling results demonstrated that a generic space syntax model both at the level of the neighborhood (radius 1000) and the whole area (radiuses 5000 and 15000) work very well. Results of the statistical analysis of correlations between the density of POIs, inhabitants, and four space syntax indicators are presented in
Table 1. The weakest correlations are between the simulated transit flows (Choice in Space Syntax) and POIs density with inhabitant density. Even if moderate correlations were observed at the local level (radius 1000) and it could be considered as not very strong, but sufficient for validation of the model, the absence of better results with global transit (radius 5000 m) could be explained by a very well developed road network in the area, thus creating a lot of alternative routes for journeys inside the region. Strong correlations were observed with so-called closeness centrality represented by Integration in the space syntax or Gravity in the presented investigation and density of street segment nodes in the network. In both cases, correlations demonstrated high values with a slightly higher result for street segment node density (node count). Based on these results, the simulative model was considered as valid and the integration of gravity chosen for the modeling and node count do not represent a simulation of the movement of people.
Calculated zones of attraction (
Table 2,
Figure 2,
Figure 3 and
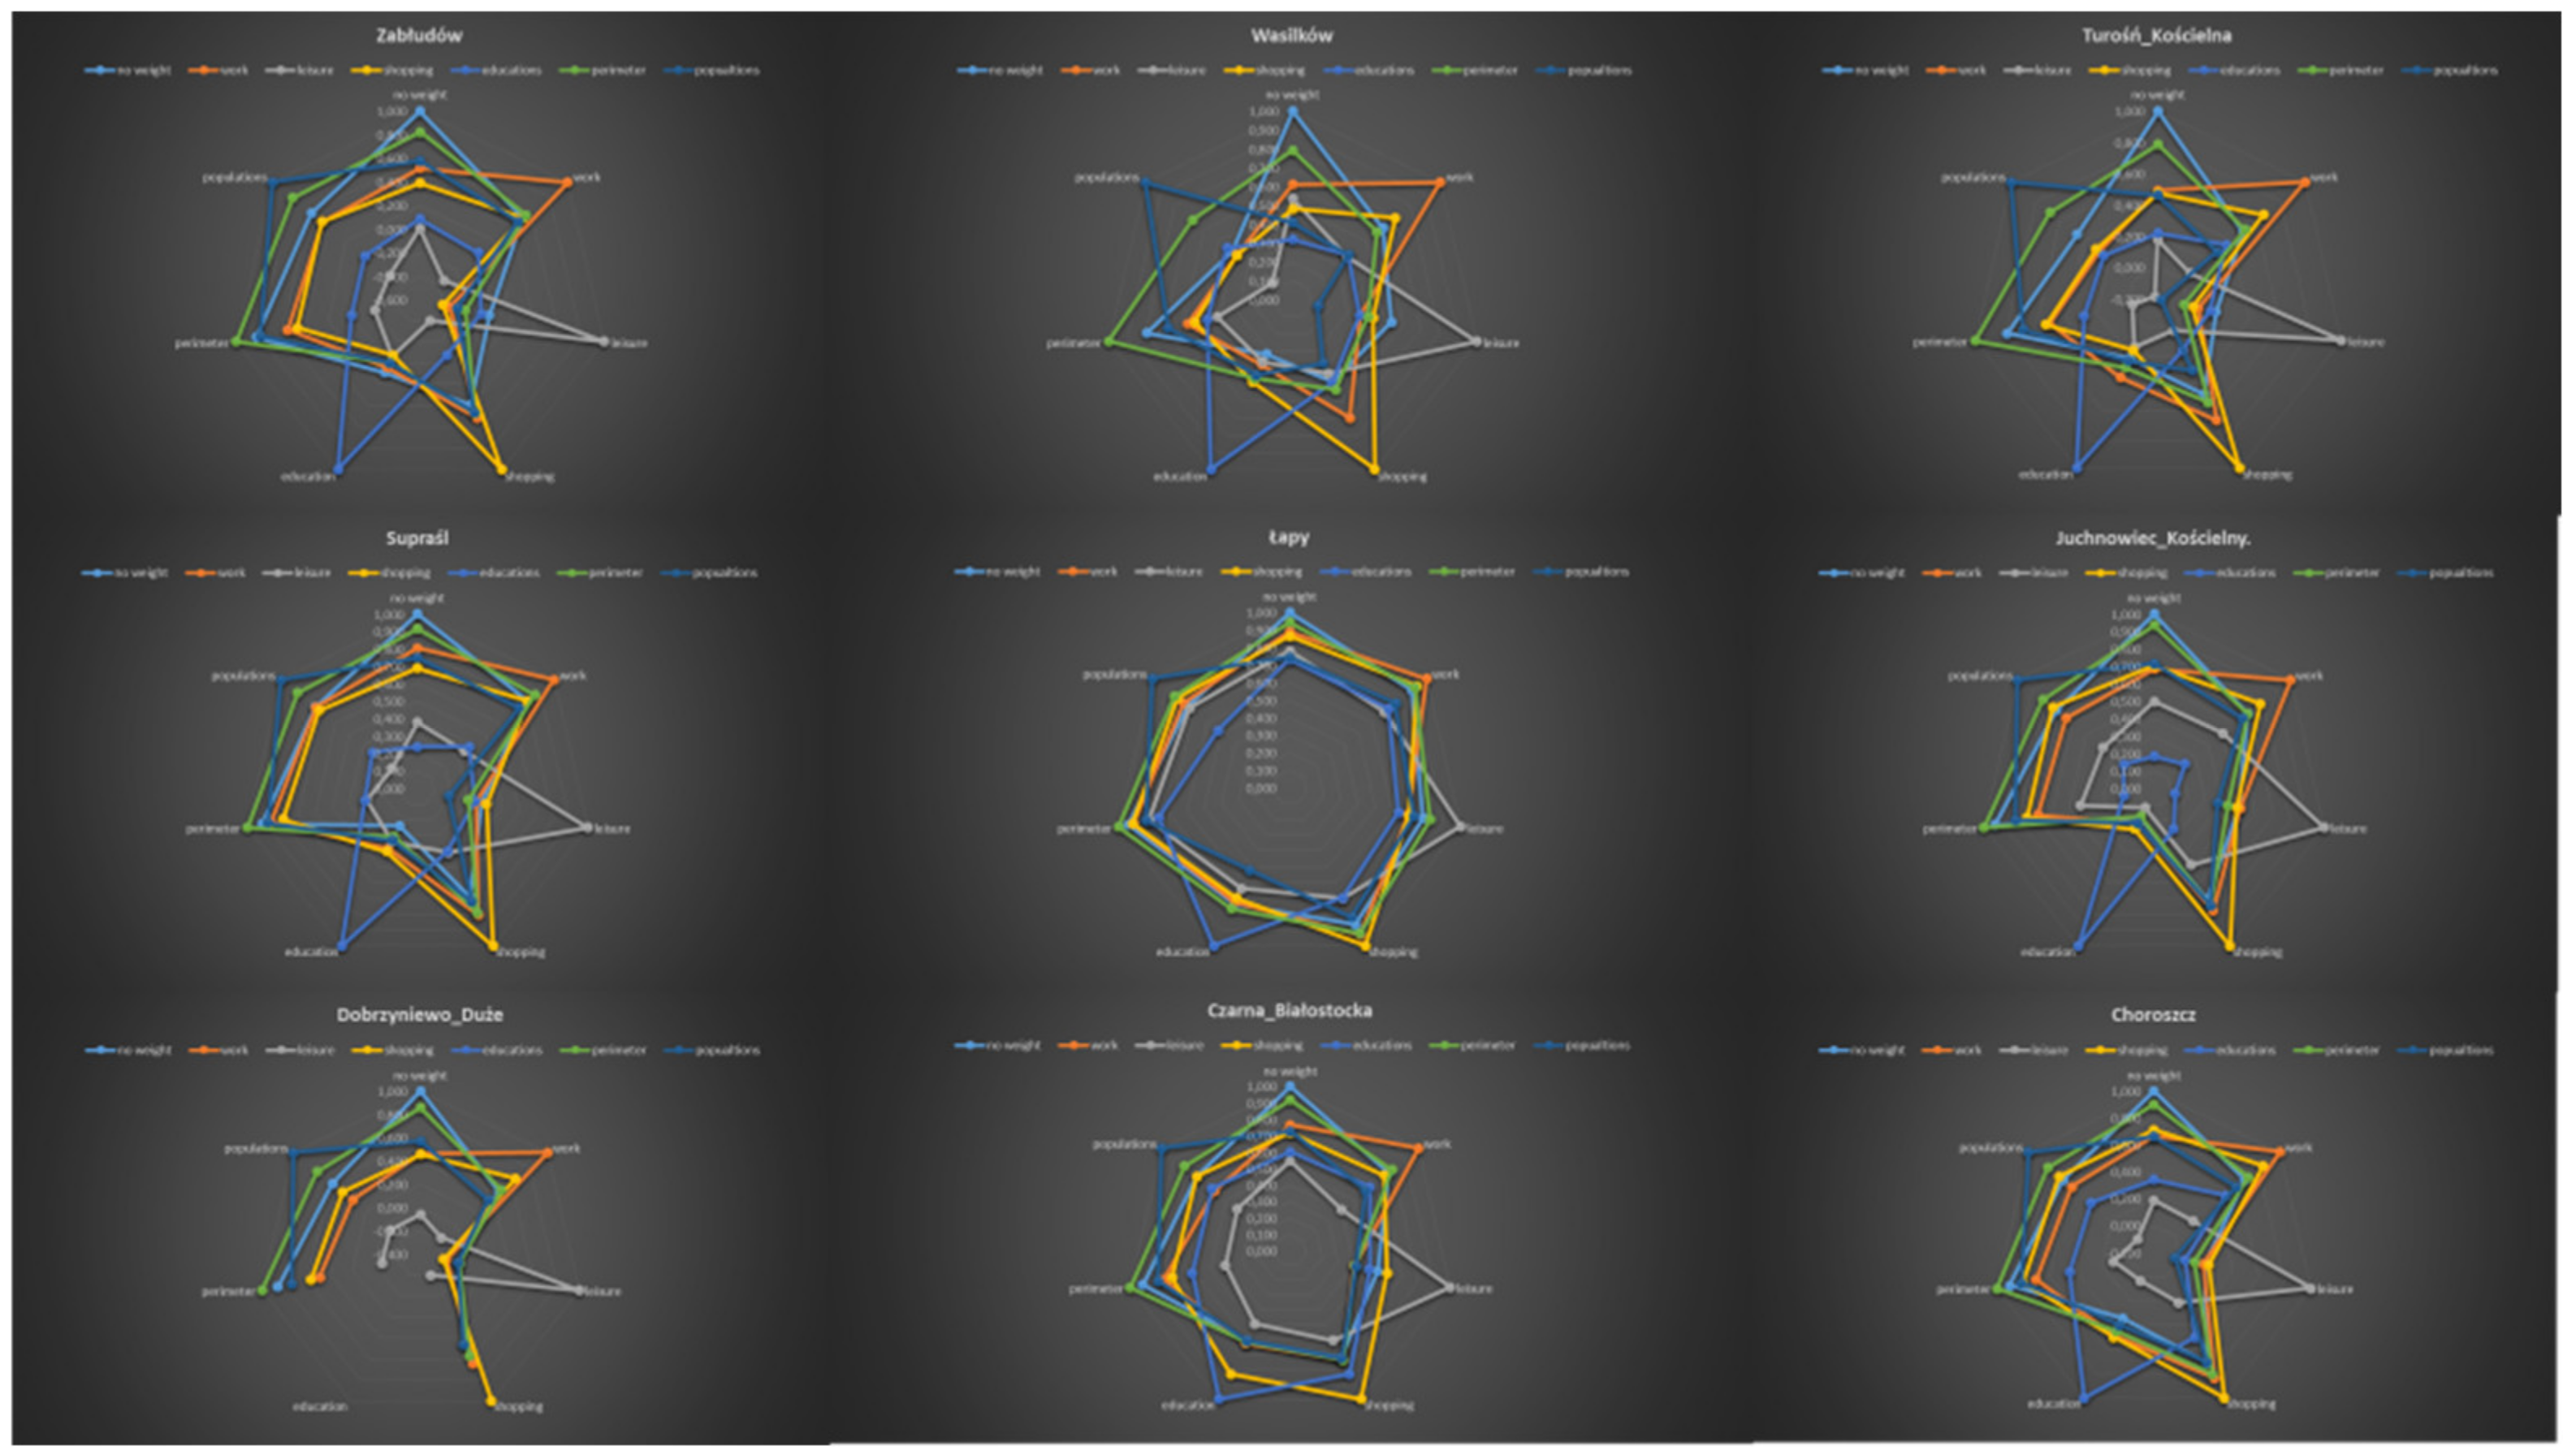
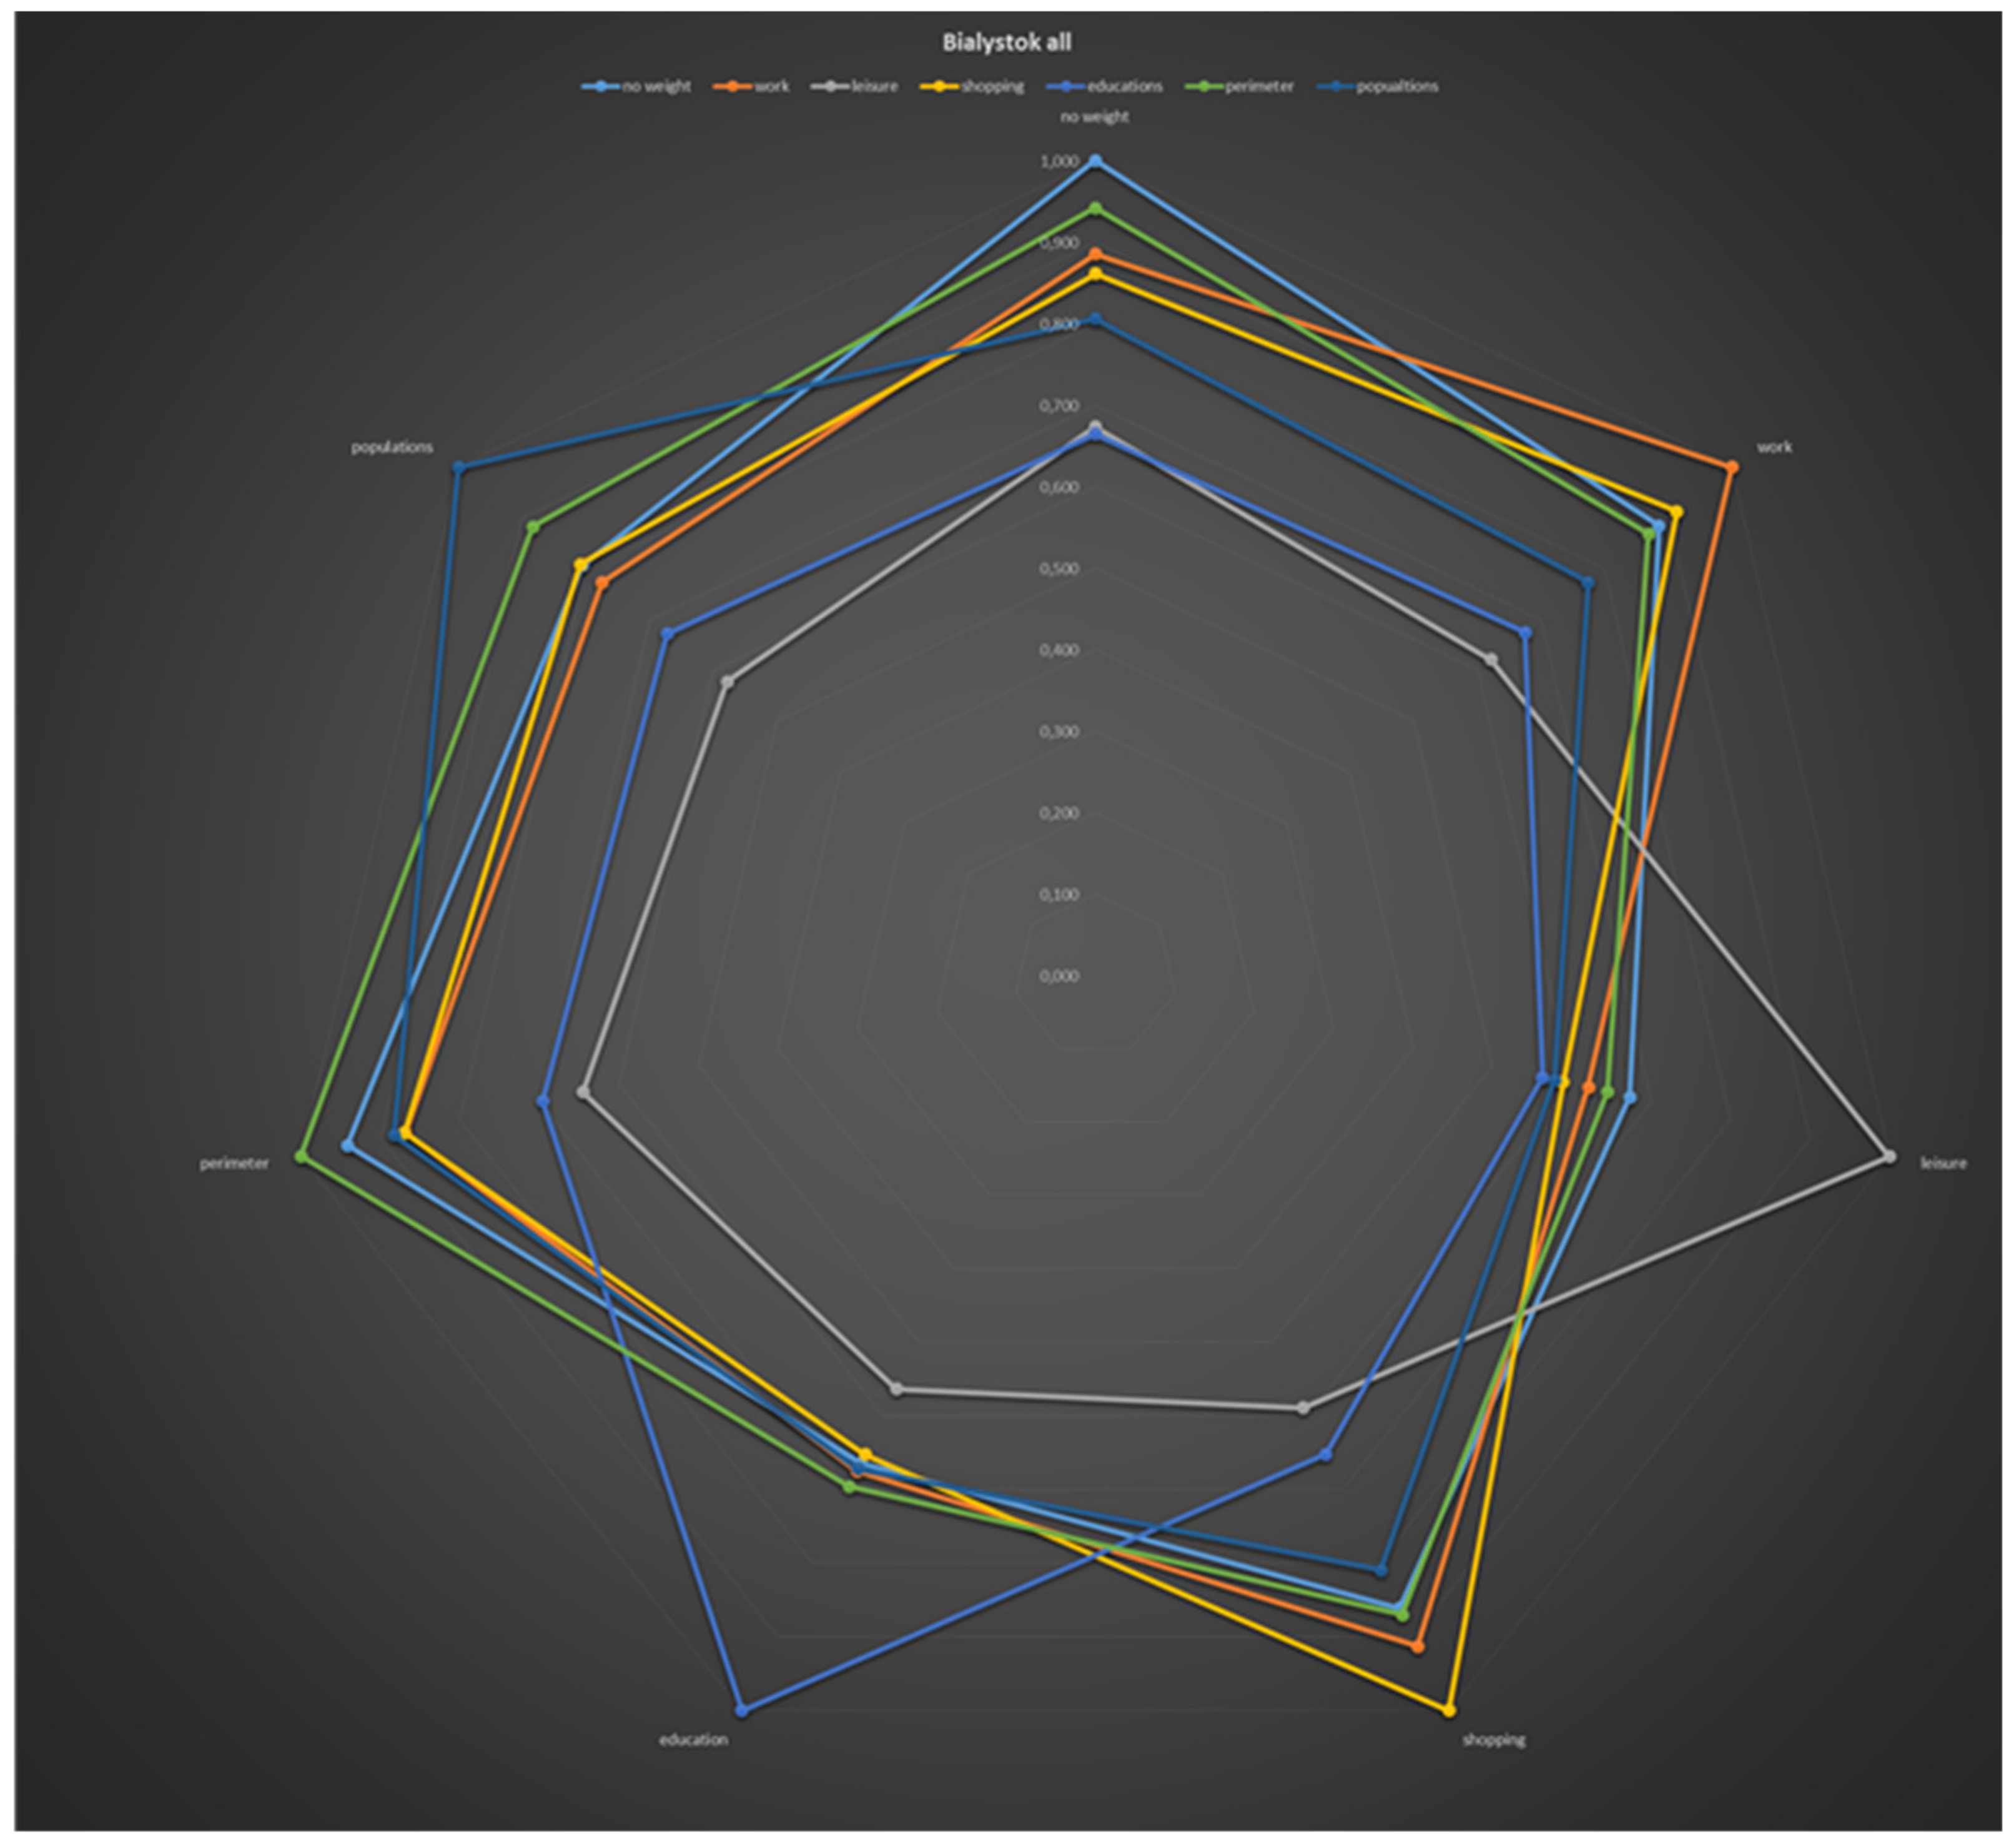
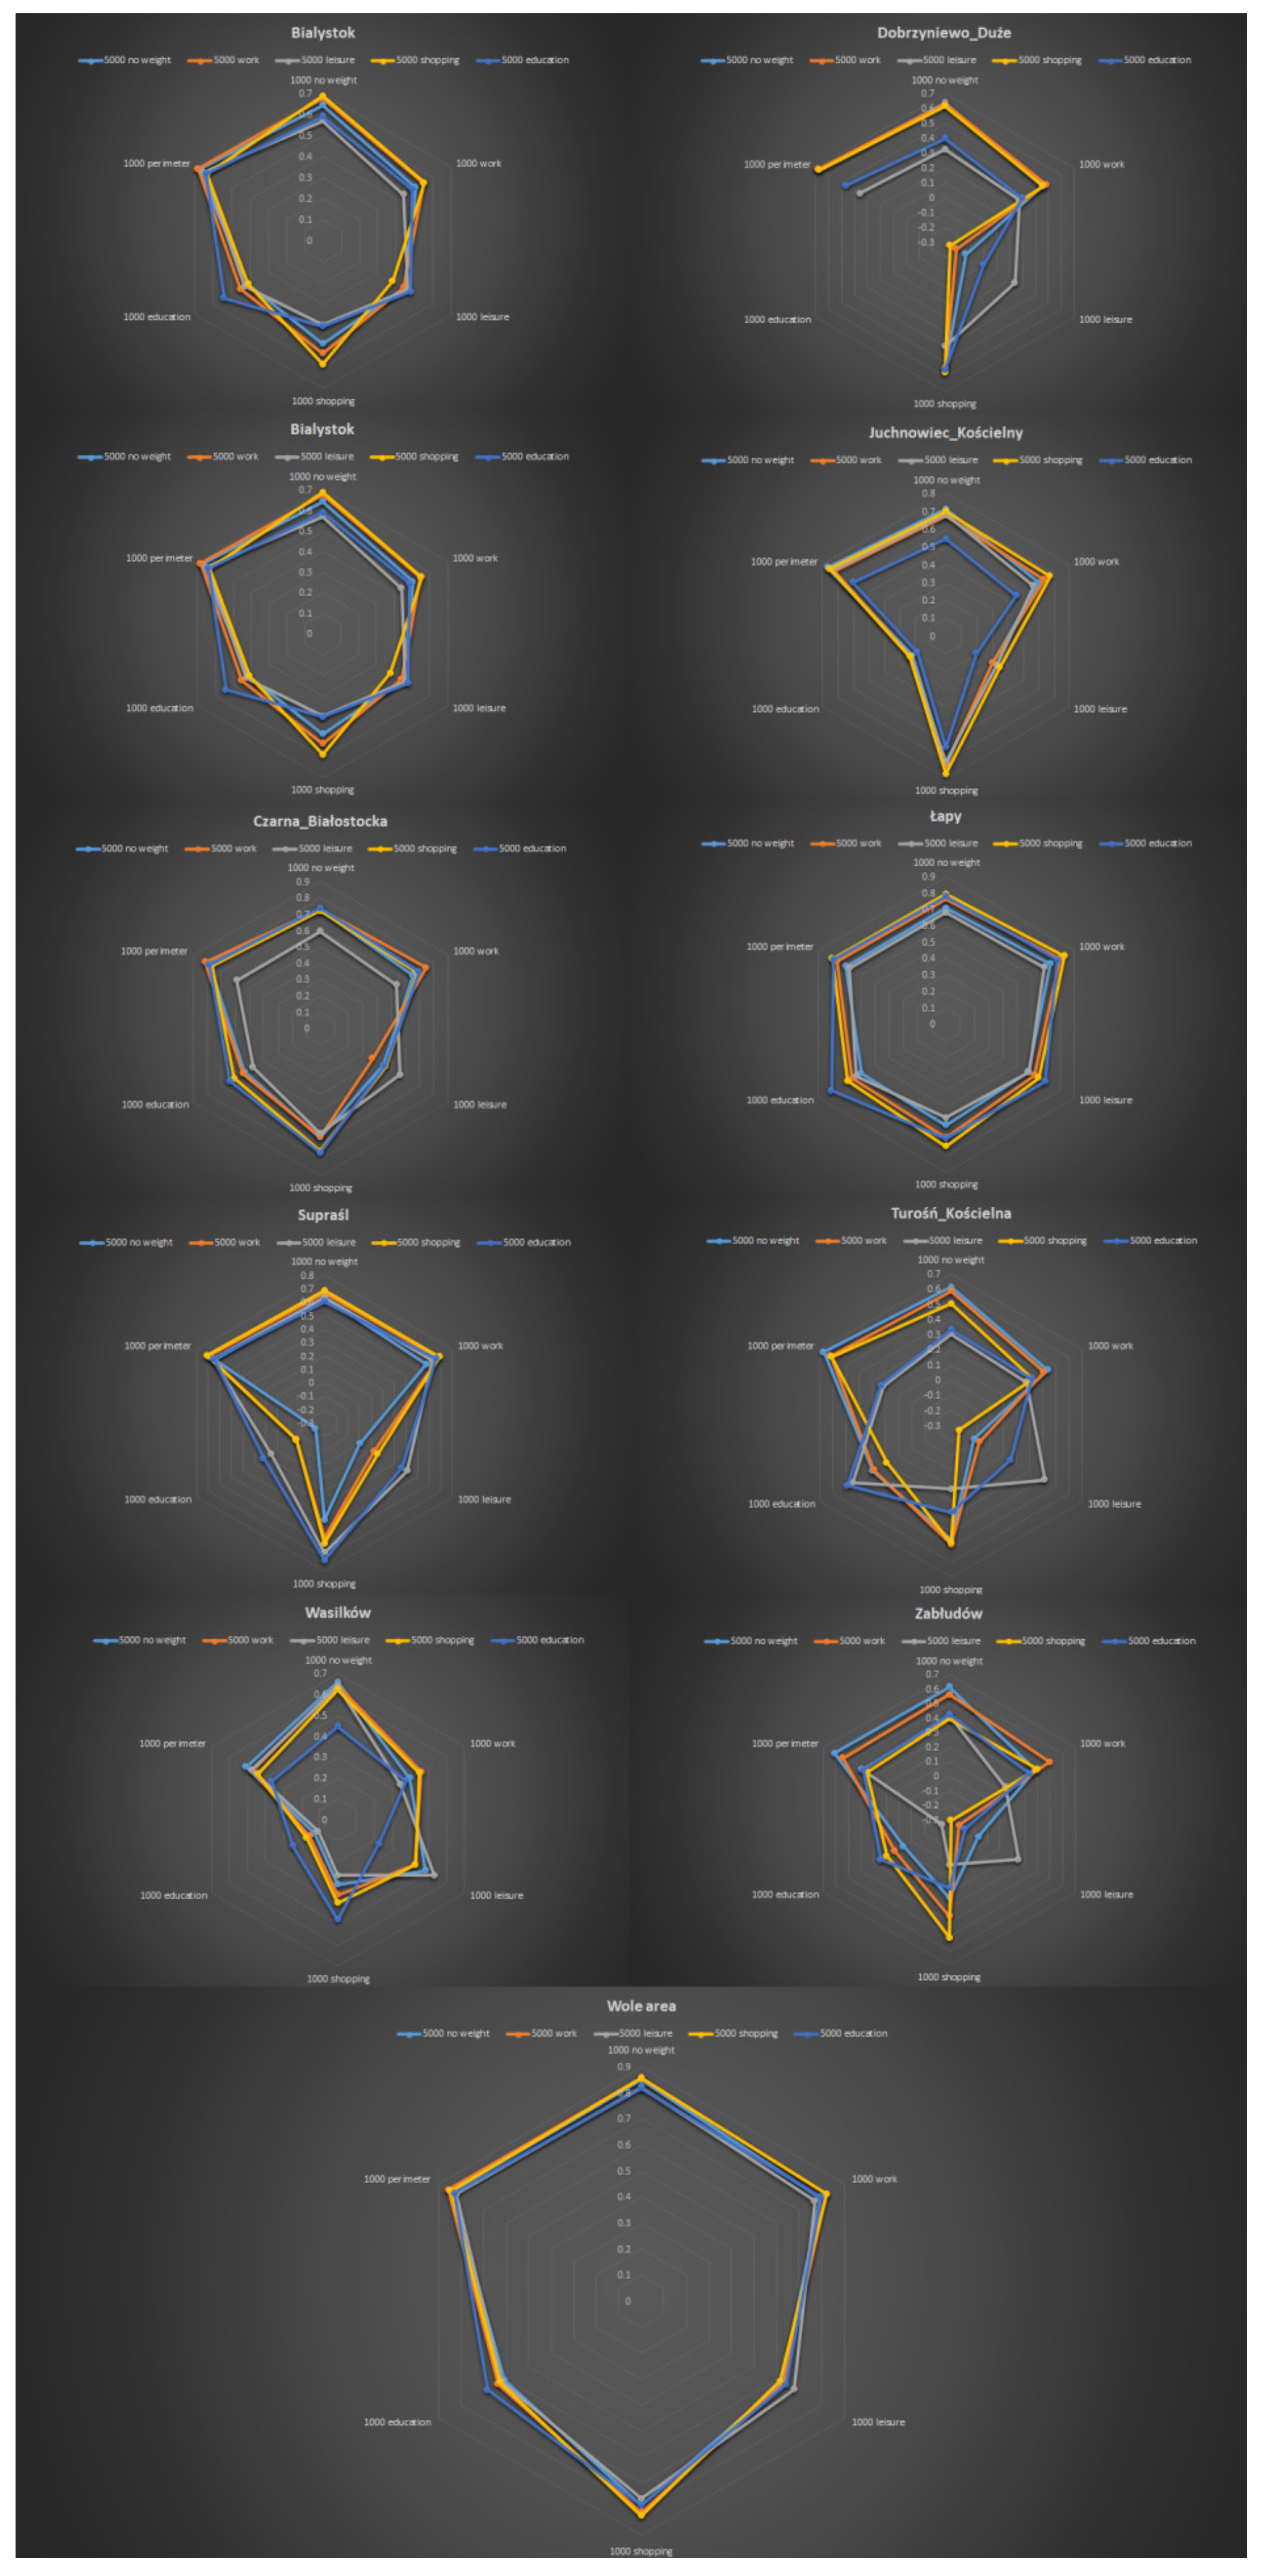
Figure 4) when people move to work, recreation, shopping, and education, and the most intensive zones of spatial urban structure within 1000 m could be related to the optimality of 15 min city or New Urbanism neighborhood concepts. A scatterplot of the zones of attraction according to the functional spheres for Bialystok city is presented in
Figure 2. It shows synergies or correlations (
Table 2) between gravity fields generated by four types of journeys (work, leisure, shopping, ajd education) within radius 1000 m and two additional calculations: gravity with no specific destinations considered as affected just by the configuration of the street network (no weight) and as destination-marked zones with a higher building and street contact perimeter. The last indicator is based on the World Bank report on walkability [
14] and could reveal public space to be more attractive for street culture. The “no weight” calculation could be useful for urban planners focussing just on spatial form while evaluating its effects on sustainability. Gravity fields of each type of journey are represented by the accordingly named line in the scatterplot while its correlations are reflected by the position of the line of the seven axes. Because correlations between the same innovators are always one, each line reaches the maximal position at least on one axe which marks itself. A more “spiky” and “star shape” scatterplot means less synergy between the gravity fields generated by different journeys. Based on the comparison of the correlations vs. scatterplots, the following neighborhoods could be named as the least multifunctional: Dobrzyniewo Duże, Choroszcz, Juchnowiec_Kościelny, Turośń_Kościelna, and Wasilków. Zabłudów, Łapy, Czarna_Białostocka, Supraśl, and Bialystok city could be named as more multifunctional neighborhoods.
At the scatterplot of Bialystok, we can see that zones of attraction of journeys of no weight and perimeter and also work are quite regular and similar. Zones of population, but especially shopping, leisure, and education, show spiky parts which means an irregular dispersion of journey and areas of concentration.
Much more irregular is that they are also almost in all peripheral communities with the exception of Lapy: the community with the biggest capital town and directly connected to Bialystok by train on the Warsaw–Bialystok line. Others show differences in parallel functional spheres like Bialystok, but with the addition of work (except Choroszcz, Czarna Bialostocka, and Supraśl).
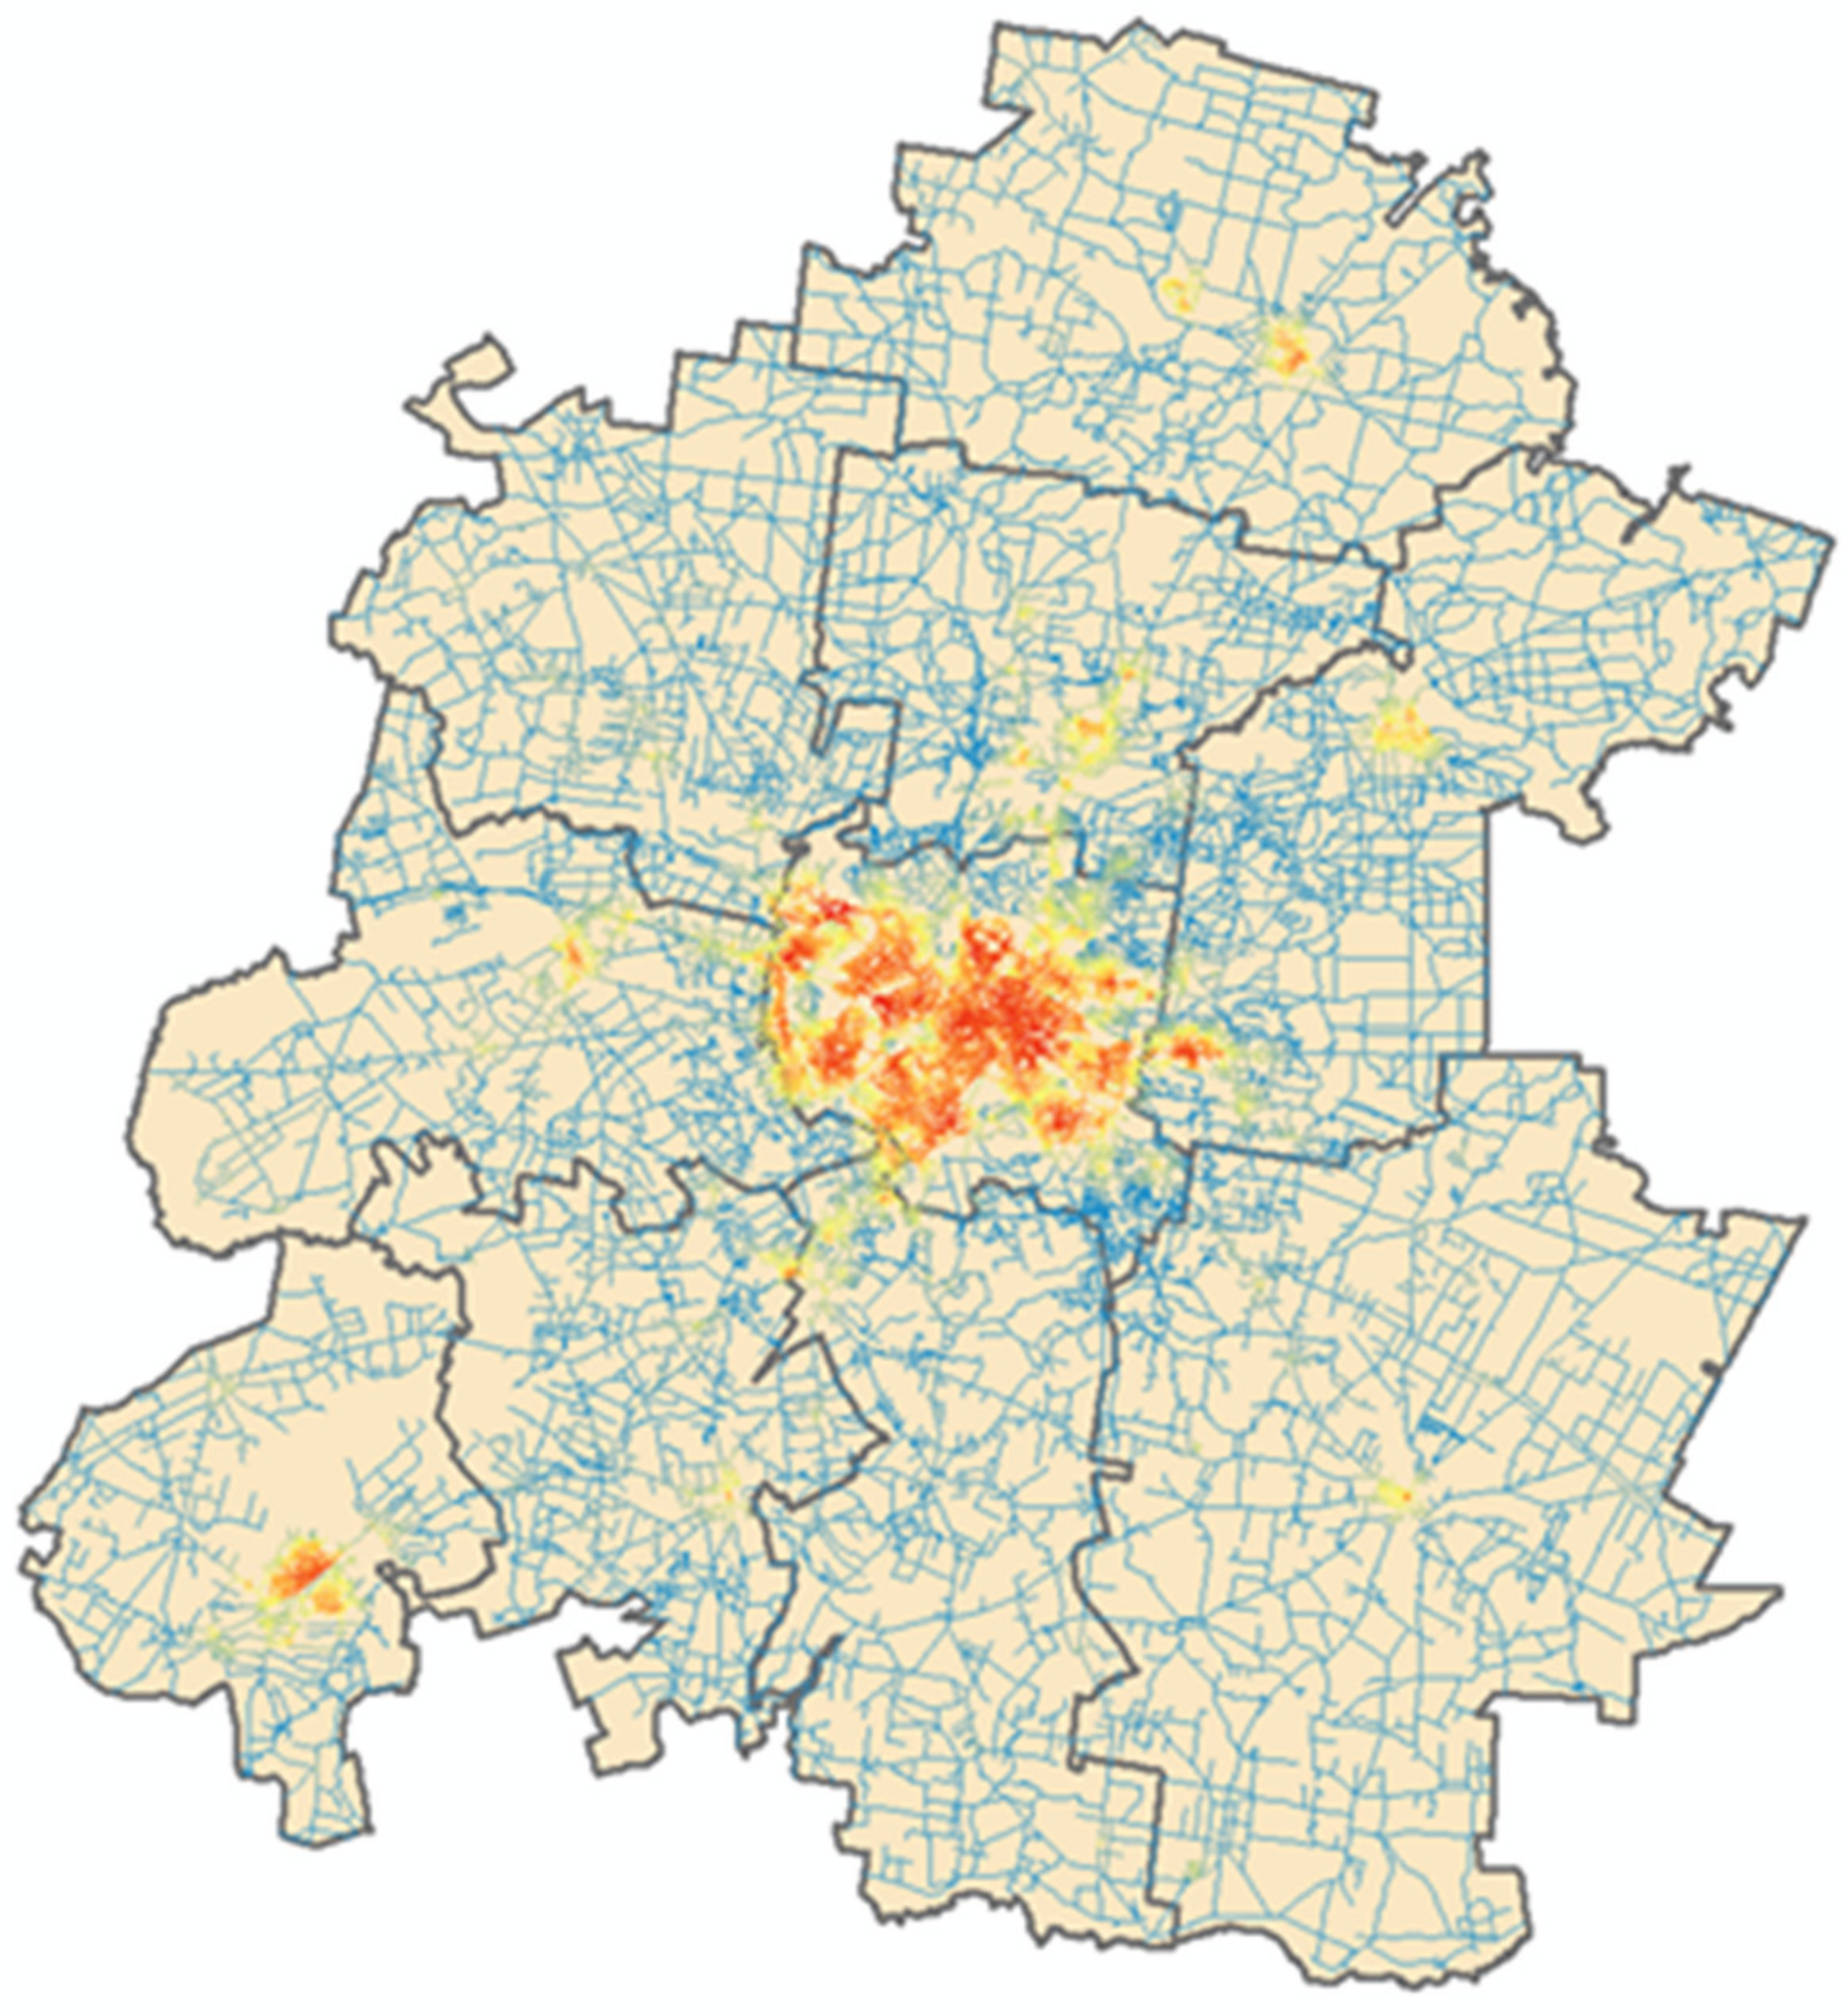
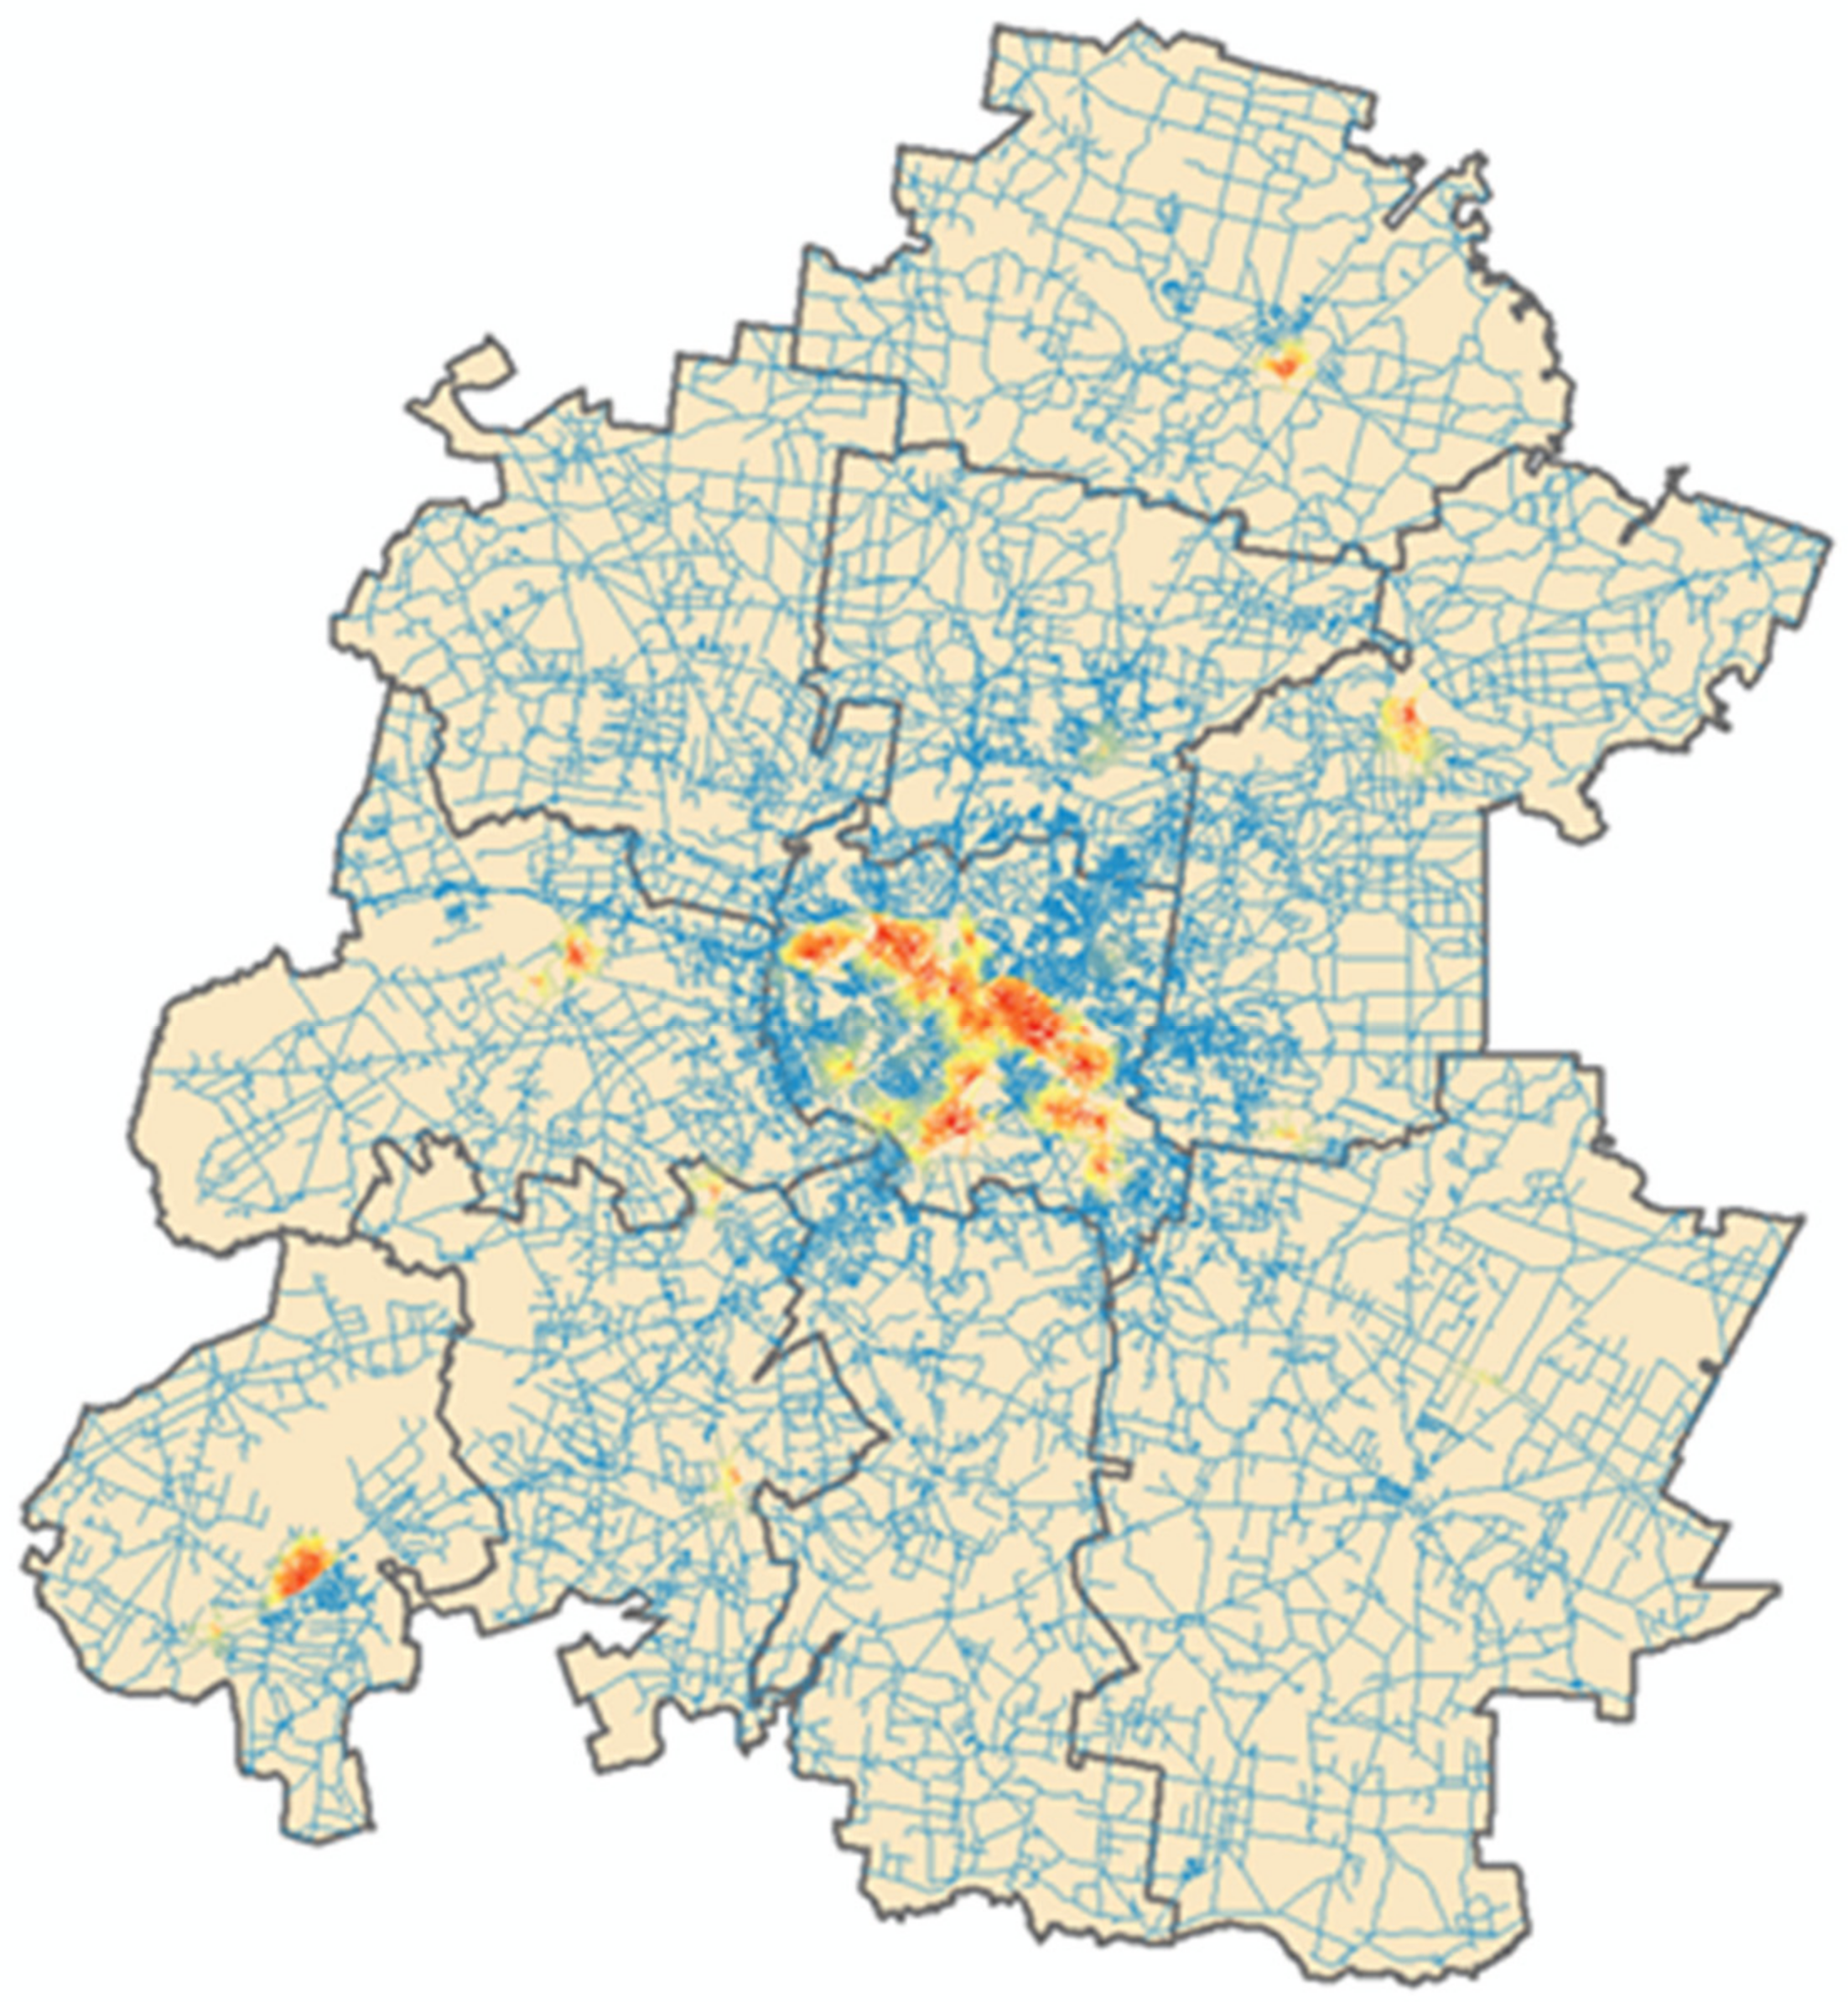
In
Figure 5, colors represent numerical values of gravity or NQPD when people travel from where they live to work places. Red color means higher values, while blue means the lowest values. The red color shows patterns of concentration of NQPD high values and how they overlap with the other values could even be visually compared.
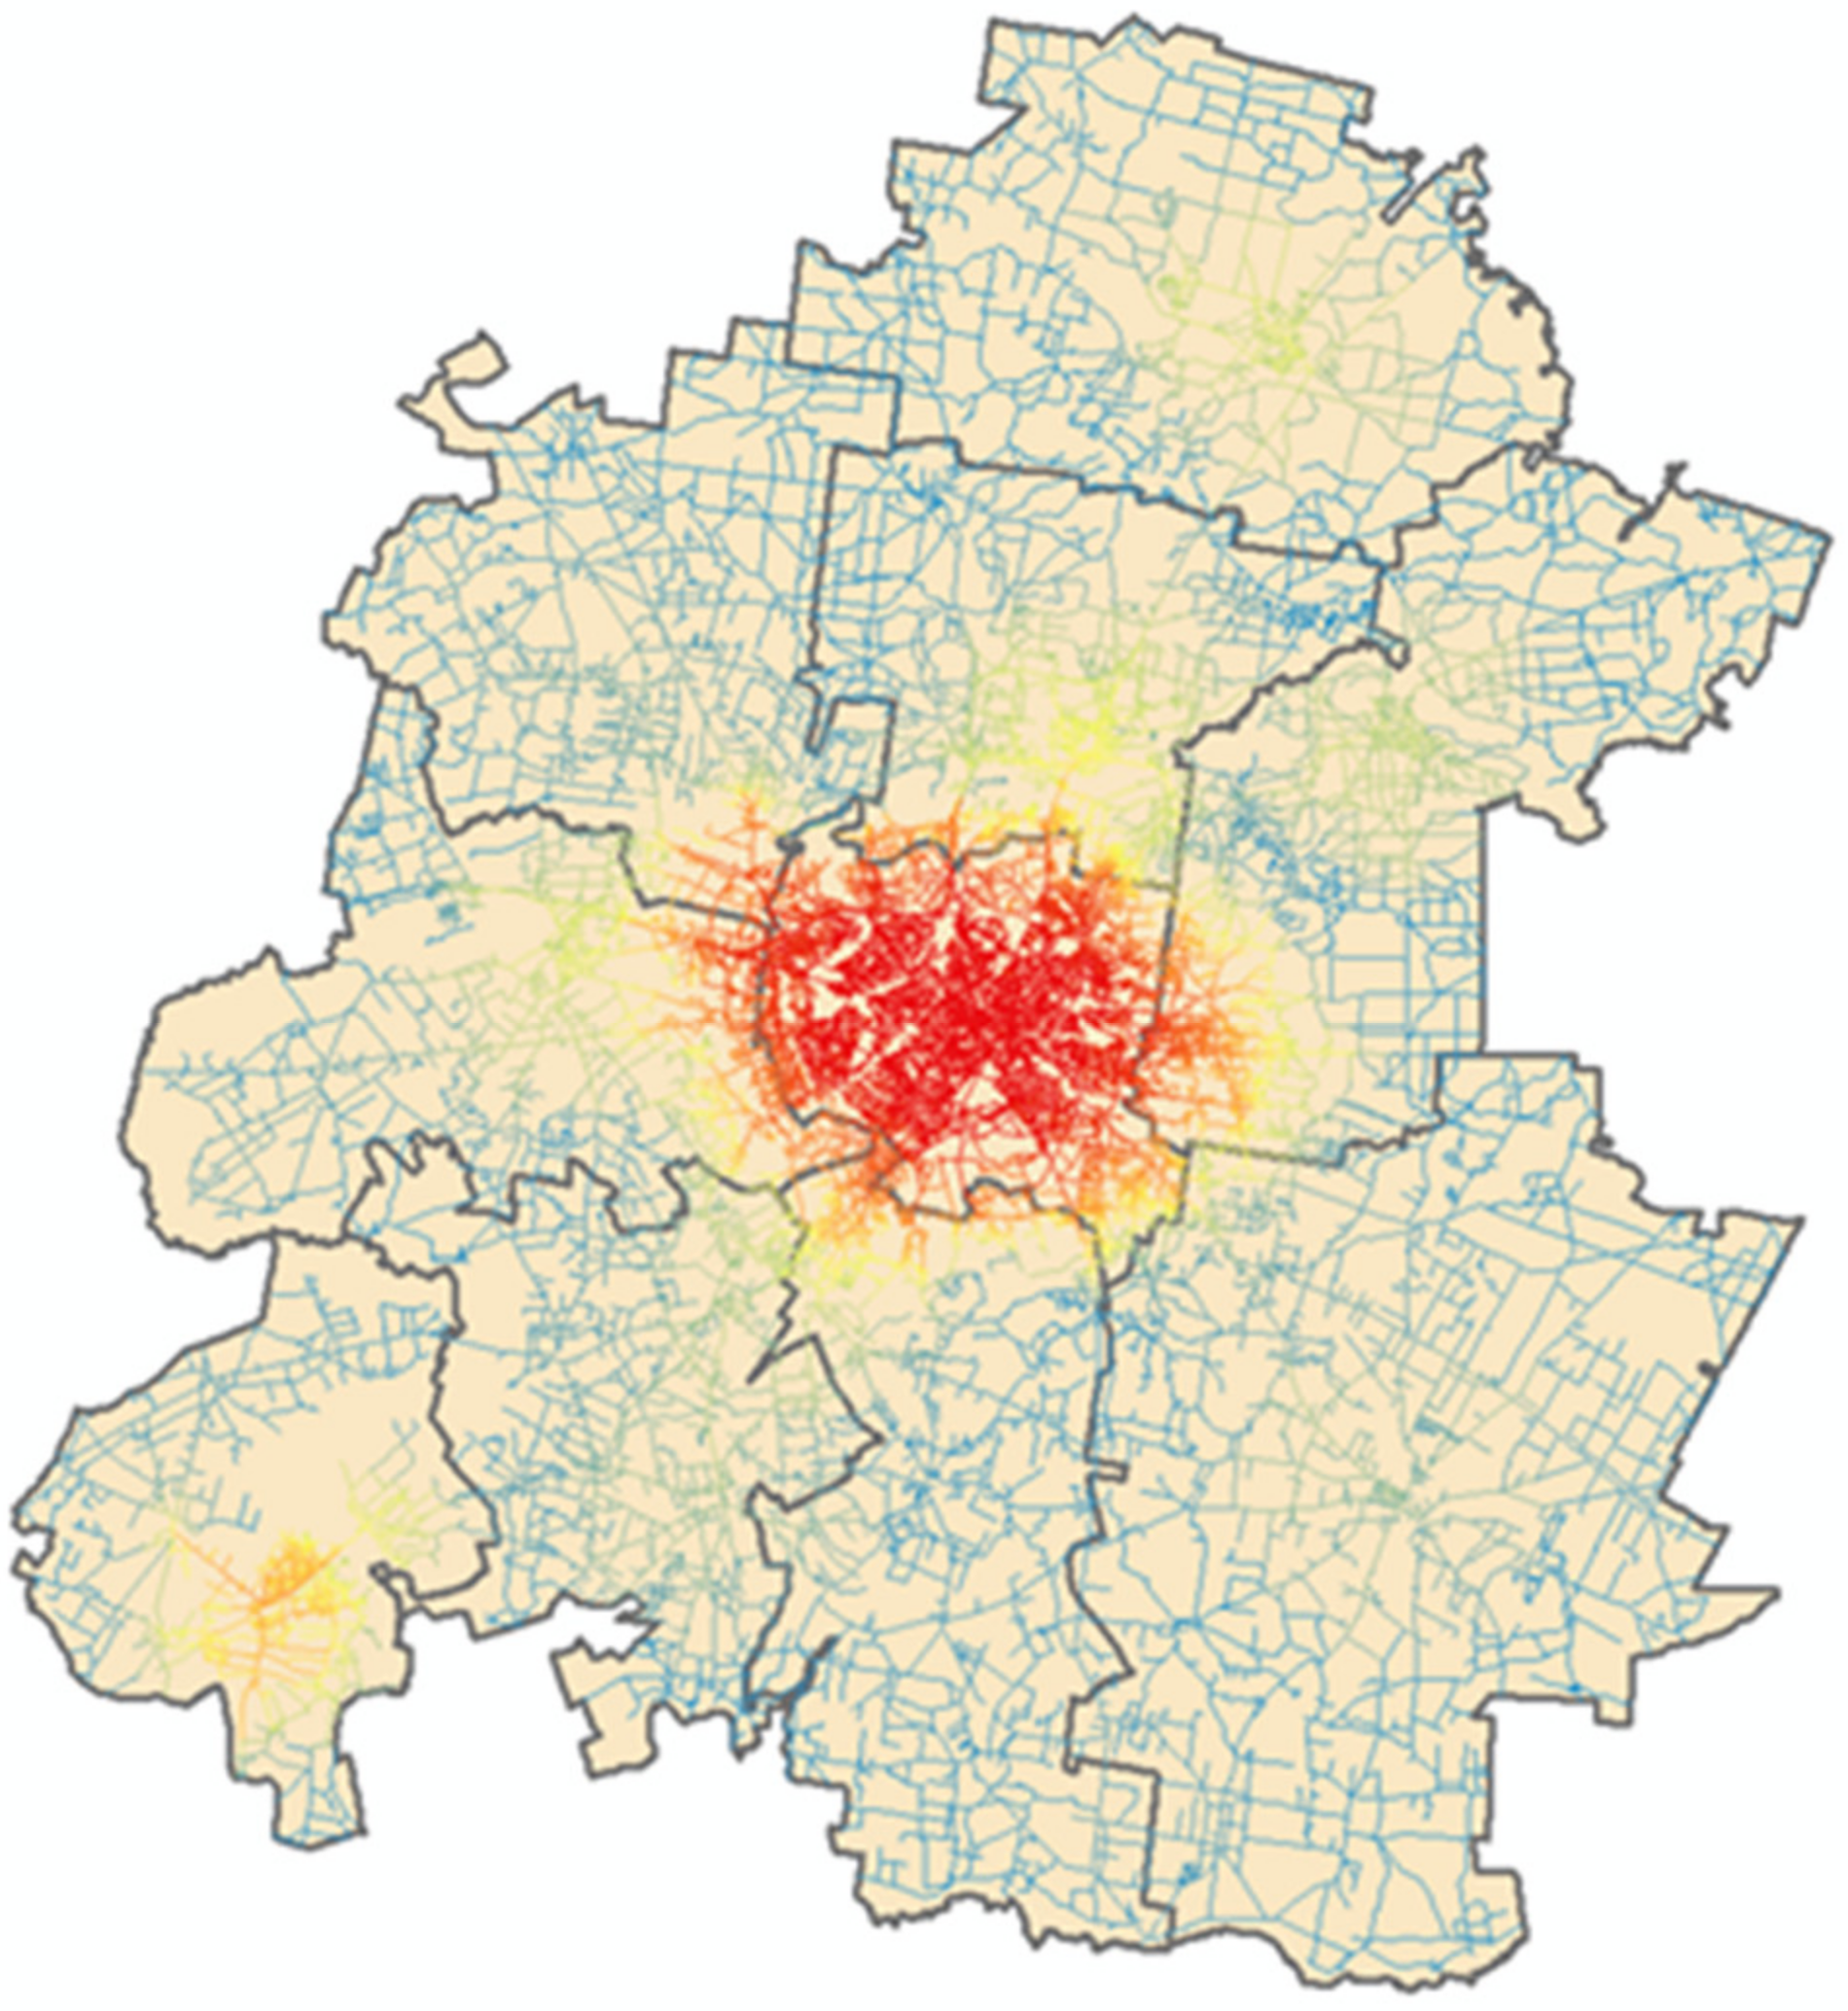
The meaning of the colors is the same as before in the Trips to education NQPD (
Figure 6), and red-color-based patterns show quite noticeable differences if compared with the previous trips to work.
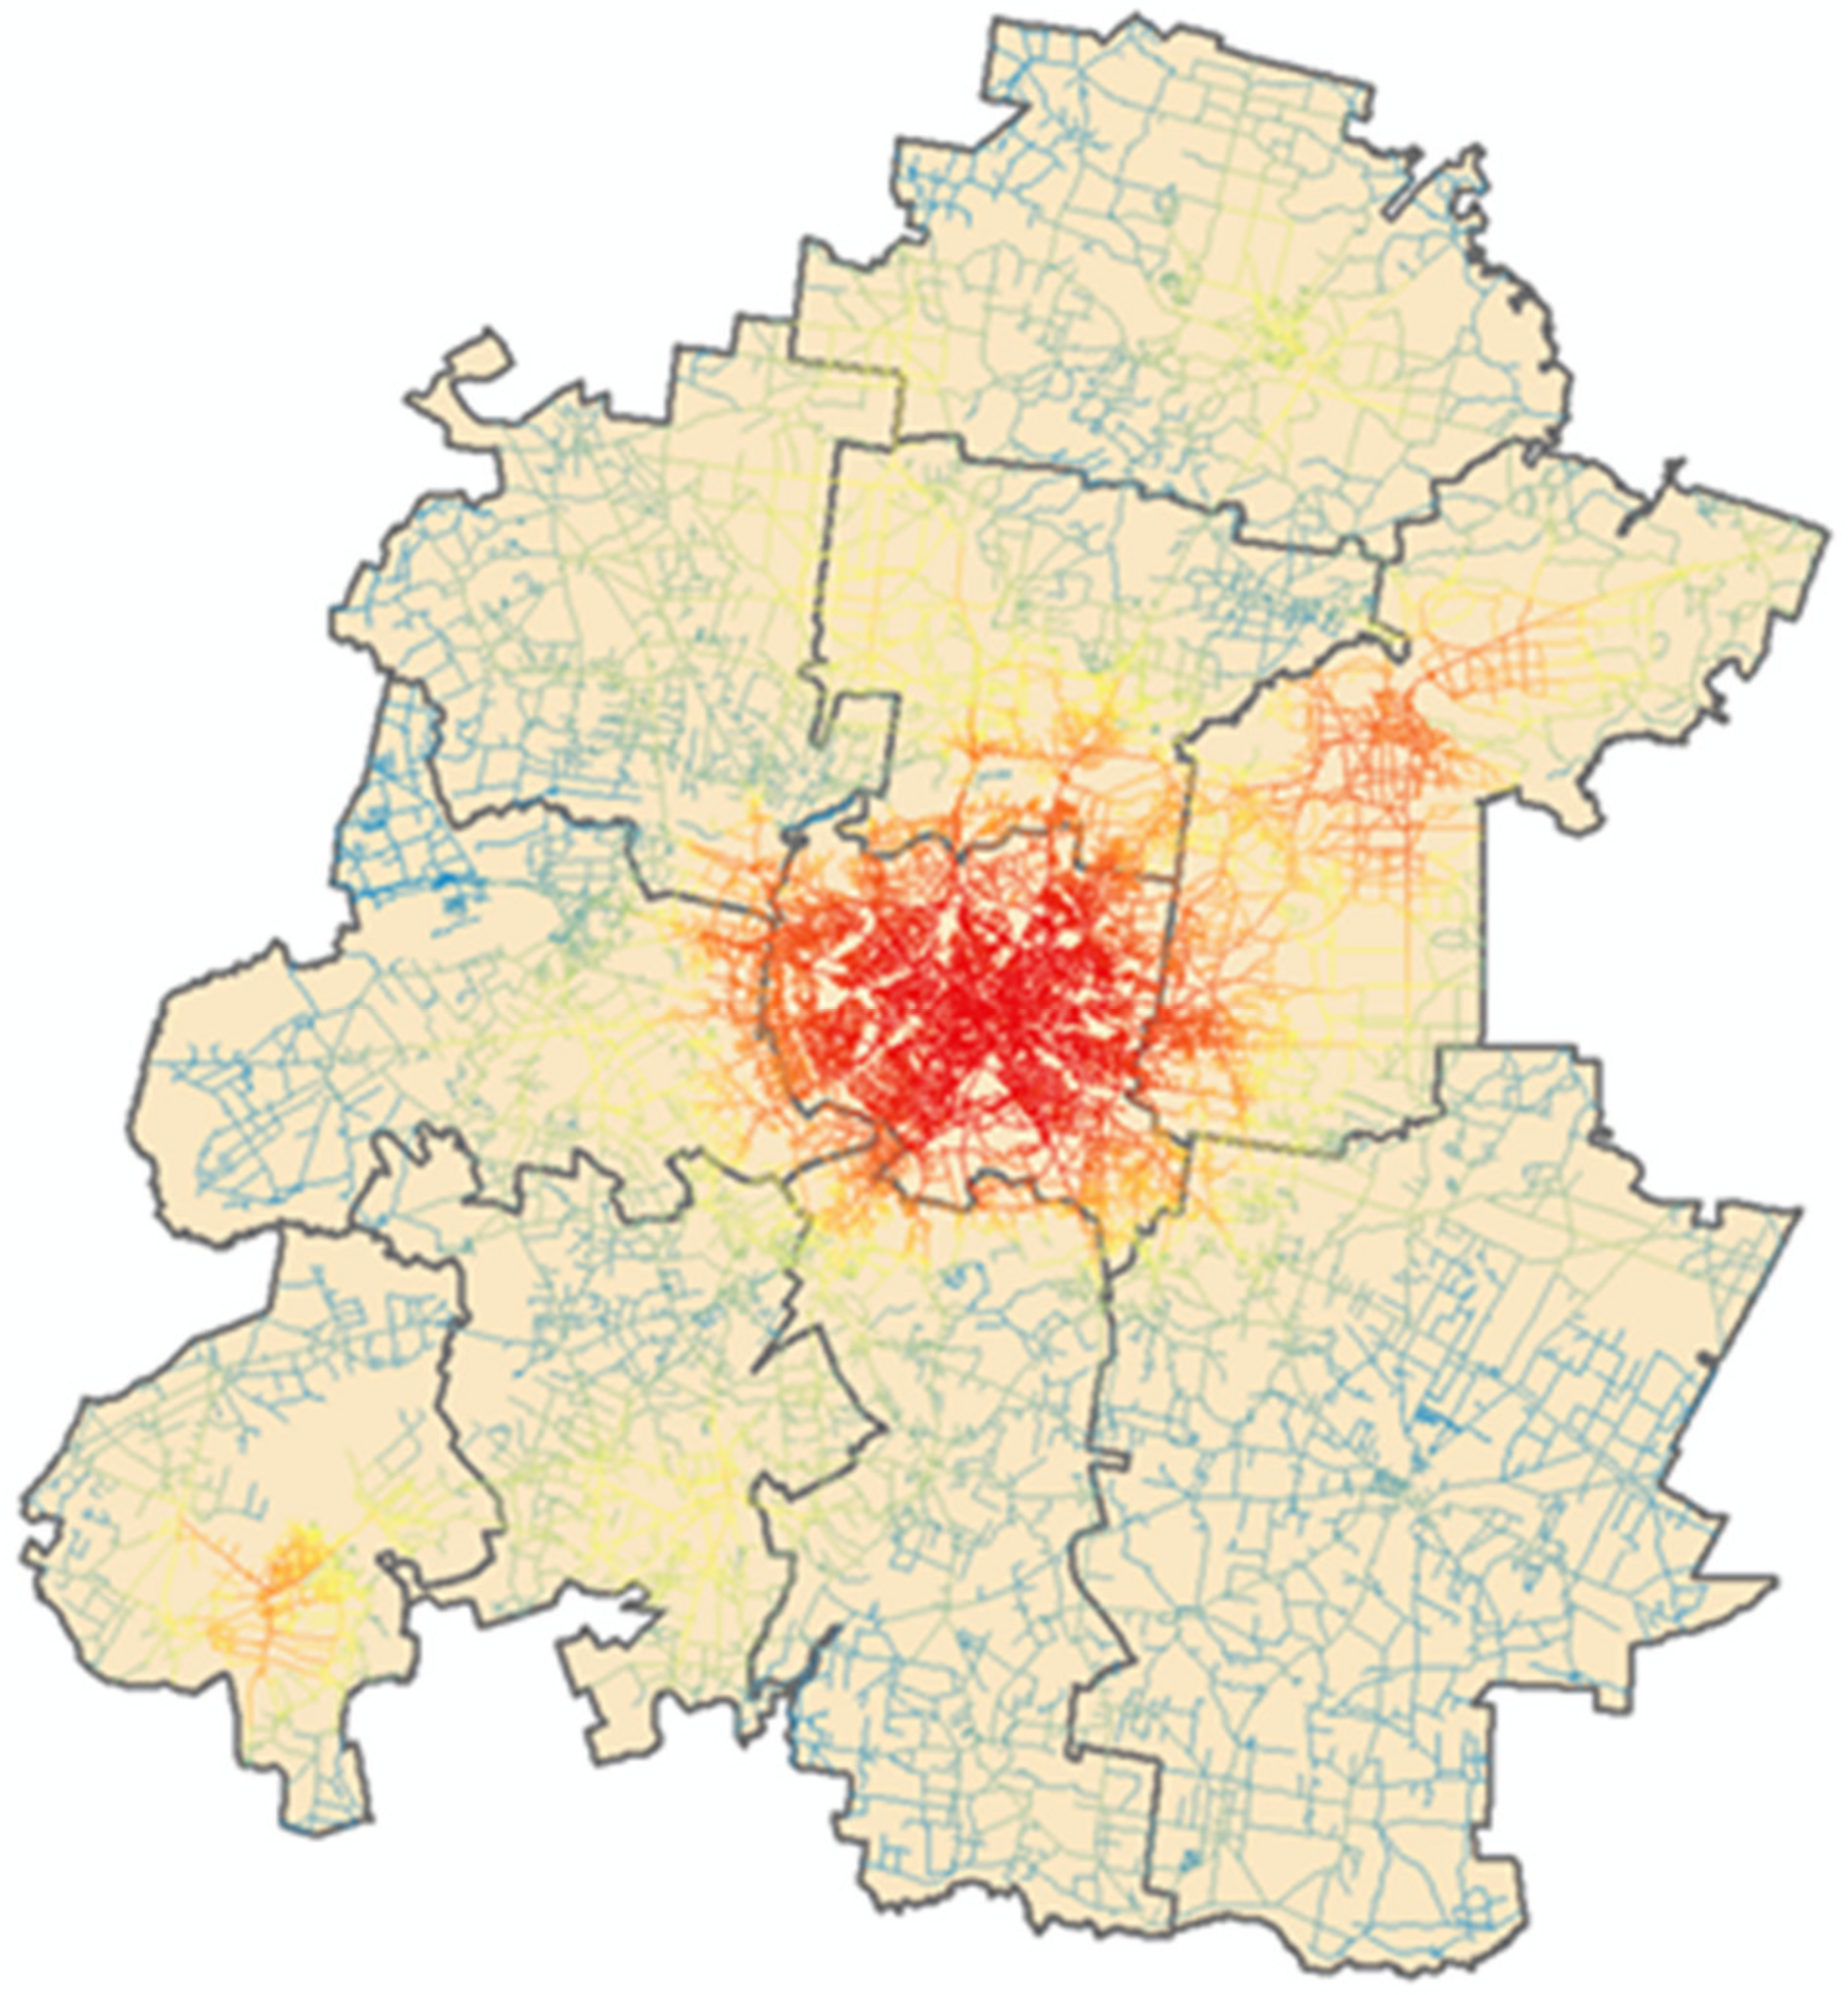
For the Trips to work NQPD (
Figure 7) (color again shows high/low values of NQPD), if compared visually to the first picture (work r1000), we can see that in some cases, red colors overlap very much (Bialystok itself); in some neighborhoods overlap is visible as well (bottom left corner, etc.).
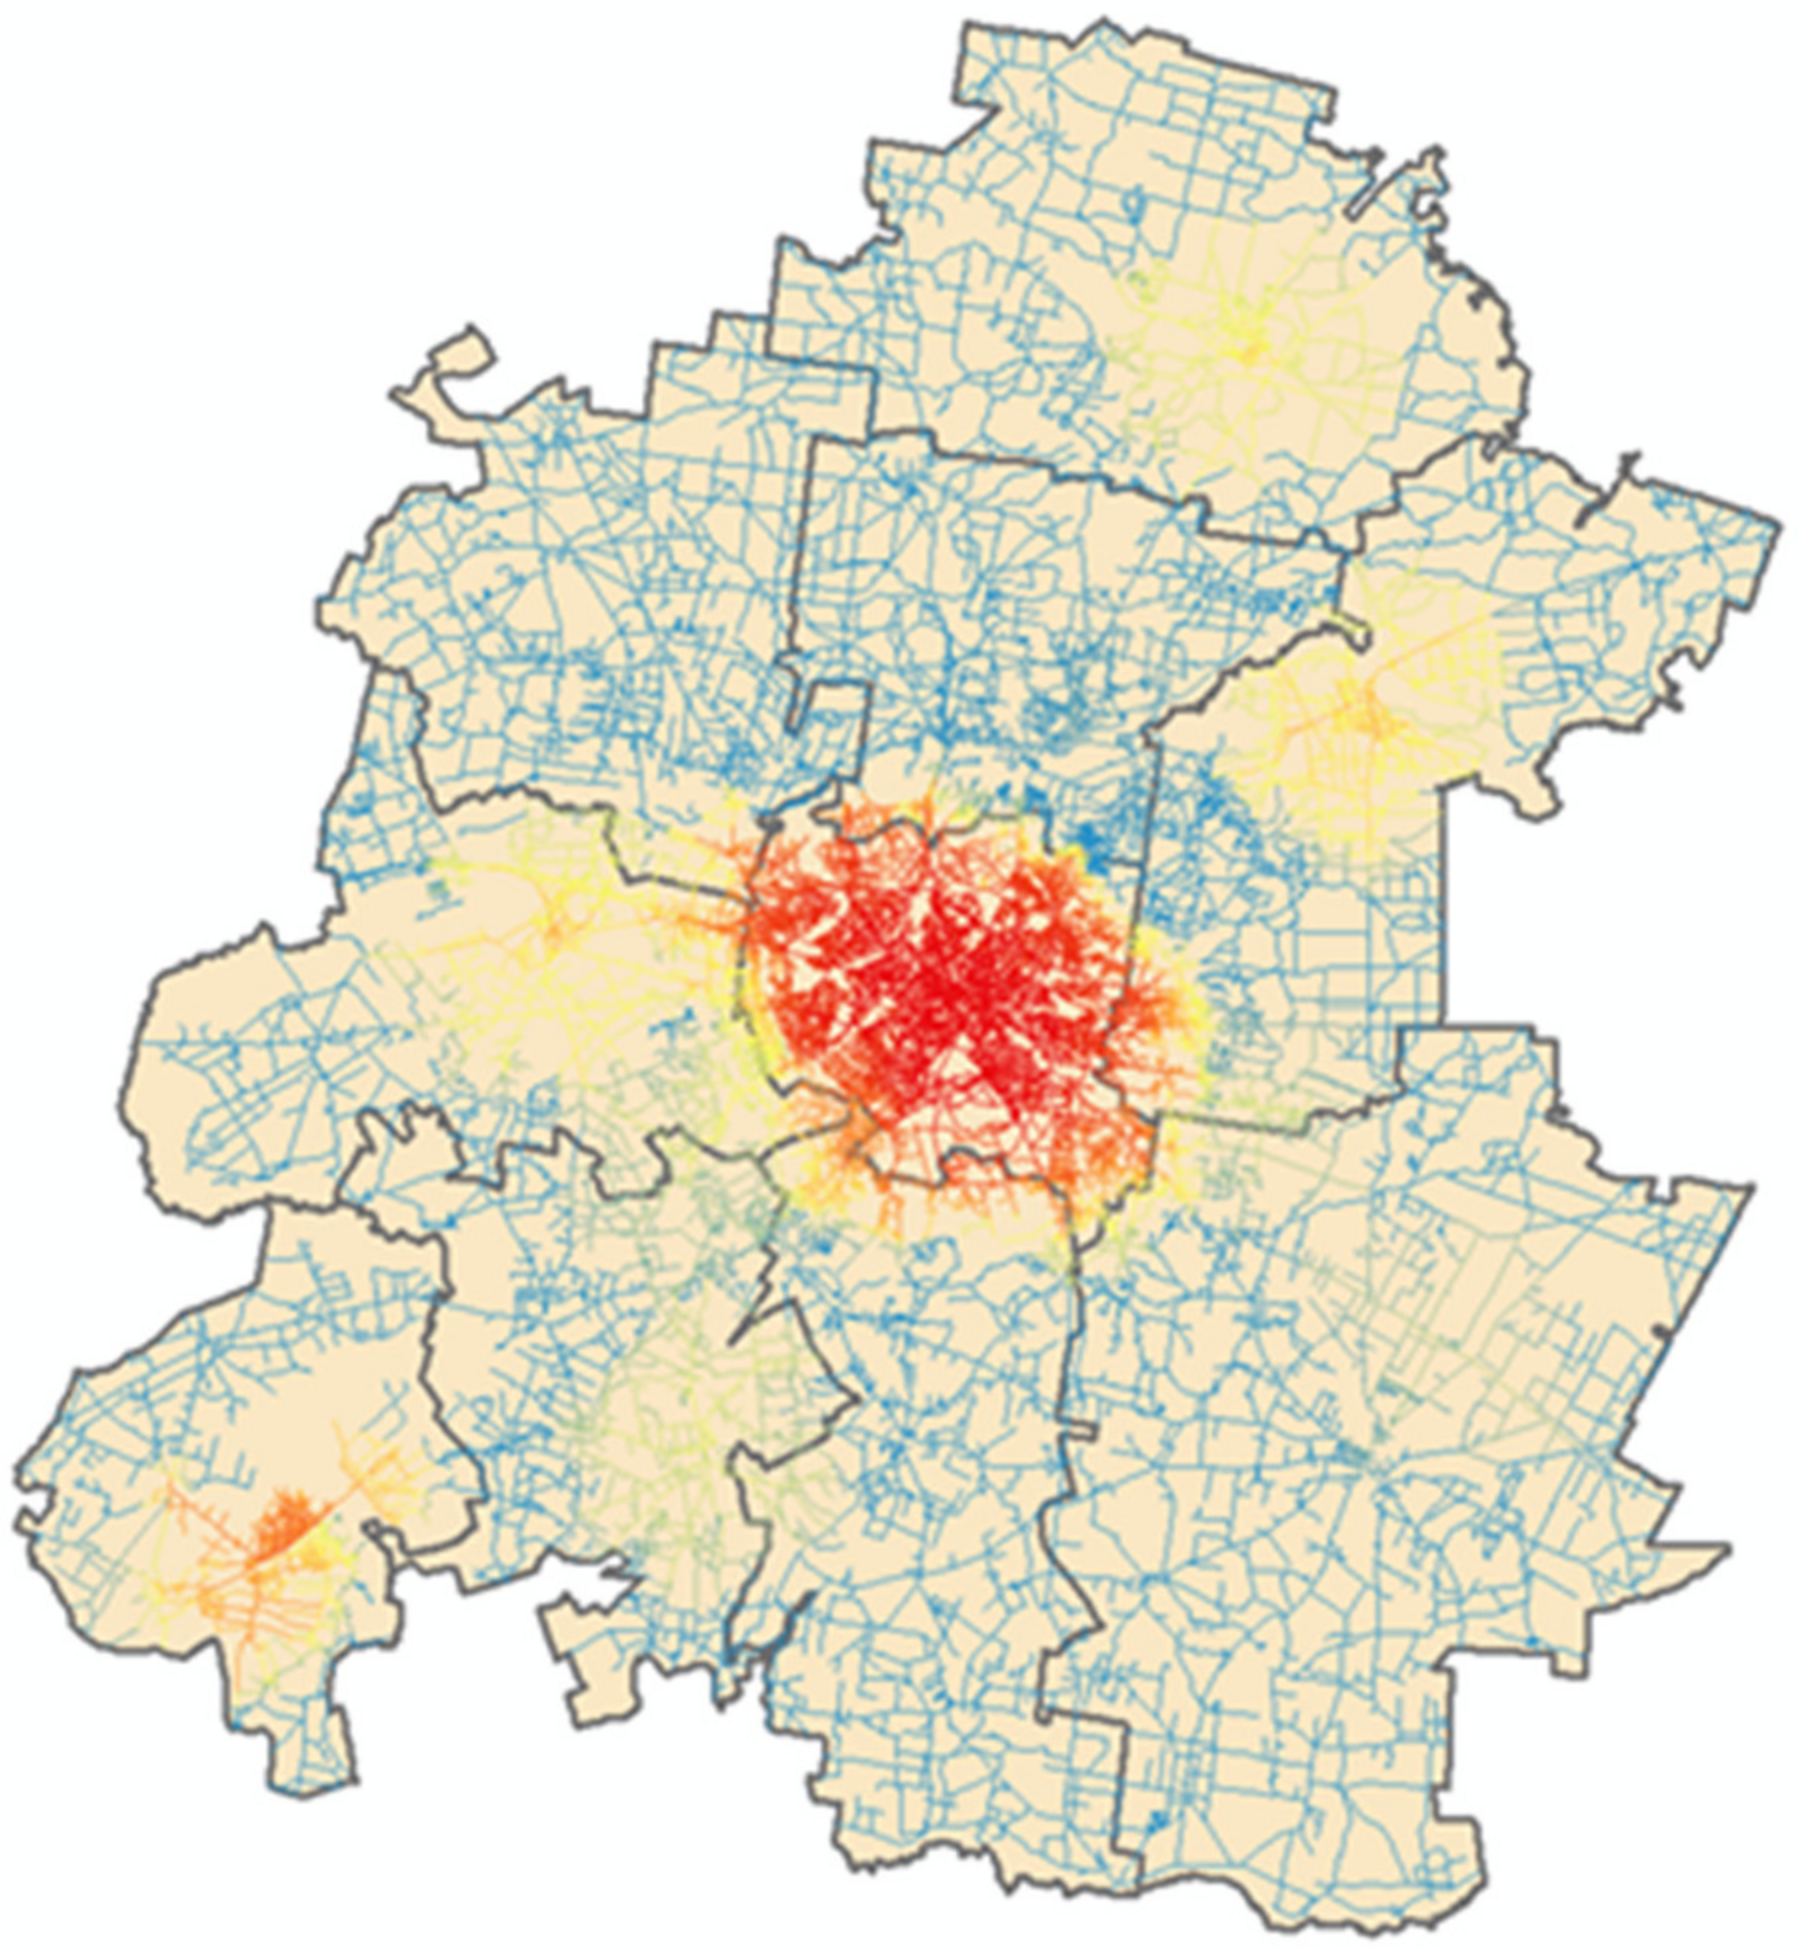
They differ (
Figure 8) quite significantly from work r5000 and reflect scattered locations of potentially recreational areas thus increasing the pervasiveness of some peripheral neighborhoods.
Education r5000 (
Figure 9) shows results that are not bad, as not all journeys are focused just on Bialystok, and it means that the network of educational objects is more evenly spread if compared to the allocation of working places.
According to some of Alexander’s patterns, and the World Bank report/study on walkability [
15], more contact between street and building creates a space that is more attractive from a street culture perspective, so it was interesting to see (
Figure 10) how, at r1000 level, these zones overlap with other trips: more overlap means more trips end up in an environment that catalyzes street culture.
We can see (in
Figure 11) that in five communities there are differences especially in accordance to spheres of leisure and education. Other ones and other communities and also all of the functional area generally show sustainability in connection dispersion.
Figure 11 represents the pervasiveness evaluation results. The correlations between gravity fields of different trips within radius 1000 m and radius 5000 m were calculated. A higher correlation means higher pervasiveness in Hillier’s terms or higher multi-functionality at both the local and regional level as well as a higher mix of various types of short and long journeys. A more “spiky” scatterplot represents a less sustainable and less pervasive neighborhood within the region.
4. Discussion and Conclusions
Shaping the city with attention to the multifunctionality of the structure and the self-sustainability of the individual units refers to the classical idea of the city, ensuring that most of the needs can be met within a walking radius. This is in line with the idea of New Urbanism [
16]. Following its assumptions should ensure less functional–spatial fluctuations and thus save the energy required for moving long distances. This also alludes to the idea of a sustainable economy. This type of solution referring to the classical urban structure was attempted by E. Plater-Zyberk and A. Duany in Seaside, Florida Kentlands, Maryland [
17].
Of course, the example of the Bialystok Functional Area under study is not such an ideal or experimental case. It is an object of research that aimed to find an answer to the question as to what extent, or if at all, it is possible to effectively optimize the functional–spatial structure in terms of energy savings.
Here, it was useful to apply the concept of “gravity fields” to the functional–spatial structure. A model of the structure was created, in accordance to Objective 1, referring to the space syntax approach of B. Hillier. However, in contrast to Hillier’s models, data stratified in terms of specific spheres of city life, relating to the basic daily needs of the inhabitants, were used. In the second step, the origins and targets of trips were identified.
According to Objective 2, the modeling of the operation of the structural system was performed.
The correlations between two types of trips in accordance to the identification of two different distances (Objective 3) gave us the possibility to understand synergies between different types of destinations.
The results showed that the greatest energy-saving potential should be attributed to peripheral areas: these have longer distances from the center and the worst accessibility of services and infrastructure. It seems that the broadest perspective for further research lies in the analysis of energy-saving potentials as a function of population density. Is the energy-saving potential of a reduction in over-population where the shorter journeys of a larger number of inhabitants (core zone) predominate or where the longer-distance journeys of a smaller number of inhabitants predominate?
The presented scatterplots could be used as a support tool for designing decision-making systems while identifying the weakest synergies which should be increased (e.g., by increasing building density or allocating new schools) or by identifying the local standard of the sustainable urban neighborhood form. As mentioned earlier, the scatterplots not only present synergy between these different zones of urban structure but also, at least indirectly, show the possible higher dispersion of energy usage.
The presented model could be employed not only for the analysis of energy usage but in essence could also be employed for the evaluation of the multifunctionality and sustainability of the urban form based on the concept of pervasiveness [
11]. The potential of the presented model is increased by the principles of New Urbanism, focused on the multi-functionality of neighborhoods, specialized districts, and urban corridors. In this case, the proposed methodology can help to evaluate not only the degree but effectiveness, based on synergy, of combinations of different functional objects. It should be pointed out that use of the Open Street Map (OSM) data on single objects allows us to perform analysis at various hierarchical levels of urban planning: informal neighborhood or street level, formal neighborhood or administrative unit or a city or region, the whole city or region, etc. The simulative nature of the employed model, as was mentioned earlier, gives a predictive power to the model, thus enabling us to use it in comparison with alternatives or even parametric urban planning. Depending on the exact needs of urban planning or the decision maker, the model could be presented in a traditional form of urban plans or as a type of sustainability compass, thus demonstrating its flexibility.
The further development of the presented model should be focused on the following tasks:
Validation and testing of the model in the other cities;
Validation of the model with the direct data on energy consumption where it is available;
Expansions of the list of the indicators of the model besides the one used, as more indicators can allow a more precise modeling of both energy consumption and multifunctionality.
The main challenges of the presented work, which have a direct influence on the possibilities of its application, could be related to the lack or scarcity of data and the modeling process. OSM still has some gaps as the street network is digitalized in different manners and at a different detail level for different cities. OSM as well could not be seen as a full and precise source of information on the allocation of various travel destinations—the precise data on each building would be needed from national agencies. Data on energy consumption, which would allow both more precise validation and further calibration or expansion of the model, could be found just for relatively small urban areas in the needed resolution. The modeling procedure requires special skills and is not very user friendly as it is based on a combination of various software tools, some of which require expensive licenses, thus making it not accessible for all municipalities or urban planning offices.


