Article

Monitoring and Effect Evaluation of an Ecological Restoration Project Using Multi-Source Remote Sensing: A Case Study of Wuliangsuhai Watershed in China

1
Key Laboratory of Precision Forestry, Beijing Forestry University, Beijing 100083, China
2
Key Laboratory of Forest Cultivation and Protection, Ministry of Education, Beijing Forestry University, Beijing 100083, China
3
The Third Construction Co., Ltd. of China Construction First Group, Beijing 100161, China
*
Author to whom correspondence should be addressed.
These authors contributed equally to this work.
Land 2023, 12(2), 349; https://doi.org/10.3390/land12020349
Submission received: 23 November 2022 / Revised: 19 January 2023 / Accepted: 20 January 2023 / Published: 28 January 2023

Abstract

:
Quantitative assessment of the effectiveness of ecological restoration provides timely feedback on restoration efforts, and helps to accurately understand the extent of restoration, while providing scientific support for optimizing restoration programs. In recent decades, the Wuliangsuhai watershed in China’s Inner Mongolia Autonomous Region has been affected by anthropogenic activities, resulting in an increasingly unbalanced ecological environment. In order to curb environmental degradation, the local government implemented the “mountain, water, forest, field, lake and grass ecological protection and restoration project of the Wuliangsuhai watershed” from 2018 to 2020. The project has been completed and there is an urgent need for remote sensing monitoring to aid in performance evaluation. We took the ecological protection and restoration area of the Wuliangsuhai watershed in China as the research object, applied multi-source remote sensing imagery and auxiliary data such as meteorology and geographic basic data, extracted information of each evaluation index before and after the implementation of this project, and used the entropy value method to determine the index weights to comprehensively evaluate the ecological restoration effect. The results showed that after the implementation of the ecological restoration project, the vegetation coverage was further improved, the effectiveness of desert management was obvious, soil and water conservation capacity was strengthened, the ecosystem became more stable, and the areas with good environment were mostly located in the central and eastern parts. A total of 37.86% of the areas had obvious ecological restoration effects, and all indicators were further improved. Among the main treatment areas, the restoration effect of the Wuliangsuhai water ecological restoration and biodiversity conservation area was the best. The restoration effect will be further accentuated over time. This study provides a scientific reference for the further management of the ecological environment in the watershed and can provide a reference for the evaluation of the ecological restoration effect in similar areas in the future.

1. Introduction

Extensive production and management activities by humans have had a significant effect on the plundering and destruction of nature. Moderate ecological restoration facilitates the return of the environment to a normal state. Ecological restoration work in China originated in the 1980s. So far, three batches of 25 ecological protection and restoration projects have been implemented, which have played an important role in comprehensively improving the quality of national and regional ecological security barriers and promoting the virtuous cycle and sustainable use of ecosystems [1,2,3]. Scientific, objective and accurate assessment of restoration project effects can provide timely feedback for ecological restoration work and also promote accurate understanding of restoration extent by project units, while making scientific adjustments to restoration plans, and also provide scientific and reasonable data support for ecological restoration process, restoration rhythm and improvement of technical methods [4,5].
Research on the indicators and methods of ecological evaluation has attracted widespread attention. The evaluation indexes have shifted from single ecological and environmental elements to the comprehensive evaluation of multiple elements [6], and many advances have been made in the establishment of evaluation models [7,8]. The existing evaluation methods are mainly divided into the following three categories: the first category is the ecological environment index (EI) [9] based on the Technical Specification for the Evaluation of Ecological Environment Conditions promulgated by the Ministry of Environmental Protection of China, the second category is the remote sensing ecological index [5], and the third category is other models such as comprehensive evaluation models [10] and value assessment models [3]. Traditional evaluation methods mostly used hierarchical analysis, which had a certain degree of universality, but for some more specialized areas could not be adapted to the ecological evaluation of the local conditions. Therefore, many scholars have adopted the evaluation method that combines hierarchical analysis with factor analysis [11] and the entropy method [12], which eliminated the subjectivity and arbitrariness of hierarchical analysis. In addition, other evaluation methods such as principal component analysis (PCA) [5], analytic network process (ANP) [13], and the combinatorial weighting method [14] have been applied in ecological evaluation.
Satellite and remote sensing techniques have been widely used in studies related to forest [15,16,17], grassland [1,18], urban [19,20], and river ecological evaluation [21,22] with their advantages of large area, real-time, rapid, and periodic repetitive observations. Scholars have constructed comprehensive evaluation models based on multi-source remote sensing data mainly using standard scoring systems and hierarchical analysis to carry out studies on land use planning [23,24,25], comprehensive evaluation of ecological and environmental quality [9,26,27], and ecological suitability evaluation [28,29,30]. However, studies on the evaluation of large-scale ecological restoration projects in China have not been carried out in depth. Although the assessment of ecological restoration effects is receiving increasing attention, scholars have conducted relevant studies on ecological conservation and restoration in ecologically fragile areas such as soil erosion and mines [31,32]. However, an accepted and systematic assessment method and system has not been formed. The evaluation index system is not yet perfect, the accessibility of data needs to be further strengthened, and a quantitative assessment model for the ecological restoration effects has not yet been established [33]. How to use remote sensing technology to build a multi-factor comprehensive evaluation index system and quantitative evaluation model to scientifically, accurately and timely evaluate the ecological protection and restoration effect is still one of the hot spots and difficulties faced by the theoretical and applied discipline fields of ecological protection and restoration.
The Wuliangsuhai watershed in Inner Mongolia Autonomous Region is one of the eight major freshwater lakes in China and the largest functional wetland in the Yellow River Basin, undertaking important functions such as regulating the volume of water in the Yellow River, protecting biodiversity and improving the regional climate. Rapid socioeconomic development has taken place in recent years, maintaining the virtuous cycle of the watershed ecosystem faces serious challenges. Water environment problems, soil sanding and salinization, mine over-exploitation and grassland degradation are the three major ecological problems facing the basin [34,35]. In view of the above, the local government started to implement the “mountain, water, forest, field, lake and grass ecological protection and restoration project of the Wuliangsuhai watershed” in 2018, which is divided into such treatment areas as the Wuliangsuhai ecological protection zone, Wuliangsuhai water ecological restoration and biodiversity protection zone, Alaben grassland soil and water conservation and Vegetation restoration zone, Wulashan water conservation and geological environment comprehensive treatment zone, Ulanbu and desert comprehensive treatment zone, and Hetao irrigation area water system ecological protection network. The project was fully completed in 2020. Some of the media have reported that the project has been effective, but scientific confirmation is still pending. At the same time, it is unknown which indicators can be used to construct an effect evaluation model and are more sensitive. Therefore, it is important to establish an ecological restoration effect evaluation model and scientifically assess the effect of the project as soon as possible, in order to monitor the regional environmental changes and timely correction of post-restoration management measures, as well as to provide a reference for the evaluation of ecological restoration projects in other regions.
The goal of our research is to complete monitoring to aid in performance evaluation of ecological protection and restoration projects in mountains, forests, fields, lakes and grasses with the help of remote sensing technology. The ecological restoration project of the Wuliangsuhai watershed was taken as the object. Firstly, a comprehensive evaluation index system of ecological restoration was constructed. Then multi-source remote sensing images and auxiliary data such as meteorological and geographic basic information were applied to extract the information of vegetation, soil, water and soil, and meteorology before and after the project. Finally, the restoration project effect evaluation model was established, and the implementation effect of the project was comprehensively evaluated to achieve quantitative and positioning evaluation. This study could provide an important reference for theoretical research and practical application of ecological restoration performance evaluation.

2. Materials and Methods
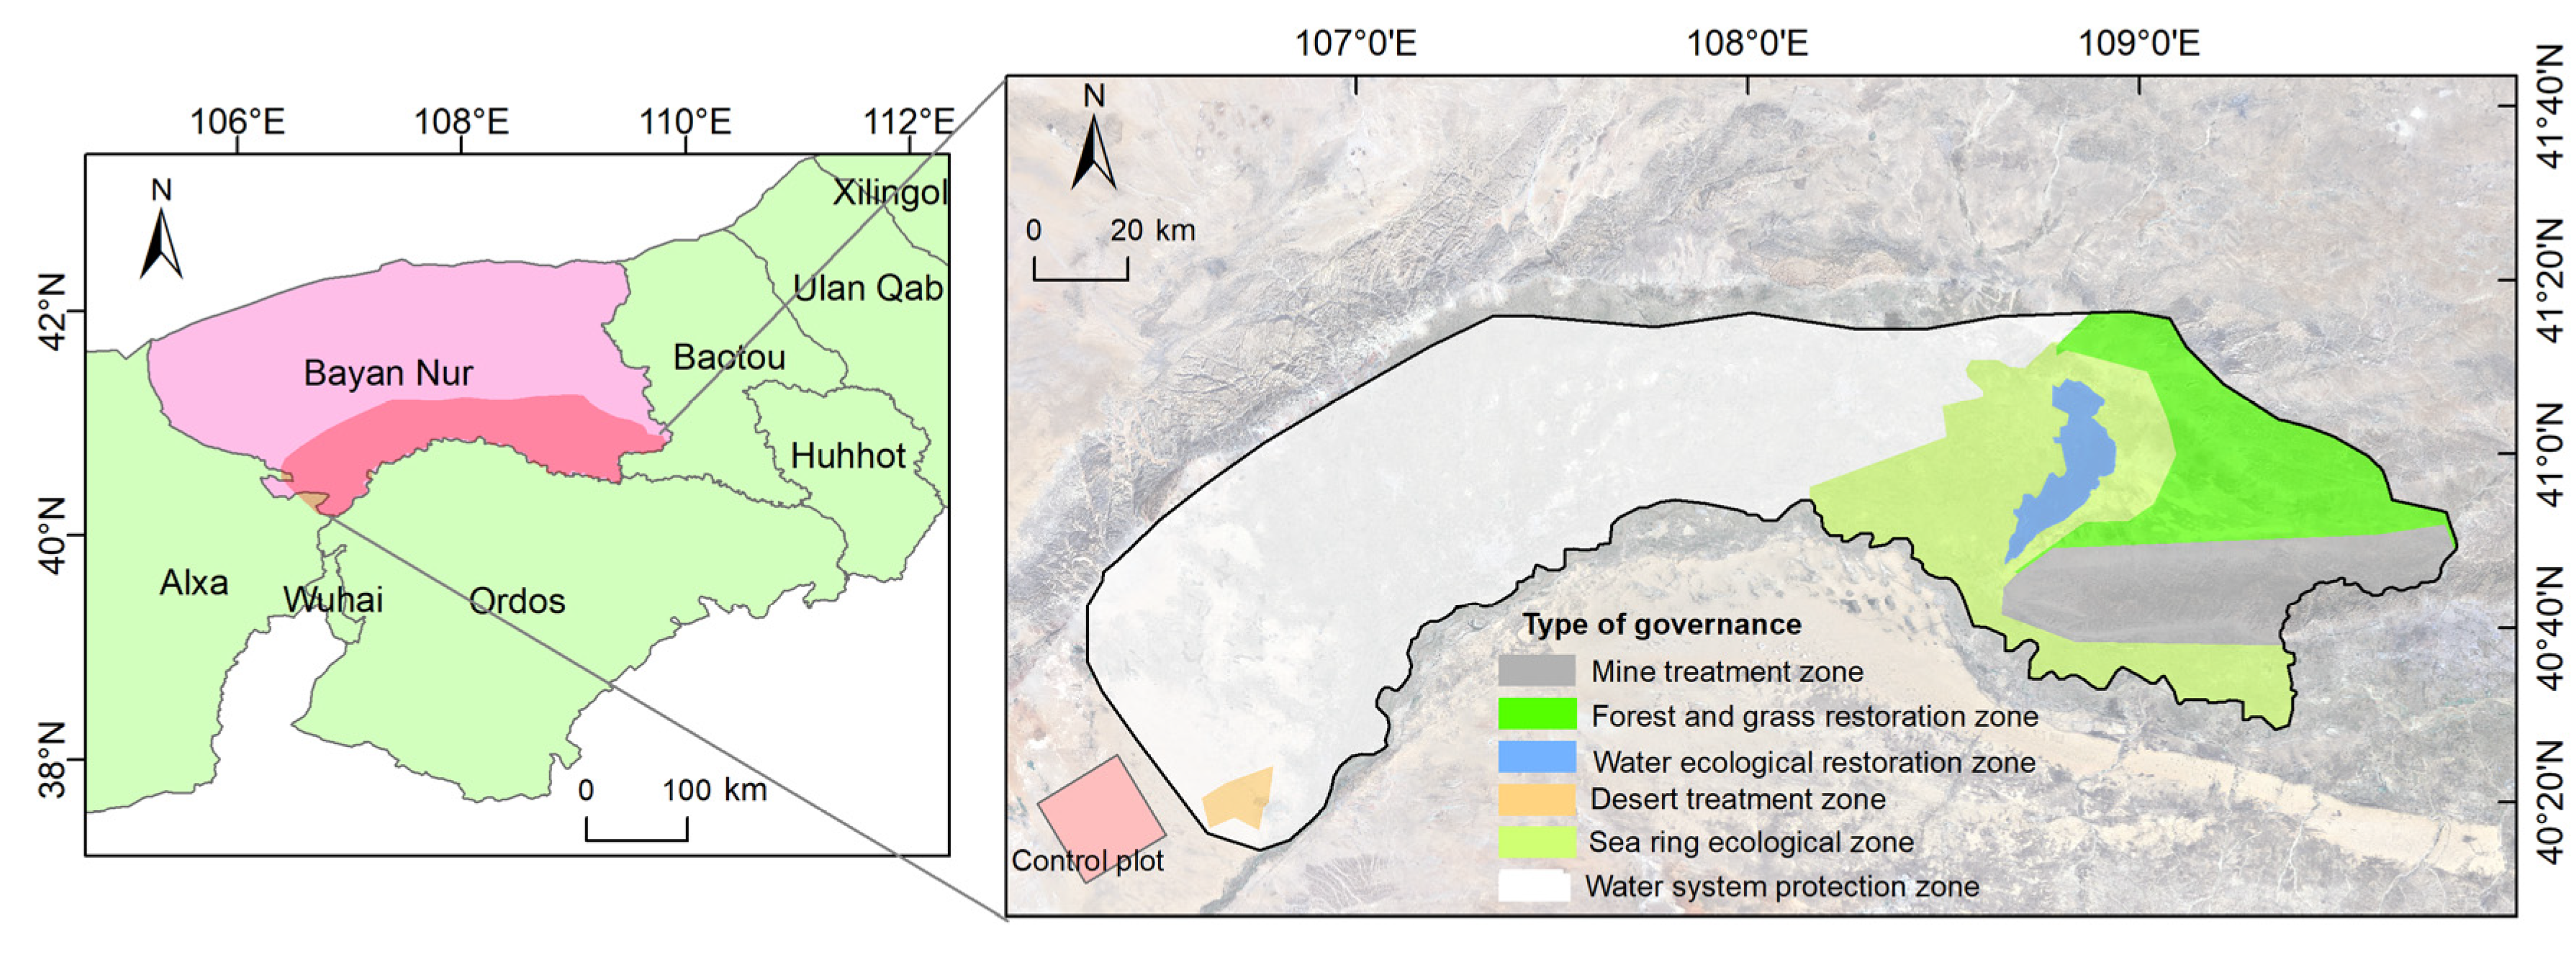
2.1. Study Area

Our study area is located in the Wuliangsuhai watershed within Bayannur City, Inner Mongolia Autonomous Region, with the geographic coordinates of Latitude 40°17′16.46″–41°20′22.92″ N, Longitude 106°59′05.51″–109°28′23.76″ E, including the river-loop irrigation area, the Wuliangsuhai area, the areas south of Yin Mountain in the front, the middle and back banners of Ulat and Dengkou county. The total area is about 1.62 × 10⁴ km2 [36]. The elevation of the Wuliangsuhai basin ranges from 1004 m to 2293 m, with an average elevation of 1643 m, and the terrain is very undulating. The semi-dry and humid mid-temperate monsoon climate, with long winters and short summers, four distinct seasons, long sunshine hours, large temperature differences between day and night, long cold periods, short frost-free periods, low precipitation, high evaporation, rain and heat at the same time, and frequent catastrophic weather, exacerbate the fragility of the ecological environment in the Wuliangsuhai watershed. The local government implemented the watershed landscape, forest, field, lake and grass restoration project from 2018 to 2020, divided six main treatment areas, and carried out the construction of comprehensive desert treatment, comprehensive mining geological environment improvement, soil and water conservation and vegetation restoration, river and lake connectivity and biodiversity protection, farmland surface source and urban point source pollution treatment, and water environmental protection and restoration of the Wuliangsuhai lake body (Figure 1). The total investment of the project was $755 million.

2.2. Data and Preprocessing

Landsat imagery, MOD11A2, MOD13Q1, MOD17A2H, Sentinel-1A and Meteorological dataset located in Wuliangsuhai watershed for 2017 and 2021 were all employed in our research.

2.2.1. Landsat Imagery

Landsat 8 imagery was obtained from the official website of USGS (http://glovis.usgs.gov/ (accessed on 15 January 2022)), the cloudiness were all below 5%, and the quality of imagery is good (Table 1). With the support of ENVI 5.3, the images were pre-processed with atmospheric correction and image mosaic, and used to obtain information on land type, vegetation coverage (VFC), desertification grade, Shannon’s diversity index (SHDI), and landscape fragmentation before and after the implementation of the ecological restoration project.

2.2.2. MODIS Imagery

MOD11A2, MOD13Q1 and MOD17A2H for 2017 and 2021 were acquired from NASA (https://ladsweb.modaps.eosdis.nasa.gov/ (accessed on 15 January 2022)), with 92 views for each type. The annual NPP and temperature raster products were extracted by projection conversion, band synthesis, band math, and resampling of these images using ENVI 5.3, all with a spatial resolution of thirty meters.

2.2.3. Sentinel-1A Imagery

Sentinel-1A imagery (IW mode single-view complex image, VV polarization, orbit number 84) located in the Wuliangsuhai watershed in December 2017 and December 2021 were selected from ESA and used to obtain topographic information. SRTM products were obtained from the Geospatial Data Cloud website (http://www.gscloud.cn (accessed on 15 January 2022)) with a spatial resolution of 30m, and was used to remove terrain phases and perform phase deconvolution. With the support of ENVI 5.3 and ArcGIS 10.5, Sentinel-1A was aligned, interferogram generated, phase de-entangled and phase elevation converted to obtain the inverse topography, and then two phases (2017 and 2021) of slope raster products were obtained, both with a spatial resolution of thirty meters.

2.3. Research Method

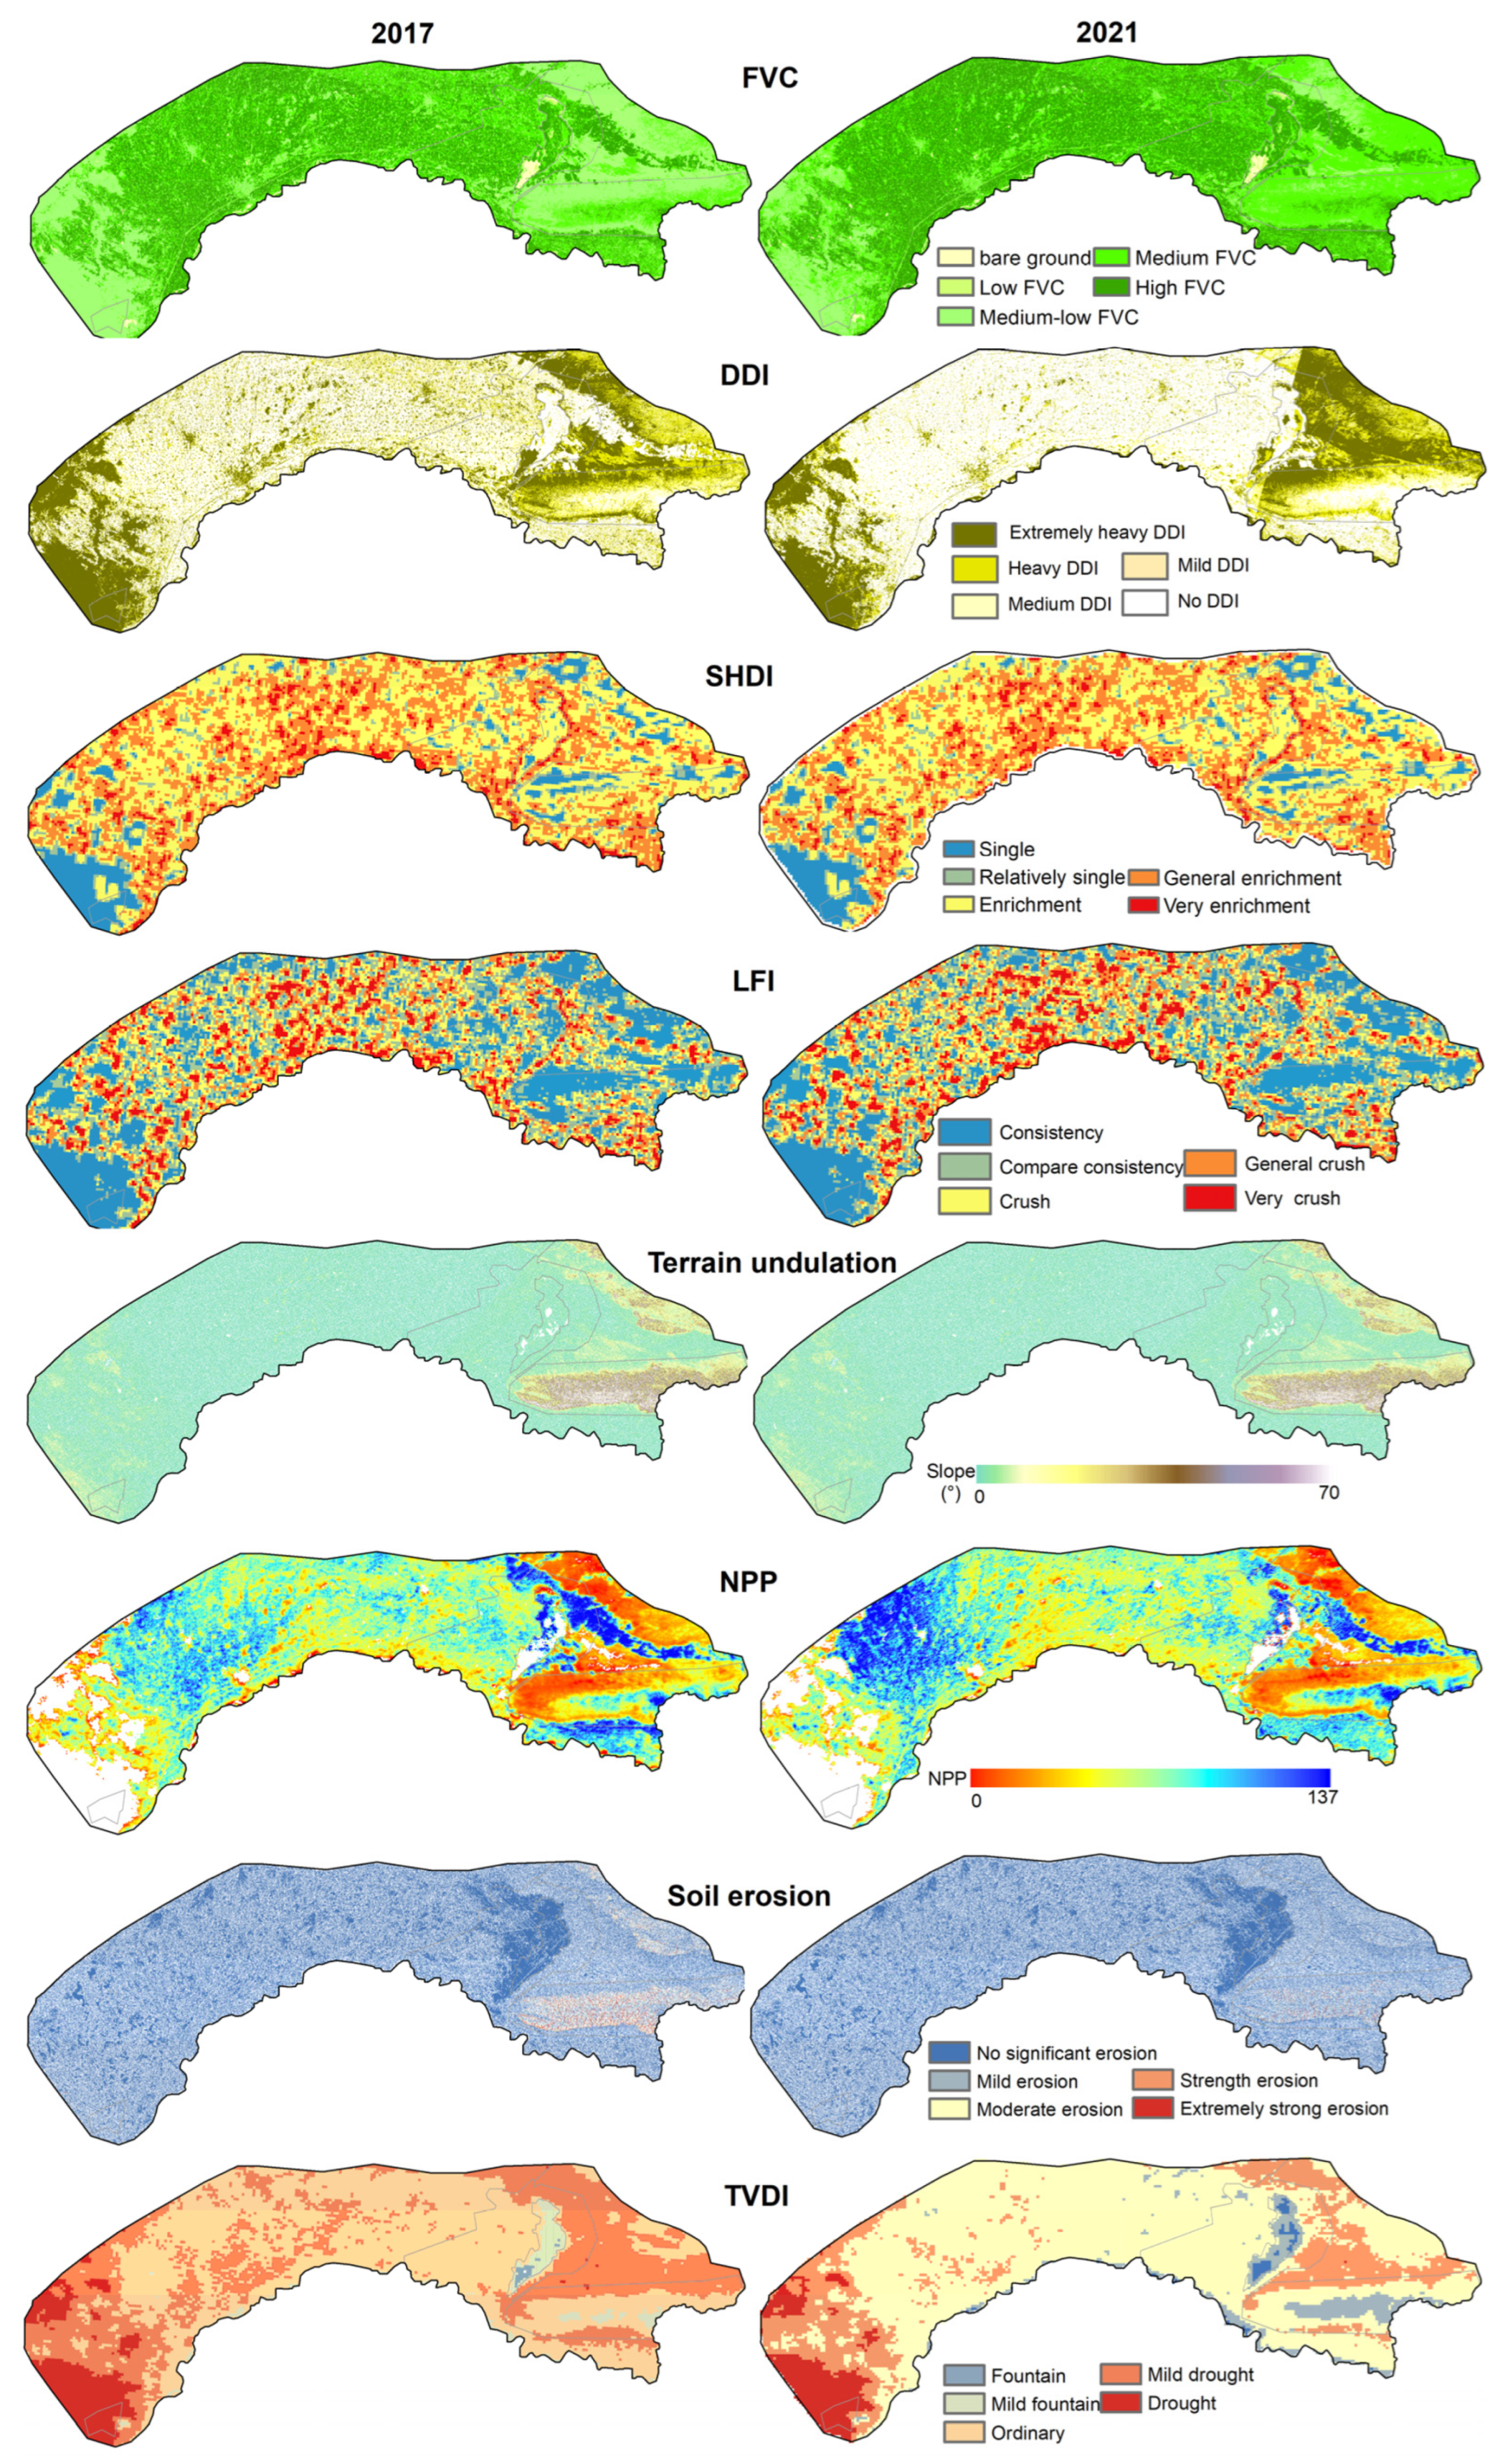
2.3.1. Index System of Restoration Effect Evaluation

We referred to the “Guidelines for Ecological Protection and Restoration Projects in Mountain, Water, Forest, Field, Lake, and Grass issued by the Ministry of Natural Resources of China” [37], and selected ten indicators (Table 2) to construct the restoration effect assessment index system by combining the actual project situation and data accessibility.
A total of two raster products were produced for each indicator using the dataset and calculations in Table 2. The coordinate system of the above raster products was CGCS2000, the format was “.tif”, and the spatial resolution was 30 m (Figure 2).

2.3.2. Calculation of Indicator Weights

The entropy method was used to determine the weight of each indicator by its information entropy. The specific calculation steps are as follows.
(1) Normalization process. The individual indicator raster products in Section 2.3.1 were normalized to eliminate the effect of the magnitude. Among them, positive indicators were calculated according to Equation (7) and negative indicators were calculated according to Equation (8).
t i j = x i j min x 1 j x n j max x 1 j x n j min x 1 j x n j ( i = 1 , 2 n , j = 1 , 2 m )
t i j = max x 1 j x n j x i j max x 1 j x n j min x 1 j x n j ( i = 1 , 2 n , j = 1 , 2 m )
where, tij is the value of the ith sample point under the jth indicator after normalization, xij is the value of the ith sample point under the jth indicator before normalization, min x 1 j x n j and max x 1 j x n j are the minimum and maximum values of all sample points under the jth indicator before normalization, respectively before normalization.
(2) Information entropy. The contribution of the ith sample point under the jth indicator is calculated based on Equation (9).
p i j = t i j i = 1 n t i j
where, pij is the contribution of the ith sample point under the jth indicator.
The information entropy value of the jth indicator was calculated based on Equation (10).
e j = k i = 1 n p i j ln ( p i j )
where, k > 0, ln is the natural logarithm, ej ≥ 0. The constant (k) is related to the number of sample points (n). Generally, let the constant k = 1/ln(n), then 0 ≤ ej ≤ 1.
(3) Information entropy redundancy (coefficient of variation). The information entropy redundancy of the jth indicator was calculated based on Equation (11).
d j = 1 e j
where, dj is the coefficient of variation of the jth indicator.
(4) Weighting of indicators. The weight of the jth indicator is calculated based on Equation (12).
w j = d j j = 1 m d j
where, wj denotes the weight of the jth indicator.
After calculating the indicator weights for each year using data from 2017 and 2021, we found that the indicator weights for the two years differed less, indicating that the indicator system and weights could be used for ecological restoration assessment. Therefore, we used the indicator weights for 2021 as the indicator weights for both years (Table 2).

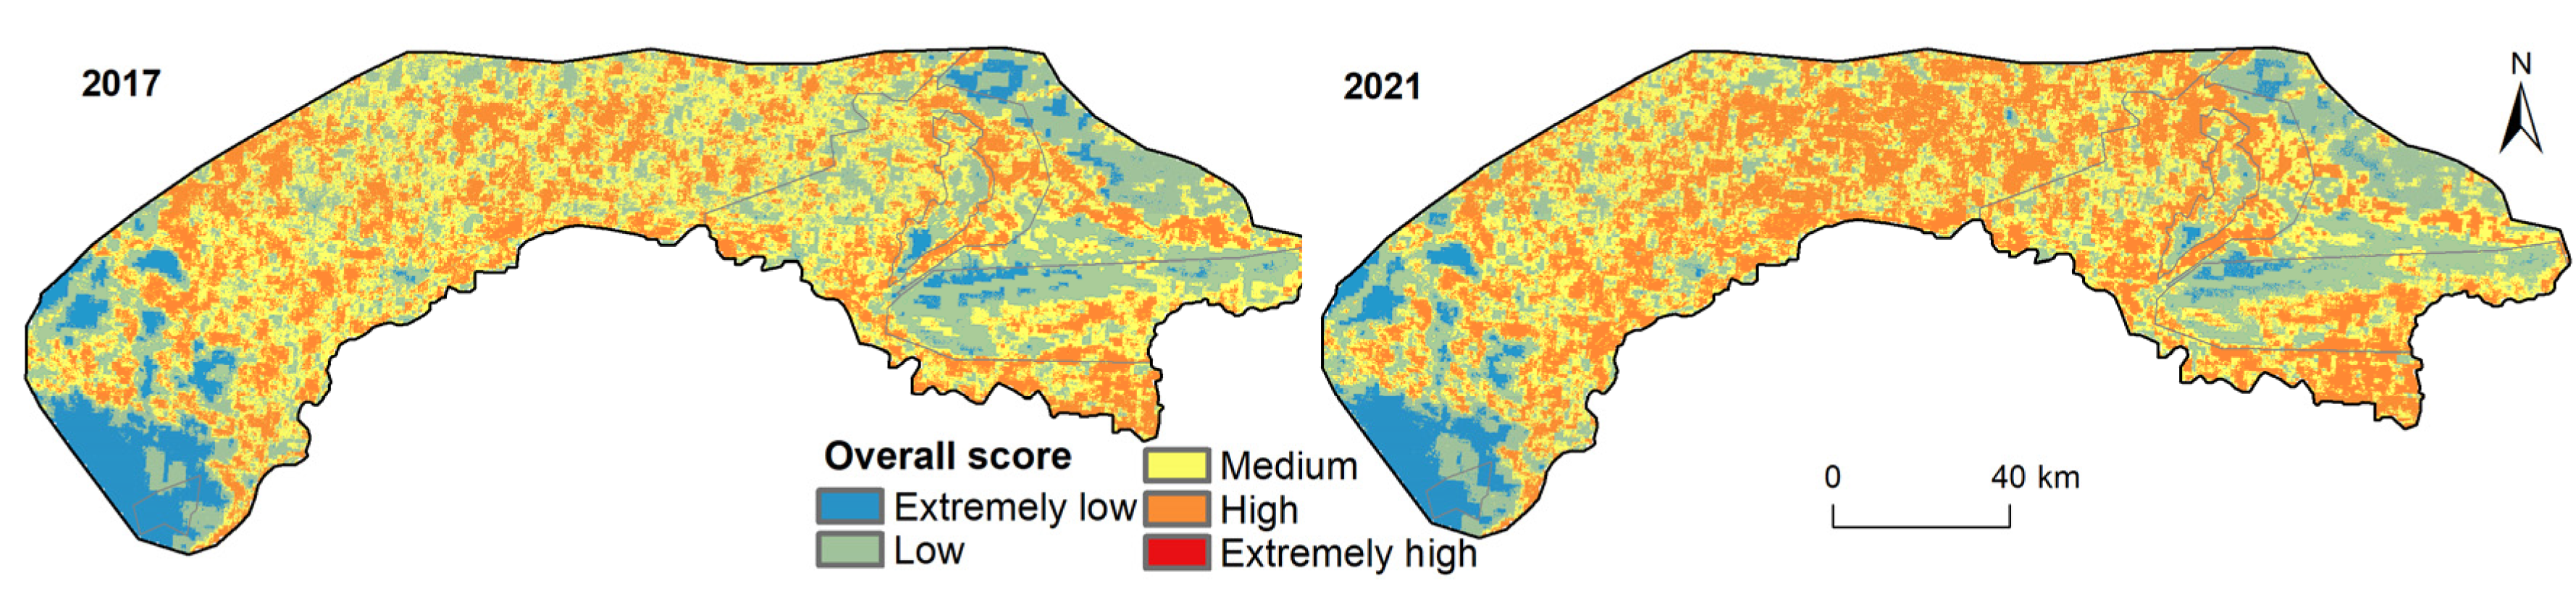
2.3.3. Integrated Assessment of Ecological Status

Based on the integrated assessment model (Equation (13)), the ecological status in 2017 and 2021 were assigned with the help of the wave calculation tool of ENVI 5.3 software.
Q i = j = 1 m w j × t i j
where, Qi is the composite score of the ith sample point.
The ecological status score was divided into five levels (Table 3) according to the natural interruption point grading method [12], and a comprehensive ecological status rating was obtained for each year (Figure 3).

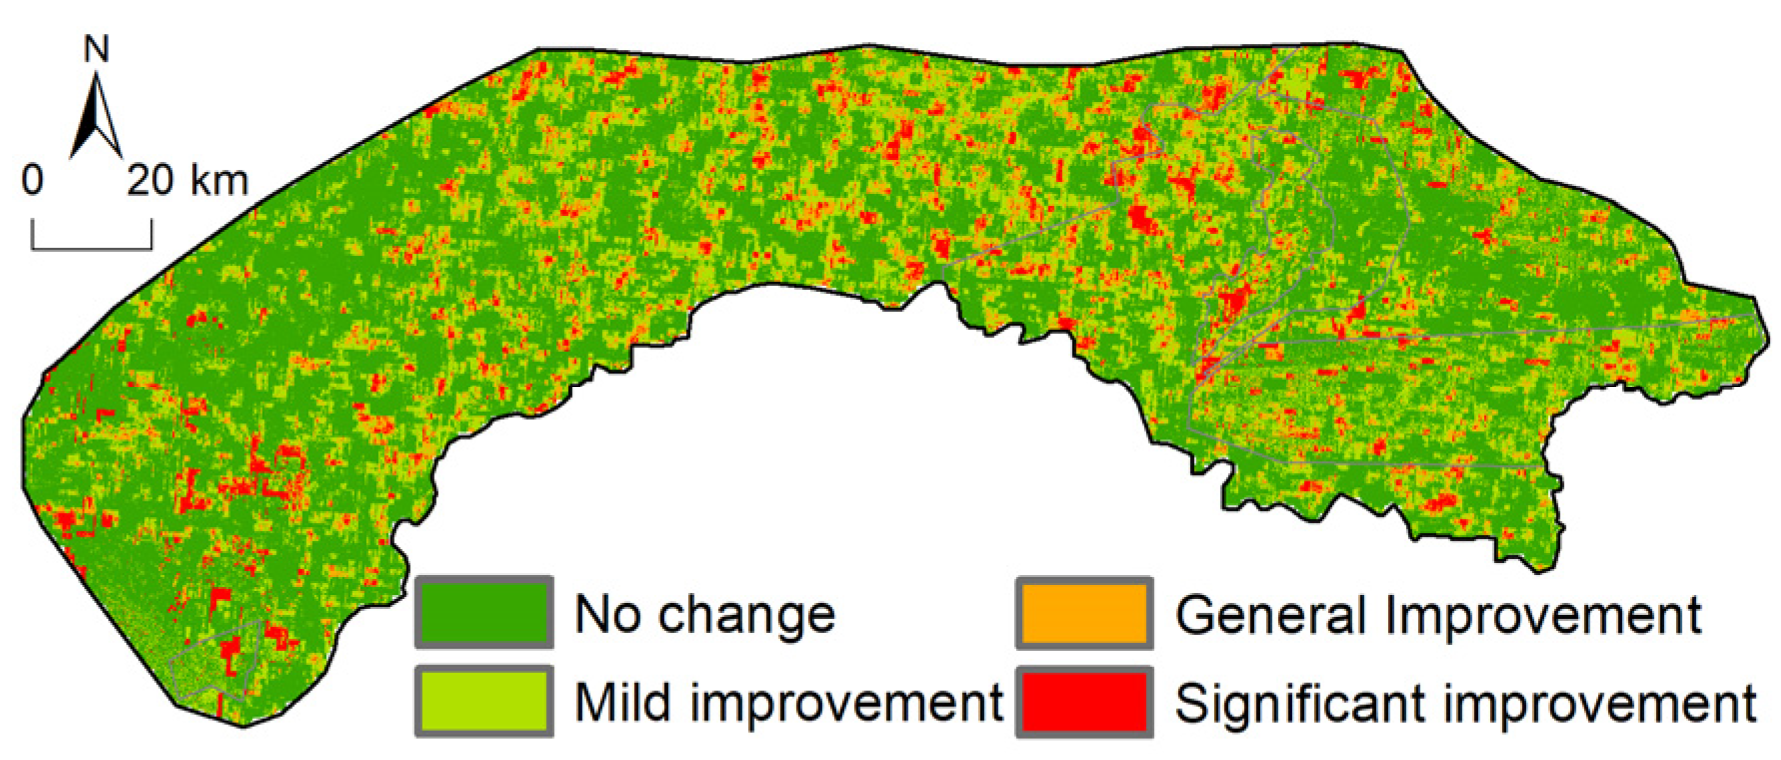
2.3.4. Evaluation of the Effect on Environmental Restoration

We used the ecological restoration rate to indicate the restoration effect. The ecological restoration rate was calculated using a time series comparison model (Equation (14)) based on the two-year composite ecological condition score in Section 2.3.4.
P i g = Q i g Q i f * 100 % / Q i f
where, Qif is the ecological restoration rate of the ith sample point in the f year after ecological restoration, Qig is the composite score of the ith sample point in the g year before restoration, and Pig is the composite score of the ith sample point in the g year after restoration.
Combined with the actual situation of the Wuliangsuhai watershed, the restoration effect was graded according to the restoration rate size (Table 4), and the comprehensive evaluation results of ecological restoration effects were output (Figure 4, Table 5).

2.3.5. Control Experiment

In order to distinguish the effect of natural evolution, a control area with an area of 400 km2 was selected in conjunction with field surveys in a remote and virtually untouched area adjacent to the study area (Figure 1). The steps in Section 2.3.2, Section 2.3.3 and Section 2.3.4 were repeated in the control area to obtain the results of the comprehensive ecological change evaluation (Figure 5) for comparative analysis.

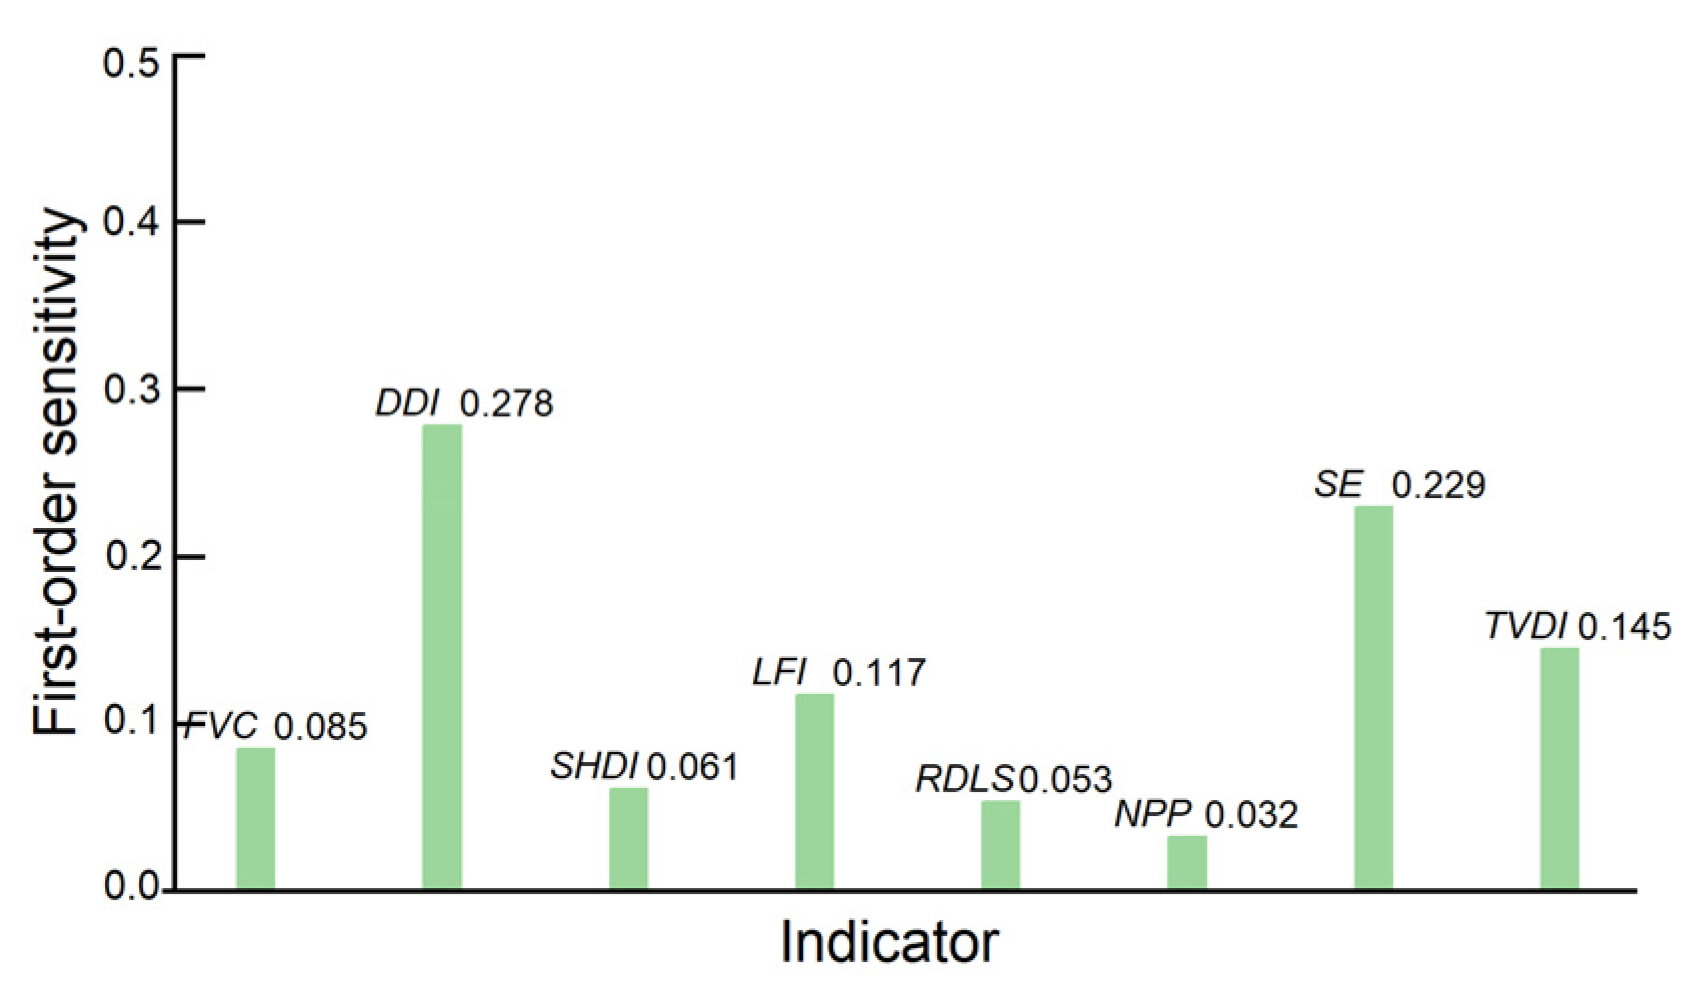
2.3.6. Sensitivity Analysis

To verify the stability of the effect evaluation model, we performed a sensitivity analysis with the aid of MATLAB software using the Sobol method [38], with the underlying data coming from the normalized raster product in Section 2.3.2.
For the function Y = f(x), the independent variable is the vector x = (x1, x2,…,xn), where n is the number of independent variables. The total variance of the equation Y = f(x) was obtained by using the function "sobolset" to perform Sobol sampling with 2400 samples, and then decomposing it into several subvariances to obtain Equation (15).
D ( Y ) = i D i + i < j D i j + i < j < k D i j k + + D 12 n
where, Di denotes the variance of the Y value generated by the ith independent variable xi, Dij denotes the variance of the Y value generated by the joint action of the ith and jth independent variables, and D12…n denotes the variance of the Y value generated by the joint action of the used independent variables.
The normalized expression Equation (16) was obtained by dividing Equation (15) left and right by D(Y) simultaneously.
1 = i D i D ( Y ) + i < j D i j D ( Y ) + i < j < k D i j k D ( Y ) + + D 12 n D ( Y )
We used the first-order sensitivity (S1) as a sensitivity indicator and calculated S1 for each indicator with the help of Formula (17) (Figure 6).
S i = D i D ( Y )

3. Results

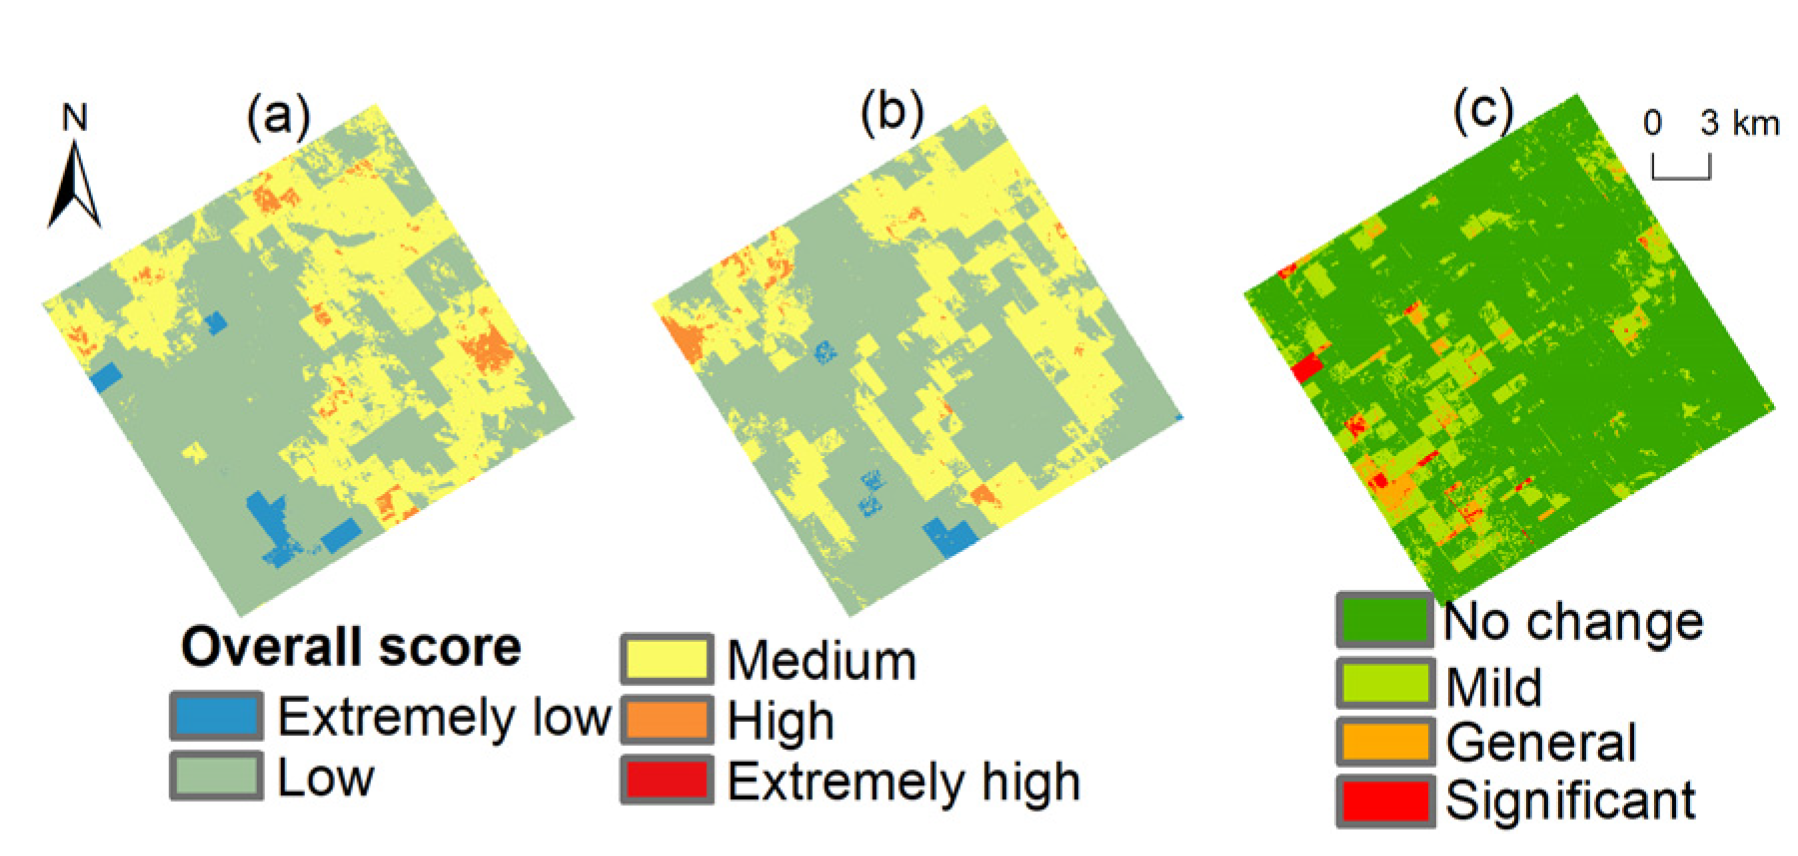
3.1. Dynamic Changes of the Ecological Status

The results of each indicator for 2017 and 2021 were obtained using multi-source remote sensing data (Figure 2), which in turn led to a composite score graph for each year (Figure 3).
The overall vegetation coverage of the Wuliangsuhai watershed was high, among which the proportion of bare land and low cover was less than 1%. 2017 average coverage was 0.71, and the proportion of medium–low coverage and high coverage was more than 30%. The average coverage in 2021 was 0.77, and the proportion of medium coverage and high coverage was more than 30%. The change of vegetation coverage status after restoration was more significant, but the change of each coverage degree was different, and the proportion of bare land and low coverage degree both decreased, among which the area of low coverage degree decreased significantly, and the area of medium and high coverage degree increased significantly.
The occurrence of desertification in the basin was relatively common. The percentage of desertified areas in 2017 was 72.52%, and the moderate and mild occurrence areas were relatively more. The percentage of desertification area decreased to 52.03% in 2021, and the moderate desertification area accounted for the largest percentage. After the restoration, the overall desertification degree had been greatly reduced, and the proportion of each degree of desertification had decreased, and the proportion of extremely severe, moderate and mild degree had decreased more, among which the proportion of mild degree had decreased by 10.52 percentage points. The effectiveness of desertification control was remarkable.
Each landscape component in the watershed was distributed in a balanced trend, and the two sides were slightly lower than the central part, and the landscape components were richer, with rich and generally rich areas accounting for more than 80% in total. After restoration, the richness decreased slightly, and the proportion of each grade of landscape richness did not change. The degree of landscape fragmentation was distributed differently, with the middle high and the two sides low. The fragmentation degree decreased slightly with time after restoration, and the proportion of fragmented areas decreased by one percentage point. Overall, the spatial heterogeneity was weakened after restoration, and the uncertain information content was smaller, and the ecosystem stability tended to be significant.
The terrain in the central and western parts of the watershed was relatively gentle, while the terrain on the eastern side was relatively steep. During the ecological restoration process, only limited land preparation was carried out during the vegetation restoration and mine treatment to maintain the original natural topography as much as possible, and the topographic relief was only reduced by 0.01 meter after restoration. Human activities played a limited role in terrain remodeling.
NPP increased by 11.70 g/(m2·a) on average after watershed restoration, with an increase in the east and a decrease in the west, mainly influenced by whether restoration measures were taken or not. Generally, the distribution of vegetation NPP had obvious regional differences, among which the western, northeastern and some eastern areas were relatively low, and only in the central and western parts and the western edge of the Wuliangsuhai was the vegetation NPP higher. The vegetation coverage in the areas with low values of NPP was also low. Within the watershed, soil erosion was not serious in most areas. The percentage of areas without significant erosion reached 96.50% in 2017 and increased to 98.92% in 2021, and the percentage of eroded areas showed a decreasing trend after restoration, and soil erosion was further reduced.
The overall arid and semi-arid climatic characteristics of the Wuliangsuhai watershed were more significant. The proportion of drought areas of all grades decreased after restoration, and the proportion of mild drought areas decreased by 6.01 percentage points. The proportion of humid areas slightly increased, and the proportion of slightly humid areas increased by 2.22 percentage points. The degree of drought showed a decreasing trend but was still relatively dry.
The results (Table 3, Figure 3) of the comprehensive ecological condition assessment showed that the percentage of areas with a high rating in ecological condition reached 74.46% in 2017 and rose to 77.48% in 2021. The area of areas with very low, low, and medium ratings after restoration decreased, with the proportion decreasing by 1.04, 1.98, and 2.03 percentage points, respectively, and the area of areas with high and very high assessments showed an increasing trend, with the proportion of areas with high assessments increasing by 4.87 percentage points. The overall ecological condition showed an improving trend, with high zoning mostly distributed in the central and eastern regions.

3.2. Effect of Ecological Restoration

The ecological restoration effect of the Wuliangsuhai watershed was graded according to the size of the restoration rate (Table 4), and the graph of the comprehensive assessment results of the restoration effect was obtained (Figure 4).
The overall ecological condition of the Wuliangsuhai watershed was good. The ecological restoration effect was not very obvious. A total of 37.86% of the areas had better ecological restoration effects, among which the highest percentage of slightly improved areas was 26.13% and the lowest percentage of significantly improved areas was only 3.90%.
The restoration effects varied among the six main treatment areas (Table 5). Specifically, through the control of pollutant discharges from agriculture and animal husbandry, towns and villages around the waters of the Wuliangsuhai, as well as treatment, the discharge of pollutants was reduced and the virtuous cycle of the ecological belt around the sea was protected, with 42% of the areas having good ecological restoration effects, and 4%, 9% and 29% of the areas having significant improvement, improvement and mild improvement, respectively. Combined with the Wuliangsuhai ecological protection zone to create a watershed ecological protection network, the water ecological restoration was carried out to further improve the water quality of the Wuliangsuhai and protect biodiversity and the Yellow River water ecological security, the overall restoration effect was better, as 50% of the regional ecological environment had improved. In response to the problems of accelerated degradation and even sanding of the Alaben grassland and soil erosion, soil and water conservation and vegetation restoration projects had been carried out in various areas of the Alaben grassland and soil erosion, combining natural restoration with artificial restoration, taking measures such as sowing grass seeds, fencing and sealing, and prohibiting grazing to reduce the amount of sediment eroded and to prevent wind and sand fixation. The overall ecological restoration effect in the area was general, and an ecological environment of only 416 km2 had been improved. There were problems such as outstanding environmental problems, degradation of forest and grass vegetation and serious soil erosion in the Wula mountain. The mine treatment and greening project in the Wula mountain had been carried out, which helped improve its geological and geomorphological environment, enhance the water connotation function, reduce soil erosion and play the role of its ecological barrier service, and the restoration effect in the treatment area was more significant, with 39% of the area having an improved ecological environment. In view of the fragile ecosystem in the sandy area, we had taken measures to restore the forest and grass vegetation in the Ulanbu desert, and implemented water and soil conservation measures such as grass square grid sand barriers to fix sand and prevent the desert from moving eastward, and the effect of restoration measures had been very obvious in some areas, and 14% of the regional ecological environment had been significantly improved. In response to the problems of agricultural surface source pollution and increased salinization of arable soil in the river−loop irrigation area, measures were taken to drain the ditch sludge dredging to curb the increasing trend of pollutants entering the lake, while agricultural field drug control and saline land management were carried out. The ecological protection area of the water system in the irrigation area was repaired with good effect, and the ecological condition in some areas was significantly improved.
Figure 5 revealed that the unrestored control area was affected by natural evolution. The control area is relatively remote, has less runoff, and has more unfavorable meteorological conditions, and the ecological environment was general. Relative to 2017, only a few regions improved in 2021, the ecological environment in most regions remained largely unchanged, and some regions were worse. Comparing the analysis of restored areas and control areas, it was more common for the ecological environment to turn better after the occurrence of artificial restoration behaviors.
MATLAB was used for programming to obtain S1 of each indicator (Figure 6).
As can be seen from Figure 6, DDI and SE were the most sensitive to the integrated ecological restoration assessment model (S1 > 0.2), followed by TVDI and LFI (S1 > 0.1), and FVC, SHDI, RDLS and NPP (S1 < 0.07) had little influence. Overall, the sensitivity (Figure 6) and weight (Table 2) ranking of the indicators were basically consistent, with slight discrepancies in the indicators of FVC, TVDI and LFI. The ecological condition assessment model we constructed is basically stable and can be used for restoration effect assessment in the study area.

4. Discussion

4.1. Evaluation System of Ecological Restoration Effect

Most of the current studies suggested that ecological restoration effectiveness assessment indicators should cover vegetation and ecosystem condition, biodiversity, and other elements, but are rather empty and generally operational [37]. SER (Society for Ecological Restoration) listed biodiversity and community structure, species richness, ecosystem stability, ecosystem health characteristics such as biodiversity and community structure, species richness, ecosystem stability, ecosystem health stress, environmental stress, and self−sustainability as criteria for ecological restoration assessment, which were comprehensive but cumbersome and costly to operate [39]. Scholars have proposed targeted evaluation indicators for small-scale restoration projects whose restoration targets were types of rivers, mines, and slopes [32,40,41], which can provide important references for the study, although they cannot cover our study subjects completely. In the actual evaluation process, the selection of indicators was more related to the national or provincial evaluation approaches introduced by government agencies than to the restoration areas and restoration measures. Considering the comprehensive nature of ecological protection and restoration projects in the Wuliangsuhai watershed and combining the characteristics of the study area and restoration measures, we selected indicators that were easily accessible and representative, and constructed a comprehensive assessment system of ecological restoration effects (Table 2). The evaluation results can objectively reflect the restoration effect. However, the indicators in our current assessment index system were mainly accessible by remote sensing. For example, indicators such as soil organic matter and grassland livestock carrying capacity were lacking in the ecosystem structure and quality category, and human factors such as the leading role of government and social capital participation were missing in the ecological change driving force assessment category. Therefore, in the context of integrated management of mountains, water, forests, fields, lakes, and grasses, we can consider the inclusion of indicators that are difficult to quantify such as disturbance, and it is the focus of future research to build a more comprehensive, comparable, operable and quantifiable ecological restoration effect assessment system and carry out systematic assessment.
Our evaluation indicators were mainly obtained through remote sensing images and meteorological stations, which could obtain near real−time and dynamic data to realize the assessment of current situations or prediction in large scale areas. The reliability of the relevant data has been verified by most scholars, but the scarcity of monitoring sample sites may lead to the accuracy of the obtained relevant data to be further verified, while the complexity of engineering measures also puts forward higher standards for the selection of indicators and reliable data collection. In future studies, data sources can be enriched, and data uncertainties can be reduced by increasing the density of sample site deployment, improved data resolution and other measures to improve the assessment accuracy.

4.2. Methods for Assessing the Effectiveness of Ecological Restoration

With the development of ecological restoration effect assessment work, the number of assessment methods is increasing, including the ecological service value assessment method [3], the comprehensive benefit assessment method (AHP) [10], and the single−indicator comparative assessment method [11]. The single−indicator comparative assessment method is relatively simple and easy to operate because only characteristic factors need to be selected. But it is limited by the representativeness of indicator selection and has a smaller scope of application. Due to the complexity of the ecosystem, methods such as hierarchical analysis, fuzzy evaluation and gray system theory are able to achieve qualitative and quantitative analysis among multiple indicators but may be influenced by whether the weights are scientific or not. The ecosystem service value assessment method, which quantifies the value of ecosystem services before and after restoration, is not applicable to indicators whose value cannot be measured, and the functional value of some indicators fluctuates with the market and region, so the reliability of the assessment cannot be guaranteed. Scientific selection of assessment methods will promote more accurate and reliable assessment conclusions. In our study, the entropy value method was used to calculate the weights of each evaluation index, and although relatively objective results can be obtained, the final conclusions may need to be further corroborated with the actual restoration situation due to the complexity of engineering measures and lagging effect of restoration. How to adopt a more scientific and reasonable evaluation method to obtain index weights should be given more attention in the future research process.

4.3. Effectiveness of the Ecological Restoration Project in the Wuliangsuhai Watershed

The Wuliangsuhai watershed landscape, forest, field, lake, and grass restoration pilot project was centered on building an important ecological security barrier in northern China, and carried out systematic management around ecological elements such as deserts, mines, forests and grasses, farmlands, wetlands, and floods in the watershed [42].After the implementation of the project, the ecological environment of each major treatment area has been greatly improved, the vegetation coverage status has been further improved, the desertification control has been effective, the richness and fragmentation of landscape components have been slightly reduced over time, the stability of the ecosystem has tended to be significant, and the ecological environment quality of the watershed has been further improved, providing an important guarantee for the water ecological security of the middle and lower reaches of the Yellow River.
Compared with the control area, the restored area has a more favorable ecological environment. The ecological environment of the Wuliangsuhai watershed is relatively fragile, with obvious characteristics of drought and low rainfall. Although the project has been basically implemented, but limited by the rule of plant growth and multi−factor interactions, the benefits of the restoration have yet to be monitored over time [43]. With the orderly implementation of the later management and care measures of the restoration project, the vegetation coverage will be steadily improved, and the capacity of wind and sand control, water connotation and soil conservation will be continuously strengthened, and the restoration effect will be further highlighted [44]. However, the current self−sustaining capacity of the ecosystem in the region is weak, and it is easy to cause the death of vegetation if maintenance management is inadequate. In addition, although the project covers a large area, the restoration measures are scattered and the enhancement of ecological service functions is limited [45]. It is suggested that the project management should further adjust the restoration measures in a timely, flexible and scientific manner according to the degree of ecosystem changes after restoration, carry out follow−up management and care work according to local conditions, promote regional high−quality development with green development, accelerate the pace of rural revitalization, and continue to do a good job of unity and stability in border ethnic areas [46].

5. Conclusions

We carried out remote sensing monitoring and auxiliary performance comprehensive evaluation in the ecological restoration project area of the Wuliangsuhai watershed by using multi−source remote sensing images and auxiliary data such as meteorological data and geographic basic data. The ecological condition of the watershed showed an overall trend of improvement, and the areas with good environment were mostly distributed in the central and eastern regions. After the implementation of the ecological restoration project, the vegetation coverage has further improved, desertification control has achieved obvious results, soil and water conservation capacity has been strengthened, and the ecosystem has gradually become stable. The overall condition of the ecological environment is good, with 37.86% of the areas having good restoration effects. The restoration effects of the main treatment areas vary but the ecological environment has been further improved, with the best restoration effects in ecological restoration and biodiversity reserves. With the steady development of the later management and care measures, the ecological environment quality will be further improved, and the project benefits will be given full play. The evaluation results can provide scientific reference for the engineering units to understand more objectively the impact of restoration measures on the ecological environment of the Wuliangsuhai watershed and the current situation and changing trend of the ecological environment, so as to further optimize the restoration measures in a timely and scientific manner and maintain the healthy development and stability of the watershed ecosystem. In the future, consideration can be given to constructing an index system with strong migration and more comprehensive and objective reflection of ecological restoration effects, improving spatial and temporal resolution of the data, and conducting yearly or quarterly long-term monitoring of the restoration area, so as to obtain more accurate and comprehensive results of the implementation of restoration project.

Author Contributions

Conceptualization, X.J., Z.J. and X.Z. (Xiaoli Zhang); methodology, X.J. and Z.J.; software, Z.J.; validation, X.J., Z.J. and X.Z. (Xiaoli Zhang); formal analysis, Z.J.; investigation, X.J., C.L., X.M., D.W., R.Z., X.Z. (Xiaoxia Zhang) and Z.H.; resources, Xiaoli Zhang; data curation, X.J. and Z.J.; writing—original draft preparation, X.J. and Z.J.; writing—review and editing, X.J. and Z.J.; visualization, X.J.; supervision, X.Z. (Xiaoli Zhang); project administration, X.Z. (Xiaoli Zhang) and X.M.; funding acquisition, X.Z. (Xiaoli Zhang). All authors have read and agreed to the published version of the manuscript.

Funding

This research was funded by Science and Technology R&D Program of the China State Construction Engineering Corporation (CSCEC), “Research and Application of Key Technologies for Restoration of Ecological Environmental Protection in Northwest China” (Grant No. CSCEC-2020-Z-5).

Data Availability Statement

Not applicable.

Acknowledgments

We acknowledge grants from the Science and Technology R&D Program of CSCEC, “Research and Application of Key Technologies for Restoration of Ecological Environmental Protection in Northwest China” (Grant No. CSCEC-2020-Z-5). We also would like to thank the graduate students for helping in data collection and summarizing. The authors gratefully acknowledge the local project builders for sharing their rich knowledge and working experience of the local ecosystem.

Conflicts of Interest

The authors declare that they have no known competing financial interests or personal relationships that could have appeared to influence the work reported in this paper.

References

  1. Sperry, K.P.; Hilfer, H.; Lane, I.; Petersen, J.; Dixon, P.M.; Sullivan, L.L. Species diversity and dispersal traits alter biodiversity spillover in reconstructed grasslands. J. Appl. Ecol. 2019, 56, 2216–2224. [Google Scholar] [CrossRef]
  2. Luo, M.; Li, T. Spatial and temporal analysis of landscape ecological quality in Yulin. Environ. Technol. Innov. 2021, 23, 101700. [Google Scholar] [CrossRef]
  3. Wang, H.; Liu, X.; Zhao, C.; Chang, Y.; Liu, Y.; Zang, F. Spatial-temporal pattern analysis of landscape ecological risk assessment based on land use/land cover change in Baishuijiang National nature reserve in Gansu Province, China. Ecol. Indic. 2021, 124, 107454. [Google Scholar] [CrossRef]
  4. Han, J.; Junxing, L.; Xianyang, Y.; Chunguang, W.; Hao, G.; Haoxuan, C.; Shijie, T. Ecological evaluation of the Tongling pyrite mining district in Anhui Province. Earth Sci. Front. 2021, 28, 131–141. [Google Scholar]
  5. Li, Y.; Wu, L.; Han, Q.; Wang, X.; Zou, T.; Fan, C. Estimation of remote sensing based ecological index along the Grand Canal based on PCA-AHP-TOPSIS methodology. Ecol. Indic. 2021, 122, 107214. [Google Scholar] [CrossRef]
  6. Noble, M.M.; Harasti, D.; Pittock, J.; Doran, B. Linking the social to the ecological using GIS methods in marine spatial planning and management to support resilience: A review. Mar. Policy 2019, 108, 103657. [Google Scholar] [CrossRef]
  7. Chen, P.; Shi, X. Dynamic evaluation of China’s ecological civilization construction based on target correlation degree and coupling coordination degree. Environ. Impact Assess. Rev. 2022, 93, 106734. [Google Scholar] [CrossRef]
  8. Meraj, G.; Singh, S.K.; Kanga, S.; Islam, M.N. Modeling on comparison of ecosystem services concepts, tools, methods and their ecological-economic implications: A review. Model. Earth Syst. Environ. 2022, 8, 15–34. [Google Scholar] [CrossRef]
  9. Chang, Y.; Hou, K.; Wu, Y.; Li, X.; Zhang, J. A conceptual framework for establishing the index system of ecological environment evaluation—A case study of the upper Hanjiang River, China. Ecol. Indic. 2019, 107, 105568. [Google Scholar] [CrossRef]
  10. Wu, X.; Hu, F. Analysis of ecological carrying capacity using a fuzzy comprehensive evaluation method. Ecol. Indic. 2020, 113, 106243. [Google Scholar] [CrossRef]
  11. Hu, X.; Ma, C.; Huang, P.; Guo, X. Ecological vulnerability assessment based on AHP-PSR method and analysis of its single parameter sensitivity and spatial autocorrelation for ecological protection—A case of Weifang City, China. Ecol. Indic. 2021, 125, 107464. [Google Scholar] [CrossRef]
  12. Du, Y.-W.; Gao, K. Ecological security evaluation of marine ranching with AHP-entropy-based TOPSIS: A case study of Yantai, China. Mar. Policy 2020, 122, 104223. [Google Scholar] [CrossRef]
  13. Ghosh, S.; Das Chatterjee, N.; Dinda, S. Urban ecological security assessment and forecasting using integrated DEMATEL-ANP and CA-Markov models: A case study on Kolkata Metropolitan Area, India. Sustain. Cities Soc. 2021, 68, 102773. [Google Scholar] [CrossRef]
  14. Li, Y.; Gao, L.; Niu, L.; Zhang, W.; Yang, N.; Du, J.; Gao, Y.; Li, J. Developing a statistical-weighted index of biotic integrity for large-river ecological evaluations. J. Environ. Manag. 2021, 277, 111382. [Google Scholar] [CrossRef] [PubMed]
  15. Halme, E.; Pellikka, P.; Mõttus, M. Utility of hyperspectral compared to multispectral remote sensing data in estimating forest biomass and structure variables in Finnish boreal forest. Int. J. Appl. Earth Obs. Geoinf. 2019, 83, 101942. [Google Scholar] [CrossRef]
  16. Loozen, Y.; Rebel, K.T.; de Jong, S.M.; Lu, M.; Ollinger, S.V.; Wassen, M.J.; Karssenberg, D. Mapping canopy nitrogen in European forests using remote sensing and environmental variables with the random forests method. Remote Sens. Environ. 2020, 247, 111933. [Google Scholar] [CrossRef]
  17. Mohajane, M.; Costache, R.; Karimi, F.; Bao Pham, Q.; Essahlaoui, A.; Nguyen, H.; Laneve, G.; Oudija, F. Application of remote sensing and machine learning algorithms for forest fire mapping in a Mediterranean area. Ecol. Indic. 2021, 129, 107869. [Google Scholar] [CrossRef]
  18. Lei, T.; Feng, J.; Lv, J.; Wang, J.; Song, H.; Song, W.; Gao, X. Net Primary Productivity Loss under different drought levels in different grassland ecosystems. J. Environ. Manag. 2020, 274, 111144. [Google Scholar] [CrossRef] [PubMed]
  19. Abutaleb, K.; Freddy Mudede, M.; Nkongolo, N.; Newete, S.W. Estimating urban greenness index using remote sensing data: A case study of an affluent vs poor suburbs in the city of Johannesburg. Egypt. J. Remote Sens. Space Sci. 2020, 24, 343–351. [Google Scholar] [CrossRef]
  20. Chen, J.; Fan, W.; Li, K.; Liu, X.; Song, M. Fitting Chinese cities’ population distributions using remote sensing satellite data. Ecol. Indic. 2019, 98, 327–333. [Google Scholar] [CrossRef]
  21. Chen, H.; Liang, Q.; Liang, Z.; Liu, Y.; Ren, T. Extraction of connected river networks from multi-temporal remote sensing imagery using a path tracking technique. Remote Sens. Environ. 2020, 246, 111868. [Google Scholar] [CrossRef]
  22. Junqueira, A.M.; Mao, F.; Mendes, T.S.G.; Simões, S.J.C.; Balestieri, J.A.P.; Hannah, D.M. Estimation of river flow using CubeSats remote sensing. Sci. Total Environ. 2021, 788, 147762. [Google Scholar] [CrossRef]
  23. Leman, N.; Ramli, M.F.; Khirotdin, R.P.K. GIS-based integrated evaluation of environmentally sensitive areas (ESAs) for land use planning in Langkawi, Malaysia. Ecol. Indic. 2016, 61, 293–308. [Google Scholar] [CrossRef]
  24. Xianjin, H.; Huan, L.; Jinliao, H.; Yueguang, Z. Application of GIS-Based Models for Land-Use Planning in China. In Comprehensive Geographic Information Systems; Huang, B., Ed.; Elsevier: Oxford, UK, 2018; pp. 424–445. [Google Scholar]
  25. Luan, C.; Liu, R.; Peng, S. Land-use suitability assessment for urban development using a GIS-based soft computing approach: A case study of Ili Valley, China. Ecol. Indic. 2021, 123, 107333. [Google Scholar] [CrossRef]
  26. Boori, M.S.; Choudhary, K.; Paringer, R.; Kupriyanov, A. Eco-environmental quality assessment based on pressure-state-response framework by remote sensing and GIS. Remote Sens. Appl. Soc. Environ. 2021, 23, 100530. [Google Scholar] [CrossRef]
  27. Yang, X.; Liu, S.; Jia, C.; Liu, Y.; Yu, C. Vulnerability assessment and management planning for the ecological environment in urban wetlands. J. Environ. Manag. 2021, 298, 113540. [Google Scholar] [CrossRef]
  28. Santos, X.; Brito, J.C.; Sillero, N.; Pleguezuelos, J.M.; Llorente, G.A.; Fahd, S.; Parellada, X. Inferring habitat-suitability areas with ecological modelling techniques and GIS: A contribution to assess the conservation status of Vipera latastei. Biol. Conserv. 2006, 130, 416–425. [Google Scholar] [CrossRef]
  29. Chen, H.-S.; Liu, G.-S.; Yang, Y.-F.; Ye, X.-F.; Shi, Z. Comprehensive Evaluation of Tobacco Ecological Suitability of Henan Province Based on GIS. Agric. Sci. China 2010, 9, 583–592. [Google Scholar] [CrossRef]
  30. Morandi, D.T.; França, L.C.d.J.; Menezes, E.S.; Machado, E.L.M.; da Silva, M.D.; Mucida, D.P. Delimitation of ecological corridors between conservation units in the Brazilian Cerrado using a GIS and AHP approach. Ecol. Indic. 2020, 115, 106440. [Google Scholar] [CrossRef]
  31. Beveridge, C.; Hossain, F.; Biswas, R.K.; Haque, A.M.A.; Ahmad, S.K.; Biswas, N.K.; Hossain, M.A.; Bhuyan, M.A. Stakeholder-driven development of a cloud-based, satellite remote sensing tool to monitor suspended sediment concentrations in major Bangladesh rivers. Environ. Model. Softw. 2020, 133, 104843. [Google Scholar] [CrossRef]
  32. Zhai, L.; Cheng, S.; Sang, H.; Xie, W.; Gan, L.; Wang, T. Remote sensing evaluation of ecological restoration engineering effect: A case study of the Yongding River Watershed, China. Ecol. Eng. 2022, 182, 106724. [Google Scholar] [CrossRef]
  33. Cai, Y.; Zhang, F.; Duan, P.; Jim, C.Y.; Chan, N.W.; Shi, J.; Liu, C.; Wang, J.; Bahtebay, J.; Ma, X.J.C. Vegetation cover changes in China induced by ecological restoration-protection projects and land-use changes from 2000 to 2020. Catena 2022, 217, 106530. [Google Scholar] [CrossRef]
  34. Zuo, Q.; Ding, X.; Cui, G.; Zhang, W. Yellow River Basin Management under Pressure. The Present State, Restoration and Protection: Lessons from a Special Issue. Water 2022, 14, 3127. [Google Scholar] [CrossRef]
  35. Wang, Z.; Mei, B. Current Status and Challenges of the Ecological Environment of Wuliangsuhai Basin in China. IOP Conf. Ser. Earth Environ. Sci. 2021, 829, 012012. [Google Scholar] [CrossRef]
  36. Wan, F.; Zhang, F.; Zheng, X.; Xiao, L.J.W. Study on Ecological Water Demand and Ecological Water Supplement in Wuliangsuhai Lake. Water 2022, 14, 1262. [Google Scholar] [CrossRef]
  37. General Office of the Ministry of Natural Resources, General Office of the Ministry of Finance, General Office of the Ministry of Ecology and Environment of China. Landscape, Forest, Field, Lake and Grass Ecological Protection and Restoration Project Guide. China Natural Resources News: Beijing, China, 2020. Available online: https://www.dzxzch.cn/zcjx/tdsy/202008/P020200806599971347546.pdf (accessed on 15 January 2022).
  38. Sobol’, I.M. Sensitivity estimates for nonlinear mathematical models. Math. Model. Comput. Exp. 1993, 1, 407–414. [Google Scholar]
  39. Society for Ecological Restoration Science & Policy Working Group. The SER Primer on Ecological Restoration [EB/OL]. 2002. Available online: www.ser.org/ (accessed on 15 January 2022).
  40. Morandi, B.; Piégay, H.; Lamouroux, N.; Vaudor, L. How is success or failure in river restoration projects evaluated? Feedback from French restoration projects. J. Environ. Manag. 2014, 137, 178–188. [Google Scholar] [CrossRef]
  41. Yuan, M.; Ouyang, J.; Zheng, S.; Tian, Y.; Sun, R.; Bao, R.; Li, T.; Yu, T.; Li, S.; Wu, D.; et al. Research on ecological effect assessment method of ecological restoration of open−pit coal mines in alpine regions. Int. J. Environ. Res. Public Health 2022, 19, 7682. [Google Scholar] [CrossRef]
  42. Tian, Y.; Feng, Q.; Tang, M.; Zheng, S.; Liu, C.; Wu, D.; Lina, W. Ecological protection and restoration of forest, wetland, grassland and cropland based on the perspective of ecosystem assessment: A case study in Wuliangsuhai Watershed. Acta Ecol. Sin. 2019, 39, 8826–8836. [Google Scholar]
  43. Yang, Y.; Liu, D.; Xiao, H.; Chen, J.; Ding, Y.; Xia, D.; Xia, Z.; Xu, W. Evaluating the effect of the ecological restoration of quarry slopes in Caidian District, Wuhan City. Sustainability 2019, 11, 6624. [Google Scholar] [CrossRef] [Green Version]
  44. Luo, M.; Zhou, Y.; Ju, Z.; Wei, H.; Zhang, S. Technological model and benefit pre-evaluation of eco-environmental rehabilitation engineering of typical mines in the Nanling area of Northern Guangdong Province under the pilot framework of the eco-restoration of mountains-rivers-forests-farmlands-lakes-grasslands. Acta Ecol. Sin. 2019, 23, 8911–8919. [Google Scholar]
  45. Qin, T.; He, S.; Liu, S.; Nie, H.; Dong, B.; Lv, X. Optimal Allocation of Slope Ecological Restoration for the Climate Change Mitigation and Natural Function Improvement. Front. Earth Sci. 2022, 10, 837311. [Google Scholar] [CrossRef]
  46. Zhang, X.; Liu, K.; Wang, S.; Wu, T.; Li, X.; Wang, J.; Wang, D.; Zhu, H.; Tan, C.; Ji, Y. Spatiotemporal evolution of ecological vulnerability in the Yellow River Basin under ecological restoration initiatives. Ecol. Indic. 2022, 135, 108586. [Google Scholar] [CrossRef]
Figure 1. Distribution of main treatment areas in the Wuliangsuhai Basin.
Land 12 00349 g001
Figure 2. Schematic diagram of the results of ecological restoration effect assessment indicators in the Wuliangsuhai watershed.
Land 12 00349 g002
Figure 3. Ecological status rating map of the Wuliangsuhai watershed.
Land 12 00349 g003
Figure 4. Comprehensive evaluation map of ecological restoration effect in the Wuliangsuhai watershed.
Land 12 00349 g004
Figure 5. Comprehensive assessment of ecological changes in the control plot of the Wuliangsuhai watershed: (a,b) are the ecological scores for 2017 and 2021, respectively; (c) is a comprehensive assessment of changes in ecological conditions.
Land 12 00349 g005
Figure 6. First−order sensitivity of indicators for integrated assessment of ecological restoration in the Wuliangsuhai watershed.
Land 12 00349 g006
Table 1. Acquisition schedule of remote sensing imagery.
Image TypeLine Number/View Number/Track NumberImaging TimeSpatial Resolution
Column NumberRow Number
Landsat8128312017-08-3030m
128322017-08-30
129312017-09-06
129322017-08-05
130312017-08-12
130322017-08-12
128312021-08-09
128322021-08-25
129312021-08-16
129322021-08-16
130312021-08-23
130322021-07-06
MOD11A24620171km
462021
MOD13Q1462017250m
462021
MOD17A2H462017500m
462021
Sentinel-1A842017-12-30
2021-12-21
Table 2. Evaluation index system of ecological restoration effect in the Wuliangsuhai watershed.
Indicator TypeDetailed IndicatorData UsedCalculation MethodWeight
Ecosystem structure and qualityVegetation coverage (FVC)Landsat8 F V C = N D V I N D V I m i n N D V I m a x N D V I m i n
where, VFC is the fraction vegetation coverage, NDVI is the vegetation index of a pixel, NDVImin is the smallest NDVI value among all pixels, and NDVImax is the largest NDVI value among all pixels.
(1)0.12
Degree of desertification index (DDI)Landsat8 D D I = a · N D V I A l b e d o
where, DDI is the difference index for desertification monitoring, a is determined by the regression equation coefficient of the vegetation index and surface albedo, NDVI is the vegetation index, and Albedo is the surface albedo.
(2)0.21
Shannon’s diversity index (SHDI)Landsat8 S H D I = i = 1 m ( P i × l n P i )
where, SHDI is Landscape enrichment, m is the number of plaque types and Pi the probability of occurrence of the ith type of plaque.
(3)0.11
Landscape fragmentation index (LFI)Landsat8 L F I = N P S
where, LFI is landscape fragmentation, NP is the number of patches in an image element, and S is the area of the image element.
(4)0.18
Relief Degree of Land Surface (RDLS)Sentinel-1AInversion of the terrain, see Section 2.2.3 for more details. 0.06
Ecosystem ServiceNet primary productivity of vegetation (NPP)MOD17A2HAnnual average NPP obtained using band synthesis, see Section 2.2.2 for more details. 0.07
Soil erosion (SE)Landsat8, DEM S E = R × K × L S × C × P
where, SE is soil erosion volume, R is the rainfall erosion force factor, K is the soil erodibility factor; LS is the slope length factor; C is the vegetation coverage factor; P is the soil and water conservation measure factor.
(5)0.16
Ecosystem change driverTemperature Vegetation Dryness Index (TVDI)MOD11A2, MOD13Q1 T V D I = L S T i a 1 + b 1 * N D V I a 2 + b 2 * N D V I a 1 + b 1 * N D V I
where, TVDI is the drought index, a1, b1, a2, b2 are the dry-side and wet-side fitting coefficients, LSTi is the surface temperature of any image element.
(6)0.09
Table 3. List of ecological index values in the Wuliangsuhai watershed.
IndicatorLevel of Indicator20172021Value of Change
Area (km2)PercentageArea (km2)Percentage
FVCBare ground (<0.2)119 0.73%109 0.68%−0.06%
Low (0.2–0.4)66 0.41%72 0.44%0.04%
Medium–low (0.4–0.6)5361 33.12%4554 28.13%–4.98%
Medium (0.6–0.8)4759 29.40%5075 31.35%1.95%
High (>0.8)5882 36.34%6377 39.40%3.06%
DDIExtremely heavy (<0.3)2606 16.10%1841 11.37%–4.73%
Heavy (0.3–0.5)1943 12.00%1823 11.26%–0.74%
Medium (0.5–0.7)3514 21.71%2786 17.21%–4.50%
Mild (0.7–0.8)3675 22.70%1972 12.18%–10.52%
No (>0.8)4448 27.48%7765 47.97%20.49%
SHDISingle (0)1366 8.44%1380 8.52%0.08%
Relatively single (0–0.5)1262 7.80%1273 7.86%0.07%
Enrichment (0.5–1)7078 43.73%7189 44.41%0.69%
General enrichment (1–1.5)5591 34.54%5515 34.07%–0.47%
Very abundant (>1.5)890 5.50%830 5.12%–0.37%
LFIConsistency (<2)4199 25.94%4031 24.90%–1.04%
Compare consistency (2–3)4086 25.24%4089 25.26%0.02%
Crusher (3–4)3796 23.45%3811 23.54%0.09%
General crush (4–5)2575 15.91%2595 16.03%0.13%
Very crush (>5)1532 9.46%1661 10.26%0.80%
RDLS(m)16187 2.65 16187 2.64 –0.01m
NPP(g/m2·a)16187 125.35 16187 137.05 11.70 g/m2·a
SENo significant erosion (<3.5)15621 96.50%16012 98.92%2.41%
Mild erosion (3.5–12.5)346 2.14%113 0.70%–1.44%
Strength erosion (12.5–26.5)100 0.62%30 0.19%–0.43%
Moderate erosion (26.5–43.5)40 0.25%12 0.07%–0.18%
Extremely strong erosion (>43.5)81 0.50%21 0.13%−0.37%
TVDIDrought (<0.55)1183 7.31%1107 6.84%−0.47%
Mild drought (0.55–0.65)5278 32.61%4306 26.60%−6.01%
Ordinary (0.65–0.75)9085 56.12%9669 59.73%3.61%
Mild fountain (0.75–0.85)566 3.50%926 5.72%2.22%
Fountain (>0.8)75 0.47%178 1.10%0.64%
Overall scoreExtremely low (0–0.2)1225 7.57%1056 6.52%−1.04%
Low (0.2–0.4)2909 17.97%2589 15.99%−1.98%
Medium (0.4–0.6)7924 48.95%7596 46.93%−2.03%
High (0.6–0.8)3991 24.66%4779 29.52%4.87%
Extremely high (0.8–1)138 0.85%167 1.03%0.18%
Table 4. Comprehensive evaluation table of ecological restoration in the Wuliangsuhai watershed.
Classification of Restoration EffectRestoration RateArea (km2)Percentage (%)
Significant improvement>50%6323.90
Moderate improvement30%–50%12677.83
Slightly improvement10%–30%422926.13
No change<10%1005962.14
Table 5. Comprehensive evaluation of ecological restoration in each treatment area of the Wuliangsuhai watershed (unit: km2).
Classification of Restoration EffectSea Ring Ecological Zone Water Ecological Restoration ZoneForest and Grass Restoration ZoneMine Treatment ZoneDesert Treatment ZoneWater System Protection Zone
Significant improvement69 19 41 43 13 447
Moderate improvement170 29 78 94 2 894
Slightly improvement562 78 297 315 16 2961
No change1121 128 730 703 60 7317
Disclaimer/Publisher’s Note: The statements, opinions and data contained in all publications are solely those of the individual author(s) and contributor(s) and not of MDPI and/or the editor(s). MDPI and/or the editor(s) disclaim responsibility for any injury to people or property resulting from any ideas, methods, instructions or products referred to in the content.

