Article

An Approach for Prioritizing Natural Infrastructure Practices to Mitigate Flood and Nitrate Risks in the Mississippi-Atchafalaya River Basin

1
IIHR-Hydroscience & Engineering, University of Iowa, Iowa City, IA 52242, USA
2
Environmental Defense Fund, Raleigh, NC 27607, USA
3
Environmental Defense Fund, Washington, DC 20009, USA
4
Center for Rural and Agricultural Development, Iowa State University, Ames, IA 50011, USA
5
Grassland Soil and Water Research Laboratory, Agricultural Research Service, U.S. Department of Agriculture, Temple, TX 76502, USA
*
Author to whom correspondence should be addressed.
Land 2023, 12(2), 276; https://doi.org/10.3390/land12020276
Submission received: 1 December 2022 / Revised: 6 January 2023 / Accepted: 14 January 2023 / Published: 18 January 2023

Abstract

:
Risks from flooding and poor water quality are evident at a range of spatial scales and climate change will exacerbate these risks in the future. Natural infrastructure (NI), consisting of structural or perennial vegetation, measures that provide multiple ecosystem benefits have the potential to reduce flood and water quality risks. In this study, we intersected watershed-scale risks to flooding and nitrate export in the Mississippi-Atchafalaya River Basin (MARB) of the central U.S. with potential locations of seven NI practices (row crop conversion, water, and sediment control basins, depressional wetlands, nitrate-removal wetlands, riparian buffers, and floodplain levees and row crop change) to prioritize where NI can be most effective for combined risk reduction at watershed scales. Spatial data from a variety of publicly-available databases were analyzed at a 10 m grid cell to locate NI practices using a geographic information system (GIS). NI practices were presented at the regional basin scale and local Iowa-Cedar watershed in eastern Iowa to show individual practice locations. A prioritization scheme was developed to show the optimal watersheds for deploying NI practices to minimize flooding and water quality risks in the MARB. Among the 84 HUC4 basins in the MARB, 28 are located in the Upper Mississippi and Ohio Rivers basins. The Wabash and Iowa-Cedar basins (HUCs 0512 and 0708, respectively) within these basins were found to rank among the uppermost quintile for nearly all practices evaluated, indicating widespread opportunities for NI implementation. Study results are a launching point from which to improve the connections between watershed scale risks and the potential use of NI practices to reduce these risks.

1. Introduction

Societal threats from flooding and poor water quality are evident at a global scale [1,2] and climate change is anticipated to increase these risks in coming decades [3,4]. Communities have historically reacted to these risks by short-term interventions at the point of damage—such as drinking water advisories and temporary housing—that do little to address the actual causes of the problem. More recently, U.S. policymakers have shown a desire to shift from (reactive) disaster response to (proactive) hazard mitigation planning. For example, the Federal Emergency Management Agency recently (2021) made $1 billion available for flood hazard mitigation through its Building Resilient Infrastructure and Communities program. Policies and programs such as these potentially open the door to a more comprehensive approach to risk management that both reduces the vulnerability of downstream communities and reduces flood and water quality risks at their source through the management of upstream watersheds. Indeed, the past decades have seen increased interest in using watershed management to protect and remediate drinking water supplies and reduce downstream flood impacts. A well-known example is the restoration and protection of the Catskill Mountains, which has successfully filtered nearly one billion gallons of water a day over the last 25 years for the millions of residents of New York City [5]. Communities along the Mississippi River, from Davenport, Iowa to Cairo, Illinois, are restoring wetlands for flood mitigation with positive results [6,7]. While the watershed approach potentially offers managers a wide array of options for reducing water pollution and flooding at the source, given limited funding also requires careful scientific assessment of which types of interventions at which locations will deliver the greatest benefits in a specific watershed. Likewise, at the regional scale, potential interventions in particular watersheds will deliver greater benefits than others to downstream communities. At both scales, therefore, spatial targeting is critical to ensuring that limited funding is directed to interventions that will do the most good.
Within watersheds, natural infrastructure (NI)—“durable structural and/or perennial vegetation measures…that restore ecological processes and deliver multiple environmental benefits to downstream communities” [8]—has the potential to reduce the risks of both flooding and water quality impairment. Many NI practices in rural landscapes promote the storage, infiltration, and slow release of runoff for flood reduction while also creating appropriate environments needed for pollution treatment in both surface and subsurface pathways. For example, sediment and phosphorus transport are reduced by practices that slow runoff, and practices that direct flow through denitrifying environments can remove nitrate from water [9]. Identifying suitable locations within a watershed for implementation of NI practices, therefore, requires an understanding of hydrologic flows as well as pollution sources, transport, and sinks within a watershed. Schilling et al. developed such a hydrologic framework at the regional scale and used it to identify agro-hydrologic regions within which specific suites of NI practices would be most appropriate for water quality improvement [10].
Most of the previous research on identifying potential locations for NI practices has often narrowly focused on either flooding or water quality benefits and has been limited to small watershed scales. For example, spatial targeting has been most often used in siting urban green infrastructure to reduce flooding [11,12] and nutrient loads [13,14] while creating other co-benefits [15,16]. It has been used less frequently for flooding outside of urban areas, although some researchers have used spatial targeting at the watershed scale for floodplain restoration to maximize avoided damages from flooding [17]. Notable examples of spatial targeting for flood reduction in an agricultural setting include spatial optimization for potential wetlands [18] and the development of a framework to optimize distributed systems of small ponds [19]. Schilling et al. evaluated the potential for targeted land use change from crops to perennial vegetation and extended rotations to reduce flood risk in a large agricultural watershed [10].
Turning to water quality, the Agricultural Conservation Planning Framework (ACPF) is a tool that was developed to target locations where in-field and edge-of-field conservation practices would be most suitable from a biophysical perspective to treat nonpoint source pollution at the watershed scale [20]. More recently the ACPF was combined with areas of high nitrate loss and areas with low economic costs to show that spatial optimization can improve water quality in these landscapes without removing much land from cultivation [21]. Spatial targeting is typically conducted at a finer resolution within small watersheds [22,23] where it can be better used by local community planners. Larger regional spatial targeting is more often carried out using county- or state-level data or lumped parameters [24,25].
In this paper, we describe a procedure for identifying potential locations for a suite of NI practices identified by Suttles et al. as having high potential to deliver flood risk reduction and/or water quality improvement [8]. We developed this procedure for the Mississippi-Atchafalaya River Basin (MARB) of the central U.S. but believe that it could be adapted and modified for other regions. Draining more than 3.2 million km2 and portions of 31 states, the heavily managed and engineered MARB has seen not only historic flooding in the past few decades [26,27], but also significant economic and ecological consequences from excessive nutrient loading to the Gulf of Mexico [28,29]. Considerable research has been conducted on assessing watershed-scale flood vulnerabilities [26,30,31] and water quality [32,33,34] but rarely have studies been directed at both risks together.
Our research builds upon earlier spatial targeting research noted above but is unique in its emphasis on the use of NI to address the combined risks of nitrate pollution and flooding and its scalability from the entire river basin to small watersheds. Our work brings together GIS-based mapping of potential locations of various NI practices with model-derived estimates of flood and water quality risks to prioritize where NI can be most effective for combined risk reduction at scales ranging from small watersheds to regional basins. Our analysis included the entire MARB, but we highlight practices and prioritization in the smaller Iowa-Cedar River Basin in eastern Iowa to better visualize the spatial data and demonstrate how prioritization could be achieved at a range of spatial scales.

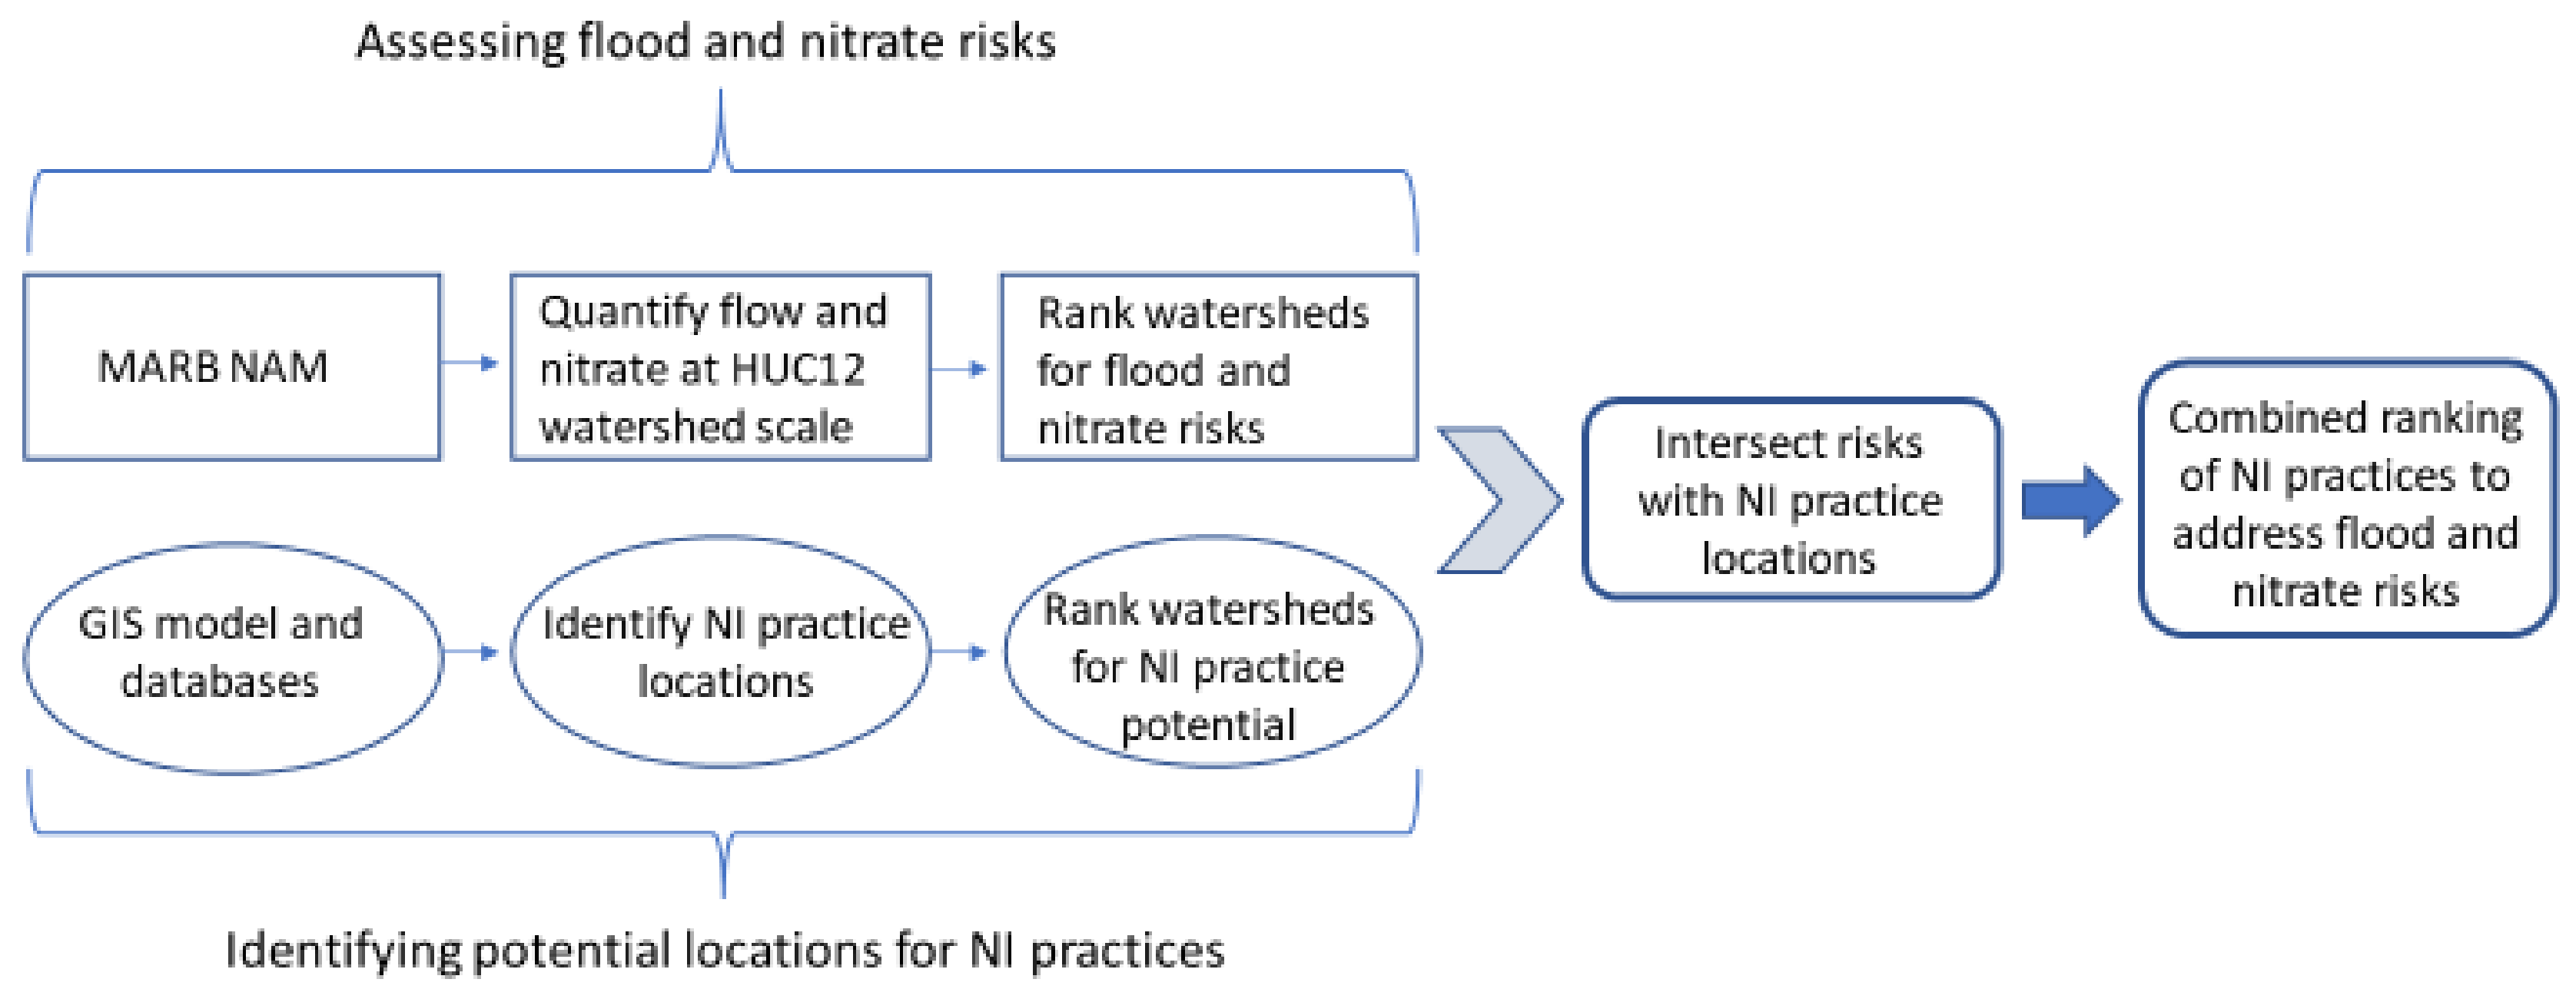
2. Materials and Methods

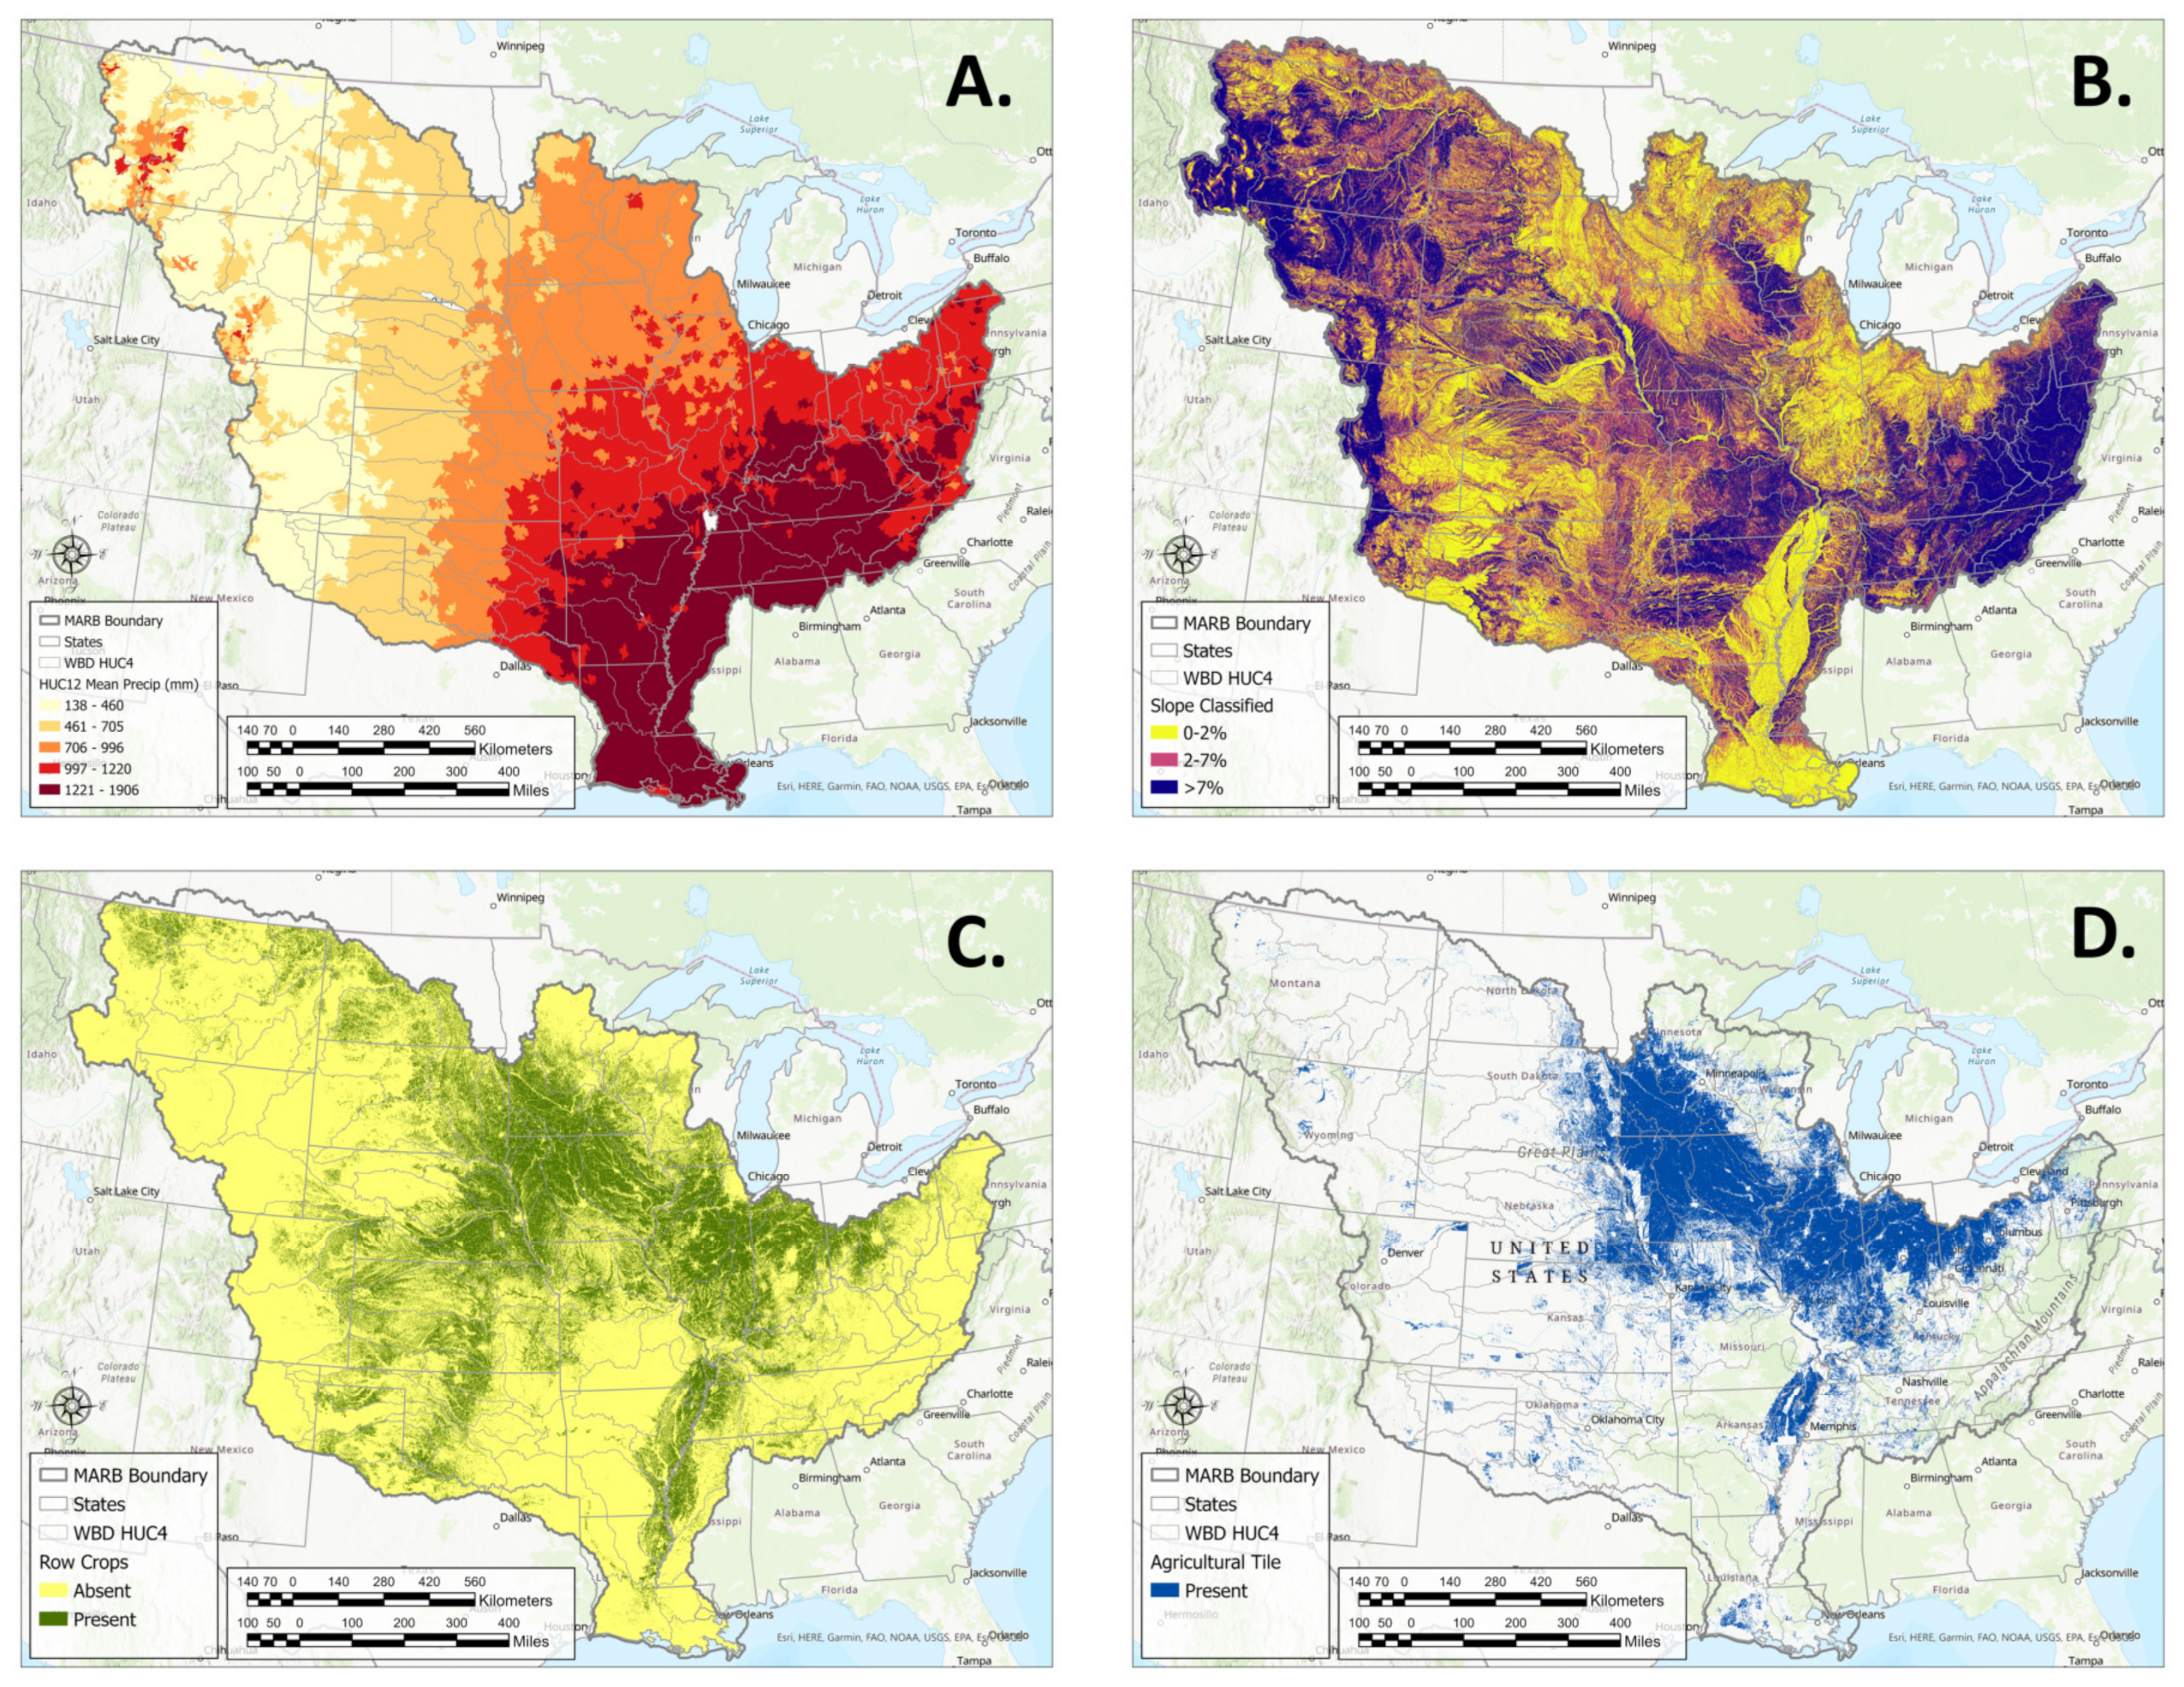
2.1. MARB Description

The MARB, extending east to west from the Appalachian Mountains in New York to the Rocky Mountains in western Montana and north to south from Canada to the Gulf of Mexico, drains an area of 3,208,700 km2 or about 41% of the conterminous United States. In a basin this large, it would be expected that climate, topography, and land use vary widely across the region (Figure 1). Long-term annual precipitation (P) increases from the drier High Plains region (<500 mm) to the southeast U.S. where annual P exceeds 1500 mm (Figure 1A). Land slopes are commonly less than 2% in the recently glaciated Midwest, Mississippi River delta region, and High Plains, but exceed 7% in older glacial landscapes and Driftless region of Wisconsin, and in mountainous regions that include the Appalachians, Rocky Mountains, and Central Uplift zone in southern Missouri and Arkansas (Figure 1B).
Largely due to continental differences in climate and topography, land use, and agricultural intensity also varies in the MARB. The dominant MARB land use categories are forest (1,051,986 km2), grassland/pasture/hay (951,426 km2), all cropland (796,449 km2), urban (166,038 km2), wetland (147,660 km2), fallow/barren (67,619 km2), and water (64,824 km2). Row crops of corn and soybeans grown in rotation are intensively grown in the expansive Corn Belt region that stretches from the eastern Missouri River Basin, across the UMRB to the western part of the Ohio River Basin (ORB) (Figure 1C). Throughout the Corn Belt, artificial subsurface drainage systems were installed to drain excess water from the landscape for crop production [35]. Watersheds containing these artificial drainage systems are susceptible to increased losses of many agricultural pollutants, including predominantly NO3-N [36,37,38].
The MARB provides tremendous ecosystem and transportation services but simultaneously suffers from severe flooding, ecological, and water quality stresses [39,40,41]. Several extreme floods occurred in parts of the MARB stream system between the early 1800s and the present time [42,43,44]. Some of these floods were considered “massive”, due to extensive destruction that occurred over large portions of the MARB during 1858, 1874, 1927, 1936, 1973, 1993, 1997, 2011, and 2019 [42,43,44,45,46,47,48,49,50]. The magnitude of “100-year floods” has increased by 20% over the past 500 years; channelization of the Lower Mississippi River Basin (LMRB) was responsible for 75% of this increase [51]. The largest portion of these flood magnitude increases was due to wing dikes and other navigational structures, with progressive levee development contributing secondary impacts [52].
Exports of nonpoint source pollutants from cropland landscapes and other diffuse sources to stream systems have manifested as the dominant MARB pollution problem in recent decades [53,54,55,56]. An analysis conducted by Sprague et al. [53] of long-term monitoring data at eight Mississippi River sites revealed little decline in nitrate loads between 1980 and 2008 in the Upper Mississippi River Basin (UMRB). Monitoring data collected across 46 Iowa watersheds from 2000 to 2017 revealed a weighted average total P (TP) yield of 1.70 kg/ha, which was estimated to result in roughly 15% of the annual TP load to the Gulf of Mexico during that time period [56]. Jones et al. [55] report that extremely high loads of nitrate were also exported from Iowa over the period of 1999 to 2016, which were equivalent to 29, 45, and 55% of the total nitrate loads discharged to the entire MARB, UMRB, and MRB regions during the study period. David et al. [57] found that the highest nitrate exports occurred from intensive row-cropped and tile-drained landscapes in Minnesota, Iowa, Illinois, Indiana, and Ohio based on statistical modeling they performed for the MARB. Dissolved inorganic and organic N exports from the MARB were found to increase by 140% and 53%, respectively, based on a simulation analysis performed from 1912 to 2014 [58]. The discharge of nutrients from the outlet of the Mississippi River has been identified as a key underlying cause of the seasonal oxygen-depleted hypoxic zone that forms annually in the northern Gulf of Mexico [55,57,59,60,61].

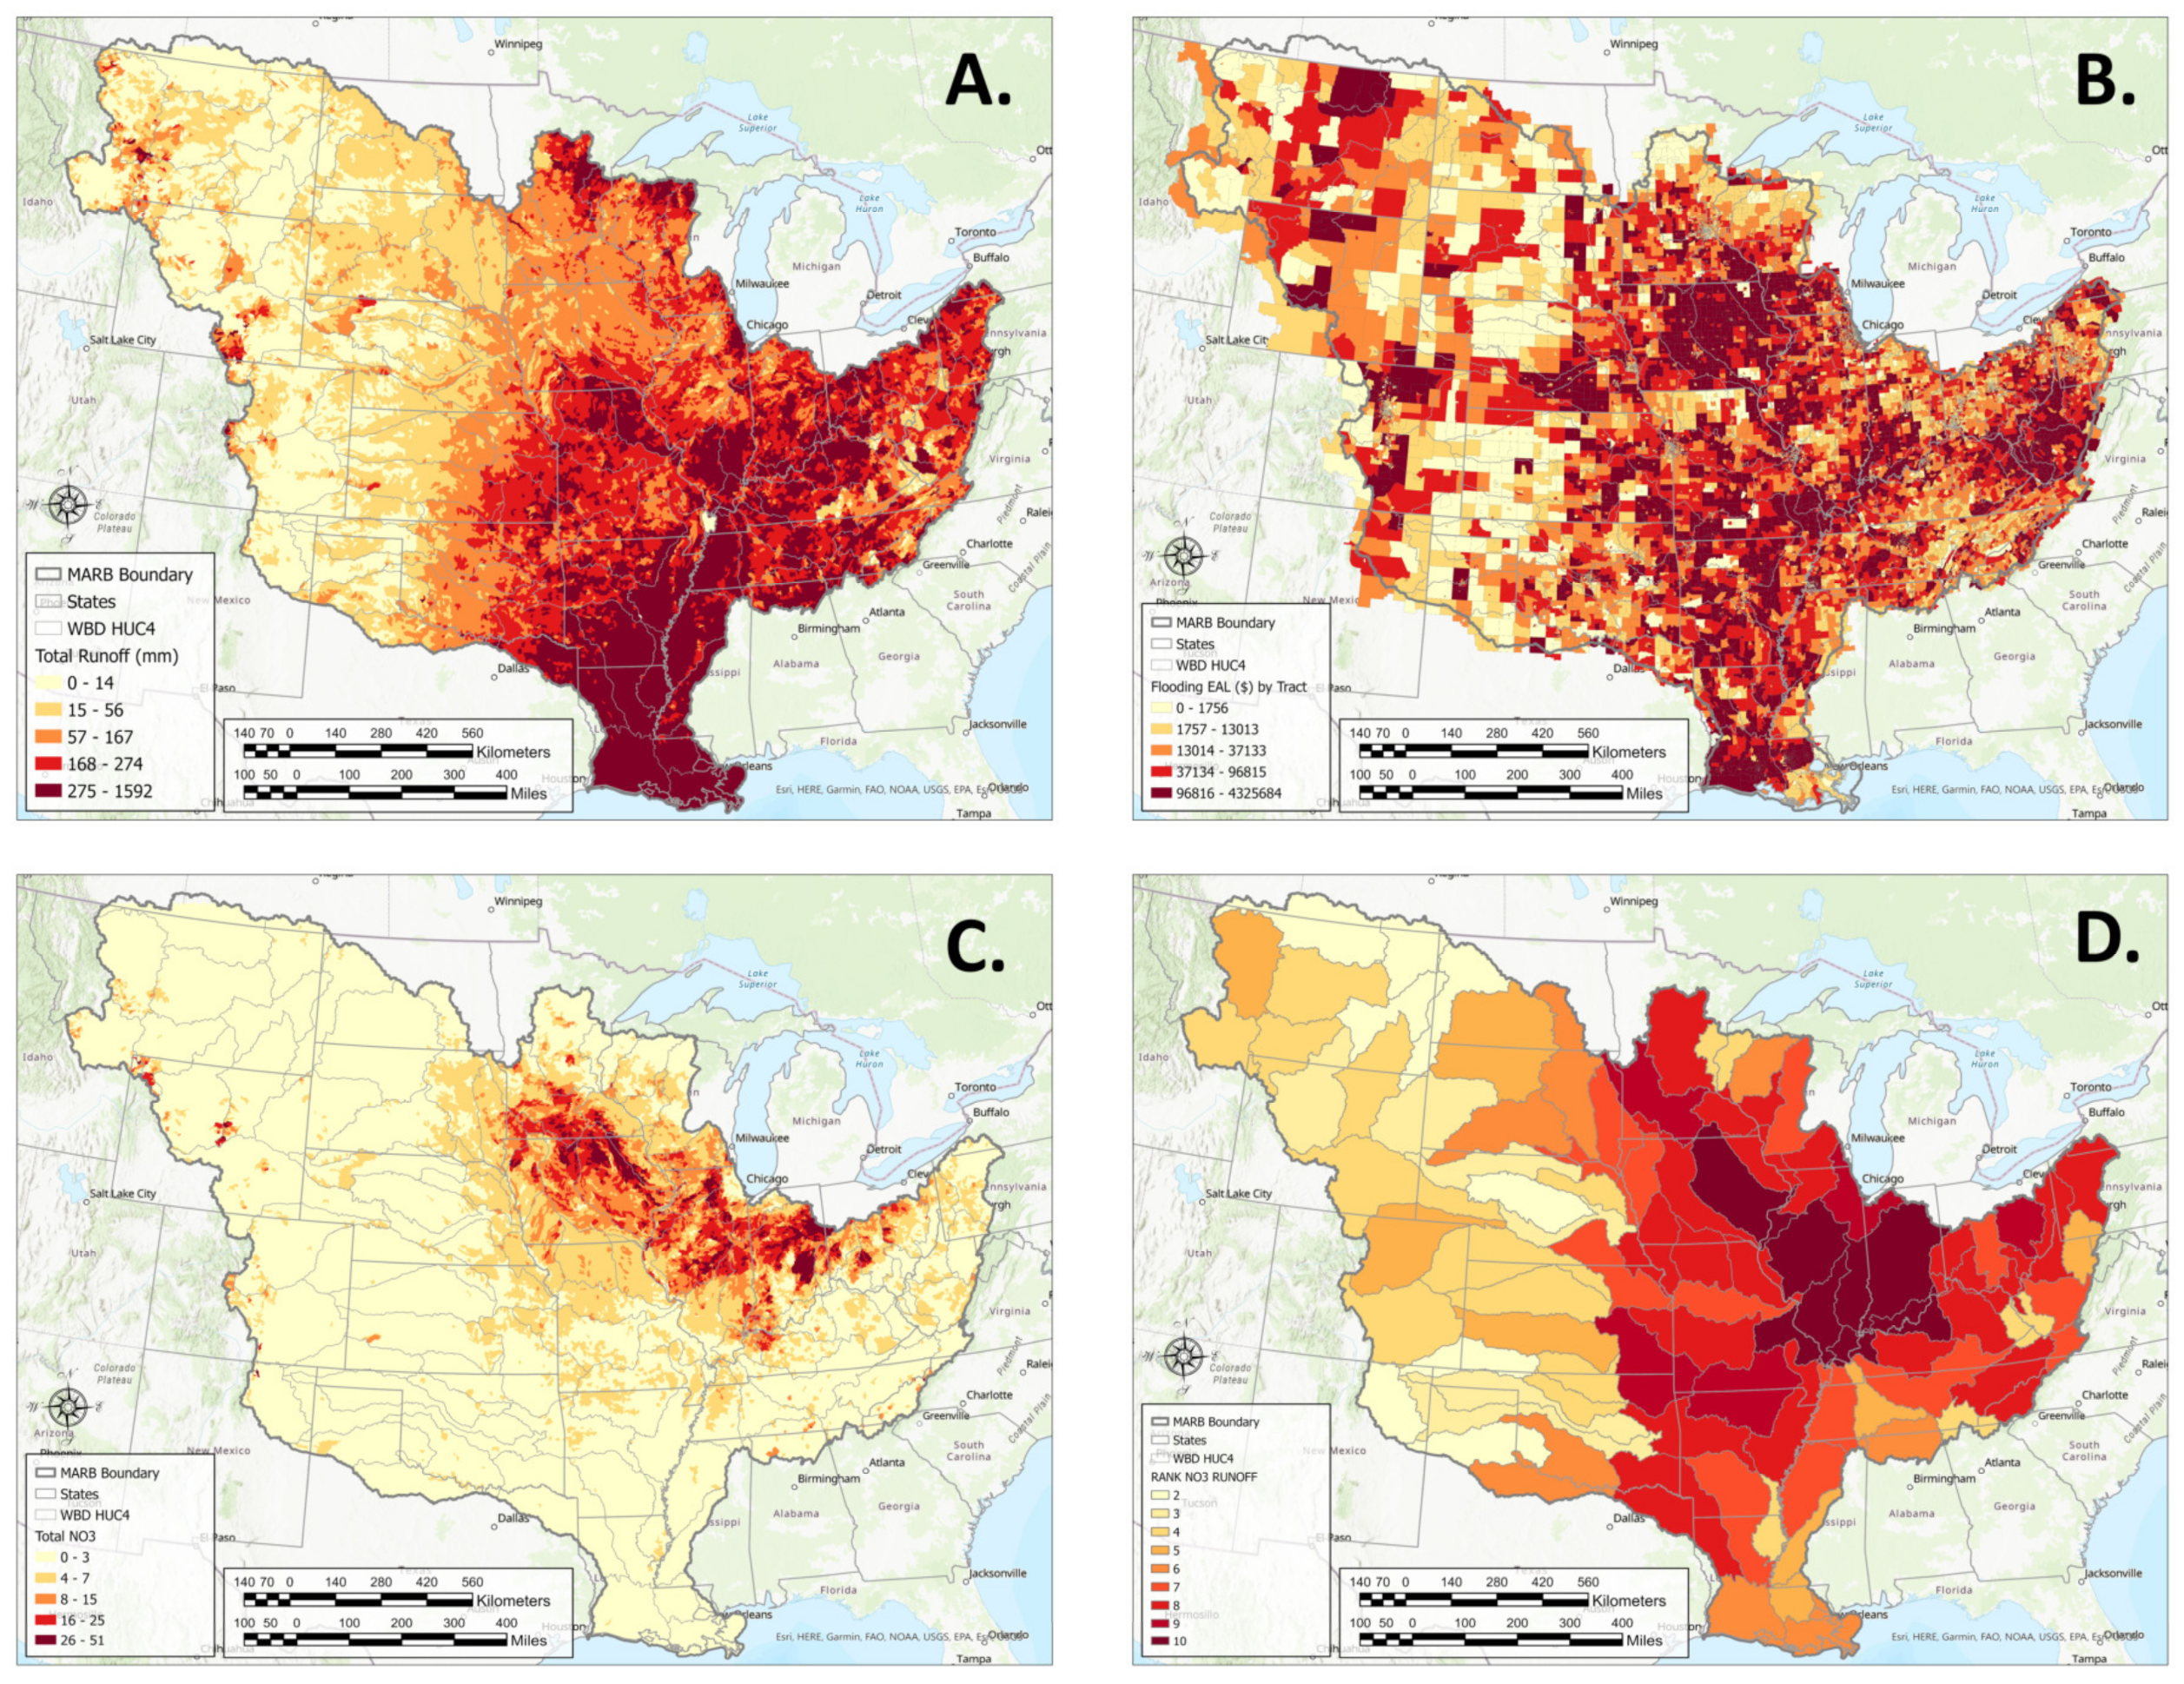
2.2. Assessing Runoff and NO3-N Risks in MARB

We used the Soil and Water Assessment Tool (SWAT) ecohydrological model [62,63,64,65] to assess runoff and nitrate risks in the MARB. SWAT has evolved over a period of three decades via multiple versions as chronicled by Bieger et al. and Gassman & Yingkuan [65,66]. SWAT has been applied across the globe to assess an extensive array of water resource problems for areas ranging from <1 km2 to entire continents as documented in the SWAT literature database [67] and various general, regional and topical reviews [68,69,70,71,72,73,74,75,76,77]. SWAT has also been applied for major MARB water resource regions including the MRB [78,79,80,81,82], ORB [29,83,84,85,86,87], Corn Belt region [88,89,90], Arkansas-Red-White River System [78,83,91,92], LMRB [93,94], and UMRB (over 40 studies, see Chen et al. [95]).
The development of the National Agroecosystem Model (NAM) provides a platform to apply SWAT for the entire MARB at refined areal resolutions as small as individual crop fields [96]. NAM also utilizes the newly developed SWAT+ model, which allows greater flexibility in the representation of individual watershed components (reservoirs, streams, fields, aquifers, etc.) and their interconnections. The NAM system has been configured for the contiguous U.S., which features a robust structure that incorporates 4,880,000 agricultural fields and 2,250,000 non-agricultural hydrologic response units [96]. These landscape spatial units are further overlayed by a hierarchical system of basins and watersheds that are identified by specific hydrologic unit codes (HUCs) that were developed by collaborating federal agencies [97,98]. The HUC classification scheme is a nationwide set of nested polygons that classifies basins based on drainage subdivisions. Six different HUC levels have officially been established which are categorized as regions, subregions, basins, subbasins, watersheds, and subwatersheds [97,99]. Regions are identified with 2-digit codes, which include the six major basins that comprise the MARB. Subregion, basin, subbasin, watershed, and subwatershed HUCs represent successively smaller drainage areas and are identified by respective 4-, 6-, 8-, 10,- and 12-digit codes [100]. There are 84 HUC4-level subregional basins and 34,944 HUC12-sized subwatersheds within the MARB.
Planting and harvesting, tillage, fertilizer, irrigation, and other management practices, coupled with structural conservation practices [100], other conservation practices, and subsurface tile drainage are also accounted for on cropland landscapes [96]. The original tile drainage layer described by Arnold et al. [96] has since been updated with the improved spatial representation of tile drains reported by Valayamkunnath et al. [101] (shown in Figure 1D).
Calibration of the NAM system initially focused on the hydrologic and crop yield components of the system [102]. Uncalibrated streamflow and nitrate loads estimated for the MARB region were used for the GIS model water quality assessment in this study. The nitrate loads were reviewed by the NAM modeling team and other co-authors of this study to ensure that expected areas of the highest loads (e.g., intensely cropped tile-drained areas) were replicated by the modeling system. The GIS model water quality assessment presented here can be updated in the future with fully calibrated and validated NAM nitrate loads.

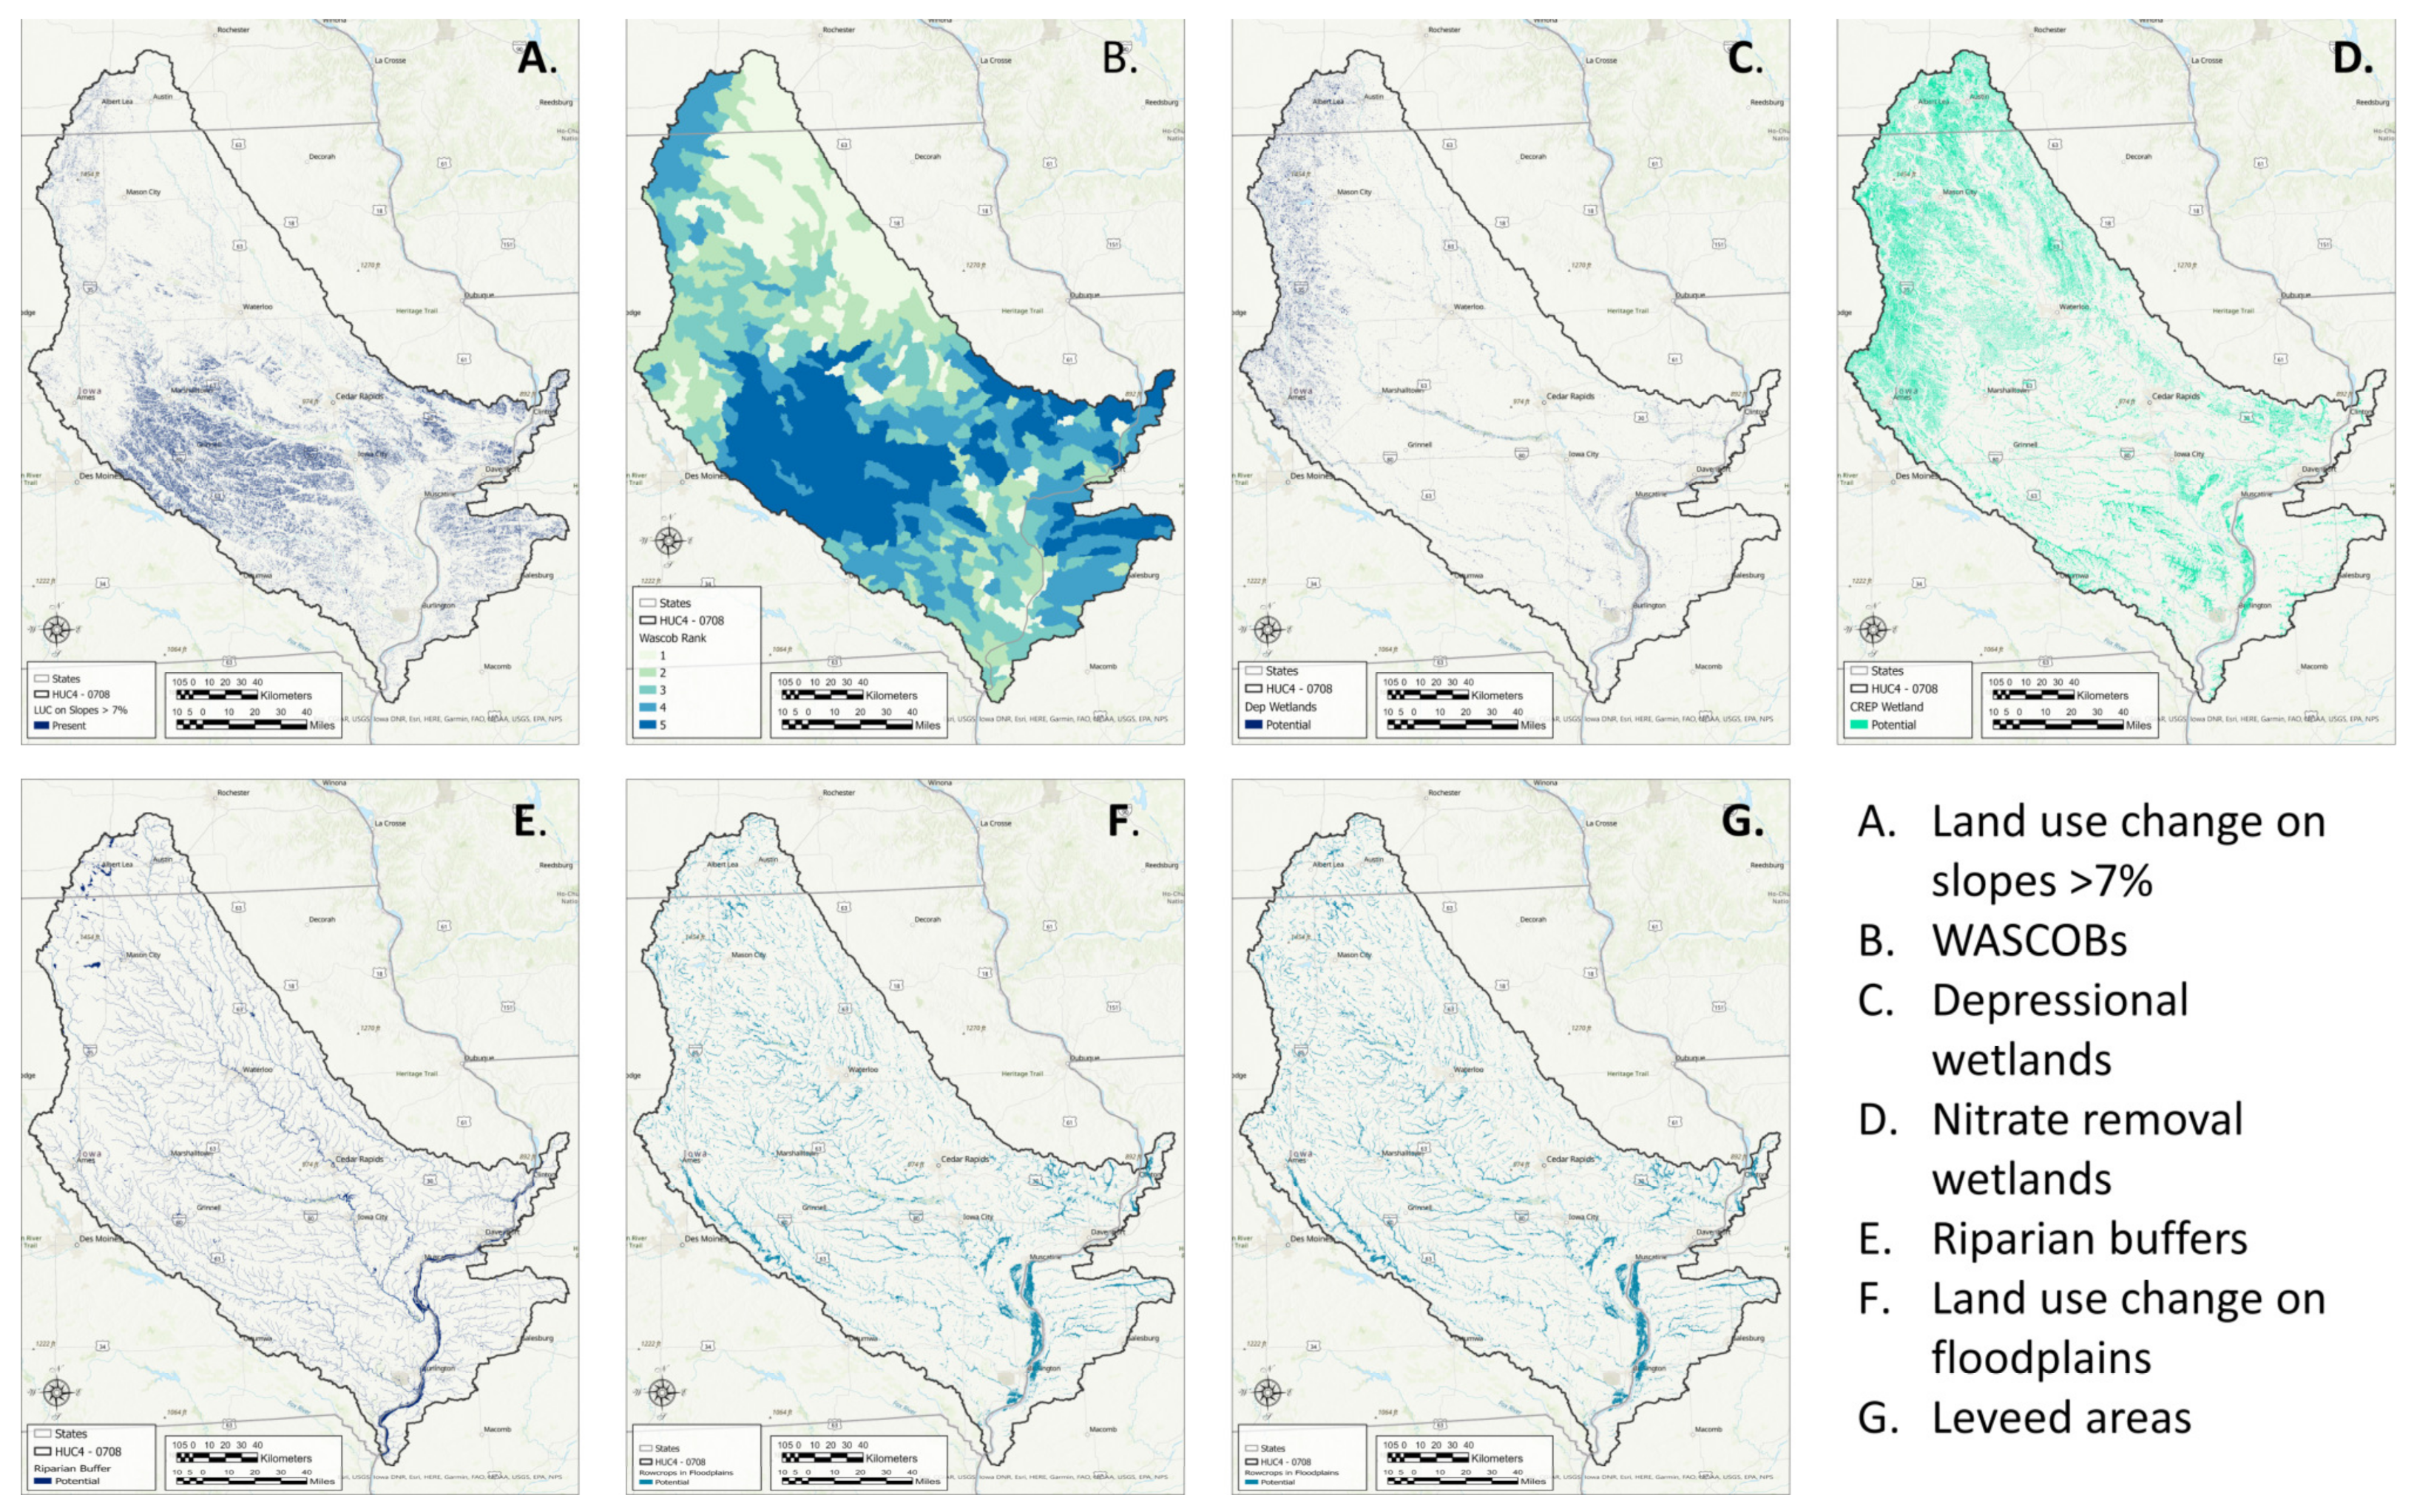
2.3. Selection of NI Practices

For this study, we evaluated NI practices that have been shown to have a high potential to reduce flood risk and/or improve water quality [8]. Our water quality focus was placed on reducing nitrate export because the hydrologic pathways of nitrate loss (primarily tile drainage and baseflow [103]) are different than those pollutants associated with rainfall runoff (i.e., sediment, bacteria, and phosphorus [104]). Practices that reduce flooding will also reduce pollutant transport from stormwater runoff. Of the NI practices examined by Suttles et al. [8], we emphasized those most likely to provide dual benefits for water quality improvement and flood reduction and for which clear siting criteria are available at the regional scale: upland row crop conversion, water, and sediment control basins (WASCOBs), depressional wetlands, nitrate-removal wetlands, riparian buffers, and floodplains (levees and row crop conversion). Our emphasis on the potential for dual benefits precluded the consideration of nitrate reduction strategies that do not have flood reduction benefits such as bioreactors [105] and saturated buffers [106]. We describe the selected practices briefly below.

2.3.1. Upland Row Crop Conversion

Considerable research has shown that land use change has contributed to increasing discharge and floods [107,108,109]. In particular, increasing cultivation and grazing pressure from agricultural land use change has contributed to increased soil compaction, reduced infiltration, and increased runoff [110,111]. On the other hand, perennial cover in watersheds reduces the likelihood of flood events, decreasing both the number of flood events and the frequency of severe floods [10]. Further, nitrate concentrations are overwhelmingly associated with agricultural croplands, specifically row crops of corn and soybean production [112,113]. Hence, a conversion of row croplands to perennial vegetation would serve the dual benefits of reducing runoff risk and reducing nitrate export.

2.3.2. WASCOBs

Berms or small terraces are placed along minor slopes or drainageways to detain runoff during storm events and slowly release the water through an outlet or seepage via infiltration [114]. These practices are similar to runoff attenuation features used primarily in the UK and Europe [8]. WASCOBs are primarily understood to significantly reduce downstream sediment and particulate phosphorus export (80–85%; [115]) but infiltrating water into drainage-way deposits that consist of fine-textured and organic-rich sediments may provide additional nitrate reduction benefits via denitrification [116].

2.3.3. Depressional Wetlands

Depressional wetlands are typically shallow depressions, sometimes referred to as palustrine wetlands, potholes, or sloughs [117]. Many of these shallow depressions were formed following the retreat of Wisconsin-age glaciers (Prairie Pothole region; [118]), but similar depressional features are found in floodplains [119]. Depressional wetlands capture and store floodwaters [120,121] and they are considered an effective edge-of-field treatment for reducing nitrate loads [122,123,124].

2.3.4. Nitrate-Removal Wetlands

Nitrate-removal wetlands are constructed or engineered wetlands that replicate the functions of natural wetlands and are often positioned in the landscape to intercept water and nitrate in tile-drained agricultural watersheds [124,125]. Many of these wetlands are located at the outlets of small, tile-drained catchments and receive flows and nitrate loads from combined surface and subsurface sources [125]. Although primarily considered a nitrate treatment practice [18,123] they also reduce peak runoff [126].

2.3.5. Riparian Forest Buffers

Riparian buffers consist of natural [127] or designed [128] perennial vegetation found adjacent to streams. Buffers are well understood to reduce subsurface nitrate concentrations [129,130,131] via processes such as plant uptake [132] and denitrification [133]. The perennial vegetation lining streams add surface roughness and may reduce flood peaks [8,134], but further study is needed.

2.3.6. Floodplain Levees

Levees are commonly located adjacent to rivers prone to flooding and reduce the impacts of flooding on floodplain agriculture and urban development [135,136,137]. One estimate indicated more than 160,000 km of levees lining US floodplains [138], and many of these are in a questionable state of repair. Levees constrict channel discharge and increase stage within the river and are occasionally overtopped during floods. Allowing for river inundation behind levees is being increasingly recognized for flood mitigation [136,139].

2.3.7. Floodplain Row Crop Conversion

Floodplains are often cropped because the soils are rich in flood-deposited nutrients and subsurface moisture is plentiful. The financial risk to farmers is often limited because federal crop insurance provides protection against crop loss due to flooding. However, floodplain farming contributes to high nitrate concentrations in shallow groundwater following flood inundation [140]. Conversion of row croplands to perennial vegetation in floodplains adds surface roughness that reduces flood energy and stores water on the floodplain attenuating peak flows [141,142,143] and reduces nitrate loads [144,145,146].

2.4. GIS Analysis

The seven NI practices evaluated in this study have specific topography, land cover, soils, and other design criteria that were considered in locating their potential implementation across the MARB. Spatial datasets describing these criteria were processed to identify and quantify NI practice locations, and then summarized as raster output and ranked by quantile. A summary of key assumptions, data inputs, GIS processing steps, and outputs is provided in Table A1, in Appendix A.
Rasters describing potential NI practice suitability criteria with a spatial resolution of 10 m were used to quantify the total watershed area potentially impacted by an NI practice. Individual grid cells were summed for the various watershed size classes, including HUC4, HUC8, and HUC12 levels. In this paper, we present the summed NI practices (cell counts) at the HUC4 level but utilize the Iowa-Cedar HUC4 in eastern Iowa to show individual practice locations. Informally for this paper, we will refer to the HUC4 level comparisons as “basins” and the mapping conducted within a single HUC4 (the Iowa-Cedar) to be a “watershed.” It is important to stress that all the NI location data were granularly located at the 10-m scale so the grid data could be summed and analyzed at any spatial scale, ranging from <HUC12 to the MARB scale. A flow chart of the evaluation process is provided in Figure 2.
Output from the SWAT NAM system was utilized to assess risks from runoff and nitrate export at the HUC12 scale (Figure 2). We extracted values of mean annual surface runoff (mean surq) from the NAM output and considered this parameter (in mm yr−1) to reflect potential risks due to overland runoff from basin areas. It is important to note that surface runoff is not the same as total runoff (that would include tile flow and baseflow), but it is only that portion of streamflow that the NAM assigns to surface water runoff. Surface runoff is a function of the intensity and amount of rainfall and other landscape factors that influence runoff such as slope, soils, and land cover. Surface runoff output from the NAM SWAT system was thus an ideal method to integrate these factors across the MARB. Similarly, nitrate risks were identified in the MARB by extracting nitrate loss from the NAM system by the HUC12 watershed and summing nitrate loss (in kg ha−1) from surface runoff, lateral flow, tile drainage, and groundwater pathways. Using the NAM output to identify risks due to surface runoff (flooding) and nitrate loss provided a means to evaluate risk patterns across the MARB by HUC12 with a methodological approach widely recognized by the scientific modeling community.
The prioritization of NI practices to reduce flooding and nitrate export risks was assessed by overlapping a scored quintile ranking scale. For each NI practice at various HUC scales, the total number of grid cells for practice was summed and binned to determine the HUC ranking by quintile. Those basins and watersheds with a specific NI practice count in the uppermost 20% were given a value of 5 and those in the lowest 20% were given a value of 1 (quintile scores of 2, 3, and 4 in-between). Each of the 7 NI practices were scored for an individual basin or watershed and then summed to derive the combined NI score. Those with the highest NI practice scores had the greatest number of potential locations for all NI practices in the basin or watershed. Likewise, we utilized a quintile ranking scheme to classify HUCs according to their flooding and nitrate export risks. Ranking from 1 to 5, with 5 being associated with a basin or watershed with the highest risk, HUCs of various sizes were ranked for their individual and combined risks of flooding and nitrate export. A value of 10 would identify a basin that is among the highest 20% of basins with a flood risk (5 points) and nitrate export risk (also 5 points). NI practices are prioritized by combining the ranking scores of individual and total NI practices within a basin with the flooding and nitrate export risk scores. Spatially targeting the basins with the highest rankings of NI practices and combined flooding and nitrate risks will lead to the locations where we would expect to see the highest rates of flood mitigation and water quality improvements from NI practices (Figure 2).
Our analysis included the entire MARB at HUC4, HUC8 and HUC12 basin scales, but we highlight practices and prioritization in MARB at the HUC4 scale and in the specific Iowa-Cedar River HUC4 watershed in eastern Iowa to better visualize the spatial data and prioritization scheme.

3. Results

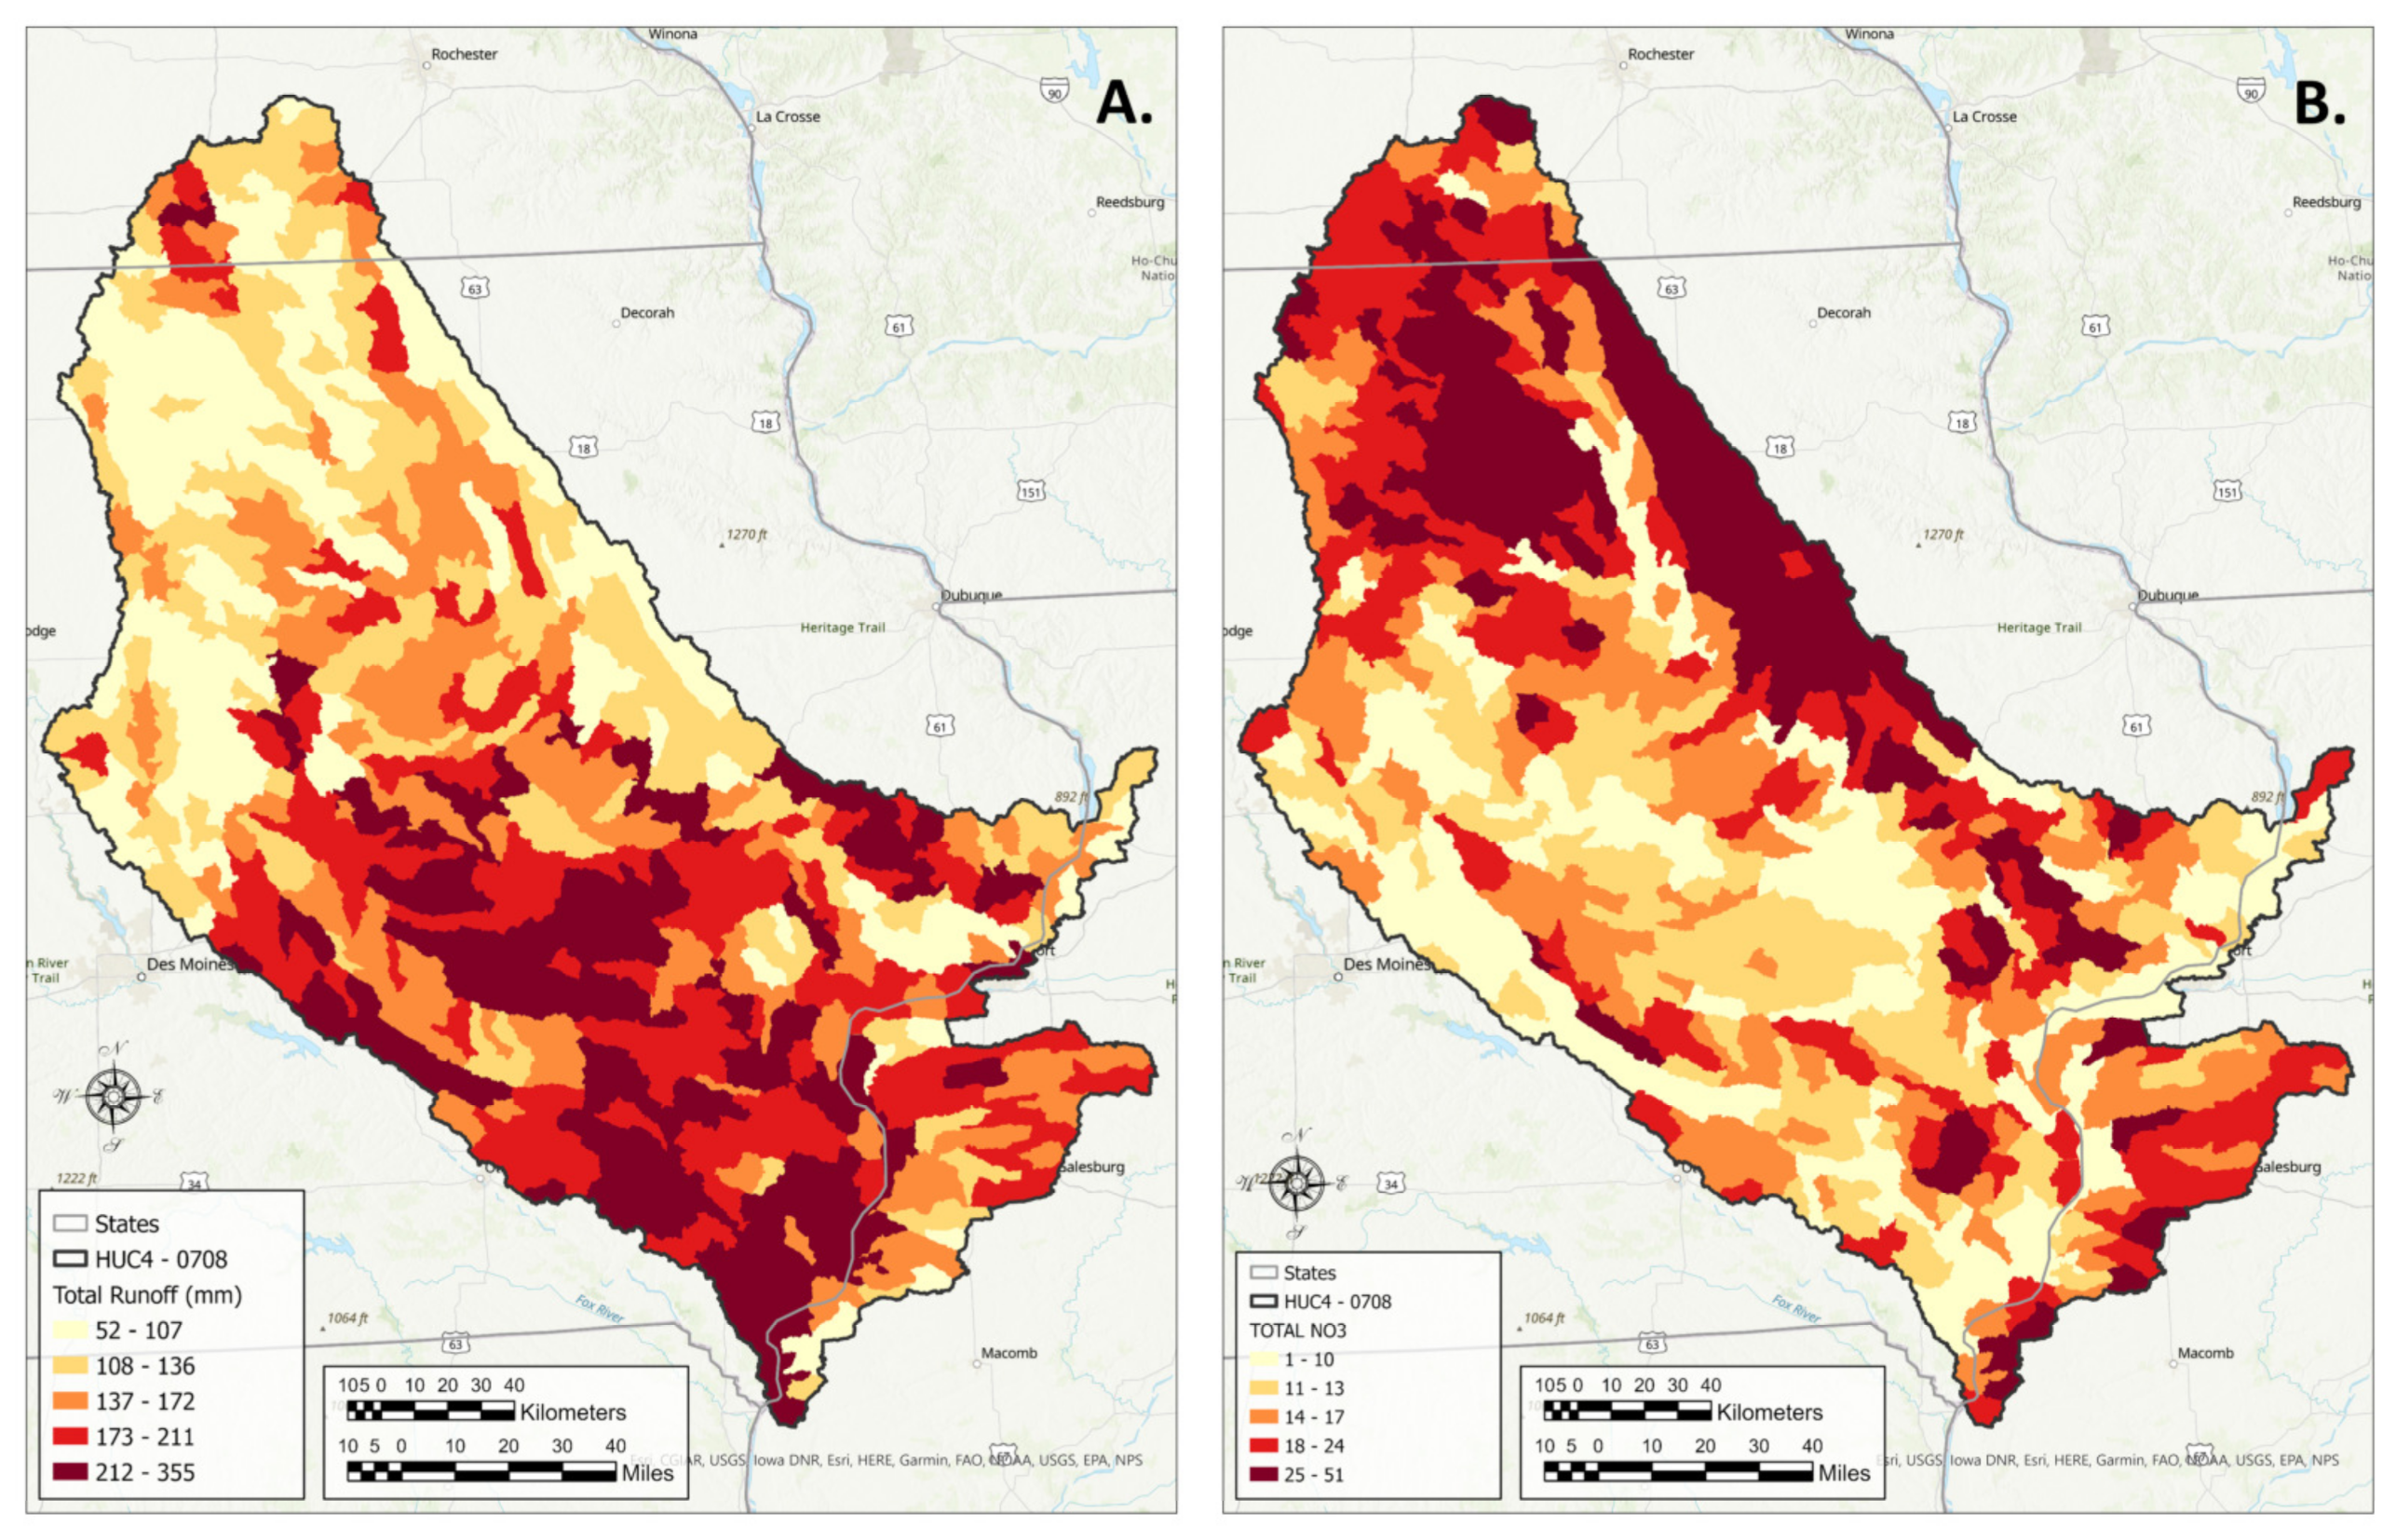
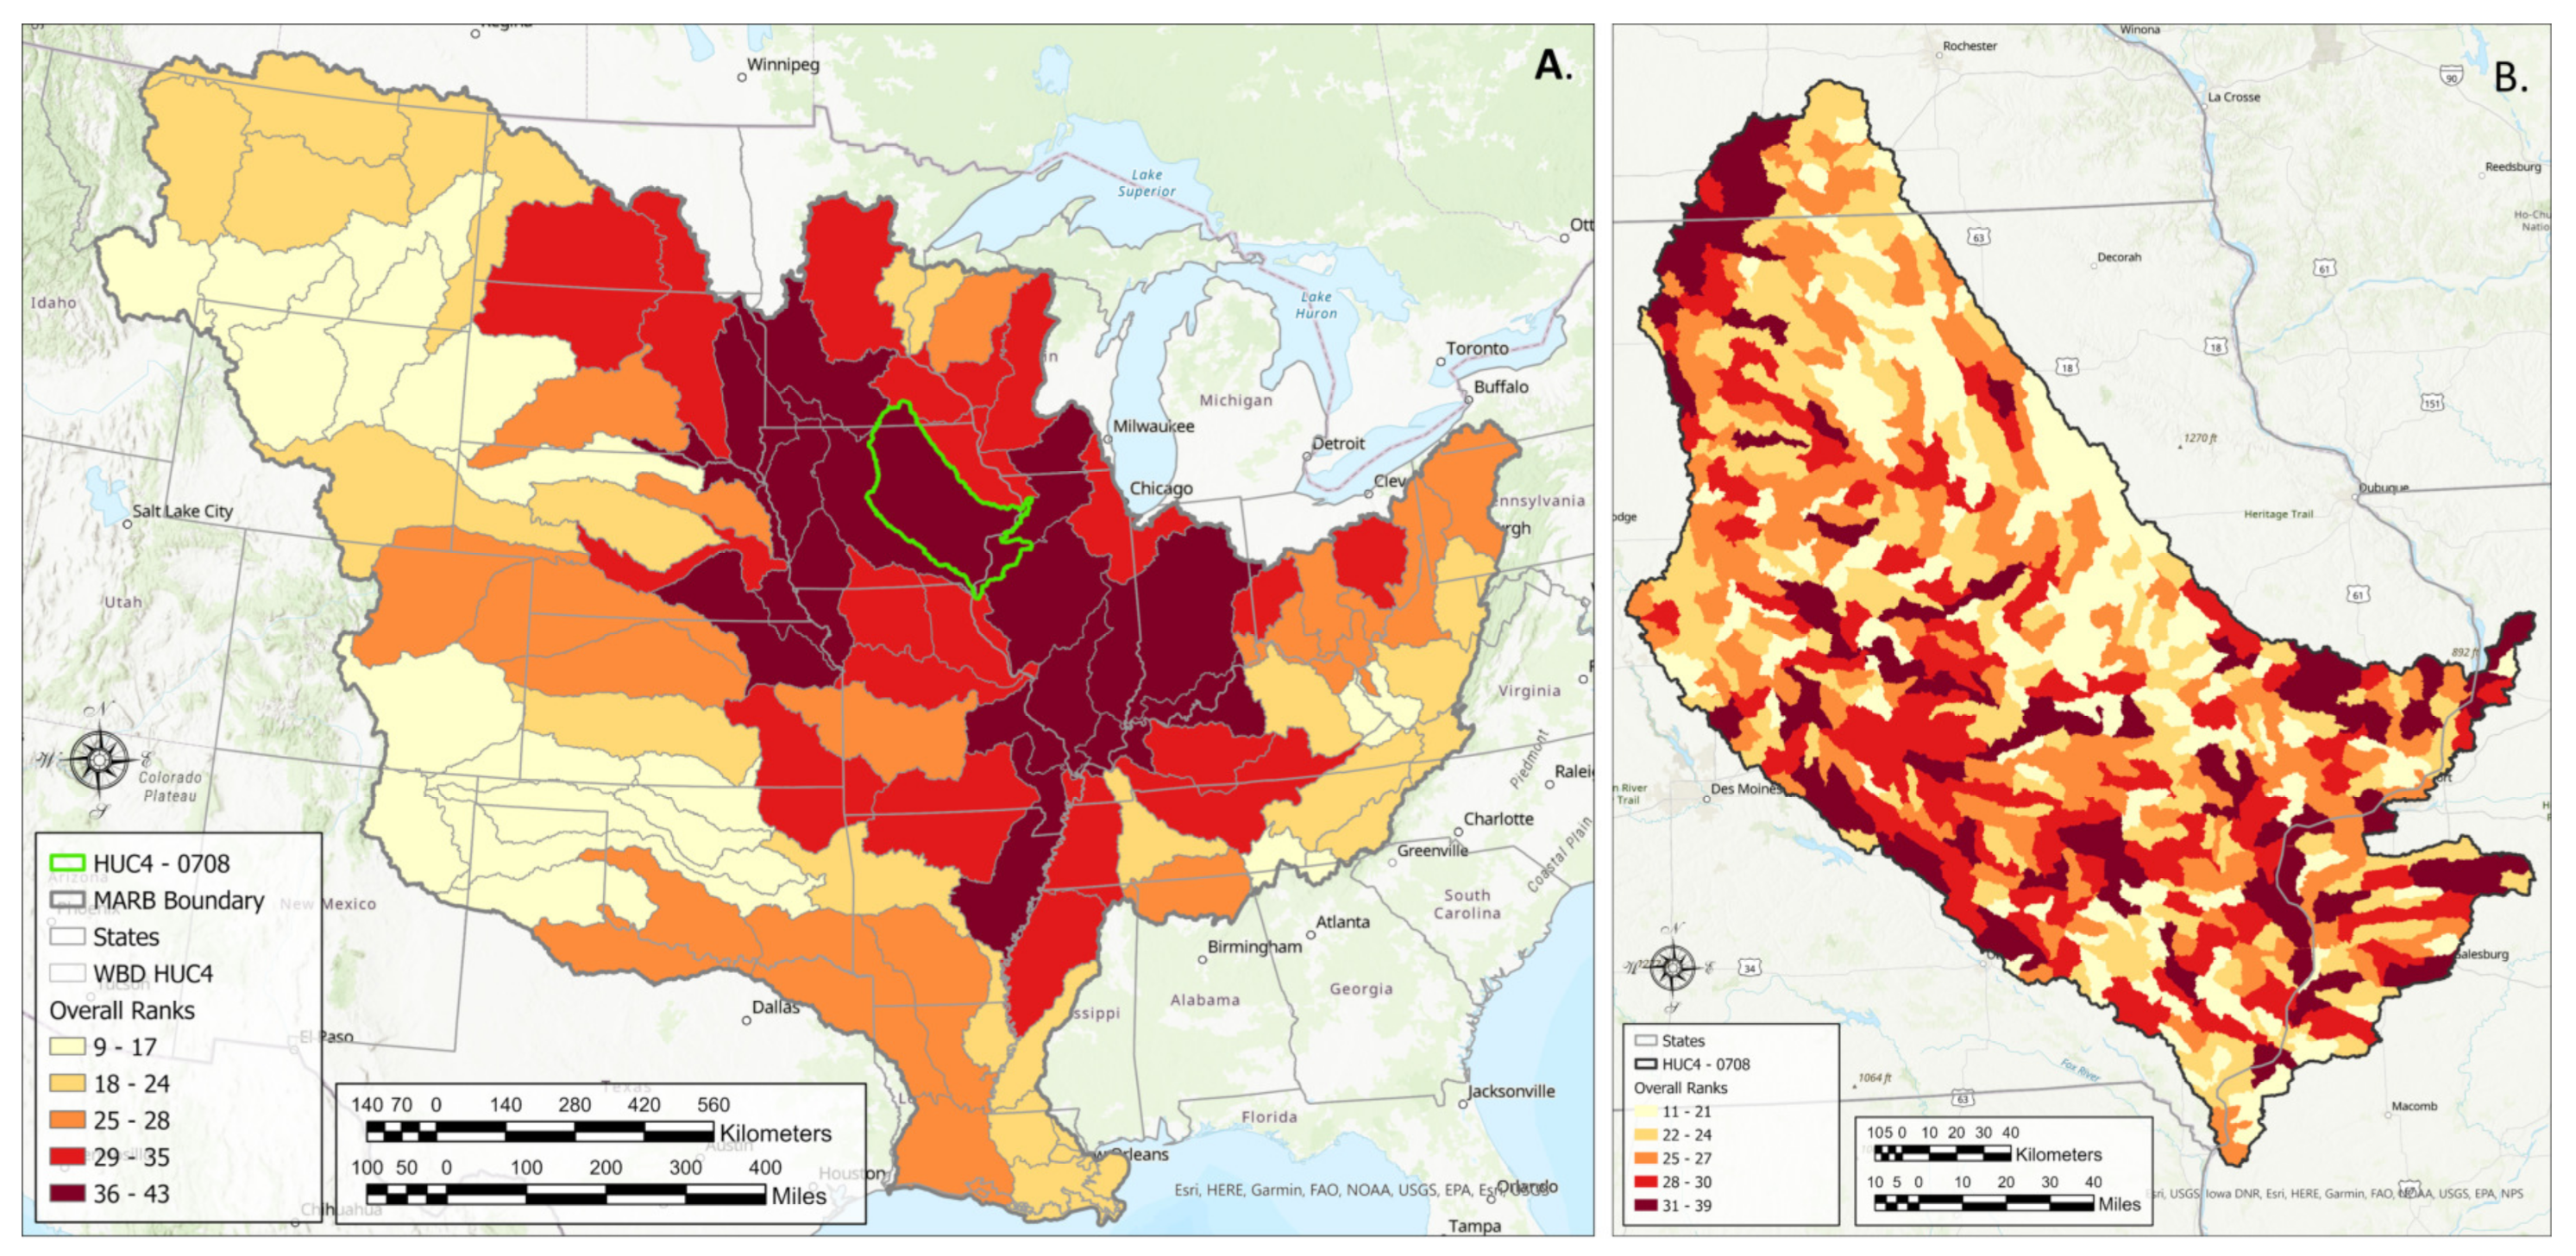
3.1. Flood and Nitrate Risk

Surface runoff in the MARB reflects an increasing precipitation gradient toward the southeast and mountainous regions that include the Appalachians, Rocky Mountains, and Central Uplift zone in southern Missouri and Arkansas (Figure 3A). Annual surface runoff exceeds 300 mm yr−1 throughout much of the region south along the Mississippi River and in the Mideast US. Surface runoff tends to increase with distance downstream in the Mississippi River, from the Indiana-Ohio region into Louisiana. For this analysis, we equate high surface runoff rates with increased flood risk with an understanding that economic damages from floods are often associated with land management practices, urban development, and floodplain infrastructure (Figure 3B). For example, the State of Iowa has a moderate surface runoff risk but is an epicenter for flood damages due to crop losses (Figure 3B). Hence, the surface runoff metric is a key indicator for identifying watershed areas where floods might originate but will not necessarily reflect where flood damages will be the greatest. This concept is consistent with a watershed systems approach to the assessment of hydrologic hazards [147].
Nitrate export in the MARB is concentrated in the Upper Mississippi River basin (Figure 3C) corresponding to land areas devoted to intense row crop cultivation (Figure 1B) and underlain by subsurface drainage tiles (Figure 1C). Nitrate loss from HUC12 basins in this area exceeds 15 kg ha−1, and in several basins exceeds 25 kg ha−1. Cropped areas in the Midwest with less intensive tile drainage typically have nitrate yields < 7.5 kg ha−1 whereas yields for most of the MARB are less than 2.5 kg ha−1 (Figure 3C).
The relative risks from surface runoff and nitrate export were ranked across HUC4 basins in the MARB and several basins in the central region of the US, including the states of Iowa, Illinois, and Indiana, have the highest combined flooding and nitrate risks (Figure 3D). We highlighted the Iowa-Cedar River HUC4 in eastern Iowa to show how these risks vary within HUC12s of a larger HUC4 basin (Figure 4). The total runoff was higher in HUC12 watersheds in the southeast portion of the basin where land slopes are steeper and there is more annual precipitation (Figure 4A). In contrast, nitrate yields are higher in the northern areas of the basin where the topography is flatter, tile drainage is prevalent and row crop intensity is greatest (Figure 4B). The diverging spatial patterns of flood (surface runoff) and nitrate risks within the same basin indicate that a diverse portfolio of NI practices should be considered to address their combined risks.

3.2. NI Practice Locations

At the scale of the MARB, it is not possible to show the locations of NI practices at a 10 m resolution, so we highlight the NI practice mapping for the Iowa-Cedar River basin (Figure 5). Consistent with the total runoff risk mapping, potential row crop conversion that is concentrated on land slopes >7% is primarily found in the southern portion of the Iowa-Cedar basin (Figure 5A). Since the siting criteria were similar, potential WASCOB locations are in the same area as land use change but since these were quantified using minimum watershed areas (20 ha), they are shown in Figure 5B based on their frequency of occurrence. The potential applicability of WASCOBs is focused largely in southeast Iowa.
Potential locations for depressional wetlands are primarily found in the northwest portion of the Iowa-Cedar basin where the basin headwater areas overlie the recently glaciated Des Moines Lobe region of Iowa (Figure 5C). The Des Moines Lobe is the southern extent of the Prairie Pothole Region and is dominantly flat with numerous land depressions that contained wetlands, kettle lakes, and ponds prior to settlement and drainage [94]. On the other hand, nitrate removal wetlands are not necessarily natural features and are typically sited based on topography, tile drainage intensity, and row crop area (Figure 5D). While there are numerous potential sites in the depressional wetland area (Figure 5C), the potential applicability of this practice extends to other regions of the Iowa-Cedar basin where siting criteria were met. In particular, potential nitrate removal wetland areas extend eastward into a region of Iowa particularly vulnerable to nitrate export.
Opportunities for riparian buffers line nearly every river and stream in the Iowa-Cedar basin (Figure 5E). Since many rivers and streams have some degree of natural buffering [104], potential locations of unbuffered segments at a 10 m mapping resolution are often closely intermingled with buffered segments at the scale of large river basins, such as the Iowa-Cedar basin. Because of this, the riparian practice is difficult to show in Figure 5E, but there is a high degree of confidence that opportunities for locating riparian buffers have been appropriately identified.
Potential locations for row crop conversion on floodplains are found throughout the basin (Figure 5F) but leveed areas are primarily concentrated along the Mississippi River and lower Iowa-Cedar River floodplains in southeast Iowa (Figure 5G). Other leveed areas are scattered along the major interior rivers protecting the larger urban areas of Cedar Rapids, Waterloo, and Marshalltown. However, most of the HUC12s within the Iowa-Cedar basin have little to no opportunities of expanding floodplain storage behind current levees.

3.3. Linking NI Practices to Flood and Nitrate Risks

We prioritized all 84 HUC4 basins within the MARB by combining the quintile ranking scheme for flooding and nitrate risks along with the quintile ranking of opportunities to implement NI practices (Figure 6A). Those basins among the uppermost 20% (combined score of >36) combine the greatest risks for flooding and nitrate export with the greatest potential for NI practice implementation. Hence, the highest-ranking basins are those where NI practices could be located for the greatest benefit. Many of these HUC4 basins are located in the Upper Mississippi and Ohio River basins (Figure 6A). The Wabash and Iowa-Cedar basins (HUCs 0512 and 0708, respectively) rank among the uppermost quintile for nearly all practices evaluated, indicating widespread opportunities for NI implementation (Table 1). In these two basins, the risks of flooding and N loss are in the uppermost 20% compared to other MARB HUC4 basins, and there are many opportunities to site the analyzed NI practices there to achieve flood and nitrate reductions. The exception is for levee reconnections; the implementation opportunity for this practice ranked lower in these two basins compared to other HUC4s.
Other basins within the Upper Mississippi River region, including the Big Sioux, Rock River, Lower Illinois, and Des Moines HUCs also rank very highly for NI practice implementation (Table 1). Prioritizing NI practices in these basins would also provide the greatest benefits. In contrast, there appears to be less NI practice potential in most of the western MARB basins and this coincides with lower flooding and nitrate loading risks.
Opportunities for prioritizing NI practices are better suited for HUC12 watersheds within a single HUC4 (Figure 6B). In the Iowa-Cedar basin there are 657 HUC12 watersheds (out of a total of 34,944 HUC12 watersheds within the MARB) and the NI practice best suited for various HUC12 conditions within the Iowa-Cedar basin varied considerably (Table 2). For example, within the Mockridge HUC12 (#070801030405) the greatest opportunities were associated with depressional wetlands and nitrate removal wetlands, whereas in another HUC12 with high flood and nitrate risks (Johnson Creek #070801010102) there was less potential for nitrate treatment wetlands (score of 2) but more potential for floodplain land use change (score of 5) (Table 1). In this assessment, the prioritization scheme based on relative rankings was not focused on the precise match of an NI practice to a watershed. Rather, the prioritization scheme included all the potential NI practices together to identify those HUC12s in the Iowa-Cedar basin where any combination of NI practices would have the most benefit for reducing combined flood and nitrate risks.

4. Discussion

In this analysis, our goal was not simply to identify locations where NI or other conservation practices could be located (i.e., [18,20]), but to identify locations where NI practices could potentially have the greatest benefits for reducing flooding and nitrate export risks. We did this by intersecting these risks with potential NI locations and found that a relative ranking centered on population quintile percentages could be used to prioritize basins from the HUC4 to HUC12 scale for risk reductions.
A priority scheme focused on identifying overlapping opportunities for flood and nitrate risk reductions using NI practices is needed to maximize the limited conservation funds available for interventions. Conservation adoption is often a function of awareness of practices and programs [148] and is considered by many to be “random acts of conservation” [149]. Improved spatial targeting is needed to inform the planning and implementation of conservation programs [149,150]. In contrast to other targeting strategies that singularly focus on flood (11, 12) or water quality risks (13, 14) or on identifying specific practice locations (20), our targeting approach includes quantification of the environmental risks and also NI solutions. For example, a state or regional entity wishing to wisely spend conservation funds could consult the maps and database from this project to identify which HUC12 watersheds have the greatest environmental risks and the greatest potential for NI practice implementation. The 10 m scale of NI locations evaluated in this study provides additional criteria to help prioritize which types of NI practices have the greatest potential for risk reduction.
However, our analysis has limitations that are acknowledged with an eye toward making future improvements. First, flooding (runoff) risks and nitrate loss were quantified at a HUC12 scale across the MARB with a national SWAT+ model (NAM) that is under development [96]. Building the NAM remains a work in progress and future refinements along with detailed model calibration and validation efforts are currently underway. For this study, we used the long-term average runoff and nitrate loss in a HUC12 to assess the relative risks across the MARB. Future integration of SWAT+ output into prioritization efforts could retain these model outputs, or perhaps focus on extracting peak flows by HUC12 (for flood risks) or identifying maximum river nitrate concentrations or loads. A major benefit of utilizing the NAM for risk identification is the ability to extract various model outputs for analysis.
Integrating the NAM into a continental prioritization scheme for NI practice placement should remain a priority if potential NI benefits are to be quantified. In our current study, we simply stacked NI practices on top of the modeled runoff and nitrate risks to identify the potential for co-benefits. If the effectiveness of single or multiple NI practices to reduce flood and nitrate risks is to be quantified, a calibrated and validated ecohydrological model such as the NAM will be needed to follow the water and route nutrient transport downstream from one watershed to another [150]. Furthermore, effectiveness varies at the scale of an individual practice [8], and accounting for this variability to estimate benefits can only be achieved with highly detailed spatial and temporal modeling. Hence, our study presented herein offers a first but coarse approach to linking flooding and water quality risks to NI practices.
The prioritization approach based on quintile ranks could be improved with a more sophisticated accounting of NI practices. The seven NI practices considered were all located and quantified at the scale of a 10 m grid cell and this spatial resolution could be better incorporated into a prioritization scheme if desired. However, since the risks were evaluated at the HUC12 scale, there was a need to keep the NI practice quantification at a consistent spatial scale. For this reason, we summed by area and binned the NI practices to quantiles by HUC12, but there are other options to prioritize NI practices based on other criteria. For example, the spatial locations of potential NI practices delineated at the 10 m scale could be used to guide the placement of NI practices across the entire MARB. Similar to other conservation targeting strategies (e.g., Tomer et al. [20]), the results from our study can be used for locating potential NI practice placements at various watershed scales for conservation professionals.

5. Conclusions

Abundant research has shown that natural infrastructure practices have the ability to reduce risks from flooding and poor water quality but rarely have a suite of NI practices been assessed at larger watershed scales for reducing their combined risks. In this study, we intersected watershed-scale risks to flooding and nitrate export in the MARB with potential locations of various NI practices to prioritize where NI interventions can be most effective for combined risk reduction at watershed scales in the MARB. A prioritization scheme demonstrated at a basin-wide HUC4 scale and highlighted at a smaller HUC12 watershed scale demonstrated that basins could be triaged to determine the optimal watersheds for deploying NI practices to minimize flooding and water quality risks. Through the use of output from a national SWAT model to identify runoff and nitrate risks, and combining this with high spatial resolution GIS modeling of NI practice locations, we qualitatively ranked watersheds ranging from HUC4 to HUC12 sizes in the MARB on the potential for seven different NI practices to reduce these risks. Policymakers could use maps of the type developed in this study to identify watersheds that are the best candidates for the use of NI to reduce flood risk and water quality. Overall, despite challenges and limitations, we believe that results from this study should be considered a launching point from which to improve the connections between watershed scale risks and the potential use of NI practices to reduce these risks. In the future, more sophisticated watershed-scale modeling will be needed to improve the quantification of benefits at various watershed scales in the MARB.

Author Contributions

K.E.S.: Conceptualization, Methodology, Writing—original draft, Supervision, Project administration. J.M.: Methodology, Software, Validation, Formal analysis, Investigation, Data curation, Writing—review and editing, Visualization. K.M.S.: Conceptualization, Writing—review, and editing. E.L.M.: Conceptualization, Writing—review, and editing, Funding acquisition. P.W.G.: Methodology, Writing—review, and editing. M.J.W.: Methodology, Resources, Writing—review, and editing. J.G.A.: Methodology, Resources, Writing—review, and editing. All authors have read and agreed to the published version of the manuscript.

Funding

This research was partially funded by Environmental Defense Fund members and donors and by the National Science Foundation initiative, “An Integrated Big Data Framework for Water Quality Issues in the Upper Mississippi River Basin” Award No. 1761772.

Data Availability Statement

The data presented in this study are available on request from the corresponding author.

Acknowledgments

We appreciate the efforts of the three anonymous reviewers whose constructive criticism greatly improved the manuscript. Special thanks to Annie McElvein for helping with journal formatting. USDA is an equal opportunity provider and employer.

Conflicts of Interest

E.L.M. and K.M.S., who are employed by Environmental Defense Fund, were involved in the design of the study, in the interpretation of data, in the writing of the manuscript, and in the decision to publish the results.

Appendix A

Table A1. Input data, GIS processing steps, and output for locating NI practices in the MARB.
NI PracticeKey
Assumptions
Input
Datasets
GIS Processing StepsOutput
Row crop replacement on high slopes (7%+)Land use change for flooding and nitrate reductions will be more acceptable to producers if focused exclusively on steeply sloping soils.10 m raster slope data from high-resolution NHD;
Cropland data layer (CDL)—Cropscape—30 m raster;
HUC4, HUC8, HUC12 polygons.
  • Resampled CDL to 10 m for common cell size;
  • Reclassified CDL into row crops vs non-row crops;
  • Classified slope raster into 0–2%, 2–7%, and 7+% slope;
  • Reclassified each raster into prime number unique classes;
  • Used map algebra to multiply row crop raster vs slope class raster;
  • Selected rows of crops on 7%+ slopes.
10 m raster of row crops on high slopes.
WASCOBsWASCOBs will be installed in catchments of over 20 ha in size.Row crop on high slopes raster from previous analysis;
HUC4, HUC8, HUC12 polygons.
  • Row crop raster converted to polygons classified as non-row crop and row crops on high slopes;
  • Polygons 20 ha and over-selected and exported to new vector dataset;
  • Spatial join between HUC12 polygons and row crop polygons
  • Acres of potential WASCOBs calculated and summed per HUC12 polygon;
Polygons of potential WASCOB locations;
 
Total number of potential WASCOBs sites per HUC12.
Depressional wetlandsDepressional wetlands can be identified by topography and hydric soils.Sinks raster from high-resolution NHD with 10 m resolution;
SSURGO polygon data;
HUC4, HUC8, HUC12 polygons.
  • Depressions across landscape classified into 2 classes: depression absent and depression present;
  • SSURGO data classified into 2 classes: areas with less than 60% hydric soils and greater than or equal to 60% hydric soils;
  • SSURGO polygons rasterized into 10 m raster;
  • Map algebra used to determine depressions with predominantly hydric soils.
10 m raster of depressional wetland areas.
Nitrate removal wetlandsNitrate removal wetlands should be located to intercept tile drainage. Locations are determined by intersecting row croplands, tile drainage, and hydric soils.Reclassed and resampled row crop from previous NI practice—10 m raster;
Agricultural tile dataset reclassed and resampled to 10 m tiled and non-tiled cells;
 
Hydric soils raster from depressional wetlands analysis—10 m raster;
HUC4, HUC8, HUC12 polygons.
  • Map algebra multiplication of hydric soils, agricultural tiles, and row crops produces a raster with 8 combinations;
  • Potential CREP wetlands are in combination with the highest resulting number.
10 m raster with cells satisfying the highest class from map algebra.
Riparian buffersRiparian buffers of perennial vegetation replace row crops that are present in the riparian corridor along streams.NHDArea Polygons;
NHD Flowline;
HUC4, HUC8, HUC12 polygons.
  • Selected and buffered NHDArea polygons corresponding to stream/river, channel/ditch, and inundation area classes;
  • Buffered flowline data;
  • Merged resulting polygons into 2 classes: non-riparian zone and riparian zone.
Polygon features that were rasterized to 10 m cells.
Leveed areasFloodplain area behind river levees can be used for flood storage and N reductions.CDL raster—resampled to 10 m, reclassed to 1 class consisting of all land uses;
Corp of Engineers levee database—protected area polygons;
HUC4, HUC8, HUC12 polygons.
  • Reclassified as cells with land use to include as a single class;
  • Computed geometric intersection between HUC12 geometries and levee-protected area polygons;
  • Spatially joined HUC12 ids associated with the split polygons in the last step;
  • The used zonal histogram on levee-protected polygons by HUC12 to sum cells.
10 m raster of land area behind levees.
Floodplain Row Crop ConversionConverting row-cropped lands on floodplains to perennial vegetation allows these areas to store floodwater and reduce N export.CDL raster—resampled to 10 m, reclassed to row crop and non-row crop;
100-year Floodplain raster from Samela et al. (2017);
HUC4, HUC8, HUC12 polygons.
  • Resampled cropscape CDL raster to 10 m cells;
  • Reclassified raster into row crop and non-row crop classes;
  • Selected HUC12 geometries by HUC4 polygons iteratively;
  • Computed zonal histogram for each HUC12 with each HUC4.
10 m raster of row crops located on floodplains.

References

  1. Flooding Could Worsen Impacts of COVID-19 and Other Infectious Diseases. Available online: https://www.wri.org/news/release-new-data-shows-millions-people-trillions-property-risk-flooding-infrastructure (accessed on 6 November 2022).
  2. Mateo-Sagasta, J.; Zadeh, S.M.; Turral, H. More People, More Food, Worse Water? A Global Review of Water Pollution from Agriculture; Food and Agriculture Organization of the United Nations: Rome, Italy; Food and Agriculture Organization of the United Nations (FAO): Rome, Italy; International Water Management Institute: Rome, Italy, 2018; ISBN 978-92-5-130729-8. [Google Scholar]
  3. Davenport, F.V.; Burke, M.; Diffenbaugh, N.S. Contribution of Historical Precipitation Change to US Flood Damages. Proc. Natl. Acad. Sci. USA 2021, 118, e2017524118. [Google Scholar] [CrossRef] [PubMed]
  4. Kelly, S.A.; Takbiri, Z.; Belmont, P.; Foufoula-Georgiou, E. Human Amplified Changes in Precipitation–Runoff Patterns in Large River Basins of the Midwestern United States. Hydrol. Earth Syst. Sci. 2017, 21, 5065–5088. [Google Scholar] [CrossRef] [Green Version]
  5. Committee to Review the New York City Watershed Protection Program; Water Science and Technology Board; Division on Earth and Life Studies; National Academies of Sciences, Engineering, and Medicine. Review of the New York City Watershed Protection Program; National Academies Press: Washington, DC, USA, 2020; p. 25851. ISBN 978-0-309-67967-1. [Google Scholar]
  6. Barrett, J. As Mississippi River Flooding Gets Worse, 100 Mayors Try a New Fix. Available online: https://www.wsj.com/articles/as-mississippi-river-flooding-gets-worse-100-mayors-try-a-new-fix-11633512602 (accessed on 6 November 2022).
  7. Flesher, J. Battered by Floods, U.S. River Communities Try New Remedies. Available online: https://apnews.com/article/tn-state-wire-nd-state-wire-mo-state-wire-michael-brown-ar-state-wire-aa5812a166b36687af3a4d0fc2a292b8 (accessed on 8 November 2022).
  8. Suttles, K.M.; Eagle, A.J.; McLellan, E.L. Upstream Solutions to Downstream Problems: Investing in Rural Natural Infrastructure for Water Quality Improvement and Flood Risk Mitigation. Water 2021, 13, 3579. [Google Scholar] [CrossRef]
  9. McLellan, E.L.; Schilling, K.E.; Wolter, C.F.; Tomer, M.D.; Porter, S.A.; Magner, J.A.; Smith, D.R.; Prokopy, L.S. Right Practice, Right Place: A Conservation Planning Toolbox for Meeting Water Quality Goals in the Corn Belt. J. Soil Water Conserv. 2018, 73, 29A–34A. [Google Scholar] [CrossRef] [Green Version]
  10. Schilling, K.E.; Gassman, P.W.; Kling, C.L.; Campbell, T.; Jha, M.K.; Wolter, C.F.; Arnold, J.G. The Potential for Agricultural Land Use Change to Reduce Flood Risk in a Large Watershed: Land Use Change and Flooding. Hydrol. Process. 2014, 28, 3314–3325. [Google Scholar] [CrossRef]
  11. Kousky, C.; Walls, M. Floodplain Conservation as a Flood Mitigation Strategy: Examining Costs and Benefits. Ecol. Econ. 2014, 104, 119–128. [Google Scholar] [CrossRef]
  12. Kousky, C.; Olmstead, S.M.; Walls, M.A.; Macauley, M. Strategically Placing Green Infrastructure: Cost-Effective Land Conservation in the Floodplain. Environ. Sci. Technol. 2013, 47, 3563–3570. [Google Scholar] [CrossRef]
  13. Liu, Y.; Engel, B.A.; Collingsworth, P.D.; Pijanowski, B.C. Optimal Implementation of Green Infrastructure Practices to Minimize Influences of Land Use Change and Climate Change on Hydrology and Water Quality: Case Study in Spy Run Creek Watershed, Indiana. Sci. Total Environ. 2017, 601–602, 1400–1411. [Google Scholar] [CrossRef]
  14. Liu, Y.; Theller, L.O.; Pijanowski, B.C.; Engel, B.A. Optimal Selection and Placement of Green Infrastructure to Reduce Impacts of Land Use Change and Climate Change on Hydrology and Water Quality: An Application to the Trail Creek Watershed, Indiana. Sci. Total Environ. 2016, 553, 149–163. [Google Scholar] [CrossRef]
  15. Meerow, S.; Newell, J.P. Spatial Planning for Multifunctional Green Infrastructure: Growing Resilience in Detroit. Landsc. Urban Plan. 2017, 159, 62–75. [Google Scholar] [CrossRef]
  16. Alves, A.; Gersonius, B.; Sanchez, A.; Vojinovic, Z.; Kapelan, Z. Multi-Criteria Approach for Selection of Green and Grey Infrastructure to Reduce Flood Risk and Increase CO-Benefits. Water Resour. Manag. 2018, 32, 2505–2522. [Google Scholar] [CrossRef]
  17. Gourevitch, J.D.; Singh, N.K.; Minot, J.; Raub, K.B.; Rizzo, D.M.; Wemple, B.C.; Ricketts, T.H. Spatial Targeting of Floodplain Restoration to Equitably Mitigate Flood Risk. Glob. Environ. Chang. 2020, 61, 102050. [Google Scholar] [CrossRef]
  18. Babbar-Sebens, M.; Barr, R.C.; Tedesco, L.P.; Anderson, M. Spatial Identification and Optimization of Upland Wetlands in Agricultural Watersheds. Ecol. Eng. 2013, 52, 130–142. [Google Scholar] [CrossRef]
  19. Antolini, F.; Tate, E. Location Matters: A Framework to Investigate the Spatial Characteristics of Distributed Flood Attenuation. Water 2021, 13, 2706. [Google Scholar] [CrossRef]
  20. Tomer, M.D.; Porter, S.A.; Boomer, K.M.B.; James, D.E.; Kostel, J.A.; Helmers, M.J.; Isenhart, T.M.; McLellan, E. Agricultural Conservation Planning Framework: 1. Developing Multipractice Watershed Planning Scenarios and Assessing Nutrient Reduction Potential. J. Environ. Qual. 2015, 44, 754–767. [Google Scholar] [CrossRef] [Green Version]
  21. Zimmerman, E.K.; Tyndall, J.C.; Schulte, L.A. Using Spatially Targeted Conservation to Evaluate Nitrogen Reduction and Economic Opportunities for Best Management Practice Placement in Agricultural Landscapes. Environ. Manag. 2019, 64, 313–328. [Google Scholar] [CrossRef]
  22. Kalcic, M.M.; Frankenberger, J.; Chaubey, I. Spatial Optimization of Six Conservation Practices Using Swat in Tile-Drained Agricultural Watersheds. JAWRA J. Am. Water Resour. Assoc. 2015, 51, 956–972. [Google Scholar] [CrossRef] [Green Version]
  23. Gaddis, E.J.B.; Voinov, A.; Seppelt, R.; Rizzo, D.M. Spatial Optimization of Best Management Practices to Attain Water Quality Targets. Water Resour. Manag. 2014, 28, 1485–1499. [Google Scholar] [CrossRef]
  24. Roy, E.D.; Hammond Wagner, C.R.; Niles, M.T. Hot Spots of Opportunity for Improved Cropland Nitrogen Management across the United States. Environ. Res. Lett. 2021, 16, 035004. [Google Scholar] [CrossRef]
  25. Zhang, J.; Lu, C.; Crumpton, W.; Jones, C.; Tian, H.; Villarini, G.; Schilling, K.; Green, D. Heavy Precipitation Impacts on Nitrogen Loading to the Gulf of Mexico in the 21st Century: Model Projections Under Future Climate Scenarios. Earths Future 2022, 10, e2021EF002141. [Google Scholar] [CrossRef]
  26. Pinter, N.; Jemberie, A.A.; Remo, J.W.; Heine, R.A.; Ickes, B.S. Flood trends and river engineering on the Mississippi River system. Geophys. Res. Lett. 2008, 35, 2008GL035987. [Google Scholar] [CrossRef]
  27. Cusick, D. Today’s Floods Occur along “a Very Different” Mississippi. Available online: https://www.eenews.net/stories/1060322715 (accessed on 6 November 2022).
  28. Crawford, J.T.; Stets, E.G.; Sprague, L.A. Network Controls on Mean and Variance of Nitrate Loads from the Mississippi River to the Gulf of Mexico. J. Environ. Qual. 2019, 48, 1789–1799. [Google Scholar] [CrossRef] [Green Version]
  29. Rabalais, N.N.; Turner, R.E.; Wiseman, W.J., Jr. Hypoxia in the Gulf of Mexico. J. Environ. Qual. 2001, 30, 320–329. [Google Scholar] [CrossRef] [PubMed]
  30. Criss, R.E.; Shock, E.L. Flood enhancement through flood control. Geology 2001, 29, 875–878. [Google Scholar] [CrossRef]
  31. Walker, N.D.; Rouse, L.J.; Fargion, G.S.; Biggs, D.C. The Great Flood of Summer 1993: Mississippi River Discharge Studied. Eos Trans. Am. Geophys. Union 1994, 75, 409. [Google Scholar] [CrossRef]
  32. Rabalais, N.N.; Turner, R.E. Gulf of Mexico Hypoxia: Past, Present, and Future. Limnol. Oceanogr. Bull. 2019, 28, 117–124. [Google Scholar] [CrossRef] [Green Version]
  33. McIsaac, G.F.; David, M.B.; Gertner, G.Z.; Goolsby, D.A. Nitrate flux in the Mississippi River. Nature 2001, 414, 166–167. [Google Scholar] [CrossRef]
  34. Justić, D.; Rabalais, N.N.; Turner, R.E. Modeling the Impacts of Decadal Changes in Riverine Nutrient Fluxes on Coastal Eutrophication near the Mississippi River Delta. Ecol. Model. 2002, 152, 33–46. [Google Scholar] [CrossRef]
  35. Kanwar, R.S.; Johnson, H.P.; Schult, D.; Fenton, T.E.; Hickman, R.D. Drainage Needs and Returns in North-Central Iowa. Trans. ASABE 1983, 26, 457–464. [Google Scholar] [CrossRef]
  36. Jaynes, D.B.; Colvin, T.S.; Karlen, D.L.; Cambardella, C.A.; Meek, D.W. Nitrate Loss in Subsurface Drainage as Affected by Nitrogen Fertilizer Rate. J. Environ. Qual. 2001, 30, 1305–1314. [Google Scholar] [CrossRef]
  37. David, M.B.; Gentry, L.E. Anthropogenic Inputs of Nitrogen and Phosphorus and Riverine Export for Illinois, USA. J. Environ. Qual. 2000, 29, 494–508. [Google Scholar] [CrossRef]
  38. Schilling, K.E.; Jones, C.S.; Seeman, A.; Bader, E.; Filipiak, J. Nitrate-Nitrogen Patterns in Engineered Catchments in the Upper Mississippi River Basin. Ecol. Eng. 2012, 42, 1–9. [Google Scholar] [CrossRef]
  39. Gonzalez, M.; Kuzma, S. Nature-Based Flood Mitigation Can Help Mississippi River Farmers; World Resources Institute: Washington, DC, USA, 2020; Available online: https://www.wri.org/insights/nature-based-flood-mitigation-can-help-mississippi-river-farmers (accessed on 6 November 2022).
  40. Newman, J.; Rigdon, R.; McGroarty, P.; Paige, T. The World’s Appetite Is Threatening the Mississippi River: Pollutants from Booming Farms Combined with Record Wet Weather Are Contaminating the Nation’s Mightiest Waterway. In Wall Street Journal; Dow Jones & Company, Inc.: New York, NY, USA, 2019; Available online: http://graphics.wsj.com/mississippi/ (accessed on 13 January 2023).
  41. Mcdonald, M. River at Risk: The Mississippi. Environment Program; Walton Family Foundation: Bentonville, AR, USA, 2017; Available online: https://www.waltonfamilyfoundation.org/stories/k-12-education/river-at-risk-the-mississippi (accessed on 6 November 2022).
  42. Changnon, S. The Historical struggle with floods on the Mississippi River Basin: Impacts of recent floods and lessons for future flood management and policy. Water Int. 1998, 23, 263–271. [Google Scholar] [CrossRef]
  43. Rogers, J.D. Development of the New Orleans flood protection system prior to Hurricane Katrina. J. Geotech. Geoenv. Eng. 2008, 134, 602–617. [Google Scholar] [CrossRef]
  44. Criss, R.E.; Luo, M. Increasing risk and uncertainty of flooding in the Mississippi River Basin. Hydrol. Process. 2017, 31, 1283–1292. [Google Scholar] [CrossRef]
  45. Noble, C.C. The Mississippi River Flood of 1973. In Geomorphology and Engineering: Binghamton Geomorphology Symposium 7; Coates, D.R., Ed.; Taylor & Francis Group: London, UK, 1976. [Google Scholar] [CrossRef]
  46. Barry, J.M. Rising Tide: The Great Mississippi Flood of 1927 and How It Changed America; Simon & Schuster: New York, NY, USA, 1997; p. 524. [Google Scholar]
  47. Pitlick, J. A regional perspective of the hydrology of the 1993 Mississippi River Basin Floods. Ann. Assoc. Am. Geog. 1997, 87, 135–151. [Google Scholar] [CrossRef]
  48. Alexander, J.S.; Wilson, R.C.; Green, W.R. A Brief History and Summary of the Effects of River Engineering and Dams on the Mississippi River System and Delta; Circular 1375; U.S. Geological Survey: Reston, VA, USA; U.S. Department of the Interior: Washington, DC, USA, 2012. Available online: https://pubs.usgs.gov/circ/1375/ (accessed on 6 November 2022).
  49. Almukhtar, S.; Migliozzi, B.; Schwartz, J.; Williams, J. The Great Flood of 2019: A Complete Picture of a Slow-Motion Disaster; The New York Times: New York, NY, USA, 2019; Available online: https://www.nytimes.com/interactive/2019/09/11/us/midwest-flooding.html (accessed on 6 November 2022).
  50. Renfro, A. 5 Reasons Why 2019’s Mississippi River Flood Is the Most Unprecedented of Our Time; Delta Dispatches, Restore the Mississippi River Delta: New Orleans, LA, USA, 2019; Available online: https://mississippiriverdelta.org/5-reasons-why-2019s-mississippi-river-flood-is-the-most-unprecedented-of-our-time/ (accessed on 6 November 2022).
  51. Munoz, S.E.; Giosan, L.; Therrell, M.D.; Remo, J.W.F.; Shen, Z.; Sullivan, R.M.; Wiman, C.; O’Donnell, M.; Donnelly, J.P. Climatic control of Mississippi River flood hazard amplified by river engineering. Nature 2018, 556, 95–98. [Google Scholar] [CrossRef]
  52. NRC. Mississippi River Water Quality and the Clean Water Act: Progress, Challenges, and Opportunities; Committee on the Mississippi River and the Clean Water Act, National Research Council (NRC): Washington, DC, USA, 2008; p. 252. Available online: www.nap.edu/catalog/12051/mississippi-river-water-quality-and-the-clean-water-act-progress (accessed on 6 November 2022).
  53. Sprague, L.A.; Hirsch, R.M.; Aulenbach, B.T. Nitrate in the Mississippi River and Its Tributaries, 1980 to 2008: Are We Making Progress? Environ. Sci. Technol. 2011, 45, 7209–7216. [Google Scholar] [CrossRef]
  54. Jones, C.S.; Nielsen, J.K.; Schilling, K.E.; Weber, L.J. Iowa stream nitrate and the Gulf of Mexico. PLoS ONE 2018, 13, e0195930. [Google Scholar] [CrossRef] [PubMed]
  55. Schilling, K.E.; Streeter, M.T.; Seeman, A.; Jones, C.S.; Wolter, C.F. Total phosphorus export from Iowa agricultural watersheds: Quantifying the scope and scale of a regional condition. J. Hydrol. 2020, 581, 124397. [Google Scholar] [CrossRef]
  56. David, M.B.; Drinkwater, L.E.; McIsaac, G.F. Sources of nitrate yields in the Mississippi River Basin. J. Environ. Qual. 2010, 39, 1657–1667. [Google Scholar] [CrossRef] [PubMed] [Green Version]
  57. Tian, H.; Xu, R.; Pan, S.; Yao, Y.; Bian, Z.; Cai, W.-J.; Hopkinson, C.S.; Justic, D.; Lohrenz, S.; Lu, C.; et al. Long-term trajectory of nitrogen loading and delivery from Mississippi River Basin to the Gulf of Mexico. Glob. Biogeo. Cyc. 2020, 34, e2019GB006475. [Google Scholar] [CrossRef]
  58. Donner, S.; Scavia, D. How climate controls the flux of nitrogen by the Mississippi River and the development of hypoxia in the Gulf of Mexico. Limnol. Ocean. 2007, 52, 856–861. [Google Scholar] [CrossRef] [Green Version]
  59. Rabotyagov, S.S.; Campbell, T.D.; White, M.; Arnold, J.G.; Atwood, J.; Norfleet, M.L.; Kling, C.L.; Gassman, P.W.; Valcu, A.; Richardson, J.; et al. Cost-effective targeting of conservation investments to reduce the northern Gulf of Mexico hypoxic zone. Proc. Natl. Acad. Sci. USA 2014, 111, 18530–18535. [Google Scholar] [CrossRef] [Green Version]
  60. Rabalais, N.N.; Turner, R.E.; Sen Gupta, B.K.; Boesch, D.F.; Chapman, P.; Murrell, M.C. Hypoxia in the northern Gulf of Mexico: Does the science support the plan to reduce, mitigate, and control hypoxia? Estuar. Coast. 2007, 30, 753–772. [Google Scholar] [CrossRef]
  61. Arnold, J.G.; Srinivasan, R.; Muttiah, R.S.; Williams, J.R. Large Area Hydrologic Modeling and Assessment Part I: Model Development. J. Am. Water Resour. Assoc. 1998, 34, 73–89. [Google Scholar] [CrossRef]
  62. Arnold, J.G.; Moriasi, D.N.; Gassman, P.W.; Abbaspour, K.C.; White, M.J.; Srinivasan, R.; Santhi, C.; Harmel, R.D.; van Griensven, A.; van Liew, M.W.; et al. SWAT: Model Use, Calibration, and Validation. Trans. ASABE 2012, 55, 1491–1508. [Google Scholar] [CrossRef]
  63. Williams, J.R.; Arnold, J.G.; Kiniry, J.R.; Gassman, P.W.; Green, C.H. History of Model Development at Temple, Texas. Hydrol. Sci. J. 2008, 53, 948–960. [Google Scholar] [CrossRef] [Green Version]
  64. Bieger, K.; Arnold, J.G.; Rathjens, H.; White, M.J.; Bosch, D.D.; Allen, P.M.; Volk, M.; Srinivasan, R. Introduction to SWAT+, A Completely Restructured Version of the Soil and Water Assessment Tool. JAWRA J. Am. Water Resour. Assoc. 2017, 53, 115–130. [Google Scholar] [CrossRef]
  65. Gassman, P.W.; Yingkuan, W. IJABE SWAT Special Issue: Innovative Modeling Solutions for Water Resource Problems. Int. J. Agric. Biol. Eng. 2015, 8, 1–8. [Google Scholar] [CrossRef]
  66. CARD SWAT Literature Database for Peer-Reviewed Journal Articles. Available online: https://www.card.iastate.edu/swat_articles/ (accessed on 22 November 2022).
  67. Gassman, P.W.; Reyes, M.R.; Green, C.H.; Arnold, J.G. The Soil and Water Assessment Tool: Historical Development, Applications, and Future Research Directions. Trans. ASABE 2007, 50, 1211–1250. [Google Scholar] [CrossRef] [Green Version]
  68. Gassman, P.W.; Sadeghi, A.M.; Srinivasan, R. Applications of the SWAT Model Special Section: Overview and Insights. J. Environ. Qual. 2014, 43, 1–8. [Google Scholar] [CrossRef] [PubMed]
  69. Gassman, P.W.; Jeong, J.; Boulange, J.; Narasimhan, B.; Kato, T.; Somura, H.; Watanabe, H.; Eguchi, S.; Cui, Y.; Sakaguchi, A.; et al. Simulation of Rice Paddy Systems in SWAT: A Review of Previous Applications and Proposed SWAT+ Rice Paddy Module. Int. J. Agric. Biol. Eng. 2022, 15, 1–24. [Google Scholar] [CrossRef]
  70. Bressiani, D.d.A.; Gassman, P.W.; Fernandes, J.G.; Garbossa, L.H.P.; Srinivasan, R.; Bonumá, N.B.; Mendiondo, E.M. Review of Soil and Water Assessment Tool (SWAT) Applications in Brazil: Challenges and Prospects. Int. J. Agric. Biol. Eng. 2015, 8, 9–35. [Google Scholar] [CrossRef]
  71. Krysanova, V.; White, M. Advances in Water Resources Assessment with SWAT—An Overview. Hydrol. Sci. J. 2015, 60, 771–783. [Google Scholar] [CrossRef] [Green Version]
  72. Tan, M.L.; Gassman, P.W.; Srinivasan, R.; Arnold, J.G.; Yang, X. A Review of SWAT Studies in Southeast Asia: Applications, Challenges and Future Directions. Water 2019, 11, 914. [Google Scholar] [CrossRef] [Green Version]
  73. Tan, M.L.; Gassman, P.W.; Liang, J.; Haywood, J.M. A Review of Alternative Climate Products for SWAT Modelling: Sources, Assessment and Future Directions. Sci. Total Environ. 2021, 795, 148915. [Google Scholar] [CrossRef]
  74. Brighenti, T.M.; Bonumá, N.B.; Srinivasan, R.; Chaffe, P.L.B. Simulating Sub-Daily Hydrological Process with SWAT: A Review. Hydrol. Sci. J. 2019, 64, 1415–1423. [Google Scholar] [CrossRef]
  75. Wang, R.; Yuan, Y.; Yen, H.; Grieneisen, M.; Arnold, J.; Wang, D.; Wang, C.; Zhang, M. A Review of Pesticide Fate and Transport Simulation at Watershed Level Using SWAT: Current Status and Research Concerns. Sci. Total Environ. 2019, 669, 512–526. [Google Scholar] [CrossRef]
  76. Akoko, G.; Le, T.H.; Gomi, T.; Kato, T. A Review of SWAT Model Application in Africa. Water 2021, 13, 1313. [Google Scholar] [CrossRef]
  77. Rosenberg, N.J.; Epstein, D.J.; Wang, D.; Vail, L.; Srinivasan, R.; Arnold, J.G. Possible Impacts of Global Warming on the Hydrology of the Ogallala Aquifer Region. Clim. Chang. 1999, 42, 677–692. [Google Scholar] [CrossRef]
  78. Mehta, V.M.; Mendoza, K.; Daggupati, P.; Srinivasan, R.; Rosenberg, N.J.; Deb, D. High-Resolution Simulations of Decadal Climate Variability Impacts on Water Yield in the Missouri River Basin with the Soil and Water Assessment Tool (SWAT). J. Hydrometeorol. 2016, 17, 2455–2476. [Google Scholar] [CrossRef]
  79. Mehta, V.M.; Rosenberg, N.J.; Mendoza, K. Simulated Impacts of Three Decadal Climate Variability Phenomena on Water Yields in the Missouri River Basin1: Simulated Impacts of Three Decadal Climate Variability Phenomena on Water Yields in the Missouri River Basin. JAWRA J. Am. Water Resour. Assoc. 2011, 47, 126–135. [Google Scholar] [CrossRef]
  80. Daggupati, P.; Deb, D.; Srinivasan, R.; Yeganantham, D.; Mehta, V.M.; Rosenberg, N.J. Large-Scale Fine-Resolution Hydrological Modeling Using Parameter Regionalization in the Missouri River Basin. JAWRA J. Am. Water Resour. Assoc. 2016, 52, 648–666. [Google Scholar] [CrossRef]
  81. Chen, P.; Yuan, Y.; Li, W.; LeDuc, S.D.; Lark, T.J.; Zhang, X.; Clark, C. Assessing the Impacts of Recent Crop Expansion on Water Quality in the Missouri River Basin Using the Soil and Water Assessment Tool. J. Adv. Model. Earth Syst. 2021, 13, 002284. [Google Scholar] [CrossRef]
  82. Santhi, C.; Kannan, N.; Arnold, J.G.; Di Luzio, M. Spatial Calibration and Temporal Validation of Flow for Regional Scale Hydrologic Modeling 1. JAWRA J. Am. Water Resour. Assoc. 2008, 44, 829–846. [Google Scholar] [CrossRef]
  83. Panagopoulos, Y.; Gassman, P.W.; Arritt, R.W.; Herzmann, D.E.; Campbell, T.D.; Valcu, A.; Arnold, J.G. Impacts of Climate Change on Hydrology, Water Quality and Crop Productivity in the Ohio-Tennessee River Basin. Int. J. Agric. Biol. Eng. 2015, 8, 36–53. [Google Scholar] [CrossRef]
  84. Demissie, Y.; Yan, E.; Wu, M. Hydrologic and Water Quality Impacts of Biofuel Feedstock Production in the Ohio River Basin. GCB Bioenergy 2017, 9, 1736–1750. [Google Scholar] [CrossRef] [Green Version]
  85. Du, L.; Rajib, A.; Merwade, V. Large Scale Spatially Explicit Modeling of Blue and Green Water Dynamics in a Temperate Mid-Latitude Basin. J. Hydrol. 2018, 562, 84–102. [Google Scholar] [CrossRef]
  86. Rajib, A.; Liu, Z.; Merwade, V.; Tavakoly, A.A.; Follum, M.L. Towards a Large-Scale Locally Relevant Flood Inundation Modeling Framework Using SWAT and LISFLOOD-FP. J. Hydrol. 2020, 581, 124406. [Google Scholar] [CrossRef]
  87. Kling, C.L.; Panagopoulos, Y.; Rabotyagov, S.S.; Valcu, A.M.; Gassman, P.W.; Campbell, T.; White, M.J.; Arnold, J.G.; Srinivasan, R.; Jha, M.K.; et al. LUMINATE: Linking Agricultural Land Use, Local Water Quality and Gulf of Mexico Hypoxia. Eur. Rev. Agric. Econ. 2014, 41, 431–459. [Google Scholar] [CrossRef]
  88. Panagopoulos, Y.; Gassman, P.W.; Jha, M.K.; Kling, C.L.; Campbell, T.; Srinivasan, R.; White, M.; Arnold, J.G. A Refined Regional Modeling Approach for the Corn Belt—Experiences and Recommendations for Large-Scale Integrated Modeling. J. Hydrol. 2015, 524, 348–366. [Google Scholar] [CrossRef] [Green Version]
  89. Panagopoulos, Y.; Gassman, P.W.; Kling, C.L.; Cibin, R.; Chaubey, I. Water Quality Assessment of Large-Scale Bioenergy Cropping Scenarios for the Upper Mississippi and Ohio-Tennessee River Basins. JAWRA J. Am. Water Resour. Assoc. 2017, 53, 1355–1367. [Google Scholar] [CrossRef]
  90. Baskaran, L.; Jager, H.I.; Schweizer, P.E.; Srinivasan, R. Progress toward Evaluating the Sustainability of Switchgrass as a Bioenergy Crop Using the SWAT Model. Trans. ASABE 2010, 53, 1547–1556. [Google Scholar] [CrossRef] [Green Version]
  91. Jager, H.I.; Baskaran, L.M.; Schweizer, P.E.; Turhollow, A.F.; Brandt, C.C.; Srinivasan, R. Forecasting Changes in Water Quality in Rivers Associated with Growing Biofuels in the Arkansas-White-Red River Drainage, USA. GCB Bioenergy 2015, 7, 774–784. [Google Scholar] [CrossRef]
  92. Ha, M.; Zhang, Z.; Wu, M. Biomass Production in the Lower Mississippi River Basin: Mitigating Associated Nutrient and Sediment Discharge to the Gulf of Mexico. Sci. Total Environ. 2018, 635, 1585–1599. [Google Scholar] [CrossRef]
  93. Xu, H.; Wu, M.; Ha, M. Recognizing Economic Value in Multifunctional Buffers in the Lower Mississippi River Basin. Biofuels Bioprod. Biorefining 2019, 13, 55–73. [Google Scholar] [CrossRef] [Green Version]
  94. Chen, M.; Gassman, P.W.; Srinivasan, R.; Cui, Y.; Arritt, R. Analysis of Alternative Climate Datasets and Evapotranspiration Methods for the Upper Mississippi River Basin Using SWAT within HAWQS. Sci. Total Environ. 2020, 720, 137562. [Google Scholar] [CrossRef]
  95. Arnold, J.G.; White, M.J.; Allen, P.M.; Gassman, P.W.; Bieger, K. Conceptual Framework of Connectivity for a National Agroecosystem Model Based on Transport Processes and Management Practices. JAWRA J. Am. Water Resour. Assoc. 2021, 57, 154–169. [Google Scholar] [CrossRef]
  96. Jones, K.A.; Niknami, L.S.; Buto, S.G.; Decker, D. Federal Standards and Procedures for the National Watershed Boundary Dataset (WBD). In U.S. Geological Survey Techniques and Methods 11-A3; U.S. Geological Survey: Reston, VA, USA, 2022; ISBN 2328-7055. (Online). [Google Scholar]
  97. U.S. Department of the Interior. U.S. Geological Survey National Hydrography Dataset: NHDPlus High Resolution. Available online: https://www.usgs.gov/national-hydrography/nhdplus-high-resolution (accessed on 2 November 2022).
  98. U.S. Department of the Interior. U.S. Geological Survey Hydrologic Unit Maps: What Are Hydrologic Units? Available online: https://water.usgs.gov/GIS/huc.html (accessed on 2 November 2022).
  99. Martins, V.S.; Kaleita, A.L.; Gelder, B.K. Digital Mapping of Structural Conservation Practices in the Midwest U.S. Croplands: Implementation and Preliminary Analysis. Sci. Total Environ. 2021, 772, 145191. [Google Scholar] [CrossRef]
  100. Valayamkunnath, P.; Barlage, M.; Chen, F.; Gochis, D.J.; Franz, K.J. Mapping of 30-Meter Resolution Tile-Drained Croplands Using a Geospatial Modeling Approach. Sci. Data 2020, 7, 257. [Google Scholar] [CrossRef] [PubMed]
  101. Cerkasova, N.; Bieger, K.; White, M.; Gao, J.; Arnold, J.; Allen, P.; Kiniry, J. Field Scale, National Scope SWAT+ Modeling of Corn and Soybean Yields for the Contiguous US. In Proceedings of the ASA, CSSA, SSSA International Annual Meeting, Salt Lake City, UT, USA, 7–10 November 2021; Available online: https://scisoc.confex.com/scisoc/2021am/meetingapp.cgi/Paper/135068 (accessed on 13 January 2023).
  102. Schilling, K.E.; Gassman, P.W.; Arenas-Amado, A.; Jones, C.S.; Arnold, J. Quantifying the Contribution of Tile Drainage to Basin-Scale Water Yield Using Analytical and Numerical Models. Sci. Total Environ. 2019, 657, 297–309. [Google Scholar] [CrossRef] [PubMed]
  103. Liang, X.; Schilling, K.E.; Jones, C.S.; Zhang, Y.-K. Temporal Scaling of Long-Term Co-Occurring Agricultural Contaminants and the Implications for Conservation Planning. Environ. Res. Lett. 2021, 16, 094015. [Google Scholar] [CrossRef]
  104. Schipper, L.A.; Robertson, W.D.; Gold, A.J.; Jaynes, D.B.; Cameron, S.C. Denitrifying Bioreactors—An Approach for Reducing Nitrate Loads to Receiving Waters. Ecol. Eng. 2010, 36, 1532–1543. [Google Scholar] [CrossRef]
  105. Jaynes, D.B.; Isenhart, T.M. Performance of Saturated Riparian Buffers in Iowa, USA. J. Environ. Qual. 2019, 48, 289–296. [Google Scholar] [CrossRef] [Green Version]
  106. Tollan, A. Land-Use Change and Floods: What Do We Need Most, Research or Management? Water Sci. Technol. 2002, 45, 183–190. [Google Scholar] [CrossRef]
  107. O’Connell, P.E.; Ewen, J.; O’Donnell, G.; Quinn, P. Is There a Link between Agricultural Land-Use Management and Flooding? Hydrol. Earth Syst. Sci. 2007, 11, 96–107. [Google Scholar] [CrossRef] [Green Version]
  108. Palamuleni, L.G.; Ndomba, P.M.; Annegarn, H.J. Evaluating Land Cover Change and Its Impact on Hydrological Regime in Upper Shire River Catchment, Malawi. Reg. Environ. Chang. 2011, 11, 845–855. [Google Scholar] [CrossRef]
  109. McIntyre, N.; Marshall, M. Identification of Rural Land Management Signals in Runoff Response. Hydrol. Process. 2010, 24, 3521–3534. [Google Scholar] [CrossRef]
  110. Hess, T.M.; Holman, I.P.; Rose, S.C.; Rosolova, Z.; Parrott, A. Estimating the Impact of Rural Land Management Changes on Catchment Runoff Generation in England and Wales. Hydrol. Process. 2010, 24, 1357–1368. [Google Scholar] [CrossRef]
  111. Schilling, K.E.; Libra, R.D. The Relationship of Nitrate Concentrations in Streams to Row Crop Land Use in Iowa. J. Environ. Qual. 2000, 29, 1846–1851. [Google Scholar] [CrossRef]
  112. Hatfield, J.L.; McMullen, L.D.; Jones, C.S. Nitrate-Nitrogen Patterns in the Raccoon River Basin Related to Agricultural Practices. J. Soil Water Conserv. 2009, 64, 190–199. [Google Scholar] [CrossRef] [Green Version]
  113. Mielke, L.N. Performance of Water and Sediment Control Basins in Northeastern Nebraska. J. Soil Water Conserv. 1985, 40, 524. [Google Scholar]
  114. Iowa Department of Agriculture and Land Stewardship; Iowa Department of Natural Resources; Iowa State University College of Agriculture and Life Sciences. Iowa Nutrient Reduction Strategy: A Science and Technology-Based Framework to Assess and Reduce Nutrients to Iowa Waters and the Gulf of Mexico 2017. Available online: https://www.nutrientstrategy.iastate.edu/sites/default/files/documents/2017%20INRS%20Complete_Revised%202017_12_11.pdf (accessed on 20 November 2022).
  115. Schilling, K.E.; Tomer, M.D.; Zhang, Y.-K.; Weisbrod, T.; Jacobson, P.; Cambardella, C.A. Hydrogeologic Controls on Nitrate Transport in a Small Agricultural Catchment, Iowa. J. Geophys. Res. Biogeosciences 2007, 112, 2007JG000405. [Google Scholar] [CrossRef]
  116. Miller, B.A.; Crumpton, W.G.; Valk, A.G. Spatial Distribution of Historical Wetland Classes on the Des Moines Lobe, Iowa. Wetlands 2009, 29, 1146–1152. [Google Scholar] [CrossRef]
  117. Van der Valk, A.G. The Prairie Potholes of North America. In The World’s Largest Wetlands; Fraser, L.H., Keddy, P.A., Eds.; Cambridge University Press: Cambridge, UK, 2005; pp. 393–423. ISBN 978-0-511-54209-1. [Google Scholar]
  118. Golden, H.E.; Rajib, A.; Lane, C.R.; Christensen, J.R.; Wu, Q.; Mengistu, S. Non-Floodplain Wetlands Affect Watershed Nutrient Dynamics: A Critical Review. Environ. Sci. Technol. 2019, 53, 7203–7214. [Google Scholar] [CrossRef]
  119. Javaheri, A.; Babbar-Sebens, M. On Comparison of Peak Flow Reductions, Flood Inundation Maps, and Velocity Maps in Evaluating Effects of Restored Wetlands on Channel Flooding. Ecol. Eng. 2014, 73, 132–145. [Google Scholar] [CrossRef]
  120. Ameli, A.A.; Creed, I.F. Does Wetland Location Matter When Managing Wetlands for Watershed-Scale Flood and Drought Resilience? JAWRA J. Am. Water Resour. Assoc. 2019, 55, 529–542. [Google Scholar] [CrossRef]
  121. Kovacic, D.A.; David, M.B.; Gentry, L.E.; Starks, K.M.; Cooke, R.A. Effectiveness of Constructed Wetlands in Reducing Nitrogen and Phosphorus Export from Agricultural Tile Drainage. J. Environ. Qual. 2000, 29, 1262–1274. [Google Scholar] [CrossRef] [Green Version]
  122. Drake, C.W.; Jones, C.S.; Schilling, K.E.; Amado, A.A.; Weber, L.J. Estimating Nitrate-Nitrogen Retention in a Large Constructed Wetland Using High-Frequency, Continuous Monitoring and Hydrologic Modeling. Ecol. Eng. 2018, 117, 69–83. [Google Scholar] [CrossRef]
  123. Crumpton, W.G.; Stenback, G.A.; Fisher, S.W.; Stenback, J.Z.; Green, D.I.S. Water Quality Performance of Wetlands Receiving Nonpoint-source Nitrogen Loads: Nitrate and Total Nitrogen Removal Efficiency and Controlling Factors. J. Environ. Qual. 2020, 49, 735–744. [Google Scholar] [CrossRef] [PubMed] [Green Version]
  124. Messer, T.L.; Moore, T.L.; Nelson, N.; Ahiablame, L.; Bean, E.Z.; Boles, C.; Cook, S.L.; Hall, S.G.; McMaine, J.; Schlea, D. Constructed Wetlands for Water Quality Improvement: A Synthesis on Nutrient Reduction from Agricultural Effluents. Trans. ASABE 2021, 64, 625–639. [Google Scholar] [CrossRef]
  125. Walters, K.M.; Babbar-Sebens, M. Using Climate Change Scenarios to Evaluate Future Effectiveness of Potential Wetlands in Mitigating High Flows in a Midwestern U.S. Watershed. Ecol. Eng. 2016, 89, 80–102. [Google Scholar] [CrossRef] [Green Version]
  126. Schilling, K.E.; Jacobson, P. Effectiveness of Natural Riparian Buffers to Reduce Subsurface Nutrient Losses to Incised Streams. CATENA 2014, 114, 140–148. [Google Scholar] [CrossRef]
  127. Schultz, R.C.; Collettil, J.P.; Isenhart, T.M.; Simpkins, W.W.; Mize, C.W.; Thompson, M.L. Design and Placement of a Multi-Species Riparian Buffer Strip System. Agrofor. Syst. 1995, 29, 201–226. [Google Scholar] [CrossRef]
  128. Lowrance, R.; Altier, L.S.; Newbold, J.D.; Schnabel, R.R.; Groffman, P.M.; Denver, J.M.; Correll, D.L.; Gilliam, J.W.; Robinson, J.L.; Brinsfield, R.B.; et al. Water Quality Functions of Riparian Forest Buffers in Chesapeake Bay Watersheds. Environ. Manag. 1997, 21, 687–712. [Google Scholar] [CrossRef]
  129. Hill, A.R.; Vidon, P.G.F.; Langat, J. Denitrification Potential in Relation to Lithology in Five Headwater Riparian Zones. J. Environ. Qual. 2004, 33, 911. [Google Scholar] [CrossRef]
  130. Dosskey, M.G. Toward Quantifying Water Pollution Abatement in Response to Installing Buffers on Crop Land. Environ. Manag. 2001, 28, 577–598. [Google Scholar] [CrossRef]
  131. Lowrance, R. Groundwater Nitrate and Denitrification in a Coastal Plain Riparian Forest. J. Environ. Qual. 1992, 21, 401–405. [Google Scholar] [CrossRef]
  132. Clément, J.-C.; Aquilina, L.; Bour, O.; Plaine, K.; Burt, T.P.; Pinay, G. Hydrological Flowpaths and Nitrate Removal Rates within a Riparian Floodplain along a Fourth-Order Stream in Brittany (France): Hydrological Flowpaths and Nitrate Removal Rates. Hydrol. Process. 2003, 17, 1177–1195. [Google Scholar] [CrossRef]
  133. Anderson, B.G.; Rutherfurd, I.D.; Western, A.W. An Analysis of the Influence of Riparian Vegetation on the Propagation of Flood Waves. Environ. Model. Softw. 2006, 21, 1290–1296. [Google Scholar] [CrossRef]
  134. Gergel, S.E.; Dixon, M.D.; Turner, M.G. Consequences of Human-Altered Floods: Levees, Floods, and Floodplain Forests along the Wisconsin River. Ecol. Appl. 2002, 12, 1755–1770. [Google Scholar] [CrossRef]
  135. Pinter, N.; Huthoff, F.; Dierauer, J.; Remo, J.W.F.; Damptz, A. Modeling Residual Flood Risk behind Levees, Upper Mississippi River, USA. Environ. Sci. Policy 2016, 58, 131–140. [Google Scholar] [CrossRef]
  136. Theiling, C.H.; Burant, J.T. Flood Inundation Mapping for Integrated Floodplain Management: Upper Mississippi River System: Umr Flood Inundation. River Res. Appl. 2013, 29, 961–978. [Google Scholar] [CrossRef]
  137. U.S. Army Corps of Engineers National Levee Database. Available online: https://levees.sec.usace.army.mil/#/ (accessed on 6 November 2022).
  138. Pinter, N. One Step Forward, Two Steps Back on U.S. Floodplains. Science 2005, 308, 207–208. [Google Scholar] [CrossRef] [Green Version]
  139. Schilling, K.E.; Jacobson, P.J.; Vogelgesang, J.A. Agricultural Conversion of Floodplain Ecosystems: Implications for Groundwater Quality. J. Environ. Manag. 2015, 153, 74–83. [Google Scholar] [CrossRef]
  140. Acreman, M.C.; Riddington, R.; Booker, D.J. Hydrological Impacts of Floodplain Restoration: A Case Study of the River Cherwell, UK. Hydrol. Earth Syst. Sci. 2003, 7, 75–85. [Google Scholar] [CrossRef] [Green Version]
  141. Ahilan, S.; Guan, M.; Sleigh, A.; Wright, N.; Chang, H. The Influence of Floodplain Restoration on Flow and Sediment Dynamics in an Urban River. J. Flood Risk Manag. 2018, 11, S986–S1001. [Google Scholar] [CrossRef]
  142. Clilverd, H.M.; Thompson, J.R.; Heppell, C.M.; Sayer, C.D.; Axmacher, J.C. Coupled Hydrological/Hydraulic Modelling of River Restoration Impacts and Floodplain Hydrodynamics: Modelling of River Restoration Impacts. River Res. Appl. 2016, 32, 1927–1948. [Google Scholar] [CrossRef]
  143. Forshay, K.J.; Stanley, E.H. Rapid Nitrate Loss and Denitrification in a Temperate River Floodplain. Biogeochemistry 2005, 75, 43–64. [Google Scholar] [CrossRef]
  144. Mitsch, W.J.; Day, J.W. Restoration of Wetlands in the Mississippi–Ohio–Missouri (MOM) River Basin: Experience and Needed Research. Ecol. Eng. 2006, 26, 55–69. [Google Scholar] [CrossRef]
  145. Newcomer Johnson, T.; Kaushal, S.; Mayer, P.; Smith, R.; Sivirichi, G. Nutrient Retention in Restored Streams and Rivers: A Global Review and Synthesis. Water 2016, 8, 116. [Google Scholar] [CrossRef] [Green Version]
  146. Weber, L.J.; Muste, M.; Bradley, A.A.; Amado, A.A.; Demir, I.; Drake, C.W.; Krajewski, W.F.; Loeser, T.J.; Politano, M.S.; Shea, B.R.; et al. The Iowa Watersheds Project: Iowa’s Prototype for Engaging Communities and Professionals in Watershed Hazard Mitigation. Int. J. River Basin Manag. 2018, 16, 315–328. [Google Scholar] [CrossRef]
  147. Prokopy, L.S.; Floress, K.; Arbuckle, J.G.; Church, S.P.; Eanes, F.R.; Gao, Y.; Gramig, B.M.; Ranjan, P.; Singh, A.S. Adoption of agricultural conservation practices in the United States: Evidence from 35 years of quantitative literature. J. Soil Water Conserv. 2019, 74, 520–534. [Google Scholar] [CrossRef] [Green Version]
  148. Keeler, B.L.; Dalzell, B.J.; Gourevitch, J.D.; Hawthorne, P.L.; Johnson, K.A.; Noe, R.R. Putting people on the map improves the prioritization of ecosystem services. Front. Ecol. Environ. 2019, 17, 51–156. [Google Scholar] [CrossRef]
  149. Knight, B.I. Precision conservation. J. Soil Water Conserv. 2005, 60, 137A. [Google Scholar]
  150. McLellan, E.; Robertson, D.; Schilling, K.; Tomer, M.; Kostel, J.; Smith, D.; King, K. Reducing Nitrogen Export from the Corn Belt to the Gulf of Mexico: Agricultural Strategies for Remediating Hypoxia. JAWRA J. Am. Water Resour. Assoc. 2015, 51, 263–289. [Google Scholar] [CrossRef]
Figure 1. Spatial patterns of annual precipitation (A), land slope (B), row crop land cover (C), and subsurface tile drainage (D) in the MARB.
Land 12 00276 g001
Figure 2. Flow chart of evaluation process whereby ranks of watersheds with flood and nitrate risks are combined with ranks of watersheds with NI practice potential to derive a combined ranking of watersheds where NI practices can do the most good to reduce flood and nitrate risks.
Land 12 00276 g002
Figure 3. Spatial patterns of mean annual surface runoff by HUC12 obtained from the NAM (A), flood damages by census block (B), mean annual NO3-N loss by HUC12 obtained from the NAM (C) and combined risk to flooding and N loss by HUC4 (D) in the MARB.
Land 12 00276 g003
Figure 4. Mean annual surface runoff obtained from the NAM for HUC12 watersheds in the Iowa-Cedar basin (A), and mean annual NO3-N loss by HUC12 obtained from the NAM (B).
Land 12 00276 g004
Figure 5. NI practices mapped at the 10 m scale in the Iowa-Cedar basin (see Table A1 for specific details). (A) Land use change on slopes >7%, (B) WASCOBS, (C) Depressional wetlands, (D) Nitrate removal wetlands, (E) Riparian buffers, (F) Land use change on floodplains, (G) Leveed areas.
Land 12 00276 g005
Figure 6. Combined quantile ranking of flood and nitrate risks with total NI practices at the HUC4 scale (A) and in the Iowa-Cedar basin (B).
Land 12 00276 g006
Table 1. Quantile ranking of selected HUC4 basins in MARB for combined flood and N risks and potential NI practice implementation.
HUC4NameFlood RiskNO3-N RiskTotal Combined RiskRow Crop Change on Slopes *WASCOBs *Depress. Wetlands *N Treat. Wetlands *Rip. Buff. *FP Levee Areas *FP Row Crop Change *Total
Combined Score
(Risk + NI)
0512Wabash5510555553543
0708Upper Mississippi-Iowa-Skunk-Wapsipinicon5510555543542
0713Lower Illinois5510445533539
0714Upper Mississippi-Kaskaskia-Meramec5510444543539
0702Minnesota459445552337
0802Lower Mississippi-St. Francis538335553537
0709Rock358554533437
1017Missouri-Big Sioux257555542437
0710Des Moines358555522436
0514Lower Ohio5510443433536
1023Missouri-Little Sioux257555513536
1027Kansas347554433536
* Natural Infrastructure Practices.
Table 2. Highest ranking watershed scores for HUC12 basins in Iowa-Cedar basin for combined flood and N risks and potential NI practice implementation.
HUC12NameFlood RiskNO3-N RiskTotal Combined RiskRow Crop Change on Slopes *WASCOBs *Depress. Wetlands *N Treat. Wetlands *Rip. Buff. *Levee Areas *FP Row Crop Change *Total
Combined Score
(Risk + NI)
070801010705Boston Bay538335555539
070801041501Cartlage Lake527335555538
070801040402Mud Creek336554355437
070801030405Mockridge 5510554535037
070801041101Cottonwood Drain448225555537
070801041704Spillman Creek-347335455537
070801010102Johnson Creek246554255436
070801030406Yankee Run538554545036
070801051106Van Zante Creek-527554555036
070802060704East Branch Wapsinonoc 257555545036
070802091104Sunfish Lake516335355535
070802020101Bancroft Creek448445554035
070802080703Plague Mine Creek516555254335
070802020106Goose Creek448445554035
070801040601Iowa Slough347225545535
070801060404Pleasant Creek448554355035
* Natural Infrastructure Practices.
Disclaimer/Publisher’s Note: The statements, opinions and data contained in all publications are solely those of the individual author(s) and contributor(s) and not of MDPI and/or the editor(s). MDPI and/or the editor(s) disclaim responsibility for any injury to people or property resulting from any ideas, methods, instructions or products referred to in the content.

