1. Introduction
With the development of the Land Administration Domain Model (LADM) standard [
1], the main guidelines for developing and maintaining a Land Administration System (LAS) are provided. A flexible abstract of the conceptual model able to support the development of 2D and 3D LASs is generated ensuring interoperability in the representation and documentation of Rights, Restrictions and Responsibilities (RRRs) [
2,
3]. However, most of the research in the field of 3D Cadastre is focused on condominiums and apartments in developed economies where the high value of land requires precise positioning of the legal boundaries within each construction, which increases the times and costs of cadastral surveys [
4,
5,
6,
7,
8,
9,
10]. Several approaches have been proposed aiming to develop LADM-based country profiles [
11,
12,
13,
14] and to settle a link between LADM and commonly used technical data models and application schemas, such as City Geography Markup Language (CityGML) [
13,
14,
15], IndoorGML [
16,
17,
18], Building Information Models (BIMs)/Industry Foundation Classes (IFCs) [
19,
20,
21,
22,
23] and LandXML/InfraGML [
24]. However, the implementation of these approaches requires time, as well as financial and computational resources. Trying to moderate these requirements, some researchers proposed the utilization of already existing 3D data models (BIMs/IFCs) from other application areas [
25]. Nonetheless, the global implementation range of such a solution is rather restricted due to their limited availability. Especially in informal low-income areas, the predecessor of such data or the acquisition of precise cadastral data is hardly achievable, but necessary in order to prevent conflicts in regularization and land readjustment procedures.
In recent years the issue of informal constructions has received a lot of attention, especially in the so-called ‘global South’ where this phenomenon is most encountered. Unrecognized, unregistered 2D and 3D rights are found to a great extent in many countries of Africa and Latin America, such as Uganda, New Guinea, Trinidad and Tobago and various Caribbean countries, but also in some countries of the Asia-Pacific region and even in some UNECE countries. In informally developed cities, such as in the self-made cities in the UNECE region [
26] the effectiveness of LAM systems is usually problematic, unable to efficiently support the current land management needs due to a large amount of missing data in terms of buildings, property units and right holders and their unrecognized rights [
27,
28,
29,
30].
According to UN guidelines [
31,
32], to successfully meet the UN SDGs by 2030, such informal rights on land and constructions have to be identified, mapped and, if possible, recognized, formalized and registered. Thus, countries that faced this phenomenon were encouraged to initiate formalization projects to legalize and register as many as possible informal constructions into the LAMs for their integration into the economic cycle [
33,
34]. Formalization and registration of such constructions and the rights on them is anticipated to eliminate the effectiveness divide among the developed and less developed LAMSs.
Until now, several fit-for-purpose solutions have been proposed by international and academic bodies to deploy 2D LAS in pro-poor environments [
35,
36]. In these approaches, the use of crowdsourcing techniques and mobile GIS (m-services) is usually chosen, while all the available cartographic basemaps are taken into consideration, including UAVs, digital orthoimages (if existed) or even aerial photos of lower geometric accuracy [
4,
37]. Occasionally, a handheld GPS/GNSS antenna or/and the integrated consumer-grade GPS/GNSS sensor of the mobile device is exploited, in order to achieve more reliable and accurate results.
However, the more complex the distribution and sequence of physical property units, the greater the need for the compilation of a 3D cadastral system. The potential of 3D cadastral infrastructure to handle the informal urban development is investigated in a few studies, concluding that there is a need for that but its realization is not yet considered to be pragmatic due to the costs and other requirements [
38,
39]. At the same time, the introduction of fit-for-purpose tactics in 3D crowdsourced cadastral surveys has already proven that it can lead to reliable results, while keeping the duration and costs of the 3D cadastral field surveys low [
25,
40,
41].
Unlike the 2D Cadastre, the 3D Cadastre requires the knowledge of all the multi-level individual property units included in a spatial unit. Determining these ownership units cannot be accomplished by viewing only an orthophoto or an aerial photo of the study area. In the case of developed areas, the building blueprints are utilized. However, this is not applicable in the informal self-made cities, where the multi-level constructions have been implemented illegally and therefore no plans exist. In the absence of an appropriate registration basemap, other methods should be used to map the indoor proprietary situation. As the GPS/GNSS signal is weak in the interior of buildings, an alternative method of locating the property boundaries and construction of each floor plan should be used.
An Indoor Position System (IPS) able to provide the 3D position of the property boundaries, fast and reliable, may constitute the best-fitted solution. The recent introduction of machine learning in the field of IPS managed to overcome the drawbacks and weaknesses of the traditional IPS methodologies, increasing their capabilities. Wi-Fi and Bluetooth Low Energy (BLE) are the most commonly used technologies for developing IPSs. Among the different types of available technologies, BLE provides relatively high accuracy, but also has a variety of other advantages, such as low cost, easy integration and low power consumption [
42]. Therefore, it is particularly suitable for the implementation of low-cost IPS. Considering that in low-income areas not everyone has access to cable internet and therefore to Wi-Fi (as it requires special infrastructure in the building), wireless and portable technologies such as BLE are preferable for the development of indoor positioning networks.
This paper presents a part of an ongoing research project aligned with the global efforts for 3D Cadastres. The goal is to develop low-cost and reliable technical processes for the immediate implementation of 3D cadastral systems everywhere, so that no one is left behind. The architecture of the technical system follows the international LADM standard, in order for the structure and documentation of 2D and 3D cadastral data to be based on the same foundations, thus ensuring the uniformity and interoperability among the cadastral systems of all countries.
The main objective of this work is to investigate the potential of technologies, tools and techniques for Indoor Positioning in the automatic acquisition of coordinates for indoor cadastre in the absence of architectural floor plans that would be used to develop a 3D crowdsourced cadastre. This paper is based on the assumption that formalization of informal constructions, property registration, urban land readjustment projects and future land reforms in the self-made cities may be better handled if property rights in the third dimension are considered, and is a follow-up of the research initiated and presented in [
41] that intends to investigate low-cost methods aiming to provide a practical technical tool for indoor 2D/3D cadastral mapping using m-services, Bluetooth technology and innovative machine learning techniques. Unlike [
41], the proposed machine learning architecture in this paper is tested with real data and under real conditions to investigate the weaknesses and the influencing factors.
2. Related Work
2.1. Fit-For-Purpose 3D Cadastre
It is now accepted that a cadastral system may be comprised of various datasets of variable quality integrated together in a fit-for-purpose whole [
43]. In recent years, data collection methods such as VGI and crowdsourcing techniques have claimed a place as a reliable cadastral data source, strengthening their role in the process for the initial implementation of 2D and 3D cadastre in both the developing and the developed world [
25,
36,
37,
40,
41,
43,
44,
45,
46,
47,
48,
49,
50]. To date, much research has been carried out trying to manage the 3D aspect of the physical objects and introduce crowdsourcing in 3D cadastral surveying procedures. Determining the location of a property unit in 3D space through a 3D point feature or the schematic illustration of the 3D ownership situation were some of the first efforts towards this direction. Ref. [
49] presents a LADM-based crowdsourced approach for 3D cadastral data acquisition through a mobile device. The user is invited to submit information regarding: (i) the height of property unit, (ii) the coordinates of a reference point indicating the building in which the property is located (a position in the center of the building is preferred) and (iii) the property unit surface relation, indicating whether the property unit is located above, below or on the ground surface. The coordinate is read either from the State Geodetic Administration Geoportal and entered in the mobile application; or it is determined through the smartphone GPS receiver. Furthermore, the user can provide information regarding the roof type of the building where his/her property is located, by selecting the best fitted type through three different roof types: (i) Flat, (ii) Inclined or (iii) Complex. This data is combined with existing 2D (official) information regarding the real property land parcel and premises, and then is delivered through the mobile application to the official authority. The aim of this effort is to assist and speed up the implementation process of 3D Cadastres, incorporating citizens participation in the cadastral surveys. Ref. [
50] proposed an interesting web-based crowdsourced approach, enabling the contributor to identify and choose the ownership situation that responds to his/her proprietary situation, through a set of alternative sketches depicting different types of land and property ownership situations. The contributor may also submit additional data concerning the location of the declared property (address, post code, point on a map), legal documents proving his/her rights and additional comments concerning the cadastral case. Through this process, important elements are collected, with a key role in the subsequent management of the complicated 3D property situations.
Beside this approach, the metric identification of 3D cadastral objects is a more complex and challenging, yet interesting and useful approach. Especially when it comes to interior cadastral objects, the determination and identification process becomes more demanding in terms of geospatial registration backgrounds, acquisition tools and technologies. The recording of 3D cadastral objects through a crowdsourced approach is based on existing 2D cadastral maps, orthophotos, existing architectural floor plans of the buildings or even BIM data, when available, in combination with citizen contributions in delivering all the necessary proprietary information into the cadastral system, mainly through mobile phone devices. Ref. [
40] designed an innovative LADM-based low-cost technical framework in order to provide a modern technical solution for 3D Cadastres. Team leaders were established in each part of the area under cadastral survey. The team leaders have a significant role in the data collection process, as well as in the organization, training and the technical support of the whole procedure. A prototype mobile application was developed enabling the contributor to capture and visualize 3D cadastral data concerning the land and property units in real-time. The application allows the visualization of the declared property premises as block models, located either above or below the ground surface. First, the contributor is asked to provide additional descriptive data concerning the right holder and the property unit (name, address, area, type of right, etc.) together with some geometric information concerning the height of the property unit and the floor where the property is located. Additional data may be also submitted, such as photos illustrating the declared property unit or other available documents (e.g., plans, deeds, etc.) proving the right holder rights. The identification of the indoor cadastral spaces is conducted by the contributors, through the selection of the property boundary point features on the architectural floor plan, where the declared property is located. By tapping the point vertices on the basemap on the mobile phone screen, a polygon feature depicting the property boundaries is created. Once all the required data are inserted in the mobile application, the 3D property unit model is automatically generated through a model-driven approach, exploiting the digitized 2D polygonal boundaries of the property unit on an available basemap (the floor plans) and the declared geometric information.
In addition to architectural floor plans, BIM data is one of the most accurate background options for the implementation of 3D cadastral surveys, since it presents in detail the structure and distribution of indoor cadastral space in 3D. Ref. [
25] proposed an interesting crowdsourced approaches for the implementation of 3D cadastral surveys by exploiting existing BIM as registration background. They developed a LADM-based web application that offers a set of tools allowing the contributor to: (i) manage the visibility model of the BIM, through enabling or disabling the layers representing the building in LoD1 or LoD4, assisting the user to locate his/her property; (ii) implement length and area calculations on/of 3D objects; (iii) view the building interior spaces by slicing the BIM, either vertically or horizontally; and (iv) select his/her property in the BIM and collect the necessary cadastral information about his/her rights.
However, these crowdsourced solutions rely on the existence of ideal conditions, assuming that highly accurate 3D data, such as BIM data and/or architectural floor plans of the buildings, are available. This may constitute the case for the plurality of new formal constructions in the planned areas but is not widely applicable. Beyond BIM data, even the architectural floor plans may not be available (e.g., for old constructions where the documents that accompany the building permits may have been destroyed or lost, or simply do not exist for the self-made informal constructions) and the creation of such plans using traditional methods is not affordable. Thus, new cadastral surveys both for the land and the buildings (indoor property unit legal boundaries at each floor) are needed.
In the absence of such cadastral maps several options to proceed with the identification of legal boundaries are proposed, including (a) the use of the GPS sensor of the smartphone with an accuracy of a few meters, for a fit-for-purpose field survey, or (b) the use of external support GNSS (Global Navigation Satellite System) tools and resources, that enables higher positioning accuracy [
41]. This approach is only applicable for field surveys in sparsely developed outdoor areas. Since the GPS/GNSS signal is weak in densely developed urban areas and moreover in the interior of the buildings, another solution is needed for the recording of the complex legal boundaries inside the constructions.
Ref. [
41] proposes an innovative approach for crowdsourced cadastral data acquisition, through the utilization of machine learning techniques, m-services and Bluetooth technology. It proposes the establishment of a Bluetooth-based IPS; the utilization of a Bluetooth-enabled mobile phone device as a data capturing tool; and an alternative machine learning architecture for Bluetooth signal analysis and provision of the space coordinates of the mobile device. The main objective of [
41] is to investigate the potentials of such a solution for the initial implementation of 3D indoor cadastral surveys, aiming to enable the future automatic acquisition of indoor property boundary points coordinates and creating a reliable floor plan when this is not available. The proposed solution was tested on benchmarked data concluding in cm-level of accuracy. However, additional research is needed to clarify all the aspects of this venture. In this paper, an attempt is made to take this research a step forward, bringing the proposed solution from theory to practice.
2.2. Machine Learning in Indoor Positioning Systems
Lately, we have witnessed the introduction of machine learning techniques in indoor positioning as they seem to be very effective in extracting knowledge, discovering, learning and improving the positional accuracy [
51]. Once trained, they can quickly produce reliable predictions. Combining machine learning algorithms with technologies such as Wi-Fi, Bluetooth Low Energy (BLE), ZigBee, etc., pioneer Indoor Positioning solutions may be provided [
52,
53,
54]. Among these technologies, BLE has some advantages that make it preferable for the development of low-cost applications. Specifically, BLE has a small size, is portable, maintains low energy consumption and is economically tolerable [
54,
55].
Over time, several approaches have been proposed, attempting to use neural networks for Wi-Fi or/and Bluetooth indoor localization. Ref. [
56] proposed a combination of Artificial Neural Network (ANN) and Database Correlation method based on Wi-Fi fingerprints. A Back Propagation Neural Network (BPNN) is employed in [
57], proving that AAN in combination with Wi-Fi fingerprints can work beneficially for indoor positioning. A different approach is proposed by [
58]; they used channel state information (CSI) instead of RSSI fingerprints, while a greedy learning algorithm was used aiming to reduce the location error. Ref. [
52] proposed a deep learning fingerprinting system, entitled “DeepFi”, for indoor localization with Wi-Fi based on Channel State Information (CSI). Their approach achieved high accuracy that overcame the performance of other traditional methods, such as FIFS, Horus and Maximum Likelihood. Ref. [
59] proposed an indoor multi-sensor positioning system based on deep belief networks (DBN), aiming to obtain more stable and richer RSSI fingerprint characteristics. They used data from both Bluetooth and Wi-Fi, achieving an average localization accuracy of 0.52 m.
Following this, Ref. [
60] proposed a BLE fingerprinting based machine learning location and tracking system for indoor positioning. For performance evaluation, they used two of the most popular machine learning algorithms, that is the logistic regression (LR) and support vector machine (SVM). As emerged from the experimental implementation, the proposed method has an average estimation error of 50 cm. Ref. [
61] compared the performance of different machine learning algorithms for BLE fingerprinting. Specifically, they investigated the performance of Artificial Neural Network Regression (ANN), Multiple Linear Regression (MLR), Random Forest Regression (RF) and Support Vector Regression (SVR), concluding that SVM has better performance in terms of Min Error and Median of Error.
In recent literature, most BLE based IPSs use an RSSI ranging technique to manage and mitigate the fluctuations of the wireless signals. Fluctuation in RSSI is a challenging problem as it directly affects the positioning accuracy of the IPS. Specifically, RSSI fingerprints are usually combined with different machine learning methods, such as KNN, SVM and Neural Networks (NN), to produce models [
53]. In commonly used machine learning algorithms that have been used so far for indoor localization purposes, RSS vectors of the signals are considered as statistically independent. However, this does not correspond to reality. Instead, there are sequential dependencies between the RSS vectors. By taking them into account, the performance of the system may be increased. In this regard, Recurrent Neural Networks (RNNs) can be very beneficial. Recently, Long Short-Term Memory (LSTM)-based models have emerged, which can exploit the sequential correlation of time-varying RSSI measurements and consequently leverage this information to reduce RSSI fluctuations. Thus, by using deep neural networks which are specifically good for handling sequential problems, the positional accuracy of the IPSs can be improved. Ref. [
51] presented a stacked LSTM approach for indoor positioning using Wi-Fi signals. They compared the performance of the proposed approach to other deep learning algorithms, namely KNN and Vanilla LSTM. They conclude that the proposed network outperforms KNN and Vanilla LSTM by 74.4% and 18.1%, respectively.
3. Indoor Cadastral Technical Framework
To meet the UN SDGs by 2030, informal rights on land and constructions have to be identified, mapped and, if possible, recognized, formalized and registered. Due to the limited financial resources of self-created cities, the implementation of 2D/3D cadastral surveys following traditional techniques is impossible. At the same time, the complexity in the geometry and the sequence between the multi-level constructions makes imperative the need for their identification in three dimensions. Specifically, for low-income areas, where the 2D Cadastre does not exist or is not complete, the simultaneous implementation of 2D and 3D Cadastre seems to be beneficial.
Since the implementation of 2D/3D cadastral surveys is directly linked to the architectural plans, that in case of illegal and informal construction do not exist, an alternative plan-free solution is required to release the crowdsourced cadastral surveys from this obligatory condition. Until now, several fit-for-purpose approaches have been proposed for the determination of 2D property boundaries on low-precision basemaps or in the absence of any cartographic basemap, exploiting GPS/GNSS sensors. However, due to the inability of the GPS/GNSS sensors to provide accurate and reliable results in the interior of buildings, other low-cost and reliable localization solutions should be investigated for the fast implementation of 2D/3D indoor cadastral mapping. The use of low-cost IPS solutions for crowdsourced 2D/3D indoor cadastral mapping is an almost unexplored field, with particular interest and prospects.
In this paper we investigate the potential introduction of low-cost and portable BLE IPS in 2D/3D indoor mobile-based crowdsourced cadastral surveys. We propose the establishment of a collaborative framework between m-services, BLE technology and machine learning techniques to automatically acquire the coordinates of indoor property boundaries, considering that at a later stage these coordinates will be used for the generation of a reliable property boundaries plan. Achieving this task is of great importance for the implementation of 2D/3D indoor crowdsourced cadastral surveys, when the available registration basemap does not precisely illustrate either the building nor the building unit (property unit) boundaries. Once the property boundaries plan is formed through this approach, the generation of the 3D property unit model may be implemented following a similar process to [
40].
The proposed framework is modelled on the basis of a Bluetooth-based IPS. Its operation is based on three inter-communicating technological tools:
- (i)
Bluetooth beacons—wireless technology, for the establishment of the IPS;
- (ii)
a Bluetooth-enabled mobile phone device, to be used as capturing tool;
- (iii)
a machine learning algorithm, to estimate/provide the indoor points coordinates.
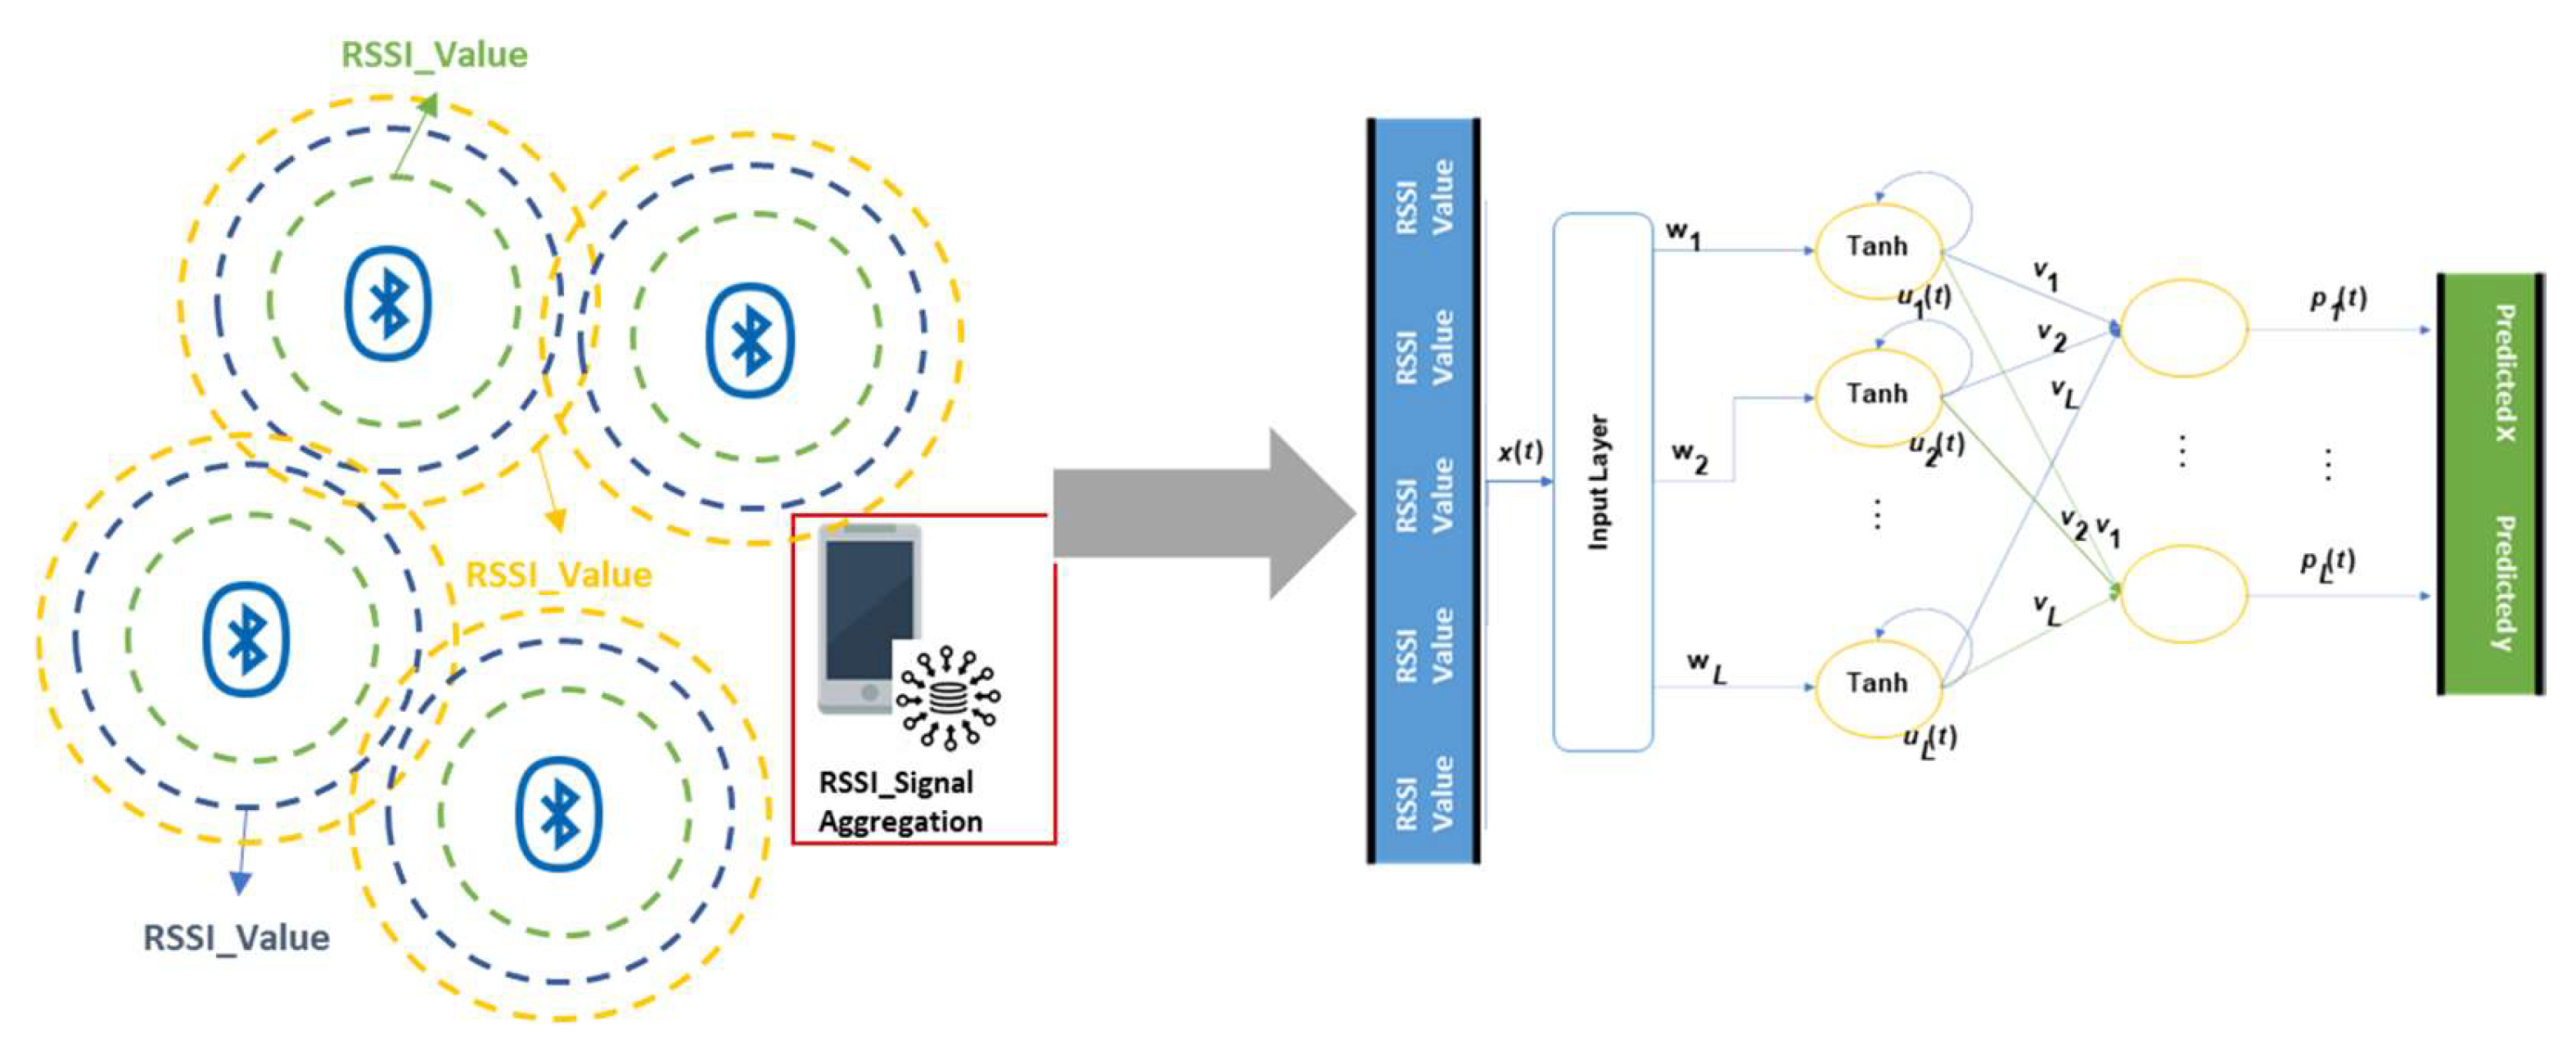
The key idea of the proposed IPS solution is the strategic distribution of the beacons in the interior environment of a building; the exploitation of a mobile device to measure in real-time the strength of the signals emitted by the beacons, when located on an indoor Point of Interest (POI); and finally the determination of the mobile device position coordinates through the machine learning algorithm. More specifically, the Bluetooth sensor of the mobile device communicates with the established IPS, providing data about its relative position throughout the IPS range. The received signals are processed by a machine learning algorithm, providing the positions of the property unit boundaries, therefore enabling the identification, capture and form of the spatial plan view of the declared property. The user of the mobile device may move towards the boundaries of the property unit and transiently place the mobile device on the POI located in the interior of the building floor that he/she want to capture. By choosing through the mobile to receive the coordinates of the point, the Bluetooth signals are processed by the machine learning algorithm and the point coordinates are determined. The technical system overview is depicted in
Figure 1.
It is worth noting that the Bluetooth itself does not have any built-in location intelligence. However, through the assignment of physical/real coordinates to the beacons and estimating the distance between the beacon and the mobile device through signals analysis, the determination of the mobile phone physical coordinates is feasible. The proposed framework is still under investigation and thus the factors affecting its performance in real conditions have not been precisely determined yet, e.g., distribution of beacons, minimum number of beacons, etc. These shortcomings are aimed to be resolved both through the present and future research towards this subject.
4. Machine Learning Architecture
Recently, several research methods have been proposed for indoor positioning, exploiting signals derived by low-cost sensors [
54] such as Bluetooth, ZigBee and most recently Wi-Fi data structures. These signals are processed using advanced machine learning models, such as deep learning neural networks, in order to measure the indoor positioning of an object based on the respective signal distortions. In this paper, a Bluetooth sensing interface is exploited for Indoor Positioning incorporating with a Long-Short Term Memory (LSTM) neural network for data processing and analysis [
62]. The purpose of the LSTM neural network structure is to estimate the indoor coordinates exploiting the distortion of Bluetooth signals.
4.1. The Sensing Infrastructure
Bluetooth wireless technology is exploited as far as the sensing interface of this paper. The installed infrastructure operates in the band of 2.402 and 2.480 GHz including a 2 MHz wide guard bands. The Bluetooth sensors have no built-in location intelligence. Instead, the machine learning model is responsible for transforming the low-level emitted signals into high-level positioning measurements. An overview of the proposed Bluetooth sensing interfaces is depicted in
Figure 1.
As the Bluetooth signal is delivered to the space, it undergoes multiple scattering affecting the overall strength of the signal. These signal distortion patterns are processed by the machine learning neural network structure in order to estimate the indoor positioning of an object. In our particular implementation we used the Received Signal Strength Indication (RSSI) as it was defined in the IEEE 802.11 standard. RSSI is a relative index which indicates the power level received by an antenna. Based on the fluctuation of radio signals, we can get a fairly accurate result of the RSSI trending. We can easily know if the signal is getting stronger or weaker, therefore, we will know if we are moving towards or away from the source. Even better, if we understand the specific mapping between the RSSI and the location of the specific receiving device, we could have a fairly accurate estimate of the distance [
63]. By deploying multiple Bluetooth antennas, you can use the varying signal strength readings to accurately calculate the exact position of a device in relation to these antennas.
4.2. Modeling Spatial Coordinates Using Mahcine Learning
In this paper an LSTM neural network model is adopted for predicting the indoor positioning of an object or target in a space using signal distortions from Bluetooth sensors. Let us denote
as the time series signal of the
j-th Bluetooth device out of
N available. These
N time series signals
are fed as inputs to the LSTM model for spatial coordinate prediction. For this purpose, we assume a column vector
containing the spatial coordinates of
K target points in the space. Let us also assume a time window of
P + 1 time series samples of the
N Bluetooth devices, expressing the signal distortion information at the time instance
t. More specifically, we have that:
In Equation (1), variable is a matric that includes all the K signals of the Bluetooth sensors over a time window of P + 1 samples. Therefore, we have input-output pairs of the form .
Using an extended experimentational framework, we measured the time series signals of the Bluetooth sensors over several time instances,
with
. In other words, variable
M indicates the number of samples gathered throughout the experimentational phase in order to construct a labelled (ground truth) dataset which is used for training the LSTM neural network model. Let us denote as
the training data set including
M pairs of the form:
It is clear that a non-linear relationship exists among the matrix
and the spatial coordinates
. Therefore, we have that:
where in Equation (3)
denotes a vector-valued non-linear function that is modeled through the LSTM neural network, and matrix
are the input signals, denoting the distrortion of the
K Bluetooth time series signals over a time window of
P + 1 samples.
4.3. Feedforwards Neural Networks as Universal Approximators
One of the main difficutlies regarding Equation (3) is that the non-linear vector-valued
is actually unknown. In order to estimate this function we used a training set of the form of Equation (2). The purpose of the training set is to estimate the unknown parameters (weights) of a neural network model used to approximate the
. Feedforward neural networks have been proven to be universal approximator, meaning that they can approximate any non-linear function (with some constaints about its form and continuity) with any degree of accuracy [
64].
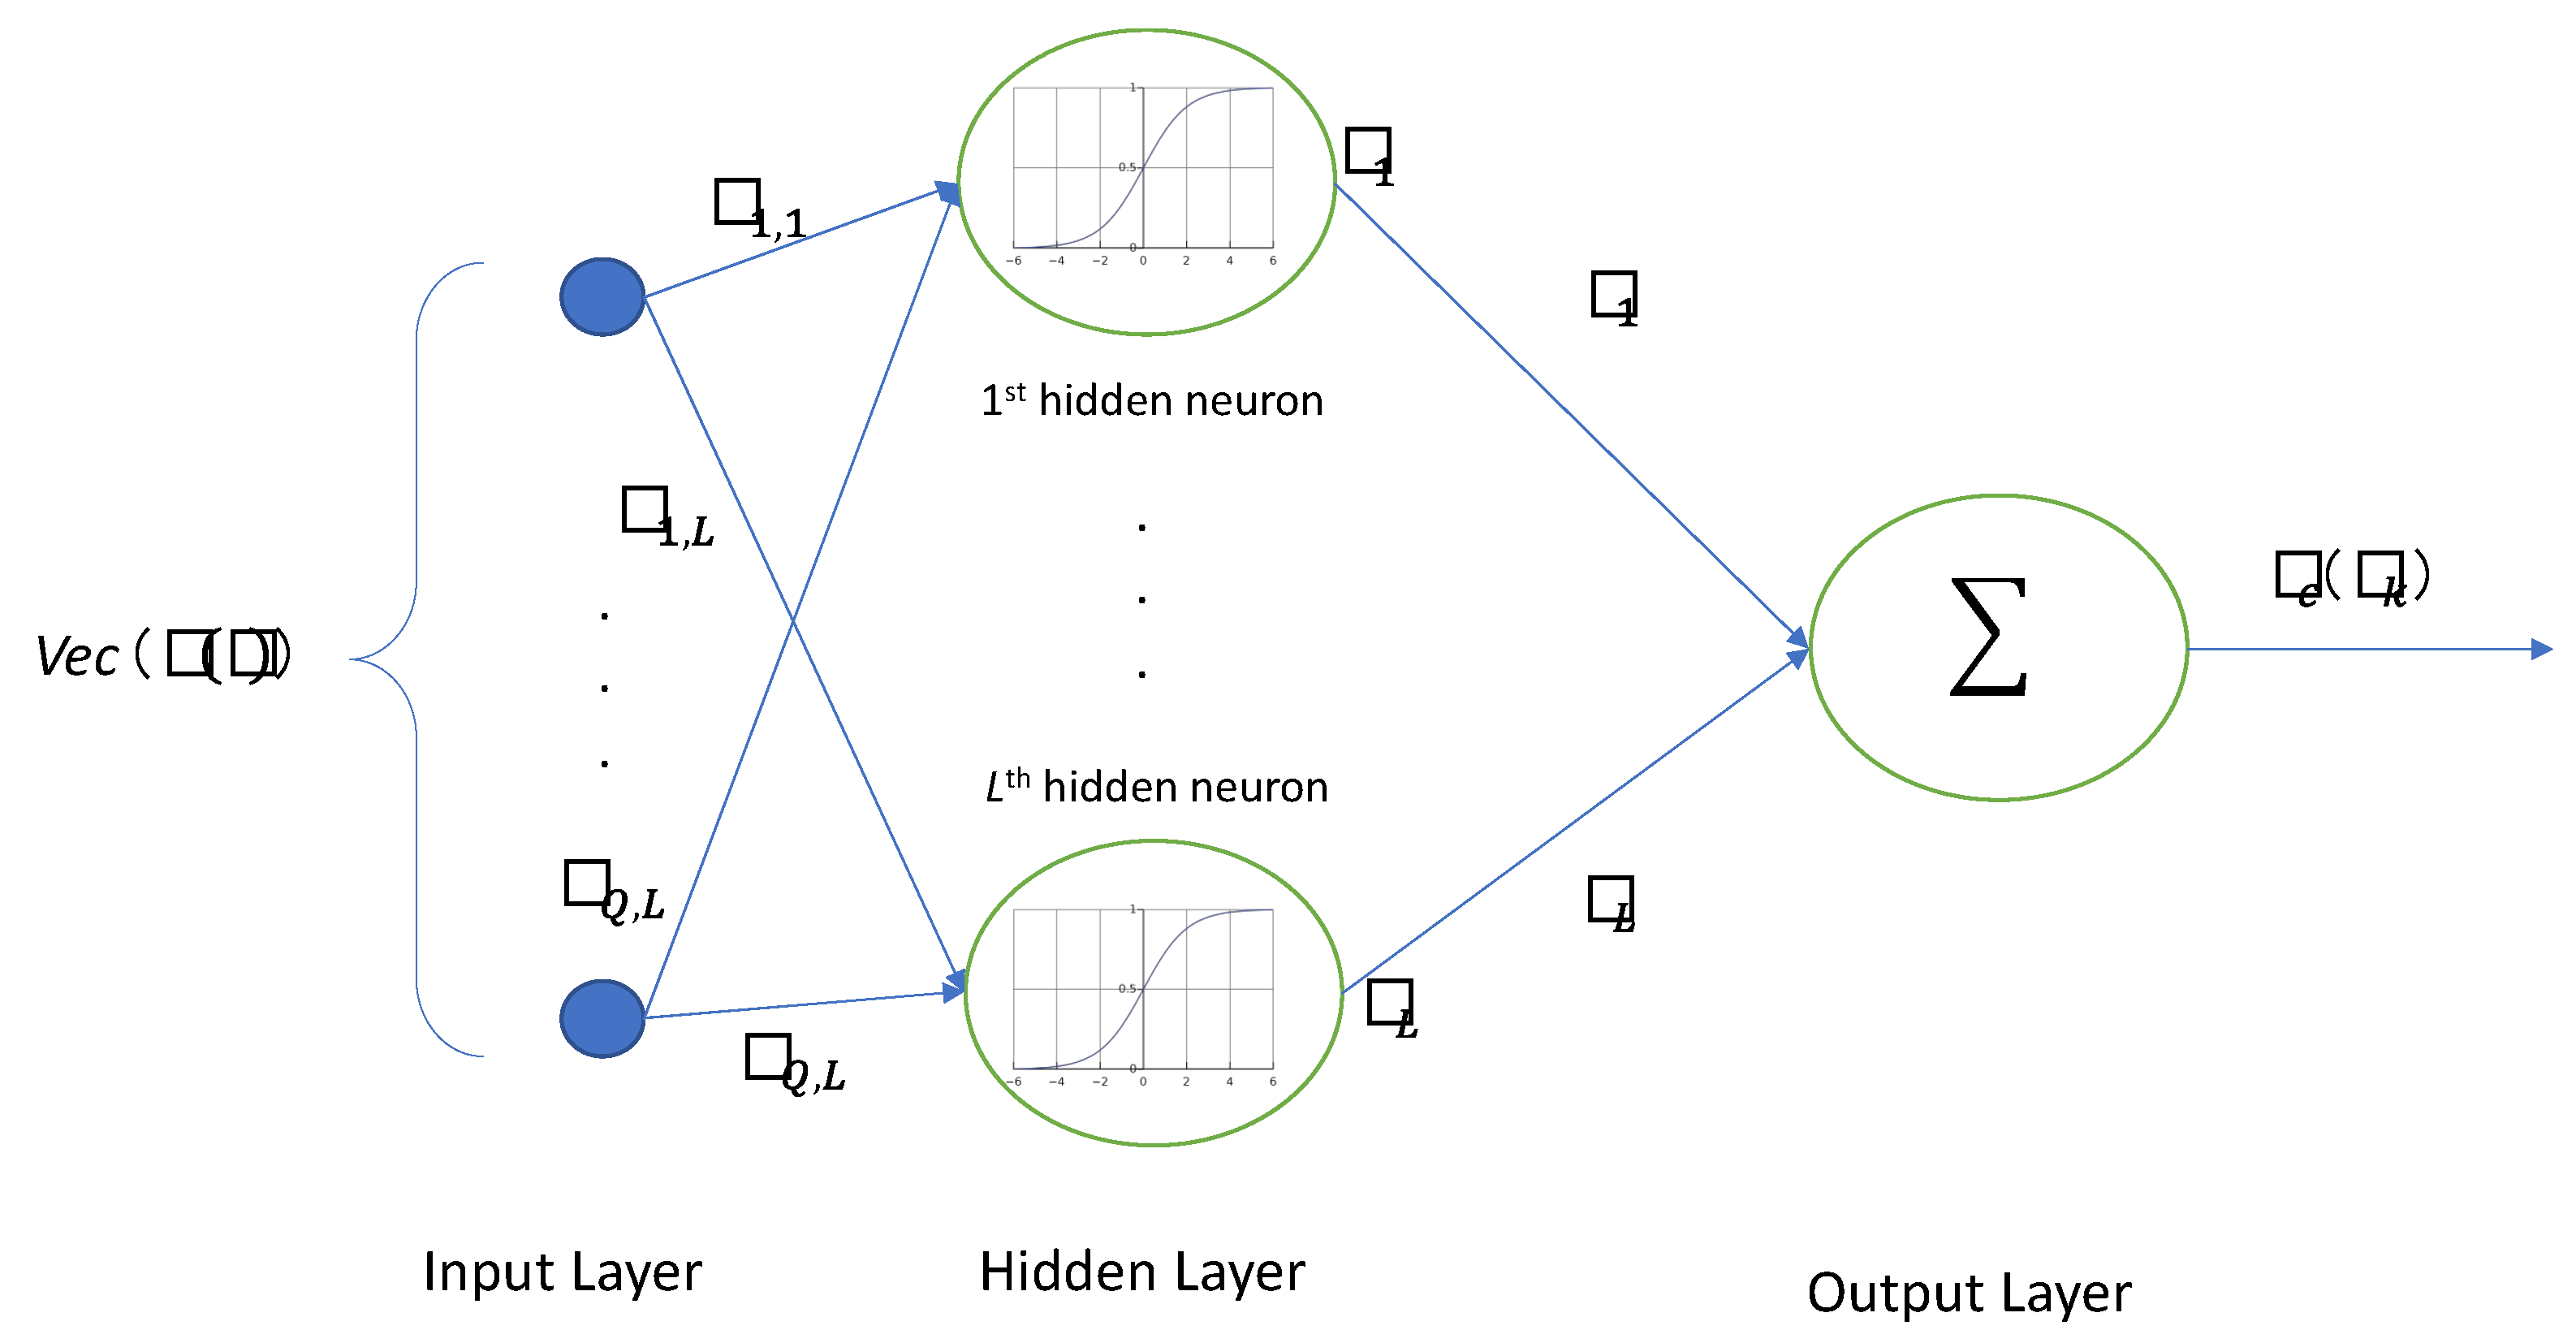
In particular, let us denote a feedforward neural network of one hidden layer of L neurons. The input matirx signal is first propagated into the L-neurons of the network. Each neuron approximates a non-linear operation based on the relationship of the sigmoid function. In other words, let us assume a weight that connects the i-th element of the input singal with the j-th hidden neuron out of L available. In this notation, we assume that the matrix input signal has been vectorized, creating elements of a vector. Therefore, the values of index ranges between and index .
Figure 2 presents the structure of a feedforward neural network of one hidden layer of
L neurons. Each neuron operates a non-linear relationship of sigmoid function, that is
. Initially, the matrix input vector
(see Equation (1)) is vectorized and consequently an input vector
of
dimension is created. This input signal
is propagated into the
L hidden neurons of the first hidden layer weights by the parameters
As we have stated, each neuron implements the sigmoid function, and therefore we have that:
In this notation,
is a vector including the output of the
L hidden neurons as a response of the sigmoid operation over the inner product of the output and the weights [
64]. In this notation, vector
includes all the weights connecting input element of
with the
i hidden neuron out of
L available.
The outputs of the
L hidden neurons are again propagated to the next output layer which is responsible for estimating the spatial coordinate for a space point. Therefore, we have that:
In Equation (5), the weights are the ones connecting the i-th hidden neuron with the output one. In this scenario, we assume that the spatial coordinates of the k-th space point can be estimated as a linear product of the hidden layer outputs and the weights .
4.4. Modeling Temporal Inter-Depenndencies of the Bluetooth Signal Distrortion
The main limitation of the proposed approach is that a feedforward neural network has no reccurrent capabilities. Therefore, it is not capable of modelling temporal relationships occurred in the Bluetooth signals. In order to address this drawback, in this paper, we propose an LSTM neural network model for predicting the spatial coordinates of the
k space points. LSTM is actually a Recurrent Neural Network (RNN) able to model long-range dependencies [
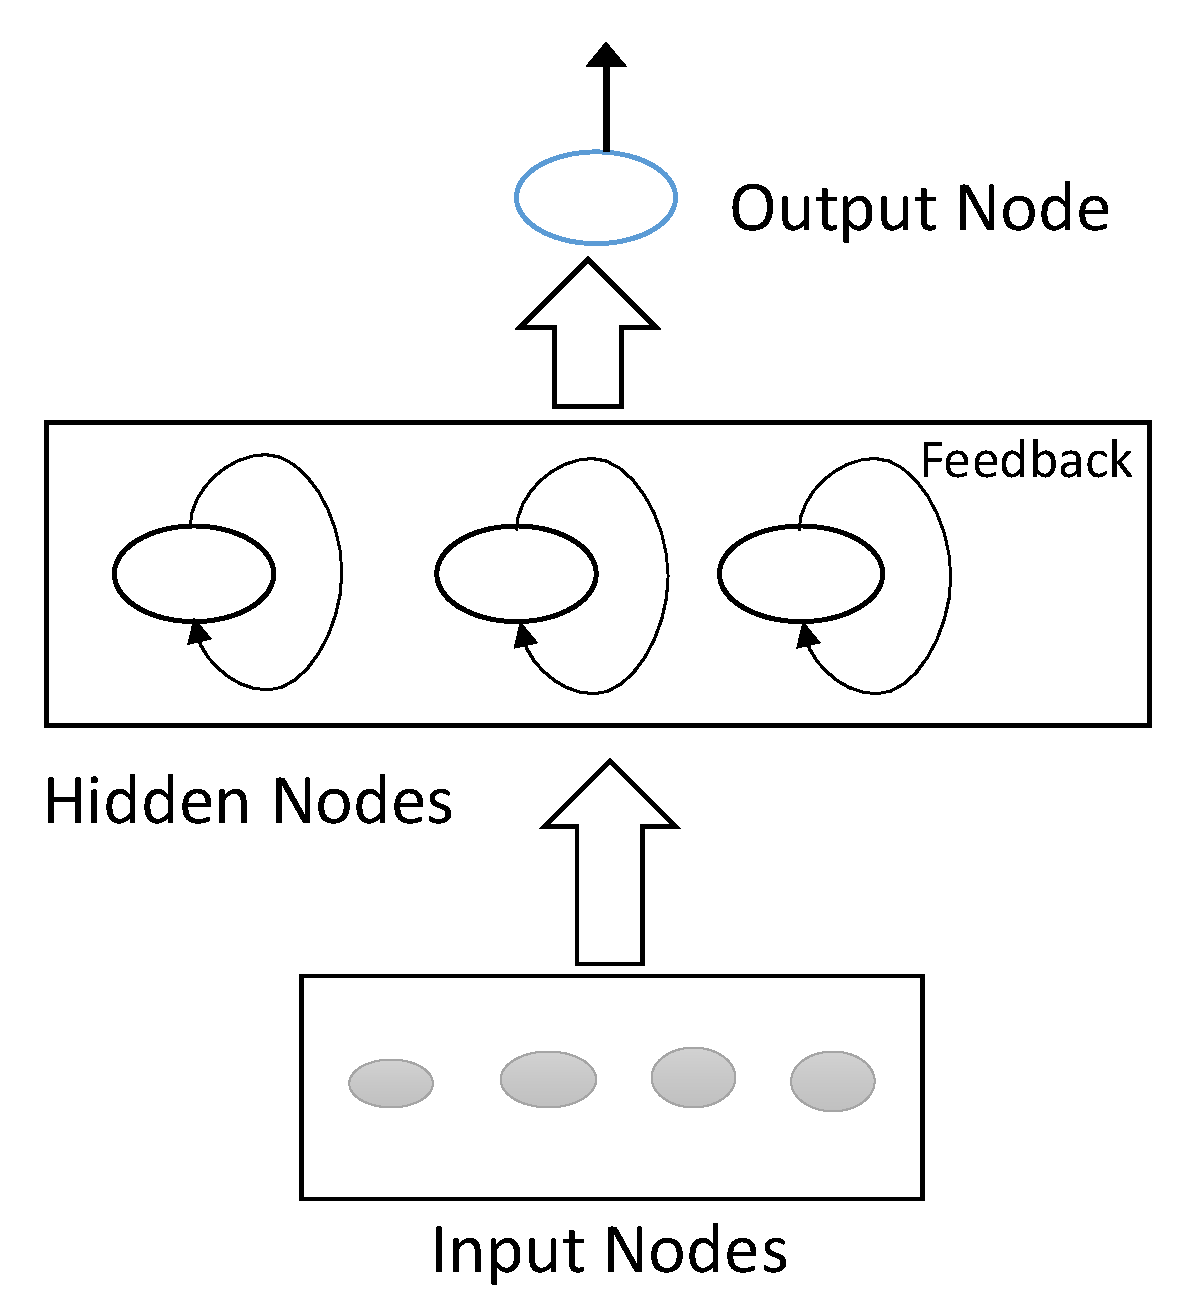
65]. The strucure of a RNN enables the ouput of a hidden layer neuron to feed back to its input at the next time interval. In this way, the RNN model is capable of modelling temporal relationships. In other words, we have:
In Equation (6), variables
and
are the wights controlling the effect of previous and next hidden layer neuron response on the current ouput. The weights
and
are of
L dimension.
Figure 3 presents the architecture of a RNN network [
62]. It is actually relied on a conventional feedforward neural network (see Secion 4.3) with recurrent capabilities between the hidden neurons.
4.5. Modeling Long-Range Temporal Dependencies
One forward and backward pass is not adequate to model the complicated temporal relationships of the Bluetooth signals. For this reason, in this paper, we adopted LSTM structures for predicting the spatial coordinates of the k space points, that is
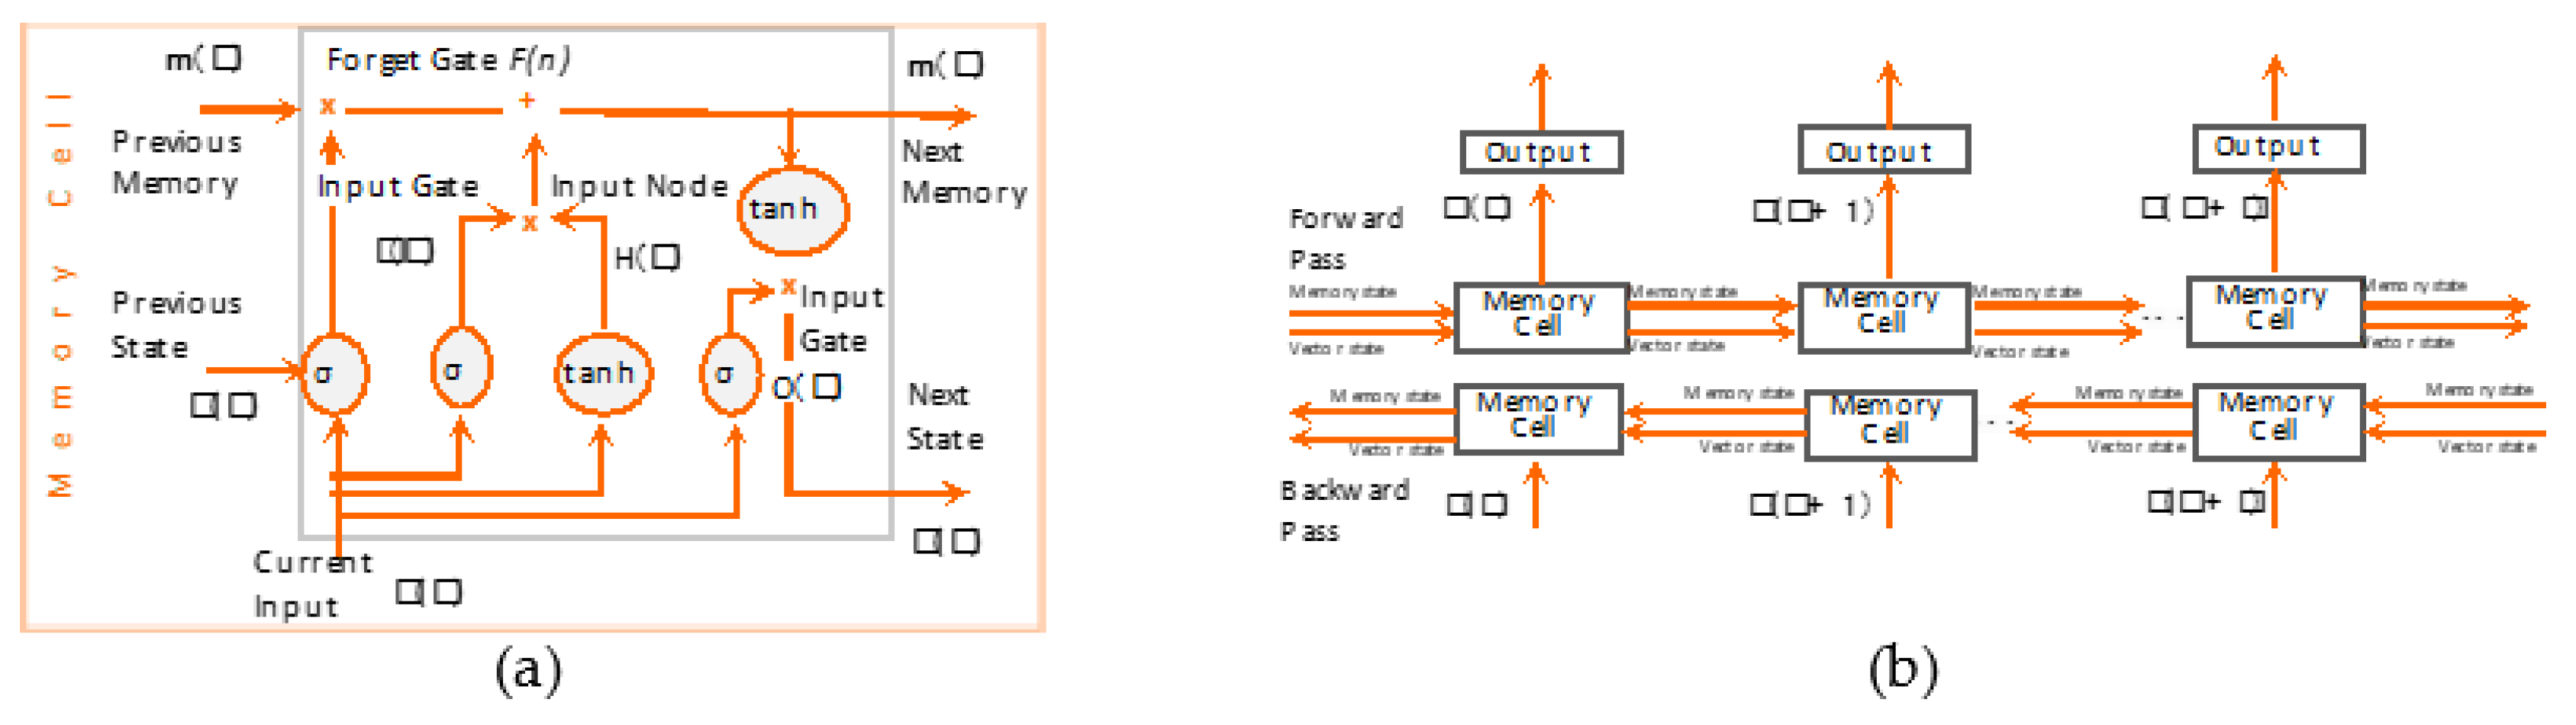
. The architecture of the proposed bi-directional LSTM network cells and how data are propagated through the architecture are shown in
Figure 4. The architecture of the proposed bi-directional LSTM network is shown in
Figure 4. In this context, bi-directional means that both forward and backward inter-dependencies are supported. This is an interesting aspect in predicting spatial coordinate information from the distribirtion of transmitted Bluetooth signals. Actually, our target is not to predict future signal samples, but to estimate a constast spatial value (space coordinates of target points) through the distrortion of the Bluetooth signals.
4.6. The Memory Cell
The heart of the adopted bi-directional LSTM neural network is the memory cell, which is depicted in
Figure 4a. The memory cell contains three different components: (i) the forget gate, (ii) the input gate and the input node and (iii) the output gate.
The forget gate: The purpose of this gate is to throw out information of the memory cell. The output takes values in the range of 0 and 1. This is mainly due to the sigmoid activation function, depicted with the symbol “σ” in
Figure 5.
The input node/gate: The input node operates in a similar manner compared to the hidden layer operation; the main activation function of this unit is “tanH”. This node regulates the significance of the input data.
The output gate: This regulates whether information of the current memory cell is “significant enough” to contribute to the next cell level.
Therefore, the operation of all the aforementioned modules is mathematically formulated by:
4.7. Bayesian Optimization
In this paper, the parameters of the LSTM model are estimated through the use of a Bayesian optimization policy similar to the approach adopted in [
66]. Selection of the Bayesian approach for LSTM neural network model approximation is mainly due to the fact that the relationship of how the parameters affect the performance of the network is actually unknown. For this reason, we assume that the parameters of the LSTM model follow a Gaussian distribution process [
67]. Let us denote by
a vector that contains configuration parameters of model
(see Equation (3)). Examples of the elements of the vector
are the number of hidden neurons in a hidden layer, the number of hidden layers, the type of non-liner relationship that a neuron implements (e.g., sigmoid or hyperbolic tangent). All these parameters are estimated using the Bayesian optimization approach presented in the following.
Let
denote a set of
different configurations referring to model
. In this way we denote as
the
i-th configuration out of the
available. Then, the error of the network (i.e., appliance model) over all training data
is given by:
In Equation (8), denotes the relationship of the non-linear function that the neural network implements on the configuration parameters of .
Given a set of configuration parameters
, the Bayesian optimization algorithm estimates the ones that minimizes the error of Equation (8).
Since the error of Equation (8) is actually unknown, we adopted a Bayesian optimization strategy for solving this problem.
4.7.1. Prior Distributions
Bayesian methods depend on a prior distribution assumption. In this paper, the error
is modeled as a Gaussian Process (
GP). A
GP models a distribution over function in a similar way that a Gaussian distribution models a distribution of a random variable and it is fully specified by the respective mean value and covariance [
68]:
In Equation (10),
denotes a Gaussian Process of zero mean value and variance of
. In this way, we model the unknown relationship of
as a
GP, and therefore, the input configuration vector affects the variance of the Gaussian through the function of
. A common choice of
is:
Equation (11) means that two points that are close together are expected to be highly correlated with each other. On the contrary, points far from each other have no influence. Equations (9) and (10) indicate that the distribution over the samples of set
(that is the
Q different network configurations) follows a multivariable Normal distribution of
, where
a
matrix of elements.
4.7.2. Posterior Distributions
Assuming the observations
(i.e., configuration parameters and respective errors derived from the configuration parameters) from previous iterations, we need to estimate the distribution of the error for a new parameter
. Then, the probability
follows a Normal distribution
of mean and standard deviation as follows [
69]:
where:
4.7.3. Optimization Strategy—Expected Improvement
To estimate the optimum configuration strategy, we first need to define the improvement function of the new configuration setup
:
Therefore, the next configuration setup is estimated as the one that maximizes the following equation:
Following the remaining steps of the approach proposed in [
70], we can estimate the optimal hyperparameters value.
5. Case Study
For assessing the performance of the proposed method, an experiment was setup at the school of School of Rural, Surveying and Geoinformatics engineering of the National Technical University of Athens. This academic environment was chosen only for experimental purposes, to test the performance of the proposed system. Accordingly, any other building with interior partitions, which can be considered as property units, could be used. Since we do not utilize any other services or infrastructures of the building, apart from its physical entity, we could claim that it can adequately simulate the building facilities of self-made cities, which consist of multi-level buildings with several property units. It is noted that in this specific experiment the main goal was to evaluate the proposed system, in terms of its ability to produce correct predictions of points coordinates. The collection of boundary points (partitions) and the construction of a floor plan will be carried out at a later stage of this research.
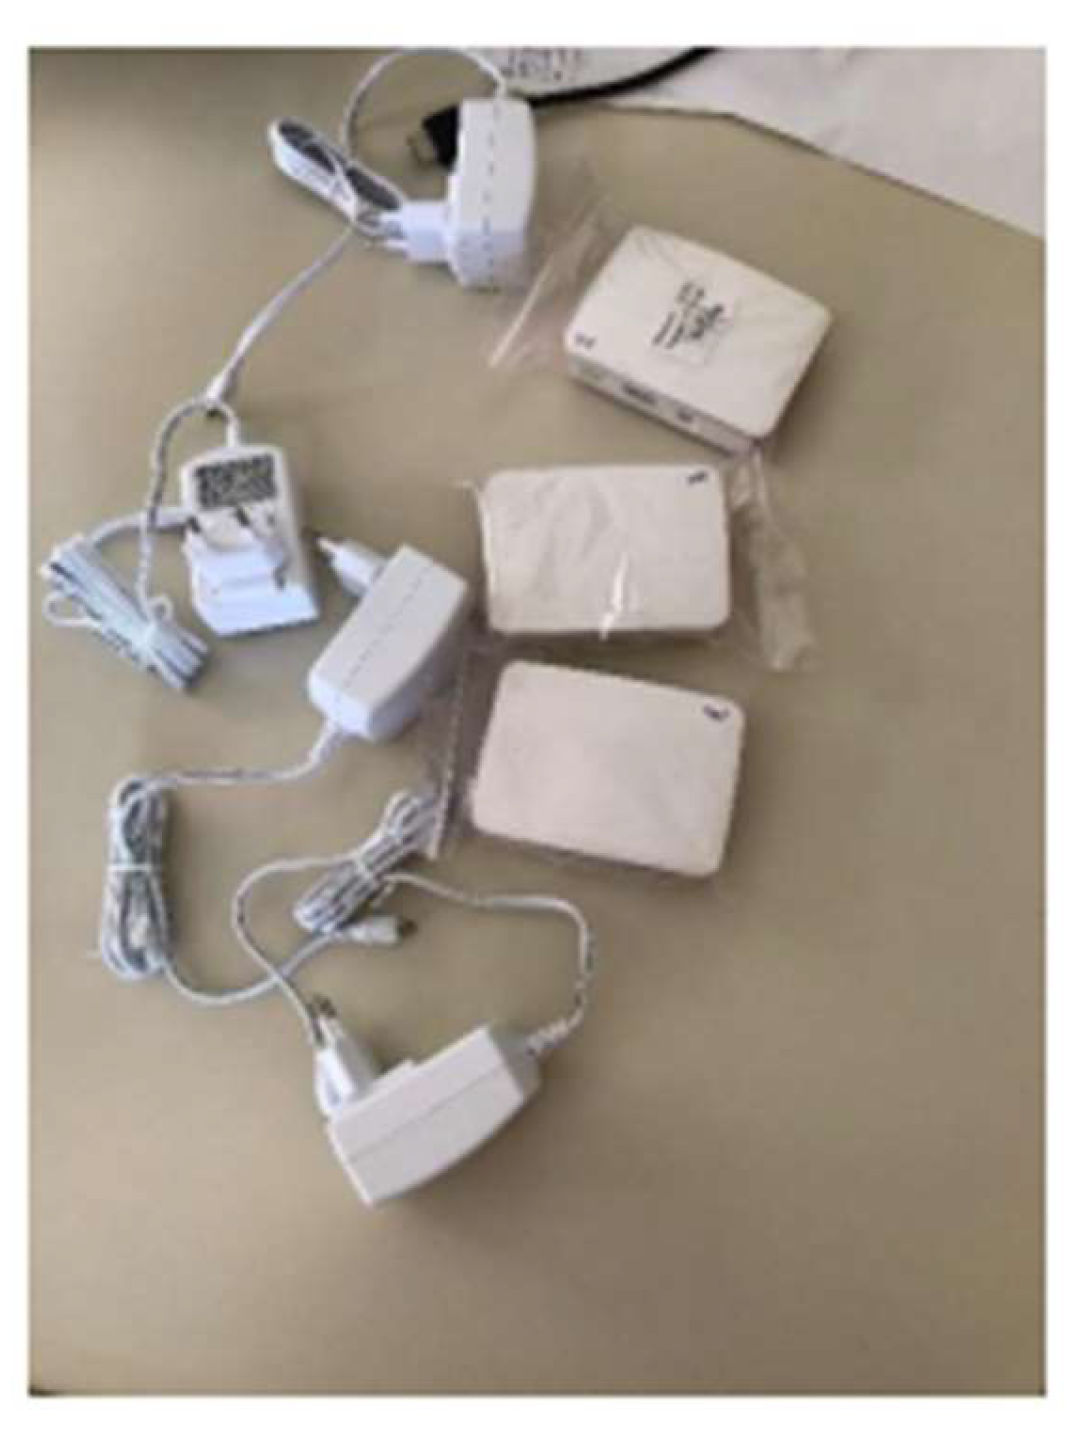
The test area consisted of an office room and a corridor with a total area of about 100 sq.m. This experiment included the use of four (4) Raspberry Pi devices (
Figure 6) in combination with a smart phone to take measurements about the Bluetooth signal strength, i.e., RSSI values from each antenna.
In the first phase of the practical experiment, a test dataset was generated. A total of 49 points were selected and marked, both in the office room and in the corridor. The goal was to create a canvas point grid and measure its vertices. Marking the canvas point grid in the office room was challenging due to the existing furniture and instruments. Thus, to proceed with the experiment, the non-occupied vertices of the established canvas point grid and points near to the occupied ones were selected to be measured. In addition, following a similar logic, additional points located on the walls of the studied building unit were also selected. The aim was to measure as many points as possible, evenly distributed in the test area, to train the LSTM network and evaluate the function the proposed technical system.
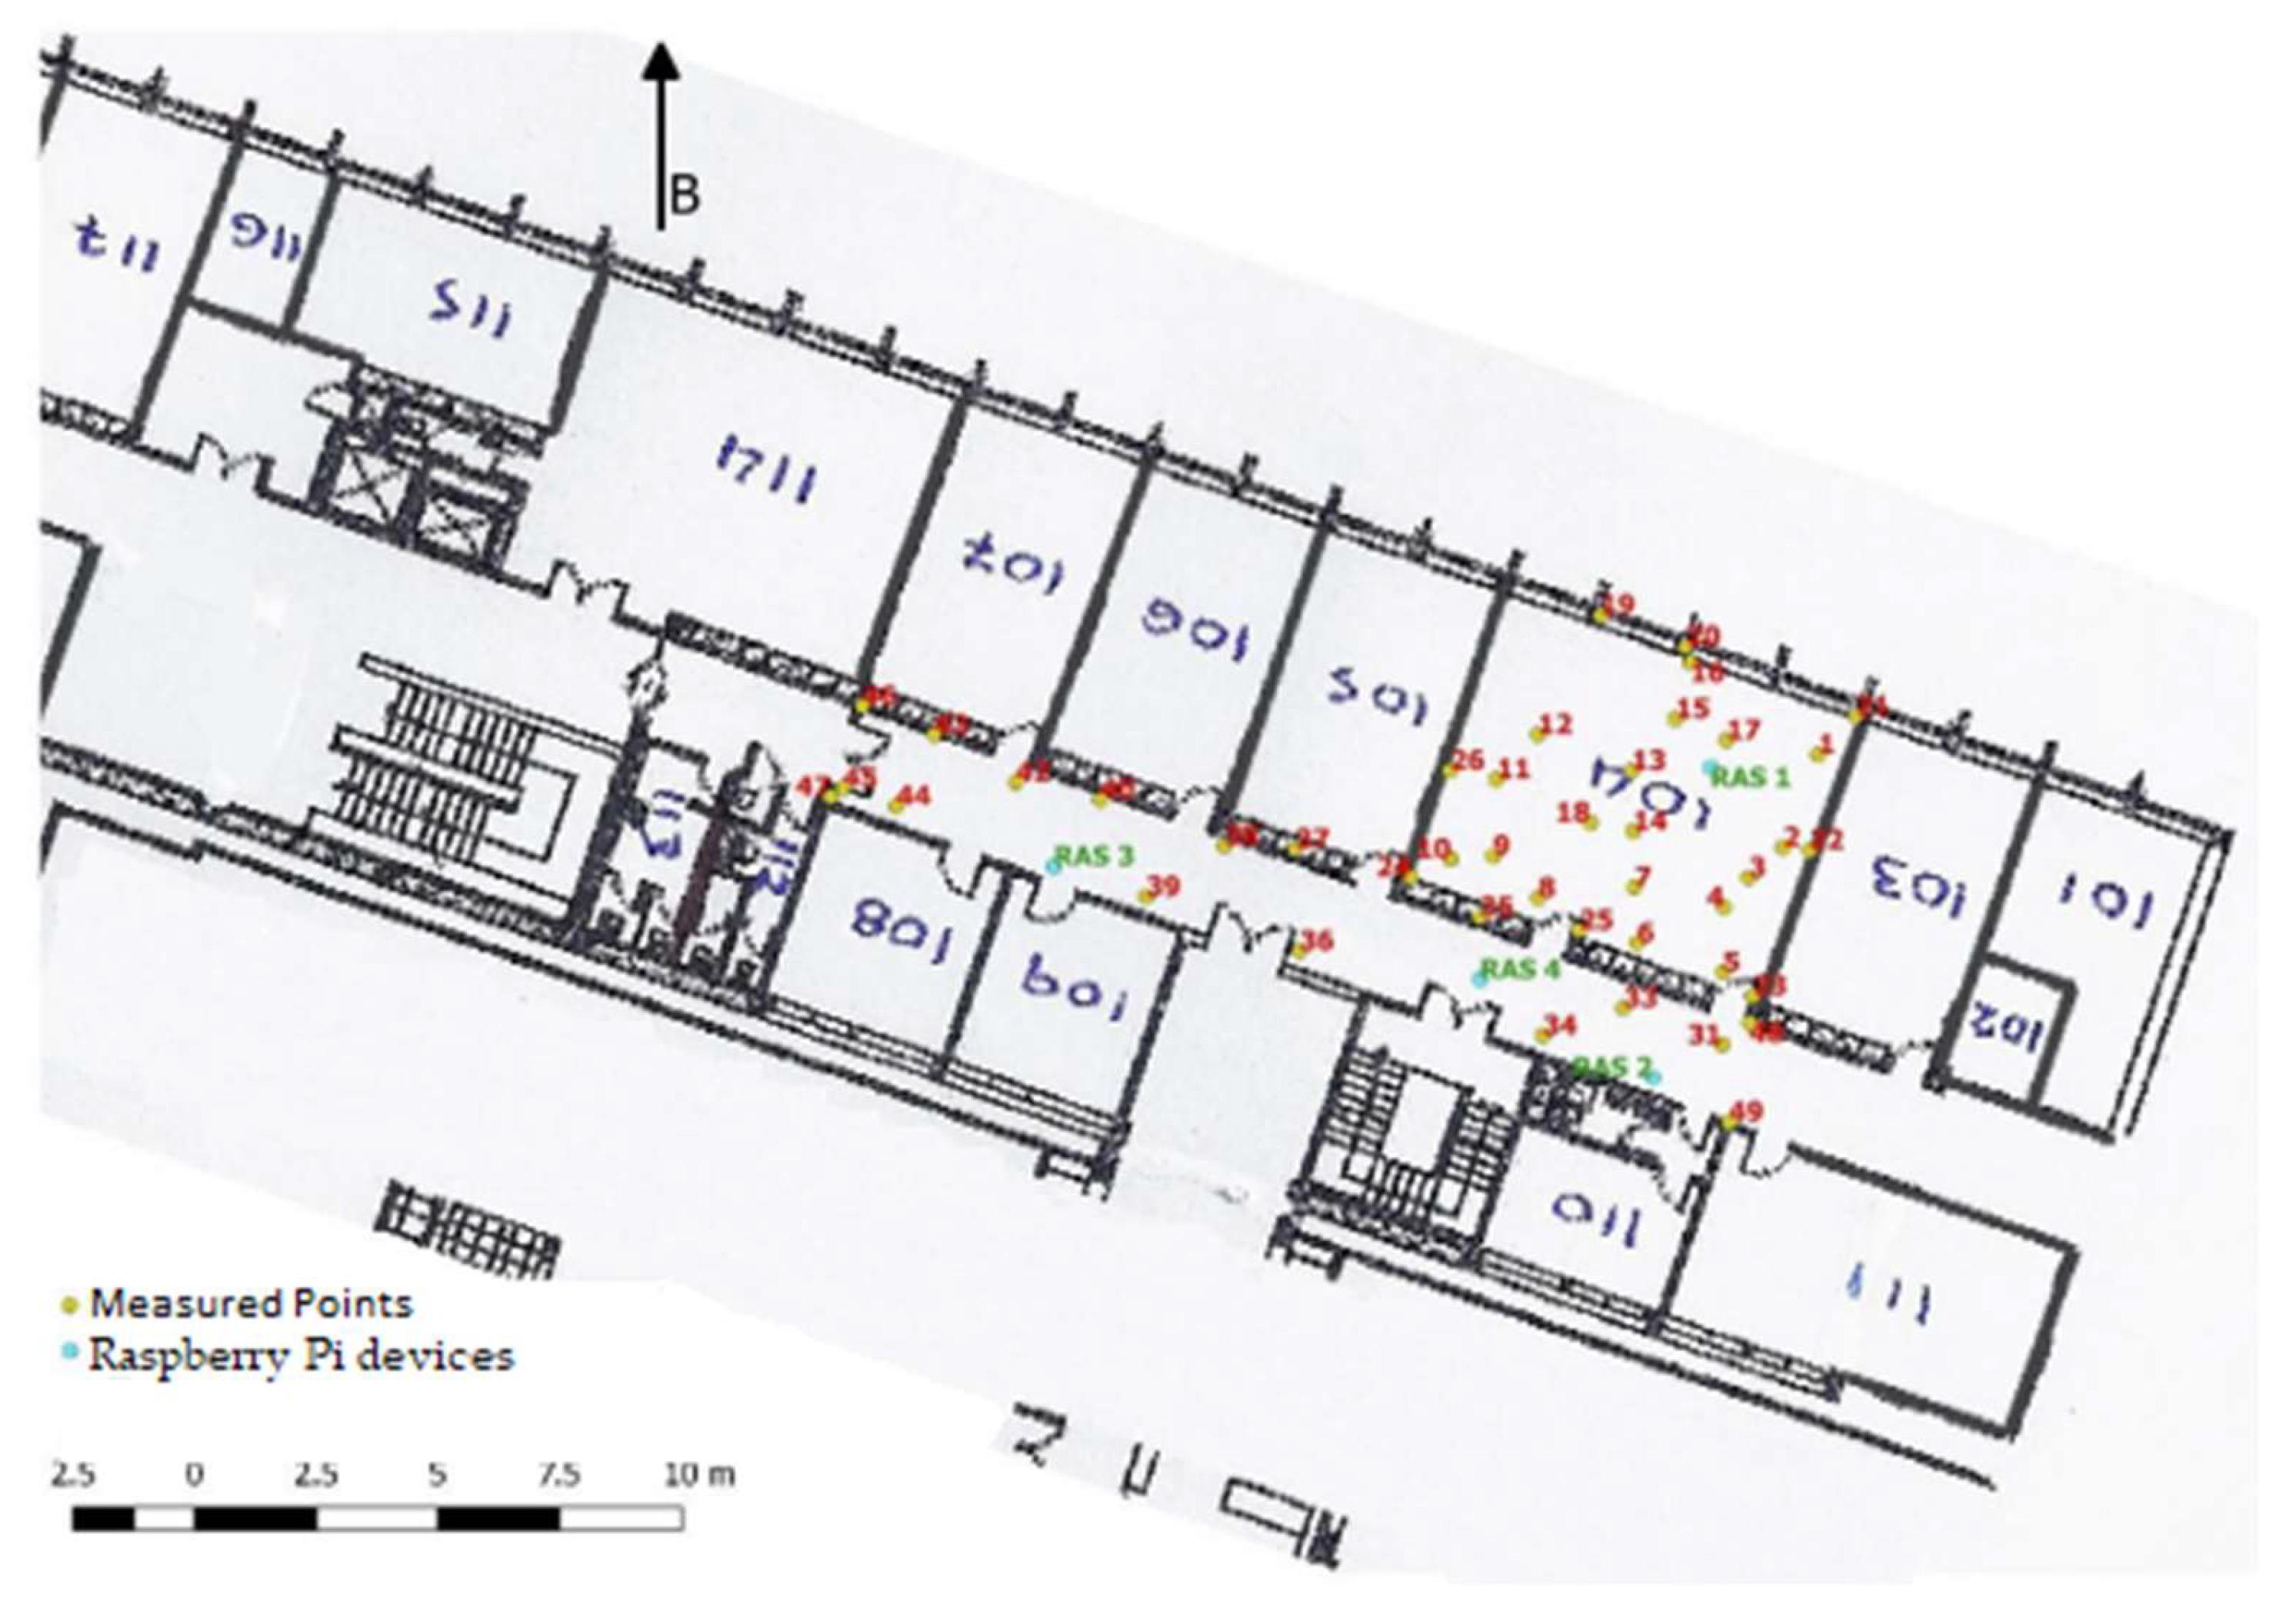
Once the 49 points were marked towards the test area, an open-end traverse tied at one end was established. Then, with the help of a total station the 49 points were captured (
Figure 7, in red). Once the traverse was resolved the 2D geodetic coordinated of the 49 measured points were obtained in a Greek Grid reference system.
Four of these vertices were then selected as deployment stations for the Raspberry Pi devices aiming to establish the IPS. These locations were selected appropriately so that Raspberry devices were evenly distributed in the study area. Thus, three devices were placed along the corridor and one in the office room with proper arrangement enabling the device in the office room to be connected with the ones located in the corridor. This was accomplished by placing one of the first three devices near the door of the office room. The distribution of the Raspberry Pi devices positions towards the study area is illustrated in
Figure 7 (in green).
Once the IPS was established, a member of our research team moved along the remaining 45 points of known coordinates holding a smart phone device with the Bluetooth enabled. Each Raspberry Pi device was receiving the following information: (a) the RSSI measurements between the Raspberry Pi and any other device with Bluetooth enabled, (b) the device ID and (c) the signal transmitting time. For each point, we held the Android device for five minutes standing on top of the spot. For every 5 s we took the average RSSI reading for the spot, resulting in 100 measurements for each spot. The RSSI readings were stored in the Raspberry Pi device and were then collected to be used for training and testing the machine learning model.
In the next step, we gathered the readings for the 45 different points in both the corridor and the office room at the School of Rural Surveying and Geoinformatics engineering. These measurements were used both for training and testing the LSTM architecture. The LSTM architecture was trained on the basis of two different scenarios. In the first scenario, the RSSI obtained from all four Raspberry Pi devices, namely RAS1, RAS2, RAS3 and RAS4, were utilized as input to the LSTM. In contrast, the second scenario investigates the performance of the LSTM when using the measurements from three out of four Raspberry Pi devices. More specifically, the second scenario included the measurements from RAS1, RAS2 and RAS3, excluding RAS4 (
Figure 7). The main objective of the second scenario was to investigate: (i) the performance of the developed system using fewer Raspberry Pi devices and (ii) the effect of the geometry and position of the Bluetooth sensors on the output. As shown in
Figure 7, RAS2 and RAS4 were very close to each other, so they had almost the same coverage range. Aiming to cover as much of the study area as possible, we decided to keep RAS 2, which was the most distant position from RAS1 and RAS3, and exclude RAS4.
In both scenarios, 10% of the measurement dataset was used for cross validation, while an 80:20 ratio was used for the remaining 90% of the dataset to separate the training and testing sets, i.e., the train set consisted of 400 measurements and the test set had 100 measurements. The model was trained using an Intel® Core™ i5 -7200U CPU (2.50 GHz) with Radeon™ R5 M430. The tested LSTM classifier consisted, beyond the necessary input and output layers, of 2 LSTM layers of 50 neurons with sigmoid activations. The time required for training the network was about 4 h, with the PC setup described above. However, the computation time for estimating a position after the model is trained was less than 1 s.
For the quantitative evaluations of LSTM performance on the basis of the two test scenarios, the commonly used metrics of accuracy, precision, recall and F1-score were selected. While these metrics are mainly used for classification problems, we modeled the regression problem that the model solves in a binary classification problem using the average error between the actual and predicted coordinates. Specifically, when the model predicted a location with an error of one meter, the prediction was considered successful.
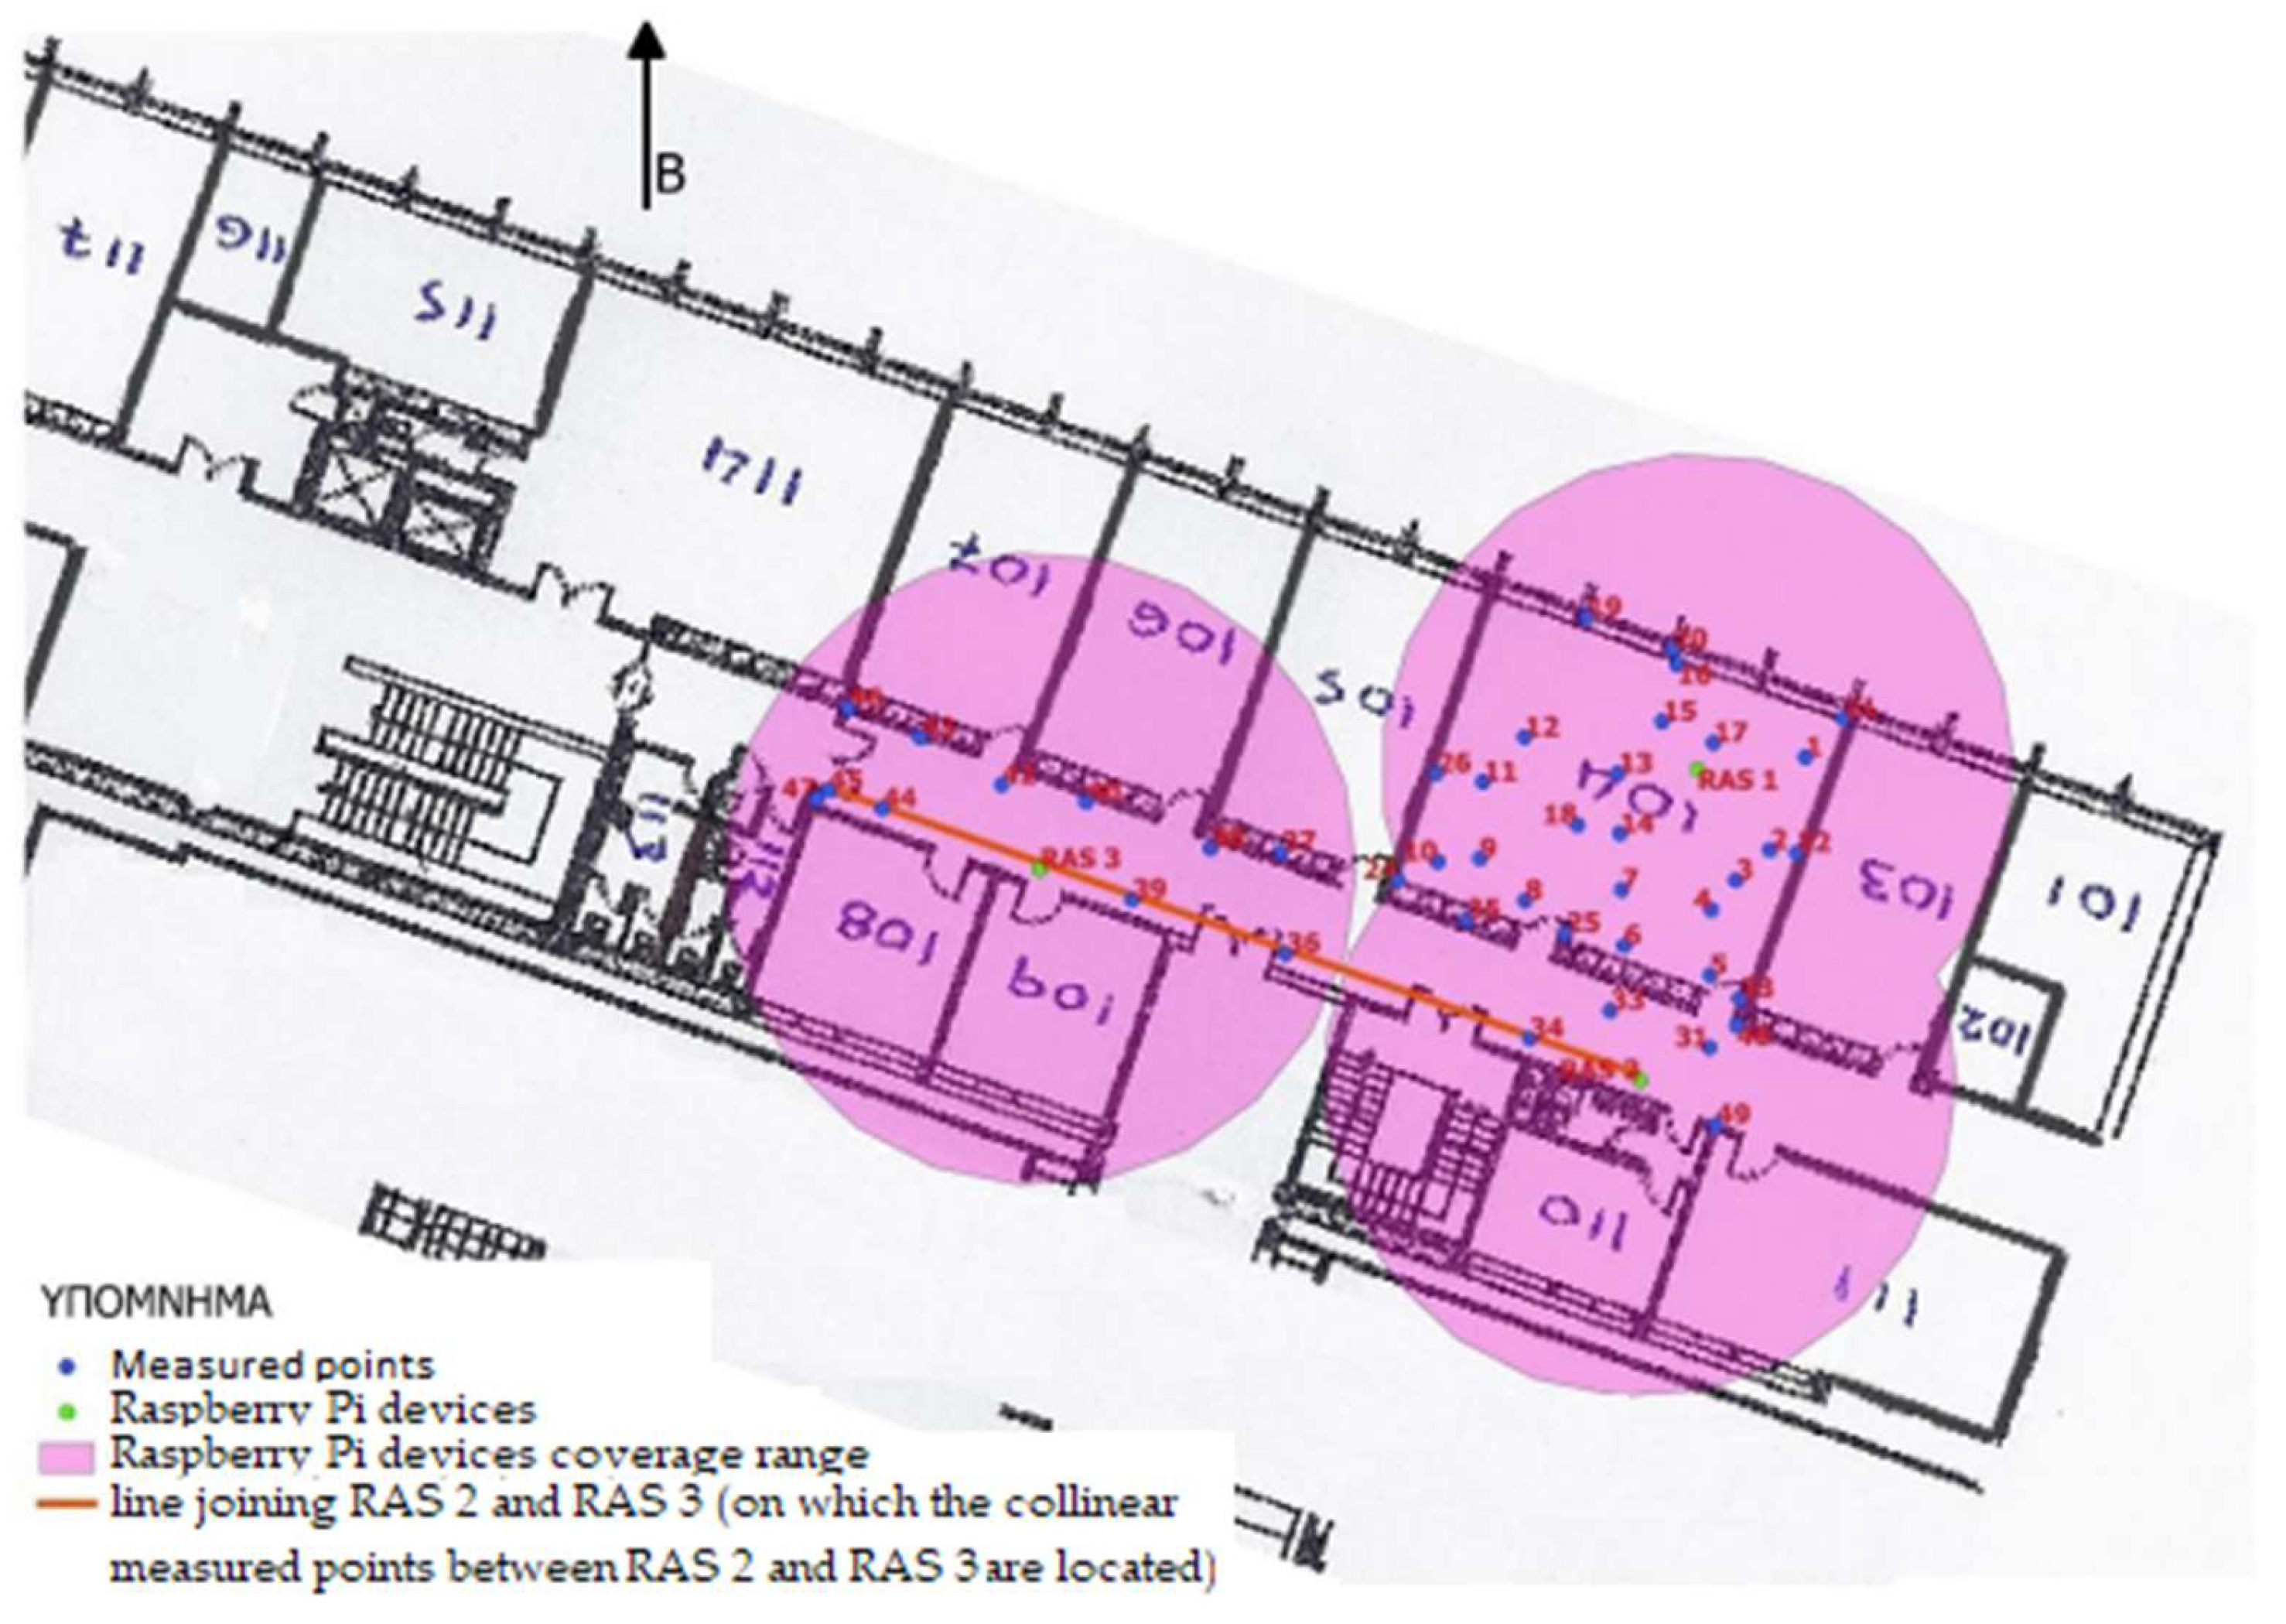
Table 1 shows the obtained performance results for both scenarios. According to these findings, scenario 1 prevails over scenario 2. This is due some drawbacks we encountered that concerned the position of the three Bluetooth devices of the second scenario. Initially, the positions of RAS3 and RAS2 were almost congruent with some points (such as 45, 44 and 47) which makes the prediction of the position of the points located within this conceivable line quite difficult. Furthermore, another important influence factor concerns the coverage range of each Raspberry device. In order to be able to accurately determine the position of a point, the coverage ranges of all three devices must be intersected. In the case of scenario 2 this was not applicable, thus leading to erroneous results (
Figure 8).
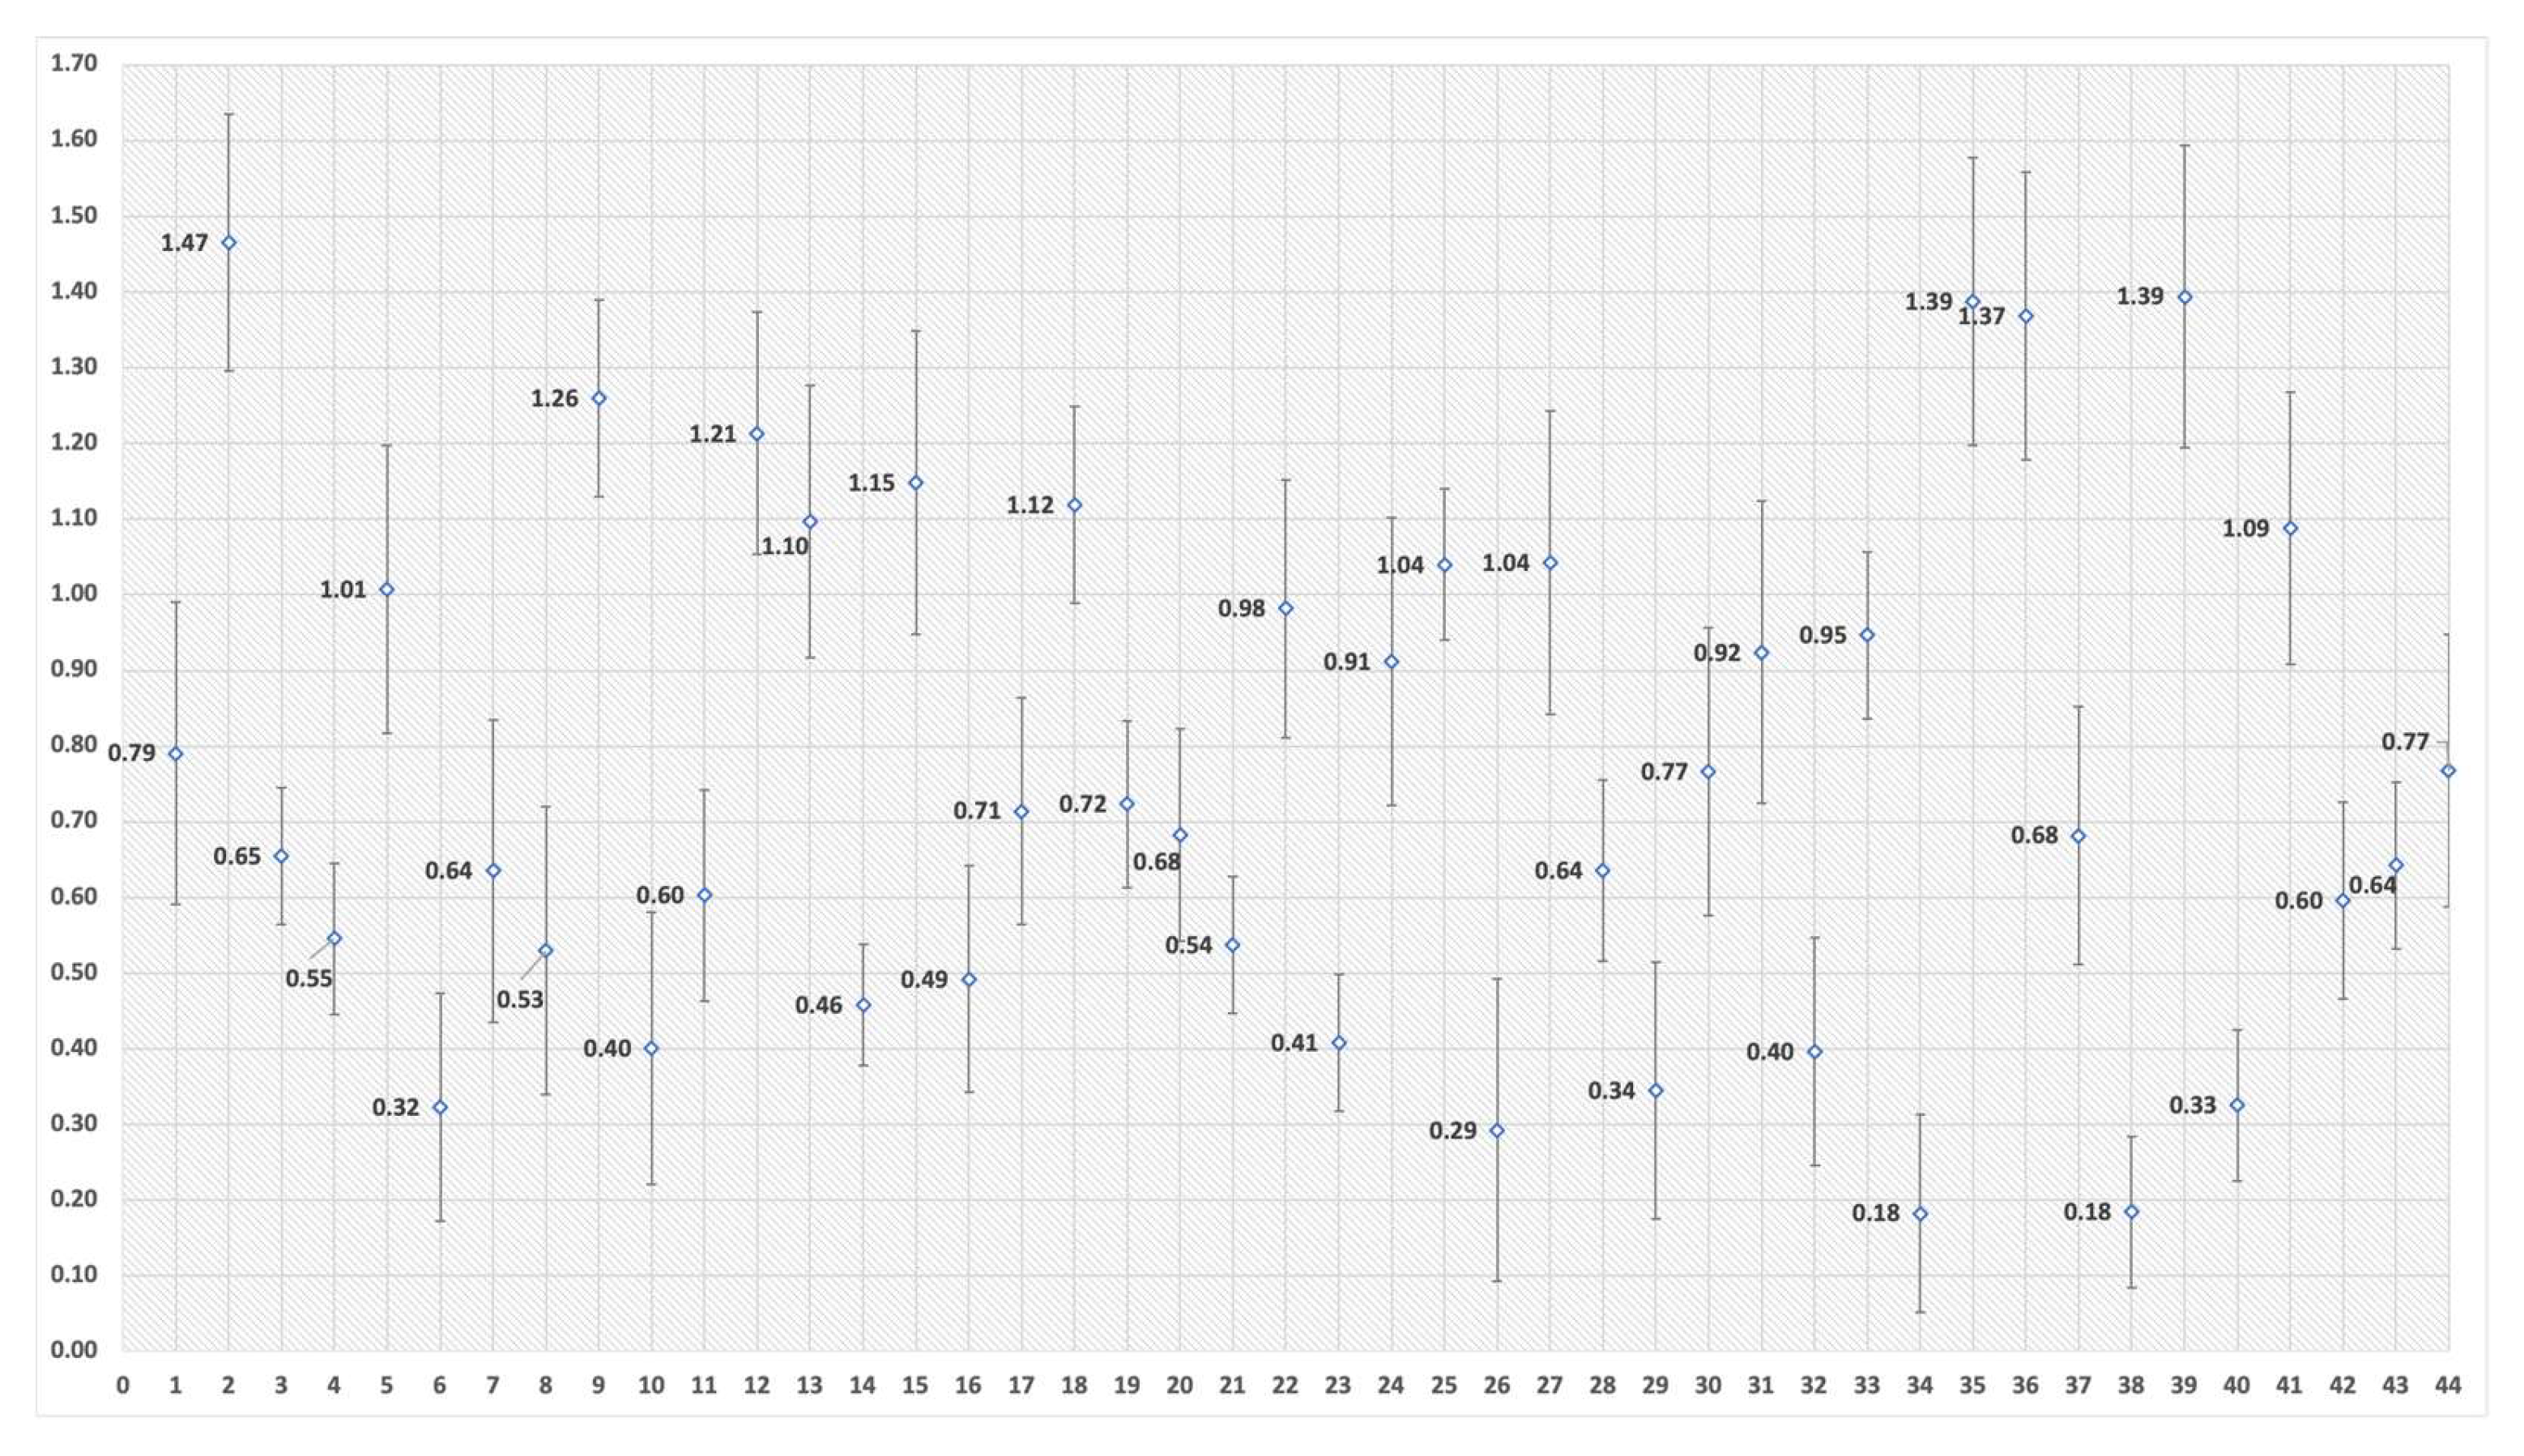
The final results of the experiments for the individual spots can be viewed in
Figure 9. The horizontal axis in this figure represents the various spots where we took measurements while in the vertical axis, we present the average distance between the actual value of the measurement and the predicted value of the measurement. Moreover, the standard deviation for all spots is presented in
Figure 9. The LSTM model yielded predicted values that have an average error of 76.6 cm with a standard deviation of 15.2 cm across all measurement points.
6. Discussion
Unlike the current LADM-based approaches for 3D Cadastre, the proposed technical solution investigates the potential exploitation of low-cost portable BLE technologies and machine learning techniques in order to provide an affordable, fast and reliable solution for the implementation of 2D/3D mobile-based crowdsourced cadastral surveys, in the absence of a reliable basemap. Through such basemap/background-free solution, the 3D LADM-based Cadastre concept can be applicable even in low-income areas with limited technical and financial resources.
The proposed technical approach enables the acquisition of the property’s boundaries coordinate measurement by the right holders, allowing them to gradually draft the outline of their property by moving towards the boundaries and capturing point features. As proved by the test implementation, the establishment of an IPS is relatively simple while the cost of the necessary equipment is tolerable. Additionally, the data capturing through the mobile device was fast, without requiring the user to have any special technical skills. The proposed solution can be effectively applied in both urban and suburban areas with simple or complex property rights. Of course, setting up an IPS requires a short planning concerning the placement of the Bluetooth devices so that the maximum possible amount of data can be collected. This pre-process will be the responsibility of the local team leaders aiming to ensure the efficiency of the surveys.
According to the practical implementation, the proposed LSTM architecture can reliably predict the spatial coordinates of the position of a mobile device along the coverage range of the Raspberry Pi devices. Results on two implementation scenarios show that four is the minimum acceptable number of Bluetooth devices in order to provide the best possible outcome for an area of about 100 sq.m. This stems from the fact that the achieved accuracy of the first scenario was 87.63% and about 83.47% for the second scenario. The percentage delta of 4.16% may not seem particularly large but its influence on the accuracy of the whole process is drastic. The average error across all measurement points was about 76.6 cm with a standard deviation of 15.2 cm. The achieved accuracy may not meet high accuracy requirements, but it is rather satisfactory considering the fixation fonts and its purpose. Nevertheless, in such fit-for-purpose crowdsourced projects there is always a trade-off between time and achieved accuracy. It should be mentioned that the achieved accuracy satisfies the current accuracy specifications of some countries, such as Greece (RMSExy for urban areas = 71 cm and RMSExy rural areas = 1.41 m).
According to the results of the experiment, the parameters that mostly affected the quality of the produced results are: (a) the distance of points from the bases of Raspberry devices, (b) the existing furniture, which can make it difficult to approach and measure some point features, (c) the geometry based on which the devices are placed into space and (d) the relative position between the devices.
As the next step of this research, the developed IPS and the crowdsourced cadastral mobile application are intended to be integrated and tested under real circumstances and different environments, and incorporating citizens with or without any special digital skills, aiming to obtain results capable of optimizing both the technical and methodological framework. In addition, the simultaneous processing of signals from heterogeneous sensors (e.g., Bluetooth and Wi-Fi signals) will be investigated. Other future research challenges will be the incorporation of novel deep learning architectures such as vision transformers or contemporary learning strategies like continual learning and self-supervision. Validation and quality control of the selected data is also within our future plans. An important future step for this application will be the training of a model from multiple buildings in order to increase accuracy. Finally, generative approaches should be studied, to create a framework that can deal with furnished areas that the user cannot access physically. Such approaches may be utilized to create an “unfurnished” model from a smaller model, where there are obstacles within some areas of the building unit.
Our main objective is to expand the proposed technical framework as much as possible, in order to cover the majority of all the possible alternatives, providing a flexible 3D cadastral solution.
7. Conclusions
This paper is a part of an ongoing research aligned with the global efforts for the implementation of 3D Cadastres. The goal is to develop low-cost and reliable technical processes for the immediate implementation of 3D cadastral systems everywhere, so that no one is left behind. This work focuses on the development of a technical solution suitable for the implementation of 2D/3D indoor cadastral surveys, in cases where there is no accurate registration basemap is available, as in the case of low-income areas with informal constructions. The use of low-cost Bluetooth technology, m-services and machine learning techniques for the establishment of the IPS, data capturing and processing seems to be beneficial towards the fulfillment of this objective. The results of the practical experiment are particularly satisfactory, with a localization accuracy of about 15.2 cm. Of course, the practical application is only a first attempt aiming to evaluate the performance of the proposed system.
We can safely state that the first results of the proposed technical solution have shown promising potential for the development of an “architectural plan-free” solution, able to simplify and speed up the 3D cadastral registration procedure. Thus, the immediate, fast and low-cost implementation of a fit-for-purpose 3D cadastral system may be feasible anywhere, resolving potential disputes and securing property RRRs.
Author Contributions
Conceptualization, C.P., N.D., N.B., M.G. and C.I.; Methodology, C.P., N.D., N.B., M.G. and C.I.; Software, N.B.; Validation, C.P., N.D., N.B. and M.G.; Formal analysis, C.P., N.D., N.B. and M.G.; Investigation, C.P., N.D., N.B. and M.G.; Data curation, N.B. and S.M.; Writing – original draft, C.P., N.D., N.B. and M.G.; Writing – review & editing, C.P., N.D., N.B., M.G. and C.I.; Visualization, M.G.; Supervision, C.P., N.D. and C.I.; Project administration, C.P., N.D. and C.I.. All authors have read and agreed to the published version of the manuscript.
Funding
This paper has received funding from the European Union’s Horizon 2020 research and innovation program under the Marie Skłodowska-Curie grant agreement No 872931, YADES "Improved Resilience and Sustainable Reconstruction of Cultural Heritage Areas to cope with Climate Change and Other Hazards based on Innovative Algorithms and Modelling Tools".
Data Availability Statement
The data presented in this study are available on request from the corresponding author.
Acknowledgments
The contribution of Maria Gkeli to this research is part of her PhD dissertation, which is supported by the Onassis Foundation scholarship program and the Hellenic Foundation for Research and Innovation (H.F.R.I).
Conflicts of Interest
The authors declare no conflict of interest.
References
- ISO 19152:2012 Geographic information—Land Administration Domain Model (LADM). Available online: www.iso.org/iso/home/store/catalogue_tc/catalogue_detail.htm?csnumber=51206 (accessed on 15 September 2020).
- van Oosterom, P. Research and development in 3D cadastres. Comput. Environ. Urban Syst. 2013, 40, 1–6. [Google Scholar] [CrossRef]
- Lemmen, C.; Oosterom, P.; Bennett, R. The land administration domain model. Land Use Policy 2015, 49, 535–545. [Google Scholar] [CrossRef] [Green Version]
- Griffith-Charles, C.; Sutherland, M. 3D cadastres for densely occupied informal situations: Necessity and possibility. Land Use Policy 2019, 98, 1–8. [Google Scholar] [CrossRef]
- Kitsakis, D.; Apostolou, C.; Dimopoulou, E. Three-dimensional cadastre modelling of customary real property rights. Surv. Rev. 2016, 50, 107–121. [Google Scholar] [CrossRef]
- Kitsakis, D.; Kalantari, M.; Rajabifard, A.; Atazadeh, B.; Dimopoulou, E. Exploring the 3rd Dimension within Public Law Restrictions: A Case Study of Victoria, Australia. Land Use Policy 2019, 85, 195–206. [Google Scholar] [CrossRef]
- Oldfield, J.; Bergs, R.; Oosterom, P.; Krijnen, T.F.; Galano, M.M. 3D Cadastral Lifecycle: An Information Delivery Manual ISO 29481 for 3D Data Extraction from the Building Permit Application Process. In Proceedings of the 7th International FIG Workshop on the Land Administration Domain Model, Zagreb, Croatia, 11–13 April 2018; pp. 153–170. [Google Scholar]
- Stoter, J.; Ploeger, H.; Roes, R.; van der Riet, E.; Biljecki, P.; Ledoux, H. First 3D Cadastral Registration of Multi-level Ownerships Rights in the Netherlands. In Proceedings of the 5th International FIG 3D Cadastre Workshop, Athens, Greece, 18–20 October 2016; pp. 491–504. [Google Scholar]
- Stoter, J.; van Oosterom, P.; Ploeger, H. The phased 3D cadastre implementation in the Netherlands. In Proceedings of the 3rd International Workshop on 3D Cadastres, Shenzhen, China, 25–26 October 2012; Van Oosterom, P., Guo, R., Li, L., Ying, S., Angsüsser, S., Eds.; 2012; pp. 201–218. [Google Scholar]
- Vučić, N.; Mađer, M.; Vranić, S.; Roić, M. Initial 3D cadastre registration by cadastral resurvey in the Republic of Croatia. Land Use Policy 2020, 98, 104335. [Google Scholar] [CrossRef]
- Lee, B.M.; Kim, T.J.; Kwak, B.Y.; Lee, Y.H.; Choi, J. Improvement of the Korean LADM country profile to build a 3D cadastre model. Land Use Policy 2015, 49, 660–667. [Google Scholar] [CrossRef]
- Zulkifli, N.A.; Abdul Rahman, A.; Van Oosterom, P.J.M. An overview of 3D topology for LADM-based objects. Int. Arch. Photogramm. Remote Sens. Spat. Inf. Sci. 2015, XL-2/W4, 71–73. [Google Scholar] [CrossRef] [Green Version]
- Vandysheva, N.; Tikhonov, V.; Van Oosterom, P.J.M.; Stoter, J.E.; Ploeger, H.D.; Wouters, R.; Penkov, V. 3D Cadastre modelling in Russia. In Proceedings of the FIG Working Week 2011" Bridging the Gap between Cultures" & 6th National Congress of ONIGT, Marrakech, Morocco, 18–22 May 2011; International Federation of Surveyors (FIG): Delft, The Netherlands; Ordre National des Ingénieurs Géomètres Topographes (ONIGT): Rabat, Morocco, 2011. [Google Scholar]
- Vandysheva, N.; Ivanov, A.; Pakhomov, S.; Spiering, B.; Stoter, J.; Zlatanova, S.; van Oosterom, P. Design of the 3D Cadastre Model and Development of the Prototype in the Russian Federation. In Proceedings of the 2nd International Workshop on 3D Cadastres, Delft, The Netherlands, 16–18 November 2011; pp. 355–375. [Google Scholar]
- Gürsoy Sürmeneli, H.; Koeva, M.; Alkan, M. The Application Domain Extension (ADE) 4D Cadastral Data Model and Its Application in Turkey. Land 2022, 11, 634. [Google Scholar] [CrossRef]
- Alattas, A.; van Oosterom, P.; Zlatanova, S.; Diakité, A.A.; Yan, J. Developing a database for the LADM-IndoorGML model. In Proceedings of the 6th International FIG Workshop on 3D Cadastres, Delft, The Netherlands, 2–4 October 2018; International Federation of Surveyors (FIG): Delft, The Netherlands, 2018; pp. 261–277. [Google Scholar]
- Alattas, A.; Oosterom, P.; Zlatanova, S. Deriving the technical model for the indoor navigation prototype based on the integration of IndoorGML and LADM conceptual model. In Proceedings of the 7th International FIG Workshop on the Land Administration Domain Model, Zagreb, Croatia, 11–13 April 2018; pp. 245–267. [Google Scholar]
- Alattas, A.; Zlatanova, S.; Oosterom, P.; Chatzinikolaou, E.; Lemmen, C.; Li, K.J. Supporting Indoor Navigation Using Access Rights to Spaces Based on Combined Use of IndoorGML and LADM Models. ISPRS Int. J. GeoInform. 2017, 6, 384. [Google Scholar] [CrossRef]
- Atazadeh, B.; Olfat, H.; Rajabifard, A.; Kalantari, M.; Shojaei, D.; Marjani, A.M. Linking Land Administration Domain Model and BIM environment for 3D digital cadastre in multi-storey buildings. Land Use Policy 2021, 104, 105367. [Google Scholar] [CrossRef]
- Petronijević, M.; Višnjevac, N.; Praščević, N.; Bajat, B. The Extension of IFC For Supporting 3D Cadastre LADM Geometry. ISPRS Int. J. Geo-Inf. 2021, 10, 297. [Google Scholar] [CrossRef]
- Guler, D.; van Oosterom, P.; Yomralioglu, T. How to exploit BIM/IFC for 3D registration of ownership rights in multi-storey buildings: An evidence from Turkey. Geocarto Int. 2022. just-accepted. [Google Scholar] [CrossRef]
- Atazadeh, B.; Rajabifard, A.; Kalantari, M. Connecting LADM and IFC Standards—Pathways towards an Integrated Legal-Physical Model. In Proceedings of the 7th International FIG Workshop on the Land Administration Domain Model, Zagreb, Croatia, 11–13 April 2018; pp. 89–102. [Google Scholar]
- Oldfield, J.; Oosterom, P.; Quak, W.; Veen, J.; Beetz, J. Can Data from BIMs be Used as Input for a 3D Cadastre? In Proceedings of the 5th International FIG 3D Cadastre Workshop, Athens, Greece, 18–20 October 2016; pp. 199–214. [Google Scholar]
- Çağdas, V.; Stubkjær, E.; de Vries, W.T.; van der Merwe, C.; Paasch, J.M.; Paulsson, J.; Schwery, N.; Ploeger, H.; Is¸ıkdag, Ü.; Kara, A. Co-ownership shares in condominiums–A comparison across jurisdictions and standards: Long version. In Proceedings of the 6th International FIG 3D Cadastre Workshop, Delft, The Netherlands, 2–4 October 2018; International Federation of Surveyors (FIG): Delft, The Netherlands, 2018. [Google Scholar]
- Gkeli, M.; Potsiou, C.; Soile, S.; Vathiotis, G.; Cravariti, M.E. A BIM-IFC Technical Solution for 3D Crowdsourced Cadastral Surveys Based on LADM. Earth 2021, 2, 605–621. [Google Scholar] [CrossRef]
- UNECE. Self-Made Cities: In Search of Sustainable Solutions for Informal Settlements in the United Nations Economic Commission for Europe Region; United Nations: New York, NY, USA; Geneva, Switzerland, 2009. [Google Scholar]
- Forbes, E.I. On the frontier of urbanization: Informal settlements in Yangon, Myanmar. Indep. J. Burmese Scholarsh. 2016, 1, 197–238. [Google Scholar]
- UNECE. Policy Framework for Sustainable Real Estate Markets; UNECE: Geneva, Switzerland, 2019; Available online: https://unece.org/housing-and-land-management/publications/policy-framework-sustainable-real-estate-markets-0 (accessed on 14 September 2022).
- Bouwmeester, J.; Hartmann, T. Unraveling the self-made city: The spatial impact of informal real estate markets in informal settlements. Cities 2021, 108, 102966. [Google Scholar] [CrossRef]
- Storey, A.D. Implicit or illicit? Self-made infrastructure, household waters, and the materiality of belonging in Cape Town. Water Altern. 2021, 14, 79–96. [Google Scholar]
- Potsiou, C.; Nystrom, S. Guidelines for the Formalization of Informal Constructions; United Nations: Geneva, Switzerland, 2019. [Google Scholar]
- UNECE. COVID-19 Recovery Action Plan for Informal Settlements in the ECE Region; UNECE: Geneva, Switzerland, 2022. [Google Scholar]
- United Nations. The UN Sustainable Development Goals; United Nations: New York, NY, USA, 2015; Available online: http://www.un.org/sustainabledevelopment/summit/ (accessed on 14 September 2022).
- Jain, S.P.; Polman, W. A Handbook for Trainers on Participatory Local Development; RAP Publication: Bangkok, Thailand, 2003. [Google Scholar]
- Molendijk, M.; Dukon, T.S.; Lemmen, C.; Morales, J.; Endo, V.; Rodriguez, S.R.; Dueñas, J.F.G.; Sanchez, I.E.M.; Spijkers, P.; Unger, E.M.; et al. Land and Peace in Colombia: FFP methodology for field data collection and data handling. In Proceedings of the World Bank Land and Poverty Conference, Washington, DC, USA, 22 March 2018. [Google Scholar]
- Jones, B.; Lemmen, C.H.J.; Molendijk, M. Low Cost, Post Conflict Cadastre with Modern Technology. In Responsible Land Governance: Towards and Evidence Based Approach, Washington, D.C. March 20–24, 2017: Proceedings of the Annual World Bank Conference on Land and Poverty; The World Bank: Washington, DC, USA, 2017; Available online: https://www.conftool.com/landandpoverty2017/index.php?page=browseSessions&form_session=35&mode=list&presentations=show (accessed on 3 September 2020).
- Ribeiro, S.C.L.; Daniel, M.N.; Abiko, A. ZEIS maps: Comparing areas to be earmarked exclusively for social housing in São Paulo city. Land Use Policy 2016, 58, 445–455. [Google Scholar] [CrossRef]
- Erba, D.; Piumetto, M. 3D Cadastre in the Federal Countries of Latin America. In Proceedings of the FIG Working Week 2012, Rome, Italy, 6–10 May 2012. [Google Scholar]
- Griffith-Charles, C.; Sutherland, M. Analysing the costs and benefits of 3D cadastres with reference to Trinidad and Tobago. Comput. Environ. Urban Syst. 2013, 40, 24–33. [Google Scholar] [CrossRef]
- Gkeli, M.; Potsiou, C.; Ioannidis, C. A technical solution for 3D crowdsourced cadastral surveys. Land Use Policy 2020, 98, 1–14. [Google Scholar] [CrossRef]
- Potsiou, C.; Doulamis, N.; Bakalos, N.; Gkeli, M.; Ioannidis, C. Indoor localization for 3d mobile cadastral mapping using machine learning techniques. ISPRS Ann. Photogramm. Remote Sens. Spatial Inf. Sci. 2020, VI-4/W1-2020, 159–166. [Google Scholar] [CrossRef]
- Liu, S.; Qi, Q.; Song, C.; Cheng, H.; Xian, W.; Wu, B.; Wang, Y. Development of indoor positioning system based on Bluetooth. In Proceedings of the 2021 WRC Symposium on Advanced Robotics and Automation (WRC SARA), Beijing, China, 11 September 2021; IEEE: New York, NY, USA, 2021; pp. 30–35. [Google Scholar]
- Thompson, R.J.; Oosterom, P.V.; Cemellini, B.; Vries, M.E. Developing an LADM Compliant Dissemination and Visualization System for 3D Spatial Units. In Proceedings of the 7th International FIG Workshop on the Land Administration Domain Model, Zagreb, Croatia, 11–13 April 2018; pp. 103–124. [Google Scholar]
- Keenja, E.; De Vries, W.T.; Bennett, R.M.; Laarakker, P. Crowd sourcing for land administration: Perceptions within Netherlands Kadaster. In Proceedings of the FIG Working Week 2012: Knowing to manage the territory, protect the environment, evaluate the cultural heritage, Rome, Italy, 6–10 May 2012; p. 12. [Google Scholar]
- McLaren, R. Crowdsourcing support of land administration: A new, collaborative partnership between citizens and land professionals. Available online: https://www.clge.eu/wp-content/uploads/2012/05/16310_RICS_Crowdsourcing_Report-final-WEB.pdf (accessed on 22 September 2022).
- McLaren, R. Crowdsourcing Support for Land Administration—A Partnership Approach. In Proceedings of the FIG Working Week 2012—Knowing to Manage the Territory, Protect the Environment, Evaluate the Cultural Heritage, Rome, Italy, 6–10 May 2012; pp. 1–14. [Google Scholar]
- Enemark, S.; Bell, K.; Lemmen, C.; McLaren, R. Building Fit-for-Purpose Land Administration Systems. In Proceedings of the XXV FIG Congress 2014, Kuala Lumpur, Malaisia, 16–21 June 2014; Available online: http://www.fig.net/resources/proceedings/fig_proceedings/fig2014/papers/SS10/SS10_enemark_lemmen_et_al_7210.pdf (accessed on 3 September 2022).
- Clouston, A. Crowdsourcing the Cadastre: The Applicability of Crowdsourced Geospatial Information to the New Zealand Cadastre. Master’s Thesis, Victoria University of Wellington, New Zealand, 2015. Available online: http://researcharchive.vuw.ac.nz/xmlui/bitstream/handle/10063/4234/thesis.pdf?sequence=2 (accessed on 27 August 2022).
- Vučić, N.; Cetl, V.; Roić, M. How to Utilize the Citizens to Gather VGI as a Support for 3D Cadastre Transition. In Proceedings of the FIG Joint Workshop 2015, Crowdsourcing of Land Information, St. Julians, Malta, 16–20 November 2015. [Google Scholar]
- Ellul, C.; Almeida, J.P.; Romano, R. Does coimbra need a 3d cadastre? Prototyping a crowdsourcing app as a first step to finding out. ISPRS Ann. Photogramm. Remote Sens. Spatial Inf. Sci. 2016, IV-2/W1, 55–62. [Google Scholar] [CrossRef]
- Sahar, A.; Han, D. An LSTM-based indoor positioning method using Wi-Fi signals. In Proceedings of the 2nd International Conference on Vision, Image and Signal Processing, Las Vegas, NV, USA, 27–29 August 2018; pp. 1–5. [Google Scholar]
- Wang, X.; Gao, L.; Mao, S.; Pandey, S. DeepFi: Deep learning for indoor fingerprinting using channel state information. In Proceedings of the IEEE Wireless Communications and Networking Conference (WCNC) IEEE, New Orleans, LA, USA, 9–12 March 2015; pp. 1666–1671. [Google Scholar]
- Ibrahim, M.; Torki, M.; El Nainay, M. CNN based Indoor Localization using RSS Time-Series. In Proceedings of the IEEE Symposium on Computers and Communications (ISCC), Natal, Brazil, 25–28 June 2018; pp. 1044–1049. [Google Scholar]
- Zhang, T.; Man, Y. The enhancement of WiFi fingerprint positioning using convolutional neural network. In Proceedings of the International Conference on Computer Networks and Communication Technologies (CCNT), Wuzhen, China, 29–30 June 2018. [Google Scholar]
- Dahlgren, E.; Mahmood, H. Evaluation of Indoor Positioning based on Bluetooth Smart Technology. Master’s Thesis, Chalmers University of Technology, Gothenburg, Sweden, 2014. [Google Scholar]
- Takenga, C.; Xi, C.; Kyamakya, K. A hybrid neural network-data base correlation positioning in GSM network. In Proceedings of the 2006 10th IEEE Singapore International Conference on Communication Systems, Singapore, 30 October–1 November 2006; IEEE: Singapore, 2006; pp. 1–5. [Google Scholar] [CrossRef]
- Tsai, C.Y.; Chou, S.Y.; Lin, S.W.; Wang, W.H. Location determination of mobile device for indoor WLAN application using neural network. In Proceedings of the 2008 IET 4th International Conference on Intelligent Environments, Seattle, WA, USA, 21–22 July 2008; pp. 1–8. [Google Scholar] [CrossRef]
- Wang, X.; Gao, L.; Mao, S.; Pandey, S. CSI-based Fingerprinting for Indoor Localization: A Deep Learning Approach. IEEE Trans. Veh. Technol. 2016, 66, 763–776. [Google Scholar] [CrossRef] [Green Version]
- Gan, X.; Yu, B.; Huang, L.; Li, Y. Deep learning for weights training and indoor positioning using multi-sensor fingerprint. In Proceedings of the 2017 International Conference on Indoor Positioning and Indoor Navigation, Sapporo, Japan, 18–21 September 2017; pp. 1–7. [Google Scholar] [CrossRef]
- Sthapit, P.; Gang, H.S.; Pyun, J.Y. Bluetooth based indoor positioning using machine learning algorithms. In Proceedings of the 2018 IEEE International Conference on Consumer Electronics-Asia (ICCE-Asia), Jeju, South Korea, 24–26 June 2018; IEEE: New York, NY, USA, 2018; pp. 206–212. [Google Scholar]
- Alexander, I.; Kusuma, G.P. Predicting indoor position using Bluetooth low energy and machine learning. Int. J. Sci. Technol. Res. 2019, 8, 1661–1667. [Google Scholar]
- Kaselimi, M.; Protopapadakis, E.; Doulamis, N.; Doulamis, A.; Voulodimos, A. Multi-Channel Recurrent Convolutional Neural Networks for Energy Disaggregation. IEEE Access 2019, 7, 81047–81056. [Google Scholar] [CrossRef]
- Bluetooth® Technology Website. Proximity and RSSI|Bluetooth® Technology Website. Available online: https://www.bluetooth.com/blog/proximity-and-rssi/ (accessed on 3 November 2021).
- Doulamis, A.; Doulamis, N.; Kollias, S. An adaptable neural-network model for recursive nonlinear traffic prediction and modeling of MPEG video sources. IEEE Trans Neural Netw. 2003, 14, 150–166. [Google Scholar] [CrossRef] [Green Version]
- Medsker, L.R.; Jain, L.C. Recurrent neural networks. Des. Appl. 2001, 5, 64–67. [Google Scholar]
- Kaselimi, M.; Doulamis, N.; Doulamis, A.; Voulodimos, A.; Protopapadakis, E. Bayesian-Optimized Bidirectional Lstm Regression Model For Non-Intrusive Load Monitoring. In Proceedings of the IEEE International Conference on Acoustics, Speech and Signal Processing (ICASSP), Brighton, UK, 12–17 May 2019; pp. 2747–2751. [Google Scholar]
- Kaselimi, M.; Doulamis, N.; Voulodimos, A.; Protopapadakis, E.; Doulamis, A. Context Aware Energy Disaggregation Using Adaptive Bidirectional LSTM Models. IEEE Trans. Smart Grid 2020, 11, 3054–3067. [Google Scholar] [CrossRef]
- Frazier, P.I. A Tutorial on Bayesian Optimization. arXiv 2018, arXiv:1807.02811. [Google Scholar]
- Brochu, E.; Cora, V.M.; de Freitas, N. A Tutorial on Bayesian Optimization of Expensive Cost Functions, with Application to Active User Modeling and Hierarchical Reinforcement Learning. arXiv 2010, arXiv:1012.2599. [Google Scholar]
- Jones, D.R.; Schonlau, M.; Welch, W.J. Efficient Global Opti-mization of Expensive Black-Box Functions. J. Glob. Optim. 1998, 13, 455–492. [Google Scholar] [CrossRef]
| Disclaimer/Publisher’s Note: The statements, opinions and data contained in all publications are solely those of the individual author(s) and contributor(s) and not of MDPI and/or the editor(s). MDPI and/or the editor(s) disclaim responsibility for any injury to people or property resulting from any ideas, methods, instructions or products referred to in the content. |
© 2022 by the authors. Licensee MDPI, Basel, Switzerland. This article is an open access article distributed under the terms and conditions of the Creative Commons Attribution (CC BY) license (https://creativecommons.org/licenses/by/4.0/).


 ,
, 


