1. Introduction
Systematic conservation planning (SCP) has the potential to greatly improve the ecological wisdom of land-use decision-making [
1,
2]. Unfortunately, the majority of the research has been on SCP tools, isolated from the social processes they are embedded within, leading to the poor achievement of SCP potential [
3,
4,
5]. Systematic conservation plans are rarely implemented as designed and are often ignored or marginalized. Many times, organizations simply continue to conserve based primarily on opportunities that arise. There are many reasons for this [
6], including the fact that implementation almost always involves multiple organizations, each with multiple institutions (agreements, directives, etc). The SCP outputs are often derived in isolation from these institutions, resulting in an incomplete consensus regarding the products and inadequate implementation. The objective of this research is to help solve these shortcomings.
One principle for addressing these shortcomings is to empower stakeholders through social learning and the co-production of science [
6]. This “increases human capacity to solve problems… and positions the conservation planners as learners and facilitators—not just imparters of knowledge—through active collaboration with stakeholders” [
6]. In this study, we explore a specific approach to this principle: having representatives of the organizations that will be using the model help in defining the criteria and logic of how they are combined in the model, as well as in setting the actual parameter values. If achieved effectively, such empowerment can lead to increased understanding of the model, increased trust, increased “buy-in”, and can be an effective framework for building consensus [
7,
8,
9,
10]. All these effects should improve implementation. This approach has the downside of potentially leading to a consensus regarding a plan that values different aspects of biodiversity than a plan developed by a group of impartial scientists [
11]. Evaluation and discussion of this tension are beyond the scope of this paper. Instead, we develop methods for minimizing tensions so that the loss in efficiency of an end-user-derived plan can be outweighed by the increased number of sites actually conserved.
The challenge becomes twofold: (1) meeting the complex and complicated requirements of SCP in a scientifically sound manner with input from end-users, some of whom will probably have only a limited understanding of SCP principles and methods, and (2) implementing a process that participants view as fair and empowering.
This challenge has become increasingly urgent and important because of the sudden interest in SCP. This explosion of interest is because of what has become known as “30 by 30”. This stemmed from the call for half of the Earth to be conserved by 2050 [
12,
13], and a subsequent call for a “Global Deal for Nature” that includes the call to conserve 30% of the planet by the year 2030 (i.e., 30 by 30) [
14]. This call has been mainstreamed and is now widely adopted, with over 100 countries now formally supporting the 30 by 30 target [
15,
16].
We utilized a participatory action research (PAR) approach [
17,
18] for exploring the twofold challenge above. PAR entails the direct involvement of the researchers in a real-world project. This co-design and co-production is a key strategy for developing new ideas and better aligning research and practice for conservation impact [
19]. In this case, we were charged with building a scientifically-based consensus among two organizations regarding the next several properties to be purchased for conservation in a region. We aimed to develop methods versatile enough to be used with many organizations, not just two, and that could prioritize many properties.
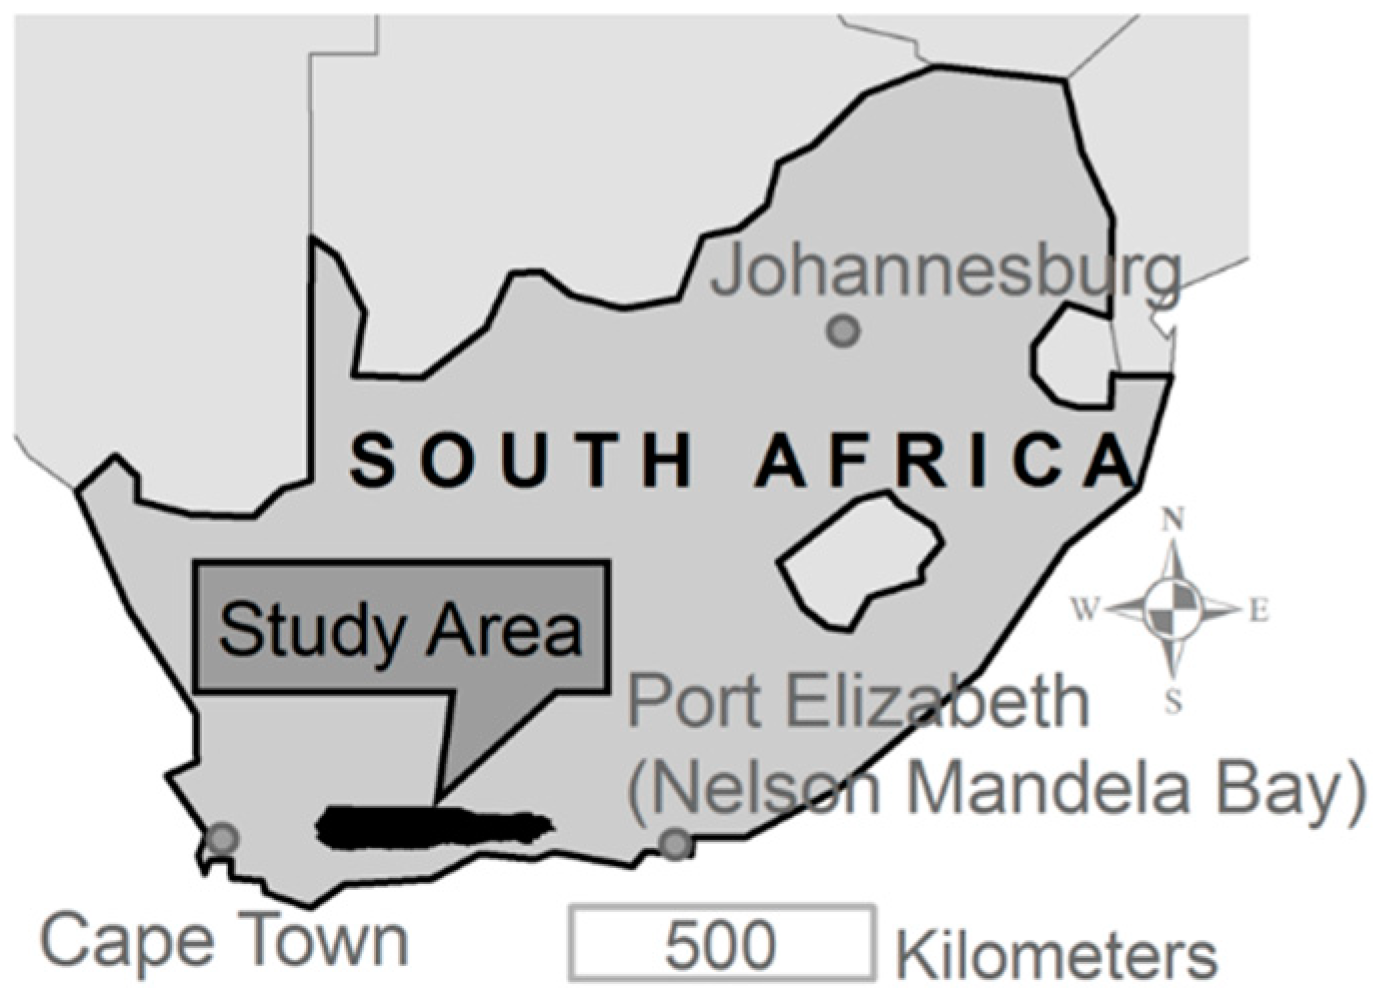
Our study was located in the Little Karoo (19,350 km
2) of South Africa’s Cape Floristic Region (
Figure 1). The Little Karoo is a semi-arid, inter-montane basin, where three globally-recognized “biodiversity hotspots” intermingle [
20,
21]. The two organizations involved in this study were the Leslie Hill Succulent Karoo Trust (LHSKT) and the Provincial conservation management authority, CapeNature (CN). LHSKT purchases properties to conserve endemic succulents. The land is then managed by a partner organization which, in this case, was CN. CN had a regional emphasis on consolidating conservation corridors identified in a previous SCP [
22]. The CN budget available for management was extremely limited, so any additional lands provided by LHSKT must also have met CN goals. In many SCP contexts, there are many more stakeholder and end-user organizations, so we used this case study of manageable scope to explore issues that can be scaled up to a many organization process.
2. Methods
Our first step was to assess the long-term information needs of the two organizations. LHSKT was likely to have funds available again for additional purchases in several years, so reconciling their needs is a recurring issue. Similarly, CN periodically encountered other conservation opportunities, so their prioritization needs were also ongoing. Hence, our overall strategy was to use a participatory process in building and parameterizing a spatial decision support system (SDSS) prototype. An SDSS uses a computer to combine human values and queries with a wealth of data and analyses to provide products used as references in making spatial decisions. A well-designed SDSS is useful for the decision at hand, and if well-managed, is easily re-queried or updated with new data to address future information needs. We used a collaborative design process for not only the design of the logic model of the SDSS (i.e., what criteria were used and how they were combined) but also in the design of the workshop process for coming to a consensus on model weights and parameter values.
2.1. The SDSS Prototype
The focus of this paper is on the engagement process, and the overarching framework and SDSS, termed the Earthwise Framework, are detailed elsewhere [
23,
24] and
Supplementary Material. (The framework was originally called LandAdvisor.) Some of the methods and results of the engagement process shown here can apply in other contexts besides the Earthwise Framework to some extent. However, the full range of results are specific to the multi-criteria overlay approach, detailed below. The type of SDSS used affects what participatory process can be followed, and its effectiveness. For example, if the methods, parameters and weights of a model are understandable, then they are more conducive to a participatory process. Hence, an overview of the multi-criteria overlay methodology is needed to provide adequate context for the rest of this manuscript.
There is a tendency in SCP to use complex mathematical algorithms designed to pursue optimality (i.e., efficiency) in maximizing the amount of nature conserved with minimum (or a given) cost. Instead of using one of these more conventional SCP software programs (such as MARXAN, Zonation, and C-Plan), we opted instead for a multi-criteria overlay framework, for several reasons: (1) it is especially tailored to building consensus among multiple objectives and organizations [
25,
26,
27,
28]; (2) parameterizing it is straightforward and intuitive [
28,
29,
30]; (3) users can quickly view the effects of different weight values and implement sensitivity analyses [
30]; and (4) the immediate need was for prioritization of sites to purchase in the short-term, rather than to identify a portfolio of sites that meet nature conservation targets with minimum cost. Further, the framework we chose allows users to later also develop such a portfolio of sites as well, albeit with a slightly less likelihood that the portfolio is the most efficient solution. In short, the multi-criteria framework had the potential of being especially user-useful and user-friendly. We provide a deeper introduction to the standard SCP software programs and their comparison to the multi-criteria framework in a related manuscript [
23].
Multi-criteria approaches are common in natural resource management and single-site assessments [
30,
31]. Their use in SCP is less common but is increasing as mathematical challenges are being met [
32]. For instance, we adapt the framework developed by Davis et al. [
33] that blends multi-attribute and multi-objective decision analyses (i.e., reserve design optimization) [
30]. It accounts for complementarity by using functions of diminishing returns [
23,
33,
34,
35,
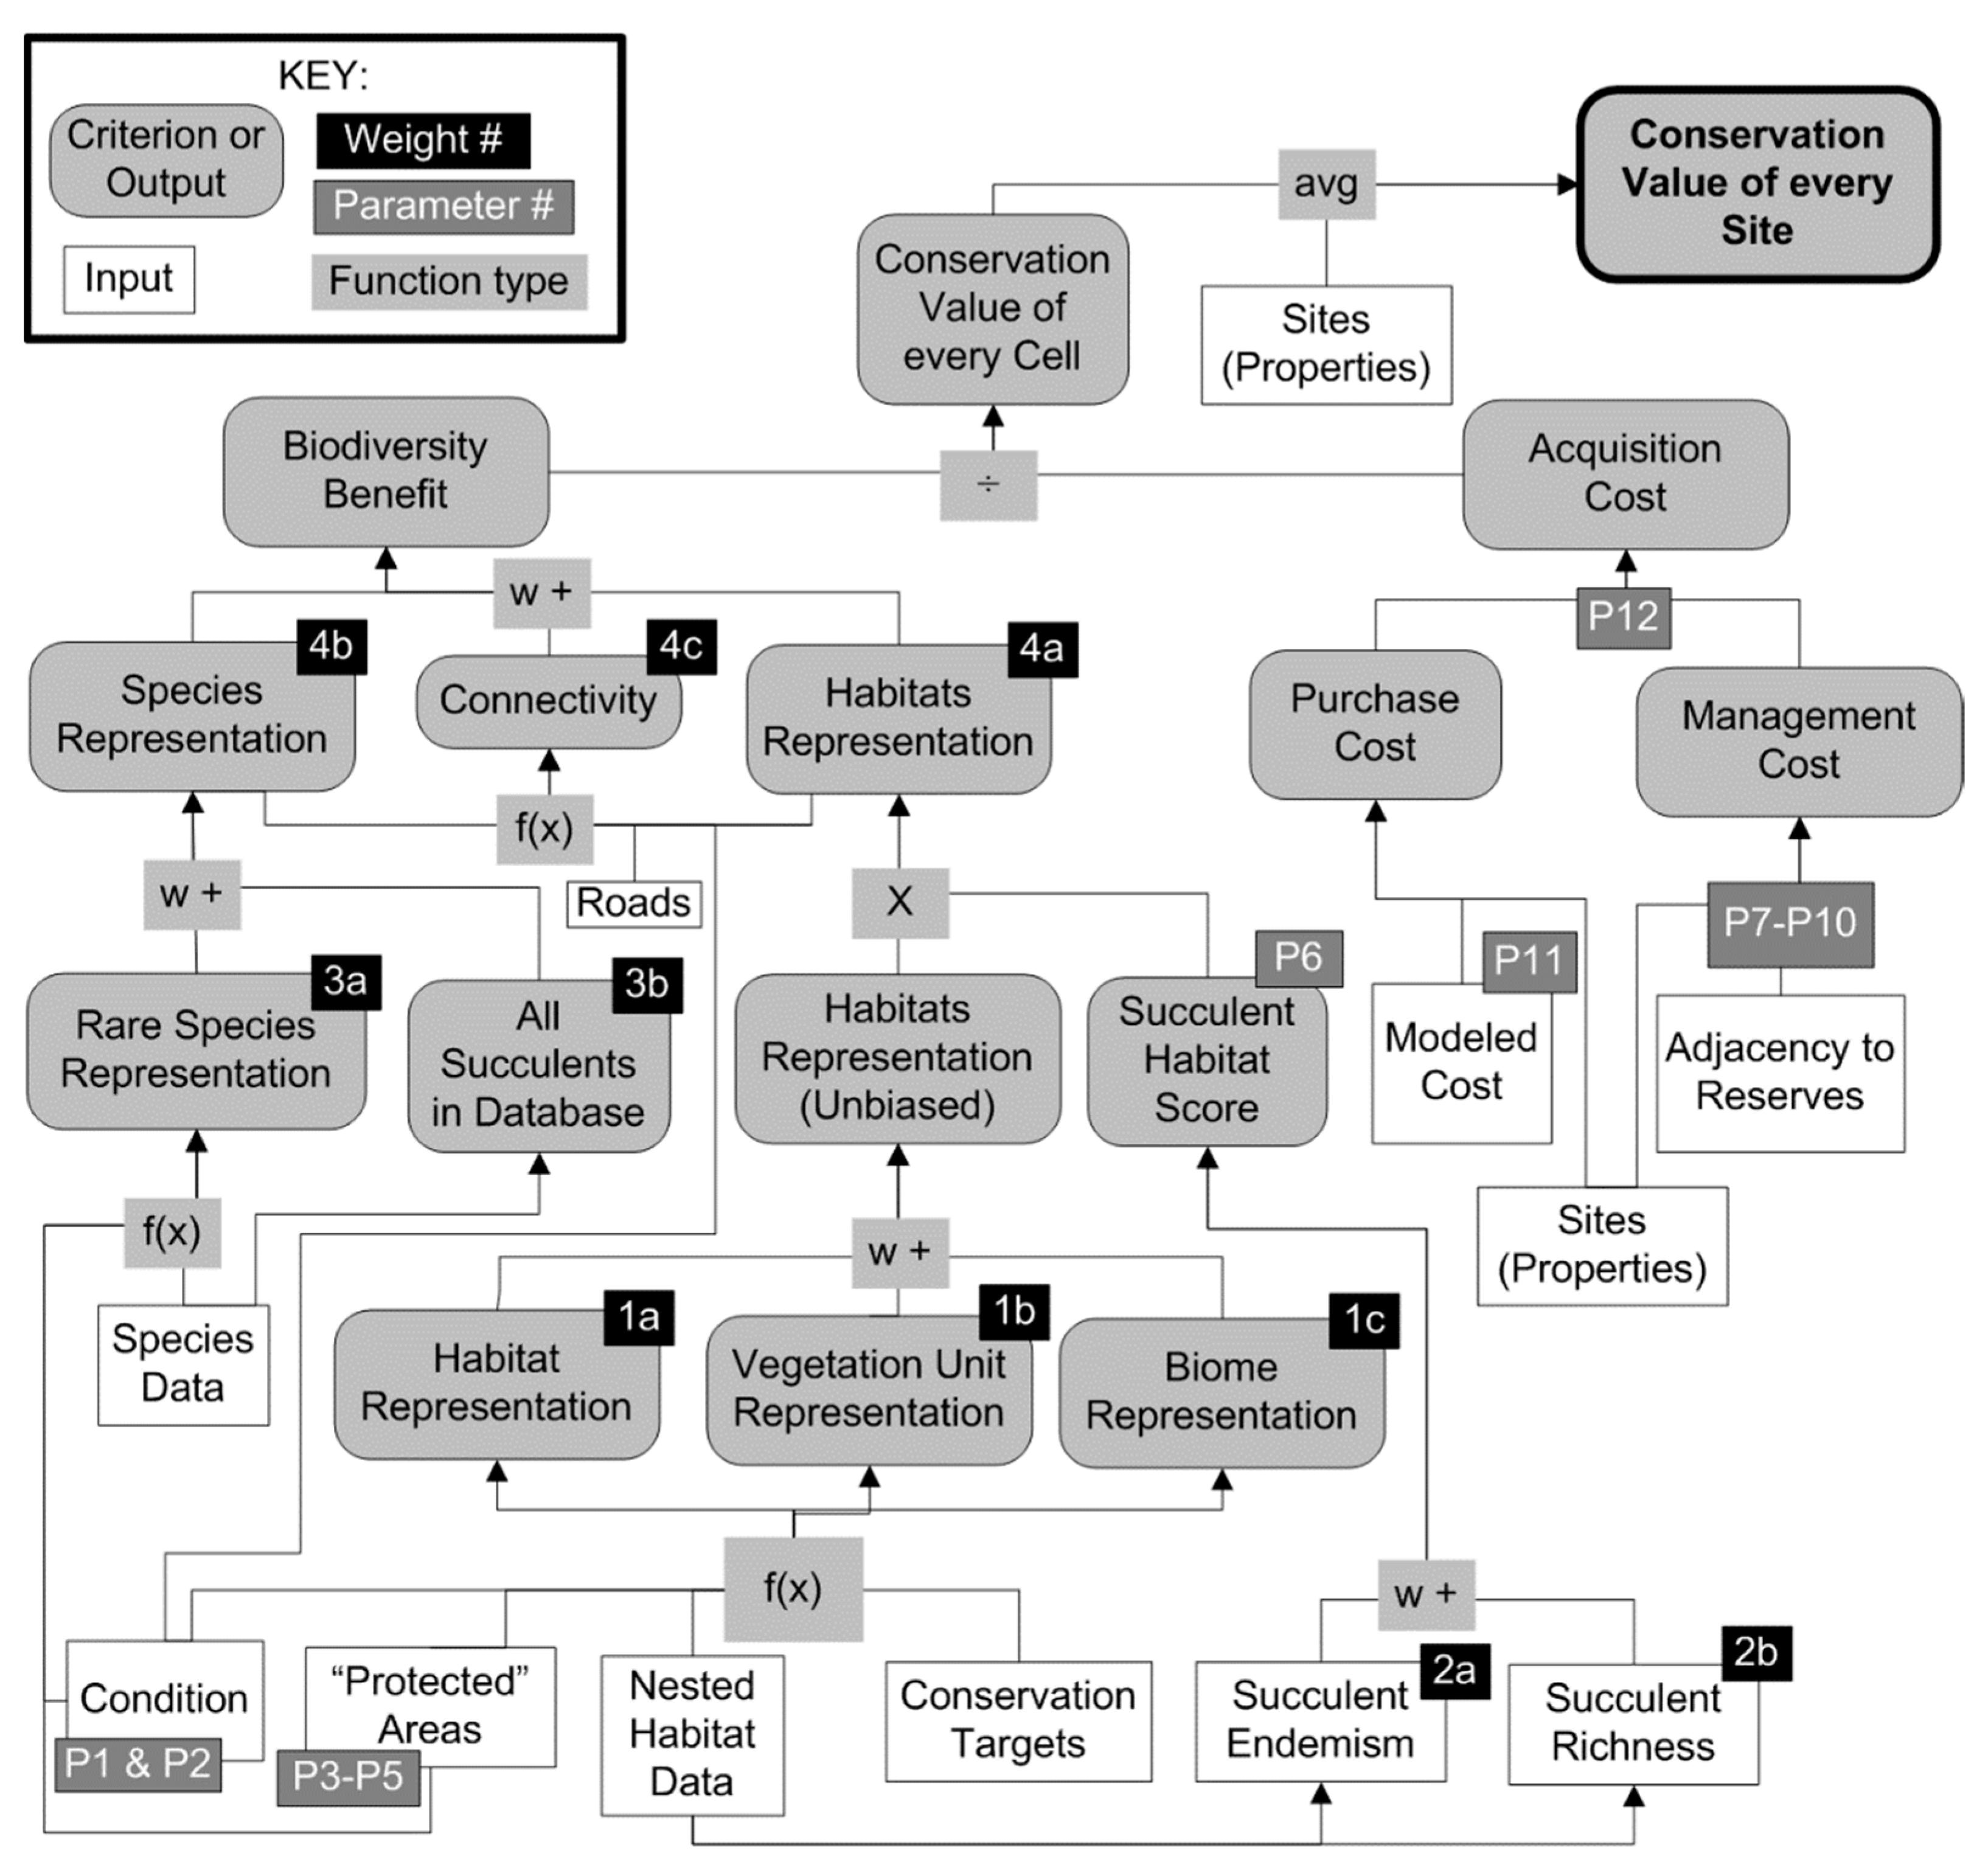
36] such that benefit gained from protecting a hectare (ha) of a habitat type diminishes as more of that habitat is protected. The framework also accounts for many levels of habitat degradation and protection rather than the traditional binary view (e.g., protected/unprotected). We combined the representation calculations with other criteria, such as cost, in a hierarchical, weighted overlay to identify the relative conservation value of every cell, in our case hectares, in the region (
Figure 2). This conservation value surface could be used “as is”, averaged per site, and/or used in an “iterative allocation algorithm” framework to estimate the most effective portfolio of sites to conserve [
23,
33,
35].
In implementing the aforementioned Davis et al. [
33] algorithm, we modified it to more effectively integrate conservation targets, and the practical benefits they bring [
36], into the functions of diminishing returns. We did this by giving the analyst the ability to have a smooth function of diminishing return or a stepwise one that drops in value at a designated amount once the target has been met [
23,
24]. We also integrated landscape connectivity into the algorithm [
23,
24].
Nested multi-criteria overlays that display only the final output value to the end-user are opaque: “Why did the site get that value?” To anticipate this question, we programmed the SDSS to provide maps of every criterion in
Figure 2, not just the final output. Output maps were provided in pairs: one showing a value for each ha, and one showing the average value of all the hectares in a site. Further, all the criteria values of any site were displayable via a mouse-click. The SDSS was programmed using Modelbuilder within ArcGIS 9.3 such that end-users were able to set a particular set of parameter values and then view the associated results during the same two-day workshop. Additional details of the Earthwise Framework and its Little Karoo SDSS are provided elsewhere [
23,
24] (
Supplemental Material).
2.2. The Participatory Process
An initial scoping workshop was held. Participants were four CN personnel from the study region, two LHSKT representatives, and three science advisors with extensive regional knowledge. One of the authors facilitated the workshops (JG), and the other authors were two of the three science advisors. The goals and timelines of both organizations were explicitly stated and documented, as well as the overall goal and expectations of the collaborative partnership. An initial list of criteria that could easily be programmed into the SDSS was provided by the facilitator. In the spirit of collaborative design [
26], the participants then suggested additional criteria as well as parameters that could be programmed into these criteria or the initial criteria. The participants also gave leads regarding data acquisition.
The SDSS was created with many of these suggestions implemented, and a second workshop was held to set the parameter values and assess the resulting output. Some additional participants attended the second workshop: the top manager for the regional CN business unit, a LHSKT board member, and a CN reserve manager.
We started with a structured discussion for the participants to decide on the group process. The process they decided upon is described here, and the full set of options they considered is available online (
S1-Supporting Information). As part of the discussion, they were given a key choice: for each organization to come to an internal consensus on parameter values (a parameter “schema”), and then subsequently reconcile two sets of parameter values or even two model outputs, or to derive a single set of parameter values that best reflected the goals and constraints of the partnership as a whole. They chose the latter. During this discussion, the group was inspired with a new idea and decided to adopt it: for each parameter, they would also derive a parameter value that best met the needs of biodiversity overall, rather than any particular organization or partnership. To choose parameter values, each criterion was first described by the facilitator, and then discussed by the group. They discussed the context of the criterion and the parameter(s) at hand. People could advocate for the parameter value they thought most appropriate, and why. Then every participant wrote on an individual score sheet the weight or parameter value they thought most appropriate for the partnership, and then they wrote an alternate value for biodiversity. In some cases, they were the same value, but often they were different. We term this the dual-centric weighting process. This name associates the biodiversity schema of weights with biocentrism, an ethical viewpoint that extends inherent value to all non-human life, regardless of its sentience (wordnik.com). The other, standard schema is often an anthropocentric (human-centered) schema, but can also be a balanced blend between anthropocentrism and biocentrism in some cases.
Participants also had the option of giving their vote for each parameter a lower “opinion weight” compared to the other participants. This was to encourage people who felt unsure of themselves or their answers to still participate in the process. Participants also had the option of nominating a higher opinion weight to experts of their choice. Each person’s parameter value vote was multiplied by their cumulative opinion weight. These products were to be combined in a weighted average to provide the group’s consensus value for that parameter. Finally, since there was an uneven number of people per organization (six for CN, three for the LHSKT, and three unaffiliated experts), the group needed to decide if the weighted average among votes would be for each organization’s weights to be even, or each person’s weight to be even (barring expert opinion weights). The group decided, without any objections, for each person to have an equal weight in the weighted average, rather than for each organization to have an equal weight. This scoring process was repeated for all parameters. (
Table 1). As time availability was limited to about six hours for this process, some obscure parameters were given a default value in advance (
S1-Supporting Information) by one of the authors (JG), with all participants having the opportunity to question the default values during and after the workshop.
The morning after the workshop, the group viewed the resulting spatial outputs and was allowed to discuss and modify parameter values. At this point, the participants also suggested minor additions and alterations to the SDSS itself. Some of these changes were made after the workshop, and the resulting suite of spatial outputs was provided to the participants as GIS files, a report with tables, and an atlas.
2.3. Organization-Specific Parameter Schemas
One of our proposed methods for evaluating the consensus-building potential of this approach was if the participants chose parameter values that best met the goals of their organization, we could compare those spatial outputs to the eventual consensus output. However, the empowered participants opted instead for the biodiversity weighting schema discussed above, which did not allow time for such organization-specific schemas. To compensate for this, one of the authors (JG) subsequently created approximated parameter schemas that represented the interests of each organization (
Table 1). The values were based primarily on a review of the audio recordings of the two workshops; with careful attention paid to the goals, missions, constraints, and arguments of the two organizations. The secondary reference was the parameter values provided by the participants for the two original schemas. The approximated parameter values were confirmed by a representative from each organization (
S1-Supporting Information).
2.4. Model Products
The primary end-products were a table and map that ranked the “long-list” (see below) of priority properties for acquisition. A key question was how many properties should be on such a list. There were 1580 properties in the region greater than 100 ha (small properties were not considered because the ratio of transaction costs plus management costs to purchase cost was prohibitive for such properties). The budget available was only sufficient to purchase about one to five properties. However, because landowner willingness to sell for conservation (i.e., willing sellers) was not part of the analysis, nor was the threat of development, the final output lacked a degree of precision. The SDSS’s top-ranked site for acquisition was not, in reality, the top-ranked site if the owner had no intention of selling. Similarly, there is a potential for big surprises when field-checking the ecological model values [
37]. Further, one of the sites already under consideration was ranked 133 out of 1580. Thus, it was decided that a large number of properties should be on the long-list, and it would be up to an ongoing process by the end-users to narrow the list down based on their combined knowledge, site visits, and discussions with landowners. The end-users primarily wanted to know which properties were better than others, and why, given the data we had. The threshold that seemed to balance inclusion with prioritization was 10% of the sites greater than 100 ha, or 158 sites.
Because only a few sites could be acquired in the near term, it was decided that the long-list of 158 sites should not be the estimated most efficient portfolio of 158 sites for maximizing biodiversity gains. Instead, it was to be a list and ranking of the 158 sites most likely to be the best property to purchase next.
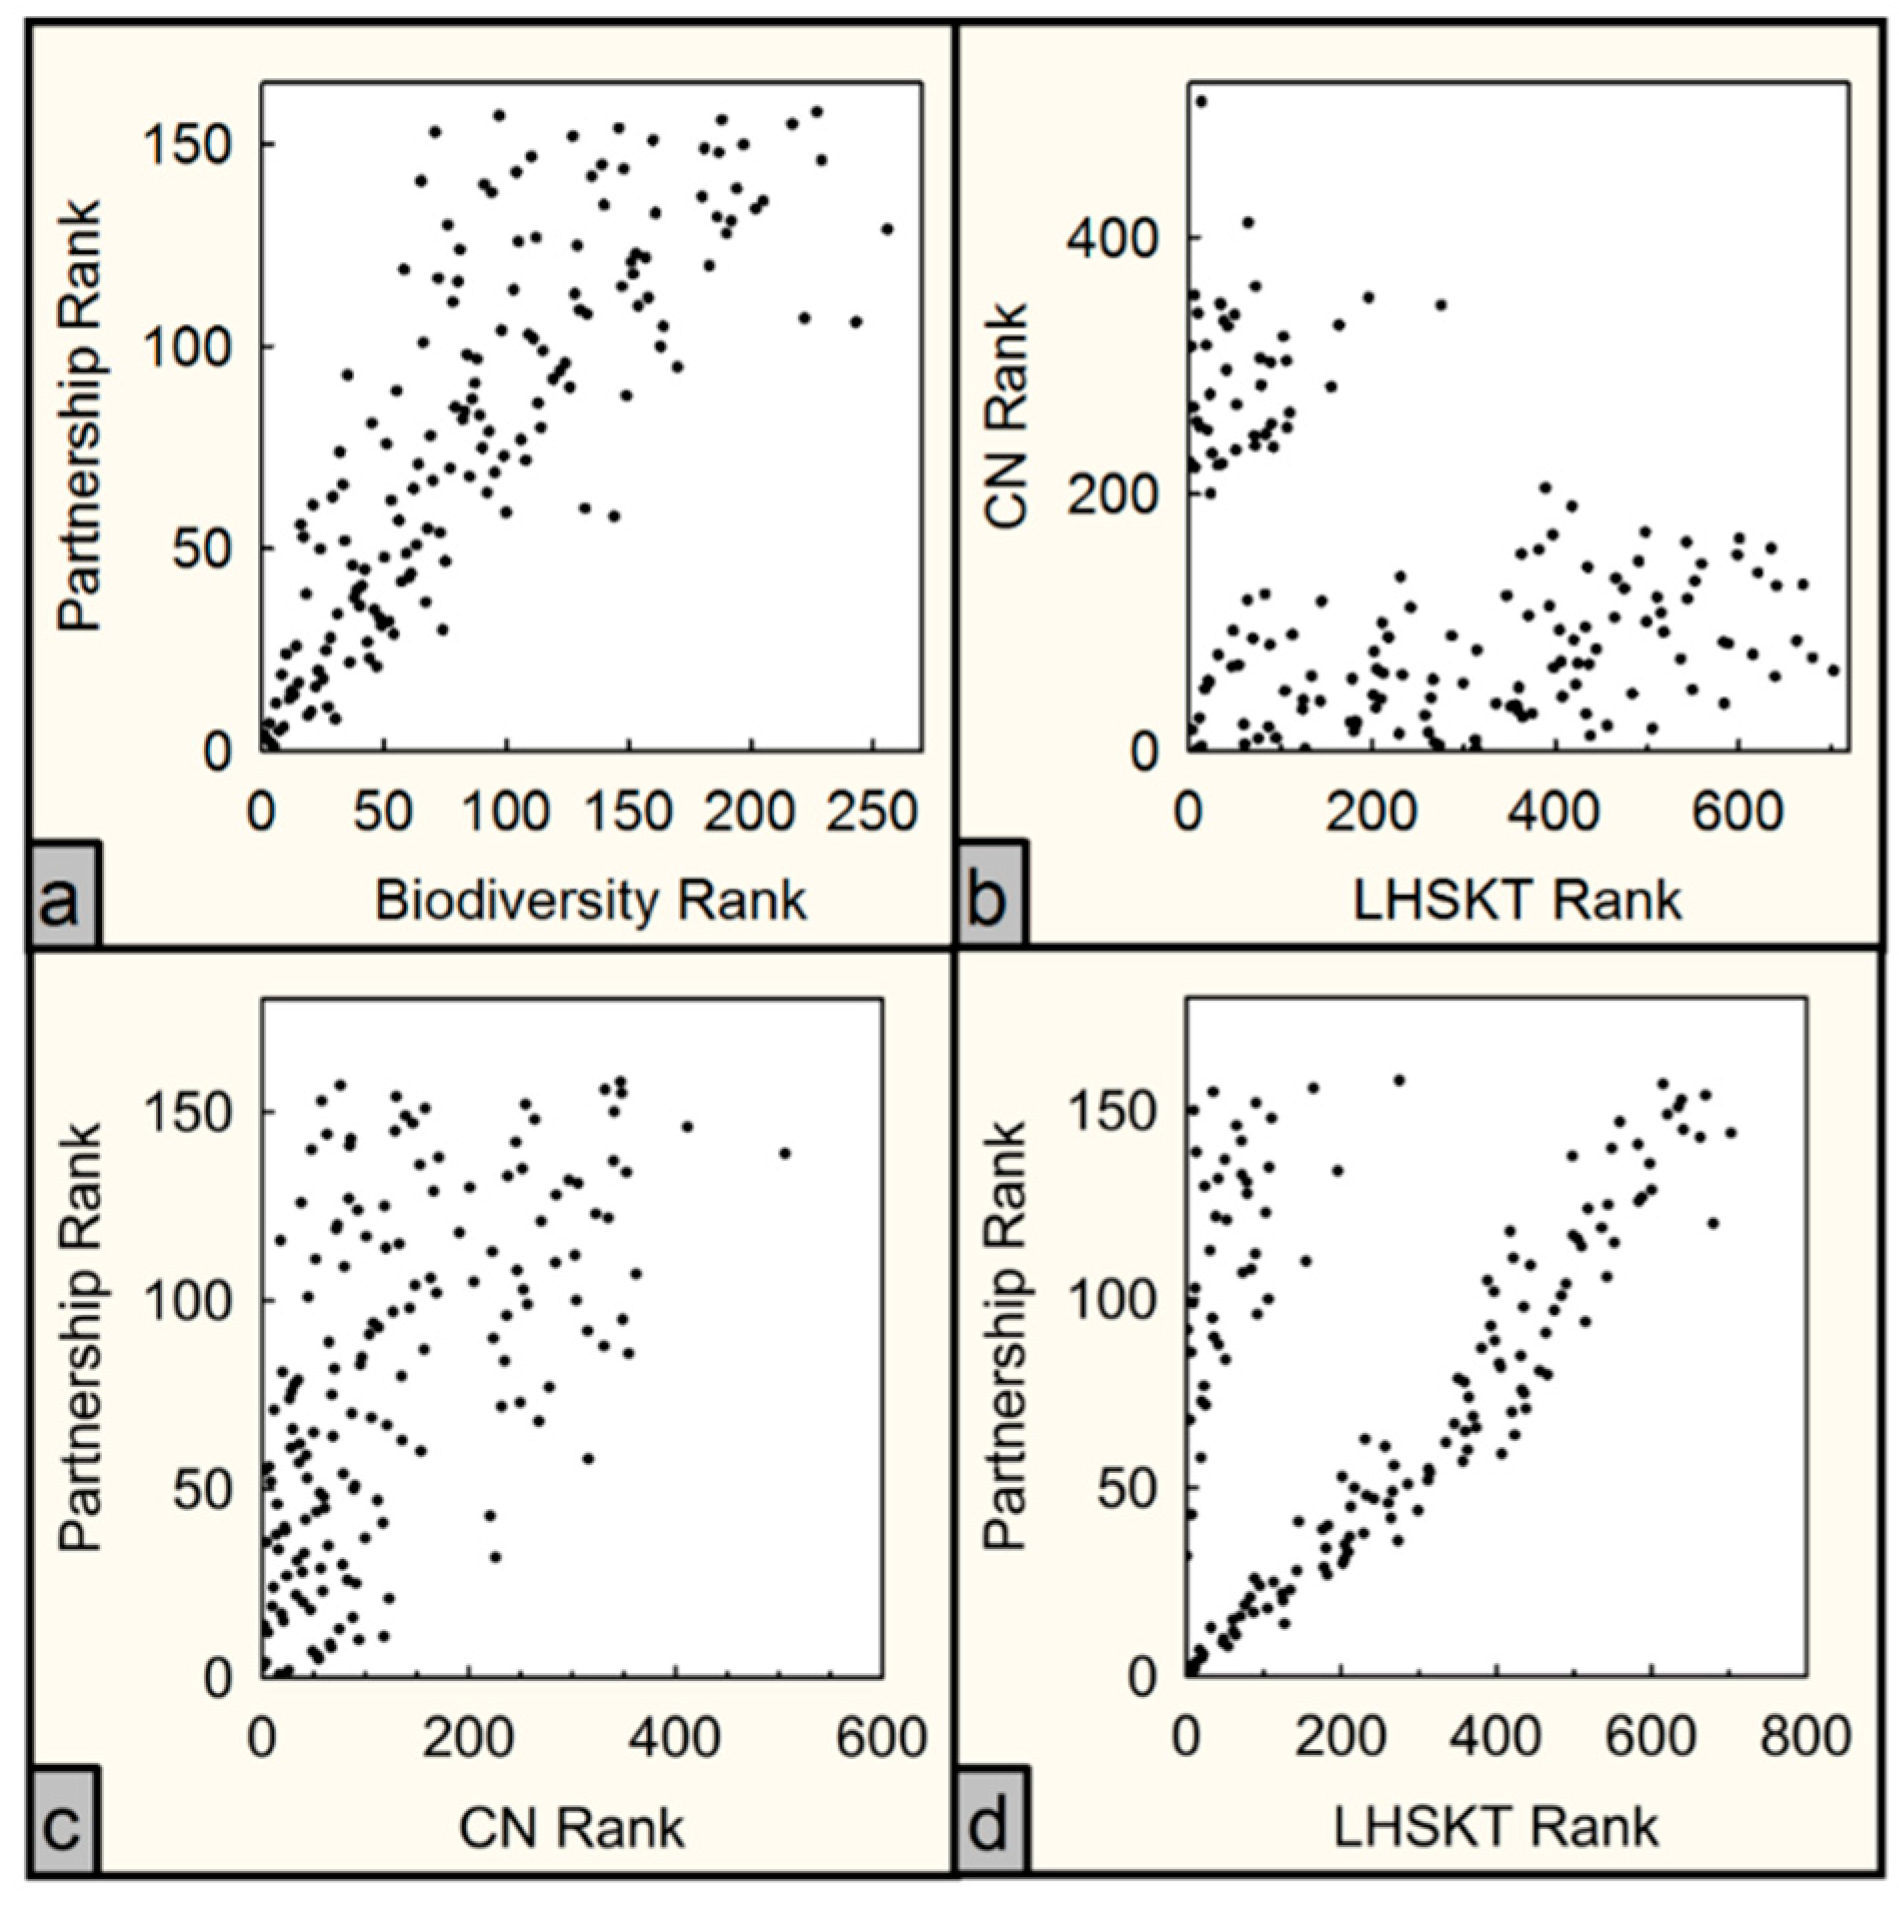
The outputs of the four schemas were mapped and compared as follows. The top 158 sites resulting from the partnership schema were selected and ranked according to conservation value (i.e., “best return on investment”). This became the long-list of sites. The SDSS was run according to the other three parameter schema, and each time, the resulting rank of each of the long-list properties among all 1580 properties was determined. The long-list rankings for each schema were compared to the rankings of each other schema using scatter plots and Spearman’s rank analysis. (Note: The first step of the Spearman’s rank analysis was to rank the non-partnership long-list sites from 1 to 158.) The comparisons were also made using the full set of 1580 properties.
3. Results
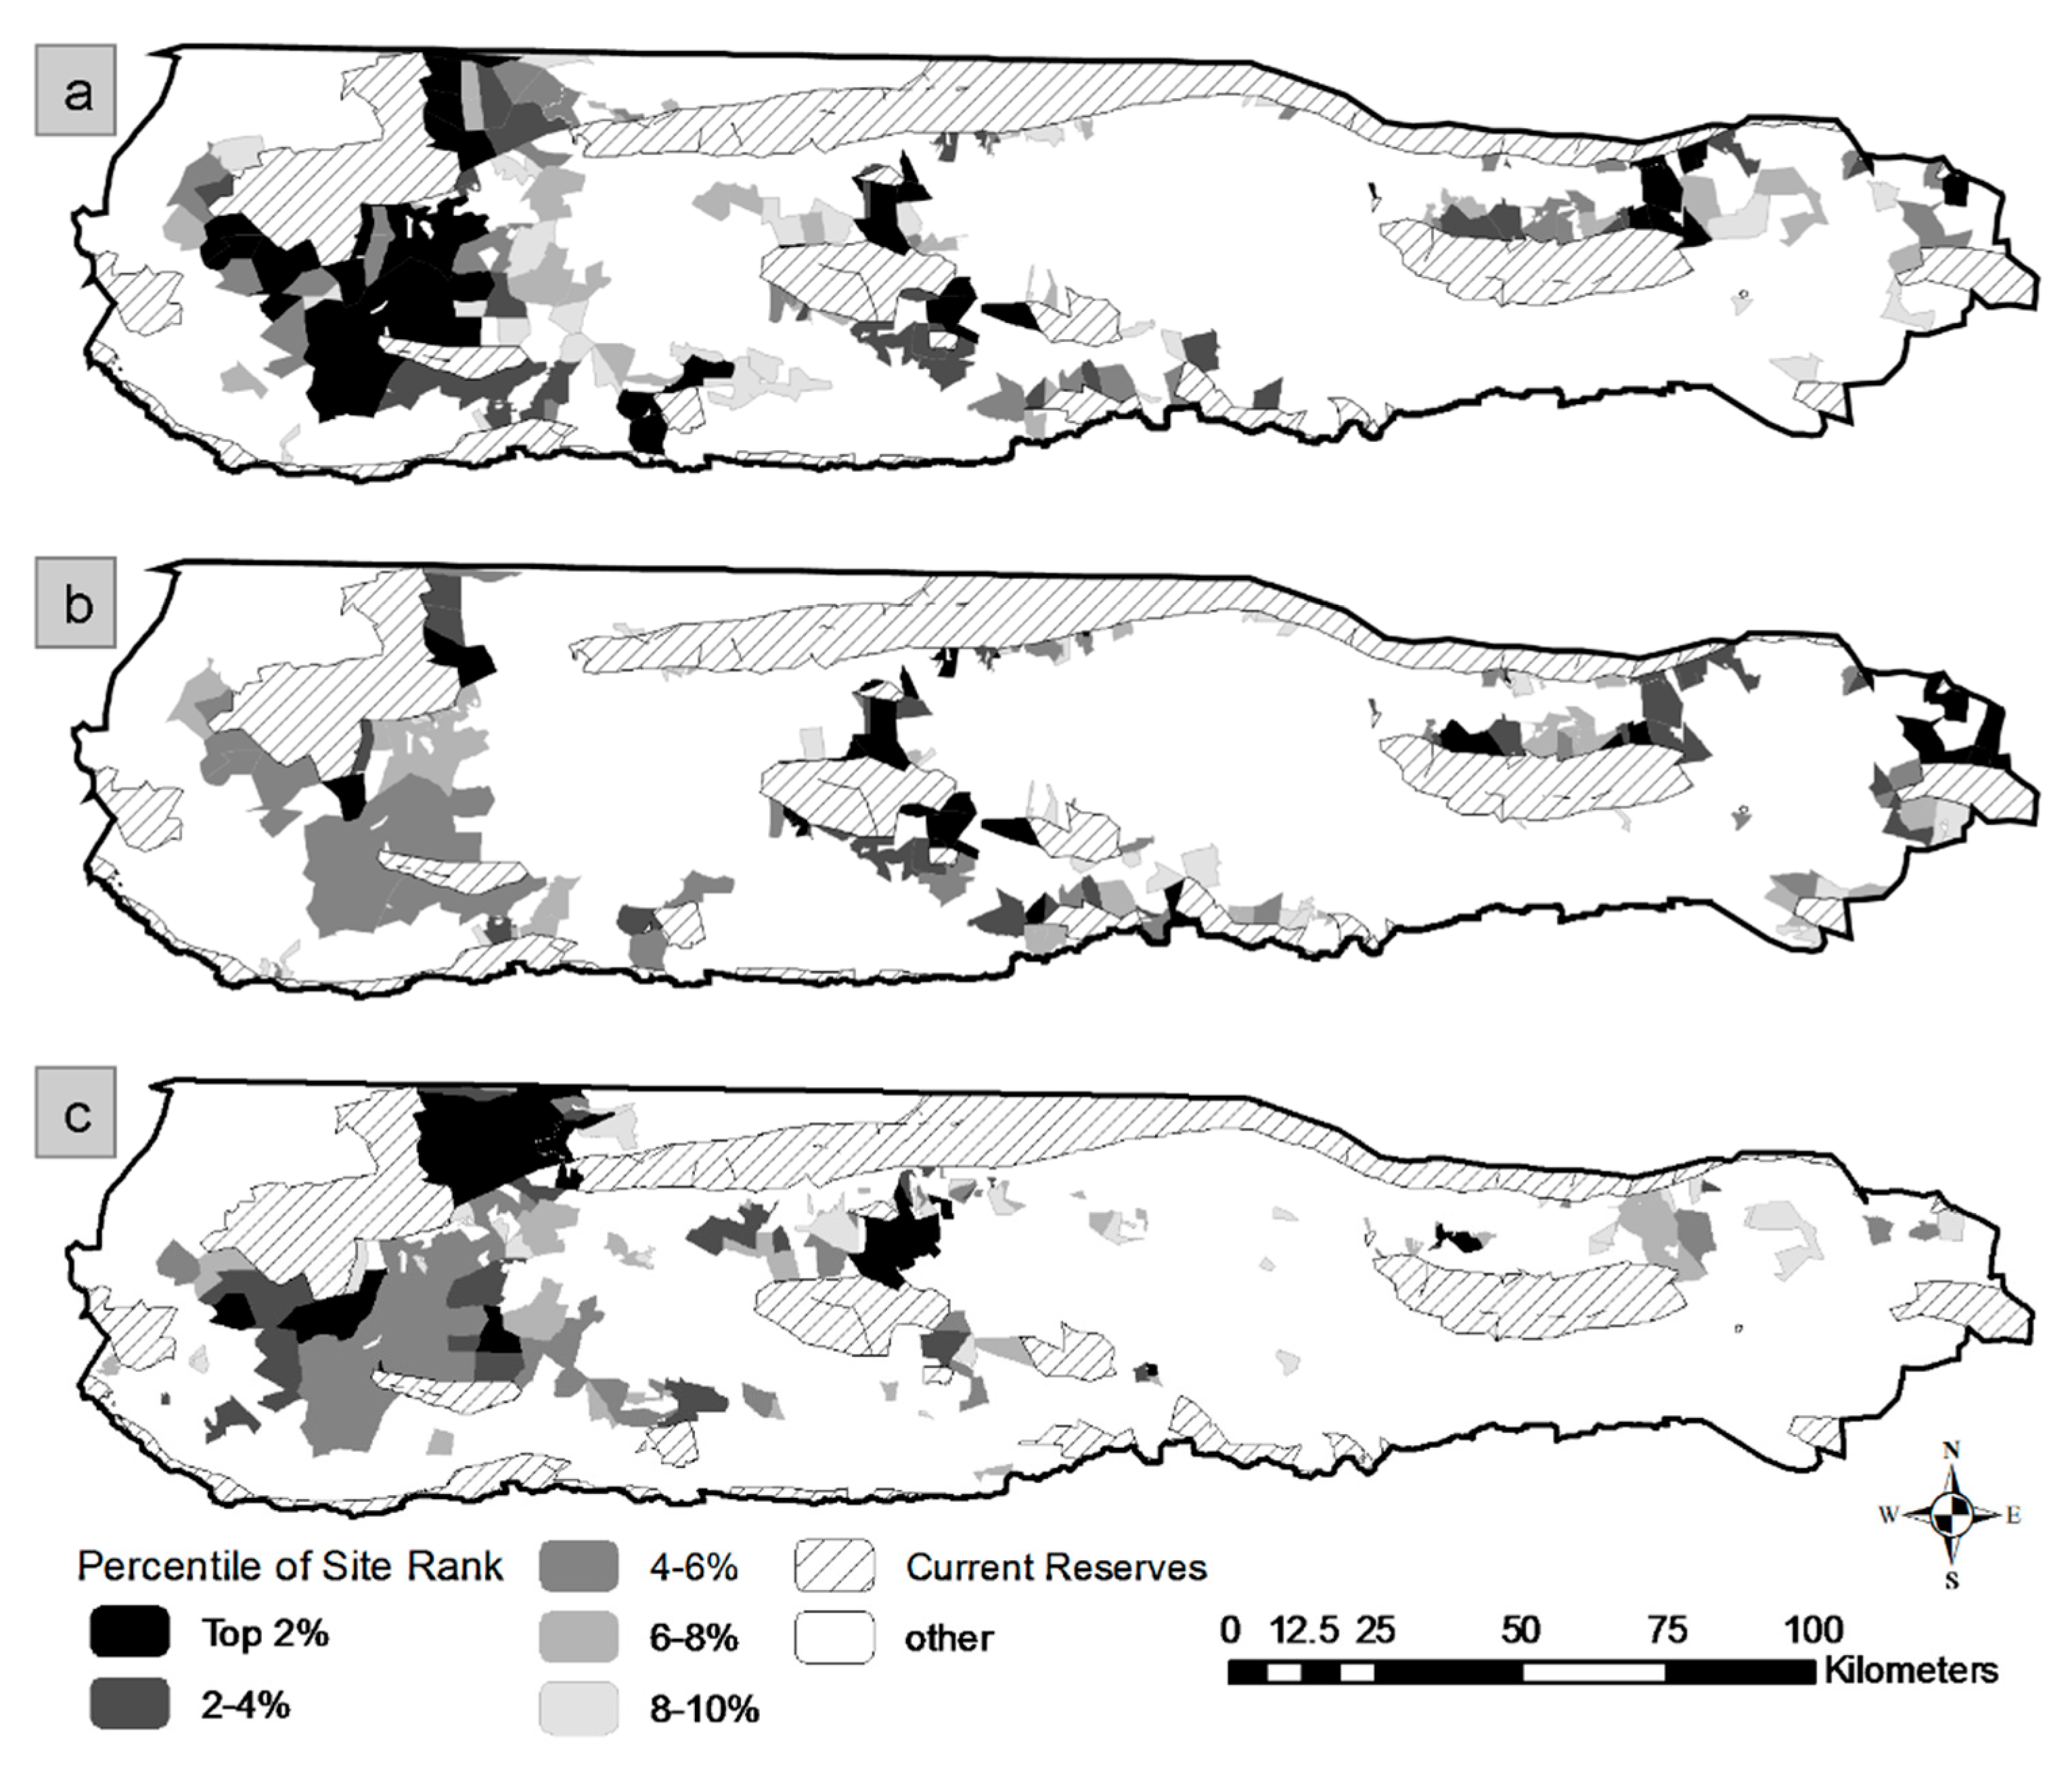
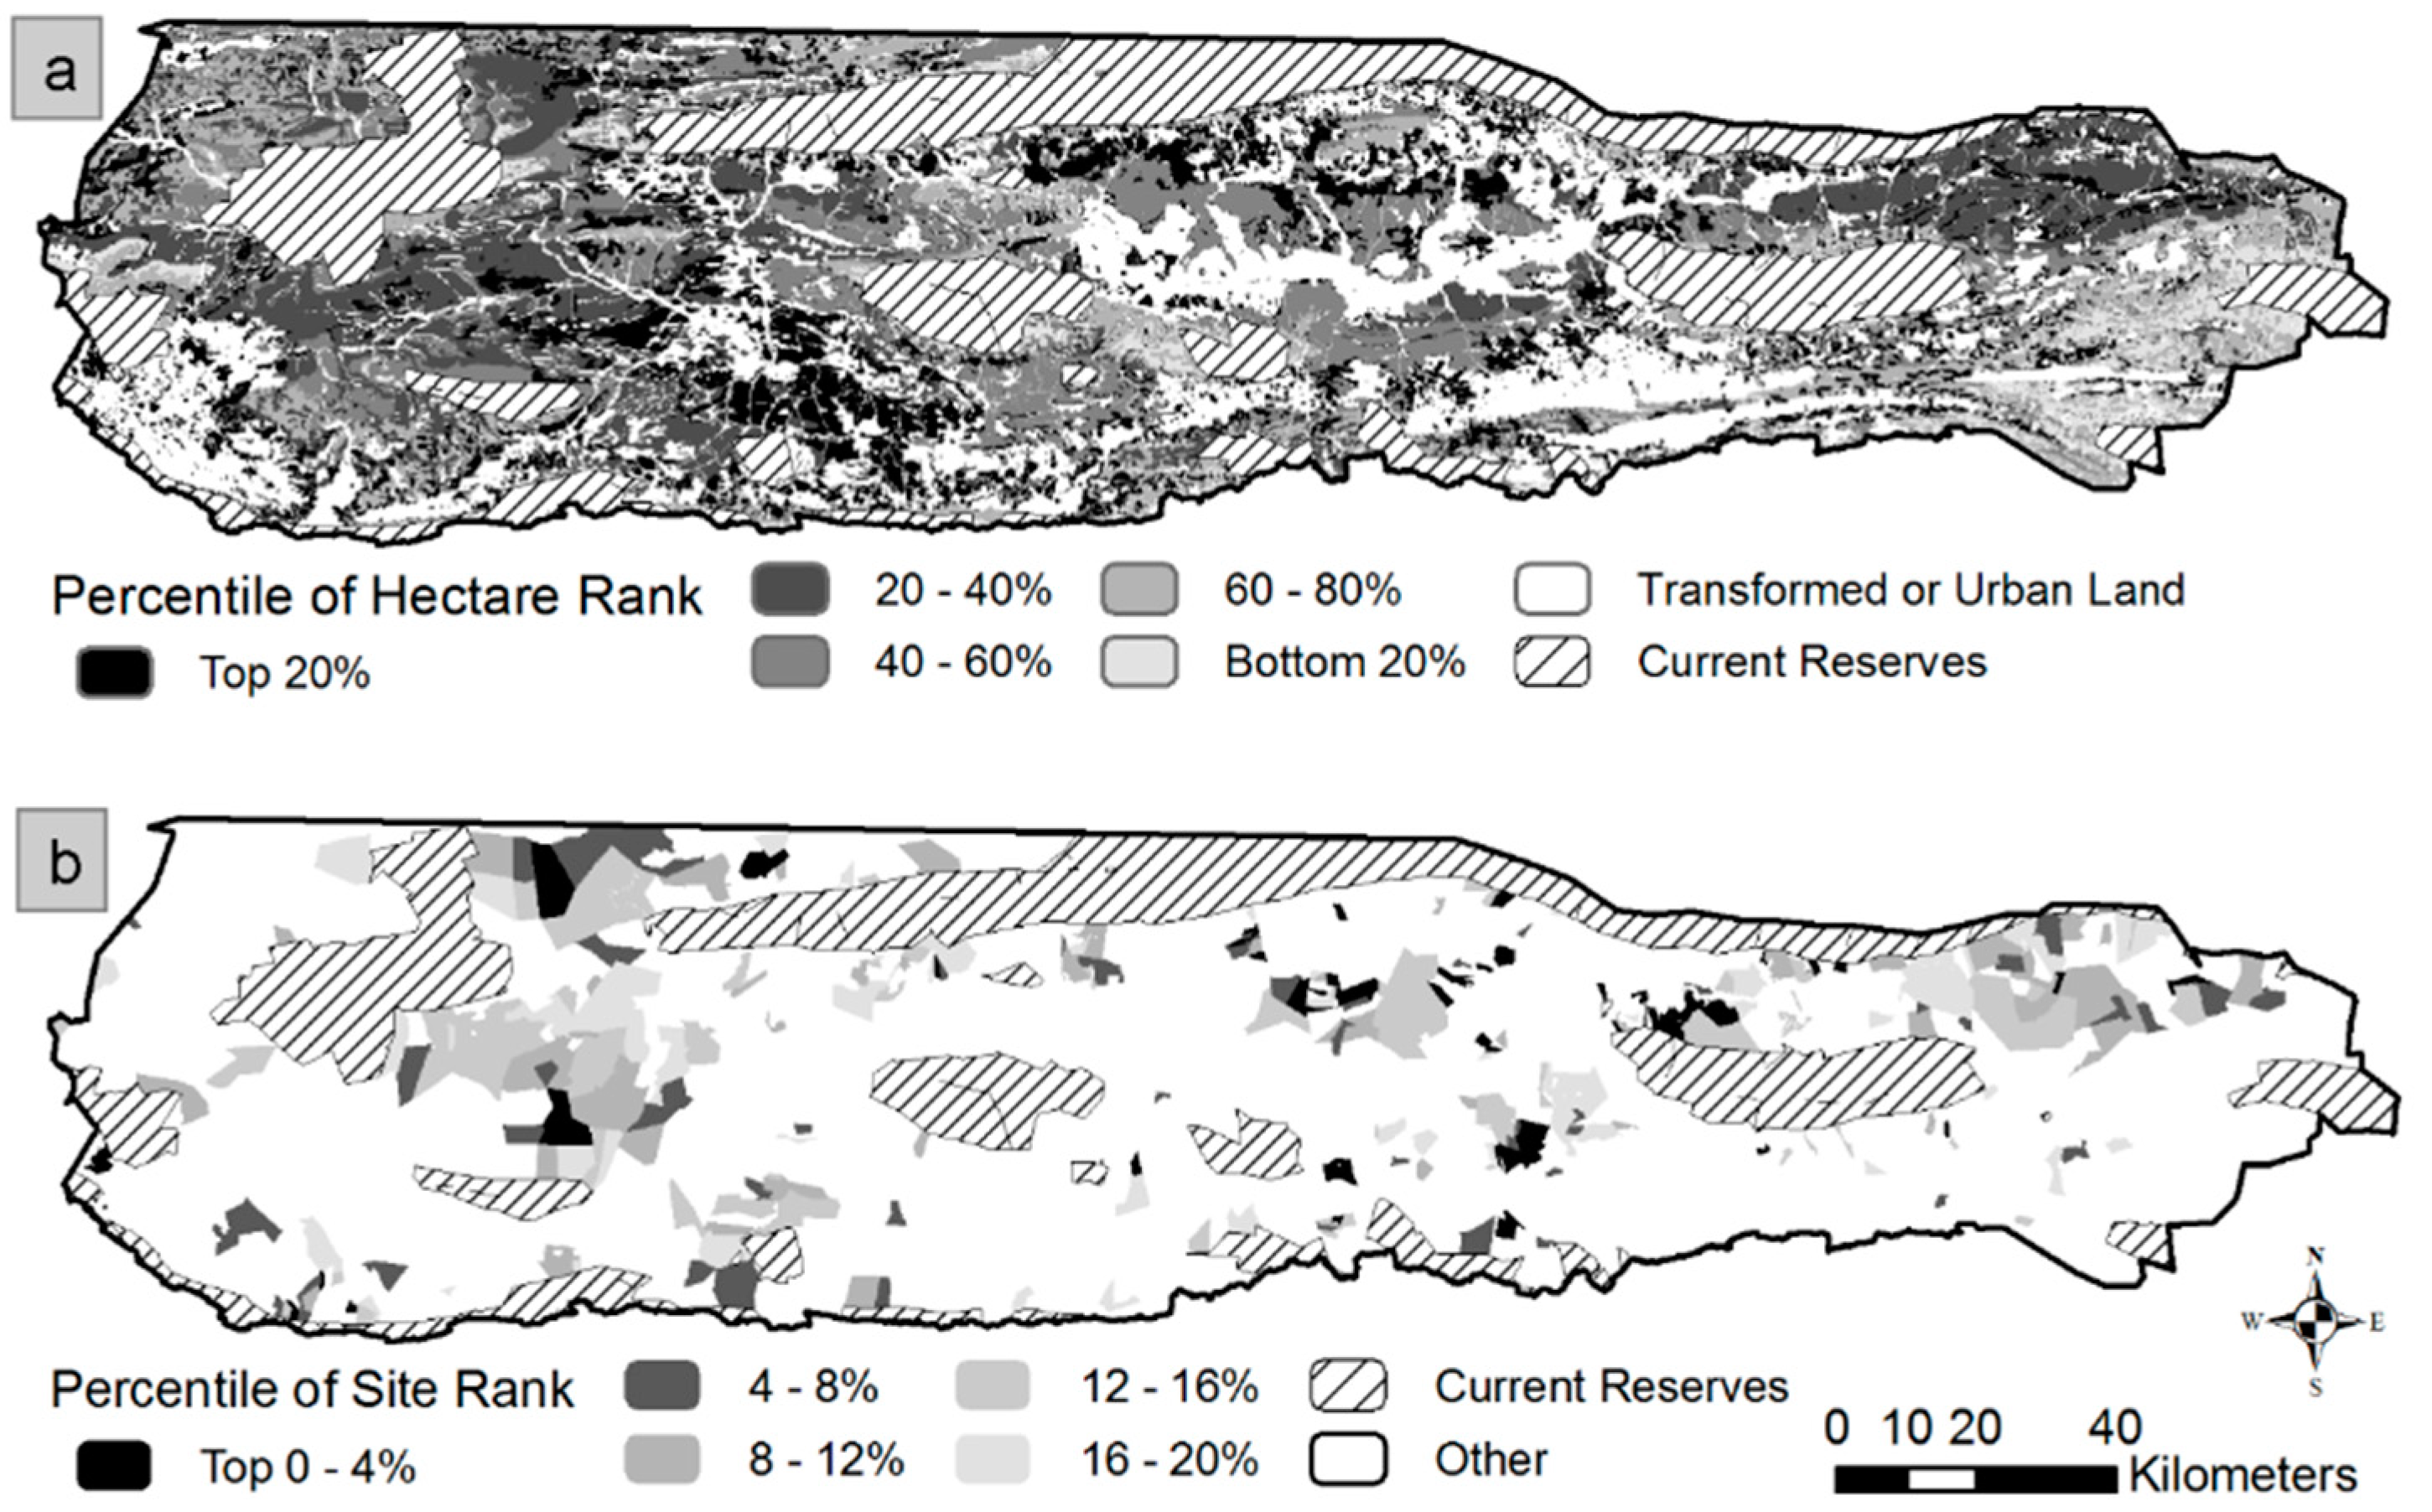
The partnership parameter schema resulted in a majority of the top sites being in the western portion of the study region (
Figure 3a). The period of the workshop spent examining areas well known by the participants and seeing if the modeled results matched local expert knowledge was a success and the participants considered the long-list from the partnership parameter schema a consensus output. In addition to corroborating known opportunities, the output highlighted conservation opportunities that had previously been overlooked. The participants also appreciated how they could document and quantify to the LHSKT Board of Directors why a particular property was nominated. Meanwhile, the LHSKT board member stated that the Trust would consider any of the long-list sites as having board approval for inquiring about selling prices and for hiring an independent property value assessor.
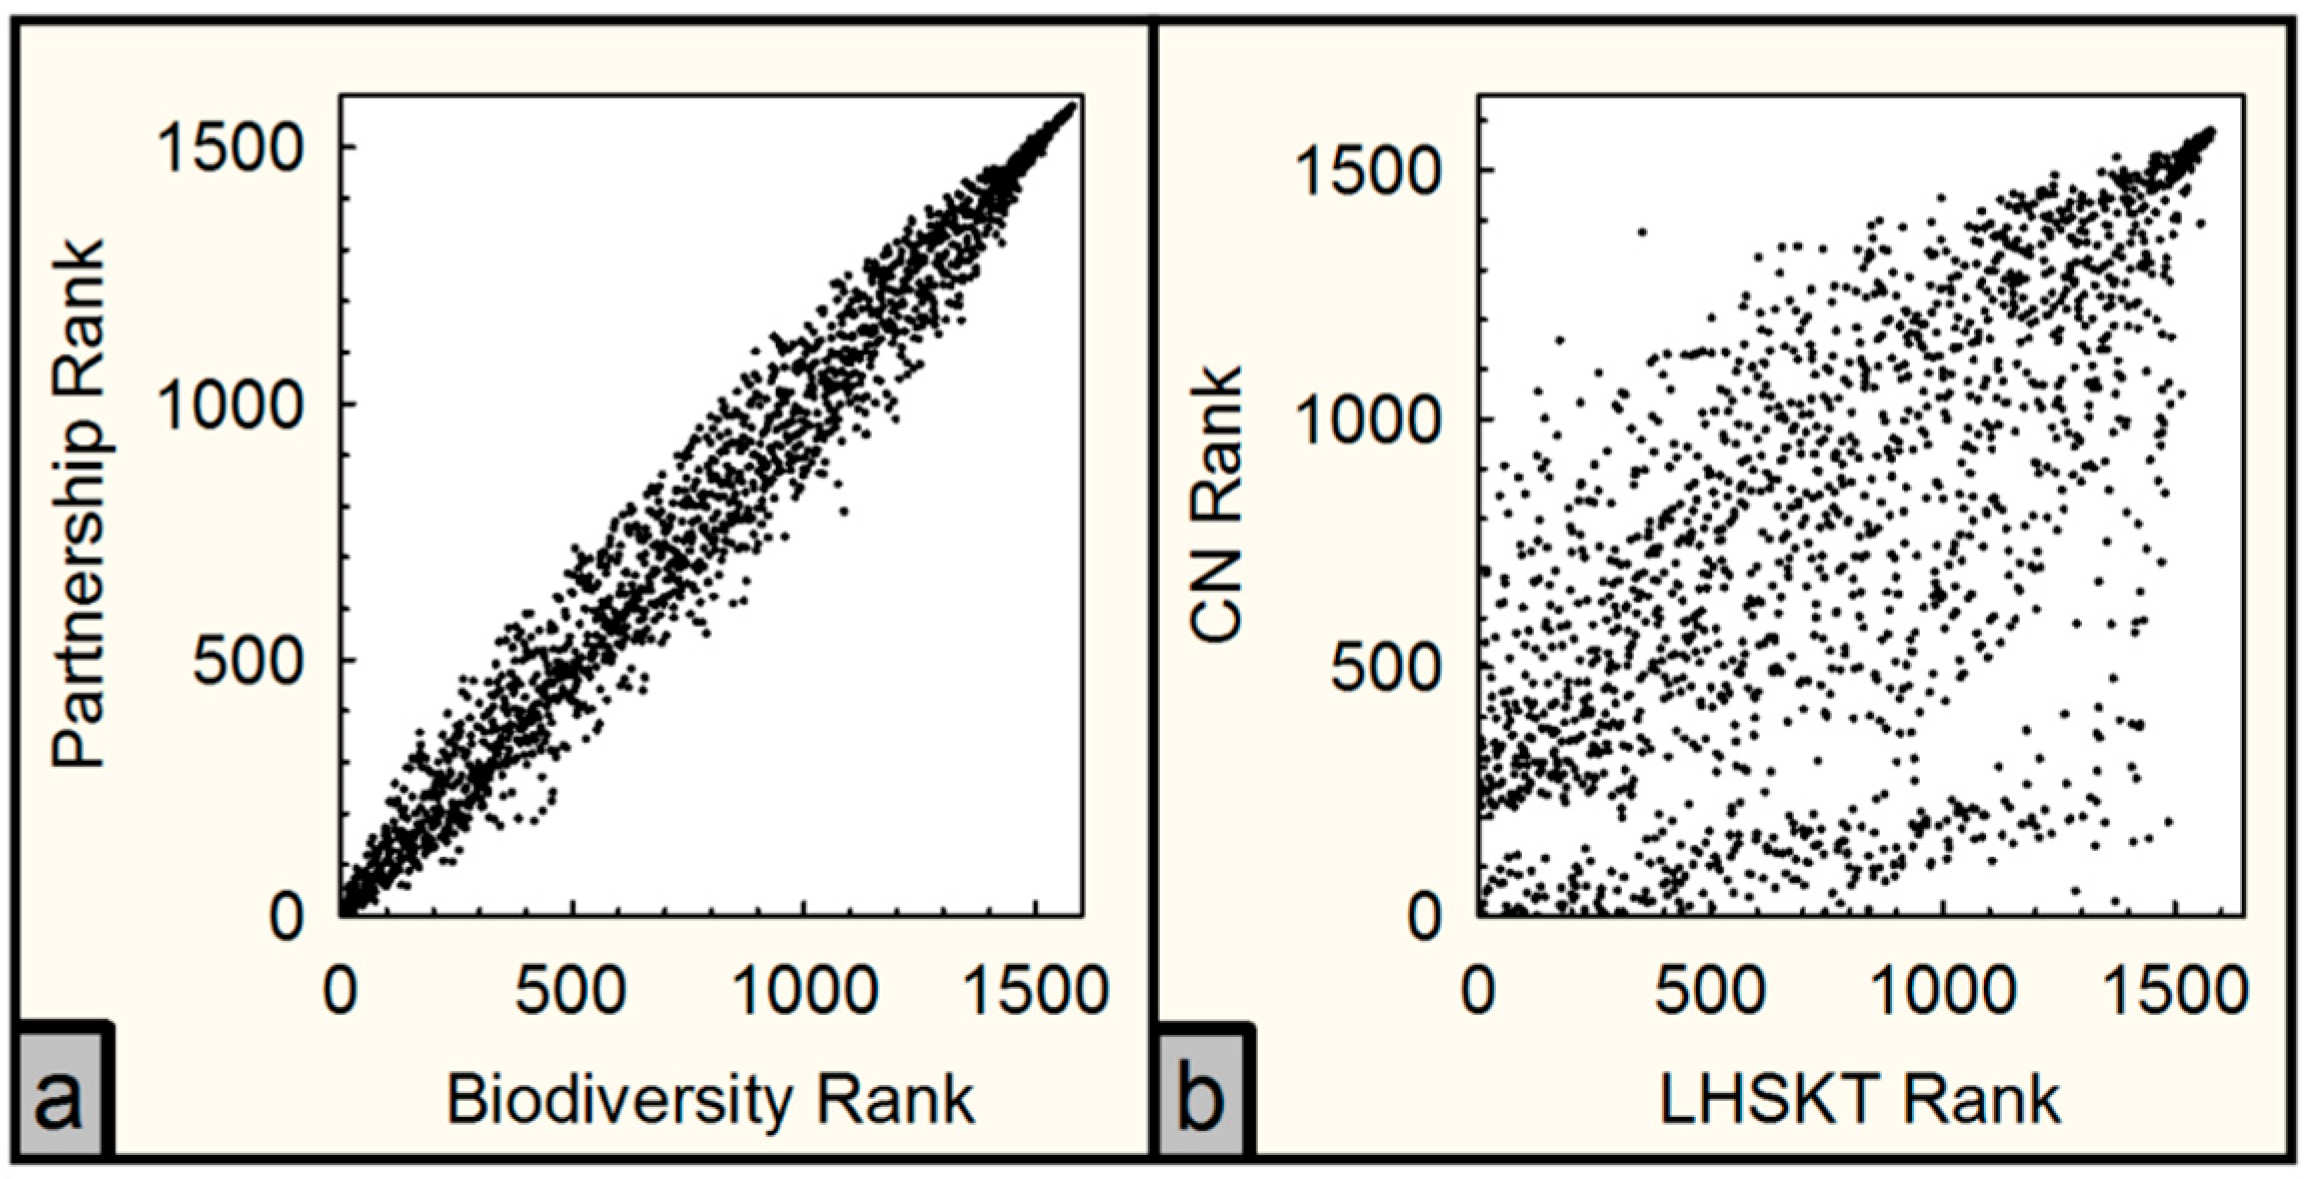
There was a strong positive relationship between rankings of sites for the partnership and the biodiversity outputs for all sites (
Figure 4a), and also when only the top 10% of partnership sites were considered (
Figure 5a). However, the CN and LHSKT outputs showed only weak relationships, as shown spatially (
Figure 3b,c) and in the scatter plots (
Figure 4b or
Figure 5b). This gives an indication that the partnership schema approach and biodiversity schema approach are large steps toward building consensus.
Surprisingly, the favorite map of the end-users was of an intermediate product, the “Habitats Representation” criterion (
Figure 6a,b). In the full analysis, the criterion was combined with two criteria (
Figure 2) that had a high uncertainty, so it was trusted more than the subsequent products. The local expert found a 100% correlation between it and his knowledge of 30 important and marginal succulent habitat locations.
4. Discussion
Although both organizations are in the business of conservation, there is a negative correlation (r
s = −0.24) between how their goals and mandates map out spatially. It must be remembered that these are only two organizations. As the number of organizations increase, the number of spatial differences is also expected to increase. This is not unique to this region, as there are often consequential differences in the goals and constraints among organizations implementing conservation [
38]. This emphasizes the importance and challenge of building consensus on spatial priorities. These inter-organizational differences were resolved via the multi-criteria framework and participatory process, yielding the partnership parameter schema and subsequently, a consensus set of spatial priorities. If this consensus-building potential is indeed joined by the other oft-cited benefits of increased participation, such as increased trust, understanding, and commitment to the solution [
7,
9,
10,
30,
39], then this approach shows promise in yielding scientifically sound conservation plans that have a good likelihood of implementation.
One of the potential pitfalls of participatory parameter setting is that expert opinion can be diluted by non-experts [
9]. We attempted to compensate for this by offering the use of opinion weights. These may be useful in some contexts, but they were not used here. However, the procedure of opening the floor for discussion before everyone voted allowed for the experts to voice their opinions, and for the non-experts to ask questions. This provided a good platform for knowledge “co-production” [
40], elucidating assumptions, and building the social learning organization [
6]. Most non-experts voted as the expert(s) recommended.
Similarly, the participatory approach changes the way the conservation planner influences the final results. In order for that person to effectively integrate their wisdom into the final output, they need to transfer some of their knowledge to the workshop participants who are setting the parameter values. This provides an added incentive to the planner to clearly and patiently communicate the principles and justifications of their beliefs. This again furthers social learning. Additional safeguards may need to be implemented to make sure that the consensus-building exercise does not jeopardize the biodiversity concerns of some participants [
41]. Worth considering for future studies also are the more sophisticated approaches for combining multiple criteria [
30], and for garnering a consensus set of parameter values [
11,
42,
43,
44]. A word of caution is to match the complexity of the consensus-building approach to the social process at hand as best as possible [
9].
The variation of making the parameter schema for “biodiversity”, while not necessary, appeared to have an important psychological role in building consensus. It allowed participants to give voice to what they thought was best for biodiversity, aside from their organization’s specific mandate for conserving biodiversity, or the constraints of the partnership. After doing this, they appeared better able to focus on the specifics of the partnership. It may also be that the exercise of stepping away from the goals of the organization, and the partnership, towards the biocentric yet daunting goals of all biodiversity, allowed a sense of relief and focus to come back to the goals of the partnership, in contrast to the goals of the partnership being the most expansive topic under consideration. A final potential benefit of this dual-centric weighting approach is that it keeps the conservation of biodiversity as an explicit goal in the conservation planning process, rather than an implicit one that can get lost in the din of many stakeholders.
This effect of keeping biodiversity at the top of mind might prove to be especially important in many of the hundreds of 30 by 30 conservation planning efforts underway worldwide. The genesis of this 30 by 30 initiative was as a means to conserve biodiversity, and now it has entered into the realm of land-use negotiation. Observations of how this is starting to play out in politics, and in science, are that there is an increasing risk of an overly strong anthropocentric lens (e.g., aesthetic, recreational, and spiritual benefits of nature) in deciding what 30% to conserve and what is “conservation” e.g., [
15,
45,
46]. Adopting a dual-centric weighting approach would ensure that any 30 by 30 effort has a better chance of yielding a spatial solution that is really good for biodiversity and not just people. A dual-centric weighting approach can be used in an informal consensus-building process or one that is formal, with participants providing private weights, etc. [
47].
It was a risk to let the participants determine the group process, but this built buy-in and led to the innovation of dual-centric weighting. Similarly, the participants’ decision to give each person an equal weight rather than each organization was counter to convention, but may have led to a product that is better implemented. It seemed to cement the camaraderie in the room, affirm that every person’s opinion was important, and increase the buy-in by individuals from CN (the majority). These were the individuals who would be the first to use or ignore the SDSS outputs in implementation. In sum, the empowerment of the participants to help define the process led to a surprising and less repeatable process than if it was defined by the experts, but it appears to have led to a product with a higher likelihood of implementation.
The choice of the modeling software underlying the SDSS can have implications for how much people understand the models and assumptions, and what parts they trust more than others. It also affects how motivated the community will be to keep the model living and up to date. These factors have long-term implications for socio-ecological resilience and are discussed elsewhere [
23,
24]. For example, the partnership and LHSKT outputs had a very low correlation (r
s = 0.39), and the partnership and biodiversity outputs had a good correlation (r
s = 0.84, for the subset of sites). One difference in these parameter schemas was that the LHSKT schema did not consider management cost, which is at the top of the logic model and thereby has a strong influence. This finding caused closer scrutiny of the cost data, increased awareness of its large uncertainty, and then increased trust and reliance by the end-users on the intermediate layers, also available, such as the habitat representation layer. These are important benefits of combining multi-criteria overlay with the incremental allocation approach [
23].


