

The Rise of Specialized and Innovative Little Giant Enterprises under China’s ‘Dual Circulation’ Development Pattern: An Analysis of Spatial Patterns and Determinants


Abstract
:1. Introduction
2. ‘Dual Circulation’ Development Pattern and the Growth of LGEs: Literature Review and Main Hypotheses
2.1. ‘Dual Circulation’ Development Pattern in China
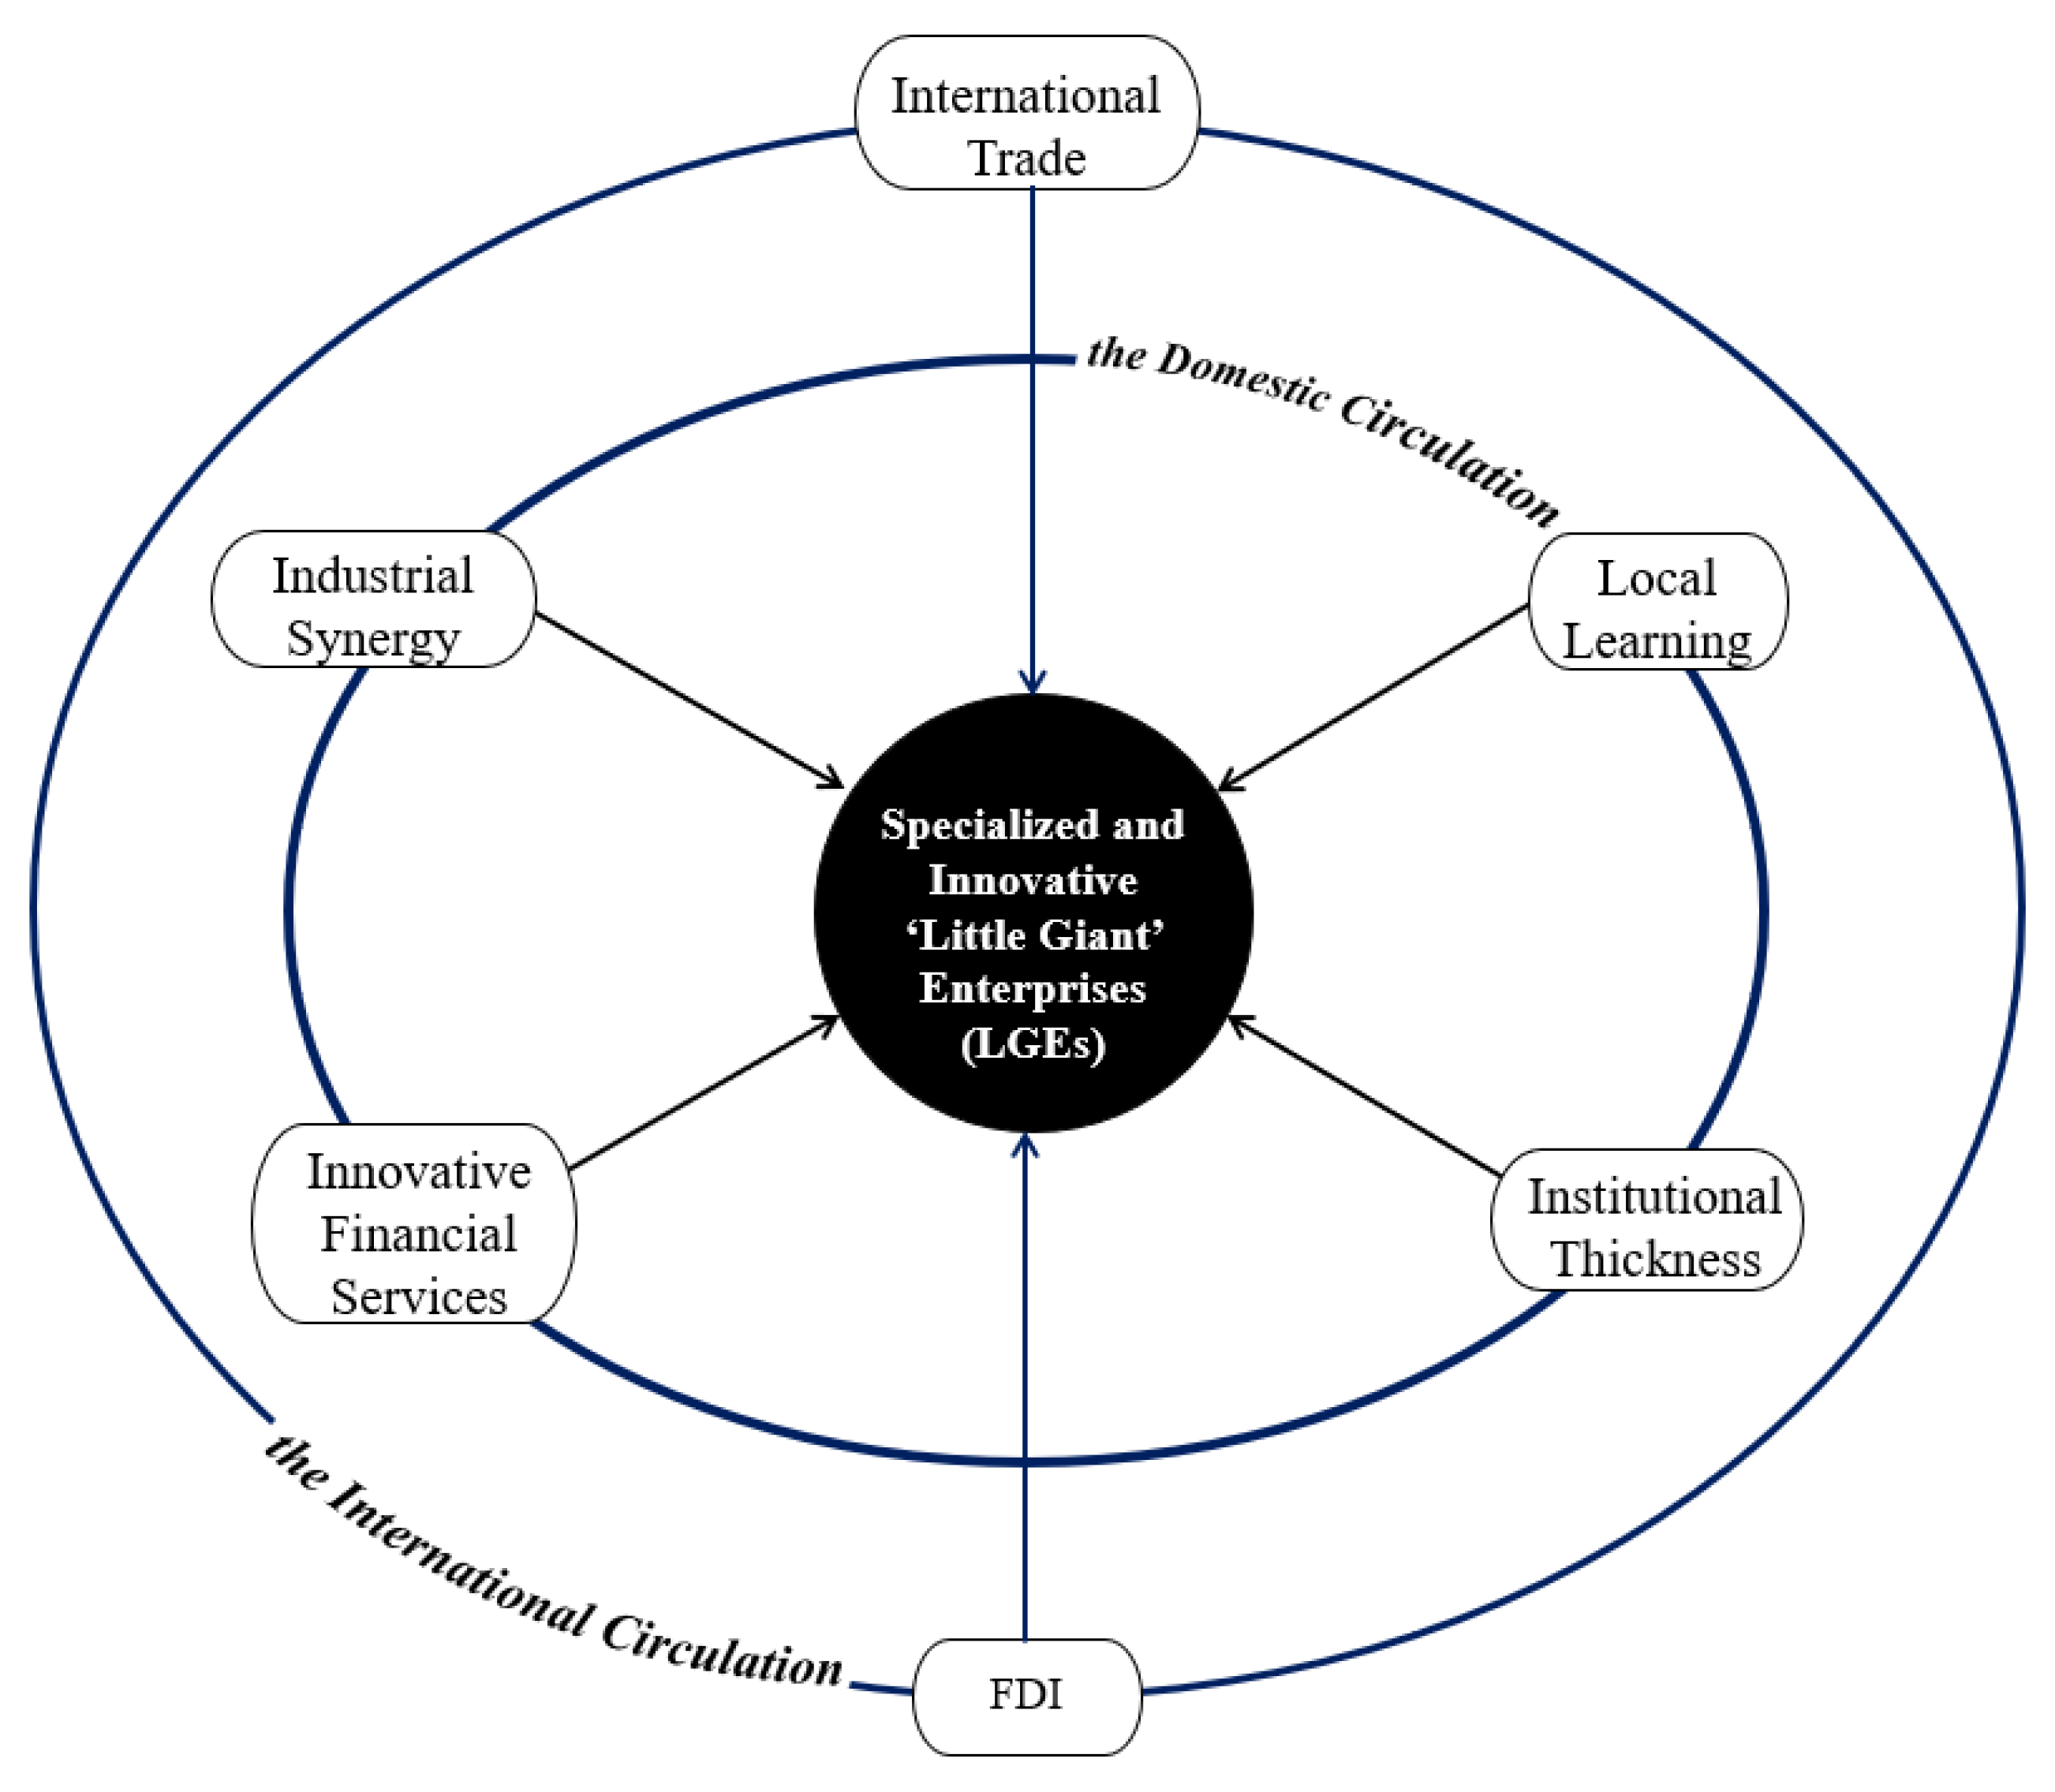
2.2. Analytical Framework and Main Hypotheses
2.2.1. International Trade, FDI, and the Growth of LGEs
2.2.2. Local Industrial Synergy and the Growth of LGEs
2.2.3. Local Learning and Growth of LGEs
2.2.4. Local Institutional Thickness and the Growth of LGEs
2.2.5. Local Innovative Financial Services and the Growth of LGEs
3. Study Area and Methodology
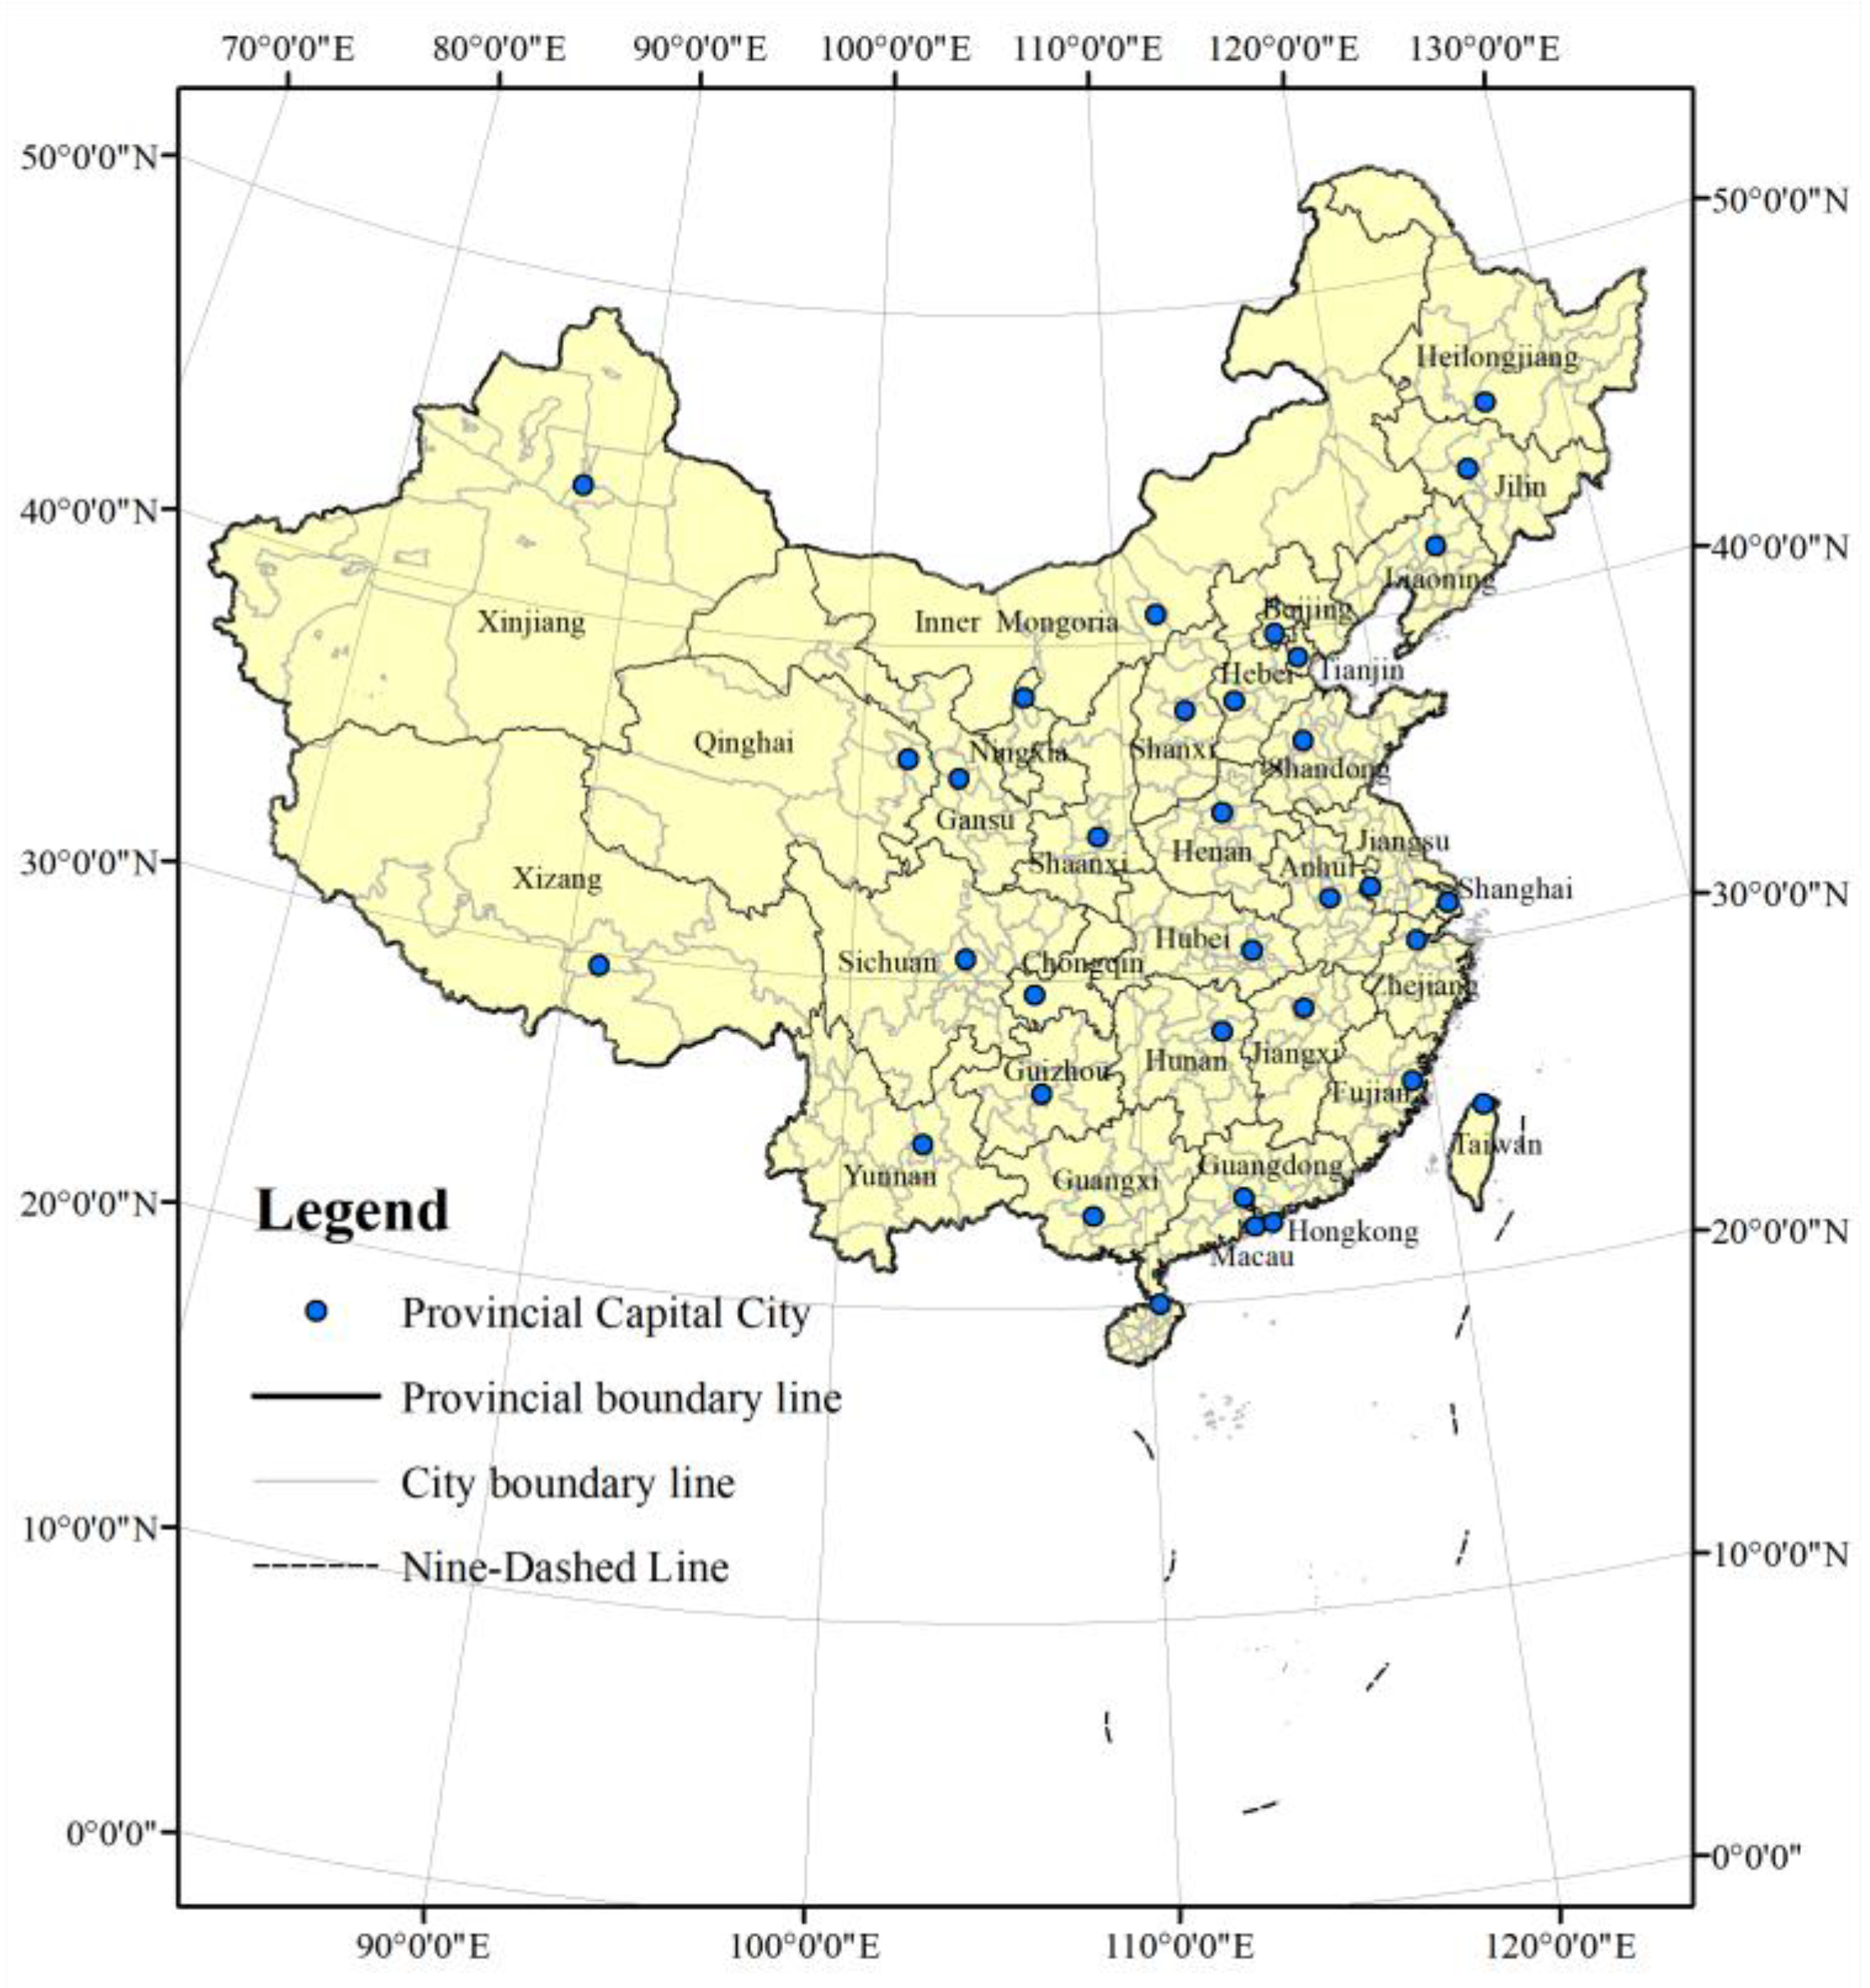
3.1. Study Area
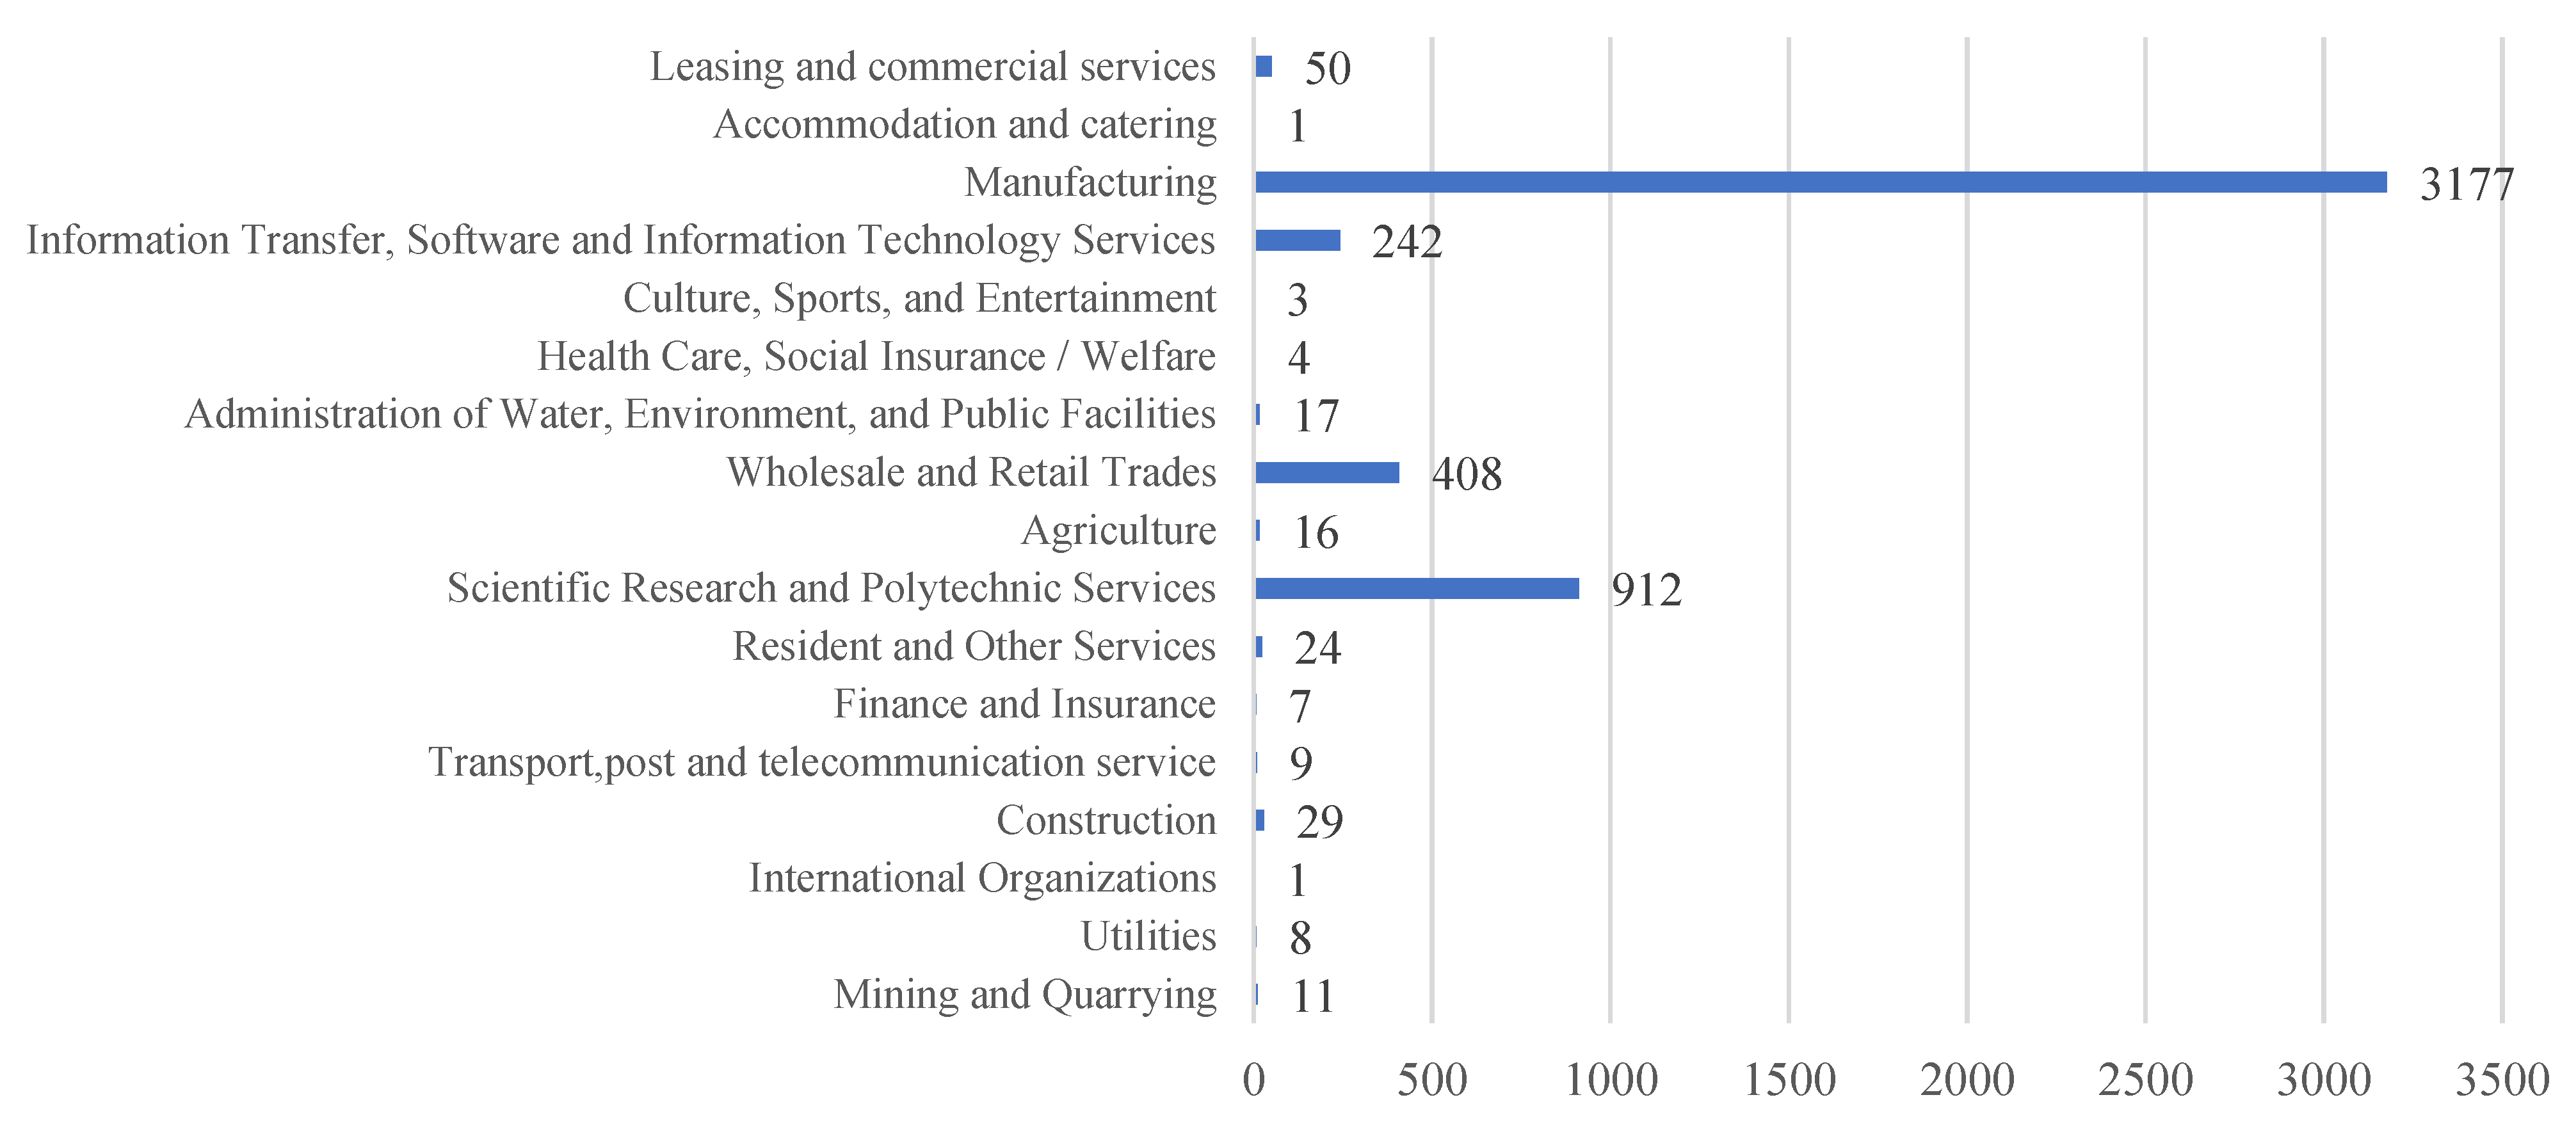
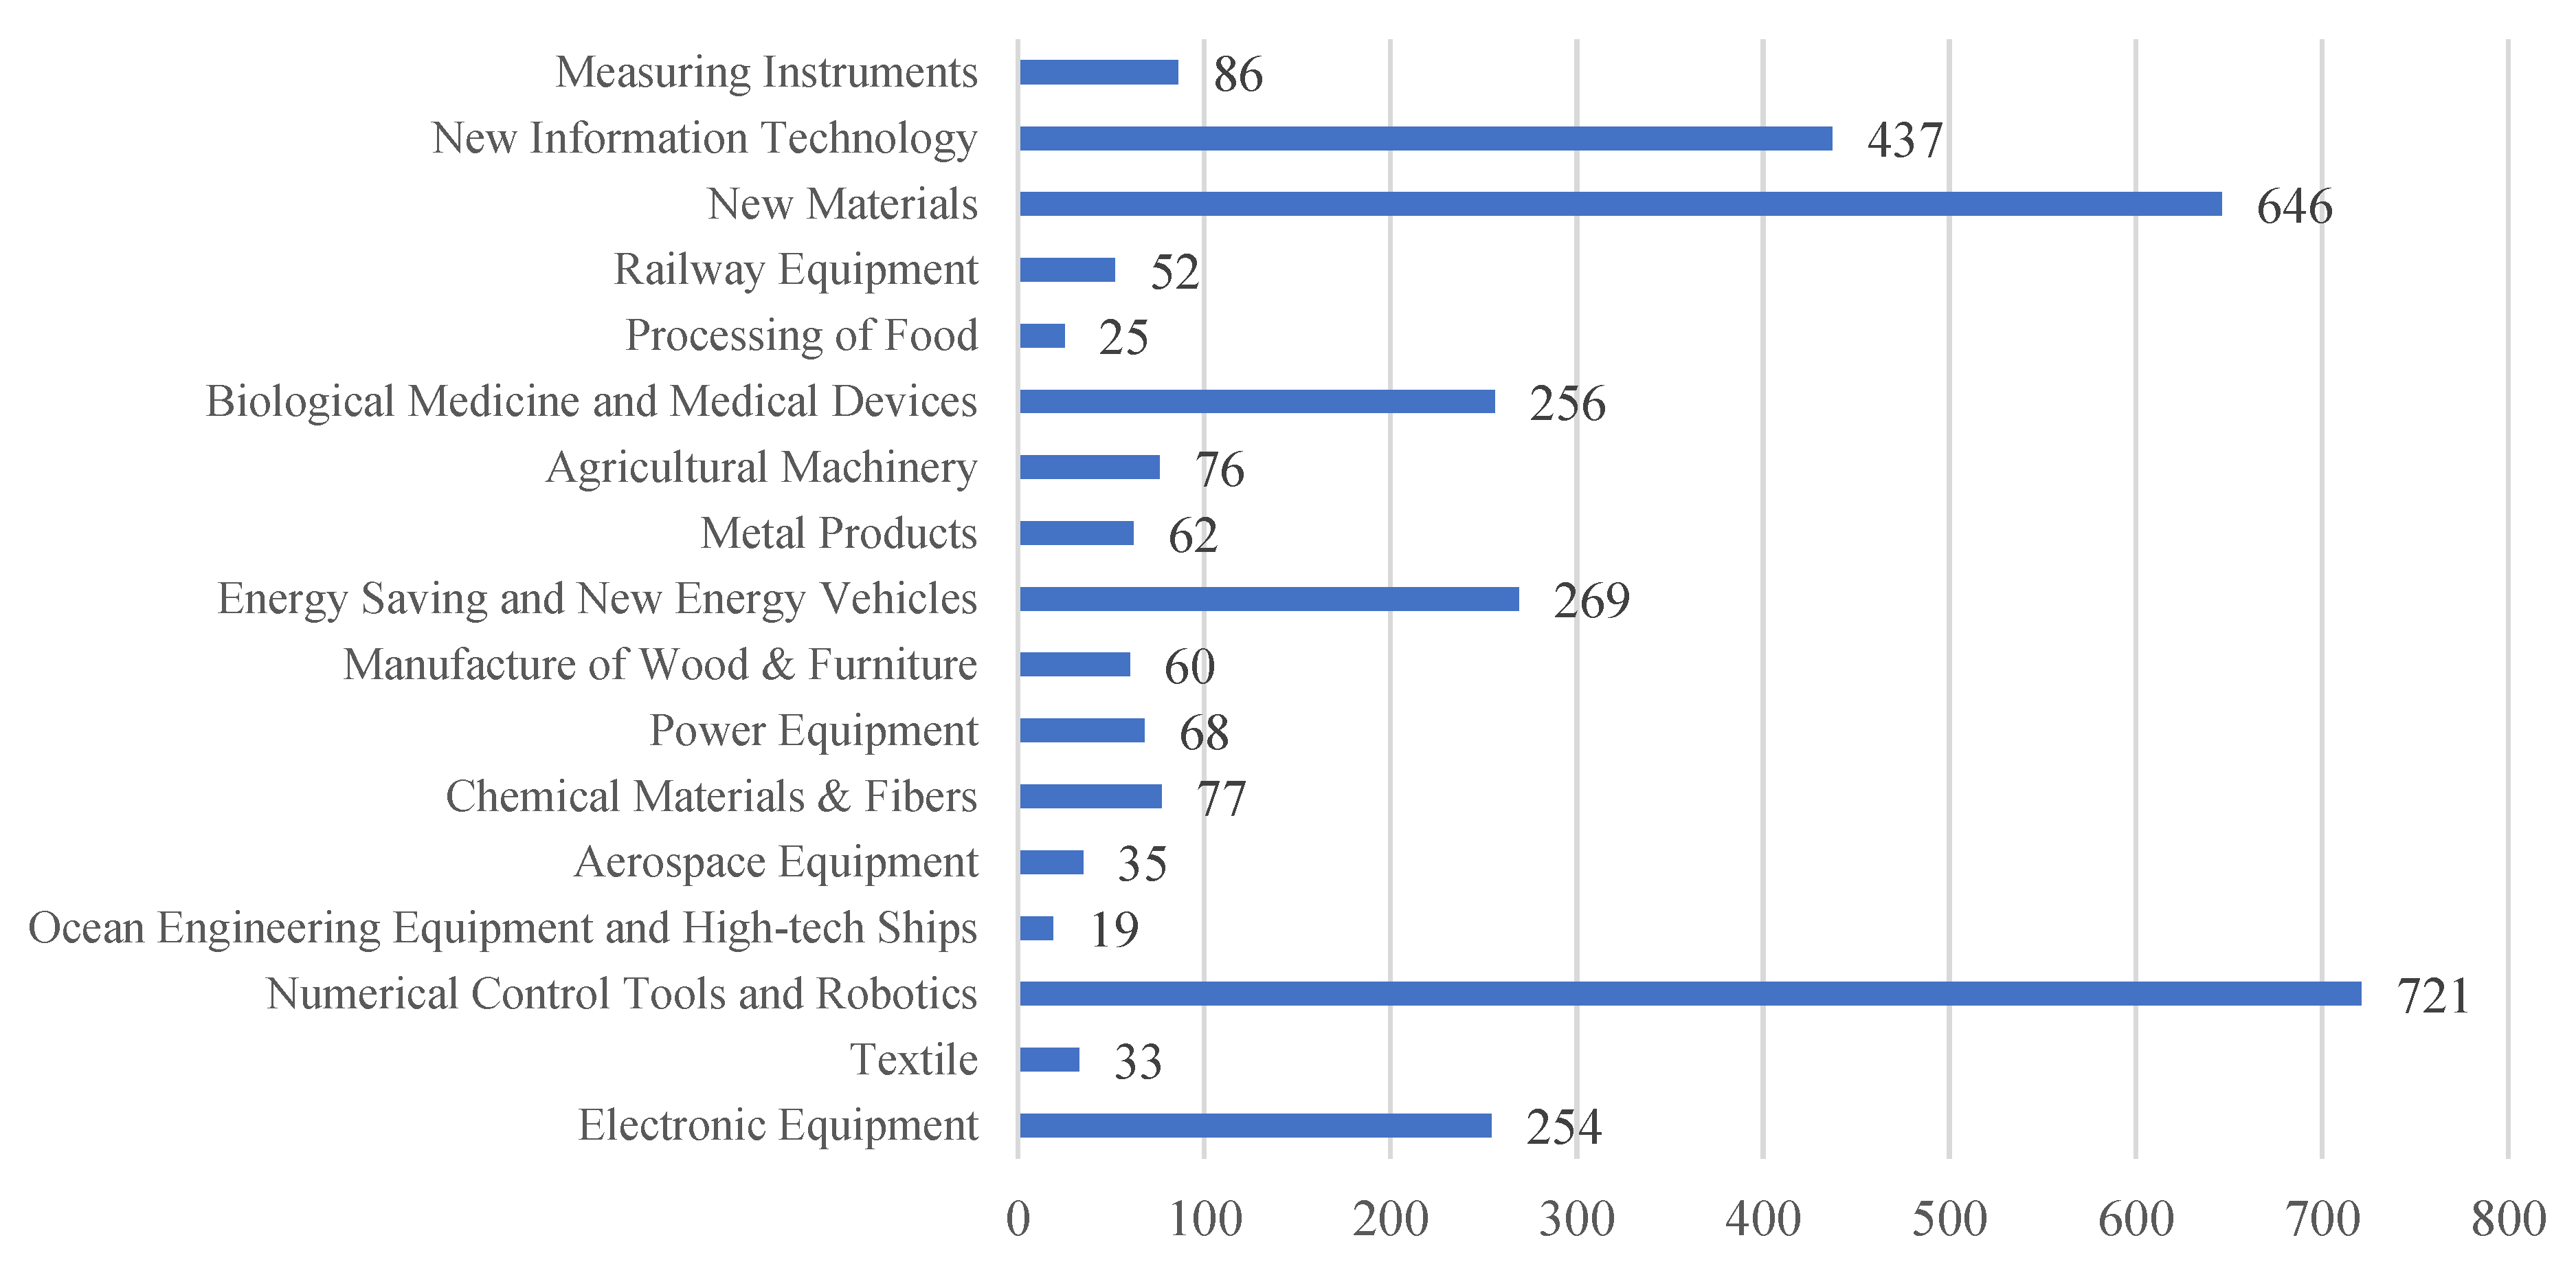
3.2. Data Sources and Statistics Profile
3.3. Research Method
3.3.1. Global Moran’s I
3.3.2. Anselin Local Moran’s I
3.3.3. Geographically Weighted Regression
4. Result
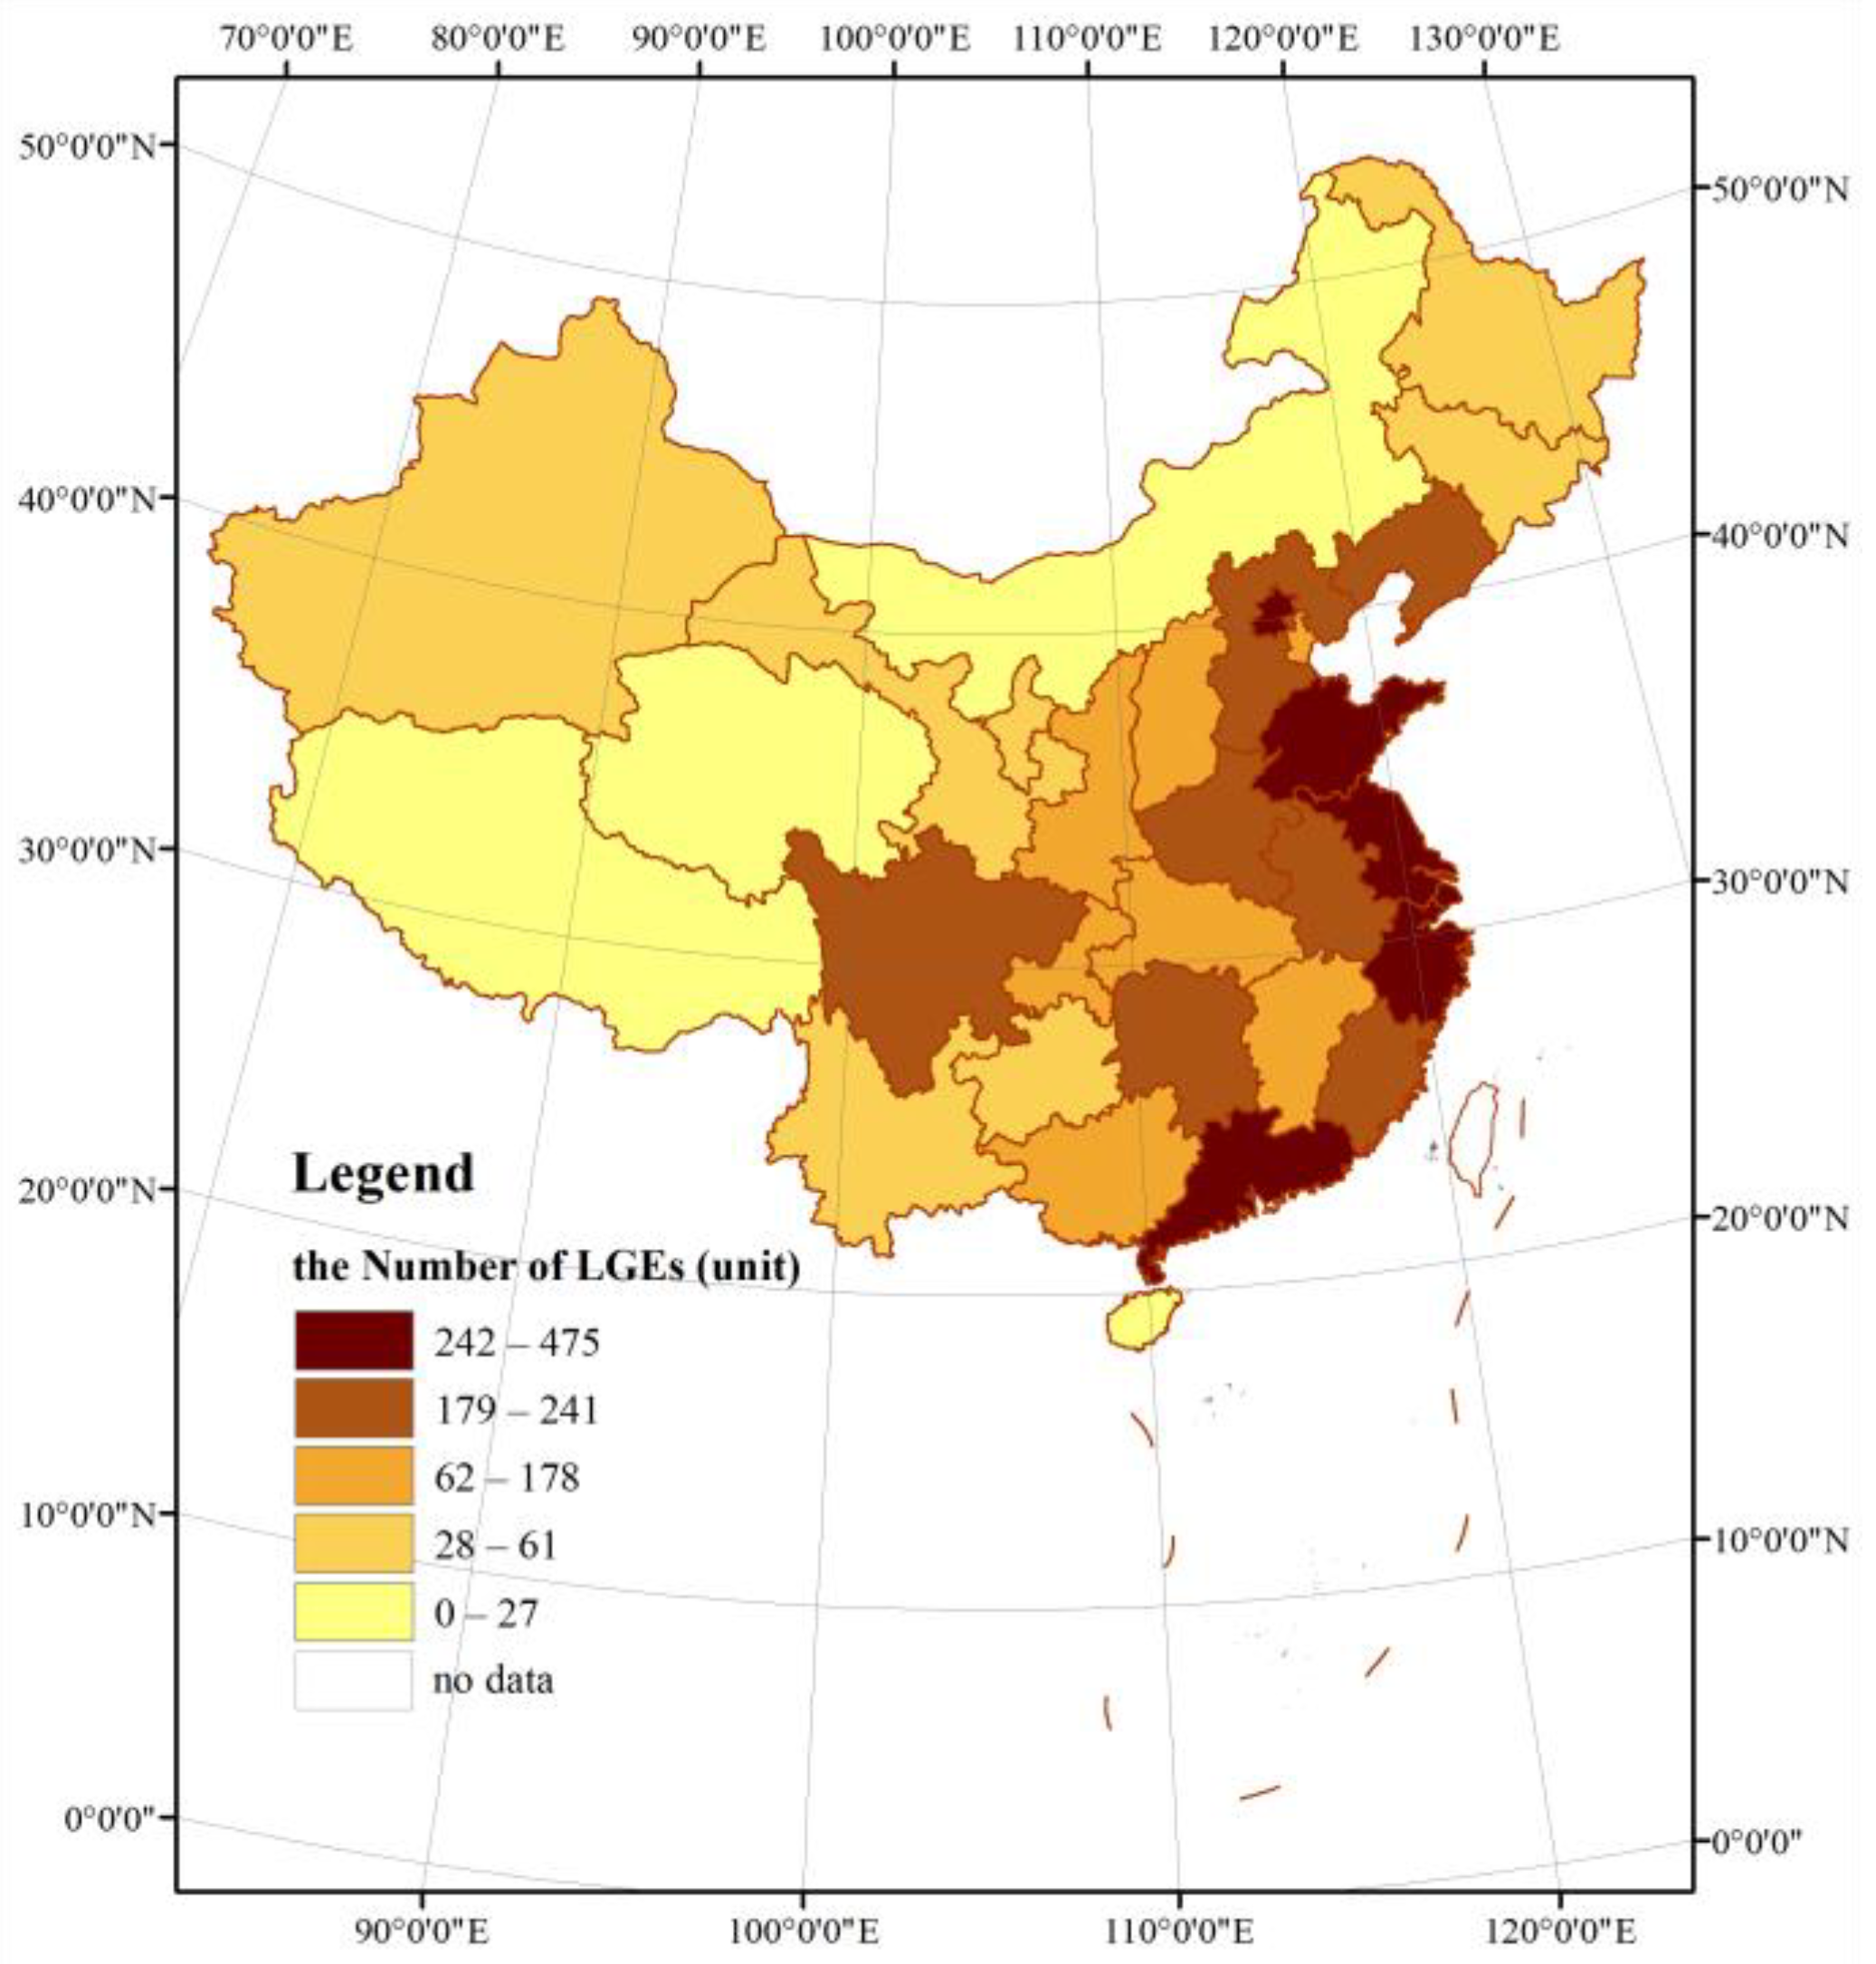
4.1. Spatial Distribution of LGEs
4.1.1. Spatial Distribution of LGEs
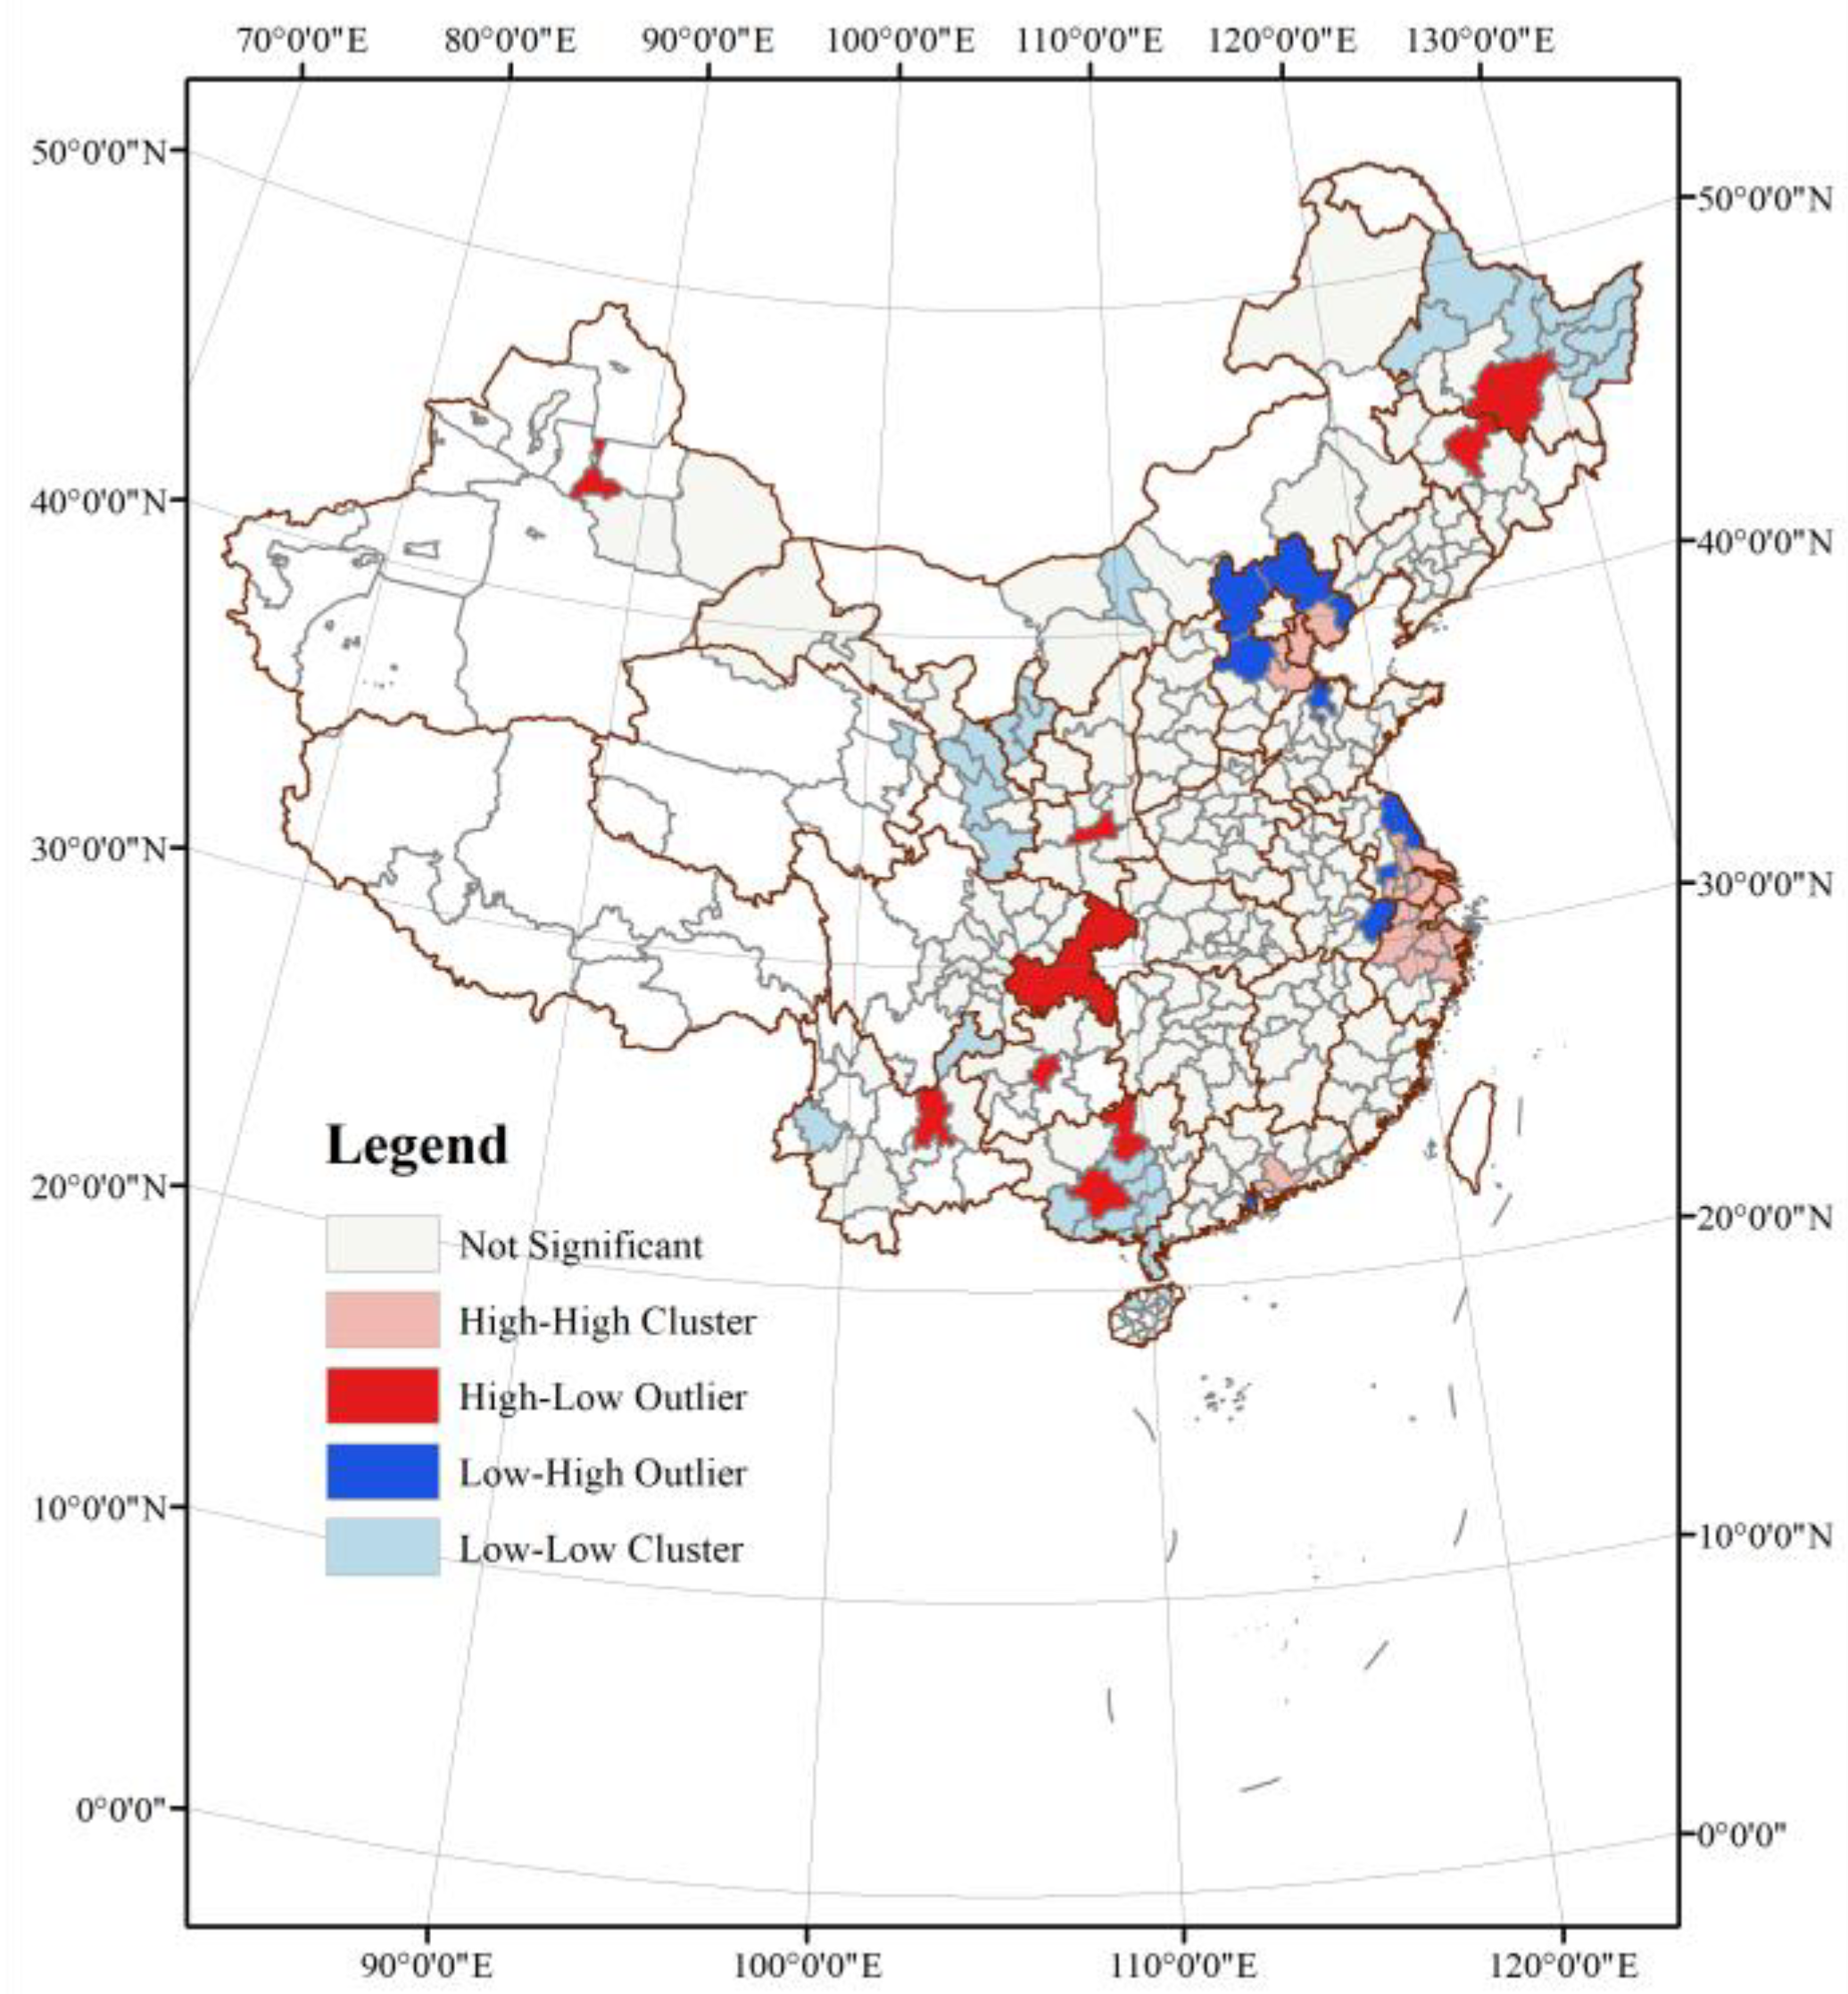
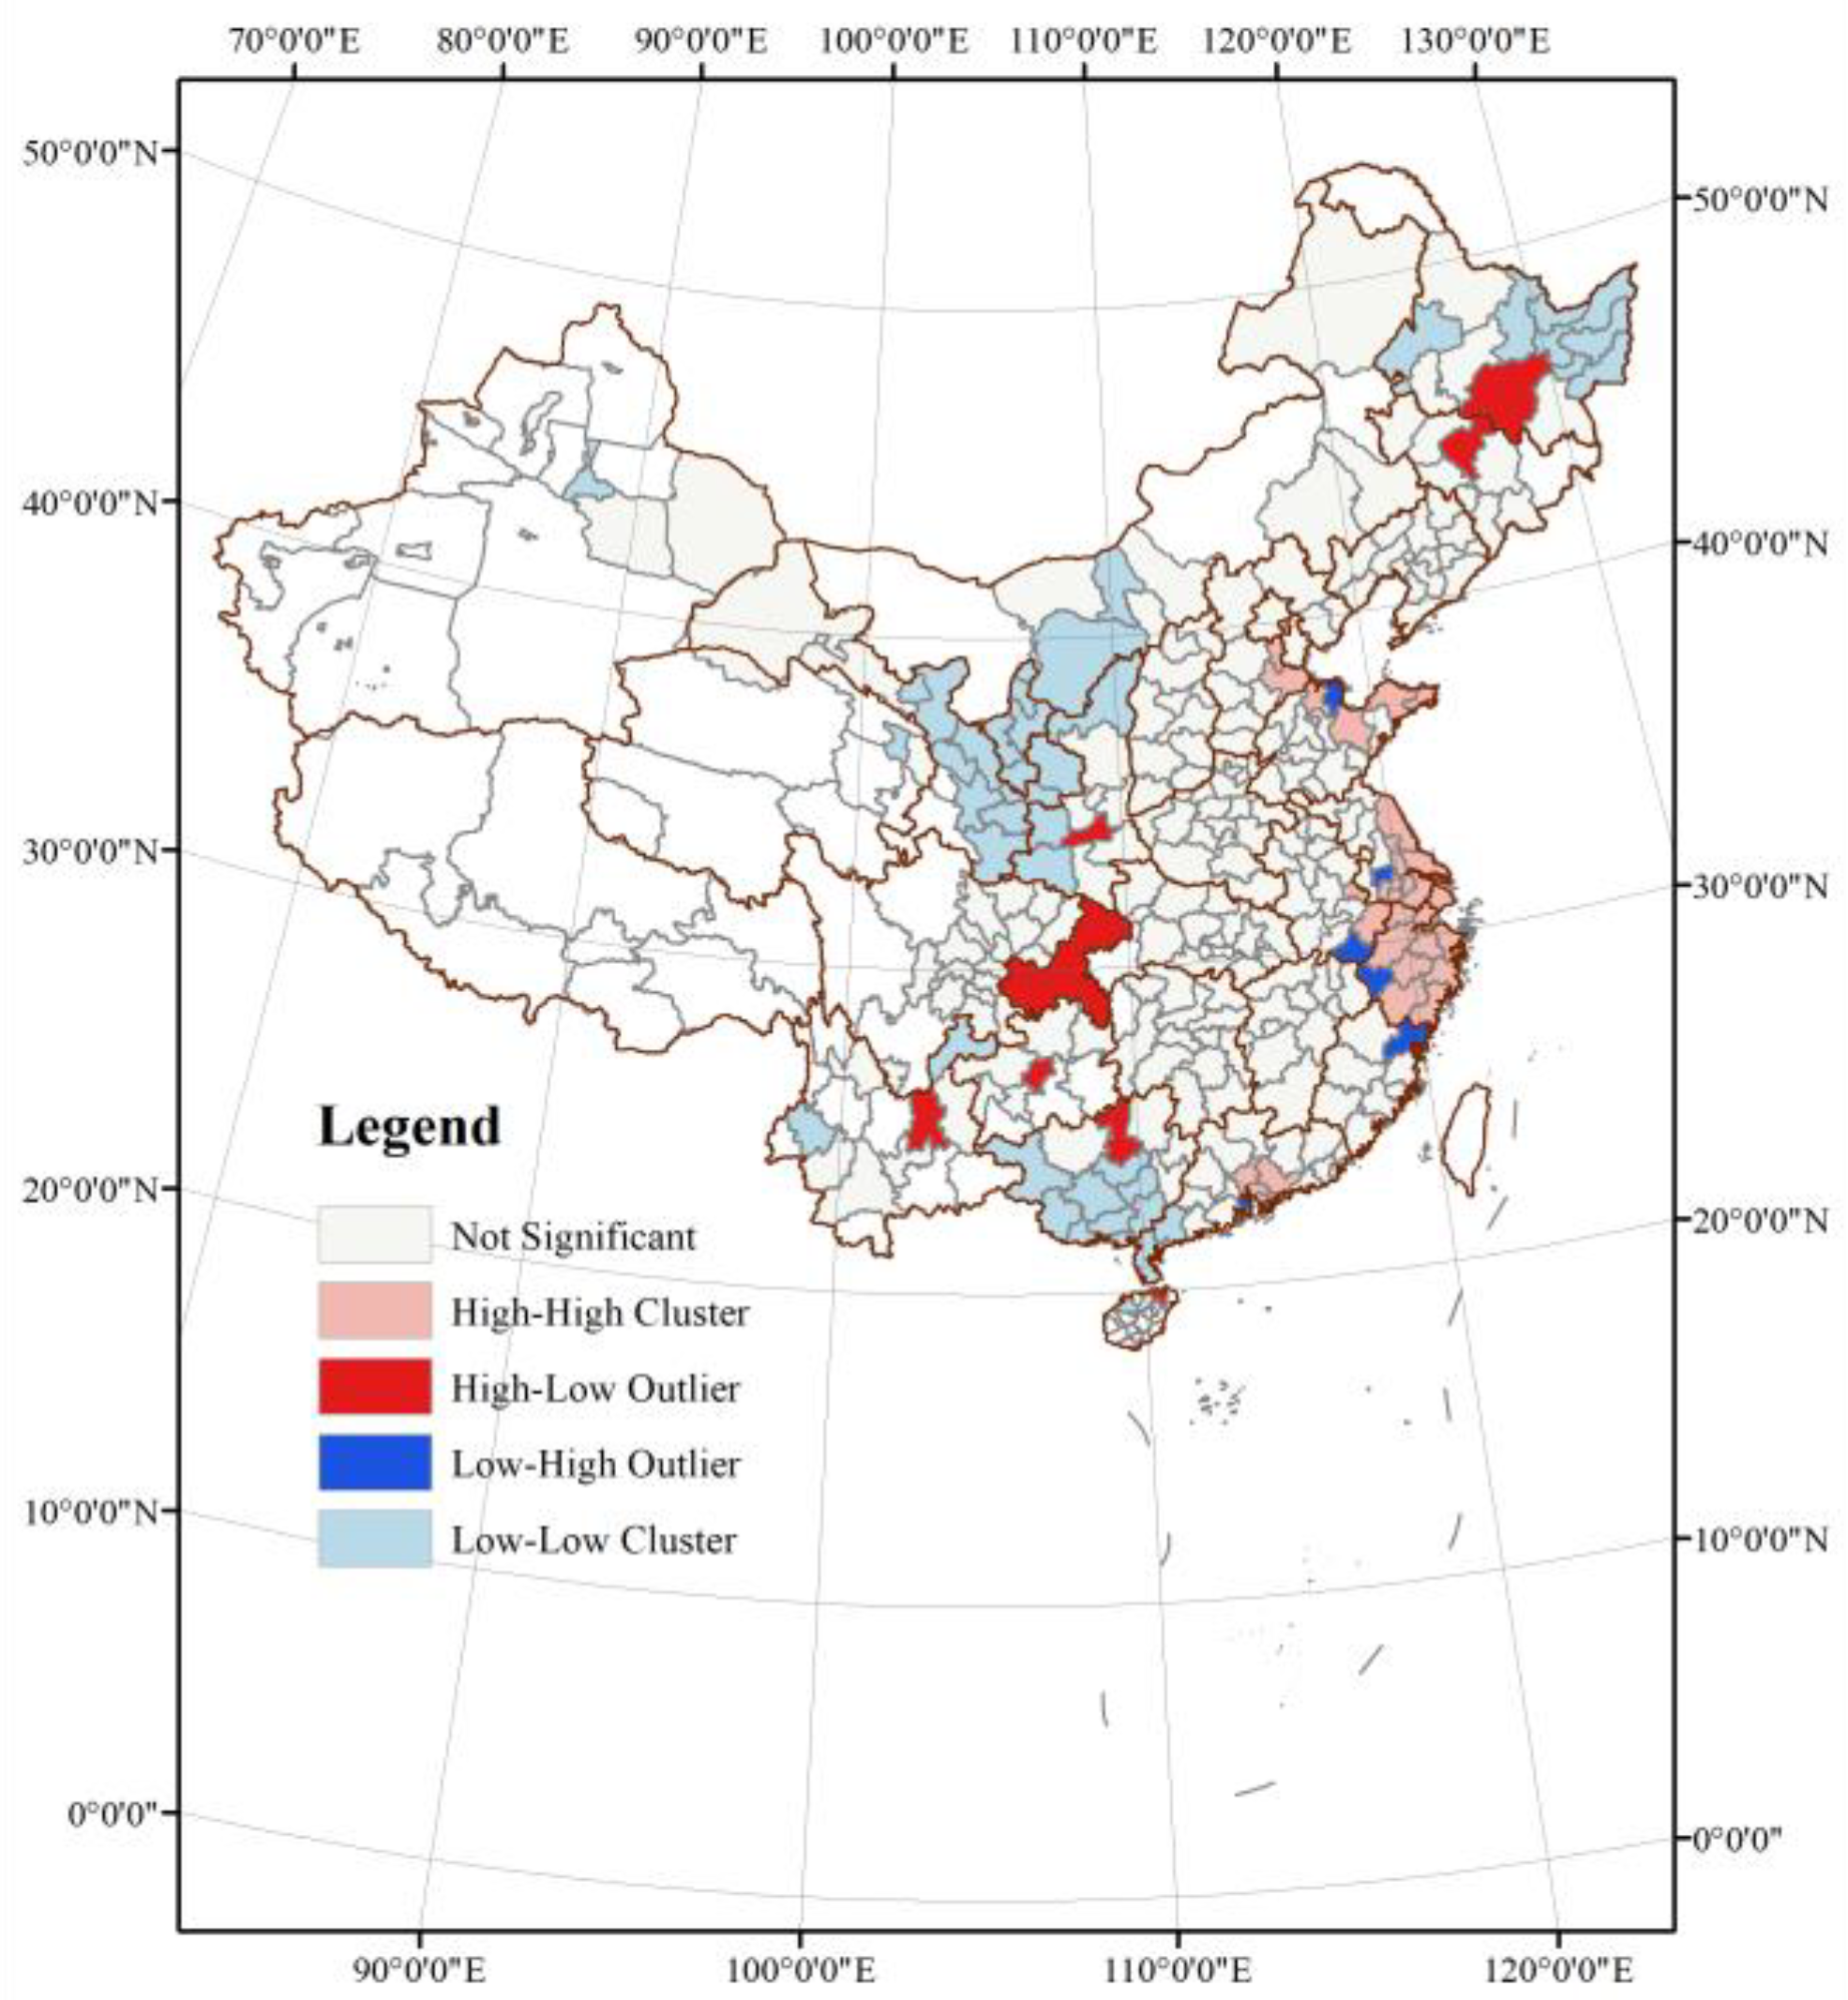
4.1.2. Geographical Agglomeration of LGEs
4.2. Influencing Factors of the Spatial Distribution of LGEs
4.2.1. Key Variables Adaptability Analysis and Model Selection
4.2.2. Global Analysis of Influencing Factors
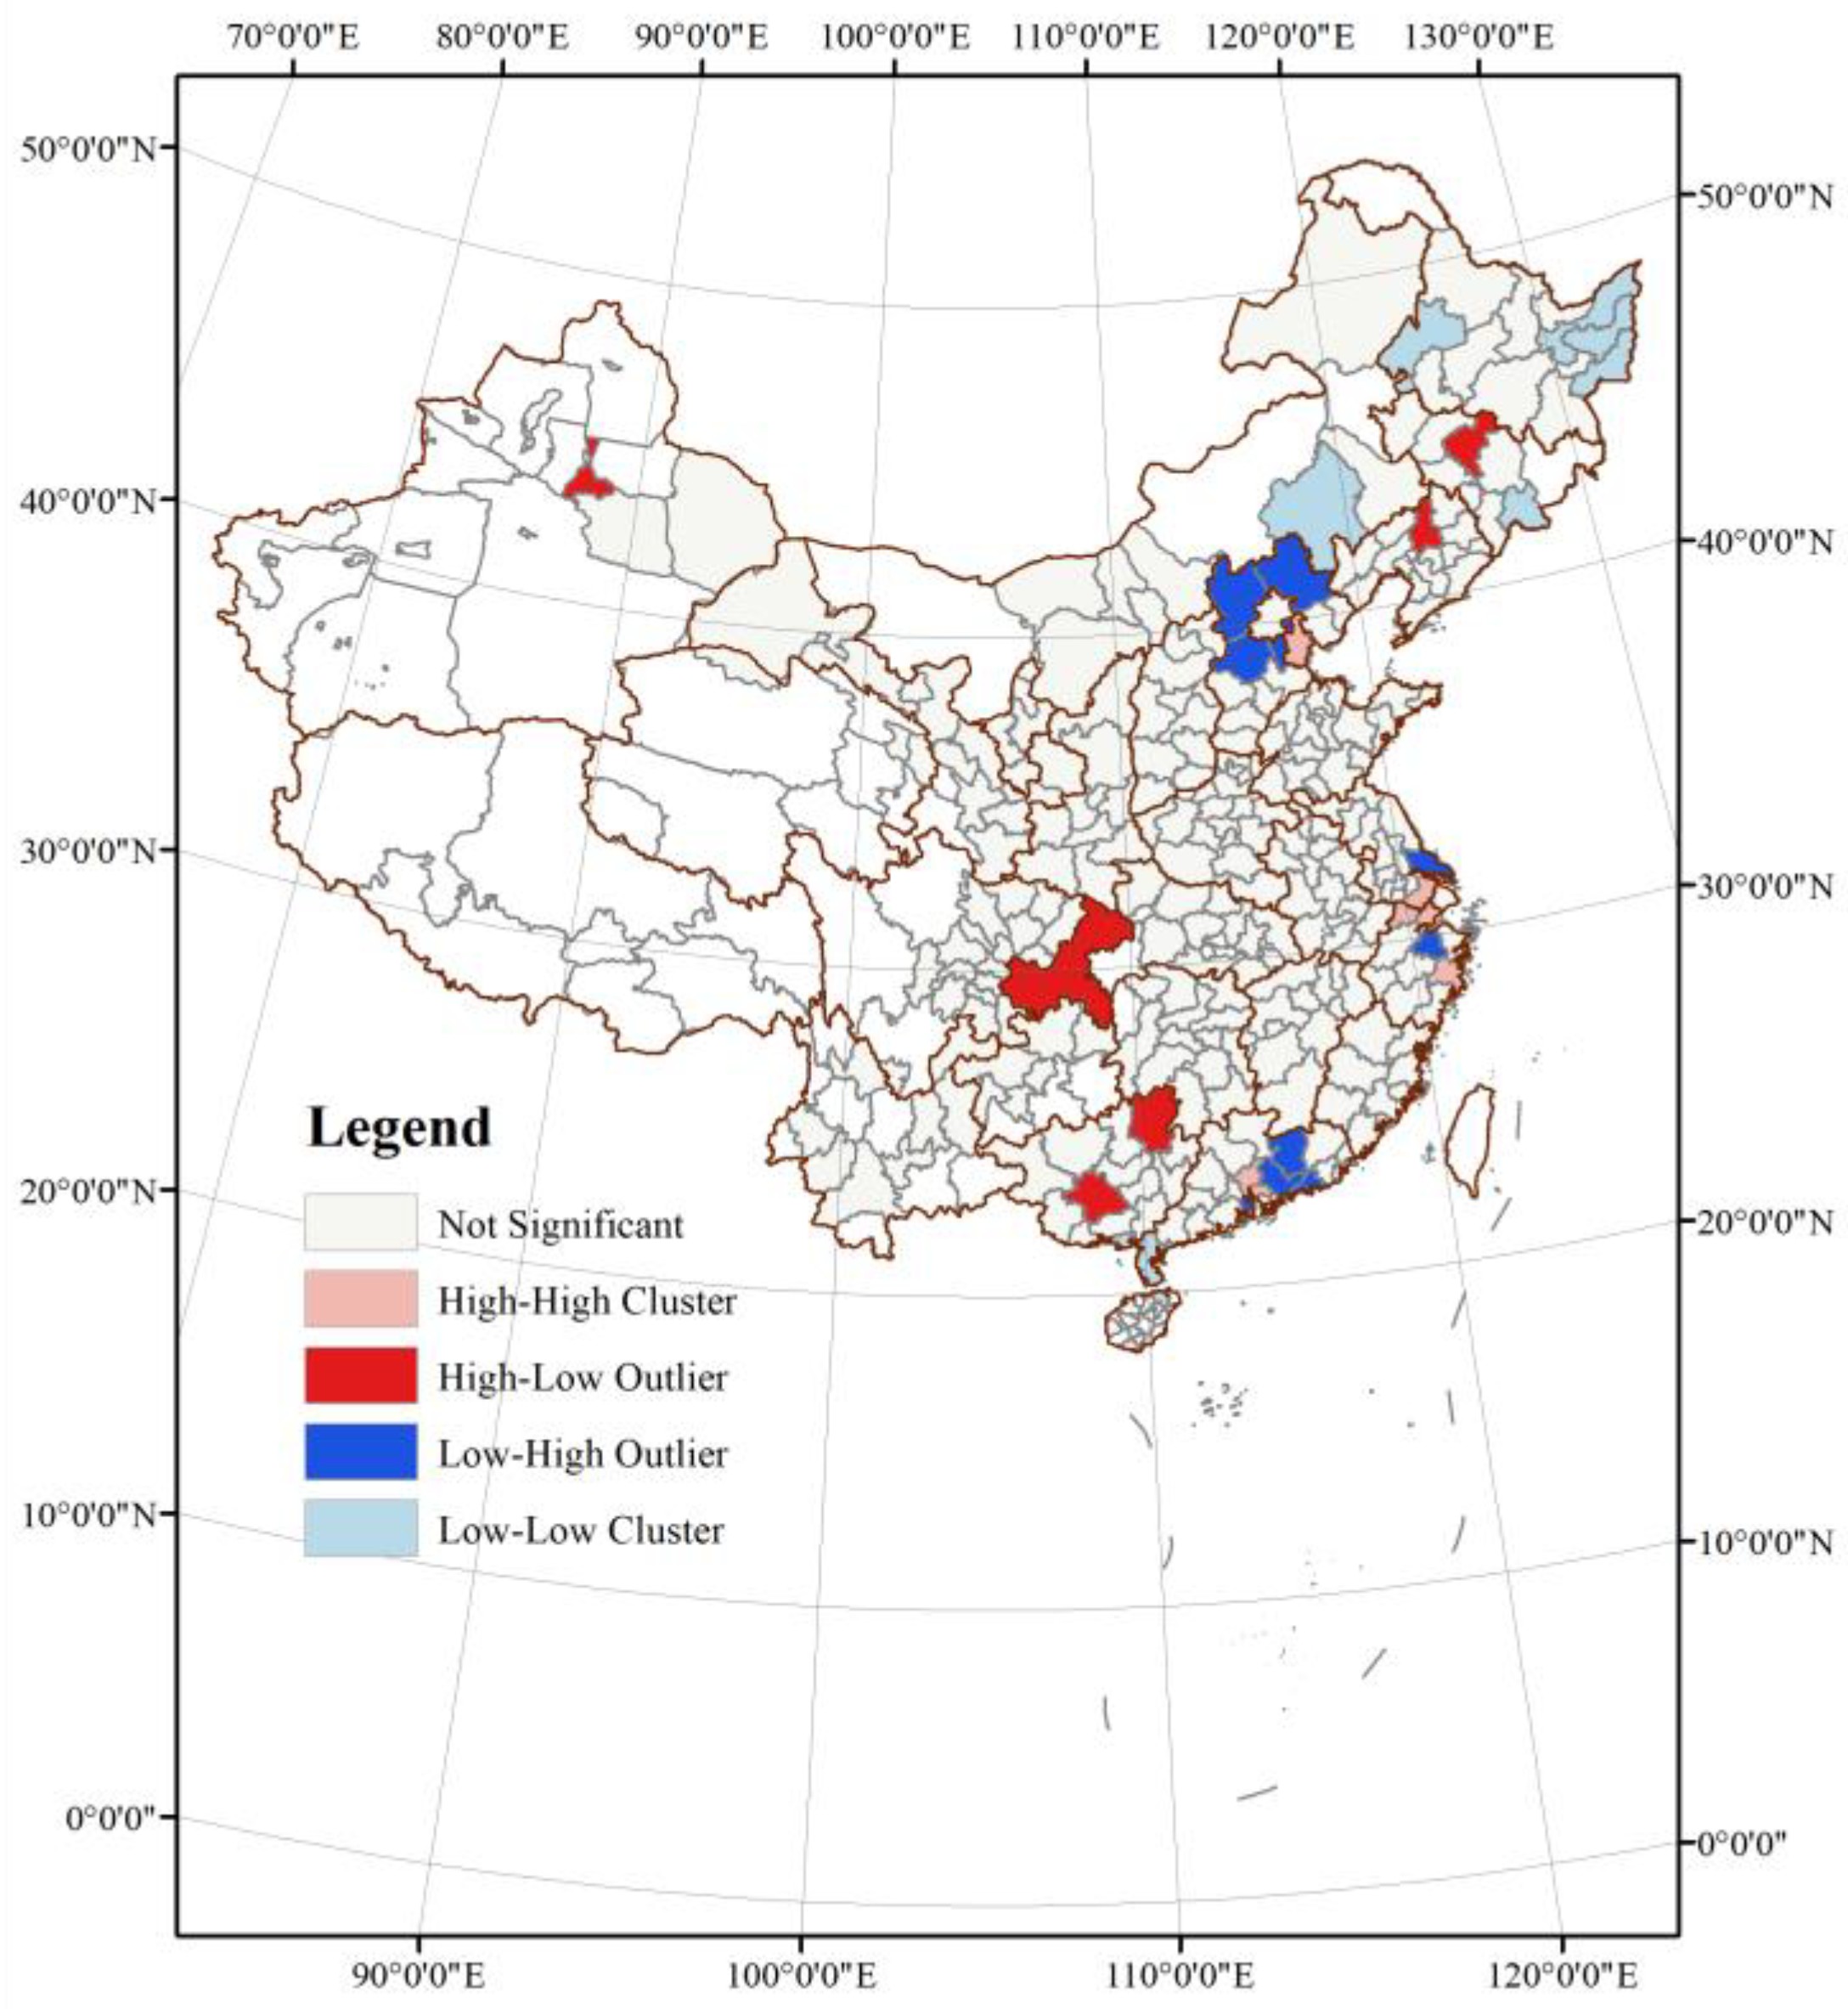
4.2.3. Local Analysis of Influencing Factors
5. Discussion and Conclusions
5.1. Discussion
5.2. Conclusions
Author Contributions
Funding
Institutional Review Board Statement
Informed Consent Statement
Data Availability Statement
Acknowledgments
Conflicts of Interest
References
- Simon, H. Hidden Champions: Aufbruch Nach Globalia Die Erfolgsstrategien Unbekannter Weltmarktfuhrer, 2nd ed.; Campus Verlag GmbH: Frankfurt, Germany, 2013; pp. 55–84. [Google Scholar]
- Scherer, F.M. Invention and Innovation In the Watt-Boulton Steam-Enging Venture. Technol. Cult. 1965, 6, 165–187. [Google Scholar] [CrossRef]
- Yoon, B. How do hidden champions differ from normal small and medium enterprises (SMEs) in innovation activities? J. Appl. Sci. Res. 2013, 9, 6257–6263. [Google Scholar]
- Simon, H.; Lorenz, J.U. Die heimlichen Gewinner: Die Erfolgsstrategien unbekannter Weltmarktführer; Campus-Verlag: Frankfurt, Germany, 1996; pp. 78–95. [Google Scholar]
- Garcia-Vega, M. Does Technology Diversification Promote Innovation? An Empirical Analysis for European Firms. Res. Policy 2006, 35, 230–246. [Google Scholar] [CrossRef]
- Schenkenhofer, J. Hidden Champions: A Review of The Literature & Future Research Avenues. Manag. Rev. Q. 2022, 72, 417–482. [Google Scholar]
- Eder, J.; Trippl, M. Innovation in the periphery: Compensation and exploitation strategies. Growth Change 2019, 4, 1511–1531. [Google Scholar] [CrossRef]
- Albers, H.H.; Suwala, L. Place leadership and corporate spatial responsibilities. In Handbook on City and Regional Leadership; Edward Elgar Publishing: Cheltenham, UK, 2021; pp. 108–130. [Google Scholar]
- Rietmann, C. Hidden Champions and their integration in rural regional innovation systems: Insights from Germany. ZFW-Adv. Econ. Geogr. 2022. [Google Scholar] [CrossRef]
- Venohr, B.; Meyer, K. The German Miracle Keeps Running: How Germany’s Hidden Champions Stay Ahead in the Global Economy. Berl. Sch. Econ. Work. Pap. 2007, 30, 1–33. [Google Scholar] [CrossRef] [Green Version]
- Ellison, G.; Glaeser, E.L.; Kerr, W. What Causes Industry Agglomeration? Evidence from Coagglomeration Patterns. J. Oper. Manag. 2007, 25, 785–805. [Google Scholar]
- Söderbom, M.; Weng, Q. Multi-Product Firms, Product Mix Changes and Upgrading: Evidence from China’s State-Owned Forest Areas. China Econ. Rev. 2012, 23, 801–818. [Google Scholar] [CrossRef] [Green Version]
- Zajac, E.J.; Kraatz, M.S.; Bresser, R.K. Modeling the Dynamics of Strategic Fit: A Normative Approach to Strategic Change Strategy. Manag. J. 2000, 21, 429–453. [Google Scholar] [CrossRef]
- Johann, M.S.; Block, J.H.; Benz, L. Financial performance of hidden champions: Evidence from German manufacturing firms. Multinatl. Bus. Rev. 2018, 26, 2–24. [Google Scholar] [CrossRef]
- Rant, M.B.; Cernr, S.K. Becoming A Hidden Champion: From Selective Use of Customer Intimacy and Product Leadership to Business Attractiveness. South East Eur. J. Econ. Bus. 2017, 12, 89–103. [Google Scholar] [CrossRef] [Green Version]
- Shi, J. Global and Local Factors of City Growth in China Based on the Change in the Manufacturing Sector. Prog. Geogr. 2019, 38, 1571–1582. [Google Scholar] [CrossRef]
- Dedrick, J.; Kraemer, K.; Linden, G. Who Profits from Innovation in Global Value Chains? A Study of the iPod and Notebook PCs. Ind. Corp. Change 2010, 19, 81–116. [Google Scholar] [CrossRef] [Green Version]
- Zhang, J.; Zheng, W.P. The Innovative Effect of Chinese Domestic Firms under the Global Value Chain. Econ. Res. J. 2020, 52, 4–19. [Google Scholar]
- Yang, W.L.; You, X.J.; Du, D.B. The Evolutionary Properties and Functions of the Geo-economic System from the Perspective of Global Commodity Trade Network. Geogr. Res. 2021, 37, 1–19. [Google Scholar]
- Hayakawa, K.; Tomohiro, M.; Fukunari, K. Globalization and Productivity: A Survey of Firm-Level Analysis. J. Econ. Surv. 2012, 26, 332–350. [Google Scholar] [CrossRef] [Green Version]
- He, C.F.; Ren, Z.R.; Wang, W.Y. “Dual circulation” and Beijing-Tianjin-Hebei High-Quality Coordinated Development: From the Division in the Value Chain And Factor Mobility Perspective. Acta Geogr. Sin. 2022, 77, 1339–1358. [Google Scholar]
- Kamakura, W.A.; Ramón-jerónimo, M.A.; Gravel, J.D.V. A Dynamic Perspective to the Internationalization of Small-Medium Enterprises. J. Acad. Mark. Sci. 2011, 40, 236–251. [Google Scholar] [CrossRef]
- Wang, Y.; Ning, L.; Li, J.; Prevezer, M. Foreign Direct Investment Spillovers and the Geography of Innovation in Chinese Regions: The Role of Regional Industrial Specialization and Diversity. Reg. Stud. 2016, 50, 805–822. [Google Scholar] [CrossRef]
- Landau, C.; Karna, A.; Richter, A.; Uhlenbruck, K. Institutional Leverage Capability: Creating and Using Institutional Advantages for Internationalization. Glob. Strategy J. 2016, 6, 50–68. [Google Scholar] [CrossRef]
- Lee, J.H.; HWAN, K.K. Scale-up Factors of Public Spin-offs to Grow up Middle Market Enterprise of Korea—A Case study on Kolmar BNH Co., Ltd.—Korean Corporation. Manag. Rev. 2019, 26, 43–63. [Google Scholar]
- Jones, S.L.; Fawcett, S.; Wallin, C.; Fawcett, A.M.; Brewer, B.L. Can Small Firms Gain Relational Advantage? Exploring Strategic Choice and Trustworthiness Signals in Supply Chain Relationships. Int. J. Prod. Res. 2014, 52, 5451–5466. [Google Scholar] [CrossRef]
- Simon, H. Innovation Activities of Mid-Sized World Market Leaders: The Case of the Hidden Champions. J. Creat. Innov. 2009, 2, 9–32. [Google Scholar]
- Song, Z.Y.; Liu, W.D. The Challenge of Wide Application of Information and Communication Technologies to Traditional Location Theory. Geogr. Sci. 2013, 23, 315–330. [Google Scholar] [CrossRef]
- Buckley, P.J.; Clegg, J.; Wang, C. Is the Relationship Between Inward FDI and Spillover Effects Linear? An Empirical Examination of the Case of China. Int. Bus. Stud. 2007, 38, 447–459. [Google Scholar] [CrossRef]
- Audretsch, D.B.; Lehmann, E.E.; Schenkenhofer, J. Internationalization strategies of hidden champions: Lessons from Germany. Multinatl. Bus. Rev. 2018, 26, 2–24. [Google Scholar] [CrossRef]
- Mear, F.; Werner, R.A. Subsidiarity as secret of success: “Hidden Champion” SMEs and subsidiarity as winning HRM configuration in interdisciplinary case studies. Empl. Relat. 2020, 43, 524–554. [Google Scholar] [CrossRef]
- Del, G.M.; Scuotto, V.; Garcia-Perez, A.; Petruzzelli, A.M. Shifting Wealth II in Chinese Economy. The Effect of the Horizontal Technology Spillover for SMEs for International Growth. Technol. Forecast. Soc. Change 2019, 145, 307–316. [Google Scholar]
- Tan, J.; Zhang, Y.Q.; Cao, H. The Fdi-Spawned Technological Spillover Effects On Innovation Quality of Local Enterprises: Evidence From Industrial Firms And The Patents In China. Appl. Econ. 2022, 20, 1–6. [Google Scholar] [CrossRef]
- Taddeo, R.; Simboli, A.; Ioppolo, G.; Morgante, A. Industrial symbiosis, networking and innovation: The potential role of innovation poles. Sustainability 2017, 9, 169. [Google Scholar] [CrossRef] [Green Version]
- Siskos, I.; Van Wassenhove, L.N. Synergy Management Services Companies A New Business Model for Industrial Park Operators. J. Ind. Ecol. 2017, 21, 802–814. [Google Scholar] [CrossRef]
- F-Jardon, C.M.; Pagani, R.N. Is Collective Efficiency in Subsistence Clusters a Growth Strategy? The Case of the Wood Industry in Obera, Argentina. Int. J. Emerg. Mark. 2009, 11, 232–255. [Google Scholar] [CrossRef]
- Fraccascia, L. The Impact of Technical And Economic Disruptions In Industrial Symbiosis Relationships: An Enterprise Input-Output Approach. Int. J. Prod. Econ. 2019, 213, 161–174. [Google Scholar] [CrossRef]
- Duschl, M.; Scholl, T.; Brenner, T.; Luxen, D.; Raschke, F. Industry-Specific Firm Growth and Agglomeration. Reg. Stud. 2015, 49, 1822–1839. [Google Scholar] [CrossRef] [Green Version]
- Noy, E. Niche Strategy: Merging Economic and Marketing Theories with Population Ecology Arguments. J. Strateg. Mark. 2010, 18, 77–86. [Google Scholar] [CrossRef]
- Eswaran, M.; Ashok, K. The Role of the Service Sector in the Process of Industrialization. J. Dev. Econ. 2002, 68, 401–420. [Google Scholar] [CrossRef]
- Andersson, M. Co-Location of Manufacturing and Producer Services—A Simultaneous Equation Approach, 1st ed.; Routledge: London, UK, 2004; pp. 18–25. [Google Scholar]
- Ellison, G.; Glaeser, E.L.; Kerr, W.R. What Causes Industry Agglomeration? Evidence from Coagglomeration Patterns. Am. Econ. Rev. 2010, 100, 1195–1213. [Google Scholar] [CrossRef] [Green Version]
- Petruzzelli, A.M.; Albino, V.; Carbonara, N. External Knowledge Sources and Proximity. J. Knowl. Manag. 2009, 13, 301–318. [Google Scholar] [CrossRef]
- Caniels, M.C.; Donald, B. Knowledge Spillovers and Economic Growth: Regional Growth Differentials across Europe. Reg. Sci. 2002, 42, 437–439. [Google Scholar]
- Seung, K.A. A Study on the Business Ecosystem of German SMEs and its Implications for Korean SMEs: Focusing on the Hidden Champion Enterprises in Germany. Korean J. Econ. Manag. 2014, 32, 69–95. [Google Scholar]
- Sarkar, S. Uncorking Knowledge-Purposeful Spillovers as a Strategic Tool for Capability Enhancement in the Cork Industry. Int. Entrep. Manag. J. 2017, 13, 251–275. [Google Scholar] [CrossRef]
- Alexy, O.; George, G.; Salter, A.J. Cui Bono? The Selective Revealing of Knowledge And Its Implications For Innovative Activity. Acad. Manag. Rev. 2013, 38, 270–291. [Google Scholar] [CrossRef]
- Mulder, R.H.; Messmann, G.; Konig, C. Vocational Education and Training: Researching the Relationship between School and Work. Eur. J. Educ. 2016, 50, 497–512. [Google Scholar] [CrossRef]
- Leeuwen, V.G. Innovation and Performance: A Collection of Microdata Studies; Proefschrift Technische Universiteit Delft: Delft, The Netherland, 2009. [Google Scholar]
- Giordano, B. ‘Institutional thickness’, Political Sub-Culture and the Resurgence of (the ‘New’) Regionalism in Italy—A Case Study of the Northern League in the Province of Varese. Trans. Inst. Br. Geogr. 2001, 26, 25–41. [Google Scholar] [CrossRef]
- Kim, S.W. An Analysis of Critical Factors in The Success of Global “Hidden Champion” Enterprises. J. Entrep. Ventur. Stud. 2010, 13, 87–114. [Google Scholar]
- Kwon, K.S.; Kim, B.J.; Ha, K.S. An Exploratory Study of Key Success Factors in Public R&D Institutions’ Business Supporting Service-Focused on Ceramic Hidden Champion Project. Asia-Pac. J. Bus. Ventur. Entrep. 2012, 7, 225–232. [Google Scholar]
- Wang, S.; Ahmad, F.; Li, Y.; Abid, N.; Chandio, A.A.; Rehman, A. The Impact of Industrial Subsidies and Enterprise Innovation on Enterprise Performance: Evidence from Listed Chinese Manufacturing Companies. Sustainability 2022, 14, 4520. [Google Scholar] [CrossRef]
- Armstrong, H.W.; Kehrer, B.; Wells, P. Initial Impacts of Community Economic Development Initiatives in the Yorkshire and Humber Structural Funds Programme. Reg. Stud. 2001, 35, 673–688. [Google Scholar] [CrossRef]
- Zhao, K.; Wu, W.S. Innovation of Family-Owned Enterprises and Government Subsidies: From A Policy-Oriented Perspective. Sustainability 2022, 14, 13331. [Google Scholar] [CrossRef]
- Zhang, X.; Yu, F.Z.; Xu, L.J. Spatial Structure of Urban Networks in China Based on the Perspective of Cultural Industry Enterprise Networks. Prog. Geogr. 2020, 39, 78–90. [Google Scholar] [CrossRef]
- Chen, B.K.; Lin, Y.F. Financial Repression, Insutrial Structure and Income Distribution. J. World Econ. Res. J. 2012, 35, 3–23. [Google Scholar]
- Khoe, K.I. The Activation Plan of Government Supporting Loan for Development of Digital Contents Industry and Case Study. J. CEO Manag. Stud. 2015, 18, 151–167. [Google Scholar]
- Rietmann, C. Corporate responsibility and place leadership in rural digitalization: The case of Hidden Champions. Eur. Plan. Stud. 2022, 2, 1–21. [Google Scholar] [CrossRef]
- Guo, F.; Wang, J.Y.; Wang, F. Measuring the Development of Digital Financial Inclusion in China: Index Compilation and Spatial Characteristics. China Econ. Q. 2020, 19, 1401–1418. [Google Scholar]
- Fu, Q.Z.; Huang, Y.P. Digital Finance’s Heterogeneous Effects on Rural Financial Demand: Evidence from China Household Finance Survey and Inclusive Digital Finance Index. J. Financ. Res. 2018, 11, 68–85. [Google Scholar]
- Kakaomerlioglu, D.C.; Carlsson, B. Manufacturing In Decline? A Matter Of Definition. Econ. Innov. New Technol. 1999, 8, 175–196. [Google Scholar] [CrossRef]
- Howells, J.; Green, A.E. Location, Technology and Industrial Organisation in U.K. Services. Prog. Plan. 1986, 26, 83–183. [Google Scholar] [CrossRef]
- FU, X. Foreign Direct Investment, Absorptive Capacity and Regional Innovation Capabilities: Evidence From China. Oxf. Dev. Stud. 2008, 36, 89–110. [Google Scholar] [CrossRef]
- Zhang, L.; Zhang, H.; Yang, H. Spatial Distribution Pattern of the Headquarters of Listed Firms in China. Sustainability 2018, 10, 2564. [Google Scholar] [CrossRef] [Green Version]
- Cheruiyot, K. Detecting Spatial Economic Clusters Using Kernel Density and Global and Local Moran’s I Analysis in Ekurhuleni Metropolitan Municipality, South Africa. Reg. Sci. Policy Pract. 2022, 14, 307–327. [Google Scholar] [CrossRef]
- Brunsdon, C.; Fotheringham, A.S.; Charlton, M.E. Geographically Weighted Regression: A Method for Exploring Spatial Nonstationarity. Geogr. Anal. 1996, 28, 281–298. [Google Scholar] [CrossRef]
- Hottenrott, H.; Richstein, R. Start-up Subsidies: Does the Policy Instrument Matter? Res. Policy 2020, 49, 103888. [Google Scholar] [CrossRef]
- Huang, J.Y.; Chou, T.C.; Lee, G.G. Imitative innovation strategies Understanding resource management of competent followers. Manag. Decis. 2010, 48, 952–975. [Google Scholar] [CrossRef]
- Song, F.F.; Zhao, C.H. Why do Chinese enterprises make imitative innovation?—An empirical explanation based on government subsidies. Front. Psychol. 2022, 13, 802703. [Google Scholar] [CrossRef]
- Xiao, F.; Zhou, Y.; Deng, W.; Gu, H. Did High-Speed Rail Affect the Entry of Automobile Industry Start-Ups? Empirical Evidence From Guangdong Province, China. Travel Behav. Soc. 2020, 19, 45–53. [Google Scholar] [CrossRef]
- Sternberg, R.; Arndt, O. The Firm or the Region: What Determines the Innovation Behavior of European Firms? Econ. Geogr. 2001, 77, 364–382. [Google Scholar] [CrossRef]
- Dong, Y.; Li, X. Internet Finance: A Literature Survey. J. Financ. Rev. 2014, 6, 16–40+123. [Google Scholar]
- Capgemini Group; EFMA. World FinTech Report 2019; Capgemin: Paris, France, 2019; Available online: https://ncfacanada.org/global-fintech-report-2019 (accessed on 19 November 2022).
- Liao, G.K.; Li, Z.H.; Wang, M.; Albitar, K. Measuring China’s urban digital finance. Quant. Financ. Econ. 2022, 6, 385–404. [Google Scholar] [CrossRef]
- Hoang, D.T.; Do, A.D.; Trinh, M.V. Spillover Effects of FDI on Technology Innovation of Vietnamese Enterprises. J. Asian Financ. Econ. Bus. 2022, 8, 655–663. [Google Scholar]
- Sun, W.; Wang, J.Y.; Cheng, L.W. Technological resources and innovation efficiency of high-tech industry—Empirical research of Chinese data based on canonical correlation analysis. Stud. Sci. Sci. 2010, 28, 1088–1093. [Google Scholar]
- Hu, X.L.; Ma, Y. International Intra-Industry Trade of China. Weltwirtschaftliches Arch.-Rev. World Econ. 1999, 135, 82–101. [Google Scholar] [CrossRef]
- Liu, Y.; Shen, J.; Xu, W.; Wang, G. From school to university to work: Migration of highly educated youths in China. Ann. Reg. Sci. 2017, 59, 651–676. [Google Scholar] [CrossRef]


| Variable Types | Level-One Variable | Level-Two Variable | Measurement Index | Unit |
|---|---|---|---|---|
| Independent Variable | Global | Foreign Direct Investment | Foreign Direct Investment (FDI) | 10,000 USD |
| International Trade | Import and Export Trade Volume (trade) | 10,000 CNY | ||
| Local | Industrial Synergy | Industrial coagglomeration index (coagg) | - | |
| Local Learning | Number of College Students (lab) | Person | ||
| R&D Intensity (R&D): R&D expenditure/GDP | - | |||
| Number of Patent Application (pat) | Piece | |||
| Institutional Thickness | Local Public Budget Expenditure (gov) | 10,000 CNY | ||
| Innovative Financial Services | Digital Inclusive Financial Index (digfin) | - | ||
| Control Variable | Economic Development | Per Capita GDP (GDP) | CNY | |
| Traditional Financial Services | Deposit Balances of Financial Institution s (fin) | 10,000 CNY | ||
| Informatization | Number of Mobile Phones Per 100 People (tel) | Piece per 100 Persons | ||
| Number of Broadband Interfaces Per 100 People (int) | Set per 100 Persons | |||
| Market | Total Wages of on-the-job Workers (wage) | 10,000 CNY | ||
| Population Density (peo) | Person per km2 | |||
| Transportation | Railway Density (rail) | km/km2 | ||
| Highway Density (free) | km/km2 | |||
| Dep. Var. | The Measurement of International Trade | ||
|---|---|---|---|
| Models | (1) | (2) | (3) |
| FDI | 0.182 *** (3.462) | 0.170 *** (3.25) | 0.169 *** (3.229) |
| Import and Export Trade Volume | 0.122 * (1.663) | ||
| Foreign Trade Dependence | 0.091 *** (2.735) | ||
| Import Dependence | 0.037 (1.109) | ||
| Export Dependence | 0.063 * (1.736) | ||
| Industrial coagglomeration index | 0.069 ** (2.297) | 0.064 ** (2.137) | 0.064 ** (2.113) |
| Number of College Students | 0.017 (0.438) | 0.004 (0.106) | 0.004 (0.114) |
| R&D Intensity | 0.026 (1.034) | 0.025 (1.004) | 0.025 (1.01) |
| Number of Patent Application | 0.060 (0.886) | 0.086 (1.363) | 0.081 (1.236) |
| Local Public Budget Expenditure | 0.568 *** (6.401) | 0.618 *** (7.926) | 0.617 *** (7.894) |
| Digital Inclusive Financial Index | 0.045 (1.298) | 0.027 (0.782) | 0.026 (0.753) |
| R2 | 0.867 | 0.870 | 0.870 |
| Adjusted R2 | 0.860 | 0.862 | 0.861 |
| F Staristic | 111.919 *** | 114.118 *** | 107.051 *** |
| Moran’s I test of the standardized residuals (GWR) | 0.0198 (1.18) | 0.0427 *** (2.36) | 0.0406 ** (2.263) |
| Whether to accept GWR model | Yes | No | No |
| VARNAME | OLS Model | GWR Model |
|---|---|---|
| Residual Squares | 38.485 | 26.396 |
| Sigma | 0.3750 | 0.3385 |
| AICc | 272.095 | 245.996 |
| R2 | 0.867 | 0.909 |
| R2 Adjusted | 0.860 | 0.886 |
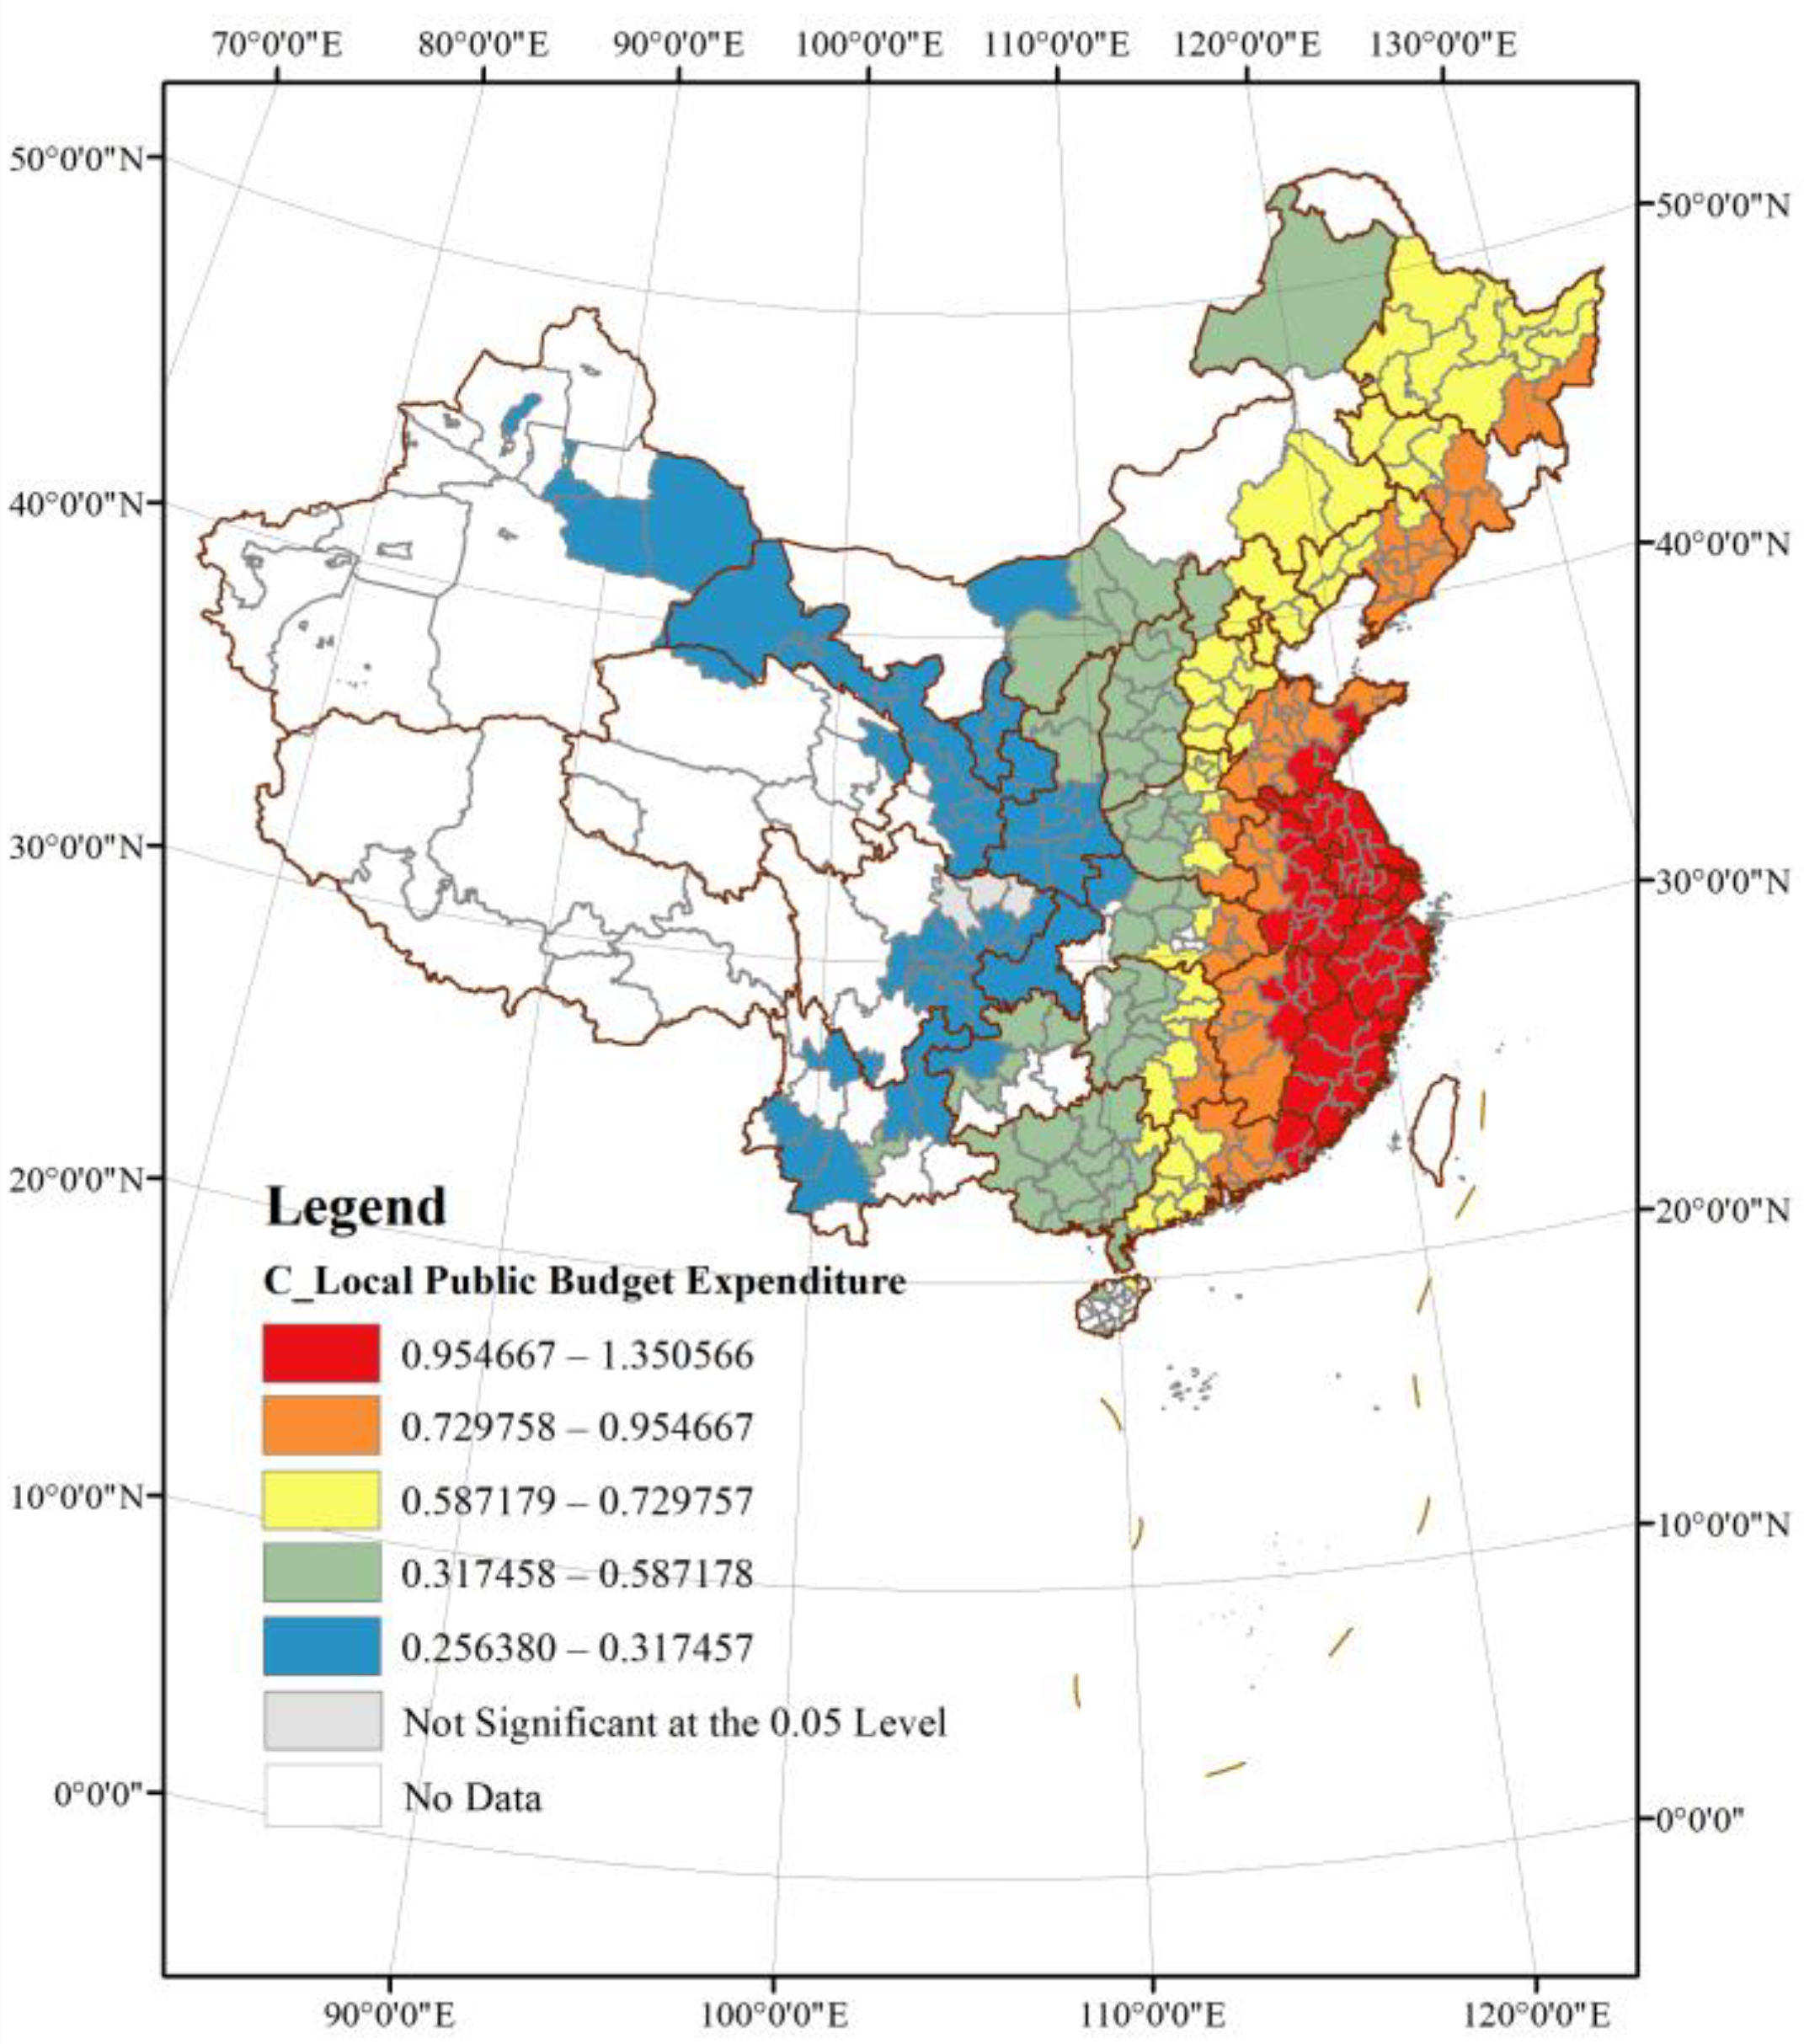
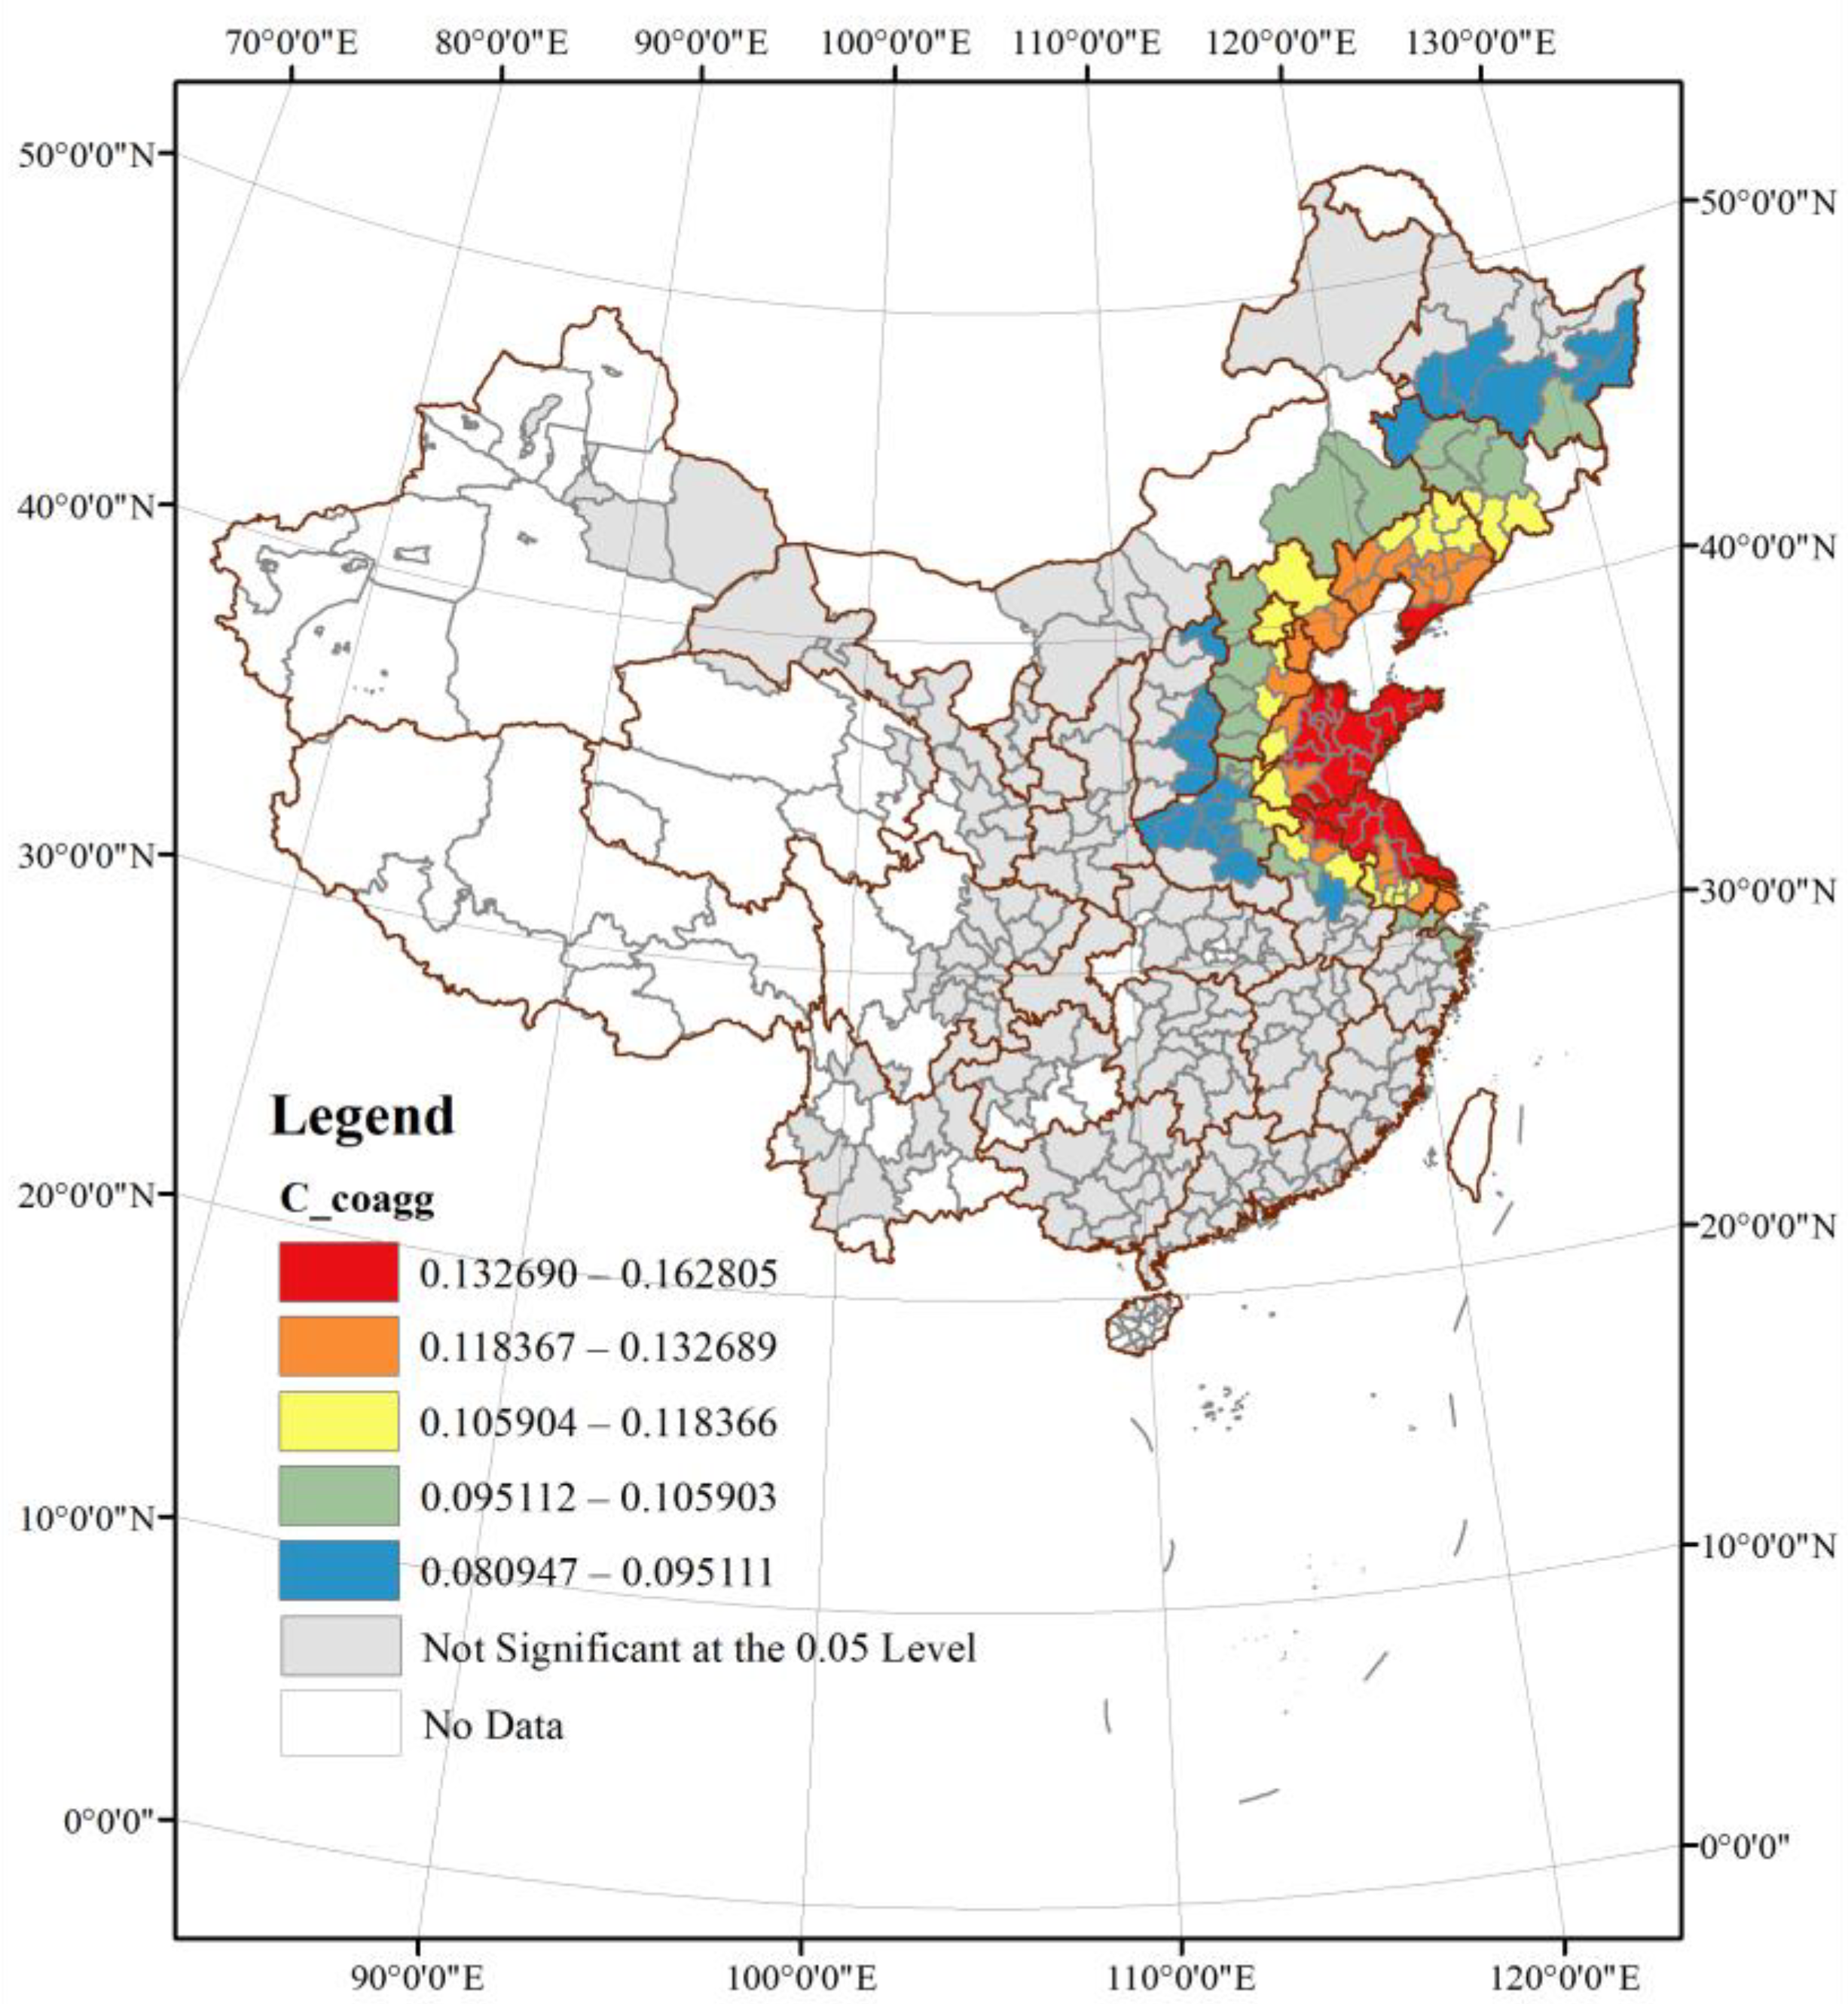
| Model Parameter | Minimum | Upper Quartile | Median | Lower Quartile | Maximum | Mean Value | Number of Cities that Pass Significance Test |
|---|---|---|---|---|---|---|---|
| Local R2 | 0.813 | 0.853 | 0.895 | 0.919 | 0.956 | 0.886 | - |
| C1_FDI | 0.122 | 0.162 | 0.185 | 0.220 | 0.272 | 0.189 | 197 |
| C2_trade | −0.229 | 0.083 | 0.294 | 0.403 | 0.902 | 0.244 | 88 |
| C3_coagg | 0.081 | 0.099 | 0.114 | 0.127 | 0.163 | 0.115 | 107 |
| C4_lab | - | - | - | - | - | - | 0 |
| C5_R&D | 0.069 | 0.090 | 0.109 | 0.123 | 0.149 | 0.106 | 34 |
| C6_pat | - | - | - | - | - | - | 0 |
| C7_gov | 0.256 | 0.382 | 0.669 | 0.886 | 1.351 | 0.670 | 287 |
| C8_digfin | 0.087 | 0.102 | 0.123 | 0.147 | 0.164 | 0.125 | 9 |
Disclaimer/Publisher’s Note: The statements, opinions and data contained in all publications are solely those of the individual author(s) and contributor(s) and not of MDPI and/or the editor(s). MDPI and/or the editor(s) disclaim responsibility for any injury to people or property resulting from any ideas, methods, instructions or products referred to in the content. |
© 2023 by the authors. Licensee MDPI, Basel, Switzerland. This article is an open access article distributed under the terms and conditions of the Creative Commons Attribution (CC BY) license (https://creativecommons.org/licenses/by/4.0/).
Share and Cite
Zhu, H.; Liu, R.; Chen, B. The Rise of Specialized and Innovative Little Giant Enterprises under China’s ‘Dual Circulation’ Development Pattern: An Analysis of Spatial Patterns and Determinants. Land 2023, 12, 259. https://doi.org/10.3390/land12010259
Zhu H, Liu R, Chen B. The Rise of Specialized and Innovative Little Giant Enterprises under China’s ‘Dual Circulation’ Development Pattern: An Analysis of Spatial Patterns and Determinants. Land. 2023; 12(1):259. https://doi.org/10.3390/land12010259
Chicago/Turabian StyleZhu, Huasheng, Ruobin Liu, and Bo Chen. 2023. "The Rise of Specialized and Innovative Little Giant Enterprises under China’s ‘Dual Circulation’ Development Pattern: An Analysis of Spatial Patterns and Determinants" Land 12, no. 1: 259. https://doi.org/10.3390/land12010259