
Impact of Intellectualization of a Zoo through a FCEM-AHP and IPA Approach

Abstract
:1. Introduction
1.1. Background
1.2. Literature Review
2. Materials and Methods
2.1. Study Area
- The zoo is located in the Ueno area in the center of the city of Tokyo, which has a greater flow of guests than the other three member locations.
- Longer construction time, historical and cultural influence, higher visibility, and better awareness among tourists and citizens.
- The Ueno area has more foreign visitors, which meets the future needs of the zoo for visitors and is more in line with the identity of the smart zoo.
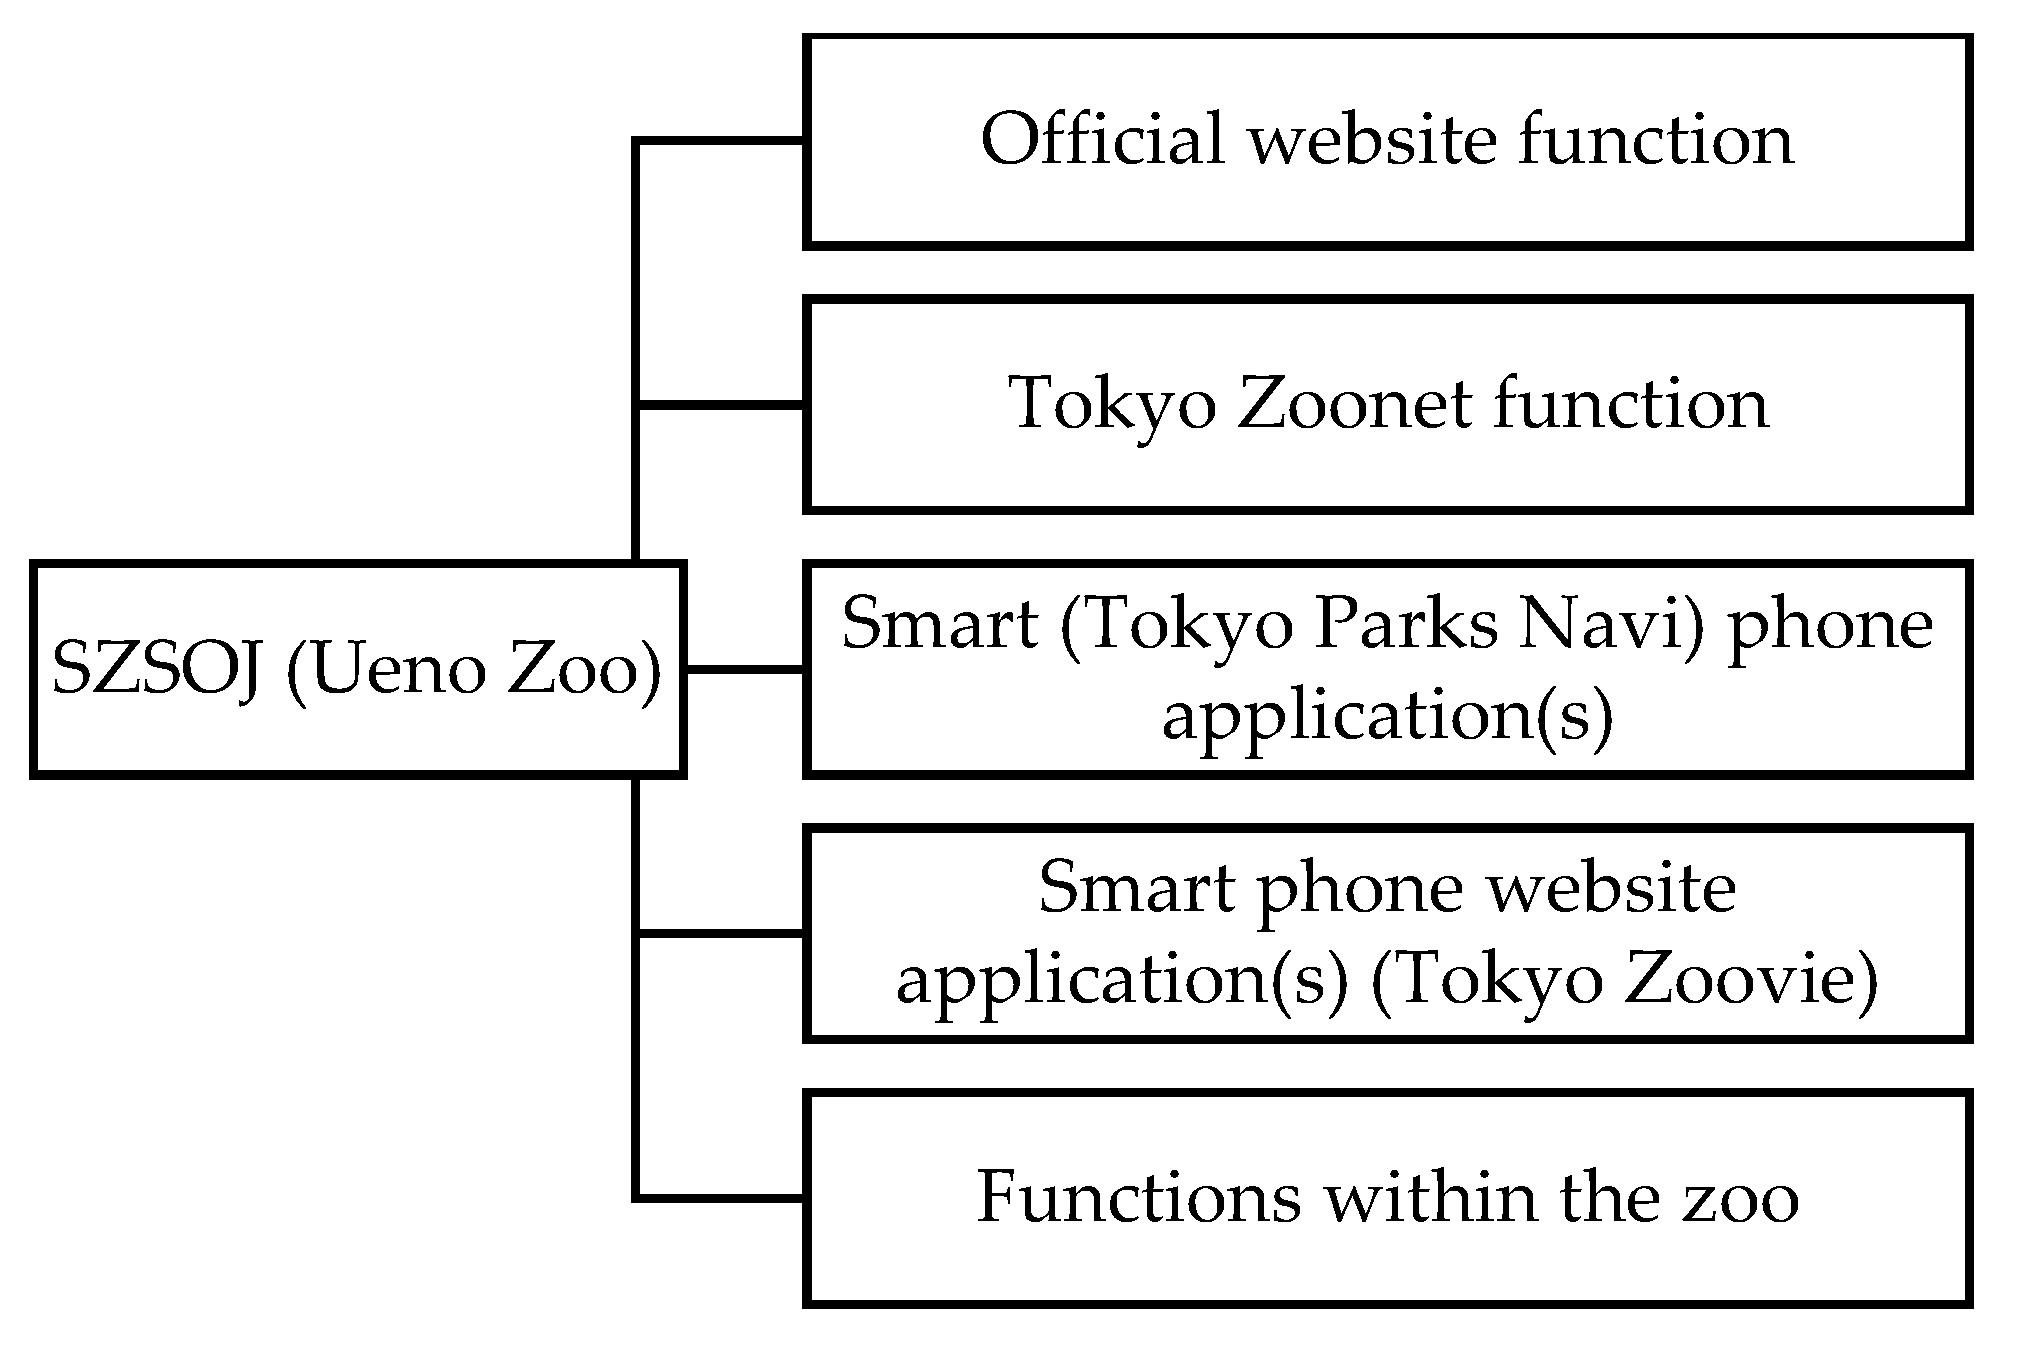
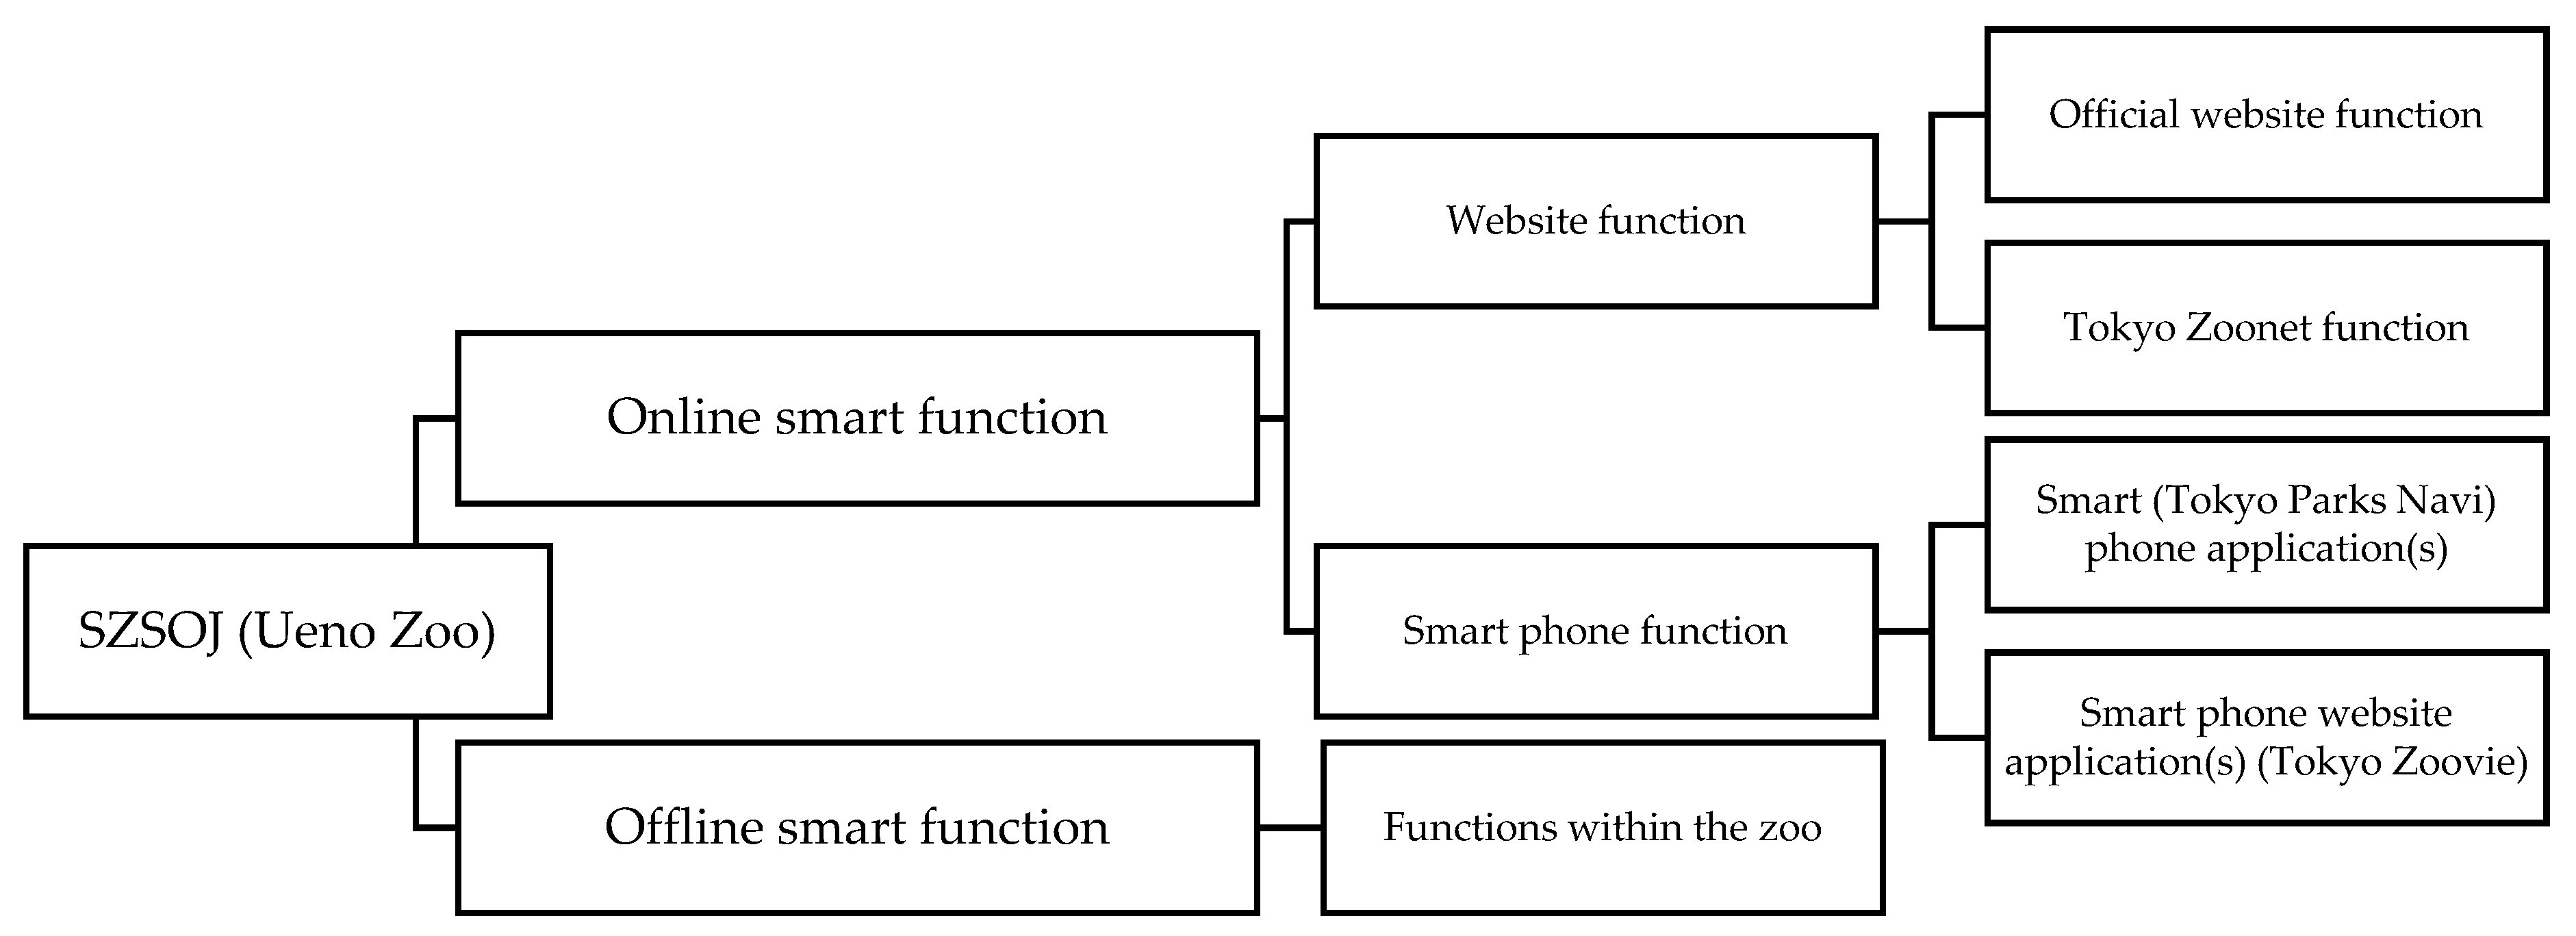
2.2. Identifying Evaluation Items of Smart Zoo System of Japan (SZSOJ)
2.3. Data Collection
2.4. AHP
- U = {U1, U2, U3, U4, U5}
- U1 = {U11, U12, U13, U14, U15, U16, U17, U18}
- U2 = {U21, U22, U23}
- U3 = {U31, U32, U33, U34, U35, U36}
- U4 = {U41, U42}
- U5 = {U51, U52, U53, U54, U55}
2.5. FCEM
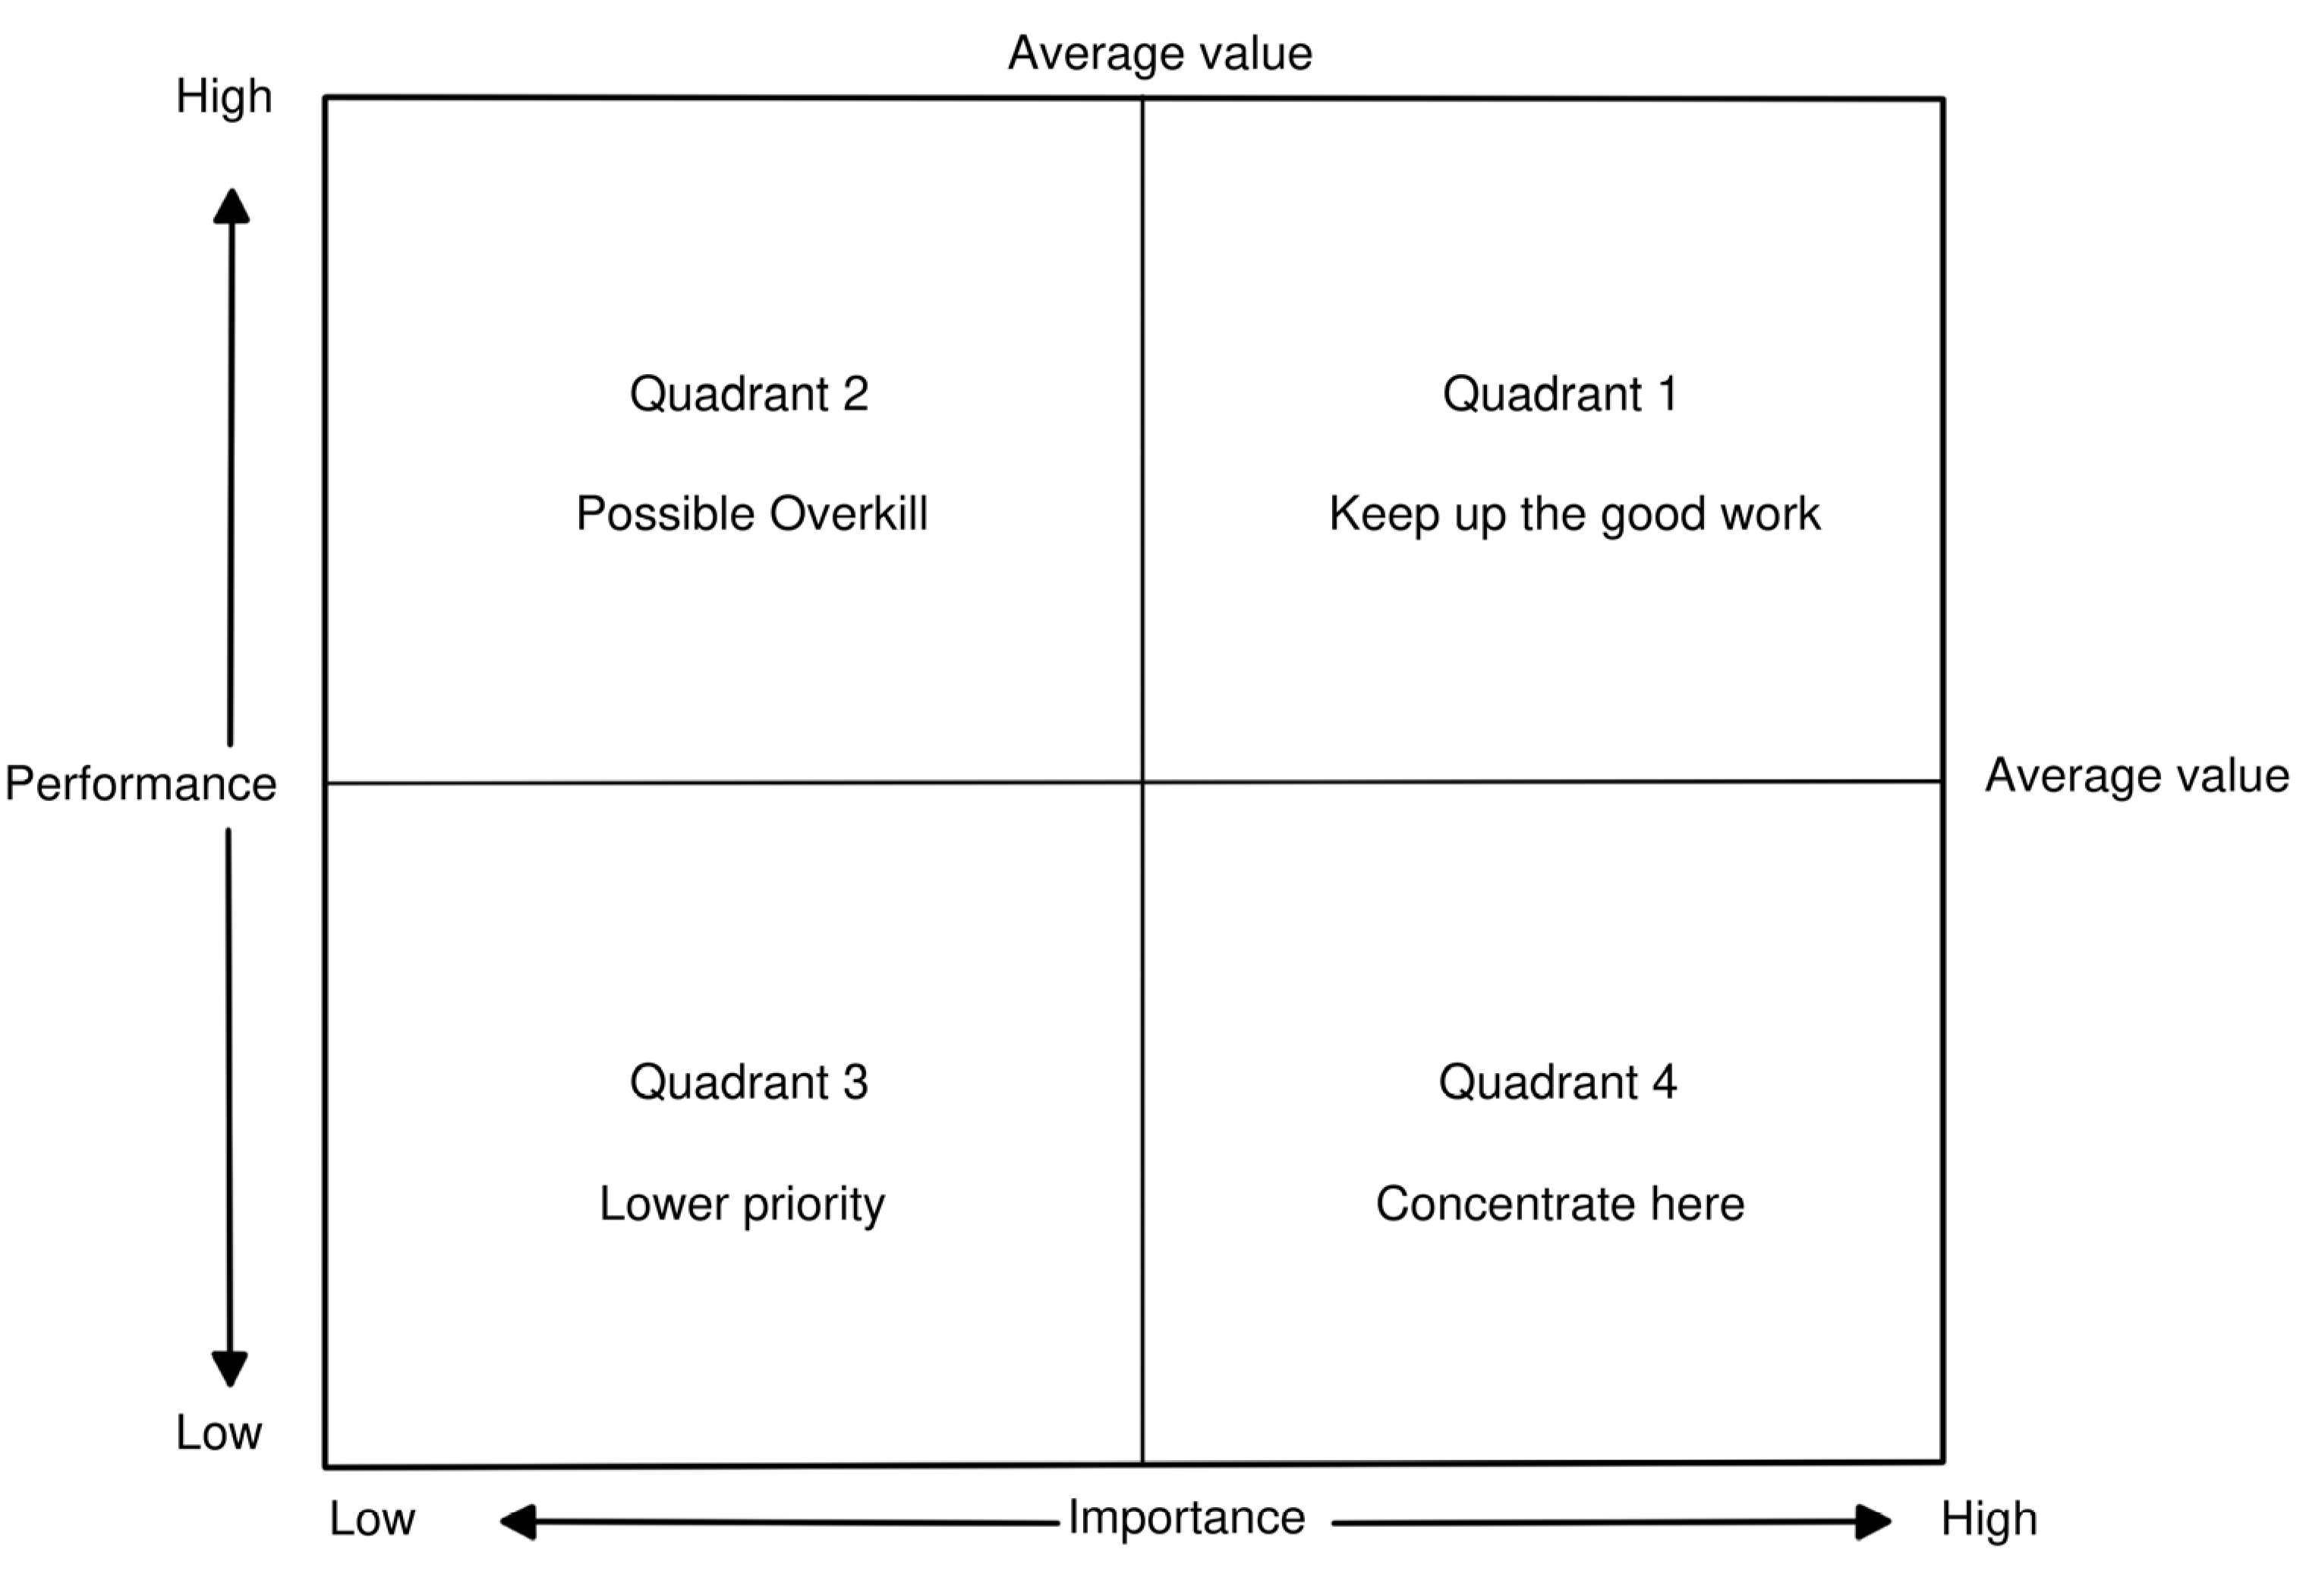
2.6. IPA
3. Results
3.1. Results of AHP
3.2. Results of FCEM
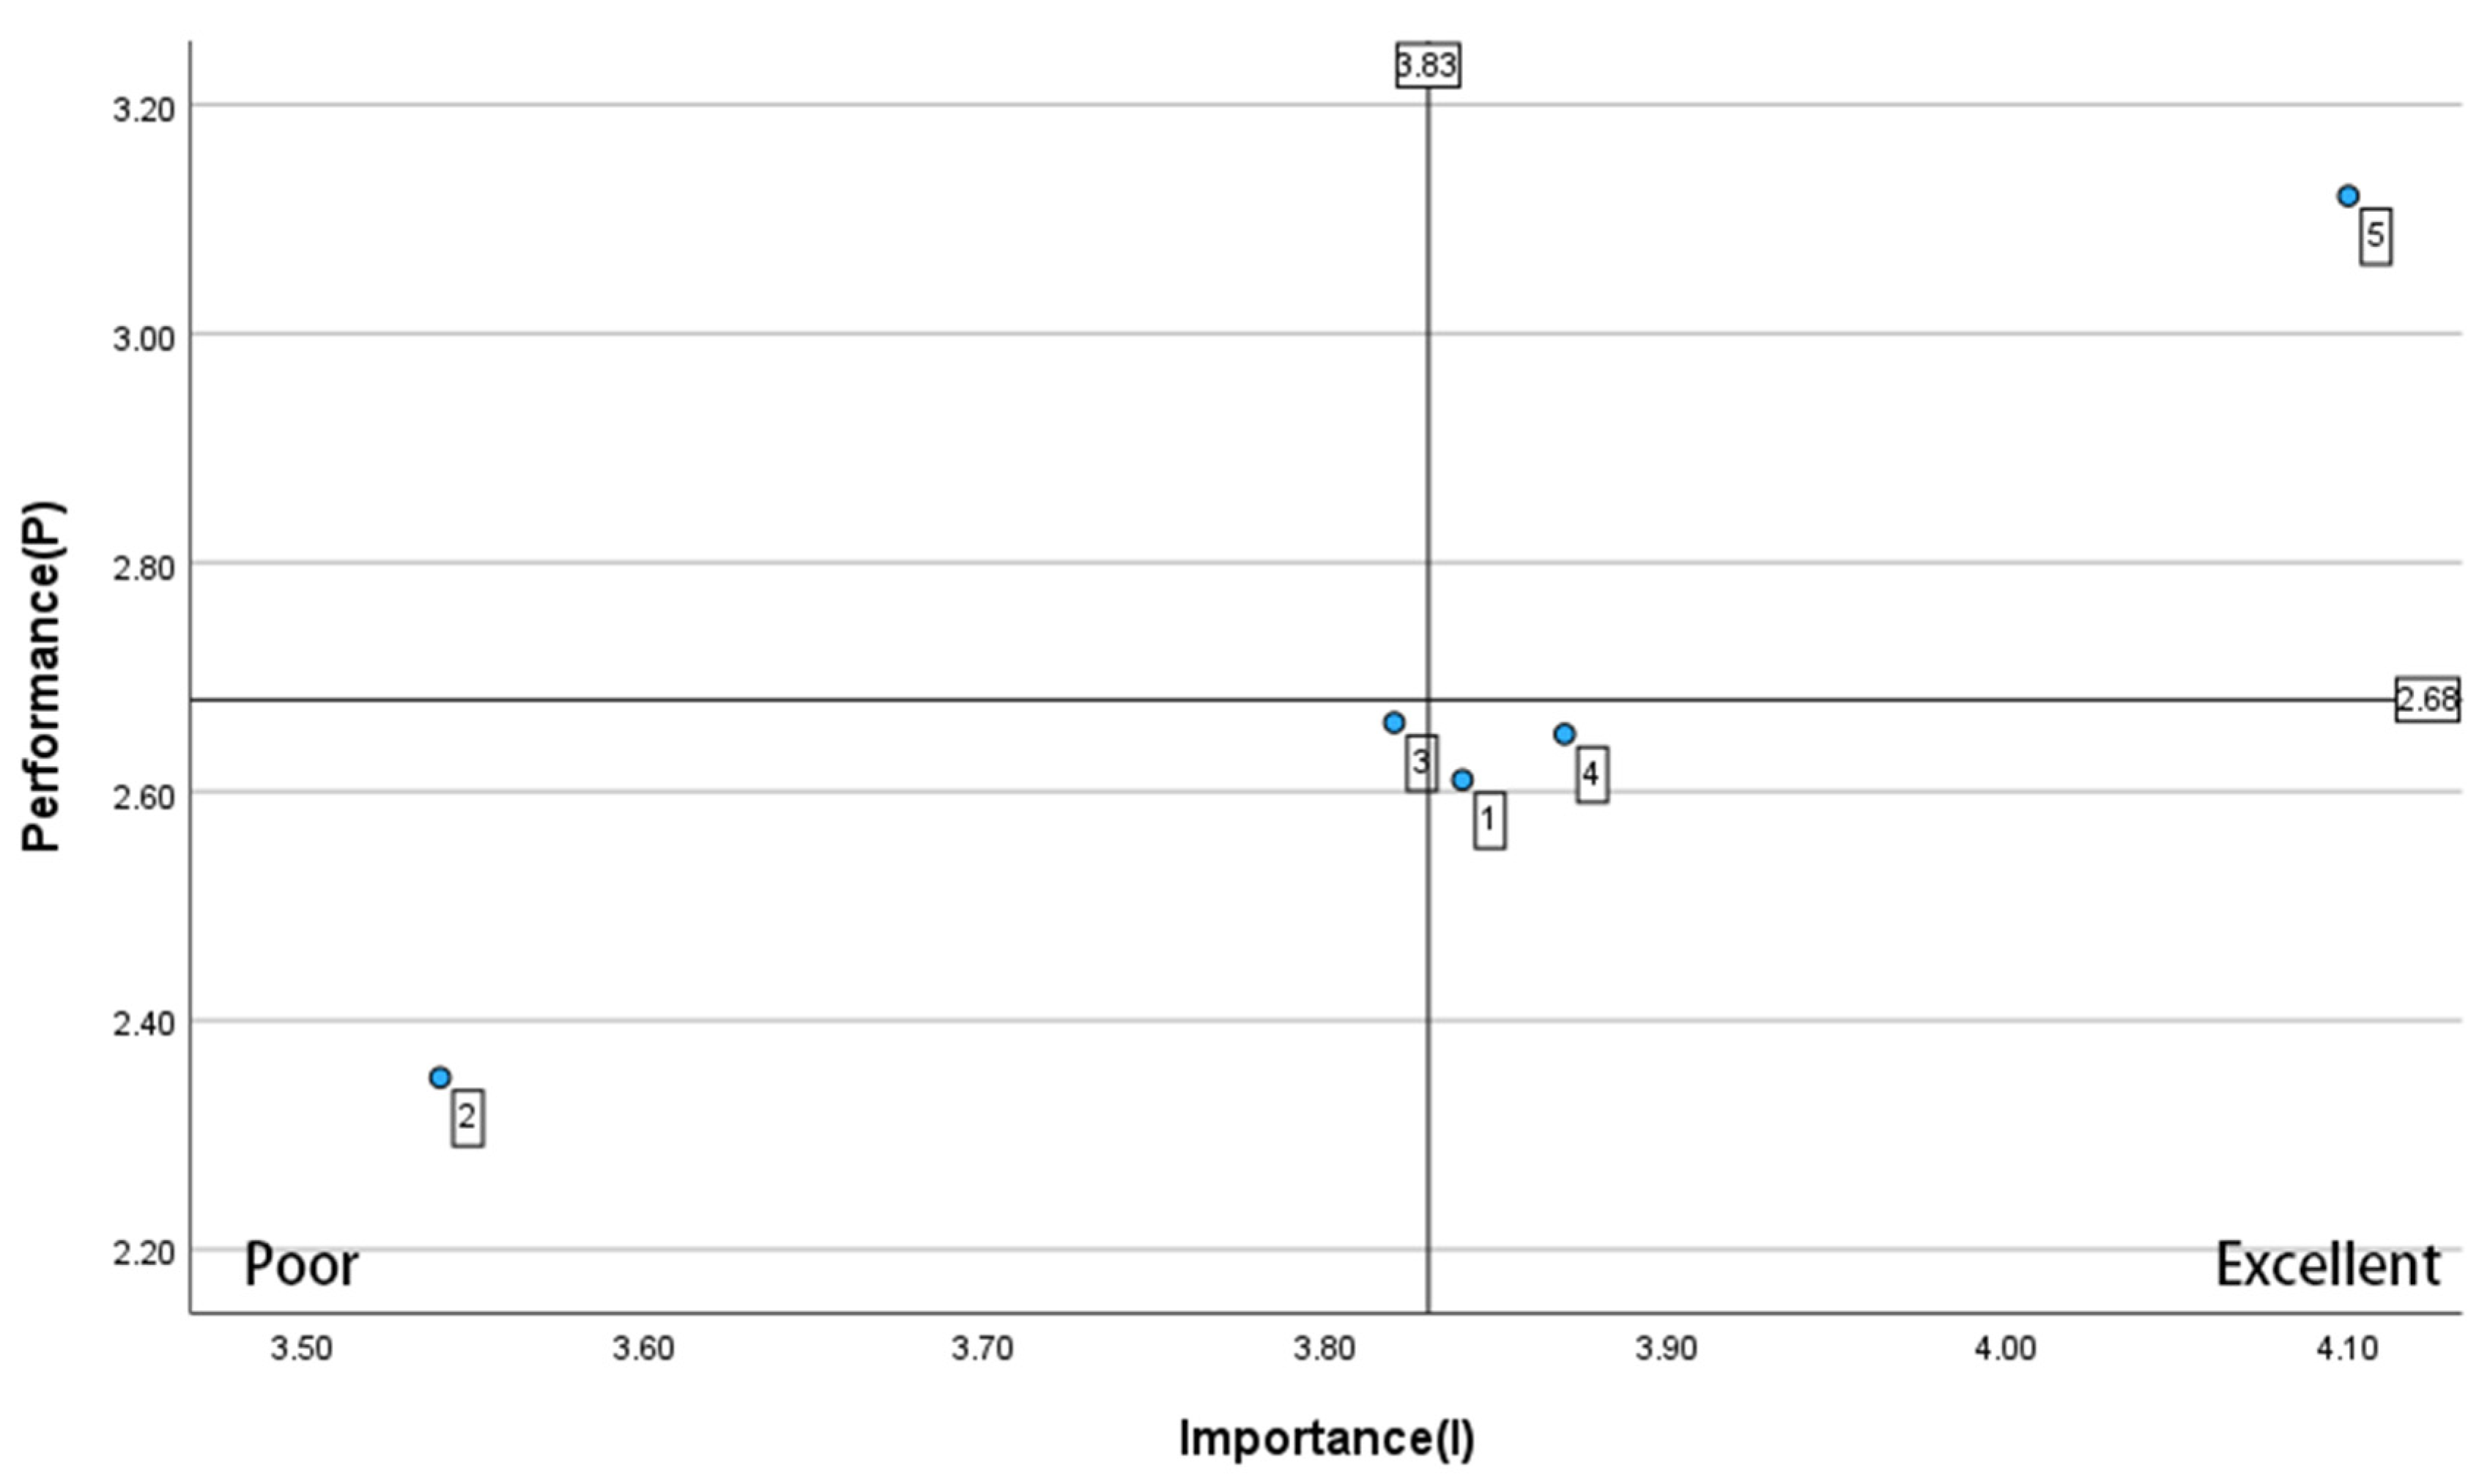
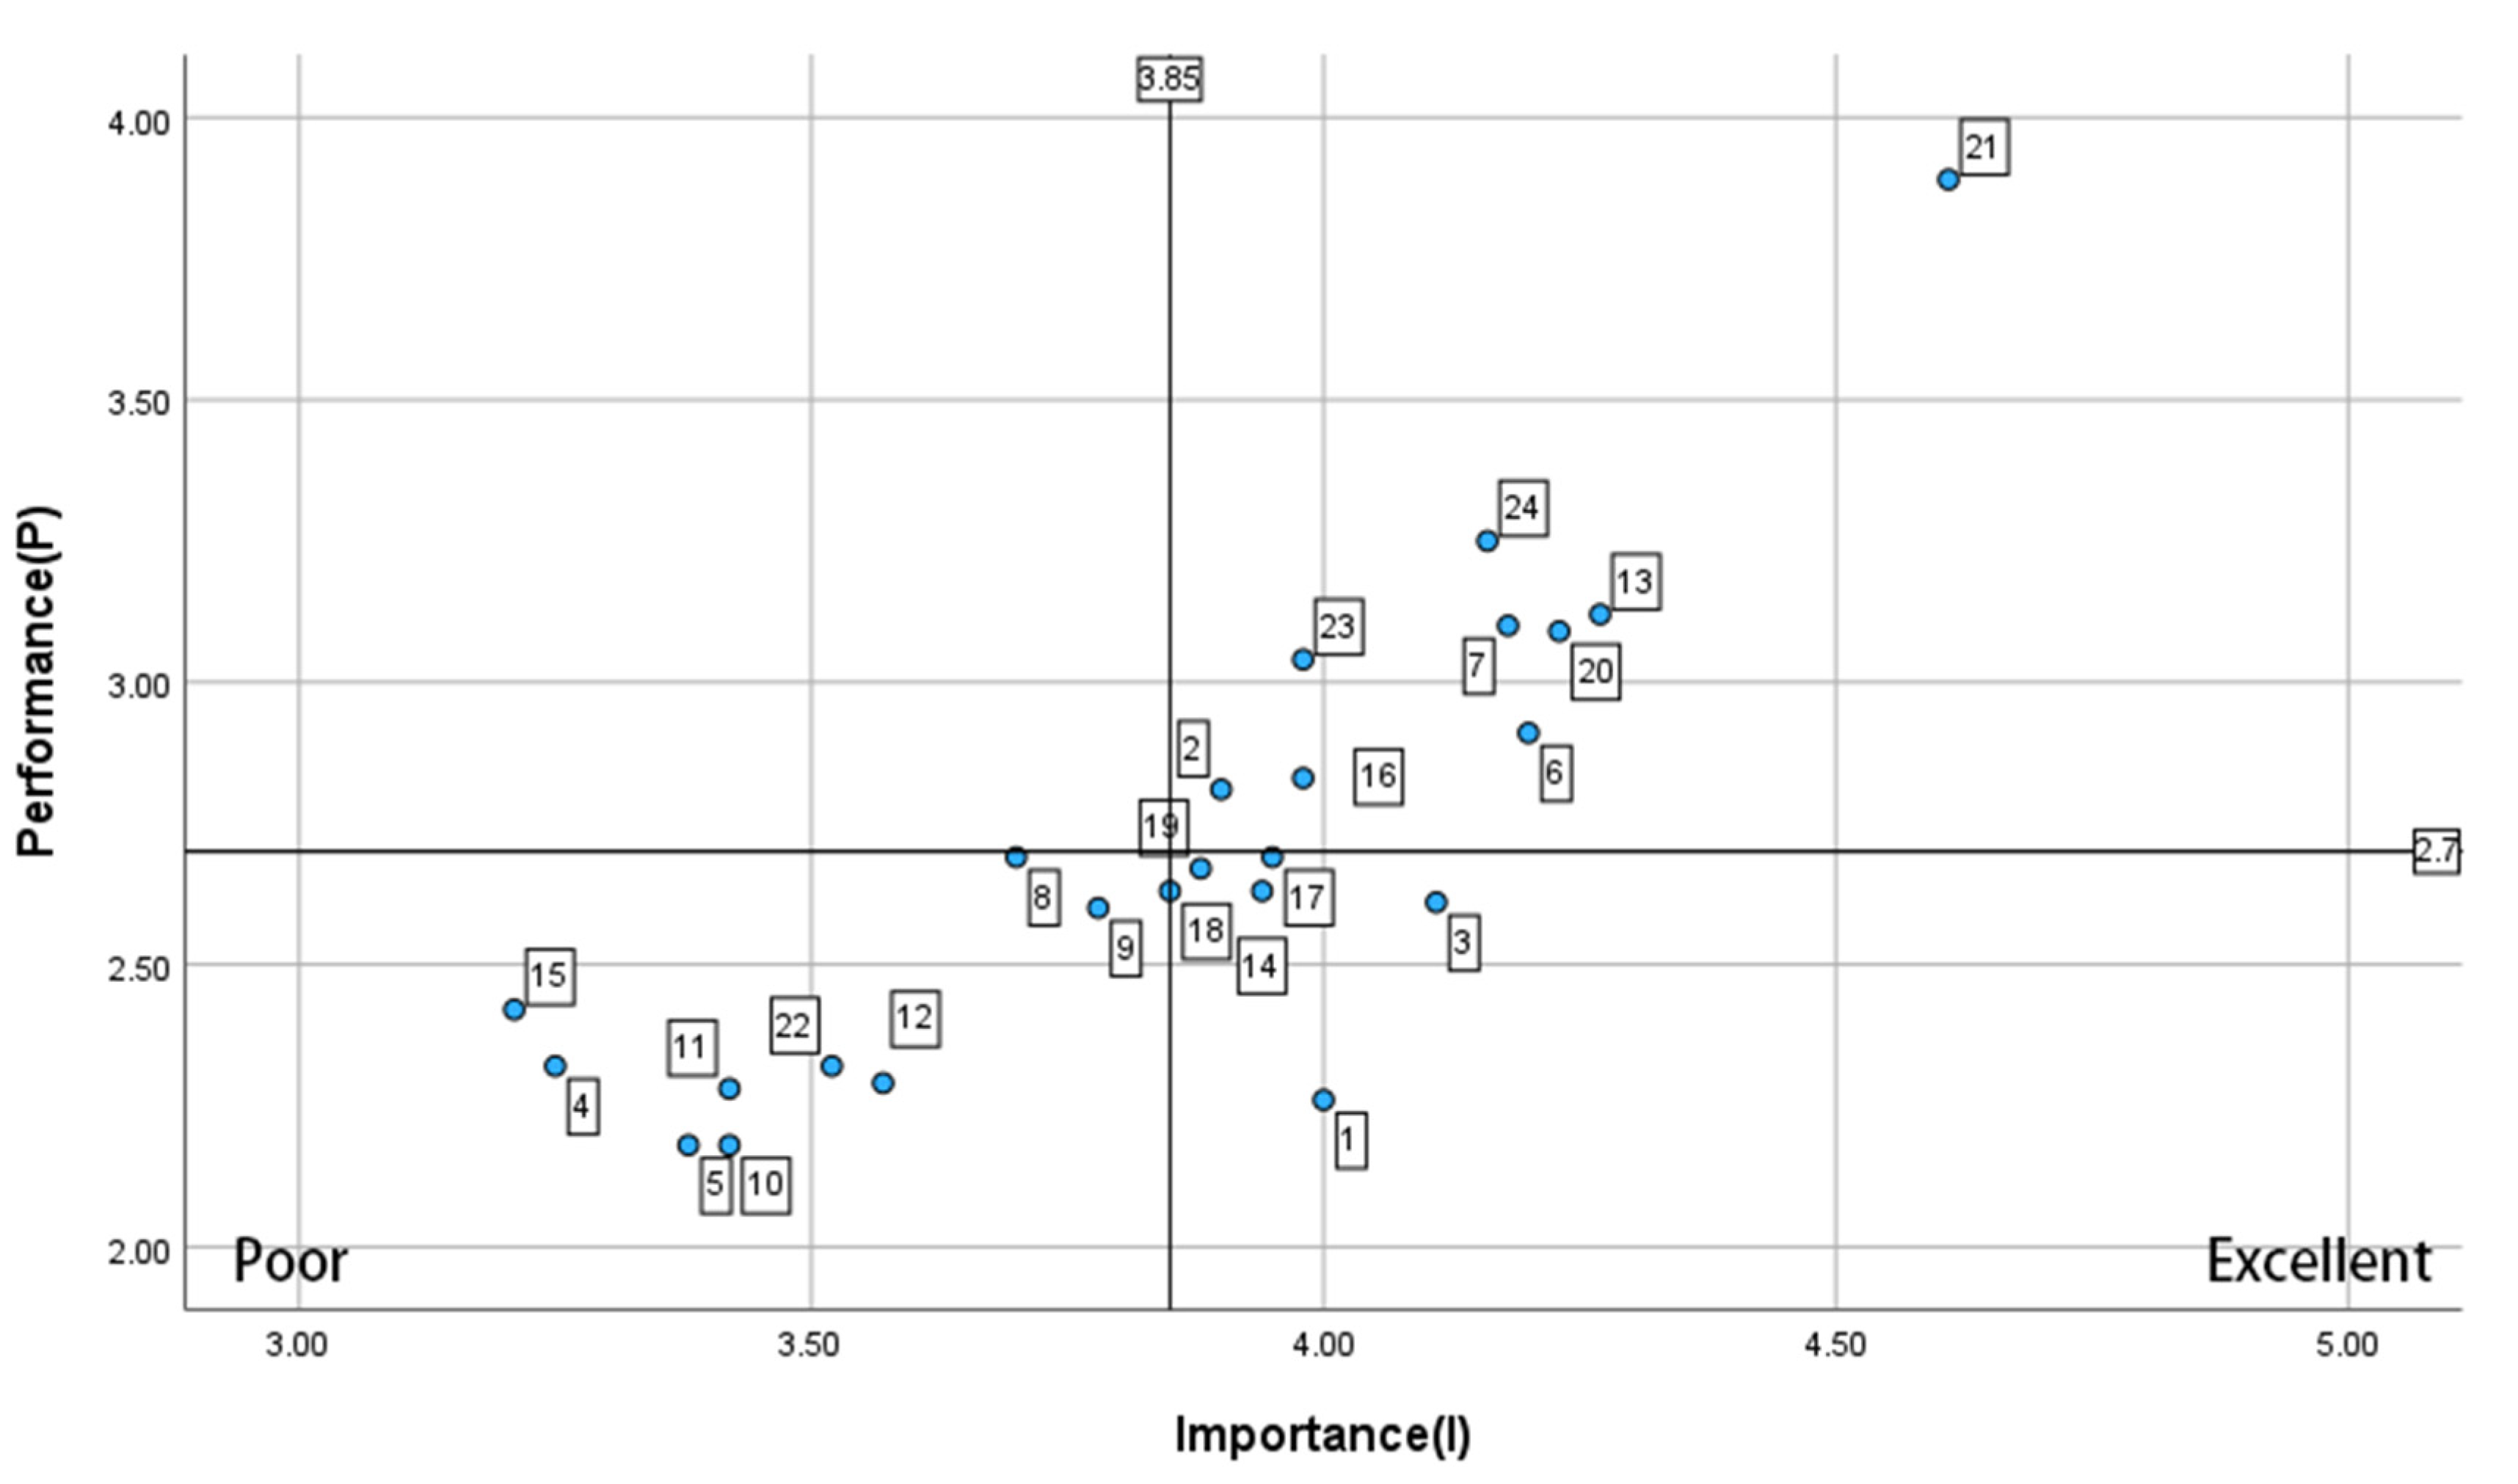
3.3. Results of IPA
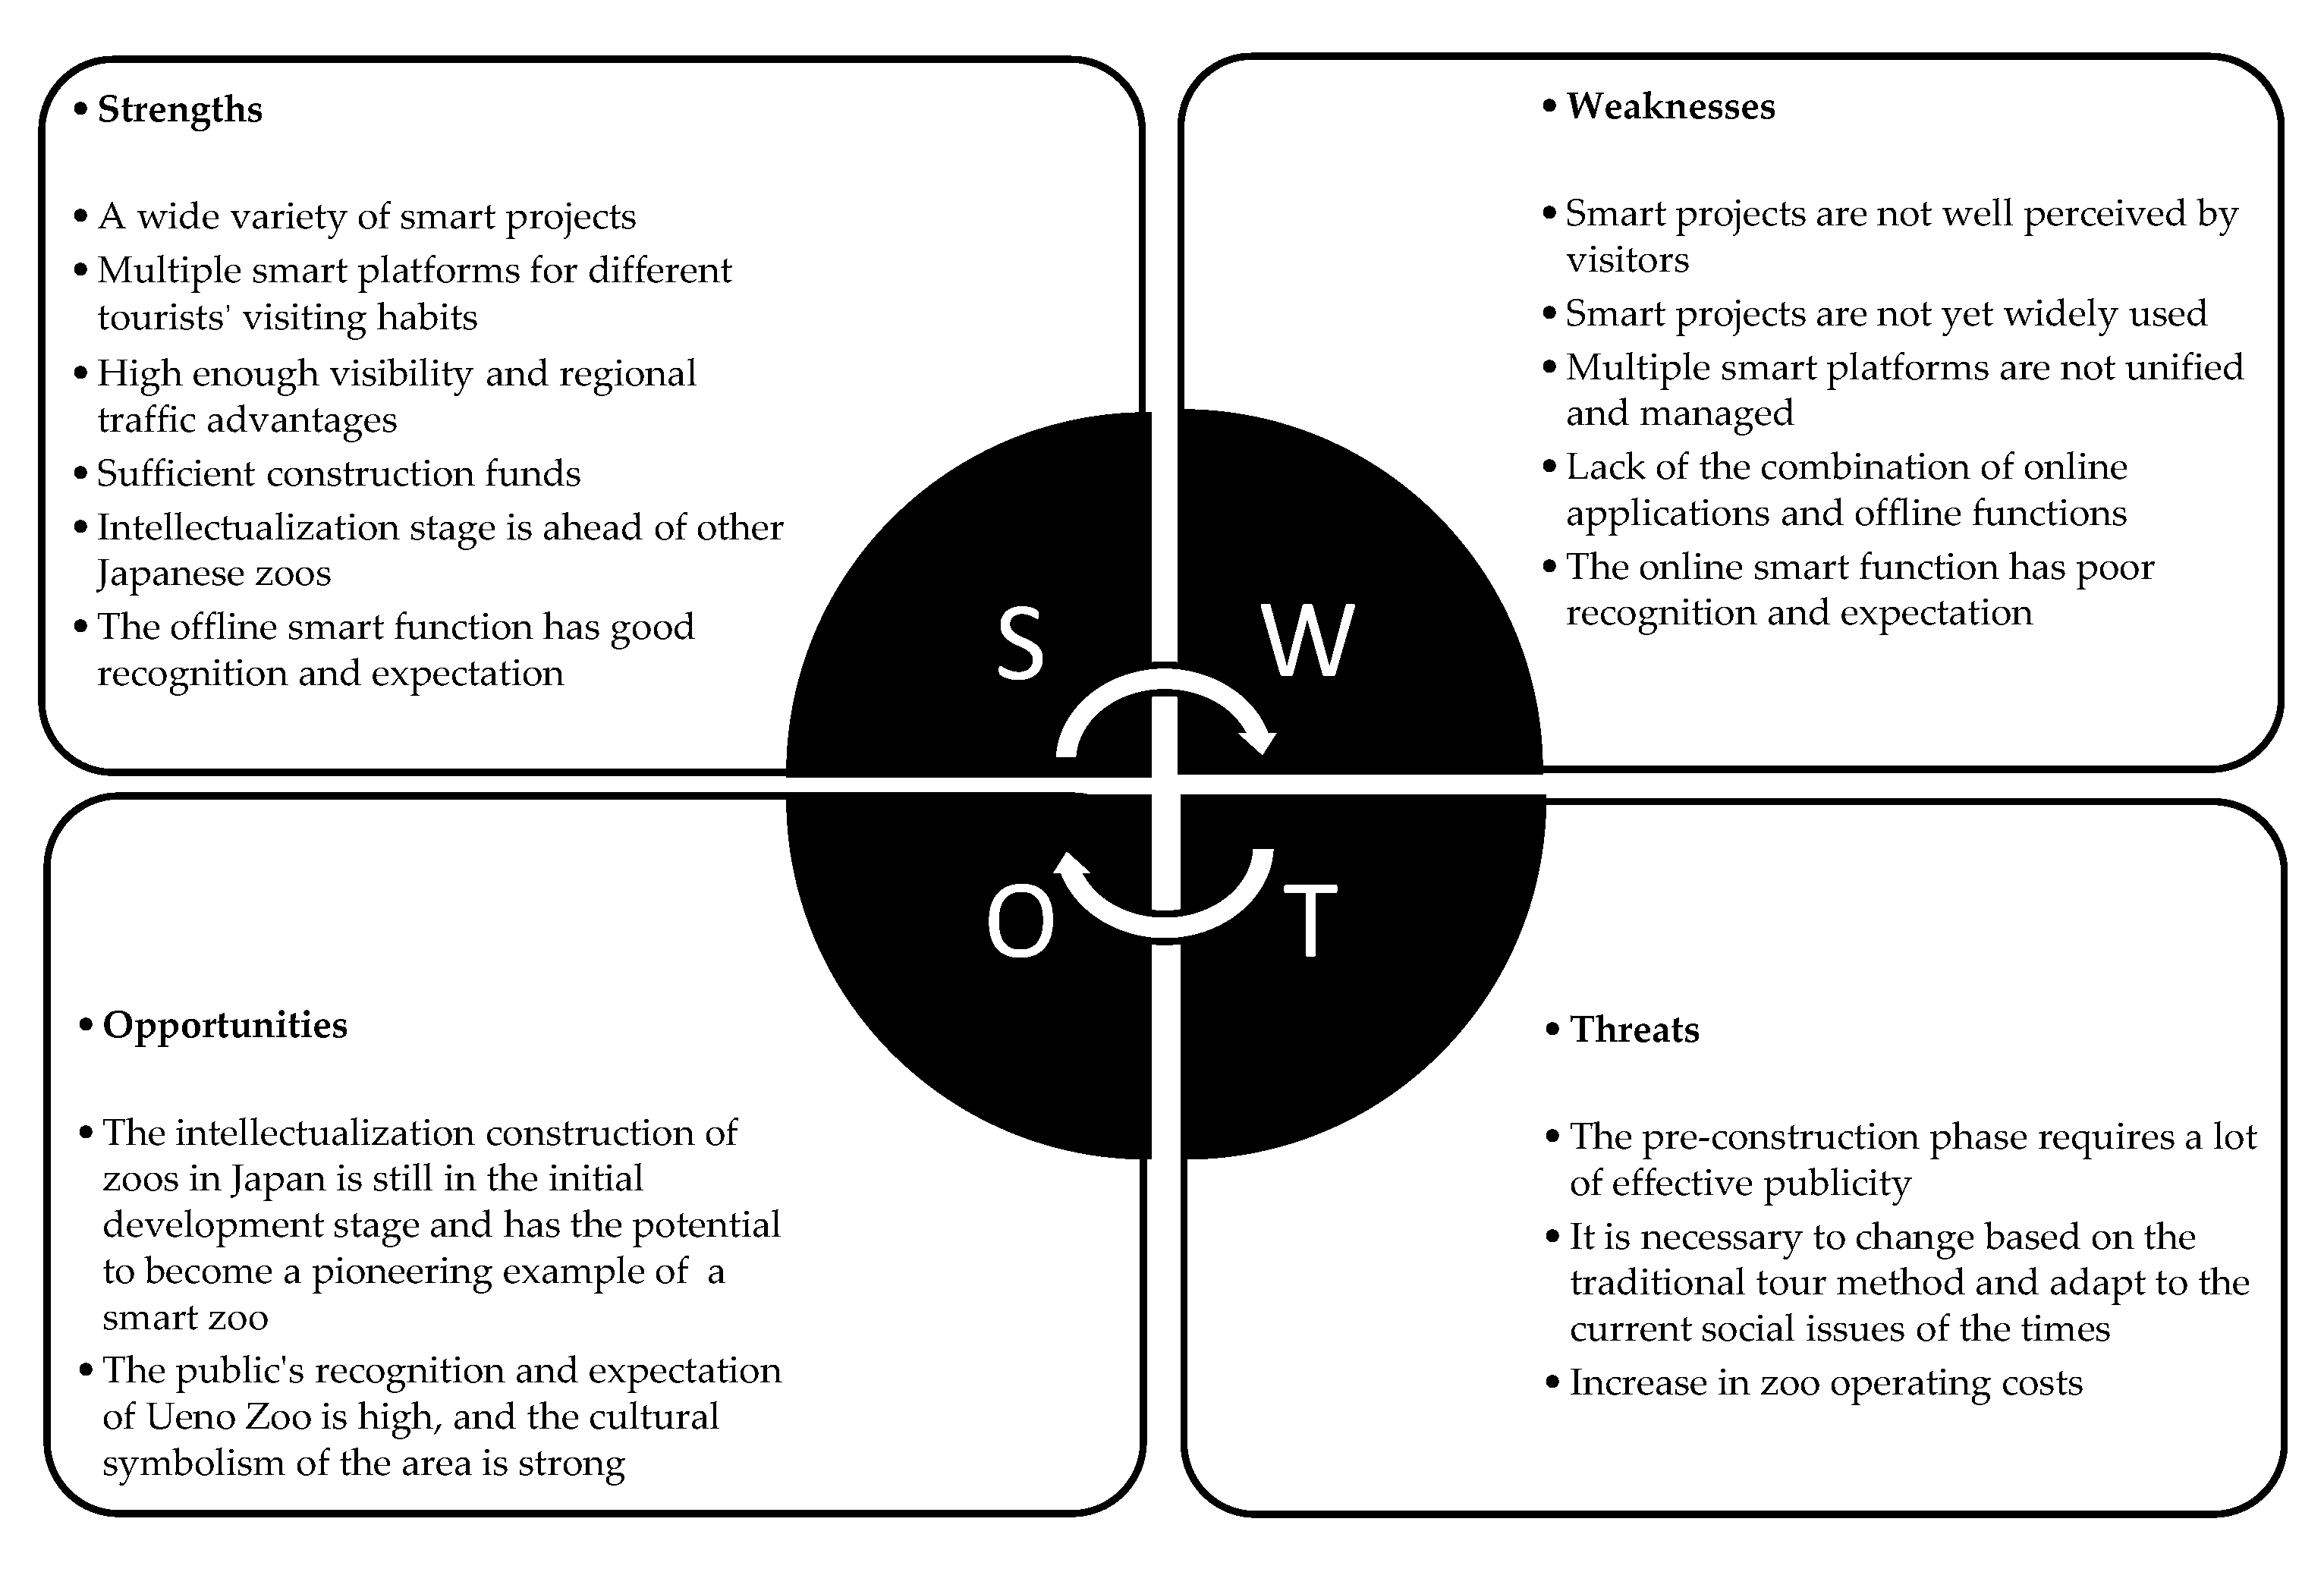
4. Discussion
4.1. Findings from Questionnaire
- The smart functions of Ueno Zoo are not well publicized [31], and it is difficult for ordinary visitors to access them apart from some essential functions such as online booking and the electronic ticket system. In the process of collecting questionnaires, a common theme of the feedback received was “The existence of these functions is unknown without the questionnaire graphics”, so the feedback on the zoo’s performance based on the questionnaire was not good.
- The zoo itself is a special type of park that places more emphasis on offline interaction, so the best feedback would come from features where one can interact with the venue [32]. At the same time, some zoos and schools that promote educational knowledge, such as animal information services, will also receive attention from zoos and citizens, and therefore, will also receive good feedback. However, some functions related to overall zoo management and construction, such as 3D models, are not important to visitors, and thus, do not receive good feedback.
- Concerns exist within Japan, especially Tokyo—due to the COVID-19 pandemic [33], declining birthrate, and aging population—that the smart-city process may eliminate or reduce drawbacks associated with traditional methods of production [34]. The overall feedback on the importance aspect of the questionnaire was good; this may be because the impact of intellectualization on ordinary citizens can make people realize the importance of intellectualization.
4.2. Findings from Analytical Calculdations
5. Conclusions
Supplementary Materials
Author Contributions
Funding
Data Availability Statement
Conflicts of Interest
References
- Palmisano, S.J. A smarter planet: The next leadership agenda. IBM Novemb. 2008, 6, 1–8. [Google Scholar]
- Caragliu, A.; Del Bo, C.; Nijkamp, P. Smart Cities in Europe. J. Urban Technol. 2011, 18, 65–82. [Google Scholar] [CrossRef]
- Yang, Z.; Fang, X.; Changlin, L. Research on the Construction Framework of Smart Park: A Case Study of Intelligent Renovation of Beijing Haidian Park. Landsc. Archit. 2020, 5, 78–87. [Google Scholar] [CrossRef]
- Guixian, S. Shenzhen Honey Park Starts the Era of Smart Park 2.0. Chin. Landsc. Archit. 2018, 2, 22–24. [Google Scholar]
- Showa Creation Co., Ltd. Connecting to the Community Making Parks Smart. Available online: https://smart-kyoto.or.jp/ksc/wp-content/uploads/2019/04/05-2-syowa.pdf (accessed on 12 January 2023).
- OFFICE, A.H.N.G.P. Nara Palace Site Historical Park “SMART CHALLENGE”. Available online: https://www.kkr.mlit.go.jp/asuka/initiatives-heijo/smart-challenge.html (accessed on 12 January 2023).
- Anastasia Loukaitou-Sideris, K.J.; Ferdman, R.; Gmoser-Daskalakis, K.; Hum, C. SMART Parks™: A Toolkit. 2018. Available online: https://innovation.luskin.ucla.edu/sites/default/files/ParksWeb020218.pdf (accessed on 12 January 2023).
- Wang, X.; Li, X.R.; Zhen, F.; Zhang, J. How smart is your tourist attraction? Measuring tourist preferences of smart tourism attractions via a FCEM-AHP and IPA approach. Tour. Manag. 2016, 54, 309–320. [Google Scholar] [CrossRef]
- Heung, V.C. Internet usage by international travellers: Reasons and barriers. Int. J. Contemp. Hosp. Manag. 2003, 15, 370–378. [Google Scholar] [CrossRef]
- Kaplanidou, K.; Vogt, C. A structural analysis of destination travel intentions as a function of web site features. J. Travel Res. 2006, 45, 204–216. [Google Scholar] [CrossRef]
- Law, R.; Leung, R. A study of airlines’ online reservation services on the Internet. J. Travel Res. 2000, 39, 202–211. [Google Scholar] [CrossRef]
- Buhalis, D.; Law, R. Progress in information technology and tourism management: 20 years on and 10 years after the Internet—The state of eTourism research. Tour. Manag. 2008, 29, 609–623. [Google Scholar] [CrossRef] [Green Version]
- Chunlei, W.; Biyun, Z.; The use of application in the theme park operation. China Tour. News 2013. Available online: http://www.360doc.com/content/13/0830/19/10580899_311018035.shtml (accessed on 12 January 2023).
- Guo, Y.; Liu, H.; Chai, Y. The embedding convergence of smart cities and tourism internet of things in China: An advance perspective. Adv. Hosp. Tour. Res. 2014, 2, 54–69. [Google Scholar]
- Wang, H.-Y.; Wang, S.-H. Predicting mobile hotel reservation adoption: Insight from a perceived value standpoint. Int. J. Hosp. Manag. 2010, 29, 598–608. [Google Scholar] [CrossRef]
- Akehurst, G. User generated content: The use of blogs for tourism organisations and tourism consumers. Serv. Bus. 2009, 3, 51–61. [Google Scholar] [CrossRef]
- Stepchenkova, S.; Mills, J.E.; Jiang, H. Virtual travel communities: Self-reported experiences and satisfaction. In Information and Communication Technologies in Tourism 2007; Springer: Berlin/Heidelberg, Germany, 2007; pp. 163–174. [Google Scholar]
- Liu, Y.; Law, R. The Adoption of Smartphone Applications by Airlines; Springer: Berlin/Heidelberg, Germany, 2013; pp. 47–57. [Google Scholar]
- Hawkins, D.E.; Leventhal, M.; Oden, W.L. The virtual tourism environment. utilisation of information technology to enhance strategic travel marketing. Prog. Tour. Hosp. Res. 1996, 2, 223–238. [Google Scholar] [CrossRef]
- Kurata, Y.; Hara, T. CT-planner4: Toward a more user-friendly interactive day-tour planner. In Information and Communication Technologies in Tourism 2014; Springer: Berlin/Heidelberg, Germany, 2013; pp. 73–86. [Google Scholar]
- GSMA. Learning about the History of Madrid Using an Augmented Reality Treasure Hunt. 2012. Available online: http://www.gsma.com/connectedliving/wp-content/uploads/2012/07/mEducation_Telefonica_UNEDMadrid.pdf (accessed on 12 January 2023).
- Chu, T.-H.; Lin, M.-L.; Chang, C.-H.; Chen, C.-W. Developing a tour guiding information system for tourism service using mobile GIS and GPS techniques. Adv. Inf. Sci. Serv. Sci. 2011, 3, 49–58. [Google Scholar]
- Huang, J.; Li, Y.; Li, H. Study on factors to adopt mobile payment for tourism e-business: Based on valence theory and trust transfer theory. In Information and Communication Technologies in Tourism 2014; Springer: Berlin/Heidelberg, Germany, 2013; pp. 747–759. [Google Scholar]
- Connell, J.; Reynolds, P. The implications of technological developments on Tourist Information Centres. Tour. Manag. 1999, 20, 501–509. [Google Scholar] [CrossRef]
- Saaty, T.L. What is the analytic hierarchy process? In Mathematical Models for Decision Support; Springer: Berlin/Heidelberg, Germany, 1988; pp. 109–121. [Google Scholar]
- Srdjevic, B.; Srdjevic, Z.; Blagojevic, B. First-level transitivity rule method for filling in incomplete pair-wise comparison matrices in the analytic hierarchy process. Appl. Math. Inf. Sci. 2014, 8, 459. [Google Scholar] [CrossRef] [Green Version]
- Zadeh, L.A. Fuzzy sets. Inf. Control 1965, 8, 338–353. [Google Scholar] [CrossRef] [Green Version]
- GUO, Y.-J.; Yuan, Y.; YI, P.-T. Method and application of dynamic comprehensive evaluation. Syst. Eng.-Theory Pract. 2007, 27, 154–158. [Google Scholar] [CrossRef]
- Chan, F.T.; Kumar, N. Global supplier development considering risk factors using fuzzy extended AHP-based approach. Omega 2007, 35, 417–431. [Google Scholar] [CrossRef]
- Martilla, J.A.; James, J.C. Importance-performance analysis. J. Mark. 1977, 41, 77–79. [Google Scholar] [CrossRef]
- Gardens, U.Z. Tokyo Parks Navi. Available online: https://www.tokyo-zoo.net/zoo/ueno/TPnavi/index.html (accessed on 12 January 2023).
- Hoage, R.J.; Deiss, W.A. New Worlds, New Animals: From Menagerie to Zoological Park in the Nineteenth Century; JHU Press: Baltimore, MD, USA, 1996. [Google Scholar]
- Yabe, T.; Tsubouchi, K.; Fujiwara, N.; Wada, T.; Sekimoto, Y.; Ukkusuri, S.V. Non-compulsory measures sufficiently reduced human mobility in Tokyo during the COVID-19 epidemic. Sci. Rep. 2020, 10, 18053. [Google Scholar] [CrossRef] [PubMed]
- Fietkiewicz, K.J.; Stock, W.G. How “Smart” are Japanese cities? An empirical investigation of infrastructures and governmental programs in Tokyo, Yokohama, Osaka, and Kyoto. In Proceedings of the 2015 48th Hawaii International Conference on System Sciences, Kauai, HI, USA, 5–8 January 2015; pp. 2345–2354. [Google Scholar]


| No. | Factors | Factor Description | Sources |
|---|---|---|---|
| 1 | Official website function | Tourists are increasingly utilizing digital sources such as tourism websites in their information search and communication exchange. Their travel intentions are strengthened by the website features of a tourism destination. | Heung, 2003 [9]; Kaplanidou and Vogt, 2007 [10] |
| 2 | Online information access | More travelers are using the internet as a medium to search for tourism information and planning their trips. Travel information is now among the most popular and frequently visited types of information on the internet. | Law and Leung, 2000 [11]; Buhalis and Law, 2008 [12] |
| 3 | Event notice | Using mobile application(s), tourist attractions can broadcast event information to tourists. | Wang and Zhu, 2013 [13] |
| 4 | Message notification (e-mail from Tokyo Zoonet) | Zoo Express is an e-mail magazine providing the latest information and animal-related news from the Tokyo Metropolitan Zoo and Aquarium. | https://www.tokyo-zoo.net/express/index.html (accessed on 12 January 2023) |
| 5 | Electronic claim system | Tourism organizations should have an e-complaint handling system to provide channels for tourists’ feedback and complaints. | Buhalis and Law, 2008 [12] |
| 6 | Electronic ticket system | A mature scenic spot information system should have an electronic ticketing system that utilizes radio-frequency identification technology. | Guo, Liu, and Chai, 2014 [14] |
| 7 | Online booking | Using technologies such as Wi-Fi, global navigation satellite systems, geographic information systems, and global positioning systems to meet tourists’ mobile reservation demands. | Wang and Wang, 2010 [15]; Buhalis and Law, 2008 [12] |
| 8 | Tourism blog | A recent survey found that tourists trusted more websites with reviews than professional guides and travel agencies, and that, far from being an irrelevant, blogs are often perceived to be more credible and trustworthy than traditional marketing communications. | Akehurst, 2009 [16] |
| 9 | Animal introduction platform | The animal introduction platform is full of information about zoos, aquariums, and living creatures. Users can make great use of the entire website for school education. | https://www.tokyo-zoo.net/zoovie/ueno (accessed on 12 January 2023) |
| 10 | VR sightseeing | A virtual travel community makes it easier for people to obtain information, maintain connections, develop relationships, and eventually make travel-related decisions through the mediation of computer bulletin boards and networks. | Stepchenkova, Mills, and Jiang, 2007 [17] |
| 11 | 3D model | The 3D model is a part of a digital twin which is a virtual representation of a real-world physical system or product (a physical twin), serving as its indistinguishable digital counterpart for practical purposes such as system simulation, integration, testing, monitoring, and maintenance. | https://my.matterport.com/show/?m=6B29NY93fGS (accessed on 12 January 2023) |
| 12 | Application | Mobile application(s) can improve the quality of customer service in theme or amusement parks by showing the exact location of rides and allowing users to check on waiting times at different attractions and make reservations. | Hafele, 2011 as cited in Liu and Law (2013) [18] |
| 13 | Digital map | Using global positioning systems, electronic maps and compasses can collect information from satellites and provide tourists with exact geographic positions and directions. | Hawkins, Leventhal, and Oden, 1996 [19] |
| 14 | Sightseeing route recommendation | People can design a tour plan with the collaborative tour-planner system in a collaborative manner, and design personal itineraries according to their own points of interest. | Kurata and Hara, 2013 [20] |
| 15 | Stamps | Collect stamps while visiting the animals around the zoo. Those who successfully collect all 10 stamps will receive an original animal image of the Ueno Zoo. | https://www.tokyo-zoo.net/zoo/ueno/TPnavi/index.html (accessed on 12 January 2023) |
| 16 | Information from QR code | Quick response codes can access information about nearby points of interest through mobile devices. | GSMA, 2012 [21] |
| 17 | Animal information service | Guests can quickly access the animal information they are looking for in multiple ways. On the phone, they can look up information about the ecology not only presented in text, but also with audio and video, and use it like a guide terminal. | https://www.tokyo-zoo.net/zoo/ueno/TPnavi/index.html (accessed on 12 January 2023) |
| 18 | Smart guide system | Guiding information services combine mobile geographic information systems and global positioning system techniques with location-based services to provide tourists with a better trip experience and a deeper understanding of the importance of the valuable landscape. | Chu, Lin, Chang, and Chen, 2011 [22] |
| 19 | Tourist spots recommendations | E-tourism-recommendation technologies can provide valuable information to tourists and help them discover and select the points of interest that best fit their preferences. | Buhalis and Law, 2008 [12] |
| 20 | Free Wi-Fi | Free Wi-Fi allows users to connect mobile devices such as personal digital assistants and mobile phones to the internet through wireless radio connection. It is now extensively used in hotels, airports, and cafes. | Buhalis and Law, 2008 [12] |
| 21 | Digital payment | Purchasing tourism products through mobile websites and application(s) is an emerging market. More and more tourists use mobile devices to plan, purchase, and enhance their travel experiences. | Huang, Li, and Li, 2013 [23] |
| 22 | Fundraising | A facility that enables visitors to make financial contributions to a foundation association operated by the Tokyo Zoological Park Society through the use of QR codes. | https://www.tokyo-zoo.net/fund/index.html (accessed on 12 January 2023) |
| 23 | Electronic information screen | Electronic touch screen technology can provide services to meet tourists’ information needs 24 h a day. | Connell and Reynolds, 1999 [24] |
| 24 | Animal state observation (Monitoring) | The animals’ living conditions are recorded in real-time using surveillance cameras and displayed through a display for visitors. | https://www.ueno-panda.jp/movie/ (accessed on 12 January 2023) |
| Scales of Relative Importance | Meaning |
|---|---|
| 1 | Equally important |
| 3 | Slightly important |
| 5 | Quite important |
| 7 | Obviously important |
| 9 | Absolutely important |
| 2, 4, 6, 8 | Intermediate scales |
| 1/3 | Slightly unimportant |
| 1/5 | Quite unimportant |
| 1/7 | Obviously unimportant |
| 1/9 | Absolutely unimportant |
| 1/2, 1/4, 1/6, 1/8 | Intermediate scales |
| Primary Classification | Result of Importance | Factor Defined | Rank | Secondary Classification | Result of Importance | Factor Defined | Rank |
|---|---|---|---|---|---|---|---|
| Official website function | 41.00% | U1 | 1 | Electronic ticket system | 57.00% | U17 | 1 |
| Online booking | 55.00% | U16 | 2 | ||||
| Event notice | 50.00% | U13 | 3 | ||||
| Official website function | 47.00% | U11 | 4 | ||||
| Online information access | 45.00% | U12 | 5 | ||||
| Tourism blog | 38.00% | U18 | 6 | ||||
| Electronic claim system | 23.00% | U15 | 7 | ||||
| Message notification (e-mail from Tokyo Zoonet) | 20.00% | U14 | 8 | ||||
| Tokyo Zoonet function | 12.00% | U2 | 4 | Animal introduction platform | 39.00% | U21 | 1 |
| 3D model | 27.00% | U23 | 2 | ||||
| VR sightseeing | 25.00% | U22 | 3 | ||||
| Smart (Tokyo Parks Navi) phone application(s) | 14.00% | U3 | 3 | Digital map | 57.00% | U32 | 1 |
| Obtain information from QR code | 43.00% | U35 | 2 | ||||
| Sightseeing route recommendation | 37.00% | U33 | 3 | ||||
| Animal information service | 37.00% | U36 | 4 | ||||
| Application | 34.00% | U31 | 5 | ||||
| Stamp | 26.00% | U34 | 6 | ||||
| Smartphone website application(s) (Tokyo Zoovie) | 5.00% | U4 | 5 | Tourist spots recommendations | 40.00% | U42 | 1 |
| Smart guide system | 37.00% | U41 | 2 | ||||
| Functions within the zoo | 26.00% | U5 | 2 | Digital payment | 77.00% | U52 | 1 |
| Free Wi-Fi | 60.00% | U51 | 2 | ||||
| Animal state observation (Monitoring) | 53.00% | U55 | 3 | ||||
| Electronic information screen | 43.00% | U54 | 4 | ||||
| Fundraising | 29.00% | U53 | 5 |
| Factor | U1 | U2 | U3 | U4 | U5 | Weight (%) |
|---|---|---|---|---|---|---|
| U1 | 1 | 4 | 4 | 5 | 2 | 44.891 |
| U2 | 0.25 | 1 | 1 | 2 | 0.5 | 12.329 |
| U3 | 0.25 | 1 | 1 | 2 | 0.5 | 12.329 |
| U4 | 0.2 | 0.5 | 0.5 | 1 | 0.333 | 7.173 |
| U5 | 0.5 | 2 | 2 | 3 | 1 | 23.279 |
| Factor | U11 | U12 | U13 | U14 | U15 | U16 | U17 | U18 | Weight (%) |
|---|---|---|---|---|---|---|---|---|---|
| U11 | 1 | 1 | 1 | 4 | 3 | 0.5 | 0.5 | 2 | 13.183 |
| U12 | 1 | 1 | 1 | 4 | 3 | 0.5 | 0.5 | 2 | 13.183 |
| U13 | 1 | 1 | 1 | 4 | 3 | 0.5 | 0.5 | 2 | 13.183 |
| U14 | 0.25 | 0.25 | 0.25 | 1 | 1 | 0.25 | 0.25 | 0.333 | 3.862 |
| U15 | 0.333 | 0.333 | 0.333 | 1 | 1 | 0.25 | 0.25 | 0.5 | 4.526 |
| U16 | 2 | 2 | 2 | 4 | 4 | 1 | 1 | 3 | 22.17 |
| U17 | 2 | 2 | 2 | 4 | 4 | 1 | 1 | 3 | 22.17 |
| U18 | 0.5 | 0.5 | 0.5 | 3 | 2 | 0.333 | 0.333 | 1 | 7.724 |
| Factor | U21 | U22 | U23 | Weight (%) |
|---|---|---|---|---|
| U21 | 1 | 2 | 2 | 50 |
| U22 | 0.5 | 1 | 1 | 25 |
| U23 | 0.5 | 1 | 1 | 25 |
| Factor | U31 | U32 | U33 | U34 | U35 | U36 | Weight (%) |
|---|---|---|---|---|---|---|---|
| U31 | 1 | 0.333 | 1 | 2 | 0.5 | 1 | 12.019 |
| U32 | 3 | 1 | 3 | 4 | 2 | 3 | 35.357 |
| U33 | 1 | 0.333 | 1 | 2 | 0.5 | 1 | 12.019 |
| U34 | 0.5 | 0.25 | 0.5 | 1 | 0.333 | 0.5 | 6.746 |
| U35 | 2 | 0.5 | 2 | 3 | 1 | 2 | 21.84 |
| U36 | 1 | 0.333 | 1 | 2 | 0.5 | 1 | 12.019 |
| Factor | U41 | U42 | Weight (%) |
|---|---|---|---|
| U41 | 1 | 1 | 50 |
| U42 | 1 | 1 | 50 |
| Factor | U51 | U52 | U53 | U54 | U55 | Weight (%) |
|---|---|---|---|---|---|---|
| U51 | 1 | 0.333 | 4 | 3 | 2 | 24.34 |
| U52 | 3 | 1 | 4 | 4 | 3 | 43.388 |
| U53 | 0.25 | 0.25 | 1 | 0.5 | 0.333 | 6.445 |
| U54 | 0.333 | 0.25 | 2 | 1 | 0.5 | 9.769 |
| U55 | 0.5 | 0.333 | 3 | 2 | 1 | 16.058 |
| Factor | Score | ||||
|---|---|---|---|---|---|
| 1 | 2 | 3 | 4 | 5 | |
| Official website function | 50.50% | 12.90% | 9.90% | 13.90% | 12.90% |
| Online information access | 27.70% | 20.80% | 14.90% | 15.80% | 20.80% |
| Event notice | 31.70% | 18.80% | 21.80% | 11.90% | 15.80% |
| Message notification (e-mail from Tokyo Zoonet) | 41.60% | 19.80% | 15.80% | 10.90% | 11.90% |
| Electronic claim system | 50.50% | 14.90% | 13.90% | 7.90% | 12.90% |
| Electronic ticket system | 30.70% | 12.90% | 17.80% | 11.90% | 26.70% |
| Online booking | 28.70% | 9.90% | 13.90% | 17.80% | 29.70% |
| Tourism blog | 27.70% | 19.80% | 23.80% | 12.90% | 15.80% |
| Factor | Score | ||||
|---|---|---|---|---|---|
| 1 | 2 | 3 | 4 | 5 | |
| Animal introduction platform | 32.70% | 13.90% | 25.70% | 15.80% | 11.90% |
| VR sightseeing | 48.50% | 12.90% | 19.80% | 9.90% | 8.90% |
| 3D model | 46.50% | 13.90% | 15.80% | 12.90% | 10.90% |
| Factor | Score | ||||
|---|---|---|---|---|---|
| 1 | 2 | 3 | 4 | 5 | |
| Application | 50.50% | 9.90% | 13.90% | 11.90% | 13.90% |
| Digital map | 24.80% | 11.90% | 18.80% | 15.80% | 28.70% |
| Sightseeing route recommendation | 32.70% | 17.80% | 18.80% | 14.90% | 15.80% |
| Stamp | 43.60% | 12.90% | 16.80% | 11.90% | 14.90% |
| Information from QR code | 31.70% | 15.80% | 14.90% | 12.90% | 24.80% |
| Animal information service | 35.60% | 12.90% | 16.80% | 15.80% | 18.80% |
| Factor | Score | ||||
|---|---|---|---|---|---|
| 1 | 2 | 3 | 4 | 5 | |
| Smart guide system | 40.60% | 11.90% | 13.90% | 10.90% | 22.80% |
| Tourist spots recommendations | 38.60% | 8.90% | 18.80% | 13.90% | 19.80% |
| Factor | Score | ||||
|---|---|---|---|---|---|
| 1 | 2 | 3 | 4 | 5 | |
| Free Wi-Fi | 26.70% | 13.90% | 15.80% | 10.90% | 32.70% |
| Digital payment | 12.90% | 9.90% | 7.90% | 13.90% | 55.40% |
| Fundraising | 42.60% | 16.80% | 16.80% | 13.90% | 9.90% |
| Electronic information screen | 19.80% | 20.80% | 21.80% | 10.90% | 26.70% |
| Animal state observation (Monitoring) | 20.80% | 10.90% | 20.80% | 17.80% | 29.70% |
| Factor | Performance (P) | Importance (I) | Mean Difference (P-I) | t Value | p Value | ||
|---|---|---|---|---|---|---|---|
| Average Value | Rank | Average Value | Rank | ||||
| Official website function | 2.61 | 4 | 3.84 | 3 | −1.23 | −11.142 | <0.001 |
| Tokyo Zoonet function | 2.35 | 5 | 3.54 | 5 | −1.18 | −10.689 | <0.001 |
| Smart (Tokyo Parks Navi) phone application(s) | 2.66 | 2 | 3.82 | 4 | −1.16 | −10.02 | <0.001 |
| Smartphone website application(s) (Tokyo Zoovie) | 2.65 | 3 | 3.87 | 2 | −1.21 | −8.243 | <0.001 |
| Functions within the zoo | 3.12 | 1 | 4.10 | 1 | −0.98 | −10.005 | <0.001 |
| Factor | Performance (P) | Importance (I) | Mean Difference (P-I) | t Value | p Value | ||
|---|---|---|---|---|---|---|---|
| Average Value | Rank | Average Value | Rank | ||||
| Official website function | 2.26 | 22 | 4 | 8 | −1.743 | −11.091 | <0.001 |
| Online information access | 2.81 | 9 | 3.9 | 13 | −1.089 | −7.152 | <0.001 |
| Event notice | 2.61 | 15 | 4.11 | 7 | −1.495 | −9.967 | <0.001 |
| Message notification (e-mail from Tokyo Zoonet) | 2.32 | 18 | 3.25 | 23 | −0.931 | −6.886 | <0.001 |
| Electronic claim system | 2.18 | 23 | 3.38 | 22 | −1.198 | −7.495 | <0.001 |
| Electronic ticket system | 2.91 | 7 | 4.2 | 4 | −1.287 | −8.444 | <0.001 |
| Online booking | 3.1 | 4 | 4.18 | 5 | −1.079 | −7.04 | <0.001 |
| Tourism blog | 2.69 | 10 | 3.7 | 17 | −1.01 | −8.049 | <0.001 |
| Animal introduction platform | 2.6 | 16 | 3.78 | 16 | −1.178 | −8.758 | <0.001 |
| VR sightseeing | 2.18 | 24 | 3.42 | 20 | −1.238 | −9.368 | <0.001 |
| 3D model | 2.28 | 21 | 3.42 | 21 | −1.139 | −8.481 | <0.001 |
| Application | 2.29 | 20 | 3.57 | 18 | −1.287 | −8.444 | <0.001 |
| Digital map | 3.12 | 3 | 4.27 | 2 | −1.149 | −7.631 | <0.001 |
| Sightseeing route recommendation | 2.63 | 13 | 3.94 | 12 | −1.307 | −9.032 | <0.001 |
| Stamps | 2.42 | 17 | 3.21 | 24 | −0.792 | −5.858 | <0.001 |
| Information from QR code | 2.83 | 8 | 3.98 | 9 | −1.149 | −7.699 | <0.001 |
| Animal information service | 2.69 | 11 | 3.95 | 11 | −1.257 | −8.907 | <0.001 |
| Smart guide system | 2.63 | 14 | 3.85 | 15 | −1.218 | −7.631 | <0.001 |
| Tourist spots recommendations | 2.67 | 12 | 3.88 | 14 | −1.208 | −7.925 | <0.001 |
| Free Wi-Fi | 3.09 | 5 | 4.23 | 3 | −1.139 | −7.544 | <0.001 |
| Digital payment | 3.89 | 1 | 4.61 | 1 | −0.723 | −5.441 | <0.001 |
| Fundraising | 2.32 | 19 | 3.52 | 19 | −1.208 | −8.613 | <0.001 |
| Electronic information screen | 3.04 | 6 | 3.98 | 10 | −0.941 | −7.626 | <0.001 |
| Animal state observation (Monitoring) | 3.25 | 2 | 4.16 | 6 | −0.911 | −6.782 | <0.001 |
Disclaimer/Publisher’s Note: The statements, opinions and data contained in all publications are solely those of the individual author(s) and contributor(s) and not of MDPI and/or the editor(s). MDPI and/or the editor(s) disclaim responsibility for any injury to people or property resulting from any ideas, methods, instructions or products referred to in the content. |
© 2023 by the authors. Licensee MDPI, Basel, Switzerland. This article is an open access article distributed under the terms and conditions of the Creative Commons Attribution (CC BY) license (https://creativecommons.org/licenses/by/4.0/).
Share and Cite
Lin, Y.; Shimoda, R. Impact of Intellectualization of a Zoo through a FCEM-AHP and IPA Approach. Land 2023, 12, 243. https://doi.org/10.3390/land12010243
Lin Y, Shimoda R. Impact of Intellectualization of a Zoo through a FCEM-AHP and IPA Approach. Land. 2023; 12(1):243. https://doi.org/10.3390/land12010243
Chicago/Turabian StyleLin, Yuxuan, and Ryosuke Shimoda. 2023. "Impact of Intellectualization of a Zoo through a FCEM-AHP and IPA Approach" Land 12, no. 1: 243. https://doi.org/10.3390/land12010243