Article

Drought Monitoring in Terms of Evapotranspiration Based on Satellite Data from Meteosat in Areas of Strong Land–Atmosphere Coupling

by
Julia S. Stoyanova
*,
Christo G. Georgiev
and
Plamen N. Neytchev
National Institute of Meteorology and Hydrolohy, 1784 Sofia, Bulgaria
*
Author to whom correspondence should be addressed.
Land 2023, 12(1), 240; https://doi.org/10.3390/land12010240
Submission received: 1 December 2022 / Revised: 29 December 2022 / Accepted: 9 January 2023 / Published: 12 January 2023
(This article belongs to the Special Issue Land Surface Monitoring Based on Satellite Imagery II)

Abstract

:
This study was focused on a key aspect of drought monitoring that has not been systematically studied in the literature: evaluation of the capacity of evapotranspiration data retrieved using geostationary meteorological satellites for use as a water stress precursor. The work was methodologically based on comparisons between constructed indexes of vegetation water stress (evapotranspiration drought index (ETDI) and evaporative stress ratio (ESR)) derived from the EUMETSAT LSASAF METREF and DMET satellite products and soil moisture availability (SMA) from a SVAT model. Long-term (2011–2021) data for regions with strong land–atmosphere coupling in Southeastern Europe (Bulgaria) were used. Stochastic graphical analysis and Q–Q (quantile–quantile) analyses were performed to compare water stress metrics and SMA. Analyses confirmed the consistency in the behavior of vegetation water-stress indexes and SMA in terms of their means, spatiotemporal variability at monthly and annual levels, and anomalous distributions. The biophysical aspects of the drought evaluation confirmed the complementary and parallel interaction of potential (METREF) and actual (DMET) evapotranspiration (in view of the Bouchet hypothesis) for the studied region. Anomalies in evapotranspiration stress indexes can provide useful early signals of agricultural/ecological drought, and the results confirm the validity of using their satellite-based versions to characterize SMA in the root zone and drought severity.

1. Introduction

Drought represents an extended imbalance between water supply and demand. Its physical manifestations are deficits in water storage and reduced fluxes; for example, lack of precipitation in meteorological drought, decreased evapotranspiration (ET) and absence of soil moisture (SM) in agricultural/ecological drought, and reduced stream flow and depletion of surface storage in hydrological drought [1]. Drought can have feedback effects on the atmosphere via biogeophysical and biogeochemical land–atmosphere interactions, potentially affecting the extremes of temperature, precipitation, and other variables [2,3]. Regions where soil moisture impacts the atmosphere most are transitional zones between dry and wet climates [4] recognized as “hotspots” of land–atmosphere coupling. For the present climate, the southern Europe/Mediterranean area has been identified as being such a region in the recent [5] past and upcoming future [6,7]. An increase in drought frequency and severity for the region [8], especially in summer [9,10,11], has been reported.
Drought generally originates as a meteorological phenomenon in which periods of low precipitation may produce water scarcity in various parts of or across the whole hydrological cycle [12,13,14], which in turn affects crops [15], various environmental systems [16], and climate [14]. Precipitation deficit has been viewed as the main factor increasing drought risk under climate change (e.g., [17]) but the drought environment can be further modulated by a number of other processes, such as increased atmospheric evaporative demand [16] and evaporation [18], which amplify the water deficit. Furthermore, biophysical processes can be affected by water deficits [19], and the vegetation response to droughts can also affect water availability through the modulation of evapotranspiration [20]. To assess drought and its impact on ecosystems, it is necessary to define a drought index that can highlight the biological changes in ecosystems in response to the dynamics of drought intensity. Better accounting for vegetation’s feedback on droughts in the Mediterranean context is needed [21] because increasing global warming has an increasing level of influence on terrestrial ecosystems [22,23,24,25,26].
Recent drought-related studies have focused mainly on evapotranspiration (ET) [27] because it is coupled with atmospheric moisture demand and, thus, affects water availability on land surfaces [28]. Vicente-Serrano et al. [29] proposed the Standardized Precipitation-Evapotranspiration Index (SPEI) by incorporating ET estimates into the structure of the Standardized Precipitation Index (SPI) [12] and found more severe drought risks under global warming than indicated by the precipitation deficit alone (with some discrepancy between the Thornthwaite and Penman–Monteinth ET estimates [30,31]). Further analyses have shown better performance for the SPEI compared to SPI [32,33]. A number of drought indexes either based only on the PE (the evaporative demand drought index (EDDI) [1,34]) or accounting for both water supply and demand (reconnaissance drought index (RDI) [35] and demand sensitive drought index (DSDI) [36]) have been developed. However, application of drought indexes that only consider PE is inappropriate in regions with specific soil moisture conditions because a positive PE anomaly does not help determine drought severity [37]. Based on the physical relation between AE and PE, a next generation of indexes, such as the ET deficit index (EDI) [38], the evaporative stress index (ESI) [39], the drought severity index (DSI) [40], the standardized ET deficit index (SEDI) [27,37], and the ET deficit index (ETDI) [41], have been proposed. These drought indexes based on the ET deficit are reliable at regional or global scales of application [37,39,42,43].
Two main issues are of importance in the application of these indexes. First, while PE can be derived from relatively simple T air-based or physically based models [30,37], ET estimates are subject to many sources of uncertainty and remain one of the most poorly understood components of the hydrologic cycle [44]. Second, Hobbins et al. [1] have brought attention to the fact that, depending on whether ET is limited by the availability of energy or of water, PE either plays a role in determining ET or else is reflective of ET. In non-water-limited conditions, PE can be used to estimate the upper limit of (energy-limited) ET, whereas in water-limited conditions, land–atmosphere feedback generated from AE drives PE in the opposite—or complementary—direction.
Evaporation estimation methods that avoid the use of rarely available SM data and are simple enough to be used with routinely available meteorological data are highly desirable. One such method is the complementary relationship (CR) first proposed by Bouchet [45]. In this model, for large homogeneous surfaces with minimal advection of heat and moisture, PE and AE are strongly coupled through land–atmosphere feedback. AE is not an independent forcing function as usually assumed. If moisture at the surface is not limited, AE equals PE; when AE falls below PE as a result of limited moisture availability, an amount of excess energy becomes available for the sensible heat flux, which warms and dries the atmospheric boundary layer, thereby causing PE to increase; similarly, if AE increases because more soil moisture becomes available, less energy is available for the sensible heat flux, causing PE to decrease. The CR extends the Budyko approach [46,47] by allowing regional PE to depend in a complementary manner on regional AE across the entire range of energy and moisture availability. This theory has found wide support in the literature, both from comparisons with other methods that estimate evapotranspiration [48,49] and from analyses based on meteorological observations and/or modeling results [50,51,52,53] aiming to find a more physical foundation for the CR (e.g., [54,55]. In line with this, combining the results for soil moisture availability (SMA) from an SVAT model and satellite-based AE and PE estimates at the regional level in Southeastern Europe (SEE), physical aspects of the complementarity were evaluated in our work.
The availability of remote sensing data has made it possible to simulate spatially continuous ET and to overcome the low temporal and spatial coverage of station-based observation ET data [43,56]. Some of the few available operational products are the ET products [57] from the EUMETSAT Satellite Application Facility on Land Surface Analysis (LSASAF) based on the SEVIRI sensor onboard the Meteosat Second Generation geostationary satellites (MSG/SEVIRI), which provide spatial coverage in near-real time from over the entire European and African continents, as well as parts of South America.
In the scientific literature, droughts (and flash droughts) have primarily been evaluated by one of three groups of variables: soil moisture, evaporative demand, and evaporative stress [58]. Soil moisture is a commonly used variable for drought detection as rapid decreases in soil moisture can indicate drought development, and limited soil water content represents a critical impact [59,60,61]. Increasing evaporative demand concurrently increases evapotranspiration, leading to rapid depletion of SM [1,34,62]. Large values for evaporative stress (low actual evapotranspiration and high potential evapotranspiration) indicate desiccation of the land surface and vegetative impacts, and rapid increases in evaporative stress can indicate development of flash droughts [63,64,65].
This study was focused on two key aspects of the drought problem that have not been systematically studied in the literature: (i) evaluation of the capacity of evapotranspiration data retrieved from remote sensing inputs for use as a precursor of actual water stress over regions with strong land–atmosphere coupling in SEE (Bulgaria); and (ii) exploration of the biophysical aspects of drought in terms of the complementary and parallel interaction of potential and actual evapotranspiration at a regional level (in view of the Bouchet hypothesis [45]) using long-term data records from LSASAF METREF and DMET satellite products on a monthly basis. Taking into account the fact that the current study is the first to use the long time-series of LSASAF products retrieved from geostationary satellite observations to investigate drought occurrence, the specific objectives were:
  • To derive evaporative stress indexes for drought assessment from geostationary meteorological satellite data;
  • To evaluate the consistency of ET-based water stress indexes and soil moisture availability (SMA) in the root zone in a short-term climatic context;
  • To characterize the spatiotemporal variability in and seasonal dynamics of water stress and drought in terms of evapotranspiration according to the Bouchet concept;
  • To use statistical analyses to evaluate the applicability of these indexes as a drought indicator for the SEE region.

2. Materials and Methods

For drought assessment, two expressions of evaporative stress were used in our work: the Evapotranspiration Deficit Index (ETDI [41]) and evaporative stress ratio [38]. In the frame of this approach, satellite-derived drought identification using evaporative stress was compared statistically to reanalysis-based SVAT-model SMA identification (for the long-term period from 2011 to 2021) to examine the temporal and spatial relationships between vegetation water stress and soil moisture deficit.

2.1. Biophysical Indexes

2.1.1. Atmospheric Evaporative Demand (AED)

The Daily Reference Evapotranspiration DMETREF (METREF) product generated by the LSASAF from Meteosat/SEVIRI was used as a measure of atmospheric evaporative demand (AED). Its algorithm is based on the reference evapotranspiration ETo concept and refers to the evaporating demand under optimum soil water conditions and excellent management and environmental conditions that would achieve full production under given climatic conditions. The reference evapotranspiration was computed by using the Penmann–Monteith equation (FAO56 [66], https://landsaf.ipma.pt/en/products/evapotranspiration-energy-flxs/metref-cdr/, accessed on 1 October 2022). The algorithm is based on experimental and theoretical evidence that the main driver of evapotranspiration over an extensive reference surface is global radiation; it is not affected by local effects, such as surface aridity or local advection. It has been shown that the ETo can be computed from the daily net radiation and, since it refers to a well-known and well-watered reference surface, daily net radiation over such a surface can be estimated from short-wave radiation [67].

2.1.2. Actual Evapotranspiration

Evapotranspiration (ET) refers to the flux of water evaporated at the Earth–atmosphere interface (soil + vegetation + water bodies) and transpired by vegetation through stomata in leaves as a consequence of photosynthetic processes. The daily Meteosat evapotranspiration product (DMET) obtained by integrating instantaneous values for the whole day (in mm per day) and generated in the framework of the LSASAF consortium at SEVIRI spatial resolution (3 km at the sub-satellite point) (https://landsaf.ipma.pt/en/products/evapotranspiration-energy-flxs/dailymet/, accessed on 30 November 2020) was used. The methodology adopted for the ET product combined the advantages of geostationary satellite remote sensing with the ability of a soil vegetation atmosphere transfer (SVAT) model to describe physical and physiological process occurring in the vegetation canopy [68,69]. It was based on the physics of the Tiled ECMWF Surface Schemes for Exchange Processes over Land (TESSEL) [70,71] and H-TESSEL [72,73] and was calculated separately for each tile and pixel value [74]. The main sources of uncertainties that might raise problems when using the DMET product are briefly described in [74].

2.2. Drought Metrics

To understand the drought patterns (water availability and moisture stress) in areas with strong land–atmosphere coupling, the developed indexes, which depict cumulative evaporative stress, were applied here. The difference and ratio between the PE and AE values are used in agriculture, ecology, water resource management, and climate studies as indicators of water deficits. AE is a valuable indicator linked to land drought status [38], but by itself it is not a water stress indicator as, in addition to water availability, it is influenced by many other factors, such as wind speed and solar radiation. This is the reason why AE is commonly normalized with the reference or the potential evapotranspiration in order to characterize water stress. Based on satellite information from the Meteosat geostationary satellite, two versions of evaporative stress [41,75,76] were used to characterize surface drought conditions in our study.

2.2.1. Evapotranspiration Deficit Index (ETDI)

The Evapotranspiration Deficit Index (ETDI [41]) is calculated according to Equation (1) on a monthly basis:
E T D I =   ( P E A E ) P E = 1 A E P E ,
where, for PE, the monthly mean of the daily LSASAF METREF estimates is used; and for AE, the monthly mean actual evapotranspiration is calculated on the basis of the daily LSASAF DMET product dataset from across the target region of Bulgaria.

2.2.2. Evaporation Ratio

The evaporative stress ratio index (ESR index or R-index [75]), defined as the ratio of actual (AE) to potential (PE) evapotranspiration, was used as a measure of plant water stress that is fundamentally linked to canopy–atmosphere coupling, as shown by Equation (2):
E S R =   A E P E ,
where AE is the evapotranspiration quantified according to the LSASAF DMET product and PE is the potential evapotranspiration defined by the LSASAF METREF product.

2.2.3. SVAT Model and SMAI
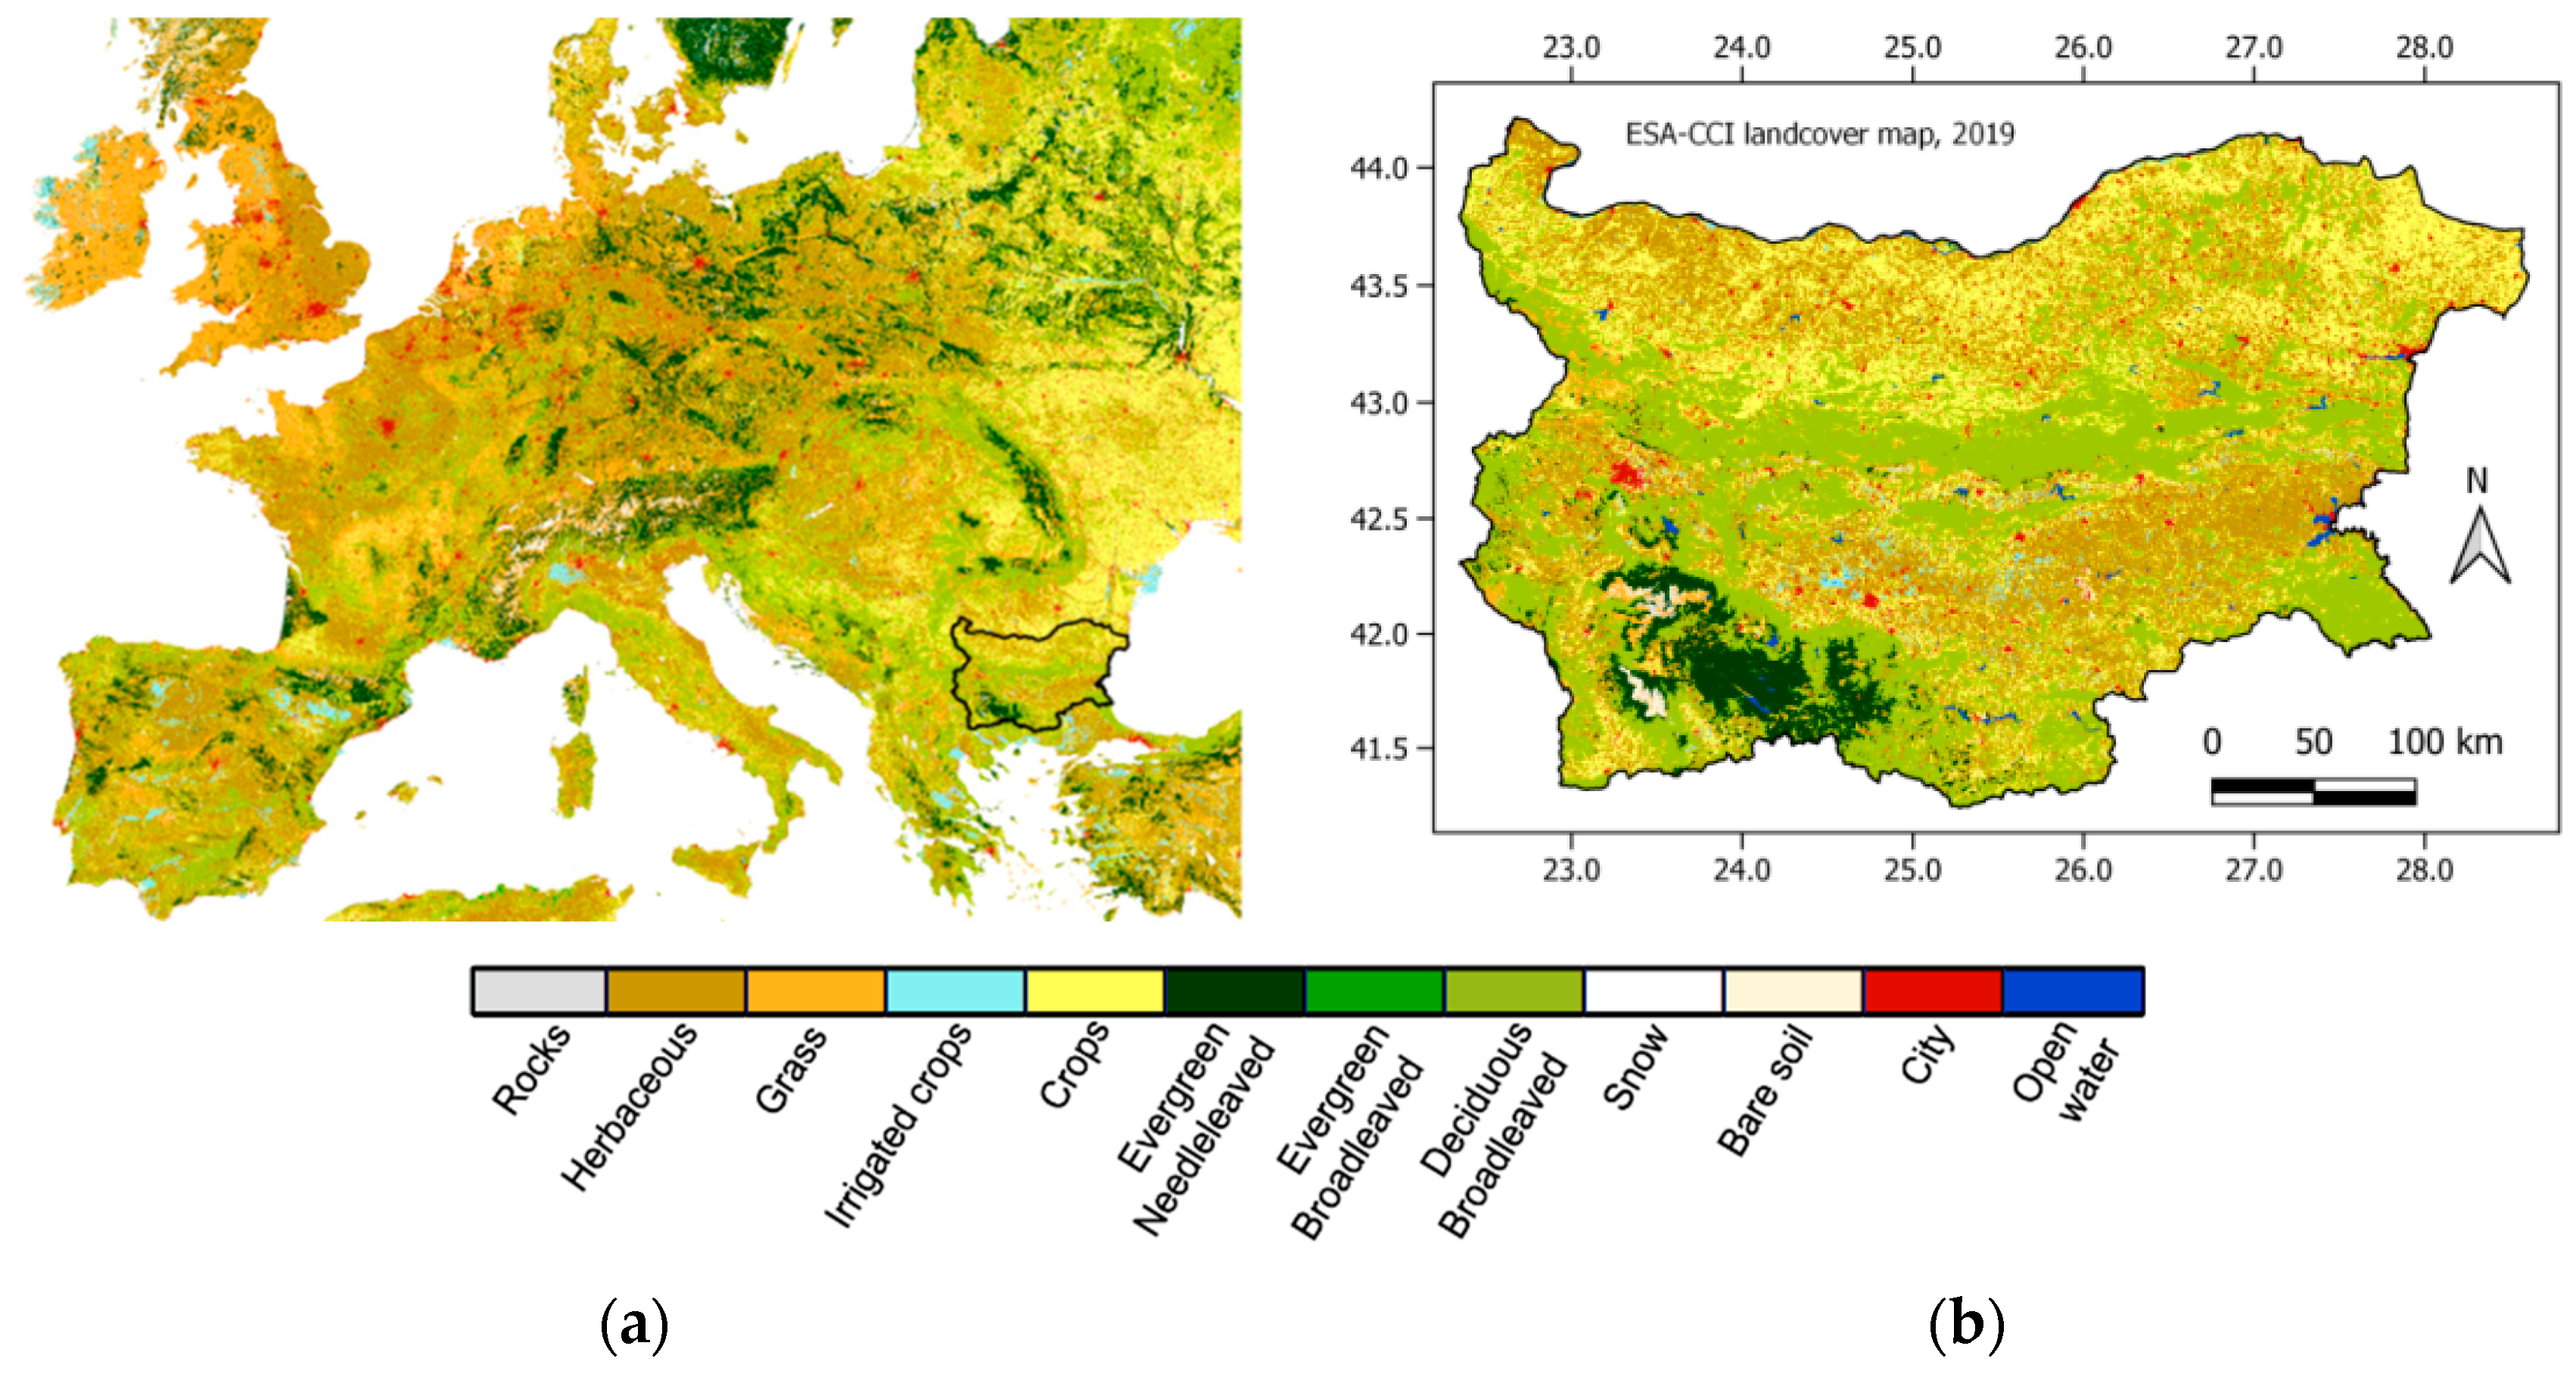
The SVAT_bg model developed at the National Institute of Meteorology and Hydrology (NIMH) of Bulgaria is used for quantification of SMA at the surface and at root-zone soil depths (50, 100 cm) [77,78,79]. To assess regional soil hydrophysical properties, a soil moisture availability index (SMAI) has been introduced as a six-level threshold scheme accounting for moistening conditions in the root zone [78,80], and here it was applied as a reference for identification of terrestrial drought (for more details, see [80]).

2.3. Study Area

The utility of satellite remote sensing for drought detection was examined for the region of Bulgaria in SEE, as it is one of the regions with strong land–atmosphere coupling. The study area was located within the latitude circles of 40.25 N and 45.0 N and meridians of 20.5 N and 29.5 E. The region (Figure 1) more or less falls under Mediterranean climate influences and is characterized by dry summers and mild, wet winters, both with irregular precipitation distributions. The projections of various model experiments on future climate change scenarios strongly agree with regard to the increased frequency and severity of droughts in the Mediterranean basin [21].
Spatial heterogeneities in land cover explain why the underlying surface conditions of Bulgaria are different and significantly affect the drought propagation process. Information about land cover (LC) provided by the ESA-CCI Land Cover Map at a spatial resolution of 300 m (https://www.esa-landcover-cci.org/?q=node/164, accessed on 20 June 2020) was used to illustrate the variability in vegetation, which has a key role in the variations in ET in Bulgaria. The last LC Map edition from 2019 was used, as the main LC types were reclassified for demonstration purposes according to the ET algorithm [81]. This diversity of land cover types also presents an opportunity to explore the utility of drought detection using remote sensing across different ecosystems. Lastly, it is important to note that drought identification was focused on the approximate growing season across Bulgaria between May and October.

2.4. Numerical Analyses

To account for vegetation water stress based on satellite-derived evapotranspiration, a dataset based on daily LSASAF DMET and METREF products for the period of May–October (2011–2021) was constructed. The two versions of the evaporative stress metrics, the ETDI and the AE/PE ratio (see Section 2.2), were calculated. Drought identification based on satellite data was compared to reanalysis-based drought identification using SMA in the root zone (at 50 and 100 cm soil depths) obtained as the SVAT_bg output [78]. The gridded site-scale assessments of mean monthly SMAI values and their anomalies at synoptic stations were compared statistically with corresponding evaporative stress indexes for the territory of Bulgaria. SMA and SMAI were considered as references in these comparative analyses. The overarching purpose of these numerical analyses was to validate evapotranspiration LSASAF products for use in an objective drought monitoring methodology.
A graphical description of the vegetation water stress metrics was produced through the boxplot quartile analyses of the METREF, DMET, and evapotranspiration deficit (the difference between the METREF and DMET). The agreement between vegetation water stress metrics and the SMA was evaluated with stochastic graphical analysis. Evaluation of the spatiotemporal variability and distribution of anomalies on a monthly mean basis was performed. Linear regression modeling and quantile–quantile (Q–Q) analyses were applied. Overlaid graphical analysis was performed for the growing season (May–October 2011–2021). Since the datasets used employed different spatial resolutions, rescaling was undertaken over the grid of the global NWP model of the ECMWF (IFS version O1280, about 9 km spatial resolution) for the Bulgaria domain. R statistics was applied for comparative analyses [82]. A review of the meteorological products utilized for drought monitoring is given in Table 1.

3. Results

3.1. Spatiotemporal Evaluation of Evapotranspiration Process

3.1.1. Boxplot Analyses

Boxplots of monthly (May–October) distributions of PE according to the LSASAF METREF product and, the AE according to the LSASAF DMET product, as well as the difference between them (i.e., the evapotranspiration deficit (ED)), for the landmass of Bulgaria are shown in Figure 2a–c.
Comparing the boxplots in Figure 2a,b, the plots show different aggregations of and variability in PE and AE data by month during the growing season. Comparing the notches, where the green lines show the median and the red and blue lines indicate the 25th and 75th percentile averages of the same statistics for all individual boxplots, monthly differences between PE and AE can be evaluated. The PE median indicates approximately 1 mm/day higher values. The statistical analyses confirmed that evaporative demands in May, July, and August were above the total median for the boxplots, being highest in July (Figure 2a) when both insolation and air temperature are significantly high. In reality, the land–atmosphere system cannot realize the entire PE and this depends on SM, cloudiness, air humidity, etc. In this connection, the actual evapotranspiration (Figure 2b) reaches a maximum in June when the SMA does not disturb the process, and after that it steadily declines due to the lack of precipitation and steadily depletion of SM. The ratio between the total medians of the PE and AE indicates that, on average on a regional scale, 42% of AED is released in actual evapotranspiration. As a result, the ED (Figure 2c) steadily increases, as in May, the mean values were below the total median of the boxplots, but in July and August (the highest), they increased significantly, reaching close to the 75th percentile, which is an indication of drought occurrence and, thus, may serve as an evaporation-based drought monitoring tool. In general, the medians of the total DMET and ED did not much differ by much (Figure 2b,c) due to the fact that approximately half of the evaporative demands in drought conditions (low or exhausted SMA) contributing to the PE could be converted into ET for the target region.

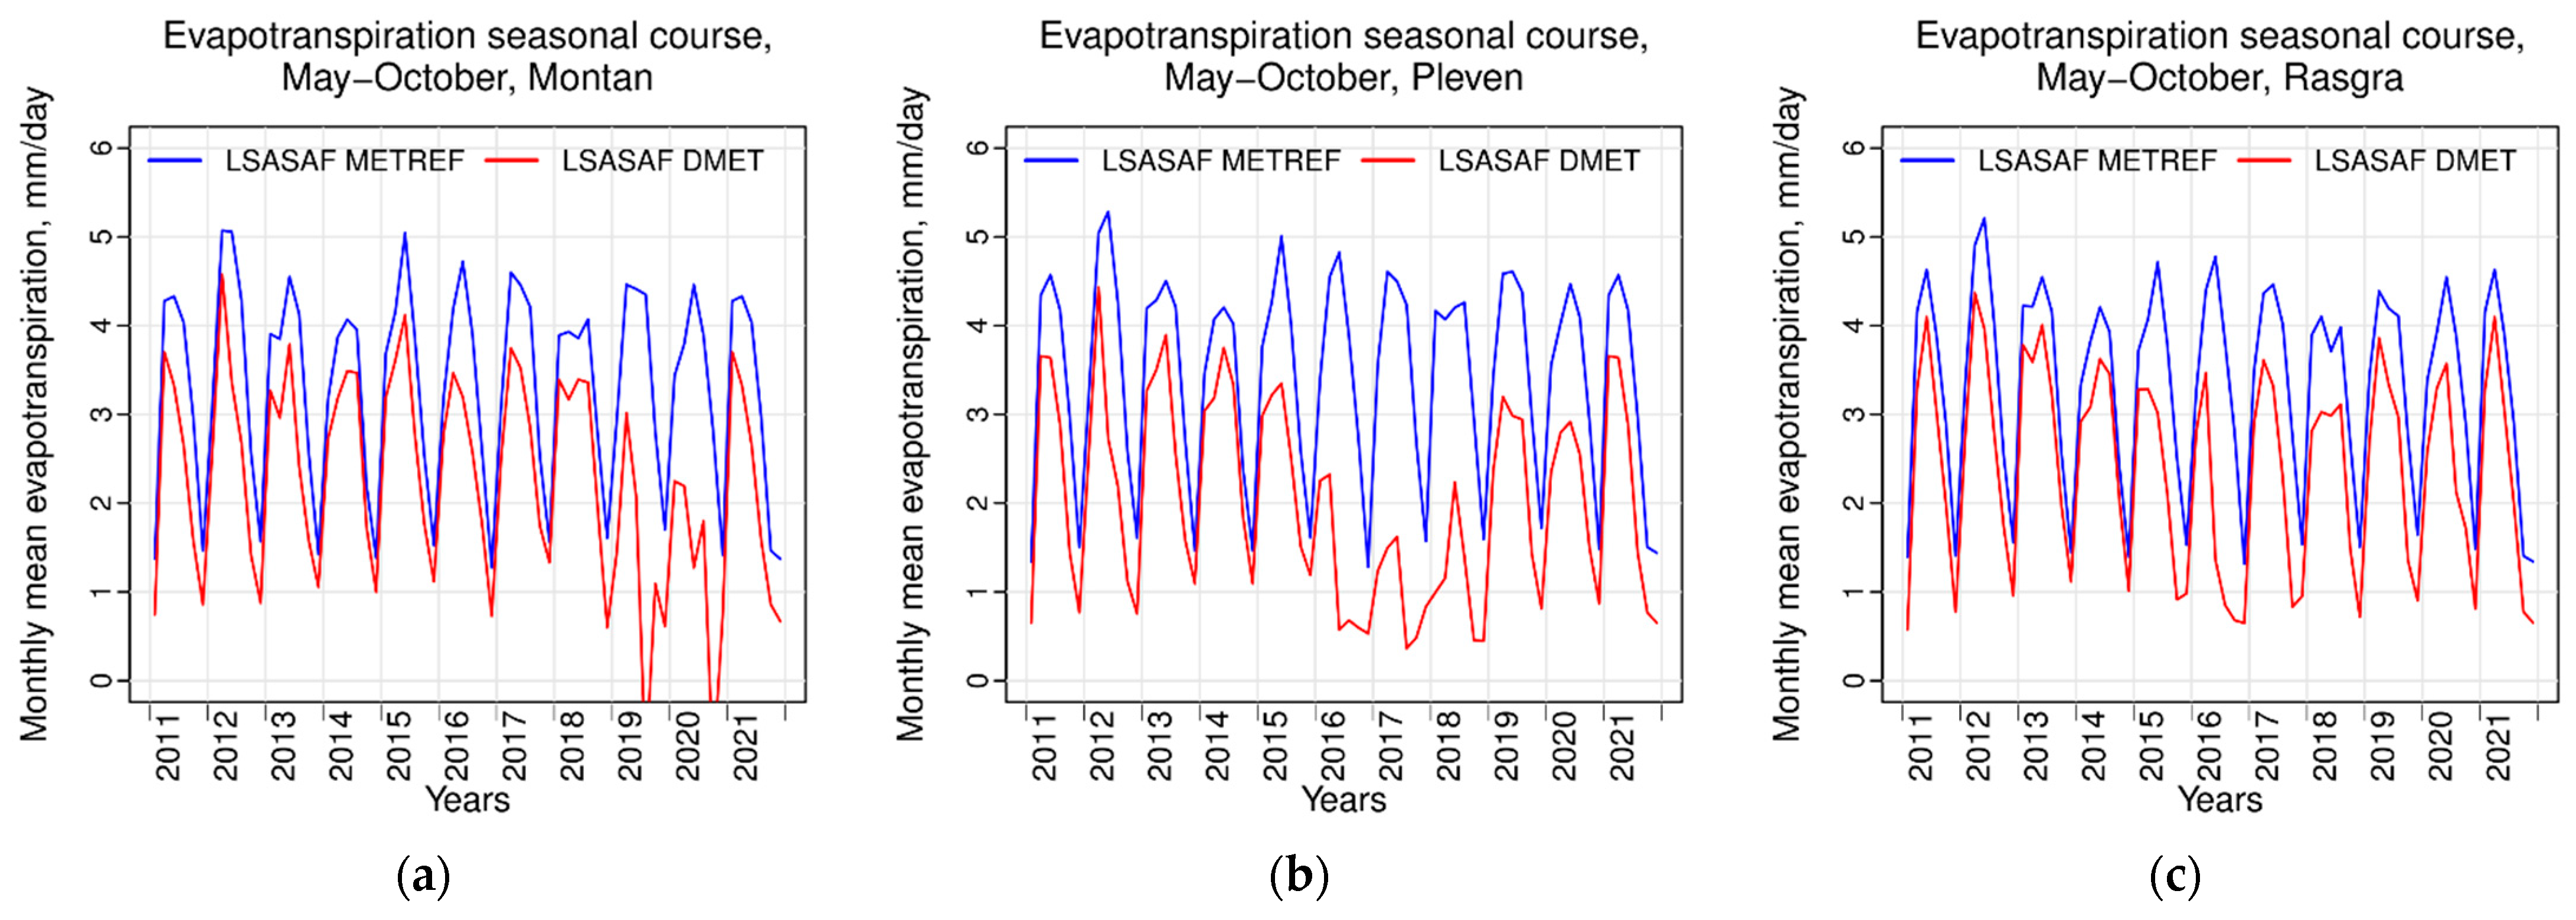
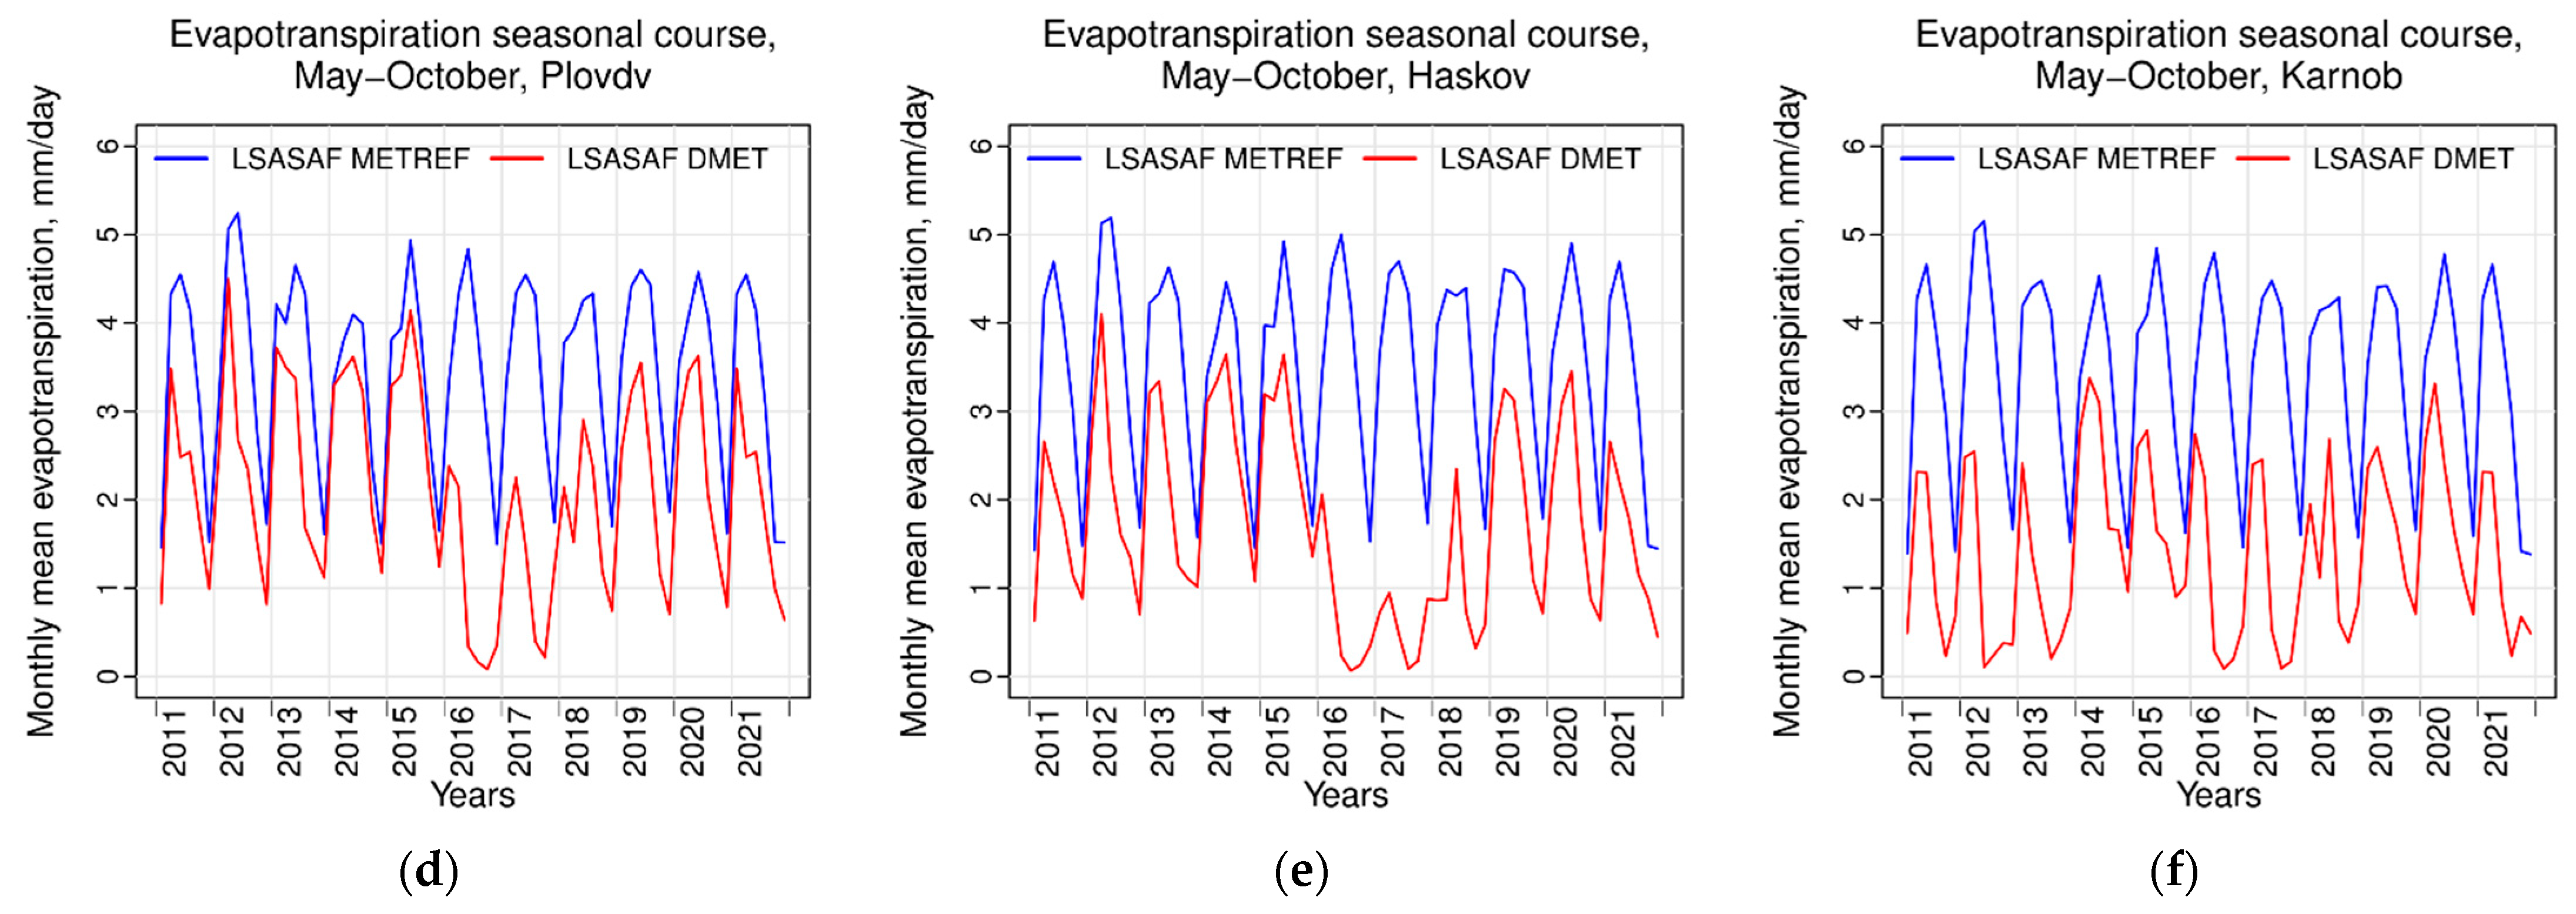
3.1.2. Local Effects on the Temporal Variability in Evapotranspiration

Evapotranspiration and the soil moisture deficit are physical indications of agricultural/ecological drought. The two measures, one ideal (PE) and the other actual (AE), together reflect the full range of evaporative drivers and responses to drought. PE acts as a strong indicator of potential drought conditions, whereas drought evaporative impacts may be better measured by an independent measure of AE [1]. In this context, the interannual (2011–2021) seasonal variability of METREF and DMET were compared. Local-scale assessments for the regions with synoptic stations were performed and here illustrated for selected regions in north Bulgaria (Figure 3a–c) and south Bulgaria (Figure 3d–f). The AEDs differed depending on the specific year and the local microclimate, being highest in 2016 for all regions; the AE varied significantly for some locations; e.g., the AE was even very low close to 0 during the summer months in 2019–2020 (Figure 3a), 2016–2017 (Figure 3b,d,e), and 2011–2013 and 2016–2017 (Figure 3f).
As is indicated in the literature, Mediterranean vegetation is not expected to be negatively affected by increased AED during periods of high precipitation and sufficient SM [83] but, during periods of SM deficits, vegetation would be further stressed by an increased AED [84,85,86]. The negative effect of increased AED can be seen in increased defoliation rates in forests [87]. Over the last few decades, AED has strongly increased [88], which has reduced global vegetation growth [89]. In this context, regional studies and monitoring of the seasonal variability in the evapotranspiration deficit would be beneficial for drought management planning and mitigation of potential drought effects. The variations in the differences between the METREF and DMET seasonal courses from year to year (Figure 3) implicitly underline the need for parallel consideration of atmospheric vapor pressure deficit, AED, and SM deficit.

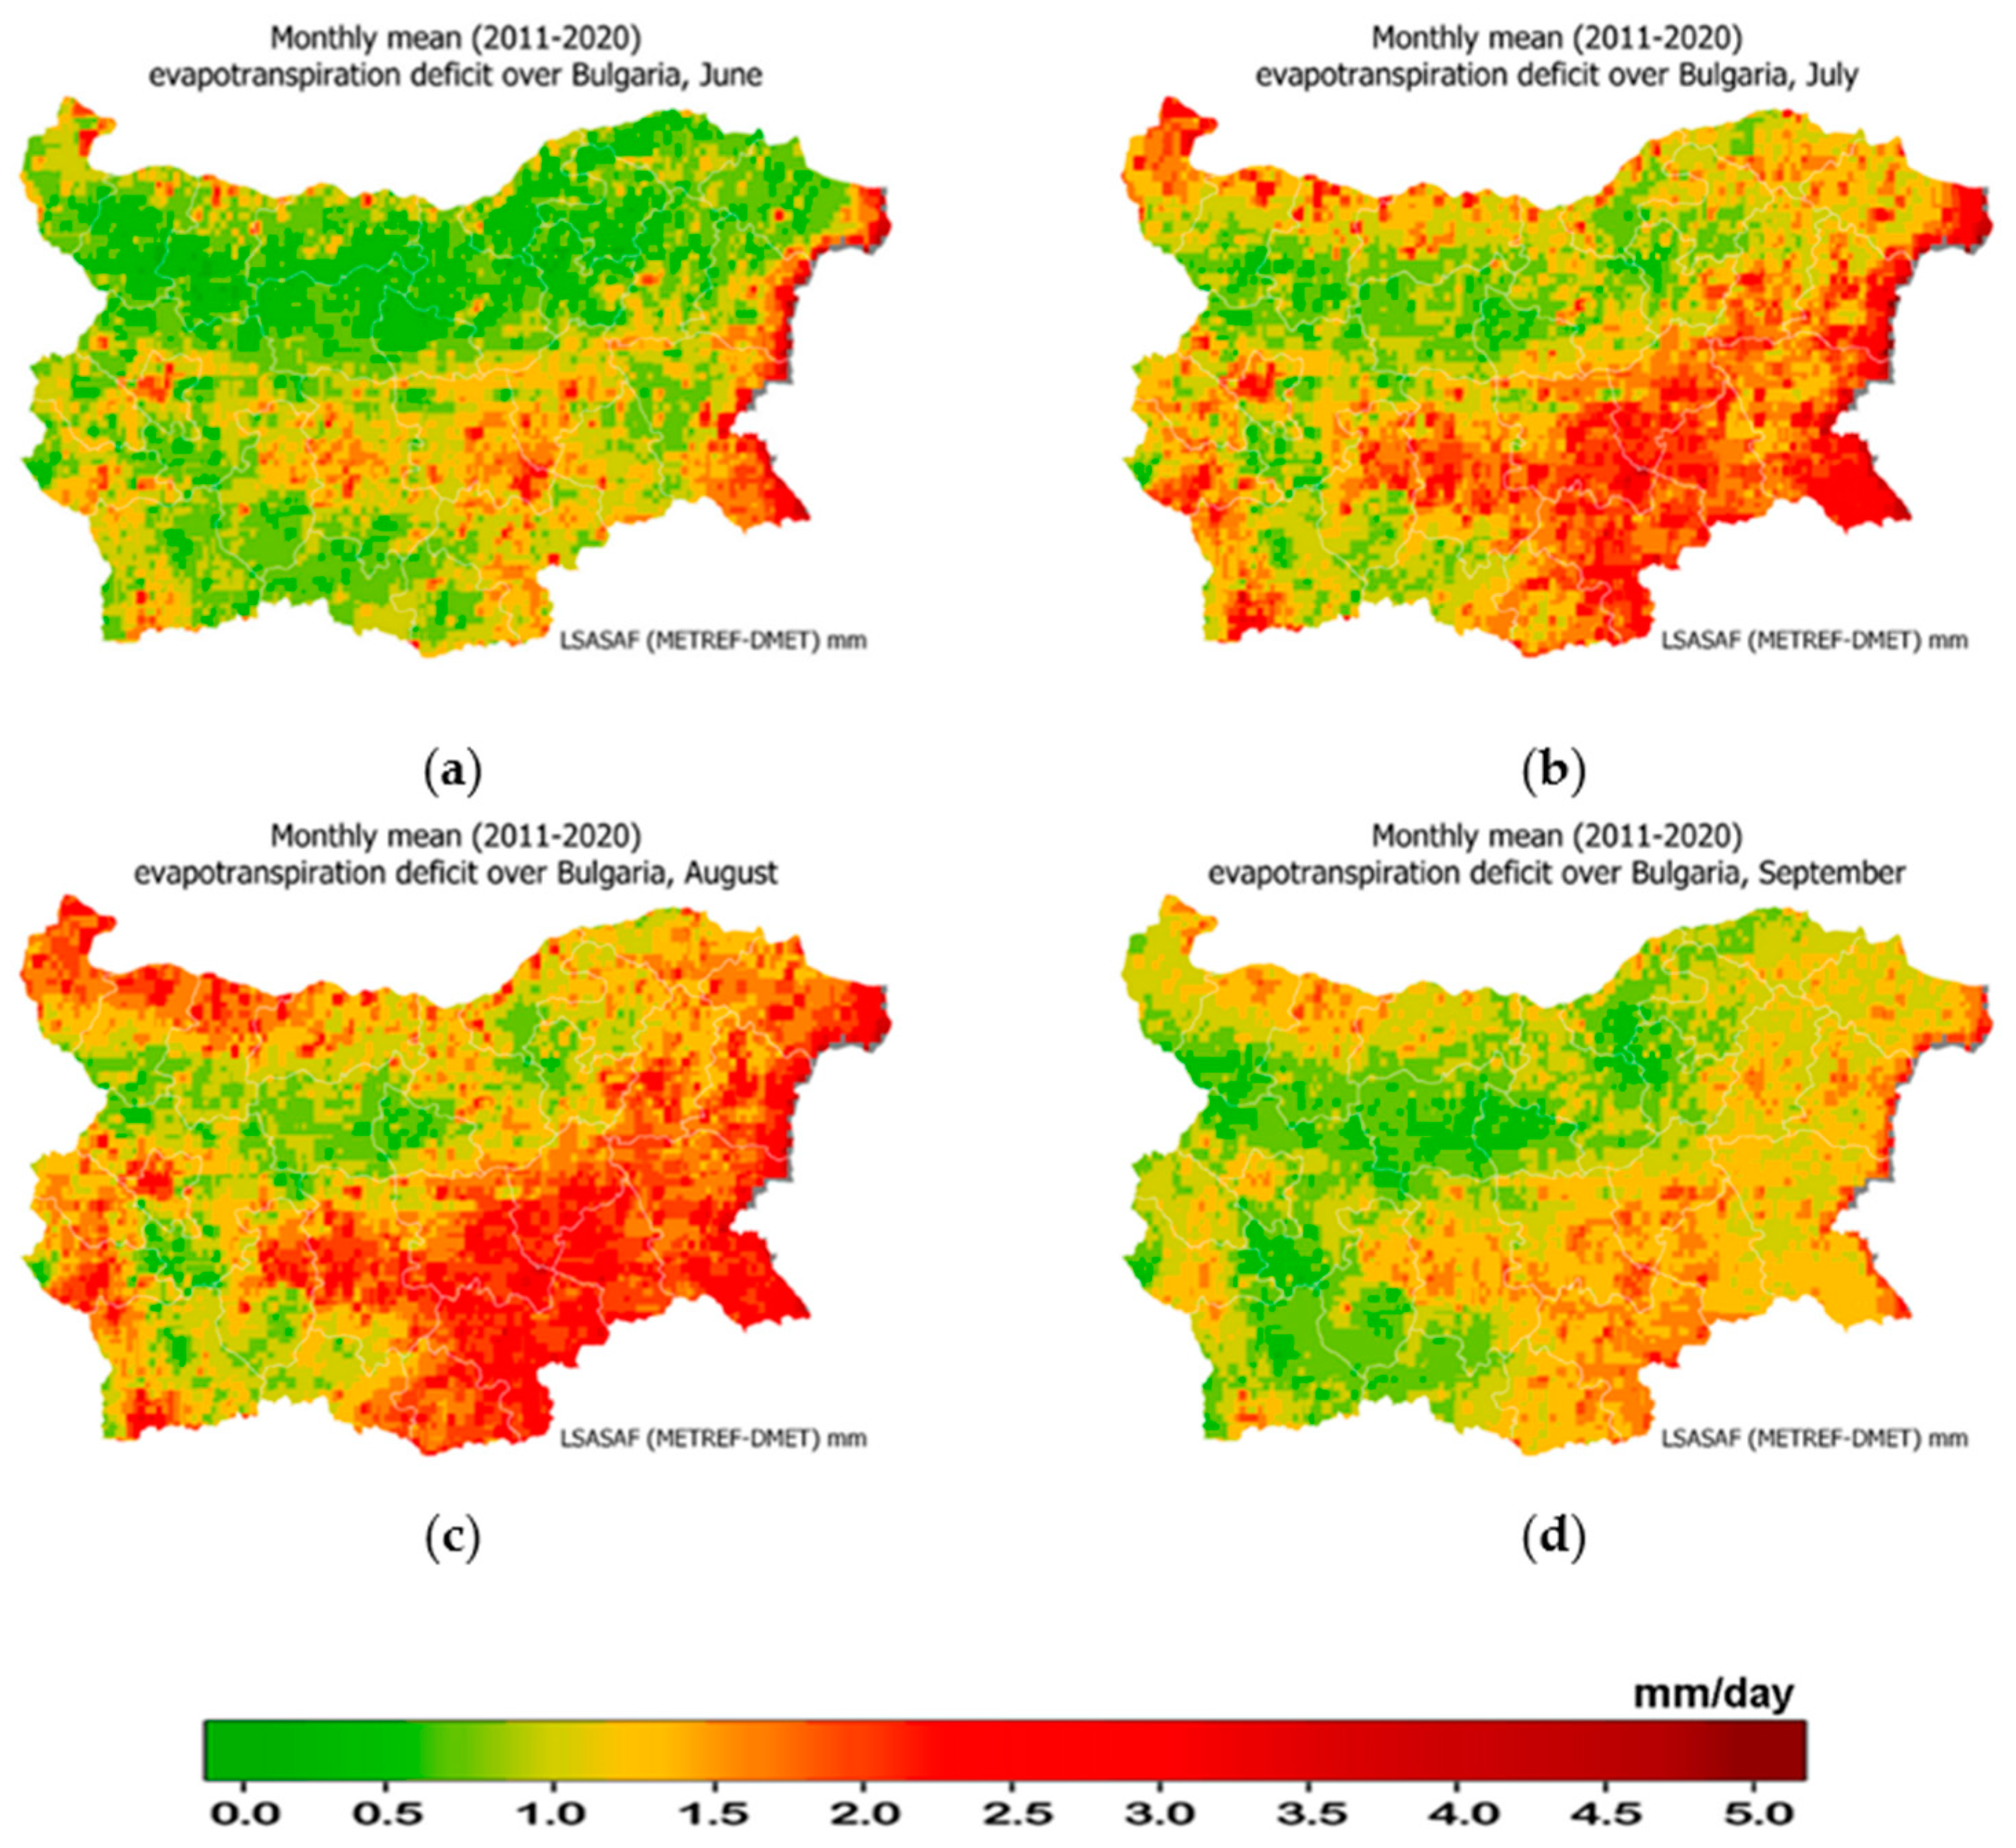
3.1.3. Seasonal Variability in Evapotranspiration Deficit

To obtain a first impression of the regional vegetation water stress in Bulgaria, the evapotranspiration deficit (ED) and its seasonal variability on a short-term climatic sale (2011–2020) were evaluated. The ED is considered to be a more relevant characteristic than solely considering AE or PE from ecophysiological perspectives [37]. The mean series were built by taking the average of the data for each ECMWF model grid point and then calculating the regional monthly means used to characterize the spatiotemporal distribution of ED (Figure 4). Color-coded maps were constructed and seasonal dynamics (May–October) could be evaluated (here illustrated only for June–September). A decrease (increase) in this variable implied that the PE and AE were moving closer (further part) but did not necessarily mean that these variables had contradictory trends. In June (Figure 4a), the greatest amount of PE was converted into AE, resulting in a predominantly “green” color for the region (with up to 1.5 mm/day evapotranspiration difference). Analyses revealed that the spots with higher evapotranspiration deficit were localized mainly in the southeastern part of the target region; their onsets were in July (Figure 4b) and they intensified in August (Figure 4c) when the greatest amount of PE was not converted into AE due to the SMA deficit, which in turn was reflected by high ED, implying high vegetation water stress in the “red” colored areas.
Regarding agronomic and eco-physiological terrestrial systems, the ED can account not only explicitly for the atmospheric evaporative demand but also for the water transferred to the atmosphere from the soil and vegetation, which physiologically explains the vegetation behavior and activity [22,27,37]. The soil moisture deficits could result in stomatal closure to avoid additional water deprivation. If the deficits become high enough to reduce soil moisture below the wilting point, plants will be under stress and may die as a result of vascular damage [90].

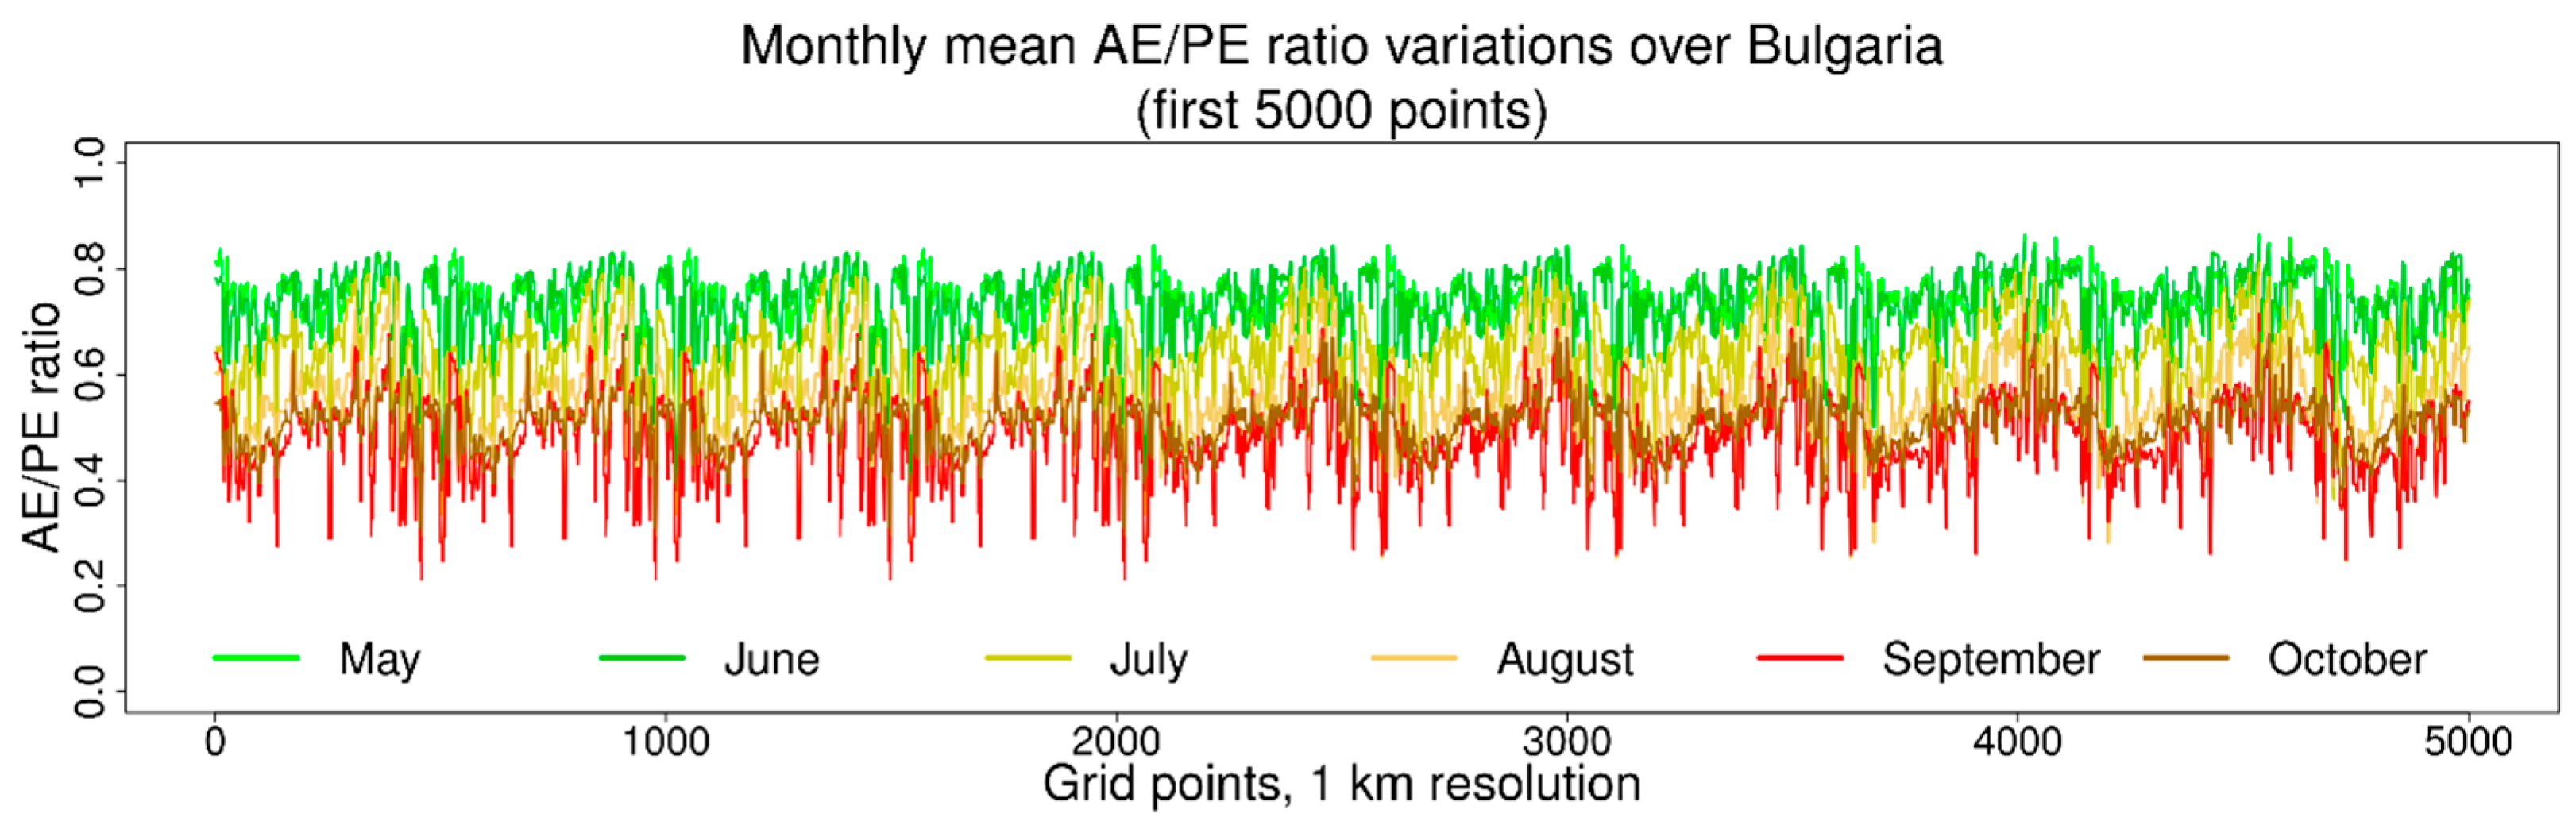
3.1.4. Seasonal Course of Evaporation Ratio

The seasonal dynamics of the evaporation ratio (Equation (2)) were evaluated on the basis of the monthly mean values from the satellite LSASAF (METREF/DMET) products at the ECMWF model grid points. Figure 5 shows a comparison for the May–October dynamics on the basis of 5000 points of downscaling over the northwestern part of Bulgaria after re-gridding the visualization of the product in Figure 4 to a 1 km evaporation ratio. In general, the AT/PE ratio has a value between 0 and 1 as, in the case of soil moisture close to field moisture capacities, AE ≈ PE; for soil moisture at the permanent wilting point, AE ≈ 0. In line with this, during May and June, AE/PE ratios indicated that there was no water stress environment, and the values were above 0.6 and reached up to 0.8 (with some being higher). From August, the values decreased (varying between 0.5 and 0.3), indicating the establishment of persistent water stress. In September, the ratio became very low, dropping down to 0.2 (the red line in Figure 5), and mean values in some grids reached 0.2. The dynamics of the satellite-derived AE/PE ratio described the changes in the vulnerability of vegetation to water stress during the growing season well.

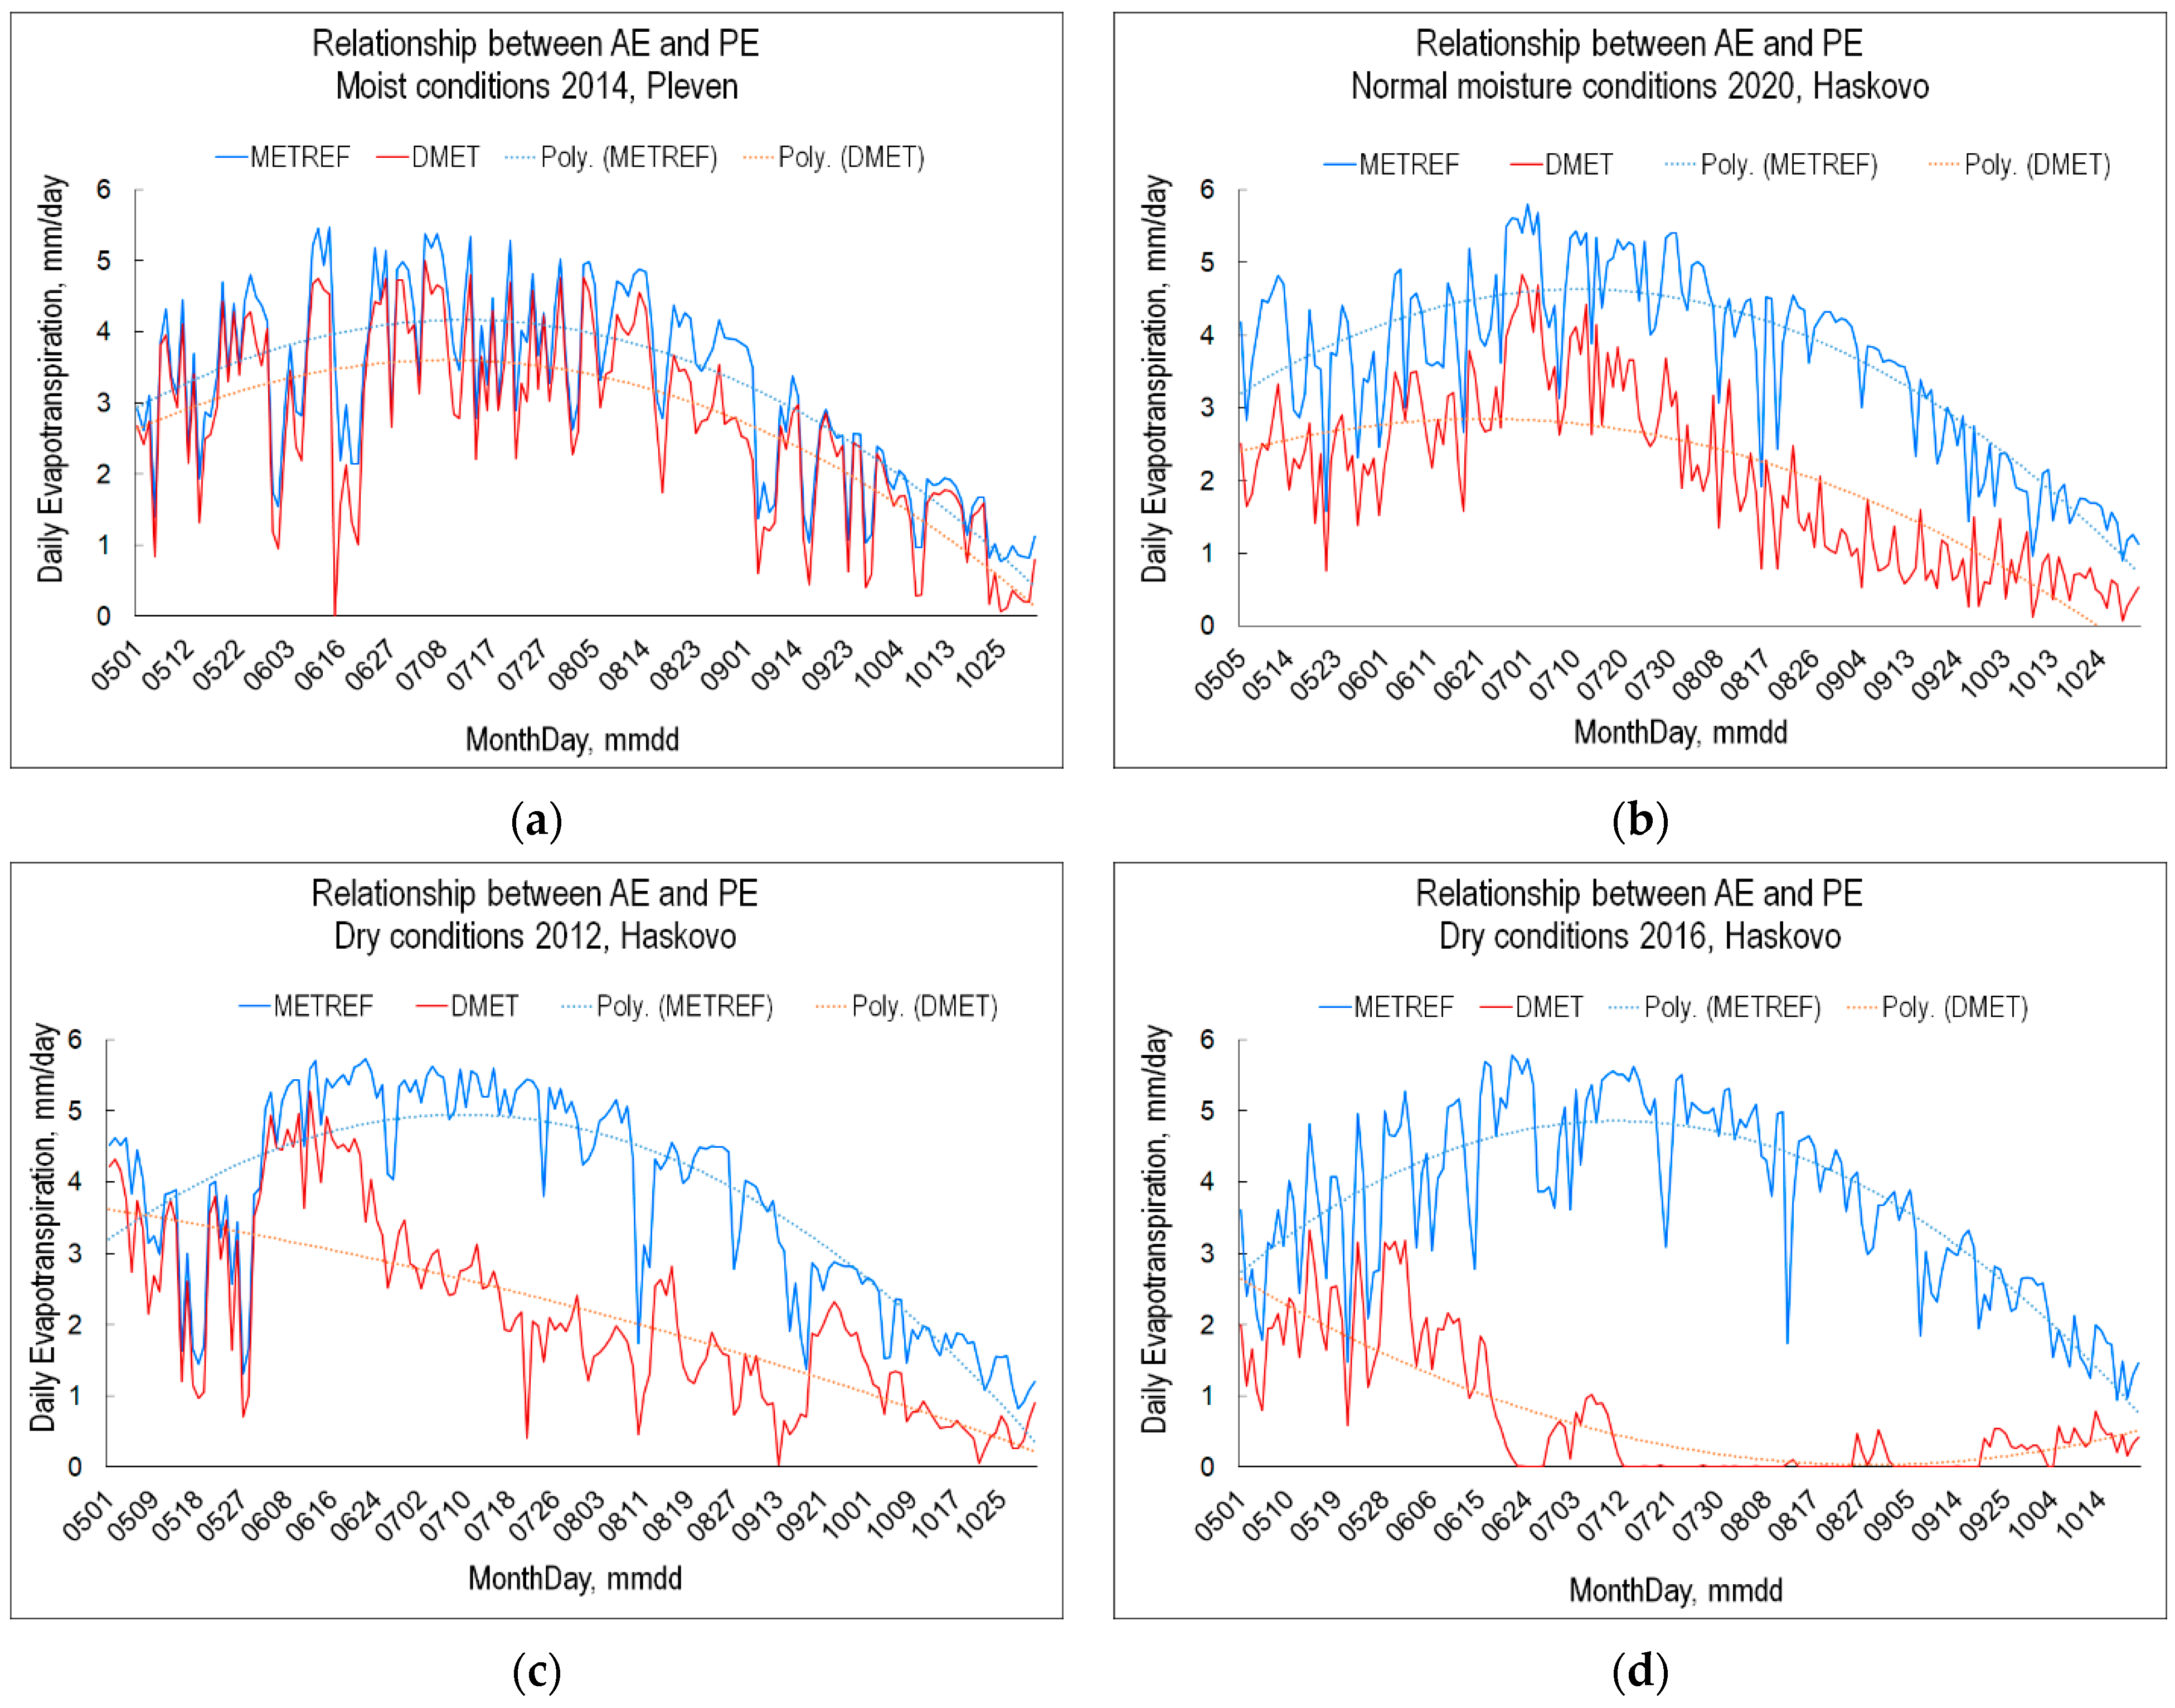
3.2. Parallel and Complementary Interactions of Potential and Actual Evapotranspiration

One way of objective drought monitoring using LSASAF evaporation products is to consider the existence and strength of the complementary relationship between PE and AE. In Figure 6, the concept of AE–PE relations is illustrated based on a comparison of the LSASAF DMET and METREF seasonal courses for two sites in the climate regions of the northern (Pleven site) and southern (Haskovo site) parts of Bulgaria in years with different soil moistening conditions. To analyze water stress using evapotranspiration metrics, the relationship between the PE and AE was evaluated in a common framework with a variety of environmental conditions.
The process of evapotranspiration is mainly controlled by the SM, and it also depends on the air temperature and humidity near the Earth’s surface. The seasonal courses of these evapotranspiration drivers are shown in Figure 7a,b,c. Since the effects of drought in the Mediterranean region are very apparent in July and August, it made sense to conditionally distinguish the years across three categories with regards to the SMA for the vegetation in this period:
  • Wet: SM significantly above the wilting point during July and August (blue curve in Figure 7a);
  • Normal: SMA persistently positive during July and August (green curve in Figure 7a);
  • Dry: SMA persistently negative during July and August (red and black curves in Figure 7a).
In years with periods in which the SM is consistently above the field moisture capacity (e.g., 2014; see Figure 6a), AE and PE show parallel behavior, with a rising trend up to the early summer and then, with the drying of the land surface in August, a shift to a decreasing trend. For the case in which full SM capacity conditions dominate (Figure 6a), the AE and PE curves are very close each other. The same parallel relationship can be observed for normal moisture conditions in 2020 but with a significant difference between the two quantities (Figure 6b) due to the complementary relation existing between PE and AE: with the surface drying, the decrease in AE results in an increase in PE through alterations to air characteristics. In other words, the energy not used for evaporation (as a surface dries out) affects the temperature and humidity of the overlying air, which, in turn, increases the potential evaporation in a prescribed manner, yielding the complementary relationship [91,92].
In years with dry periods in spring and early summer, the SMA of the landscape is limited (e.g., 2012 at the Haskovo site; see Figure 6c), and the opposite trends can clearly be seen for the AE (decreasing) and PE (increasing) in June and July (Figure 6c,d). In August, the METREF showed a decreasing trend because, in the LSASAF algorithm, the net radiation is inferred from the incoming solar radiation. However “surface dryness” affects the actual net radiation, and when the surface is dry, the surface temperature is relatively high compared to reference conditions. This implies an upper limit for the rising METREF values corresponding to a given level of drought, beyond which METREF values do not increase, even though DMET decreases.
Comparing the years with dry conditions shows that 2012 and 2016 (Figure 7a) exhibited similar trends for SMA, including large periods without SMA in the vegetation, but in 2016 there was a stronger decreasing trend in the DMET, and no significant change in METREF values could be observed. Data from meteorological observations from the synoptic stations reveal that the reason for this difference was the significantly higher air temperature (Figure 7b) and, especially, air humidity (Figure 7c) in 2012. Assuming that SMA derived using the SVAT model is the reference for drought conditions, it can be concluded that there was sustained drought in July–August in both 2012 and 2016, but the DMET model from LSASAF overestimated the AE in 2012. Alternatively, the decrease in the DMET could be considered as an indicator of drought, and it could be assumed that the SVAT model underestimated SMA in the case with higher air temperature and humidity in the summer of 2012. Taking into account these results, the model-derived metrics of drought have to be considered carefully and the conclusions verified using independent sources of information.
To underline the parallel courses of the AE (DMET) and PE (METREF), their short-term climate trends in relation to SMA were evaluated (Figure 8). Smoothed spline lines are used for the AE and PE to indicate the statistically confirmed descending slope for the evapotranspiration deficit with the increase in SMA (respectively, the decrease in AE deficit). Since the PE is the upper limit of the evapotranspiration for vegetation in a given climate, if the water supply available is less than the PE requirements, the deficit will be drawn from soil moisture storage until SMA is reduced. Beyond this, the AE will be significantly lower than the PE, until the SM wilting point is reached and evapotranspiration ceases. Depending on the microclimate, the ED (the green line) can vary, as can be seen by comparing Figure 8b,c. Complementary regional PE–AE dependences were confirmed throughout the entire ranges of energy and moisture availability at all other (26) synoptic stations (not presented); specific linear regressions approximated a descending trend for the ED with the increase in SMA.

3.3. Evapotranspiration as a Climatic Drought Indicator

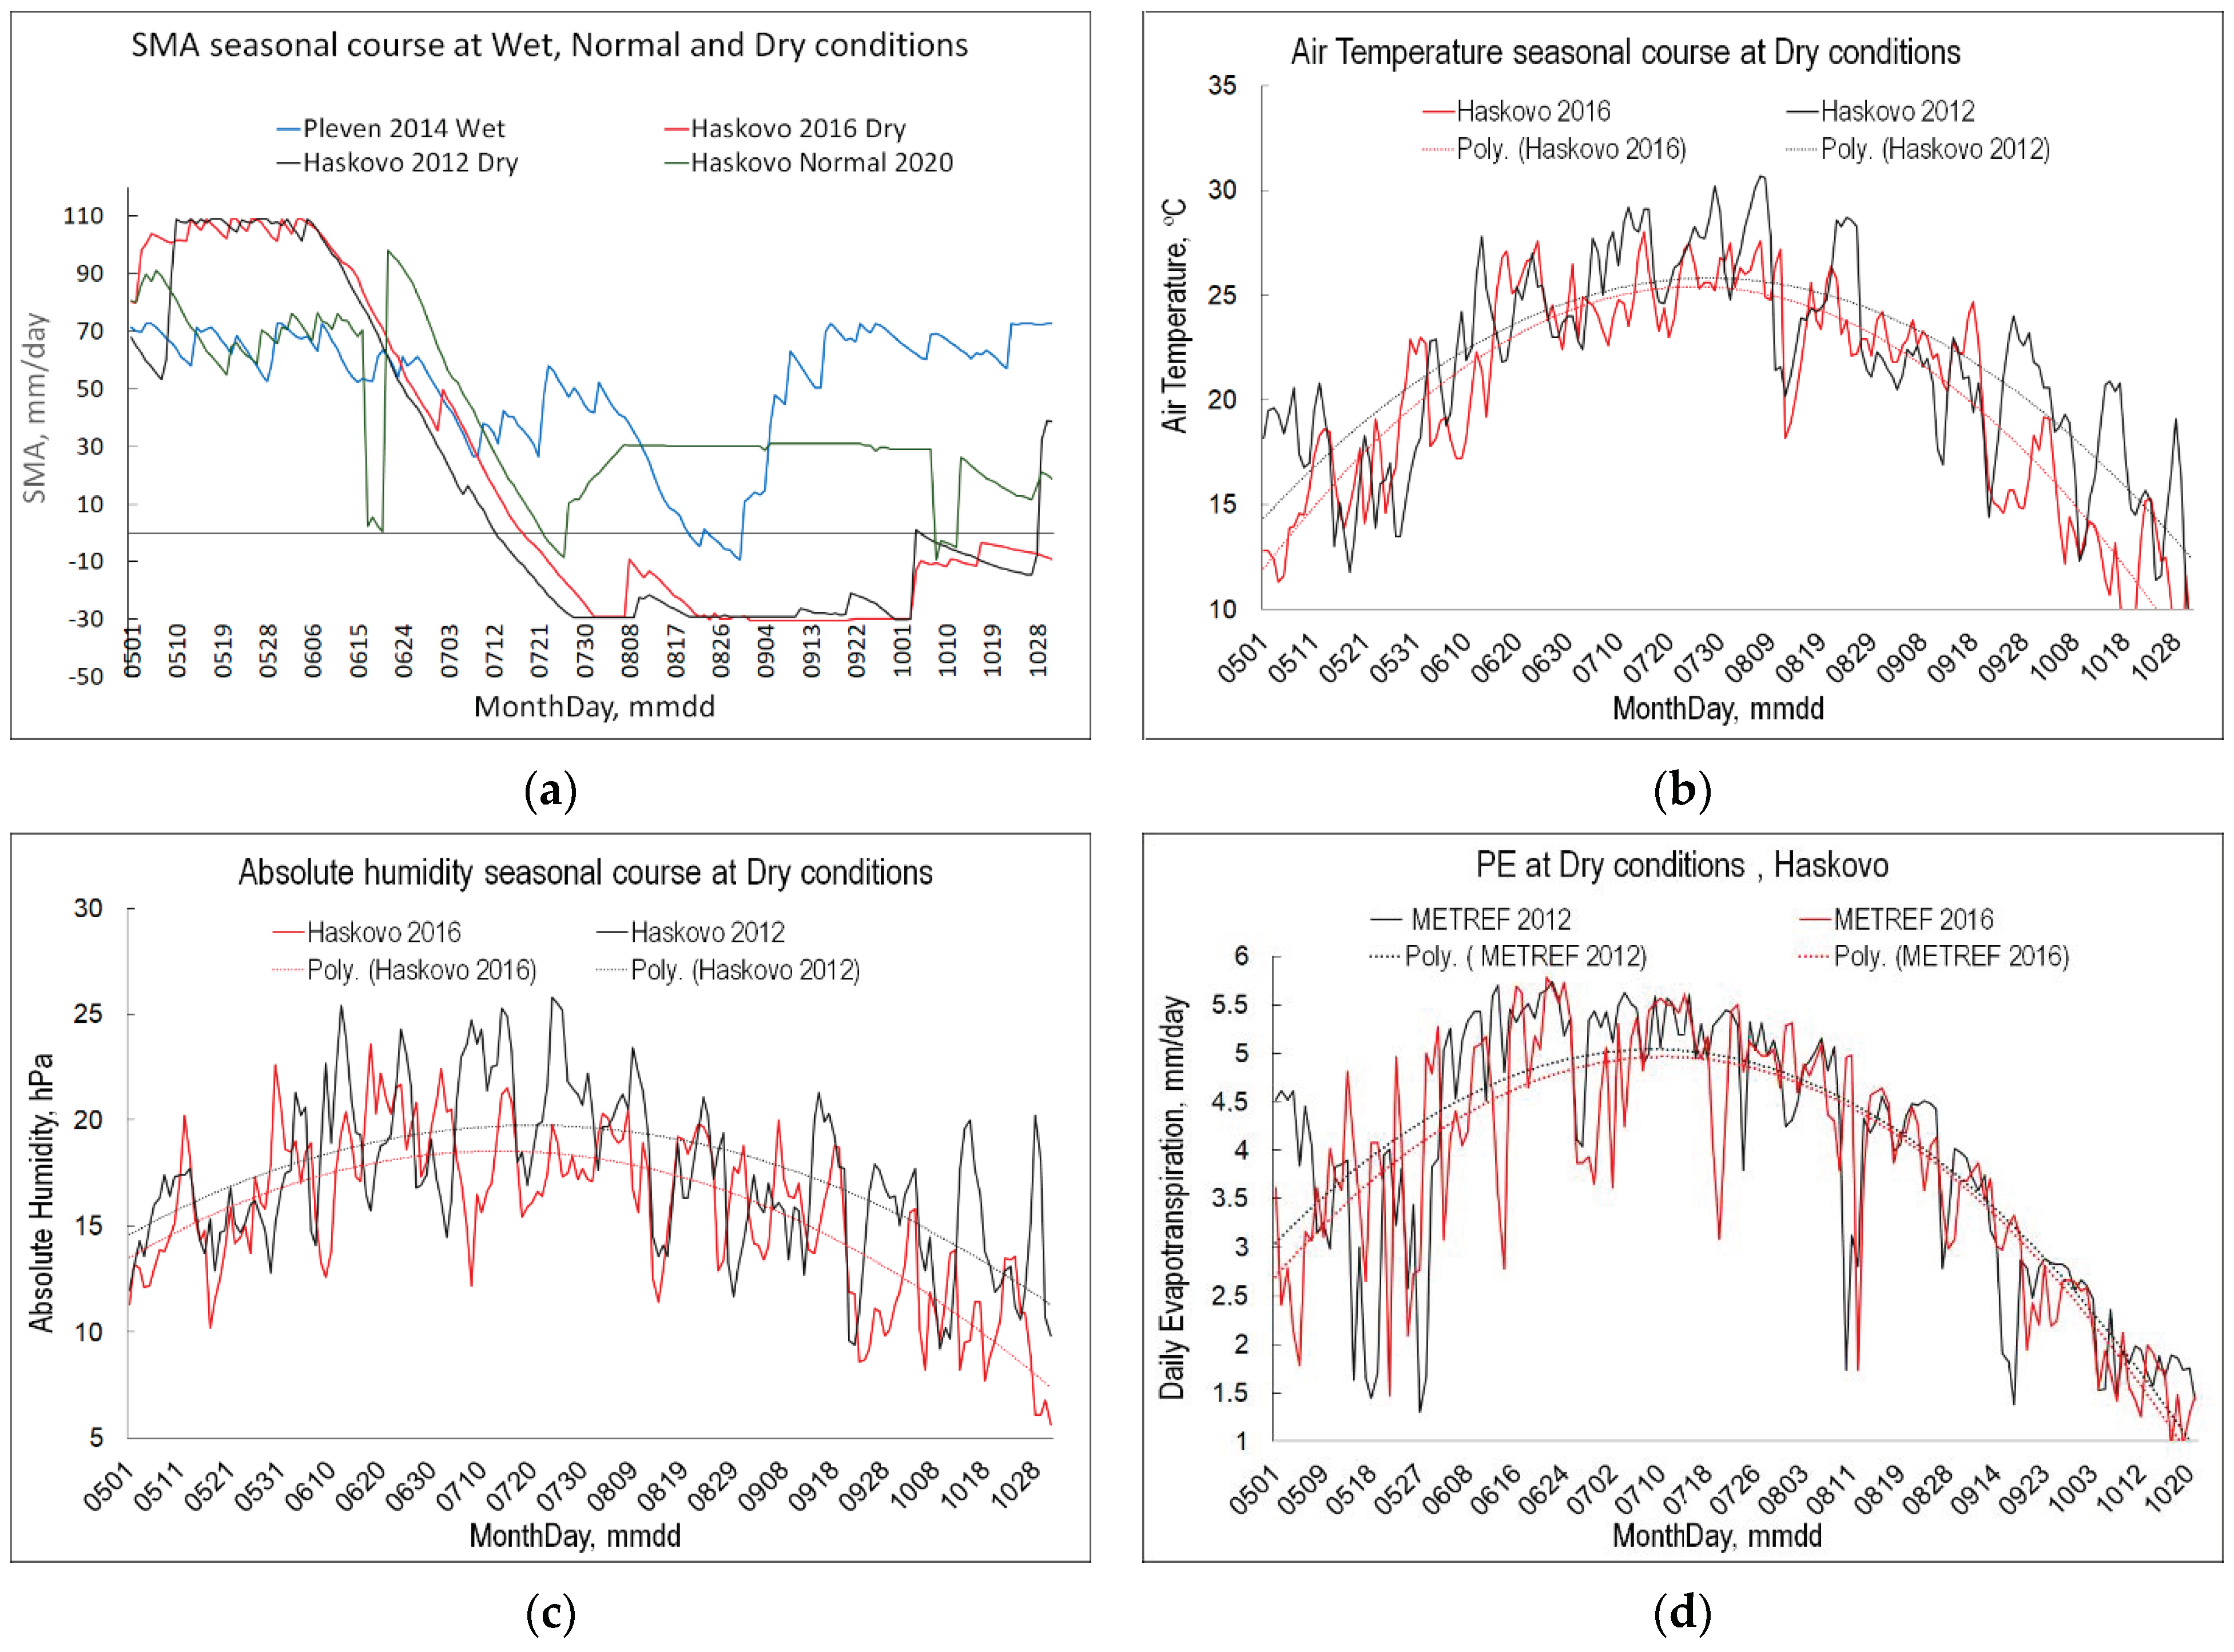
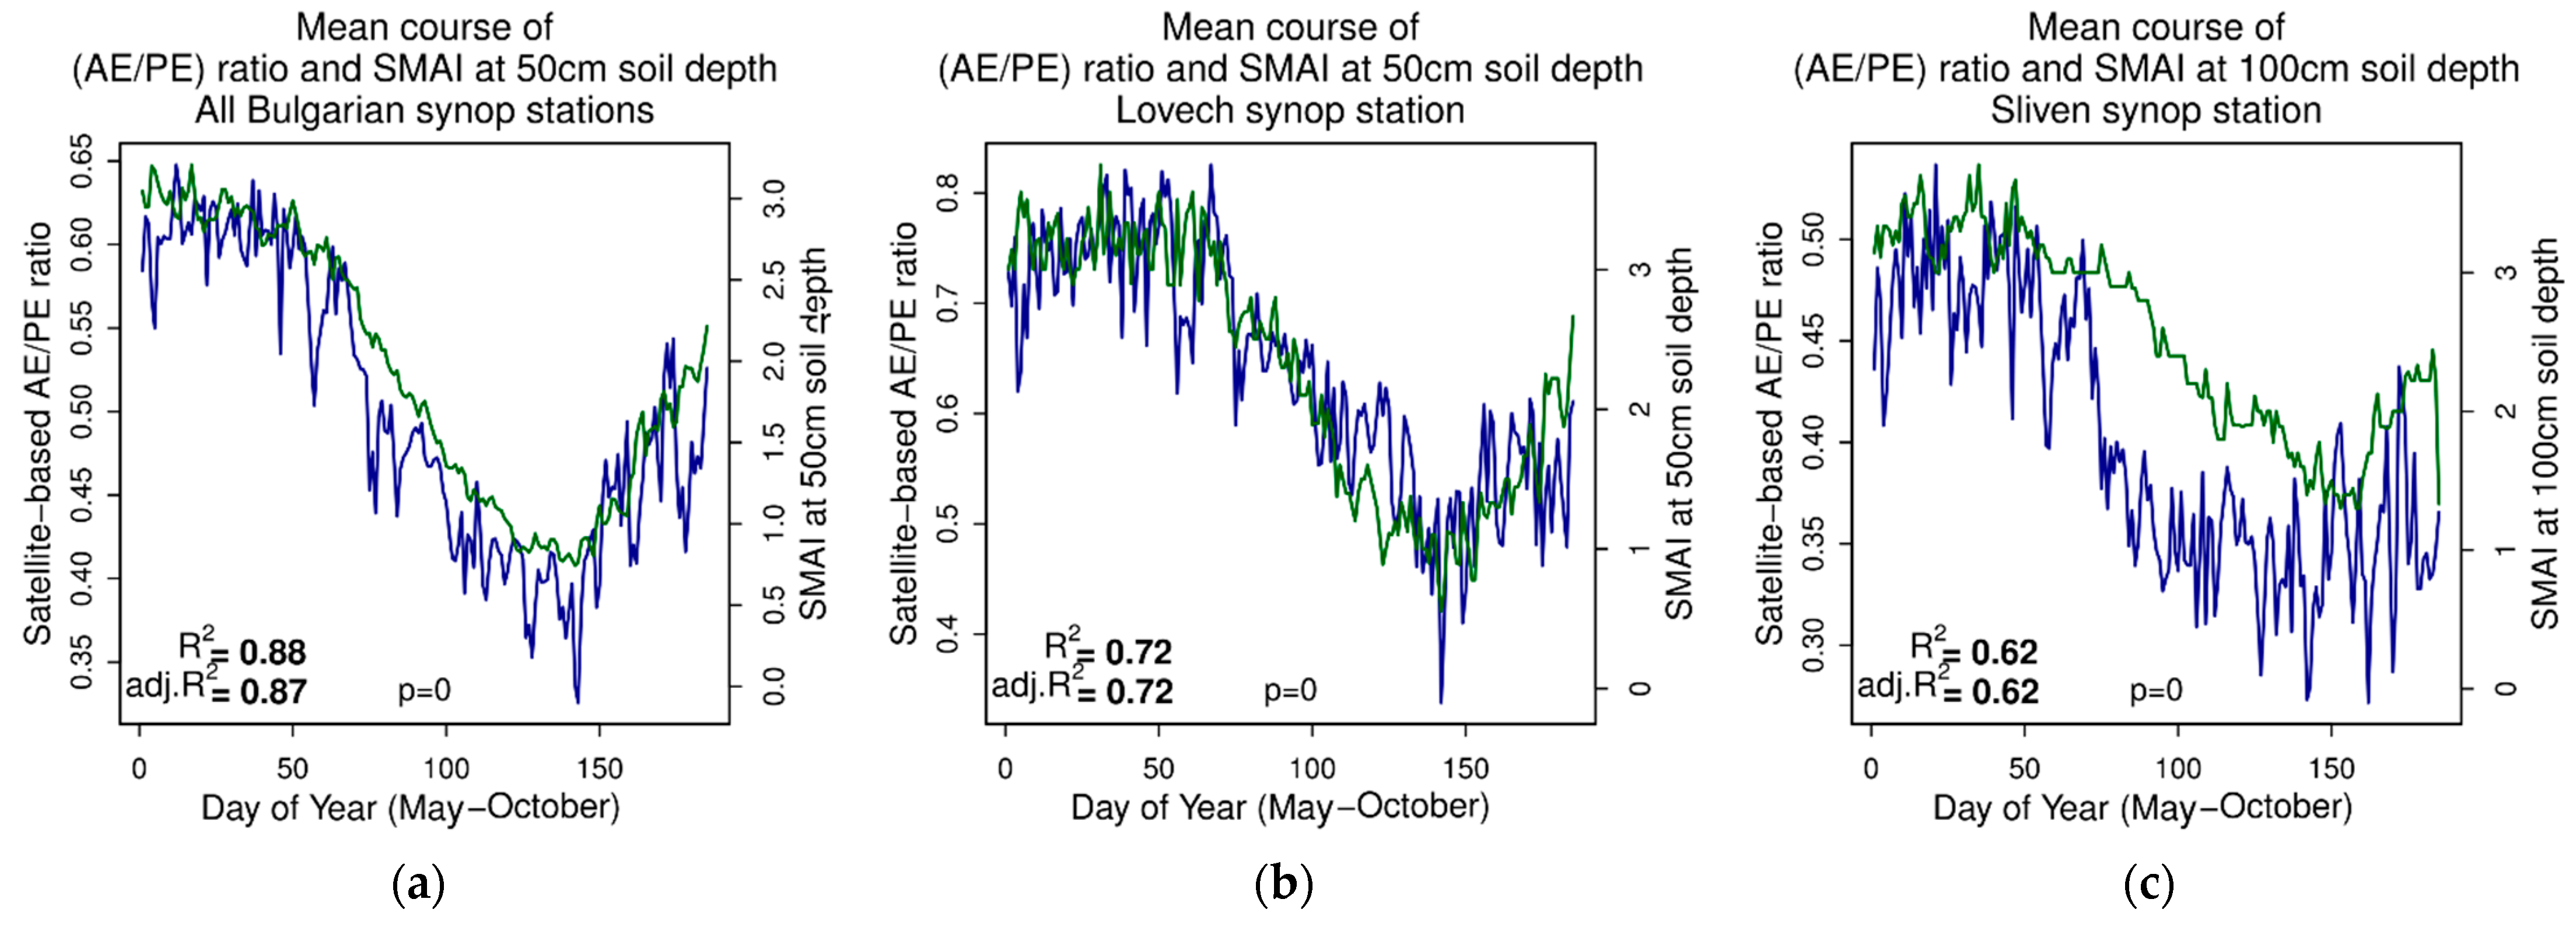
3.3.1. Root-Zone Soil Moisture and Vegetation Water Stress

A climate study with evapotranspiration as the drought indicator was performed through analyses of the relationship between SMA in the root zone and the satellite-derived AE/PE ratio. Daily values for the SMAI and satellite-derived evapotranspiration ratio during the growing season (May–October) were compared for the 2011–2021 period. Calculations were performed for the regions where each synoptic station (n = 26) was located and with the dataset for the whole country. The analyses revealed synchronized seasonal behavior in the two indexes (Figure 9): at high SMAI values (optimal SMA) during May and June, the DMET/METREF ratio ranged between 0.7 and 0.8 and even higher, implying no vegetation water stress. At low SMAI values (indicating low SM content), the evapotranspiration ratio decreased below 0.5, even reaching 0.0 at the end of August and September due to the depleted SMA resulting from high AE, which also led to high vegetation water stress. Correlation analyses revealed good agreement between the two indexes, with high correlation R2 (and adjusted-R2) rankings between 0.88 and 0.54 and high confidence levels (p = 0) for all stations. This implicitly confirmed the spatiotemporal consistency between the evapotranspiration ratio derived from geostationary satellites and the drought (SMA) assessed with SVAT modeling. From another perspective, the high correlation confirmed the utility of LSASAF evapotranspiration products for the characterization of water stress. The only exceptions were stations in the coastal area of the Black Sea and the capital, where urban areas dominate over vegetation. Examples of high positive correlation are shown for the whole of Bulgaria in Figure 9a, north Bulgaria in Figure 9b, and south Bulgaria in Figure 9c. The mean daily values significantly varied at the site scale, ranging from 0.25 to 0.8 at the Lovech site and from 0.25 to 0.55 at the Sliven site.
The reported relationship between the SM and the AE/PE ratio on a regional scale is in conformity with the Budyko curve [93].

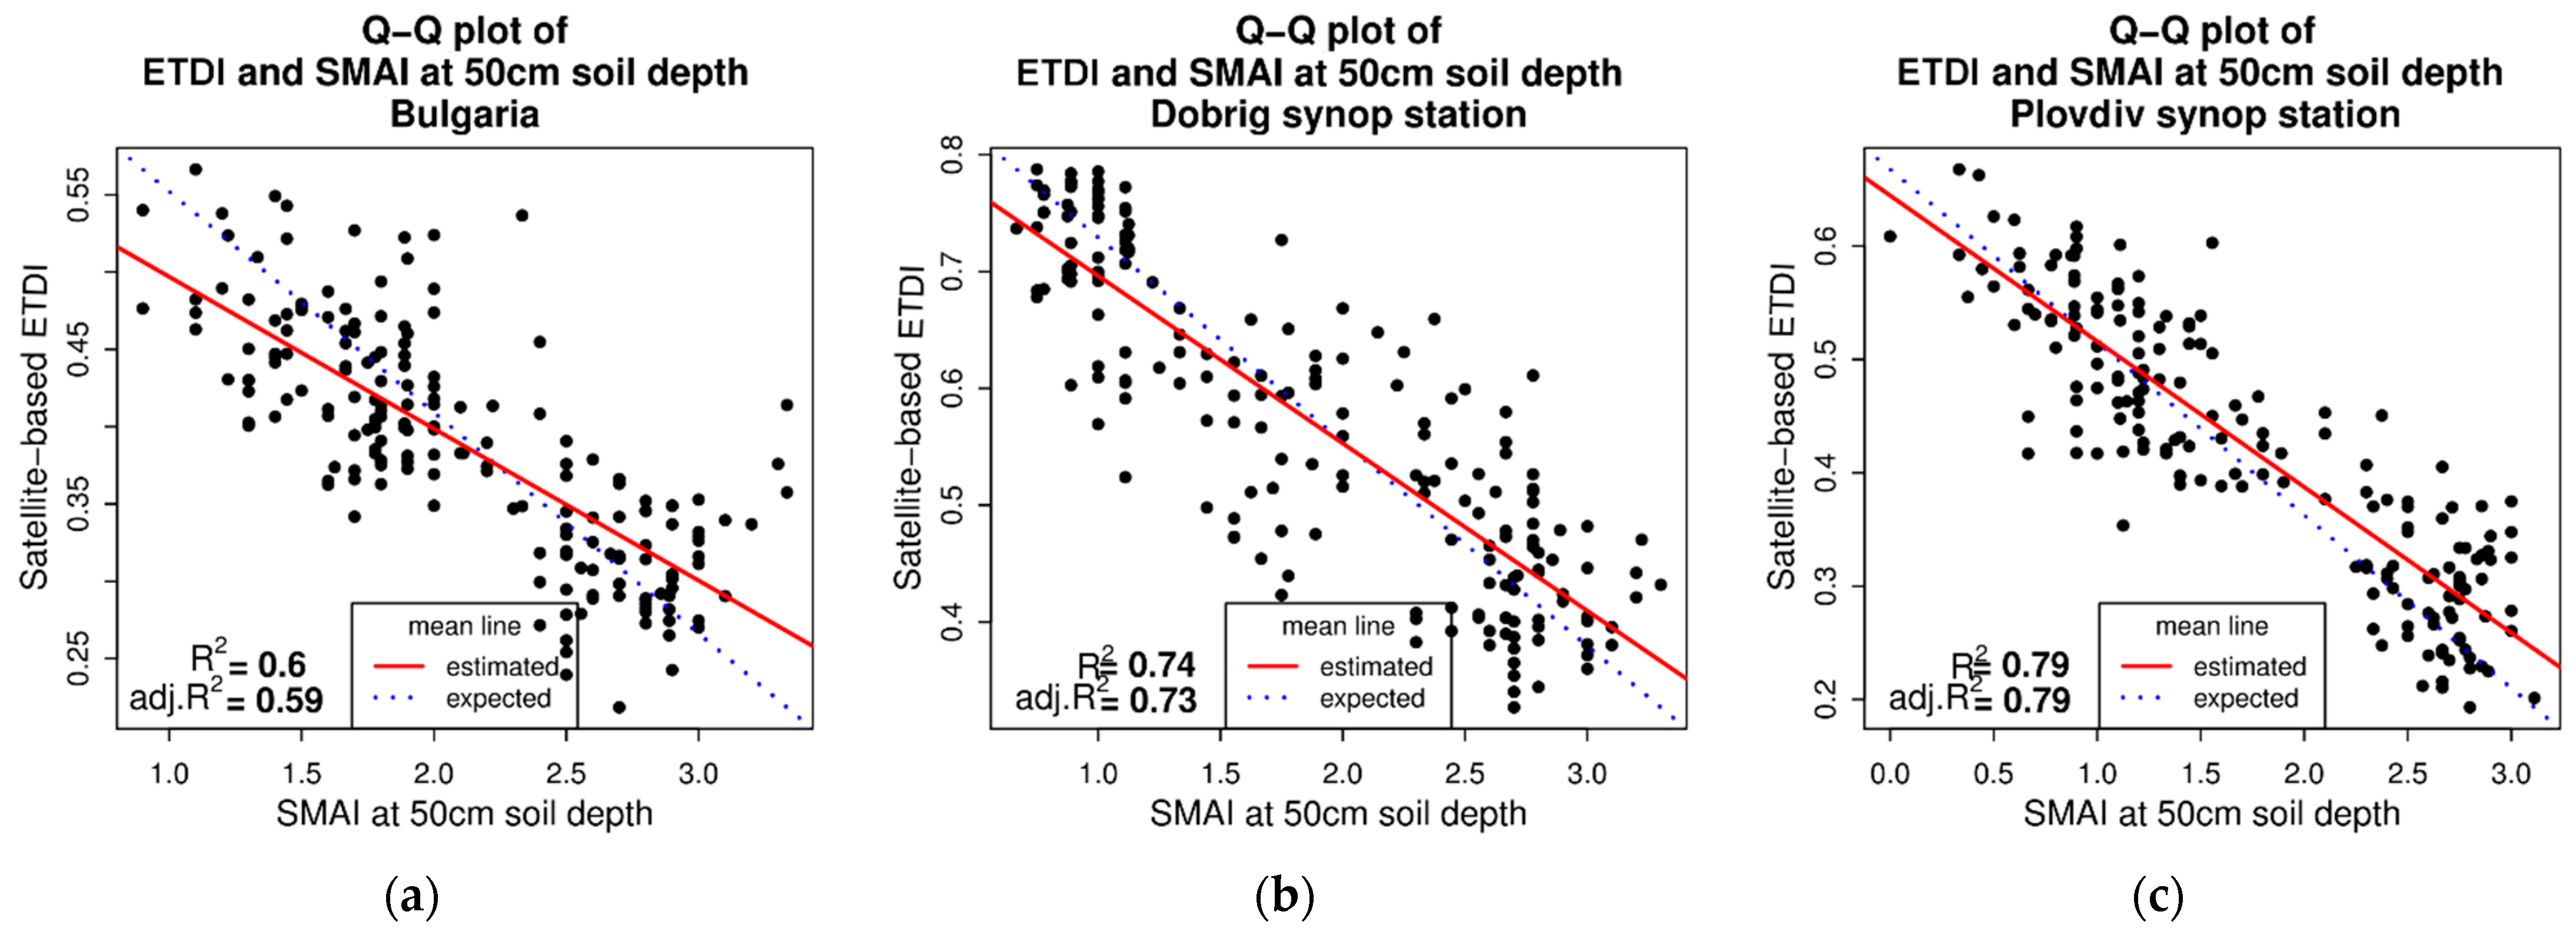
3.3.2. Quantile–Quantile (Q–Q) Plots of ETDI and SMAI Probability Distributions

To statistically characterize the relation between the probability distributions of the ETDI and SMAI, quantile–quantile (Q–Q) plots were constructed. Using monthly mean values for both indexes (ETDI and SMAI), Q–Q plots for the regions where each synoptic station was located were constructed. It appears that the Q–Q distributions were linearly related (Figure 10) with a high correlation (R2 between 0.54 and 0.88 for the different microclimates). The red line approximates the linear relation between the ETDI and SMA, visually indicating the deviation from the ideal diagonal (blue) line in addition to the indicated correlation on the plots. The curve pattern indicates that the ETDI increases with a slight delay with the decrease in the SMAI. The high correlation coefficient of the probability plot indicates a high level of agreement for the fitted quantile–quantile correspondence between the SMAI and ET drought indexes in relation to water stress.

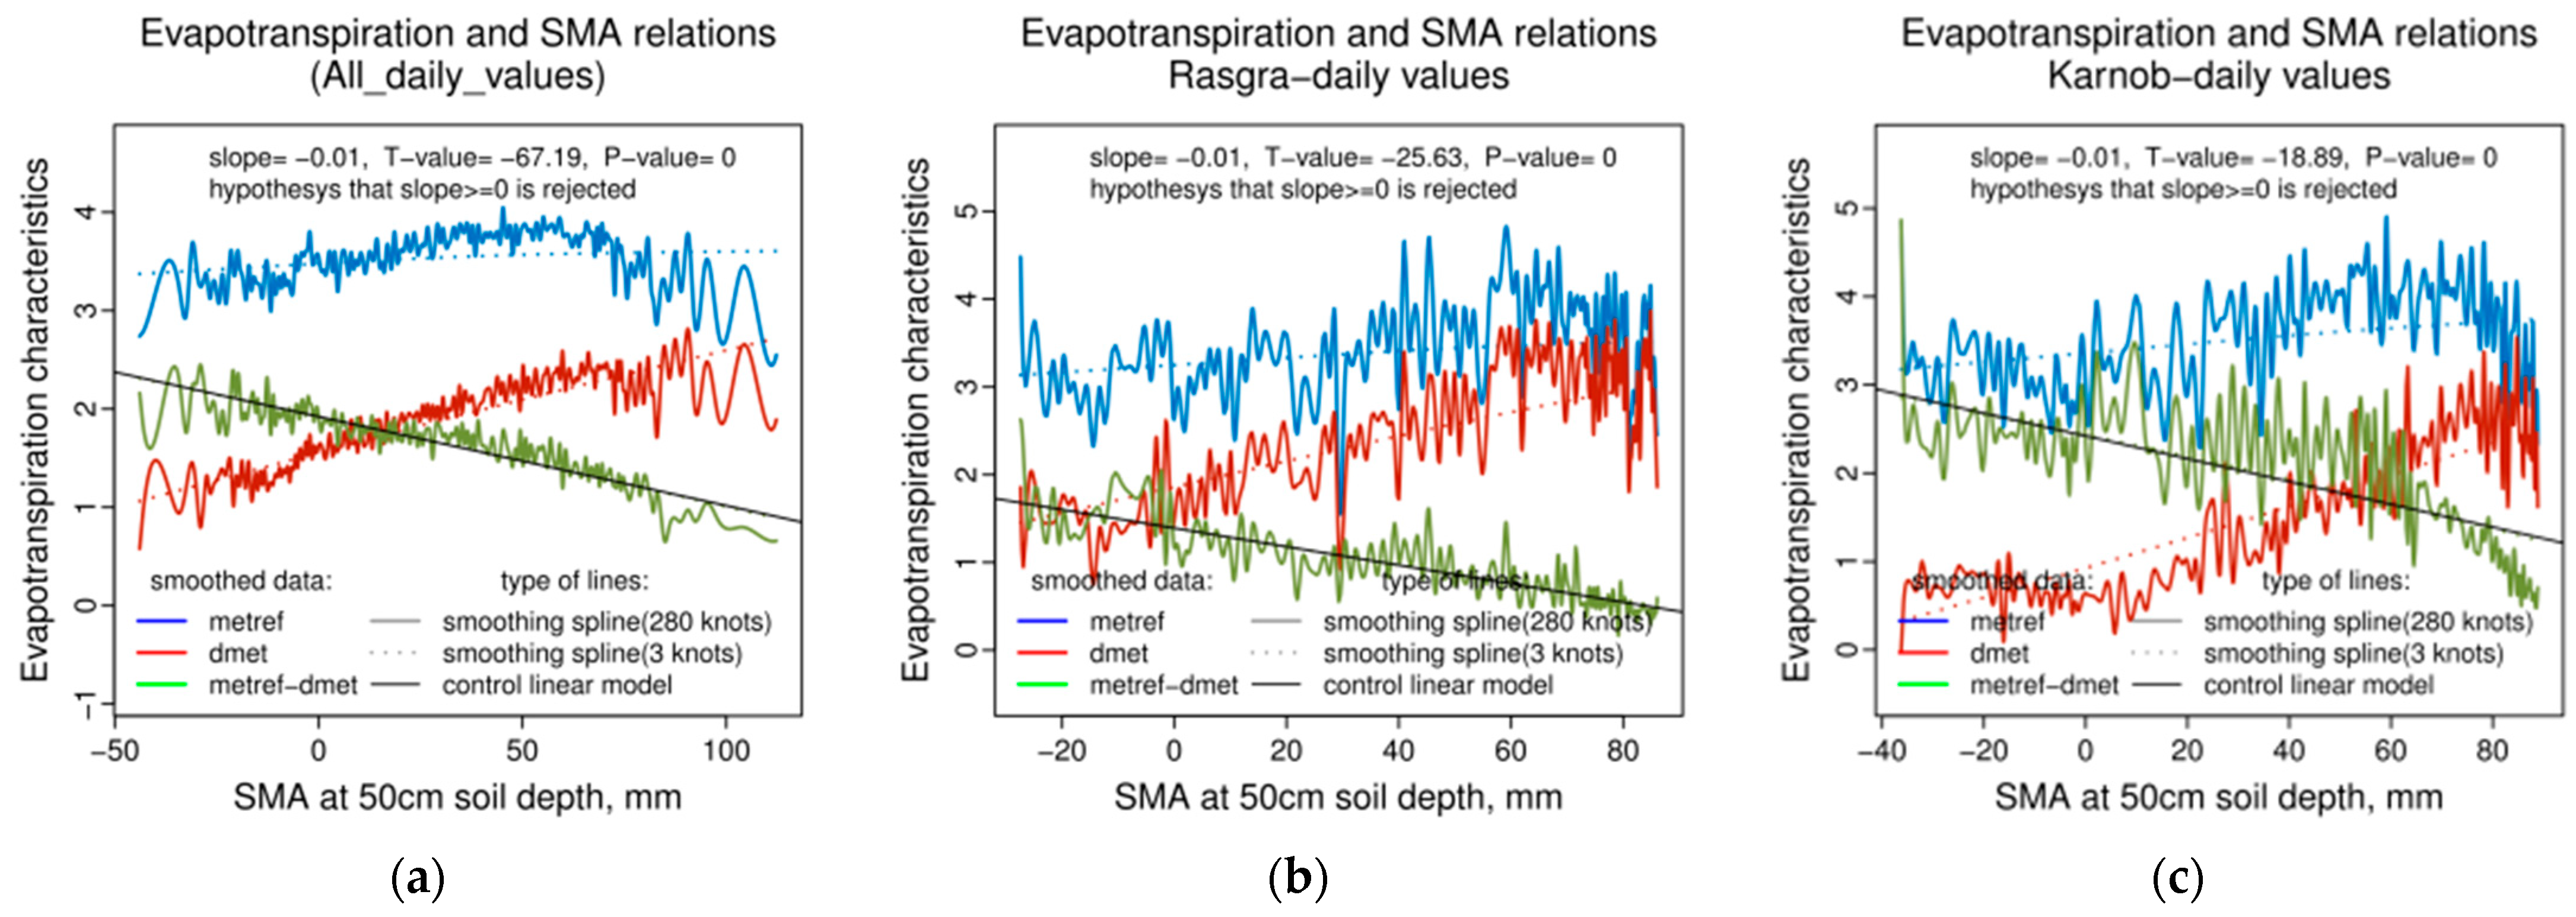
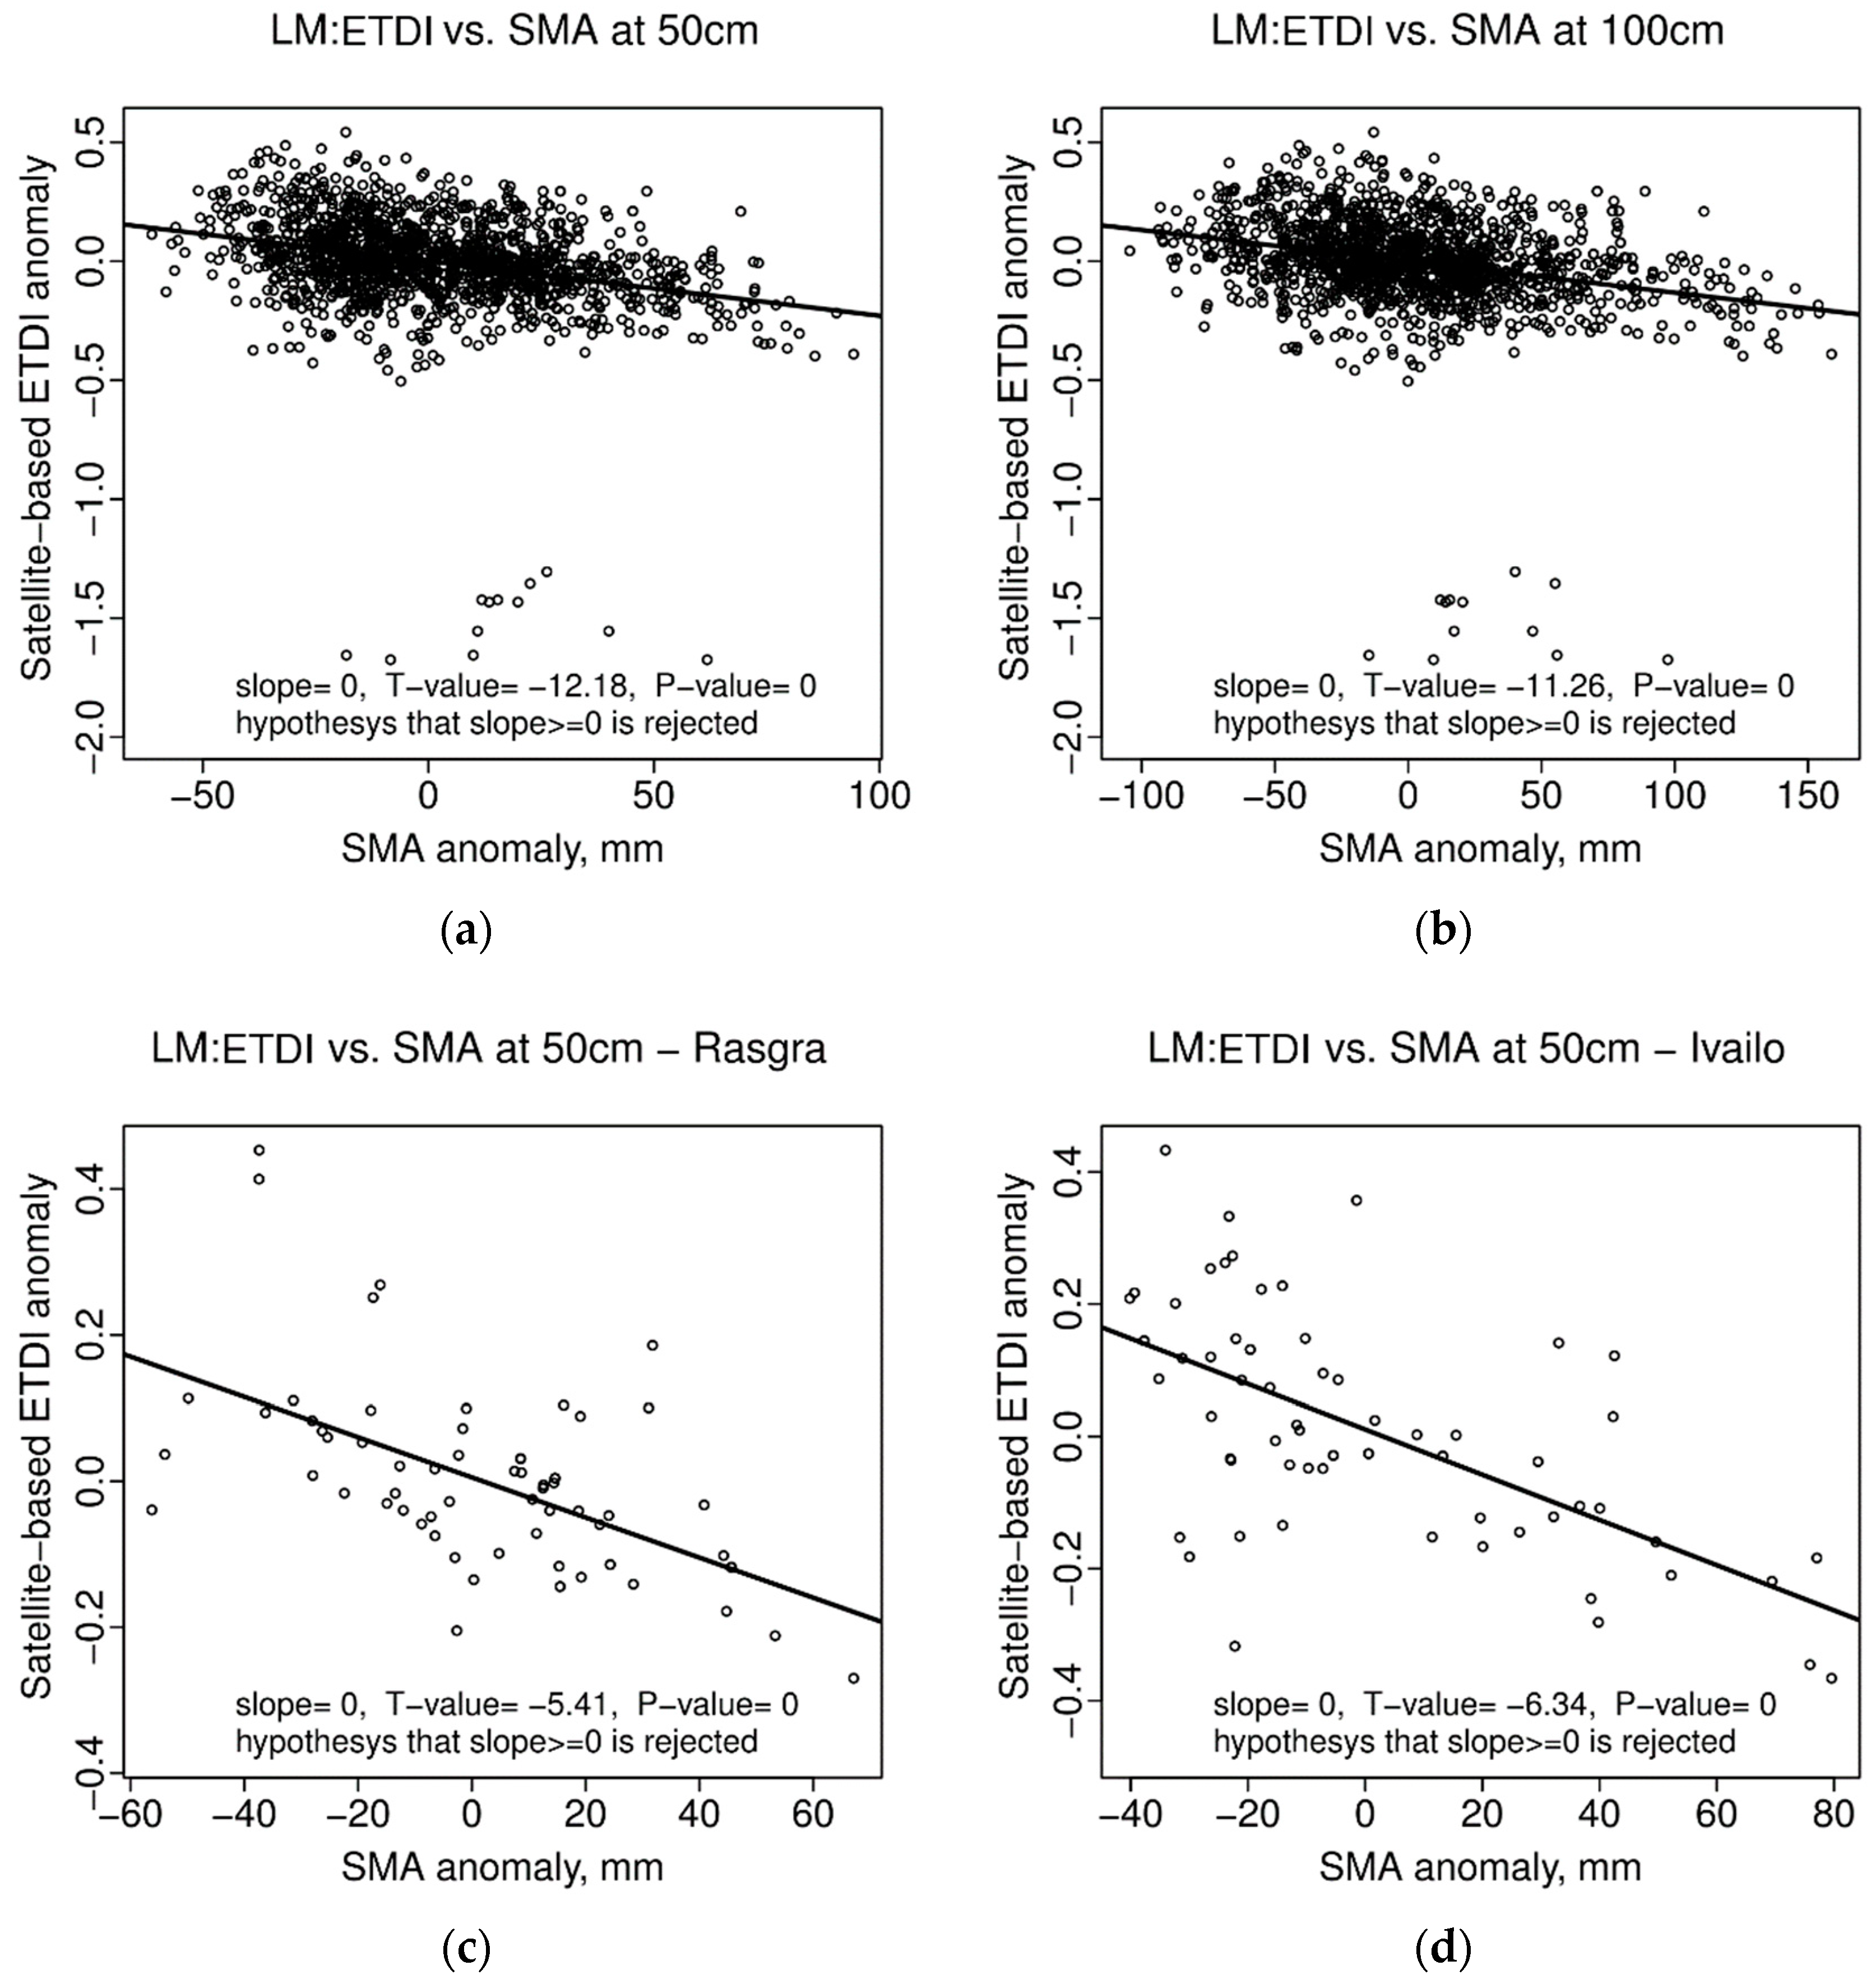
3.3.3. Trend Analyses for ESI and SMA Anomalies

Correlation analysis was applied to account for the correspondence between SMA anomalies and ETDI anomalies. Monthly anomaly values (regarding the 2011–2021 period) were calculated for the region where each synoptic station was located using the NIMH operational network during the growing season (May–October). Calculations were performed for soil depths of 50 cm and 100 cm along the root zone. Linear regression showed that a descending trend fit the relation between the anomalies in the SMA and ETDI. This trend was statically confirmed by a Student’s t-test showing a high level of significance, p = 0 (Figure 11).
There was a high degree of association between the dry SMA anomalies (negative values) and the higher evapotranspiration stress characterized by the ETDI positive anomalies. Linear regressions fit all the relations, including for the whole region of Bulgaria (for SMA anomalies at 50 cm and 100 cm root-zone depths) (Figure 11a,b) and in site-scale analyses for the different microclimates of the synoptic stations (e.g., Figure 11c,d). Anomalies in evapotranspiration stress indexes can provide useful early signals of agricultural/ecological drought, and the utility of their satellite-based versions in characterizing SMA in the root zone and drought severity is here illustrated.

4. Discussion

As evaporation of water is an energy-demanding process, increasing ET rates decrease the surface temperature of leaves and ecosystems, which leads to corresponding changes in the energy balance of the vegetated land surface. Thus, evapotranspiration can serve as a measure of the dynamic functional coupling between the energy and water cycles of ecosystems and contribute to identification of the vegetation water stress and SM drought. This approach deserves special attention in regions with Mediterranean climatic influences where water deficit might be a serious problem for vegetation sustainability.
Monitoring land surface drought using evapotranspiration based on satellite observations is a challenge. Basic theories involved in the current use of remote sensing for ET estimates [94] have generally been applied at the regional scale [95] and nowadays provide global coverage. Infrared observations from the IASI instrument on European polar-orbiting meteorological satellites have been used to design a water deficit index and associate it with the rate of evapotranspiration to study the meteorological drought over southern Italy as a result of the 2017 heat wave [96]. LSASAF ET products are beneficial due to the high temporal resolution and near-real time observational information, which are essential for detecting early signals of vegetation water stress. However LSASAF evapotranspiration information (daily DMET and METREF products, as well as an ET product, each 30 min) from geostationary satellites is still rarely used for drought monitoring. The LSASAF ET product has been used for calculation of the AE/PE ratio for Europe [97] during two drought episodes in spring/summer 2007/2011. Synchronized behavior has been reported with the SPI [12] and SPEI [29] meteorological drought indexes.
The current work is the first to use long time-series of LSASAF METREF and DMET data retrieved via geostationary satellite observations to analyze and monitor drought occurrence in a region with strong land–atmosphere coupling in SEE. Two key aspects of the drought problem not systematically reflected upon in the literature are: (i) the evaluation of the consistency between evapotranspiration water stress and the related SMA deficit; (ii) the applicability of Bouchet’s hypothesis regarding these biophysical drivers of drought for SEE. Based on long-term (2011–2021) archive LSASAF data, it was shown that the AE/PE ratio can reflect the climatic demand in relation to the soil water supply: a strong correlation between the AE/PE ratio and SMA at a high significance level (p = 0) was obtained for the regions of all synoptic stations (Figure 9). However, the extent of the variability in the ratio, as a measure of a specific regional vulnerability to drought, depended on the site microclimate. Mean values from all stations (Figure 9a) varied between 0.65 and 0.34; for north Bulgaria (Figure 9b), they were between 0.8 and 0.25, while the seasonal dynamics of south Bulgaria (Figure 9c) ranged between 0.54 and 0.27. The selected regions were used only as examples of the ratio variability, not as typical for different parts of Bulgaria.
The quantile–quantile (Q–Q) plot for the probability distributions of the ETDI and SMAI indicated a linear relation (Figure 10) with a high coefficient of determination R2 (within the range 0.54–0.88 for different microclimates). Linear regression with SMA–ETDI anomalies statistically confirmed a high degree of association between the dry SMA anomalies (negative values at 50 cm and 100 cm root-zone depths derived with the SVAT model) and the higher evapotranspiration stress characterized by the ETDI positive anomalies (Figure 11a,b). Thus, anomalies in evapotranspiration stress indexes can provide useful early signals of agricultural/ecological drought, and the capacity of their satellite-based versions to reflect SMA anomalies in the root zone and drought severity was here illustrated.
In our previous study (Figure 6 [80]), a strong negative linear regression between land surface temperature anomalies (derived on the basis of LSASAF LST long-term datasets) and SMA during drought was reported. Moreover, dry spots represented by negative SMA anomalies appear to be associated with high positive LST anomalies that facilitate increased fire activity [98]. These hotspot locations identified in our prior studies where drought and fire activity were strengthened during separate years coincide (visually) with the regions with high evapotranspiration deficits reported in the current study (Figure 4).
To increase the added value of the current work, further work in support of drought assessment and monitoring using geostationary satellites would be useful. First, the components of the energy and water cycles (evapotranspiration and land surface temperature) as retrieved by Meteosat should be placed in a common framework to quantify land surface dry anomalies. Second, the usefulness of this approach for short-term applications using LST and AE products from the MODIS sensor should be validated. Third, the approach should be adapted to operational mode for the analysis of real drought situations with the scope of providing early warnings.
Evapotranspiration has been central in recent scientific work on global and historical drought assessments, but most of the focus has been on the application of the Penman hypothesis, which depends on precipitation [27]. An alternative approach for developing an evapotranspiration-based index is the Bouchet [45] hypothesis. It has been suggested that ET-based drought indexes based on the Bouchet hypothesis could be better for monitoring agricultural and vegetative droughts in upcoming years [27].
Using satellite observations of the AE and PE at a regional scale, in the current study, direct observational evidence of the complementarity in regional evapotranspiration relations was obtained (Section 3.2), although the region is not a very homogeneous landscape. These results give us a reason to continue our work with the aim of operationally applying fully ET-dependent indexes in drought monitoring for the region of SEE.

5. Conclusions

Based on the remote sensing-driven components of the terrestrial evapotranspiration provided by the EUMETSAT LSASAF products, we comprehensively examined the utility of geostationary satellites for the assessment of terrestrial drought as a natural process and its monitoring in SEE, a region of strong land–atmosphere. The main findings are as follows:
  • To assess and monitor vegetation water stress, the AE/PE ratio and ETDI were constructed on the basis of the LSASAF DMET and METREF datasets; their ability to reflect SMA in the root zone and, in this way, indirectly indicate drought on short-term climatic bases (2011–2021) without the involvement of precipitation was evaluated;
  • The evapotranspiration deficit indexes were correlated with the SMA in a variety of microclimates that mostly covered the territory of Bulgaria and, therefore, were capable of capturing drought;
  • Statistical analyses confirmed the ability of satellite products to detect vegetation water stress. It was shown that regional PE depends in a complementary manner on regional AE across the entire ranges of energy and moisture availability in the target region;
  • Competitive performance was found for the ETDI/ESI and the SMAI. The applicability of satellite-based ETDI and ESI data as independent evapotranspiration drought indexes for regions with strong land–atmosphere coupling (such as the Eastern Mediterranean region) or as alternatives to land surface model-based SMA indexes for assessing agricultural/ecological droughts was confirmed.
It is worth noting that managing drought effectively means recognizing that human influence is as integral to drought as natural climate variability. The multidirectional relationship between the drought process and the role of people is still not fully understood [99], which can implicitly induce uncertainties in local-scale assessments.

Author Contributions

Conceptualization, J.S.S.; methodology, J.S.S. and C.G.G.; software, C.G.G.; formal analysis, P.N.N.; investigation, J.S.S.; data curation, C.G.G. and J.S.S.; writing—original draft preparation, J.S.S.; writing—editing, C.G.G.; project administration, J.S.S.; funding acquisition, J.S.S. All authors have read and agreed to the published version of the manuscript.

Funding

This research was partially funded by the EUMETSAT LSASAF project CDOP-4, 2022–2027.

Data Availability Statement

Data are available at users’ request at the LSASAF website: https://landsaf.ipma.pt/en/data/catalogue/ (accessed on 30 November 2020).

Acknowledgments

LSASAF is acknowledged for providing the requested DMET and METREF archive data. Kiril Slavov is acknowledged for technical support in downloading the data. The visualizations in Figure 1 and Figure 4 were kindly produced by Andrey Kulishev in the frame of the LSASAF project. Thanks are due to the anonymous reviewers for their helpful recommendations.

Conflicts of Interest

The authors declare no conflict of interest. The funder had no role in the design of the study; in the analyses, or interpretation of data; in the writing of the manuscript, or in the decision to publish the results.

References

  1. Hobbins, M.T.; Wood, A.; McEvoy, D.J.; Huntington, J.L.; Morton, C.; Anderson, M.; Hain, C. The Evaporative Demand Drought Index. Part I: Linking Drought Evolution to Variations in Evaporative Demand. J. Hydrometeorol. 2016, 17, 1745–1761. [Google Scholar] [CrossRef]
  2. Seneviratne, S.I.; Corti, T.; Davin, E.L.; Hirschi, M.; Jaeger, E.B.; Lehner, I.; Orlowsky, B.; Teuling, A.J. Investigating soil moisture—Climate interactions in a changing climate: A review. Earth-Sci. Rev. 2010, 99, 125–161. [Google Scholar] [CrossRef]
  3. Nicholls, N.; Larsen, S. Impact of drought on temperature extremes in Melbourne, Australia. Meteorol. Oceanogr. J. 2011, 61, 113–116. [Google Scholar] [CrossRef]
  4. Koster, R.D.; Dirmeyer, P.A.; Guo, Z.; Bonan, G.; Chan, E.; Cox, P.; Gordon, C.T.; Kanae, S.; Kowalczyk, E.; Lawrence, D.; et al. Regions of Strong Coupling Between Soil Moisture and Precipitation. Science 2004, 305, 1138–1140. [Google Scholar] [CrossRef] [PubMed] [Green Version]
  5. Zhang, J.; Wang, W.-C.; Wei, J. Assessing land-atmosphere coupling using soil moisture from the Global Land Data Assimilation System and observational precipitation. J. Geophys. Res. Atmos. 2008, 113, D17119. [Google Scholar] [CrossRef]
  6. Giorgi, F. Climate Change Hot-Spots. Geophys. Res. Lett. 2006, 33, L08707. [Google Scholar] [CrossRef]
  7. Giorgi, F.; Lionello, P. Climate change projections for the Mediterranean region. Glob. Planet. Chang. 2008, 63, 90–104. [Google Scholar] [CrossRef]
  8. Hoerling, M.P.; Eischeid, J.K.; Perlwitz, J.; Quan, X.; Zhang, T.; Pegion, P.J. On the Increased Frequency of Mediterranean Drought. J. Clim. 2012, 25, 2146–2161. [Google Scholar] [CrossRef] [Green Version]
  9. Zampieri, M.; D’Andrea, F.; Vautard, R.; Ciais, P.; De Noblet-Ducoudré, N.; Yiou, P. Hot European Summers and the Role of Soil Moisture in the Propagation of Mediterranean Drought. J. Clim. 2009, 22, 4747–4758. [Google Scholar] [CrossRef]
  10. Spinoni, J.; Naumann, G.; Vogt, J.V. Pan-European seasonal trends and recent changes of drought frequency and severity. Glob. Planet. Chang. 2017, 148, 113–130. [Google Scholar] [CrossRef]
  11. Spinoni, J.; Jürgen, V.; Vogt, J.V.; Naumann, G.; Barbosa, P.; Dosio, A. Will drought events become more frequent and severe in Europe? Int. J. Climatol. 2018, 38, 1718–1736. [Google Scholar] [CrossRef] [Green Version]
  12. McKee, T.B.; Doesken, N.J.; Kleist, J. The Relationship of Drought Frequency and Duration to Time Scales. In Proceedings of the 8th Conference on Applied Climatology, American Meteorological Society, Anaheim, CA, USA, 17–22 January 1993. [Google Scholar]
  13. WMO. International Meteorological Vocabulary, 2nd ed.; World Meteorological Organnisation: Geneva, Switzerland, 1992; p. 784. [Google Scholar]
  14. American Meteorological Society. Meteorological drought—Policy statement. Bull. Am. Meteorol. Soc. 1997, 78, 847–849. [Google Scholar] [CrossRef] [Green Version]
  15. Chaves, M.M.; Marôco, J.P.; Pereira, J.S. Understanding plant responses to drought—from genes to the whole plant. Funct. Plant Biol. 2003, 30, 239–264. [Google Scholar] [CrossRef]
  16. Vicente-Serrano, S.M.; Quiring, S.M.; Peña-Gallardo, M.; Yuan, S.; Domínguez-Castro, F. A review of environmental droughts: Increased risk under global warming? Earth-Sci. Rev. 2020, 201, 102953. [Google Scholar] [CrossRef]
  17. Sheffield, J.; Wood, E.F. Projected changes in drought occurrence under future global warming from multi-model, multi-scenario, IPCC AR4 simulations. Clim. Dyn. 2008, 31, 79–105. [Google Scholar] [CrossRef]
  18. Teuling, A.J.; Van Loon, A.F.; Seneviratne, S.I.; Lehner, I.; Aubinet, M.; Heinesch, B.; Bernhofer, C.; Grünwald, T.; Prasse, H.; Spank, U. Evapotranspiration amplifies European summer drought. Geophys. Res. Lett. 2013, 40, 2071–2075. [Google Scholar] [CrossRef]
  19. McDowell, N.; Pockman, W.T.; Allen, C.D.; Breshears, D.D.; Cobb, N.; Kolb, T.; Plaut, J.; Sperry, J.; West, A.; Williams, D.G.; et al. Mechanisms of plant survival and mortality during drought: Why do some plants survive while others succumb to drought? New Phytol. 2008, 178, 719–739. [Google Scholar] [CrossRef]
  20. Swann, A.L.S. Plants and Drought in a Changing Climate. Curr. Clim. Chang. Rep. 2018, 4, 192–201. [Google Scholar] [CrossRef] [Green Version]
  21. Tramblay, Y.; Koutroulis, A.; Samaniego, L.; Vicente-Serrano, S.M.; Volaire, F.; Boone, A.; Le Page, M.; Llasat, M.C.; Albergel, C.; Burak, S.; et al. Challenges for drought assessment in the Mediterranean region under future climate scenarios. Earth-Sci. Rev. 2020, 210, 103348. [Google Scholar] [CrossRef]
  22. Zhang, X.; Li, M.; Ma, Z.; Yang, Q.; Lv, M.; Clark, R. Assessment of an Evapotranspiration Deficit Drought Index in Relation to Impacts on Ecosystems. Adv. Atmos. Sci. 2019, 36, 1273–1287. [Google Scholar] [CrossRef]
  23. Huang, J.; Li, Y.; Fu, C.; Chen, F.; Fu, Q.; Dai, A.; Shinoda, M.; Ma, Z.; Guo, W.; Li, Z.; et al. Dryland climate change: Recent progress and challenges. Rev. Geophys. 2017, 55, 719–778. [Google Scholar] [CrossRef]
  24. Zhu, Z.; Piao, S.; Myneni, R.B.; Huang, M.; Zeng, Z.; Canadell, J.G.; Ciais, P.; Sitch, S.; Friedlingstein, P.; Arneth, A.; et al. Greening of the Earth and its drivers. Nat. Clim. Chang. 2016, 6, 791–795. [Google Scholar] [CrossRef]
  25. Allen, C.D.; Macalady, A.K.; Chenchouni, H.; Bachelet, D.; McDowell, N.; Vennetier, M.; Kitzberger, T.; Rigling, A.; Breshears, D.D.; Hogg, E.H.; et al. A global overview of drought and heat-induced tree mortality reveals emerging climate change risks for forests. For. Ecol. Manag. 2010, 259, 660–684. [Google Scholar] [CrossRef] [Green Version]
  26. Ma, Z.; Fu, C. Global aridification in the second half of the 20th century and its relationship to large-scale climate background. Sci. China Ser. D Earth Sci. 2007, 50, 776–788. [Google Scholar] [CrossRef]
  27. Kim, D.; Rhee, J. A drought index based on actual evapotranspiration from the Bouchet hypothesis. Geophys. Res. Lett. 2016, 43, 10277–10285. [Google Scholar] [CrossRef]
  28. Dai, A. Characteristics and trends in various forms of the Palmer Drought Severity Index during 1900–2008. J. Geophys. Res. Atmos. 2011, 116, D12115. [Google Scholar] [CrossRef] [Green Version]
  29. Vicente-Serrano, S.M.; Beguería, S.; López-Moreno, J.I. A Multiscalar Drought Index Sensitive to Global Warming: The Standardized Precipitation Evapotranspiration Index. J. Clim. 2010, 23, 1696–1718. [Google Scholar] [CrossRef] [Green Version]
  30. Sheffield, J.; Wood, E.F.; Roderick, M.L. Little change in global drought over the past 60 years. Nature 2012, 491, 435–438. [Google Scholar] [CrossRef]
  31. Dai, A. Increasing drought under global warming in observations and models. Nat. Clim. Change 2013, 3, 52–58. [Google Scholar] [CrossRef]
  32. McEvoy, D.J.; Huntington, J.L.; Abatzoglou, J.; Edwards, L.M. An Evaluation of Multiscalar Drought Indices in Nevada and Eastern California. Earth Interact. 2012, 16, 1–18. [Google Scholar] [CrossRef]
  33. Vicente-Serrano, S.M.; Zouber, A.; Lasanta, T.; Pueyo, Y. Dryness is accelerating degradation of vulnerable shrublands in semiarid Mediterranean environments. Ecol. Monogr. 2012, 82, 407–428. [Google Scholar] [CrossRef] [Green Version]
  34. McEvoy, D.J.; Huntington, J.L.; Hobbins, M.; Wood, A.; Morton, C.; Anderson, M.; Hain, C. The Evaporative Demand Drought Index. Part II: CONUS-Wide Assessment against Common Drought Indicators. J. Hydrometeorol. 2016, 17, 1763–1779. [Google Scholar] [CrossRef]
  35. Tsakiris, G.; Pangalou, D.; Vangelis, H. Regional Drought Assessment Based on the Reconnaissance Drought Index (RDI). Water Resour. Manag. 2006, 21, 821–833. [Google Scholar] [CrossRef]
  36. Etienne, E.; Devineni, N.; Khanbilvardi, R.; Lall, U. Development of a Demand Sensitive Drought Index and its application for agriculture over the conterminous United States. J. Hydrol. 2016, 534, 219–229. [Google Scholar] [CrossRef] [Green Version]
  37. Vicente-Serrano, S.M.; Miralles, D.; Domínguez-Castro, F.; Azorin-Molina, C.; Kenawy, A.; McVicar, T.; Tomás-Burguera, M.; Beguería, S.; Maneta, M.; Peña-Gallardo, M. Global Assessment of the Standardized Evapotranspiration Deficit Index (SEDI) for Drought Analysis and Monitoring. J. Clim. 2018, 31, 5371–5393. [Google Scholar] [CrossRef]
  38. Yao, Y.; Liang, S.; Qin, Q.; Wang, K. Monitoring Drought over the Conterminous United States Using MODIS and NCEP Reanalysis-2 Data. J. Appl. Meteorol. Clim. 2010, 49, 1665–1680. [Google Scholar] [CrossRef]
  39. Anderson, M.C.; Hain, C.R.; Wardlow, B.; Pimstein, A.; Mecikalski, J.R.; Kustas, W.P. Evaluation of Drought Indices Based on Thermal Remote Sensing of Evapotranspiration over the Continental United States. J. Clim. 2011, 24, 2025–2044. [Google Scholar] [CrossRef]
  40. Mu, Q.; Zhao, M.; Kimball, J.S.; McDowell, N.G.; Running, S.W. A Remotely Sensed Global Terrestrial Drought Severity Index. Bull. Am. Meteorol. Soc. 2013, 94, 83–98. [Google Scholar] [CrossRef] [Green Version]
  41. Narasimhan, B.; Srinivasan, R. Development and evaluation of Soil Moisture Deficit Index (SMDI) and Evapotranspiration Deficit Index (ETDI) for agricultural drought monitoring. Agric. For. Meteorol. 2005, 133, 69–88. [Google Scholar] [CrossRef]
  42. Zhang, Y.; Peña-Arancibia, J.L.; McVicar, T.; Chiew, F.H.S.; Vaze, J.; Liu, C.; Lu, X.; Zheng, H.; Wang, Y.; Liu, Y.Y.; et al. Multi-decadal trends in global terrestrial evapotranspiration and its components. Sci. Rep. 2016, 6, 19124. [Google Scholar] [CrossRef]
  43. Kim, D.; Lee, W.-S.; Kim, S.T.; Chun, J.A. Historical Drought Assessment Over the Contiguous United States Using the Generalized Complementary Principle of Evapotranspiration. Water Resour. Res. 2019, 55, 6244–6267. [Google Scholar] [CrossRef]
  44. Entekhabi, D.; Asrar, G.R.; Betts, A.K.; Beven, K.J.; Bras, R.L.; Duffy, C.J.; Dunne, T.; Koster, R.D.; Lettenmaier, D.P.; McLaughlin, D.B.; et al. An Agenda for Land Surface Hydrology Research and a Call for the Second International Hydrological Decade. Bull. Am. Meteorol. Soc. 1999, 80, 2043–2058. [Google Scholar] [CrossRef]
  45. Bouchet, R.J. Evapotranspiration réelle et potentielle, signication climatique. Int. Assoc. Sci. Hydrol. Publ. 1963, 62, 134–142. [Google Scholar]
  46. Budyko, M.I.; Efimova, N.A.; Zubenok, L.A.; Strokina, L.A. The heat balance of the Earth’s surface. Izv. Akad. Nauk SSSR Ser. Geogr. 1962, 1, 6–16. [Google Scholar] [CrossRef]
  47. Roderick, M.L.; Farquhar, G.D. Changes in Australian pan evaporation from 1970 to 2002. Int. J. Clim. 2004, 24, 1077–1090. [Google Scholar] [CrossRef]
  48. Parlange, M.; Katul, G. An advection-aridity evaporation model. Water Resour. Res. 1992, 28, 127–132. [Google Scholar] [CrossRef]
  49. Qualls, R.J.; Gultekin, H. Influence of components of the advection-aridity approach on evapotranspiration estimation. J. Hydrol. 1997, 199, 3–12. [Google Scholar] [CrossRef]
  50. Hobbins, M.; Ramírez, J.A.; Brown, T.C. The complementary relationship in estimation of regional evapotranspiration: An enhanced advection-aridity model. Water Resour. Res. 2001, 37, 1389–1403. [Google Scholar] [CrossRef] [Green Version]
  51. Sugita, M.; Usui, J.; Tamagawa, I.; Kaihotsu, I. Complementary relationship with a convective boundary layer model to estimate regional evaporation. Water Resour. Res. 2001, 37, 353–365. [Google Scholar] [CrossRef]
  52. Ozdogan, M.; Salvucci, G.D. Irrigation-induced changes in potential evapotranspiration in southeastern Turkey: Test and application of Bouchet’s complementary hypothesis. Water Resour. Res. 2004, 40, W04301. [Google Scholar] [CrossRef] [Green Version]
  53. Hobbins, M.T.; Ramírez, J.A.; Brown, T.C. Trends in pan evaporation and actual evapotranspiration across the conterminous U.S.: Paradoxical or complementary? Geophys. Res. Lett. 2004, 31, L13503. [Google Scholar] [CrossRef]
  54. Kim, C.P.; Entekhabi, D. Feedbacks in the Land-Surface and Mixed-Layer Energy Budgets. Bound.-Layer Meteorol. 1998, 88, 1–21. [Google Scholar] [CrossRef]
  55. Szilagyi, J. On Bouchet’s complementary hypothesis. J. Hydrol. 2001, 246, 155–158. [Google Scholar] [CrossRef]
  56. AghaKouchak, A.; Farahmand, A.; Melton, F.S.; Teixeira, J.; Anderson, M.C.; Wardlow, B.D.; Hain, C.R. Remote sensing of drought: Progress, challenges and opportunities. Rev. Geophys. 2015, 53, 452–480. [Google Scholar] [CrossRef] [Green Version]
  57. Trigo, I.F.; DaCamara, C.C.; Viterbo, P.; Roujean, J.-L.; Olesen, F.; Barroso, C.; Camacho-De-Coca, F.; Carrer, D.; Freitas, S.C.; García-Haro, J.; et al. The Satellite Application Facility for Land Surface Analysis. Int. J. Remote Sens. 2011, 32, 2725–2744. [Google Scholar] [CrossRef]
  58. Lisonbee, J.; System, N.I.D.I.; Woloszyn, M.; Skumanich, M. Making sense of flash drought: Definitions, indicators, and where we go from here. J. Appl. Serv. Clim. 2021, 2021, 1–19. [Google Scholar] [CrossRef]
  59. Ford, T.W.; Labosier, C.F. Meteorological conditions associated with the onset of flash drought in the Eastern United States. Agric. For. Meteorol. 2017, 247, 414–423. [Google Scholar] [CrossRef]
  60. Yuan, X.; Wang, L.; Wu, P.; Ji, P.; Sheffield, J.; Zhang, M. Anthropogenic shift towards higher risk of flash drought over China. Nat. Commun. 2019, 10, 4661. [Google Scholar] [CrossRef] [Green Version]
  61. Osman, M.; Zaitchik, B.F.; Badr, H.S.; Christian, J.I.; Tadesse, T.; Otkin, J.A.; Anderson, M.C. Flash drought onset over the contiguous United States: Sensitivity of inventories and trends to quantitative definitions. Hydrol. Earth Syst. Sci. 2021, 25, 565–581. [Google Scholar] [CrossRef]
  62. Pendergrass, A.G.; Meehl, G.A.; Pulwarty, R.; Hobbins, M.; Hoell, A.; AghaKouchak, A.; Bonfils, C.J.W.; Gallant, A.J.E.; Hoerling, M.; Hoffmann, D.; et al. Flash droughts present a new challenge for subseasonal-to-seasonal prediction. Nat. Clim. Chang. 2020, 10, 191–199. [Google Scholar] [CrossRef] [Green Version]
  63. Otkin, J.; Anderson, M.; Hain, C.; Mladenova, I.E.; Basara, J.; Svoboda, M. Examining Rapid Onset Drought Development Using the Thermal Infrared–Based Evaporative Stress Index. J. Hydrometeorol. 2013, 14, 1057–1074. [Google Scholar] [CrossRef]
  64. Otkin, J.; Anderson, M.; Hain, C.; Svoboda, M. Examining the Relationship between Drought Development and Rapid Changes in the Evaporative Stress Index. J. Hydrometeorol. 2014, 15, 938–956. [Google Scholar] [CrossRef]
  65. Nguyen, H.; Wheeler, M.C.; Otkin, J.A.; Cowan, T.; Frost, A.J.; Stone, R.C. Using the evaporative stress index to monitor flash drought in Australia. Environ. Res. Lett. 2019, 14, 064016. [Google Scholar] [CrossRef] [Green Version]
  66. Allen, R.G.; Pereira, L.S.; Raes, D.; Smith, M. Crop Evapotranspiration: Guidelines for Computing Crop Water Requirements; Irrigation and Drainage Paper 56; FAO: Rome, Italy, 1998; p. 300. [Google Scholar]
  67. De Bruin, H.A.R.; Trigo, I.; Bosveld, F.C.; Meirink, J.F. A Thermodynamically Based Model for Actual Evapotranspiration of an Extensive Grass Field Close to FAO Reference, Suitable for Remote Sensing Application. J. Hydrometeorol. 2016, 17, 1373–1382. [Google Scholar] [CrossRef]
  68. Choudhury, B.J. Multispectral satellite data in the context of land surface heat balance. Rev. Geophys. 1991, 29, 217–236. [Google Scholar] [CrossRef]
  69. Ghilain, N.; Arboleda, A.; Gellens-Meulenberghs, F. Evapotranspiration modelling at large scale using near-real time MSG SEVIRI derived data. Hydrol. Earth Syst. Sci. 2011, 15, 771–786. [Google Scholar] [CrossRef] [Green Version]
  70. Viterbo, P.; Beljaars, A. An improved surface parametrization scheme in the ECMWF model and its validation. J. Clim. 1995, 8, 2716–2748. [Google Scholar] [CrossRef]
  71. van den Hurk, B.; Viterbo, P.; Beljaars, A.; Betts, A. Offline Validation of the ERA40 Surface Scheme; ECMWF Techn. Memorandum No. 295; ECMWF: Reading UK, 2000; p. 42. [Google Scholar]
  72. Balsamo, G.; Beljaars, A.; Scipal, K.; Viterbo, P.; van den Hurk, B.; Hirschi, M.; Betts, A.K. A Revised Hydrology for the ECMWF Model: Verification from Field Site to Terrestrial Water Storage and Impact in the Integrated Forecast System. J. Hydrometeorol. 2009, 10, 623–643. [Google Scholar] [CrossRef] [Green Version]
  73. Albergel, C.; Balsamo, G.; de Rosnay, P.; Muñoz-Sabater, J.; Boussetta, S. A bare ground evaporation revision in the ECMWF land-surface scheme: Evaluation of its impact using ground soil moisture and satellite microwave data. Hydrol. Earth Syst. Sci. 2012, 16, 3607–3620. [Google Scholar] [CrossRef] [Green Version]
  74. Arboleda, A.; Ghilain, N.; Meulenberghs, F. Product User Manual (PUM) for Evapotranspiration and Surface Fluxes; EUMETSAT LSA SAF, IPMA: Lisbon, Portugal, 2018; p. 35. Available online: https://nextcloud.lsasvcs.ipma.pt/s/r786yz3Ex2Fe9Ya (accessed on 20 June 2022).
  75. Yao, A.Y. Agricultural potential estimated from the ratio of actual to potential evapotranspiration. Agric. Meteorol. 1974, 13, 405–417. [Google Scholar] [CrossRef]
  76. Otkin, J.A.; Anderson, M.C.; Hain, C.; Svoboda, M.; Johnson, D.; Mueller, R.; Tadesse, T.; Wardlow, B.; Brown, J. Assessing the evolution of soil moisture and vegetation conditions during the 2012 United States flash drought. Agric. For. Meteorol. 2016, 218–219, 230–242. [Google Scholar] [CrossRef]
  77. Stoyanova, J.S.; Georgiev, C.G. Drought and vegetation fires detection using MSG geostationary satellites. In Proceedings of the 2010 EUMETSAT Meteorological Satellite Conference, Córdoba, Spain, 20–24 September 2010. [Google Scholar]
  78. Stoyanova, J.S.; Georgiev, C.G. SVAT modelling in support to flood risk assessment in Bulgaria. Atmospheric Res. 2013, 123, 384–399. [Google Scholar] [CrossRef] [Green Version]
  79. Stoyanova, J.S.; Georgiev, C.G. Operational drought detection and monitoring over Eastern Mediterranean by using MSG data. In Proceedings of the 2013 EUMETSAT Meteorological Satellite Conference/19th American Meteorological Society AMS Satellite Meteorology, Oceanography, and Climatology Conference, Vienna, Austria, 16–20 September 2013. [Google Scholar]
  80. Stoyanova, J.; Georgiev, C.; Neytchev, P.; Kulishev, A. Spatial-Temporal Variability of Land Surface Dry Anomalies in Climatic Aspect: Biogeophysical Insight by Meteosat Observations and SVAT Modeling. Atmosphere 2019, 10, 636. [Google Scholar] [CrossRef] [Green Version]
  81. RMI Team. Algorithm Theoretical Basis Document Meteosat Second Generation Based Products: Instantaneous evapotranspiration (MET v2), Daily Evapotranspiration (DMET v2), Surface Latent Heat Flux (LE), Surface Sensible Heat Flux; EUMETSAT LSA SAF, IPMA: Lisbon, Portugal, 2016; p. 23. Available online: https://nextcloud.lsasvcs.ipma.pt/s/J3kdDgaiHrjnypw (accessed on 15 May 2022).
  82. R Core Team. R: A Language and Environment for Statistical Computing; R Foundation for Statistical Computing: Vienna, Austria, 2017. [Google Scholar]
  83. Vicente-Serrano, S.M.; McVicar, T.R.; Miralles, D.; Yang, Y.; Tomas-Burguera, M. Unraveling the influence of atmospheric evaporative demand on drought and its response to climate change. WIREs Clim. Chang. 2020, 11, e632. [Google Scholar] [CrossRef]
  84. Vicente-Serrano, S.; Camarero, J.; Zabalza, J.; Sangüesa-Barreda, G.; López-Moreno, J.; Tague, C. Evapotranspiration deficit controls net primary production and growth of silver fir: Implications for Circum-Mediterranean forests under forecasted warmer and drier conditions. Agric. For. Meteorol. 2015, 206, 45–54. [Google Scholar] [CrossRef] [Green Version]
  85. León-Sánchez, L.; Nicolás, E.; Nortes, P.A.; Maestre, F.T.; Querejeta, J.I. Photosynthesis and growth reduction with warming are driven by nonstomatal limitations in a Mediterranean semi-arid shrub. Ecol. Evol. 2016, 6, 2725–2738. [Google Scholar] [CrossRef] [Green Version]
  86. Pumo, D.; Viola, F.; Noto, L. Climate changes’ effects on vegetation water stress in Mediterranean areas. Ecohydrology 2010, 3, 166–176. [Google Scholar] [CrossRef]
  87. Carnicer, J.; Coll, M.; Ninyerola, M.; Pons, X.; Sánchez, G.; Peñuelas, J. Widespread crown condition decline, food web disruption, and amplified tree mortality with increased climate change-type drought. Proc. Natl. Acad. Sci. USA 2011, 108, 1474–1478. [Google Scholar] [CrossRef] [Green Version]
  88. Vicente-Serrano, S.M.; Lopez-Moreno, I.; Beguería, S.; Lorenzo-Lacruz, J.; Sanchez-Lorenzo, A.; García-Ruiz, J.M.; Azorin-Molina, C.; Morán-Tejeda, E.; Revuelto, J.; Trigo, R.; et al. Evidence of increasing drought severity caused by temperature rise in southern Europe. Environ. Res. Lett. 2014, 9, 044001. [Google Scholar] [CrossRef]
  89. Yuan, W.; Zheng, Y.; Piao, S.; Ciais, P.; Lombardozzi, D.; Wang, Y.; Ryu, Y.; Chen, G.; Dong, W.; Hu, Z.; et al. Increased atmospheric vapor pressure deficit reduces global vegetation growth. Sci. Adv. 2019, 5, eaax1396. [Google Scholar] [CrossRef] [Green Version]
  90. Anderegg, W.R.L.; Flint, A.; Huang, C.-Y.; Flint, L.; Berry, J.A.; Davis, F.W.; Sperry, J.S.; Field, C.B. Tree mortality predicted from drought-induced vascular damage. Nat. Geosci. 2015, 8, 367–371. [Google Scholar] [CrossRef]
  91. Aminzadeh, M.; Or, D. The complementary relationship between actual and potential evaporation for spatially heterogeneous surfaces. Water Resour. Res. 2017, 53, 580–601. [Google Scholar] [CrossRef]
  92. Pettijohn, J.C.; Salvucci, G.D. A New Two-Dimensional Physical Basis for the Complementary Relation between Terrestrial and Pan Evaporation. J. Hydrometeorol. 2009, 10, 565–574. [Google Scholar] [CrossRef]
  93. Budyko, M.I. Climate and Life; Academic Press: New York, NY, USA, 1974. [Google Scholar]
  94. Zhang, K.; Kimball, J.S.; Running, S.W. A review of remote sensing based actual evapotranspiration estimation. Wiley Interdiscip. Rev. Water 2016, 3, 834–853. [Google Scholar] [CrossRef]
  95. Verstraeten, W.W.; Veroustraete, F.; Feyen, J. Assessment of Evapotranspiration and Soil Moisture Content Across Different Scales of Observation. Sensors 2008, 8, 70–117. [Google Scholar] [CrossRef] [Green Version]
  96. Masiello, G.; Ripullone, F.; De Feis, I.; Rita, A.; Saulino, L.; Pasquariello, P.; Cersosimo, A.; Venafra, S.; Serio, C. The IASI Water Deficit Index to Monitor Vegetation Stress and Early Drying in Summer Heatwaves: An Application to Southern Italy. Land 2022, 11, 1366. [Google Scholar] [CrossRef]
  97. Sepulcre-Canto, G.; Vogt, J.; Arboleda, A.; Antofie, T. Assessment of the EUMETSAT LSA-SAF evapotranspiration product for drought monitoring in Europe. Int. J. Appl. Earth Obs. Geoinf. 2014, 30, 190–202. [Google Scholar] [CrossRef]
  98. Stoyanova, J.S.; Georgiev, C.G.; Neytchev, P.N. Satellite Observations of Fire Activity in Relation to Biophysical Forcing Effect of Land Surface Temperature in Mediterranean Climate. Remote Sens. 2022, 14, 1747. [Google Scholar] [CrossRef]
  99. Van Loon, A.F.; Gleeson, T.; Clark, J.; Van Dijk, A.I.; Stahl, K.; Hannaford, J.; Di Baldassarre, G.; Teuling, A.J.; Tallaksen, L.M.; Uijlenhoet, R.; et al. Drought in the Anthropocence. Nat. Ggeosci. 2016, 9, 89. [Google Scholar] [CrossRef]
Figure 1. General location of target region against the background of the land cover types from the ESA-CCI Land Cover Map using the 2019 classification. For the purposes of the study, vegetation types were reclassified as considered by the ET algorithm [74]: (a) Europe; (b) Bulgaria, SEE.
Land 12 00240 g001
Figure 2. Boxplots of monthly mean values (2011–2020) during the growing season (May–October) for the region of Bulgaria: (a) LSASAF METREF; (b) LSASAF DMET; (c) difference between METREF and DMET. The boxes represent the interquartile range (25th to 75th percentile, red and blue lines, respectively), whiskers cover 99.3% of the data, and the middle (green) line represents the mean values.
Land 12 00240 g002
Figure 3. Comparison of monthly means (May-October, 2011–2021) for potential evapotranspiration (LSASAF METREF, blue) and actual evapotranspiration (LSASAF DMET, red) for selected synoptic stations in: (ac) north Bulgaria; (df) south Bulgaria.
Land 12 00240 g003aLand 12 00240 g003b
Figure 4. Spatiotemporal distribution of the seasonal evapotranspiration deficit over Bulgaria constructed on the basis of LSASAF METREF and DMET products. Color-coded maps show monthly means (2011–2020) for: (a) June; (b) July; (c) August; (d) September.
Land 12 00240 g004
Figure 5. Comparison of monthly (May–October, 2011–2020) mean AE/PE variations for the northwestern Bulgarian landmass for: (a) May (bright green); (b) June (dark green); (c) July (ocher); (d) August (orange); (e) September (red); (f) October (brown). The first 5000 ECMWF grid-point values are used for illustration.
Land 12 00240 g005
Figure 6. Seasonal (May–October) courses (daily values) of AE (DMET) and PE (METREF) and their trends (described with polynomial functions) under different environmental conditions: (a) moist; (b) normal; (c,d) dry.
Land 12 00240 g006
Figure 7. Seasonal (May–October) courses of evapotranspiration drivers (daily values): (a) SMA under moist (2014, blue), normal (2020, green), and dry (2012, black, and 2016, red) conditions; (b) air temperature; (c) absolute humidity; (d) PE (METREF) under dry conditions for 2012 (black) and 2016 (red). The polynomial trend lines (dashed) are shown.
Land 12 00240 g007
Figure 8. The complementary relationship between PE (METREF) and AE (DMET) values and the ED deficit (in the sense of the Bouchet hypothesis [45]) as the drought indicator for: (a) the entire Bulgarian landmass; (b) Rasgrad station in northeastern Bulgaria; (c) Karnobat station in southeastern Bulgaria. (d) Evapotranspiration deficit (green line) approximated using a linear regression model (black line). Mean daily values for May–October 2011–2021 were used for calculation.
Land 12 00240 g008
Figure 9. Comparison of time series (May–October) for the AE/PE ratio (blue line) based on LSASAF DMET/METREF and SMAI using the SVAT model (green line): (a) mean values from 26 synoptic stations in Bulgaria; (b) a station in north Bulgaria; (c) a station in south Bulgaria. Daily mean values for 2011–2020 were used.
Land 12 00240 g009
Figure 10. Q–Q plots comparing the distributions of the monthly mean ETDI and SMAI at 50 cm soil depth (red line): (a) mean values from 26 synoptic stations in Bulgaria; (b) a station in north Bulgaria; (c) a station in south Bulgaria. Mean values for May–October 2011–2020 were used. The blue line indicates the ideal diagonal of the linear distribution.
Land 12 00240 g010
Figure 11. Descending linear regression models of the relationship between satellite-derived ETDI anomalies and SMA anomalies: (a) all 26 synoptic stations in Bulgaria at 50 cm soil depth; (b) all 26 synoptic stations in Bulgaria at 100 cm soil depth; (c) a station in north Bulgaria; (d) a station in south Bulgaria. The monthly mean (2011–2021) was used to calculate the anomalies.
Land 12 00240 g011
Table 1. Characteristics of the data from Meteosat and SVAT_bg.
DataTemporal ResolutionSpatial ResolutionCoverage
LSASAF DMETREFDailySEVIRI, about
5 km over Bulgaria
MSG disk
LSASAF DMET DailySEVIRI, about
5 km over Bulgaria
MSG disk
Soil moisture availability
index (SMAI)
Daily, 0600 UTCNIMH synoptic
station network
Regional
Disclaimer/Publisher’s Note: The statements, opinions and data contained in all publications are solely those of the individual author(s) and contributor(s) and not of MDPI and/or the editor(s). MDPI and/or the editor(s) disclaim responsibility for any injury to people or property resulting from any ideas, methods, instructions or products referred to in the content.

