
Environmental Forest Fire Danger Rating Systems and Indices around the Globe: A Review


Abstract
:1. Introduction
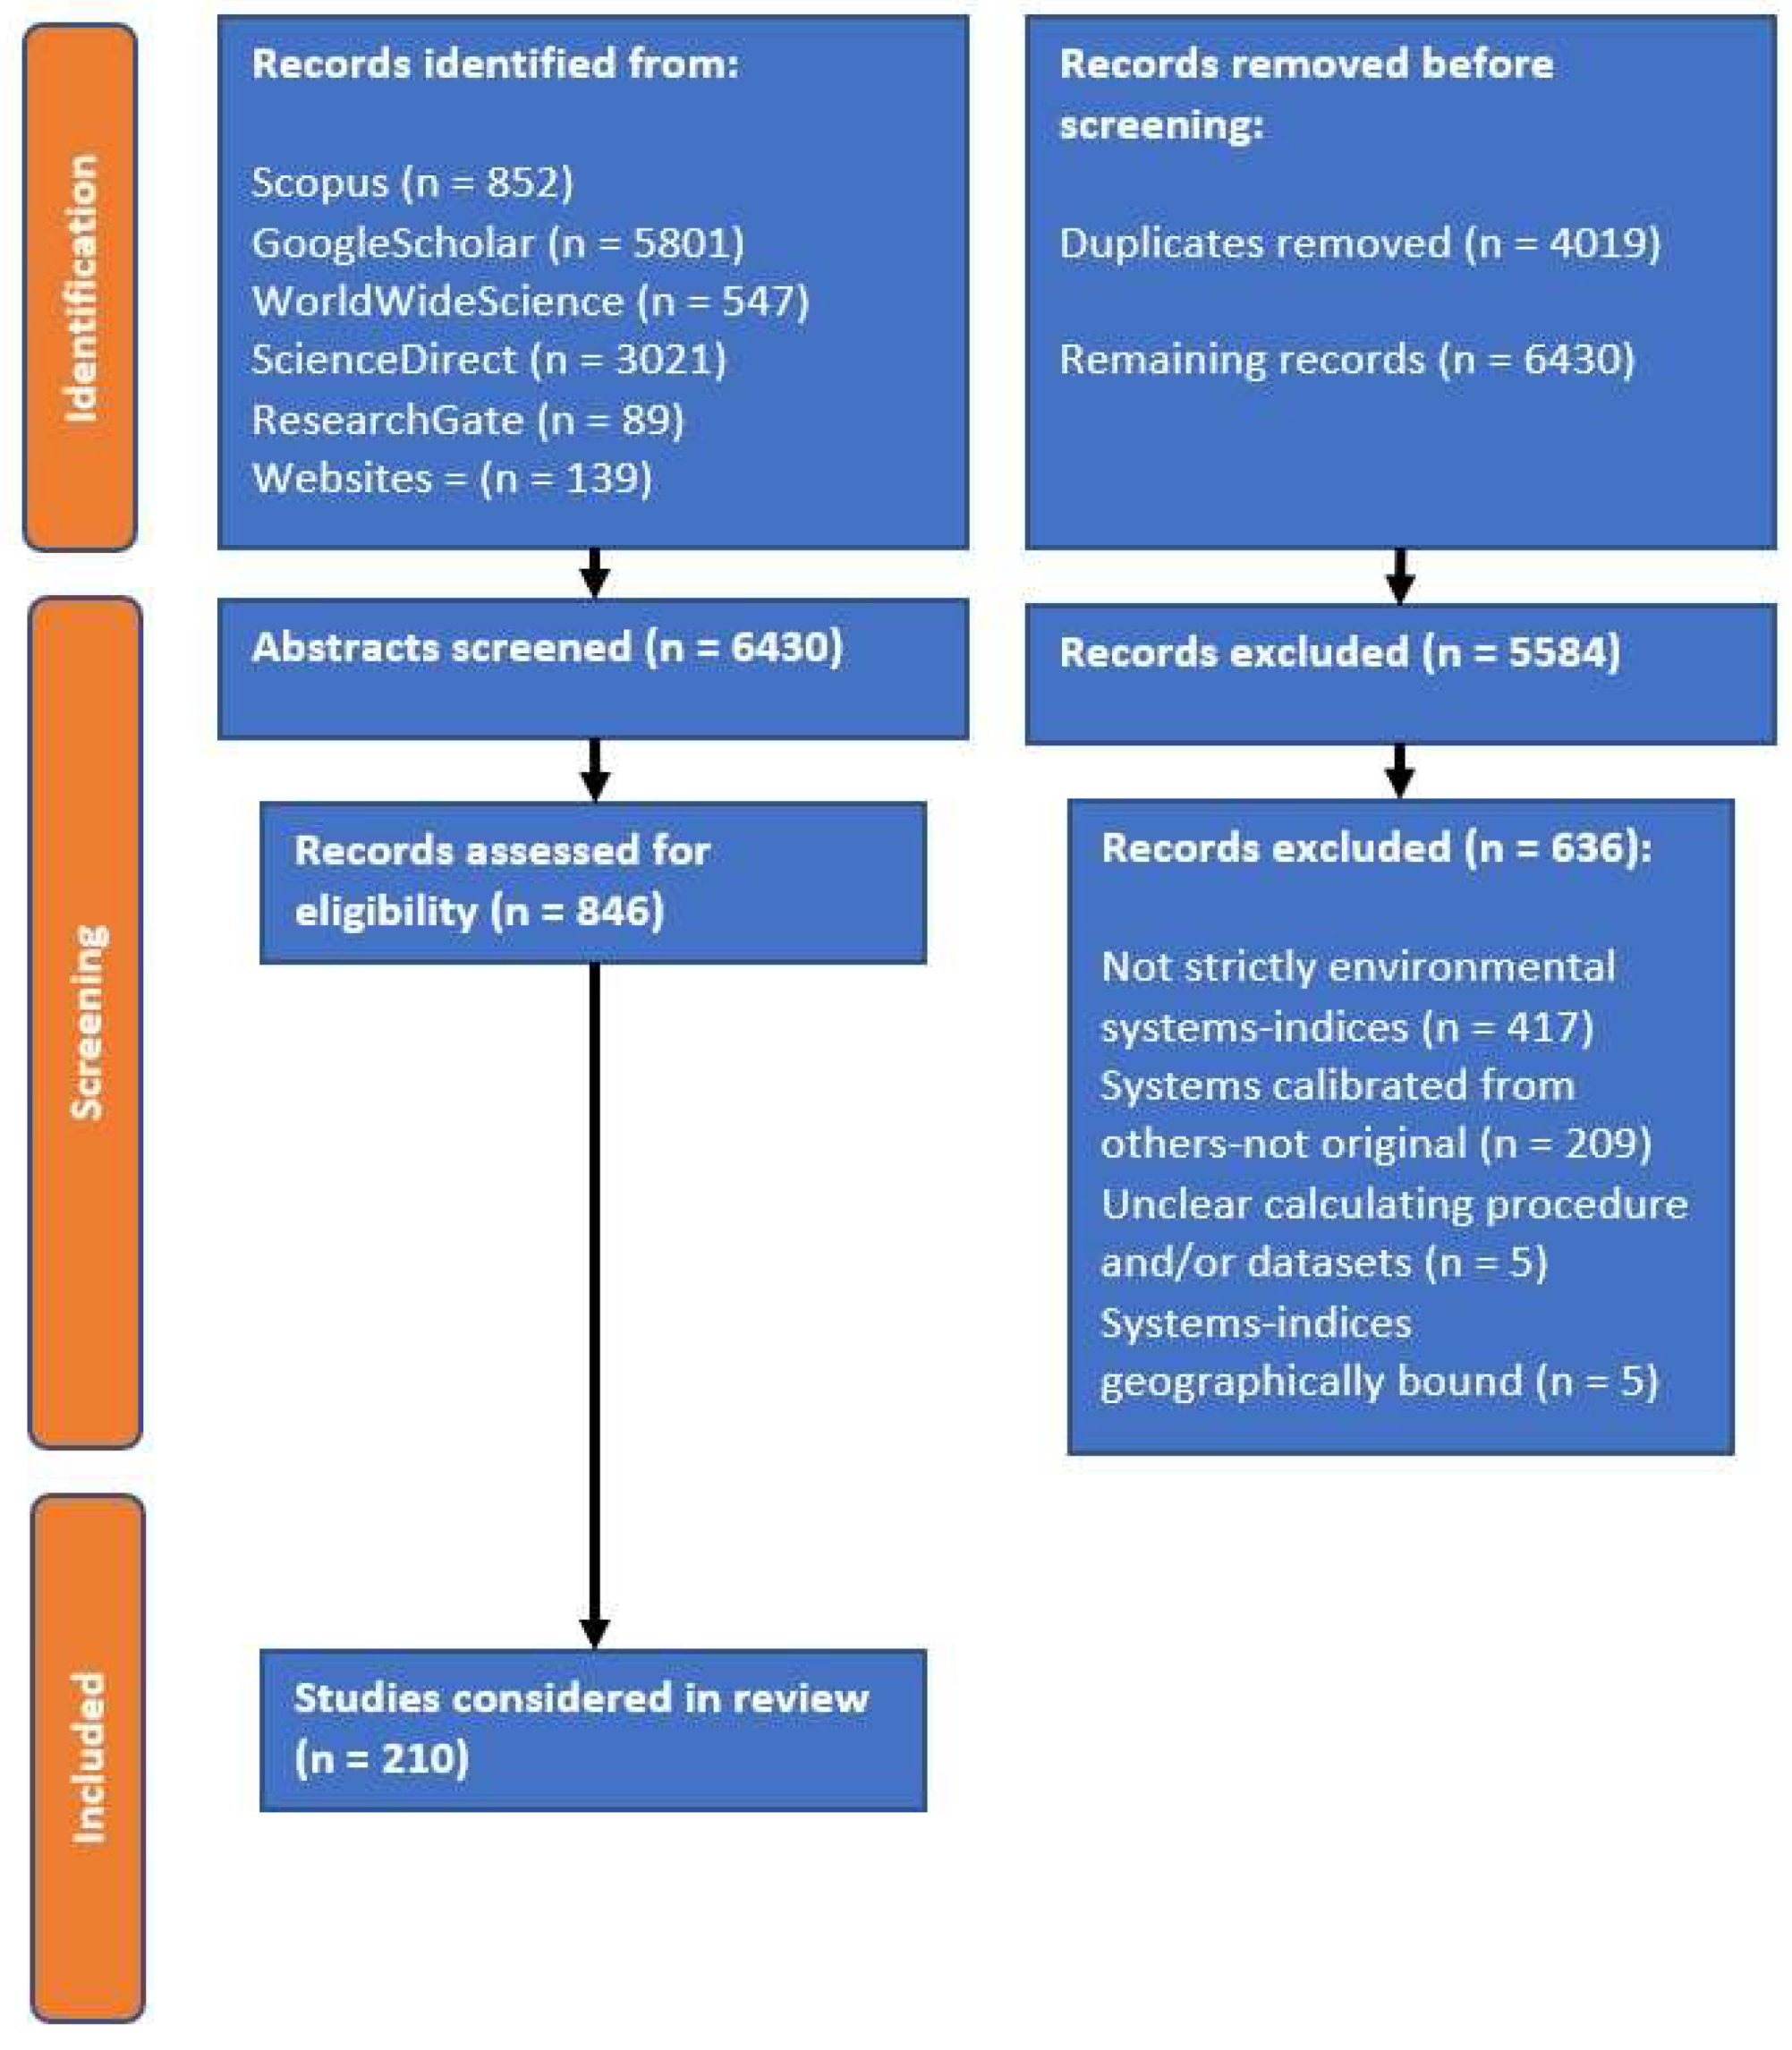
2. Materials and Methods
3. Results
3.1. North America Fire Danger Systems and Indices
3.1.1. Canadian Forest Fire Danger Rate System
3.1.2. National Fire Danger Rating System

| No | Systems Indices | Origin | Publications |
|---|---|---|---|
| Ad hoc Fire Danger Rating Systems | |||
| North American | |||
| 1 | CFFDRS | Canada | [30,51,55,56,59] |
| 2 | NFDRS | USA | [29,65,66,67] |
| 3 | Fosberg | USA | [74,75] |
| 4 | Fosberg + | USA | [76] |
| 5 | BEHAVE | USA | [69,73,77,78] |
| 6 | CBI | USA | [79] |
| 7 | HDWI | USA | [80] |
| 8 | LASI | USA | [81] |
| Southern Hemisphere | |||
| 9 | FFDI | Australia | [28,82,83] |
| 10 | GFDI | Australia | [28,82,84] |
| 11 | FFBT | Australia | [85,86] |
| 12 | SFDI | Australia | [87,88] |
| 13 | LFDI | S. Africa | [89,90] |
| 14 | FMA | Brazil | [91] |
| 15 | FMA+ | Brazil | [92] |
| 16 | IRM | Argentina | [93] |
| 17 | RF | Brazil | [94] |
| 18 | EPI | Brazil | [95] |
| 19 | PEI | Brazil | [95] |
| Mediterranean | |||
| 20 | r (Orieux) | France | [96] |
| 21 | I87 | France | [97] |
| 22 | Numerical | France | [98] |
| 23 | Lourenco | Portugal | [99] |
| 24 | Lourenco_m100 | Portugal | [99] |
| 25 | Lourenco_f | Portugal | [99] |
| 26 | Ifa | Portugal | [100,101] |
| 27 | ICONA | Spain | [102] |
| 28 | CFS | Italy | [103] |
| 29 | IREPI | Italy | [104] |
| 30 | IFI | Italy | [105,106] |
| 31 | DMRIF | Tunisia | [107] |
| North Eurasian | |||
| 32 | AI | Sweden | [108] |
| 33 | BIt | Germany | [109] |
| 34 | IBr | Germany | [110] |
| 35 | TLI | Russia | [111] |
| 36 | NI | Russia | [112] |
| 37 | mNI | Russia | [113] |
| 38 | Zhdanko | Russia | [114] |
| 39 | M68 | Germany | [113] |
| 40 | mM68 | Germany | [113] |
| 41 | DW | Finland | [115] |
| Indirect Indicators | |||
| Drought–Moisture | |||
| 42 | MDI | USA | [116] |
| 43 | KBDI | USA | [117] |
| 44 | SDI | Australia | [118] |
| 45 | PDSI | USA | [119] |
| 46 | RDI | Greece | [120] |
| 47 | CWD | USA | [121] |
| 48 | VPD | USA | [122] |
| 49 | DI | France | [123,124] |
| Remote Sensing | |||
| 50 | NDVI | USA | [125] |
| 51 | RG | USA | [31] |
| 52 | VG | USA | [31] |
| 53 | NDWI | USA | [126] |
| 54 | NDWI_m | USA | [127] |
| 55 | NDII_6 | USA | [128] |
| 56 | NDII_7 | USA | [128] |
| 57 | NMDI | USA | [129] |
| 58 | SAVI | USA | [130] |
| 59 | EVI | USA | [130] |
| 60 | VARI | USA | [131] |
| 61 | FPI | USA | [70,132] |
| 62 | FPI_m1 | USA | [133] |
| 63 | FPI_m2 | USA | [61,134] |
3.1.3. Fosberg and Modified Fosberg Indices
3.1.4. BEHAVE System
3.1.5. Chandler Burning Index
3.1.6. Hot-Dry-Windy Index
3.1.7. LASI Index
3.2. South Hemisphere Fire Danger Systems and Indices
3.2.1. Australian Systems and Indices
3.2.2. Lowveld Fire Danger Index
3.2.3. Formulas of Monte Alegre
3.2.4. Rodriguez–Moretti Index
3.2.5. Risco do Fogo Index
3.2.6. Evaporation-Precipitation Indices
3.3. Mediterranean Indices
3.3.1. Orieux Index
3.3.2. Carrega’s I87 Index
3.3.3. Numerical Index
3.3.4. Portuguese Indices
3.3.5. ICONA Index
3.3.6. Italian Indices
3.3.7. Tunisian Index
3.4. Northern Eurasian Indices
3.4.1. Angstrom Index
3.4.2. Baumgartner Index
3.4.3. Bruschek Index
3.4.4. Telicyn Logarithmic Index
3.4.5. Nesterov, Modified Nesterov, and Zhdanko Indices
3.4.6. M68 and Modified M68 Indices
3.4.7. Finnish Fire Index
3.5. Drought–Moisture Indices
3.5.1. Munger Drought Index
3.5.2. Keetch–Byram Drought Index
3.5.3. Soil Dryness Index
3.5.4. Palmer Drought Severity Index
3.5.5. Reconnaissance Drought Index
3.5.6. Climatic Water Deficit and Vapor Pressure Deficit
3.5.7. Darcy’s Law
3.6. Remote Sensing Indices
3.6.1. Normalized Difference Vegetation Index
3.6.2. Relative and Visual Greenness
3.6.3. Liquid Water Presence-Based Indices
3.6.4. Soil Adjusted Vegetation Index
3.6.5. Enhanced Vegetation Index and Visible Atmospheric Resistant Index
3.6.6. Fire Potential Index Model and Modifications
4. Discussion
4.1. Computational Procedure
4.2. Fire Characteristics
4.3. Modularity
4.4. Credibility
4.5. Accuracy
5. Conclusions
Supplementary Materials
Author Contributions
Funding
Data Availability Statement
Conflicts of Interest
References
- FAO; UNEP. The State of the World’s Forests 2020. In Forests, Biodiversity and People; FAO: Rome, Italy, 2020. [Google Scholar] [CrossRef]
- Agrawal, A.; Cashore, B.; Hardin, R.; Shepherd, G.; Benson, C.; Miller, D. Economic Contributions of Forests. In United Nations Forum on Forests Tenth Session 8–19 April 2013; United Nations: Istanbul, Turkey; p. 132. Available online: https://www.un.org/esa/forests/wp-content/uploads/2015/12/EcoContrForests.pdf (accessed on 13 March 2022).
- Abatzoglou, J.T.; Williams, A.P. Impact of anthropogenic climate change on wildfire across western US forests. Proc. Natl. Acad. Sci. USA 2016, 113, 11770–11775. [Google Scholar] [CrossRef] [PubMed] [Green Version]
- Boer, M.M.; Nolan, R.H.; De Dios, V.R.; Clarke, H.; Price, O.F.; Bradstock, R.A. Changing Weather Extremes Call for Early Warning of Potential for Catastrophic Fire. Earth’s Futur. 2017, 5, 1196–1202. [Google Scholar] [CrossRef]
- Ponomarev, E.; Shvetsov, E.; Litvintsev, K.; Bezkorovaynaya, I.; Ponomareva, T.; Klimchenko, A.; Ponomarev, O.; Yakimov, N.; Panov, A. Remote Sensing Data for Calibrated Assessment of Wildfire Emissions in Siberian Forests. Multidiscip. Digit. Publ. Inst. Proc. 2018, 2, 348. [Google Scholar] [CrossRef] [Green Version]
- Westerling, A.L. Wildfire Simulations for California’s Fourth Climate Change Assessment: Projecting Changes in Extreme Wildfire Vents with a Warming Climate. California’s Fourth Climate Change Assessment, California Energy Commission. Publication Number: CCCA4-CEC-2018-014. 2018. Available online: https://www.energy.ca.gov/sites/default/files/2019-11/Projections_CCCA4-CEC-2018-014_ADA.pdf (accessed on 4 May 2022).
- Bentz, B.J.; Jönsson, A.M.; Schroeder, M.; Weed, A.; Wilcke, R.A.I.; Larsson, K. Ips typographus and Dendroctonus ponderosae Models Project Thermal Suitability for Intra- and Inter-Continental Establishment in a Changing Climate. Front. For. Glob. Chang. 2019, 2, 1. [Google Scholar] [CrossRef]
- Jia, J.; Cao, Z.; Liu, C.; Zhang, Z.; Lin, L.; Wang, Y.; Haghipour, N.; Wacker, L.; Bao, H.; Dittmar, T.; et al. Climate warming alters subsoil but not topsoil carbon dynamics in alpine grassland. Glob. Chang. Biol. 2019, 25, 4383–4393. [Google Scholar] [CrossRef]
- Abram, N.J.; Henley, B.J.; Gupta, A.S.; Lippmann, T.J.R.; Clarke, H.; Dowdy, A.J.; Sharples, J.J.; Nolan, R.H.; Zhang, T.; Wooster, M.J.; et al. Connections of climate change and variability to large and extreme forest fires in southeast Australia. Commun. Earth Environ. 2021, 2, 1–17. [Google Scholar] [CrossRef]
- Fernandez-Anez, N.; Krasovskiy, A.; Müller, M.; Vacik, H.; Baetens, J.; Hukić, E.; Solomun, M.K.; Atanassova, I.; Glushkova, M.; Bogunović, I.; et al. Current Wildland Fire Patterns and Challenges in Europe: A Synthesis of National Perspectives. Air Soil Water Res. 2021, 14. [Google Scholar] [CrossRef]
- EMERCOM—Ministry of Emergency Situations of Russian Federation. Available online: https://www.chs.gov.ru/ (accessed on 13 March 2022).
- INPE; Brazilian National Institute for Space Research. Available online: https://www.ov.br/inpe/pt-br (accessed on 18 March 2022).
- Natural Resources, Canada. Available online: https://www.rcan.gc.ca/home (accessed on 14 March 2022).
- National Interagency Fire Center, USA. Available online: https://www.ifc.gov/ (accessed on 15 March 2022).
- European Forest Fire Information System. Available online: https://effis.rc.ec.europa.eu/ (accessed on 13 March 2022).
- Department of Agriculture, Water and the Environment, Australia. Available online: https://www.griculture.gov.au/ (accessed on 15 March 2022).
- ISFR (India State of Forest Report, Forest Survey of India—Ministry of Environment & Forests), Dehradun, India. 2019. Available online: https://fsi.nic.in/forest-report-2019 (accessed on 13 March 2022).
- Eurostat. Available online: https://ec.uropa.eu/eurostat/web/main/data/database (accessed on 13 March 2022).
- Del Hoyo, L.V.; Isabel, M.P.M.; Vega, J.M. Empleo de Técnicas de Regresión Logística Para la Obtención de Modelos de Riesgo Humano de Incendio Forestal a Escala Regional. Boletín de la Asociación de Geógrafos Españoles. 2008. Available online: https://www.bage.age-geografia.es/ojs/index.php/bage/article/download/2027/1940 (accessed on 13 March 2022).
- Vilar, L.; Woolford, D.G.; Martell, D.L.; Martín, M.P. A model for predicting human-caused wildfire occurrence in the region of Madrid, Spain. Int. J. Wildland Fire 2010, 19, 325–327. [Google Scholar] [CrossRef]
- Srivastava, S.K.; Saran, S.; De By, R.A.; Dadhwal, V.K. A geo-information system approach for forest fire likelihood based on causative and anti-causative factors. Int. J. Geogr. Inf. Sci. 2013, 28, 427–454. [Google Scholar] [CrossRef]
- Forest Survey of India. Available online: https://fsi.ic.in/index.php (accessed on 20 March 2022).
- Civil Protection—Greece. Available online: https://www.ivilprotection.gr/en/forest-fires (accessed on 2 February 2022).
- U.S Forest Service Data Archive. Available online: https://www.s.usda.gov/rds/archive/ (accessed on 10 March 2022).
- Houghton, J.T.; Meira-Filho, L.G.; Callander, B.A.; Harris, N.; Kattenberg, A.; Maskell, K. Climate Change 1995: The Science of Climate Change; Cambridge University Press: New York, NY, USA, 1996; Available online: Digitallibrary.un.org/record/223181/files/ipcc_sar_wg_I_full_report.pdf?ln=en (accessed on 13 March 2022).
- Keane, R.E.; Burgan, R.; van Wagtendonk, J. Mapping wildland fuels for fire management across multiple scales: Integrating remote sensing, GIS, and biophysical modeling. Int. J. Wildland Fire 2001, 10, 301–309. [Google Scholar] [CrossRef]
- Schlobohm, P.; Brain, J. Gaining an Understanding of the National Fire Danger Rating System. National Wildfire Coordinating Group, PMS, 932. 2002. Available online: https://www.nwcg.gov/sites/default/files/products/pms932.pdf (accessed on 30 November 2021).
- McArthur, A.G. Fire Behaviour in Eucalypt Forests. 1967. Available online: http://vgls.sdp.sirsidynix.net.au/client/search/asset/1299701/0 (accessed on 10 December 2021).
- Deeming, J.E.; Burgan, R.E.; Cohen, J.D. The National Fire-Danger Rating System—1978; General Technical Report INT-39; USDA Forest Service, Intermountain Forest and Range Experiment Station: Ogden, UT, USA, 1977; 63p. Available online: https://www.fs.usda.gov/rm/pubs_series/int/gtr/int_gtr039.pdf (accessed on 25 November 2021).
- Van Wagner, C.E. Structure of the Canadian Forest Fire Weather Index; Environment Canada, Forestry Service: Ottawa, ON, Canada, 1974; Volume 1333, Available online: https://meteo-wagenborgen.nl/wp/wp-content/uploads/2019/08/van-Wagner-1974.pdf (accessed on 25 November 2021).
- Burgan, R.E.; Hartford, R.A. Monitoring Vegetation Greenness with Satellite Data; US Department of Agriculture, Forest Service, Intermountain Research Station: Ogden, UT, USA, 1993; Volume 297. [Google Scholar] [CrossRef] [Green Version]
- Chuvieco, E. Remote Sensing of Large Wildfires in the European Mediterranean Basin; Global Forest Resources Assessment 2020: Main Report; FAO: Rome, Italy, 2020; ISBN 3540657673. [Google Scholar]
- Cardille, J.A.; Ventura, S.J.; Turner, M.G. Environmental and social factors influencing wildfires in the Upper Midwest, United States. Ecol. Appl. 2001, 11, 111–127. [Google Scholar] [CrossRef]
- Chuvieco, E.; Aguado, I.; Dimitrakopoulos, A.P. Conversion of fuel moisture content values to ignition potential for integrated fire danger assessment. Can. J. For. Res. 2004, 34, 2284–2293. [Google Scholar] [CrossRef]
- Cortez, P.; Morais, A.D.J.R. A Data Mining Approach to Predict Forest Fires Using Meteorological Data. 2007. Available online: http://www3.dsi.uminho.pt/pcortez/fires.pdf (accessed on 20 December 2021).
- Martínez, J.; Vega-Garcia, C.; Chuvieco, E. Human-caused wildfire risk rating for prevention planning in Spain. J. Environ. Manag. 2009, 90, 1241–1252. [Google Scholar] [CrossRef]
- Ponomarev, E.I.; Ivanov, V.; Korshunov, N. System of Wildfires Monitoring in Russia. In Wildfire Hazards, Risks and Disasters; Elsevier: Amsterdam, The Netherlands, 2015; pp. 187–205. [Google Scholar] [CrossRef]
- Rodrigues, M.; Jiménez-Ruano, A.; Peña-Angulo, D.; de la Riva, J. A comprehensive spatial-temporal analysis of driving factors of human-caused wildfires in Spain using Geographically Weighted Logistic Regression. J. Environ. Manag. 2018, 225, 177–192. [Google Scholar] [CrossRef] [PubMed] [Green Version]
- Vasilakos, C.; Kalabokidis, K.; Hatzopoulos, J.; Kallos, G.; Matsinos, Y. Integrating new methods and tools in fire danger rating. Int. J. Wildland Fire 2007, 16, 306–316. [Google Scholar] [CrossRef]
- Müller, M.M.; Vilà-Vilardell, L.; Vacik, H. Towards an integrated forest fire danger assessment system for the European Alps. Ecol. Inform. 2020, 60, 101151. [Google Scholar] [CrossRef]
- Mazzeo, G.; De Santis, F.; Falconieri, A.; Filizzola, C.; Lacava, T.; Lanorte, A.; Marchese, F.; Nolè, G.; Pergola, N.; Pietrapertosa, C.; et al. Integrated Satellite System for Fire Detection and Prioritization. Remote Sens. 2022, 14, 335. [Google Scholar] [CrossRef]
- Allen, R.G.; Pereira, L.S.; Raes, D.; Smith, M. Crop Evapotranspiration: Guidelines for Computing Crop Water Requirements; FAO: Rome, Italy, 1998; Available online: http://www.fao.org/docrep/x0490e/x0490e00.htm (accessed on 23 March 2022).
- Bachmann, A.; Allgöwer, B. A consistent wildland fire risk terminology is needed. Fire Manag. Today 2001, 61, 28–33. Available online: https://www.frames.gov/documents/usfs/fmt/fmt_61-4.pdf#page=28 (accessed on 23 July 2022).
- Page, M.J.; McKenzie, J.E.; Bossuyt, P.M.; Boutron, I.; Hoffmann, T.C.; Mulrow, C.D.; Shamseer, L.; Tetzlaff, J.M.; Akl, E.A.; Brennan, S.E.; et al. The PRISMA 2020 Statement: An Updated Guideline for Reporting Systematic Reviews. BMJ Br. Med. J. 2021, 372, n71. [Google Scholar] [CrossRef]
- Li, X.; Zhao, G.; Yu, X.; Yu, Q. A comparison of forest fire indices for predicting fire risk in contrasting climates in China. Nat. Hazards 2013, 70, 1339–1356. [Google Scholar] [CrossRef]
- Cruz, M.; Gould, J.S.; Alexander, M.E.; Sullivan, A.; McCaw, W.L.; Matthews, S. Empirical-based models for predicting head-fire rate of spread in Australian fuel types. Aust. For. 2015, 78, 118–158. [Google Scholar] [CrossRef]
- Pagnon Eriksson, C.; Johansson, N. Review of Wildfire Indices: Indices Applicable for a Swedish Context. Division of Fire Safety Engineering, Lund, Sweden: TVBB, No. 3233. 2020. Available online: https://lucris.lub.lu.se/ws/portalfiles/portal/87339976/Review_of_wildfire_indices_Indices_applicable_for_a_Swedish_context.pdf (accessed on 15 April 2022).
- Baijnath-Rodino, J.A.; Foufoula-Georgiou, E.; Banerjee, T. Reviewing the “Hottest” Fire Indices Worldwide. ESS Open Archive 2020. [Google Scholar] [CrossRef]
- Chronopoulos, K.; Matsoukis, A. Meteorological Forest Fire Risk: A brief review. Acad. Lett. 2021. Article 364. [Google Scholar] [CrossRef]
- Steinfeld, D.; Peter, A.; Martius, O.; Brönnimann, S. Assessing the performance of various fire weather indices for wildfire occurrence in Northern Switzerland. EGUsphere 2022, in press. [Google Scholar] [CrossRef]
- Stocks, B.J.; Lawson, B.D.; Alexander, M.E.; Wagner, C.V.; McAlpine, R.S.; Lynham, T.J.; Dube, D.E. The Canadian forest fire danger rating system: An overview. For. Chron. 1989, 65, 450–457. Available online: https://pubs.cif-ifc.org/doi/pdf/10.5558/tfc65450-6?download=true (accessed on 30 April 2022). [CrossRef]
- Lawson, B.D.; Armitage, O.B. Weather Guide for the Canadian Forest Fire Danger Rating System. 2008. Available online: https://docs.niwa.co.nz/eco/fwsys/ref/2008CFFDRSWeatherGuide.pdf (accessed on 11 June 2022).
- De Groot, W.J. Examples of Canadian Forest Fire Behavior Prediction System fuel types in Saskatchewan; Canadian Forest Service, Forestry Canada, Northern Forestry Centre: Edmonton, AB, Canada, 1993; Available online: https://cfs.nrcan.gc.ca/publications?id=11038 (accessed on 13 March 2022).
- Dowdy, A.J. Climatological Variability of Fire Weather in Australia. J. Appl. Meteorol. Clim. 2018, 57, 221–234. [Google Scholar] [CrossRef]
- Van Wagner, C.E. Development and structure of the Canadian Forest Fire Weather Index System. Can. For. Serv. For. Tech. Rep. 1987, 35, 37. Available online: https://d1ied5g1xfgpx8.cloudfront.net/pdfs/19927.pdf (accessed on 25 November 2021).
- Van Wagner, C.E.; Pickett, T.L. Equations and FORTRAN program for the Canadian Forest Fire Weather Index System. Can. For. Serv. Ott. ON. For. Tech. Rep. 1985, 33, 18. Available online: https://d1ied5g1xfgpx8.cloudfront.net/pdfs/19973.pdf (accessed on 25 November 2021).
- Byram, G.M. Combustion of Forest Fuels. Forest Fire: Control and Use. 1959; pp. 61–89. Available online: https://www.frames.gov/documents/behaveplus/publications/Byram_1959_CombustionOfForestFuels.pdf (accessed on 30 May 2022).
- Lawson, B.D. Fire Spread in Lodgepole Pine Stands. Master’s Thesis, University of Montana, Missoula, MT, USA, 1972. Available online: https://scholarworks.umt.edu/cgi/viewcontent.cgi?article=3376&context=etd (accessed on 20 July 2022).
- Van Wagner, C.E. Three Experimental Fires in Jack Pine Stands. 1966. Available online: https://d1ied5g1xfgpx8.cloudfront.net/pdfs/24667.pdf (accessed on 25 November 2021).
- Fogarty, L.G.; Pearce, H.G.; Catchpole, W.R.; Alexander, M.E. Adoption vs Adaptation: Lessons from applying the Canadian Forest Fire Danger Rating System in New Zealand. In Proceedings of the III International Conference on Forest Fire Research, 14th Conference on Fire and Forest Meteorology, Luso, Portugal, 16–20 November 1998; ADAI: Coimbra, Portugal, 1998. Available online: https://d1ied5g1xfgpx8.cloudfront.net/pdfs/18753.pdf (accessed on 13 March 2022).
- López, A.S.; San-Miguel-Ayanz, J.; Burgan, R.E. Integration of satellite sensor data, fuel type maps and meteorological observations for evaluation of forest fire risk at the pan-European scale. Int. J. Remote Sens. 2002, 23, 2713–2719. [Google Scholar] [CrossRef]
- Groot, W.J.D.; Field, R.D.; Brady, M.A.; Roswintiarti, O.; Mohamad, M. Development of the Indonesian and Malaysian fire danger rating systems. Mitig. Adapt. Strateg. Glob. Chang. 2006, 12, 165–180. Available online: http://www.columbia.edu/~rf2426/index_files/deGrootetal2006MITI.pdf (accessed on 13 March 2022). [CrossRef]
- Dimitrakopoulos, A.P.; Bemmerzouk, A.M.; Mitsopoulos, I.D. Evaluation of the Canadian fire weather index system in an eastern Mediterranean environment. Meteorol. Appl. 2011, 18, 83–93. [Google Scholar] [CrossRef]
- Giannakopoulos, C.; Lesager, P.; Moriondo, M.; Bindi, M.; Karali, A.; Hatzaki, M.; Kostopoulou, E. Comparison of fire danger indices in the Mediterranean for present day conditions. Iforest Biogeosci. For. 2012, 5, 197–203. [Google Scholar] [CrossRef] [Green Version]
- Bradshaw, L.; Deeming, J.E.; Burgan, R.E.; Cohen, J.D. 1978-National Fire-Danger Rating System—Technical Documentation; Gen. Tech. Rep. INT 169; Intermountain Forest and Range Experiment Station, Forest Service, U.S. Department of Agriculture: Ogden, UT, USA, 1983; 44p, Available online: https://www.fs.fed.us/rm/pubs_int/int_gtr169.pdf (accessed on 13 March 2022).
- Burgan, R.E. 1988 Revisions to the 1978 National Fire-Danger Rating System; Research Paper SE-273; USDA Forest Service, Southeastern Forest Experiment Station: Asheville, NC, USA, 1988; p. 39. Available online: https://www.srs.fs.usda.gov/pubs/rp/rp_se273.pdf (accessed on 18 December 2021).
- Cohen, J.D.; Deeming, J.E. The National Fire Danger Rating System: Basic Equations (General Technical Report PSW-GTR-82); U.S. Department of Agriculture, Forest Service: Berkeley, CA, USA, 1985. [Google Scholar] [CrossRef]
- de Groot, W.J.; Wotton, B.M.; Flannigan, M.D. Wildland Fire Danger Rating and Early Warning Systems. In Wildfire Hazards, Risks, and Disasters; Shroder, J.F., Paton, D., Eds.; Elsevier: Dordrecht, The Netherlands, 2015; pp. 207–228. [Google Scholar] [CrossRef]
- Rothermel, R.C. Modeling Moisture Content of Fine Dead Wildland Fuels: Input to the BEHAVE Fire Prediction System (No.359); US Department of Agriculture, Forest Service, Intermountain Research Station: Ogden, UT, USA, 1986. [Google Scholar] [CrossRef] [Green Version]
- Burgan, R.; Klaver, R.W.; Klaver, J.M. Fuel Models and Fire Potential from Satellite and Surface Observations. Int. J. Wildland Fire 1998, 8, 159–170. [Google Scholar] [CrossRef]
- Helfman, R.S.; Straub, R.J.; Deeming, J.E. User’s Guide to AFFIRMS: Time-Share Computerized Processing for Fire Danger Rating; Gen. Tech. Rep. INT-82; U.S. Department of Agriculture, Forest Service, Intermountain Forest and Range Experiment Station: Ogden, UT, USA, 1980. [Google Scholar]
- Bradshaw, L.; McCormick, E. FireFamily Plus User’s Guide, Version 2; Gen. Tech. Rep. RMRS-GTR-67; US Department of Agriculture, Forest Service, Rocky Mountain Research Station: Ogden, UT, USA, 2000; p. 67. Available online: https://www.fs.fed.us/rm/pubs/rmrs_gtr067.pdf (accessed on 13 March 2022).
- Andrews, P.L. BEHAVE: Fire Behaviour Prediction and Fuel Modeling System: BURN Subsystem, Part 2; US Department of Agriculture, Forest Service, Intermountain Research Station: Ogden, UT, USA, 1989; Volume 194, Available online: https://www.fs.fed.us/rm/pubs_int/int_gtr260.pdf (accessed on 17 May 2022).
- Fosberg, M.A.; Rothermel, R.C.; Andrews, P.L. Moisture content calculations for 1000-hour timelag fuels. For. Sci. 1981, 27, 19–26. Available online: https://www.fs.fed.us/psw/publications/fosberg/psw_1981_fosberg001.pdf (accessed on 13 March 2022).
- Fosberg, M.A. Weather in Wildland Fire Management: The Fire Weather Index; US For Serv Reprints of articles by FS employees: Ogden, UT, USA, 1978; Available online: https://agris.fao.org/agris-search/search.do?recordID=US201302440660 (accessed on 13 March 2022).
- Goodrick, S.L. Modification of the Fosberg fire weather index to include drought. Int. J. Wildland Fire 2002, 11, 205–211. Available online: https://www.srs.fs.usda.gov/pubs/ja/ja_goodrick001.pdf (accessed on 4 May 2022). [CrossRef] [Green Version]
- Andrews, P.L. BEHAVE: Fire Behaviour Prediction and Fuel Modeling System: BURN Subsystem, Part 1; US Department of Agriculture, Forest Service, Intermountain Research Station: Ogden, UT, USA, 1986; Volume 194. [Google Scholar] [CrossRef] [Green Version]
- Rothermel, R.C. A Mathematical Model for Fire Spread Predictions in Wildland Fuels; Res. Pap. INT-1 15; Intermountain Forest and Range Experiment Station, Forest Service, U.S. Department of Agriculture: Ogden, UT, USA, 1972; p. 40. Available online: https://www.fs.fed.us/rm/pubs_int/int_rp115.pdf (accessed on 15 December 2021).
- Chandler, C.; Cheney, P.; Thomas, P.; Trabaud, L.; Williams, D. Fire in Forestry. Volume 1. Forest Fire Behavior and Effects. Volume 2. Forest Fire Management and Organization; John Wiley & Sons, Inc.: Hoboken, NJ, USA, 1983. [Google Scholar]
- Srock, A.F.; Charney, J.J.; Potter, B.E.; Goodrick, S.L. The Hot-Dry-Windy Index: A New Fire Weather Index. Atmosphere 2018, 9, 279. [Google Scholar] [CrossRef] [Green Version]
- Haines, D.A. A lower atmospheric severity index for wildland fire. Natl. Weather. Dig. 1988, 13, 23–27. Available online: https://github.com/Unidata/MetPy/files/1519394/Haines.1988.pdf (accessed on 2 September 2022).
- Noble, I.R.; Bary, G.A.V.; Gill, A.M. McArthur’s fire-danger meters expressed as equations. Aust. J. Ecol. 1980, 5, 201–203. [Google Scholar] [CrossRef]
- Griffiths, D. Improved Formula for the Drought Factor in McArthur’s Forest Fire Danger Meter. Aust. For. 1999, 62, 202–206. [Google Scholar] [CrossRef]
- Purton, C.M. Equations for the McArthur Mark 4 Grassland Fire Danger Meter; Commonwealth of Australia Bureau of Meteorology Meteorological Note No. 147; Bureau of Meteorology: Melbourne, VC, Australia, 1982; p. 12. Available online: https://naturaldisaster.royalcommission.gov.au/system/files/exhibit/BOM.9004.0001.0405.pdf (accessed on 30 June 2022).
- Sneeuwjagt, R.J.; Peet, G.B. Forest Fire Behaviour Tables for Western Australia, 3rd ed.; Western Australia Department of Conservation and Land Management: Perth, WA, USA; p. 591985.
- Beck, J.A. Equations for the Forest Fire Behaviour Tables for Western Australia. CALM Sci. 1995, 1, 325–348. Available online: https://www.victoriasforestryheritage.org.au/pinefire/Beck_1995_EquationsForTheForestFireBehaviourTablesForWesternAustralia.pdf (accessed on 5 May 2022).
- Sharples, J.; McRae, R.; Weber, R.; Gill, A. A simple index for assessing fire danger rating. Environ. Model. Softw. 2009, 24, 764–774. [Google Scholar] [CrossRef]
- Sharples, J.; McRae, R.; Weber, R.; Gill, A. A simple index for assessing fuel moisture content. Environ. Model. Softw. 2009, 24, 637–646. [Google Scholar] [CrossRef]
- Laing, M.V. Meteorological Note No.60; Department of Meteorological Services: Salisbury, Australia, 1978. [Google Scholar]
- Meikle, S.; Heine, J. A Fire Danger Index System for the Transvaal Lowveld and Adjoining Escarpment Areas. South Afr. For. J. 1987, 143, 55–56. [Google Scholar] [CrossRef]
- Soares, R.V. Determinação de Um índice de Perigo de Incêndio para a Região Centro Paranaense, Brasil. Master’s Thesis, CATIE/IICA, Turrialba, Costa Rica, 1972; p. 72. [Google Scholar]
- Nunes, J.R.S.; Fier, I.S.N.; Soares, R.V.; Batista, A.C. Desempenho da fórmula de monte alegre (fma) e da fórmula de monte alegre alterada (fma+) no distrito florestal de monte alegre. Floresta 2010, 40. [Google Scholar] [CrossRef] [Green Version]
- Rodríguez, N.; Moretti, A. Índice de peligro de propagación de Incendios Forestales. VI Congreso Forestal Argentino; Tomo III.: Santiago del Estero, Argentine, 1988; 5p. [Google Scholar]
- Setzer, A.W.; Sismanoglu, R.A. Risco de Fogo: Metodologia do Cálculo—Descrição Sucinta da Versão 9; Instituto Nacional de Pesquisas Espaciais: São José dos Campos, Brazil, 2012; Available online: https://queimadas.dgi.inpe.br/~rqueimadas/documentos/RiscoFogo_Sucinto_20130911.pdf (accessed on 13 June 2022).
- Sampaio, O.B. Estudo Comparativo de Índices, para Previsão de Incêndios Florestais, na Região de Coronel Fabriciano, Minas Gerais [Dissertação]; Universidade Federal de Viçosa: Viçosa, MG, USA, 1991. [Google Scholar]
- Orieux, A. Conditions météorologiques et incendies en région méditerranéenne. Rev. For. Française 1974, 26 (S), 122–129. Available online: https://hal.archives-ouvertes.fr/hal-03395671 (accessed on 27 June 2022).
- Carrega, P. L’évapotranspiration potentielle et réelle dans le Midi méditerranéen. Son originalité par rapport au reste de le France. Méditerranée 1988, 66, 3–8. Available online: https://www.persee.fr/doc/medit_0025-8296_1988_num_66_4_2575 (accessed on 20 July 2022). [CrossRef]
- Drouet, J.C.; Sol, B. Etude de Nouveaux Indices de Risques Météorologiques D’incendies de forêt en Zone Méditerranéenne. Rapport en 3 tomes; I.U.T., Aix en Provence, C.I.R.C.O.S.C., Valabre, Service Météorologique Interregional Sud-Est: Marseille-Marignane, France, 1988. [Google Scholar]
- Lourenço, L. Risco Meteorológico de Incêndio Florestal. Colectâneas Cindínicas II; Núcleo de Investigação Científica de Incêndios Florestais, Faculdade de Letras da Universidade de Coimbra: Coimbra, Portugal, 2004; ISBN 978-972-8330-16-3. Available online: https://www.researchgate.net/publication/318792210_Risco_Risco_Meteorologico_de_Incendio_Florestal_Colectaneas_Cindinicas_II/comments (accessed on 16 June 2022).
- INMG (Instituto Nacional de Meteorologia e Geofisica). Nota Explicativa Sobre o ĺndice de Risco Meteorológico de Incêndios Rurais; Divisão de Meteorologia Agrícola: Lisbon, Portugal, 1988. [Google Scholar]
- Gonçalves, Z.J.; Lourenço, L. Meteorological index of forest fire risk in the portuguese mainland territory. In Proceedings of the International Conference on Forest Fire Research, B.07-1/14. Coimbra, Portugal, 21–24 November 1990; Available online: https://www.researchgate.net/profile/Luciano-Lourenco/publication/313476213_Meteorological_index_of_forest_fire_risk_in_the_Portuguese_Mainland_Territory/links/589baf7faca2721ae1b7ab18/Meteorological-index-of-forest-fire-risk-in-the-Portuguese-Mainland-Territory.pdf (accessed on 3 April 2022).
- ICONA. Manual de Operaciones Contra Incendios Forestales. Madrid. 5.1/65. 1993. Available online: https://documentacion.fundacionmapfre.org/documentacion/publico/es/media/group/1088234.do (accessed on 17 May 2022).
- Palmieri, S.; Inghilesi, R.; Siani, A.M. Un indice meteorologico di rischio per incendi boschivi. Semin. Fight. For. Fires 1993, 15, 49–62. [Google Scholar]
- Bovio, G.; Quaglino, A.; Nosenzo, A. Individuazione di un indice di previsione per il pericolo di incendi boschivi. Monti Boschi 1984, 35, 39–44. Available online: https://iris.unito.it/handle/2318/106685 (accessed on 13 March 2022).
- Sirca, C.; Spano, D.; Duce, P.; Delogu, G.; Cicalò, G.O. Performance of a newly developed integrated fire rating index in Sardinia, Italy. In Proceedings of the “Wildfire 2007—4th International Wildland Fire Conference”, Seville, Spain, 13–17 May 2007; Viegas, X.D., Ed.; Ministry of Environment: Madrid, Spain; Junta de Andalucia: Seville, Spain, 2007. [Google Scholar]
- Spano, D.; Georgiadis, T.; Duce, P.; Rossi, F. A Fire Index for Mediterranean Vegetation Based on Micrometeorological and Ecophysiological Measurements. 2001. Available online: https://ams.confex.com/ams/pdfpapers/65497.pdf (accessed on 29 May 2022).
- Arif, A. Les Applications Météorologiques dans la lute Contre les Incendies de Forêts—Étude de cas pour la Tunisie; ESCWA: Beirut, Lebanon, 1994; p. 23. [Google Scholar]
- Angstrom, A. Riskerna for skogsbrand och deras beroende av vader och klimat (The risks for forest fires and their relation to weather and climate). Sven. Skogsvirdsforeningens Tidskr. 1942, 40, 323–343. [Google Scholar]
- Baumgartner, A.; Klemmer, L.; Raschke, E.; Waldmann, G. Waldbrände in Bayern 1950 bis 1959. Mitt. Aus Der Staatsforstverwalt. Bayerns 1967, 36, 57–79. [Google Scholar]
- Bruschek, G. Forest areas and forest fires in Brandenburg during the dry and hot summer of 1992. In The Extreme Summer of 1992 in Northern Germany; PIK Report No. 2/1; Schellnhuber, H., Enke, W., Flechsig, M., Eds.; Potsdam Institute for Climate Impact Research: Potsdam, Germany, 1994; pp. 245–264. [Google Scholar]
- Telicyn, G.P. Logarithmic index of fire weather danger for forests. Lesn. Khozyaistvo 1970, 11, 1–581970. [Google Scholar]
- Nesterov, V.G. Combustibility of the Forest and Methods for Its Determination; Goslesbumizdat: Moscow, Russia, 1949; 76p. (In Russian) [Google Scholar]
- Käse, H. Ein Vorschlag für eine Methode zur Bestimmung und Vorhersage der Waldbrandgefährdung mit Hilfe Komplexer Kennziffern; Akademie Verlag: Berlin, Germany, 1969. [Google Scholar]
- Zhdanko, V.A. Scientific basis of development of regional scales and their importance for forest fire management. In Contemporary Problems of Forest Protection from Fire and Firefighting; Melekhov, I.S., Ed.; Lesnaya Promyshlennost’ Publ.: Moscow, Russia, 1965; pp. 53–86. [Google Scholar]
- Venäläinen, A.R.I.; Heikinheimo, M. The spatial variation of long-term mean global radiation in Finland. Int. J. Climatol. A J. R. Meteorol. Soc. 1997, 17, 415–426. [Google Scholar] [CrossRef]
- Munger, T.T. Graphic method of representing and comparing drought intensities. Mon. Weather. Rev. 1916, 44, 642–643. Available online: https://journals.ametsoc.org/downloadpdf/journals/mwre/44/11/1520-0493_1916_44_642_gmorac_2_0_co_2.xml (accessed on 27 June 2022). [CrossRef]
- Keetch, J.J.; Byram, G.M. A Drought Index for Forest Fire Control; Research Paper SE-38; USDA Forest Service, Southeast Forest Experiment Station: Ashville, NC, USA, 1968; p. 32. Available online: https://www.srs.fs.usda.gov/pubs/rp/rp_se038.pdf (accessed on 5 January 2022).
- Mount, A.B. The Derivation and Testing of a Soil Dryness Index Using Run-Off Data; Bull. 4; Forestry Commission: Tasmania, Australia, 1972; 30p, ISBN 072460006X. [Google Scholar]
- Palmer, W.C. Meteorological Drought; US Department of Commerce, Weather Bureau: Washington, DC, USA, 1965; Volume 30, Available online: https://www.droughtmanagement.info/literature/USWB_Meteorological_Drought_1965.pdf (accessed on 20 July 2022).
- Tsakiris, G.; Vangelis, H. Establishing a drought index incorporating evapotranspiration. Eur. Water 2005, 9, 3–11. Available online: https://www.ewra.net/ew/pdf/EW_2005_9-10_01.pdf (accessed on 24 June 2022).
- Stephenson, N.L. Climatic control of vegetation distribution—The role of the water balance. Am. Nat. 1990, 135, 649–670. Available online: https://www.jstor.org/stable/2462028 (accessed on 23 June 2022). [CrossRef]
- Landsberg, J. Physiological Ecology of Forest Production; Academic Press: London, UK, 1986; 198p. [Google Scholar]
- Darcy, H. Les Fontaines Publiques de la Ville de Dijon; Dalmont: Paris, France, 1856; Available online: https://gallica.bnf.fr/ark:/12148/bpt6k624312/f1n657.pdf (accessed on 20 July 2022).
- McDowell, N.G.; Allen, C.D. Darcy’s law predicts widespread forest mortality under climate warming. Nat. Clim. Chang. 2015, 5, 669–672. [Google Scholar] [CrossRef]
- Tucker, C.J. Red and photographic infrared linear combinations for monitoring vegetation. Remote Sens. Environ. 1979, 8, 127–150. [Google Scholar] [CrossRef] [Green Version]
- Gao, B.-C. NDWI—A normalized difference water index for remote sensing of vegetation liquid water from space. Remote Sens. Environ. 1996, 58, 257–266. [Google Scholar] [CrossRef]
- McFeeters, S.K. The use of the Normalized Difference Water Index (NDWI) in the delineation of open water features. Int. J. Remote Sens. 1996, 17, 1425–1432. [Google Scholar] [CrossRef]
- Hardisky, M.A.; Klemas, V.; Smart, R.M. The influence of soil salinity, growth form, and leaf moisture on the spectral radiance of Spartina alterniflora canopies. Photogramm. Eng. Remote Sens. 1983, 49, 77–83. Available online: https://www.asprs.org/wp-content/uploads/pers/1983journal/jan/1983_jan_77-83.pdf (accessed on 23 July 2022).
- Wang, L.; Qu, J.J. NMDI: A normalized multi-band drought index for monitoring soil and vegetation moisture with satellite remote sensing. Geophys. Res. Lett. 2007, 34, L20405-1-5. [Google Scholar] [CrossRef]
- Huete, A.R. A soil-adjusted vegetation index (SAVI). Remote Sens. Environ. 1988, 25, 295–309. [Google Scholar] [CrossRef]
- Huete, A.; Didan, K.; Miura, T.; Rodriguez, E.P.; Gao, X.; Ferreira, L.G. Overview of the radiometric and biophysical performance of the MODIS vegetation indices. Remote Sens. Environ. 2002, 83, 195–213. [Google Scholar] [CrossRef]
- Burgan, R.E.; Andrews, P.L.; Bradshaw, L.S.; Chase, C.H.; Hartford, R.A.; Latham, D.J. Current status of the wildland fire assessment system (WFAS). Fire Manag. Notes 1997, 57, 14–17. Available online: https://data.fs.usda.gov/wwwbeta/sites/default/files/legacy_files/fire-management-today/057-2_0.pdf#page=14 (accessed on 20 March 2022).
- Sudiana, D.; Kuze, H.; Takeuchi, N.; Burgan, R.E. Indonesian Forest Fire—A Quantitave Assessment. In Proceedings of the 12th Indonesian Scientific Meeting, Osaka, Japan, 6–September 2003; 2003. Available online: https://staff.ui.ac.id/system/files/users/dodi.sudiana/publication/ti-12-indonesianforestfireaquantitaveassessment.pdf (accessed on 28 June 2022).
- Huesca, M.; Litago, J.; Palacios-Orueta, A.; Montes, F.; Sebastián-López, A.; Escribano, P. Assessment of forest fire seasonality using MODIS fire potential: A time series approach. Agric. For. Meteorol. 2009, 149, 1946–1955. Available online: https://www.pc.noaa.gov/exper/firecomp/INFO/fosbinfo.html (accessed on 28 June 2022). [CrossRef]
- Fosberg, M.A. Theory of precipitation effects on dead cylindrical fuels. For. Sci. 1972, 18, 98–108. [Google Scholar] [CrossRef]
- Andrews, P.L. BehavePlus Fire Modeling System, Version 5: Variables. Gen. Tech. Rep. RMRS-GTR-213 Revised; Department of Agriculture, Forest Service, Rocky Mountain Research Station: Fort Collins, CO, USA, 2009; p. 111. Available online: https://www.fs.fed.us/rm/pubs/rmrs_gtr213.pdf (accessed on 26 July 2022).
- Andrews, P.L.; Rothermel, R.C. Charts for Interpreting Wildland Fire Behaviour Characteristics; US Department of Agriculture, Forest Service, Intermountain Forest and Range Experiment Station: Ogden, UT, USA, 1982; Volume 131, Available online: https://www.fs.fed.us/rm/pubs_int/int_gtr131.pdf (accessed on 17 May 2022).
- McDonald, J.M.; Srock, A.F.; Charney, J.J. Development and Application of a Hot-Dry-Windy Index (HDW) Climatology. Atmosphere 2018, 9, 285. [Google Scholar] [CrossRef] [Green Version]
- Kulseth, M.G. An Evaluation of the Hot-Dry-Windy Fire-Weather Index Using Historical Fire Events and Meteorological Analysis Datasets; Michigan State University: East Lansing, MI, USA, 2019; Available online: https://d.lib.msu.edu/etd/47779/datastream/OBJ/view/ (accessed on 28 August 2022).
- Watts, A.; Potter, B.; Charney, J.; Srock, A. The Hot-Dry-Windy Index: A New Tool for Forecasting Fire Weather. Science Findings 227; US Department of Agriculture, Forest Service, Pacific Northwest Research Station: Portland, OR, USA, 2020; Available online: https://www.fs.fed.us/pnw/sciencef/scifi227.pdf (accessed on 18 July 2022).
- Choi, G.; Kim, J.; Won, M.S. Spatial patterns and temporal variability of the Haines Index related to the wildland fire growth potential over the Korean Peninsula. J. Korean Geogr. Soc. 2006, 41, 168–187. Available online: https://citeseerx.ist.psu.edu/viewdoc/download?doi=10.1.1.486.5239&rep=rep1&type=pdf (accessed on 18 May 2022).
- Potter, B.E.; Winkler, J.A.; Wilhelm, D.F.; Shadbolt, R.P.; Bian, X. Computing the Low-Elevation Variant of the Haines Index for Fire Weather Forecasts. Weather Forecast 2008, 23, 159–167. [Google Scholar] [CrossRef]
- Barberà, M.J.; Niclòs, R.; Estrela, M.J.; Valiente, J.A. Climatology of the stability and humidity terms in the Haines Index to improve the estimate of forest fire risk in the Western Mediterranean Basin (Valencia region, Spain). Int. J. Clim. 2014, 35, 1212–1223. [Google Scholar] [CrossRef]
- Reges, H.W.; Alden, S. Use of the Haines Index to evaluate large fire potential for interior Alaska. In Proceedings of the Second Conference on Fire and Forest Meteorology, American Meteorological Society, Phoenix, AZ, USA, 4–8 January 1998. [Google Scholar]
- Croft, P.J.; Potter, B.E.; Reed, A. The analysis of the Haines Index climatology for the eastern Unites States, Alaska, Hawaii, and Puerto Rico. In Atmospheric stability environments and fire weather in Australia—Extending the Haines Index, Proceedings of the 4th Symposium on Fire and Forest Meteorology, American Meteorological Society, Reno, NV, USA, 13–15 November 2001; Technical Report No. 20; Mills, G., McCaw, L., Eds.; The Centre for Australian Weather and Climate Research: Melbourne, Australia, 2002; pp. 242–246. ISBN 978-1-921605-56-7. Available online: https://nla.gov.au/nla.obj-2968722768/view (accessed on 4 March 2022).
- Potter, B.E.; Goodrick, S. Performance of the Haines Index during August 2000 for Montana. In Proceedings of the 4th Symposium on Fire and Forest Meteorology, Reno, NV, USA, 13–15 November 2001; American Meteorological Society: Boston, MA, USA, 2003; pp. 233–236. Available online: https://www.nrs.fs.fed.us/pubs/jrnl/2003/nc_2003_potter_005.pdf (accessed on 30 May 2022).
- Mills, G.A.; McCaw, W.L. Atmospheric Stability Environments and Fire Weather in Australia: Extending the Haines Index; Centre for Australian Weather and Climate Research: Aspendale, VIC, Australia, 2010; ISBN 978-1-921605-56-7. Available online: https://www.cawcr.gov.au/technical-reports/CTR_020.pdf (accessed on 5 April 2022).
- Tatli, H.; Türkeş, M. Climatological evaluation of Haines forest fire weather index over the Mediterranean Basin. Meteorol. Appl. 2013, 21, 545–552. [Google Scholar] [CrossRef]
- Stuart, M. A comparison of fire danger rating systems for use in forests. Aust. Meteorol. Oceanogr. J. 2009, 58, 41–48. [Google Scholar] [CrossRef]
- Lucas, C. Fire climates of Australia: Past, present and future. In Proceedings of the 6th Symposium on Fire and Forest Meteorology, Canmore, AB, Canada, 25–27 October 2005; pp. 25–27. Available online: https://www.bushfirecrc.com/sites/default/files/managed/resource/97592.pdf (accessed on 8 July 2022).
- Gouvas, M. The South African Lowveld Fire Danger Index (LFDI) and its application advantages in Greece (in Greek). In Proceedings of the 19th Hellenic Forestry Conference, Litochoro, Greece, 29 September–2 October 2019; pp. 268–278. Available online: https://www.academia.edu/40551183/The_South_African_Lowveld_Fire_Danger_Index_LFDI_and_its_application_advantages_in_Greece_in_Greek_ (accessed on 5 July 2022).
- White, L.A.S.; White, B.L.A.; Ribeiro, G.T. Evaluation of Forest Fire Danger Indexes for Eucalypt Plantations in Bahia, Brazil. Int. J. For. Res. 2015, 2015, 613736. [Google Scholar] [CrossRef] [Green Version]
- Cavalcante, R.B.; Souza, B.M.; Ramos, S.J.; Gastauer, M.; Junior, W.R.N.; Caldeira, C.F.; Souza-Filho, P.W. Assessment of fire hazard weather indices in the eastern Amazon: A case study for different land uses. Acta Amaz. 2021, 51, 352–362. [Google Scholar] [CrossRef]
- Torres, F.T.P.; Lima, G.S.; Alvares, B.F. Fire behavior variables and hazard indices of forest fires. Rev. Árvore 2018, 42. [Google Scholar] [CrossRef]
- Torres, F.T.P.; Martins, S.V.; Lima, G.S.; Valverde, S.R. Analysis of efficiency of fire danger indices in forest fire prediction. Rev. Árvore 2017, 41. [Google Scholar] [CrossRef] [Green Version]
- Dentoni, M.C. Sistema de Evaluación de Peligro de Incendios Forestales, una Experiencia Argentina [en línea]; Boletín INIA—Instituto de Investigaciones Agropecuarias: Chillán, Chile, 2006; no. 145; Available online: https://hdl.handle.net/20.500.14001/7139 (accessed on 19 July 2022).
- Martínez Techera, C. Análisis de Índices de Riesgo de Incendio Forestal y su Aplicabilidad en el Uruguay, Tesis de Grado; Universidad de la República (Uruguay), Facultad de Ciencias: Montevideo, Uruguay, 2021; Available online: https://hdl.handle.net/20.500.12008/31085 (accessed on 19 July 2022).
- Setzer, A.; Pereira, M.C.; Pereira, J.R. O uso de satélites NOAA na detecção de queimadas no Brasil. Climanálise 1992, 7, 40–531992. [Google Scholar]
- Setzer, A.W.; Sismanoglu, R.A.; dos Santos, J.G.M. Método do Cálculo do Risco de Fogo do Programa do INPE-Versão 11, junho/2019. CEP, 12, 010. Sao Jose dos Campos, Brasil. 2019. Available online: http://mtc-m21c.sid.inpe.br/col/sid.inpe.br/mtc-21c/2019/11.21.11.03/doc/publicacao.pdf (accessed on 13 June 2022).
- Torres, F.T.P.; Lima, G.S. Forest Fire Hazard in the Serra do Brigadeiro State Park (MG). Floresta Ambient. 2019, 26. [Google Scholar] [CrossRef]
- Sampaio, O.B. Análise da Eficiência de Quatro Índices na Previsão de Incêndios Florestais Para a Região de Agudos—SP. [tese] Curitiba: Universidade Federal do Paraná. 1999. Available online: https://acervodigital.ufpr.br/bitstream/handle/1884/25618/T%20-%20OTAVIO%20BEZERRA%20SAMPAIO.pdf?sequence=1&isAllowed=y (accessed on 10 June 2022).
- Pausas, J.G.; Vallejo, R.V. The role of fire in the European Mediterranean ecosystems. In Remote Sensing of Large Wildfires in the European Mediterranean Basin; Chuvieco, E., Ed.; Springer-Verlag: Berlin/Heidelberg, Germany, 1999; pp. 3–16. ISBN 3540657673. [Google Scholar]
- Westerling, A.L.; Bryant, B.P. Climate change and wildfire in California. Clim. Chang. 2007, 87, 231–249. [Google Scholar] [CrossRef]
- Barriopedro, D.; Fischer, E.M.; Luterbacher, J.; Trigo, R.M.; García-Herrera, R. The Hot Summer of 2010: Redrawing the Temperature Record Map of Europe. Science 2011, 332, 220–224. [Google Scholar] [CrossRef]
- FAO. Global Forest Resources Assessment 2020: Main Report; Food and Agriculture Organization: Rome, Italy, 2020. [Google Scholar]
- San-Miguel-Ayanz, J.; Schulte, E.; Schmuck, G.; Camia, A.; Strobl, P.; Liberta, G.; Amatulli, G. Comprehensive monitoring of wildfires in Europe: The European forest fire information system (EFFIS). In Approaches to Managing Disaster-Assessing Hazards, Emergencies and Disaster Impacts; Tiefenbacher, J.P., Ed.; IntechOpen: London, UK, 2012; Chapter 5; Available online: https://ec.europa.eu/environment/forests/pdf/InTech.pdf (accessed on 12 June 2022).
- Thornthwaite, C.W.; Mather, J.R. Instructions and Tables for Computing Potential Evapotranspiration and the Water Balance; Laboratory of Climatology: Centerton, NJ, USA, 1957; Available online: https://www.wrc.udel.edu/wp-content/publications/ThornthwaiteandMather1957Instructions_Tables_ComputingPotentialEvapotranspiration_Water%20Balance.pdf (accessed on 23 March 2022).
- Thornthwaite, C.W. An Approach toward a Rational Classification of Climate. Geogr. Rev. 1948, 38, 55–94. [Google Scholar] [CrossRef]
- Ponce, V.M. Engineering Hydrology: Principles and Practices; Prentice Hall: Englewood Cliffs, NJ, USA, 1989; Volume 640, Available online: http://ponce.sdsu.edu/330textbook_hydrology_chapters.html (accessed on 29 June 2022).
- Carrega, P. A Meteorological Index of Forest Fire Hazard in Mediterranean France. Int. J. Wildland Fire 1991, 1, 79–86. [Google Scholar] [CrossRef]
- Sol, B. Estimation du risque météorologique d’incendies de forêts dans le sud-est de la France. Rev. For. Française Spécial 1990, 263–271. Available online: https://hal.archives-ouvertes.fr/hal-03425206/document (accessed on 24 April 2022). [CrossRef] [Green Version]
- Drouet, J.C.; Sol, B. Mise au point d’un indice numérique de risque météorologique d’incendies de forêts. Dossier: Forêts et incendies 1991–1992. Mediterranéenne 1993, 14, 155–162. Available online: https://hal.archives-ouvertes.fr/hal-03557194/document (accessed on 20 January 2022).
- Allen, F.R. The Management of Risk to Society from Potential Accidents; Elsevier Applied Science: London, UK, 1998; ISBN 97813158980701992. [Google Scholar]
- Camia, A.; Bovio, G. Description of the Indices Implemented in EUDIC Software for the European Meteorological Forest fire Risk Mapping; European Commission Join Research Center: Tourin, Italy, 2000; Technical Report. [Google Scholar]
- Almeida, R. Noções Básica de Meteorologia e Incêndios Rurais, ISEC. Pós-Grad. Em Riscos E Proteção Civ. 2020. Available online: https://fogos.icnf.pt/download/ (accessed on 13 March 2022).
- WSL Swiss Federal Institute for Forest, Snow and Landscape Research. Available online: https://wikifire.sl.ch/tiki-index515f.html?page=Introduction&structure=Fire (accessed on 30 June 2022).
- Mestre, A.; Allue, M.; Peral, C.; Santamaria, R.; Lazcano, M. Operational Fire Danger Rating System in Spain. In Proceedings of the International Workshop on Operational Weather Systems for Fire Danger Rating, Edmonton, AT, Canada, 14–16 July 2008. [Google Scholar]
- Ventura, F.; Marletto, V.; Zinoni, F. Un metodo per il calcolo dell’indice meteorologico del rischio di incendio forestale. Sherwood 2001, 68, 13–18. [Google Scholar]
- Marletto, V.; Ventura, F. Indici Meteorologici per il Calcolo del Rischio D’incendio Torestale. 2002. Available online: http://www.agrometeorologia.it/documenti/Aiam2002/17_Marletto.pdf (accessed on 25 May 2022).
- Ricotta, C.; Guglietta, D. Indici di Rischio di INCENDIO Boschivo.IN Il Sistema di Videosorveglianzae Telerilevamento Degli Incendi Boschivi. 2010. Available online: https://www.vigilfuoco.it/aspx/isaViewDoc.aspx?id=21&t=2 (accessed on 24 May 2022).
- Xiang, K.; Li, Y.; Horton, R.; Feng, H. Similarity and difference of potential evapotranspiration and reference crop evapotranspiration—A review. Agric. Water Manag. 2020, 232, 106043. [Google Scholar] [CrossRef]
- McMahon, T.A.; Peel, M.C.; Lowe, L.; Srikanthan, R.; McVicar, T.R. Estimating actual, potential, reference crop and pan evaporation using standard meteorological data: A pragmatic synthesis. Hydrol. Earth Syst. Sci. 2013, 17, 1331–1363. Available online: https://hess.copernicus.org/articles/17/1331/2013/hess-17-1331-2013.pdf (accessed on 20 July 2022). [CrossRef] [Green Version]
- Sirca, C.; Salis, M.; Arca, B.; Duce, P.; Spano, D. Assessing the performance of fire danger indexes in a Mediterranean area. Iforest Biogeosci. For. 2018, 11, 563–571. [Google Scholar] [CrossRef] [Green Version]
- Clément, J. International Handbook on Forest Fire Protection; FAO Forestry Department Press: Aix en Provence, France, 2001; 163p, Available online: https://www.fao.org/forestry/27221-06293a5348df37bc8b14e24472df64810.pdf (accessed on 13 June 2022).
- Sebei, S. Le degré météorologique du risque incendie de forêt (DMRIF): Méthode d’évaluation du risque d’incendie en Tunisie. In Proceedings of the XXVIII Colloque de L’association Internationale de Climatologie, Liège, Belgium, 4 July 2015; Available online: http://climato.be/aic/colloques/actes/ACTES_AIC2015/2%20Climatologie%20appliquee/034-SEBEI-212-217.pdf (accessed on 3 July 2022).
- Groisman, P.Y.; Sherstyukov, B.G.; Razuvaev, V.N.; Knight, R.W.; Enloe, J.G.; Stroumentova, N.S.; Whitfield, P.H.; Førland, E.; Hannsen-Bauer, I.; Tuomenvirta, H.; et al. Potential forest fire danger over Northern Eurasia: Changes during the 20th century. Glob. Planet. Chang. 2007, 56, 371–386. [Google Scholar] [CrossRef] [Green Version]
- Ou, T. Droughts and Wildfires in Sweden—Past Variation and Future Projection; Myndigheten för Samhällsskydd och Beredskap (MSB1112): Karlstad, Sweden, 2017. Available online: https://www.msb.se/siteassets/dokument/publikationer/english-publications/droughts-and-wildfires-in-sweden-past-variation-and-future-projection.pdf (accessed on 12 May 2022).
- De Rigo, D.; Libertà, G.; Durrant, T.H.; Vivancos, T.A.; San-Miguel-Ayanz, J. Forest Fire Danger Extremes in Europe under Climate Change: Variability and Uncertainty. Ph.D. Thesis, Publications Office of the European Union, Luxembourg, 2017. Available online: https://hal.archives-ouvertes.fr/hal-02906196/document (accessed on 29 September 2022).
- Knorr, W.; Jiang, L.; Arneth, A. Climate, CO2 and human population impacts on global wildfire emissions. Biogeosciences 2016, 13, 267–282. [Google Scholar] [CrossRef] [Green Version]
- Langholz, H.; Schmidtmayer, E. Meteorologische Verfaren zur Abschatzung des Waldbrandrisikos. Allg. Forst 1993, 48, 394–396. [Google Scholar]
- Penman, H.L. Physics in Agriculture. J. Sci. Instrum. 1948, 25, 425–432. [Google Scholar] [CrossRef]
- Vadrevu, K.P.; Ohara, T.; Justice, C. Biomass Burning in South and Southeast Asia: Impacts on the Biosphere; CRC Press: Boca Raton, FL, USA, 2021; Volume 2, ISBN 9780429022036. [Google Scholar] [CrossRef]
- Torres, F.; Ribeiro, G. Índices de risco de incêndios florestais em Juiz de Fora/MG. Floram 2008, 15, 24–34. Available online: https://www.floram.org/article/588e221ae710ab87018b465c/pdf/floram-15-2-24.pdf (accessed on 30 May 2022).
- Shetinsky, E.A. Protection of forests and forest pyrology. Ecology 1994, 209. (In Russian) [Google Scholar]
- Skvarenina, J.; Mindas, J.; Holecy, J.; Tucek, J. Analysis of the Natural and Meteorological Conditions during Two Largest Forest Fire Events in the Slovak Paradise National Park. Forest Fire in the Wildland-Urban Interface and Rural Areas in Europe: An integral Planning and Management Challenge. Athens. 2003. Available online: http://www.fria.gr/WARM/chapters/warmCh04Skvarenina.pdf (accessed on 20 June 2022).
- Dominic, A. Evaluation of Meteorological Forest Fire Risk Indices and Projection of Fire Risk for German Federal States. 2011. Available online: https://www.researchgate.net/publication/260487902_Evaluation_of_meteorological_forest_fire_risk_indices_and_projection_of_fire_risk_for_German_federal_states (accessed on 23 June 2022).
- Monteith, J.L. Evaporation and surface temperature. Q. J. R. Meteorol. Soc. 1981, 107, 1–27. [Google Scholar] [CrossRef]
- Venäläinen, A.R.I.; Heikinheimo, M. The Finnish forest fire index calculation system. In Early Warning Systems for Natural Disaster Reduction; Springer: Berlin/Heidelberg, Germany, 2003; pp. 645–647. [Google Scholar] [CrossRef]
- Vajda, A.; Venäläinen, A.; Suomi, I.; Junila, P.; Mäkelä, H.M. Assessment of forest fire danger in a boreal forest environment: Description and evaluation of the operational system applied in Finland. Meteorol. Appl. 2013, 21, 879–887. [Google Scholar] [CrossRef]
- Heim, R.R., Jr. A Review of Twentieth-Century Drought Indices Used in the United States. Bull. Am. Meteorol. Soc. 2002, 83, 1149–1166. [Google Scholar] [CrossRef] [Green Version]
- Dowdy, A.J.; Mills, G.A.; Finkele, K.; De Groot, W. Australian Fire Weather as Represented by the McArthur Forest Fire Danger Index and the Canadian Forest Fire Weather Index; Centre for Australian Weather and Climate Research: Melbourne, Australia, 2009; p. 91. Available online: https://www.cawcr.gov.au/technical-reports/CTR_010.pdf (accessed on 8 June 2022).
- Crane, W.J.B. Computing grassland and forest fire behaviour, relative humidity and drought index by pocket calculator. Aust. For. 1982, 45, 89–97. [Google Scholar] [CrossRef]
- Alexander, M.E. Computer calculation of the Keetch-Byram Drought Index-programmers beware. Fire Manag. Notes 1990, 51, 23–25. Available online: http://www.climateanalyzer.science/python/dashboards/keetch_byram_corrected.pdf (accessed on 20 July 2022).
- USFS-WFAS. Available online: https://www.fas.net/ (accessed on 24 May 2022).
- Burrows, N.D. The Soil Dryness Index for Use in Fire Control in the South-West of Western Australia; Technical Report; Western Australian Department of Conservation and Land Management: Joondalup, Australia, 1987. Available online: https://library.dbca.wa.gov.au/static/Journals/080075/080075-17.pdf (accessed on 13 March 2022).
- Kumar, V.; Dharssi, I. Sources of Soil Dryness Measures and Forecasts for Fire Danger Rating. 1987, 15, pp. 2729–2746. Available online: https://www.bnhcrc.com.au/sites/default/files/managed/downloads/brr-009.pdf (accessed on 17 September 2022).
- Palmer, W.C.; Havens, A.V. A graphical technique for determining evapotranspiration by the thornthwaite method. Mon. Weather Rev. 1958, 86, 123–128. [Google Scholar] [CrossRef]
- Alley, W.M. The Palmer drought severity index: Limitations and assumptions. J. Appl. Meteorol. Climatol. 1984, 23, 1100–1109. [Google Scholar] [CrossRef]
- Heddinghaus, T.R.; Sabol, P. A Review of the Palmer Drought Severity Index and where Do We Go from Here. In Proceedings of the 7th Conference on Applied Climatology, Salt Lake City, UT, USA, 10–13 September 1991; American Meteorological Society: Boston, MA, USA, 1991; Available online: https://citeseerx.ist.psu.edu/document?repid=rep1&type=pdf&doi=69512362983873d5a9ffbf816cd1d0ac014aa814 (accessed on 13 March 2022).
- Bergström, S. The HBV Model—Its Structure and Applications. SMHI Reports RH, No. 4, Norrköping. 1992. Available online: https://www.smhi.se/polopoly_fs/1.83592!/Menu/general/extGroup/attachmentColHold/mainCol1/file/RH_4.pdf (accessed on 8 June 2022).
- Healy, R.W.; Cook, P. Using groundwater levels to estimate recharge. Hydrogeol. J. 2002, 10, 91–109. [Google Scholar] [CrossRef]
- Nimmo, J.R.; Healy, R.W.; Stonestorm, D.A. Aquifer Recharge, in Encyclopedia of Hydrological Sciences; Anderson, M.G., Ed.; John Wiley & Sons Ltd.: Hoboken, NJ, USA, 2005; ISBN 0-471-49103-92005. [Google Scholar]
- Felch, R.E. Drought: Characteristics and assessment. In North American Droughts; Rosenberg, N.J., Ed.; Amer. Assoc. Adv. Sci. Selected Symp; Routledge: New York, NY, USA, 2019; Volume 15, pp. 25–42. [Google Scholar] [CrossRef]
- Morton, F. Operational estimates of areal evapotranspiration and their significance to the science and practice of hydrology. J. Hydrol. 1983, 66, 1–76. [Google Scholar] [CrossRef]
- Tigkas, D.; Vangelis, H.; Tsakiris, G. The RDI as a composite climatic index. Eur. Water 2013, 41, 17–22. Available online: https://www.ewra.net/ew/pdf/EW_2013_41_02.pdf (accessed on 21 June 2022).
- Crittenden, J.C.; Trussell, R.R.; Hand, D.W.; Howe, K.J.; Tchobanoglous, G. Appendix C: Physical Properties of Water. In MWH’s Water Treatment: Principles and Design; John Wiley & Sons: Hoboken, NJ, USA, 2012; pp. 1861–1862. ISBN 9781118131473. [Google Scholar] [CrossRef]
- Edwards, W.R.N.; Jarvis, P.G.; Landsberg, J.J.; Talbot, H. A dynamic model for studying flow of water in single trees. Tree Physiol. 1986, 1, 309–324. [Google Scholar] [CrossRef]
- Arndt, N.; Vacik, H.; Koch, V.; Arpaci, A.; Gossow, H. Modeling human-caused forest fire ignition for assessing forest fire danger in Austria. Iforest Biogeosci. For. 2013, 6, 315–325. [Google Scholar] [CrossRef] [Green Version]
- Camia, A.; Bovio, G.; Aguado, I.; Stach, N. Meteorological fire danger indices and remote sensing. In Remote Sensing of Large Wildfires; Springer: Berlin/Heidelberg, Germany, 1999; pp. 39–59. Available online: https://www.researchgate.net/profile/Andrea-Camia/publication/268745891_Meteorological_fire_danger_indices_and_remote_sensing/links/57109a6608ae68dc790978f1/Meteorological-fire-danger-indices-and-remote-sensing.pdf (accessed on 14 June 2022).
- Leblon, B.; Chen, J.; Alexander, M.E.; White, S. Fire danger monitoring using NOAA-AVHRR NDVI images in the case of northern boreal forests. Int. J. Remote Sens. 2001, 22, 2839–2846. Available online: http://faculty.geog.utoronto.ca/Chen/Chen’s%20homepage/PDFfiles/InterJournal%20of%20Remote%20SensingVol.22pp2839-2846.pdf (accessed on 30 June 2022). [CrossRef]
- Paltridge, G.; Barber, J. Monitoring grassland dryness and fire potential in australia with NOAA/AVHRR data. Remote Sens. Environ. 1988, 25, 381–394. [Google Scholar] [CrossRef]
- Gonzalez-Alonso, F.; Cuevas, J.M.; Casanova, J.L.; Calle, A.; Illera, P. A forest fire risk assessment using NOAA AVHRR images in the Valencia area, eastern Spain. Int. J. Remote Sens. 1997, 18, 2201–2207. [Google Scholar] [CrossRef]
- Chuvieco, E.; Allgöwer, B.; Salas, J. Integration of physical and human factors in fire danger assessment. In Wildland Fire Danger Estimation and Mapping: The Role of Remote Sensing Data; Chuvieco, E., Ed.; World Scientific Publishing Co., Inc.: Hackensack, NJ, USA, 2003; pp. 197–218. [Google Scholar] [CrossRef]
- Dennison, P.E.; Roberts, D.A.; Peterson, S.H.; Rechel, J. Use of Normalized Difference Water Index for monitoring live fuel moisture. Int. J. Remote Sens. 2005, 26, 1035–1042. [Google Scholar] [CrossRef]
- Stow, D.; Niphadkar, M.; Kaiser, J. Time series of chaparral live fuel moisture maps derived from MODIS satellite data. Int. J. Wildland Fire 2006, 15, 347–360. [Google Scholar] [CrossRef]
- Roberts, D.A.; Dennison, P.E.; Peterson, S.; Sweeney, S.; Rechel, J. Evaluation of Airborne Visible/Infrared Imaging Spectrometer (AVIRIS) and Moderate Resolution Imaging Spectrometer (MODIS) measures of live fuel moisture and fuel condition in a shrubland ecosystem in southern California. J. Geophys. Res. Earth Surf. 2006, 111, GO4S02. [Google Scholar] [CrossRef]
- Peterson, S.H.; Roberts, D.A.; Dennison, P. Mapping live fuel moisture with MODIS data: A multiple regression approach. Remote Sens. Environ. 2008, 112, 4272–4284. [Google Scholar] [CrossRef]
- Yebra, M.; Chuvieco, E.; Riaño, D. Estimation of live fuel moisture content from MODIS images for fire risk assessment. Agric. For. Meteorol. 2008, 148, 523–536. [Google Scholar] [CrossRef]
- García, M.; Chuvieco, E.; Nieto, H.; Aguado, I. Combining AVHRR and meteorological data for estimating live fuel moisture content. Remote Sens. Environ. 2008, 112, 3618–3627. [Google Scholar] [CrossRef]
- Yebra, M.; Dennison, P.E.; Chuvieco, E.; Riaño, D.; Zylstra, P.M.; Hunt, E.R., Jr.; Danson, F.M.; Qi, Y.; Jurdao, S. A global review of remote sensing of live fuel moisture content for fire danger assessment: Moving towards operational products. Remote Sens. Environ. 2013, 136, 455–468. [Google Scholar] [CrossRef]
- Burgan, R.E.; Cohen, J.D.; Deeming, J.E. Manually Calculating Fire-Danger Rating—1978 National Fire Danger Rating System; Gen. Tech. Rep. INT-40; Intermountain Forest and Range Experiment Station, Forest Service, U.S. Department of Agriculture: Ogden, UT, USA, 1978; 51p, Available online: https://digitalcommons.usu.edu/cgi/viewcontent.cgi?article=1080&context=govdocs_forest (accessed on 18 May 2022).
- Newnham, G.J.; Verbesselt, J.; Grant, I.F.; Anderson, S.A. Relative Greenness Index for assessing curing of grassland fuel. Remote Sens. Environ. 2011, 115, 1456–1463. [Google Scholar] [CrossRef]
- Gitelson, A.A.; Kaufman, Y.J.; Stark, R.; Rundquist, D. Novel algorithms for remote estimation of vegetation fraction. Remote Sens. Environ. 2002, 80, 76–87. Available online: https://digitalcommons.unl.edu/cgi/viewcontent.cgi?article=1151&context=natrespapers (accessed on 2 July 2022). [CrossRef] [Green Version]
- NASA-FIRMS. Available online: https://firms.modaps.eosdis.nasa.gov/ (accessed on 20 July 2022).
- Matsoukis, A.; Kamoutsis, A.; Chronopoulos, K. Estimation of the meteorological forest fire risk in a mountainous region by using remote air temperature and relative humidity data. Int. Lett. Nat. Sci. 2018, 67, 1–8. [Google Scholar] [CrossRef]
- Gouma, B. Methodology of Spatiotemporal Estimation of Meteorological Danger of Forest Fir—Application in the Mountainous Area of Parnitha. Ph.D. Thesis, Agricultural University of Athens, Athens, Greece, 2001. Available online: https://www.didaktorika.gr/eadd/handle/10442/12994 (accessed on 29 December 2022).
- Chronopoulos, K. Development and Application of Modern Methods of Analysis and Elaboration for Estimating Environmental Parameters in Topography with Idiosyncratic Geomorphological Characteristics. Ph.D. Thesis, Agricultural University of Athens, Athens, Greece, 2009. Available online: https://www.didaktorika.gr/eadd/handle/10442/28098 (accessed on 29 December 2022).


| Meteorology | Vegetation | Topography | Hydrology | |||||||||||||||||||||||||||
|---|---|---|---|---|---|---|---|---|---|---|---|---|---|---|---|---|---|---|---|---|---|---|---|---|---|---|---|---|---|---|
| Index | A | B | C | D | E | F | G | H | I | J | K | L | M | N | O | P | Q | R | S | T | U | V | W | X | Y | Z | a | b | c | Σ |
| CFFDRS | X | X | X | X | X | 5 | ||||||||||||||||||||||||
| NFDRS | X | X | X | X | X | X | 6 | |||||||||||||||||||||||
| Fosberg | X | X | X | 3 | ||||||||||||||||||||||||||
| mFosberg | X | X | X | X | X | 5 | ||||||||||||||||||||||||
| BEHAVE | X | X | X | X | X | X | X | X | X | X | 10 | |||||||||||||||||||
| CBI | X | X | 2 | |||||||||||||||||||||||||||
| HDWI | X | X | X | 3 | ||||||||||||||||||||||||||
| LASI | X | X | X | 3 | ||||||||||||||||||||||||||
| FFDI | X | X | X | X | X | 3 | ||||||||||||||||||||||||
| GFDI | X | X | X | X | X | 3 | ||||||||||||||||||||||||
| FFBT | X | X | X | X | X | X | 5 | |||||||||||||||||||||||
| SFDI | X | X | X | 3 | ||||||||||||||||||||||||||
| LFDI | X | X | X | X | X | 5 | ||||||||||||||||||||||||
| FMA | X | X | 2 | |||||||||||||||||||||||||||
| FMA+ | X | X | X | 3 | ||||||||||||||||||||||||||
| IRM | X | X | X | X | 4 | |||||||||||||||||||||||||
| RF | X | X | X | X | X | X | 6 | |||||||||||||||||||||||
| EPI | X | X | 2 | |||||||||||||||||||||||||||
| PEI | X | X | 2 | |||||||||||||||||||||||||||
| r (Orieux) | X | X | X | 3 | ||||||||||||||||||||||||||
| I87 | X | X | X | X | X | X | 6 | |||||||||||||||||||||||
| Numerical | X | X | X | X | 4 | |||||||||||||||||||||||||
| Ifa | X | X | X | X | 4 | |||||||||||||||||||||||||
| ICONA | X | X | X | X | X | X | X | X | X | 9 | ||||||||||||||||||||
| CFS | X | X | X | X | X | 5 | ||||||||||||||||||||||||
| IREPI | X | X | 2 | |||||||||||||||||||||||||||
| IFI | X | X | X | X | X | X | X | X | X | X | X | 11 | ||||||||||||||||||
| DMRIF | X | X | X | X | X | 5 | ||||||||||||||||||||||||
| Lourenco | X | X | 2 | |||||||||||||||||||||||||||
| Lourenco_m100 | X | X | X | 3 | ||||||||||||||||||||||||||
| Lourenco_f | X | X | X | 3 | ||||||||||||||||||||||||||
| AI | X | X | 2 | |||||||||||||||||||||||||||
| BIt | X | X | 2 | |||||||||||||||||||||||||||
| IBr | X | X | 2 | |||||||||||||||||||||||||||
| TLI | X | X | X | 3 | ||||||||||||||||||||||||||
| NI | X | X | X | 3 | ||||||||||||||||||||||||||
| mNI | X | X | X | 3 | ||||||||||||||||||||||||||
| Zhdanko | X | X | X | 3 | ||||||||||||||||||||||||||
| M68 | X | X | 2 | |||||||||||||||||||||||||||
| mM68 | X | X | 2 | |||||||||||||||||||||||||||
| DW | X | X | X | X | X | X | X | X | 8 | |||||||||||||||||||||
| MDI | X | 1 | ||||||||||||||||||||||||||||
| KBDI | X | X | X | X | X | 5 | ||||||||||||||||||||||||
| SDI | X | X | X | X | X | X | X | 7 | ||||||||||||||||||||||
| PDSI | X | X | X | X | X | X | X | 6 | ||||||||||||||||||||||
| RDI | X | X | 2 | |||||||||||||||||||||||||||
| CWD | X | X | 2 | |||||||||||||||||||||||||||
| VPD | X | X | 2 | |||||||||||||||||||||||||||
| DI | X | X | 2 | |||||||||||||||||||||||||||
| Σ | 38 | 27 | 22 | 1 | 20 | 8 | 3 | 5 | 3 | 5 | 4 | 2 | 2 | 1 | 1 | 3 | 2 | 2 | 3 | 3 | 13 | 9 | 3 | 3 | 2 | 3 | 3 | 3 | 2 | |
| Legend (Column heading) | ||||||||||||||||||||||||||||||
| A | Temperature | K | Vegetation type | U | Drought period | |||||||||||||||||||||||||
| B | Relative humidity | L | Curing degree | V | Potential Evapotranspiration | |||||||||||||||||||||||||
| C | Wind speed | M | Fuel quantity | W | Actual Evapotranspiration | |||||||||||||||||||||||||
| D | Wind direction | N | Leaf area index | X | Evaporation | |||||||||||||||||||||||||
| E | Precipitation | O | Leaf area density | Y | Latent Heat of Evaporation | |||||||||||||||||||||||||
| F | Dew point temperature | P | Canopy characteristics | Z | Interception | |||||||||||||||||||||||||
| G | Clouds concentration | Q | Plants physiology | a | Runoff | |||||||||||||||||||||||||
| H | Latitude | R | Elevation | b | Recharge | |||||||||||||||||||||||||
| I | Date and/or Time | S | Slope | c | Solar Radiation | |||||||||||||||||||||||||
| J | Fuel moisture | T | Aspect | Σ | Sum | |||||||||||||||||||||||||
| S1 | Σ | S2 | Σ | S3 | Σ | S4 | Σ | Grade | ||||||||||
|---|---|---|---|---|---|---|---|---|---|---|---|---|---|---|---|---|---|---|
| Index | A | B | C | D | E | F | G | H | I | J | K | L | M | |||||
| CFFDRS | 1 | 2 | 4 | SI | −1 | 6 | m | i | 2 | 1 | 0 | 1 | se | 1 | 3 | 3 | 11 | 17 |
| NFDRS | 0 | 0 | 3 | O | 0 | 2 | m,v,t | i,b,S | 6 | 1 | 1 | 2 | se | 0 | 3 | 2 | 9 | 18 |
| Fosberg | 3 | 4 | 5 | O | 0 | 11 | m | i | 2 | 0 | 0 | 0 | s | 1 | 2 | 1 | 7 | 14.5 |
| Fosberg + | 2 | 3 | 5 | O | 0 | 9 | m | i | 2 | 0 | 1 | 1 | s | 1 | 1 | 1 | 6 | 13.5 |
| BEHAVE | 0 | 0 | 3 | O | 0 | 2 | m,v,t | b,S | 5 | 1 | 1 | 2 | se | 1 | 2 | 1 | 8 | 17 |
| CBI | 5 | 5 | 5 | SI | 0 | 15 | m | i | 2 | 0 | 0 | 0 | e | 1 | 1 | 1 | 5 | 14.5 |
| HDWI | 4 | 4 | 5 | SI | 0 | 13 | m | i | 2 | 0 | 0 | 0 | s | −1 | 1 | 1 | 4 | 12.5 |
| LASI | 5 | 4 | 1 | SI | 0 | 10 | m | i,S | 3 | 0 | 0 | 0 | a | 1 | 3 | 2 | 6 | 14 |
| FFDI | 2 | 2 | 5 | SI | −1 | 8 | m | i | 2 | 1 | 1 | 2 | se | 1 | 3 | 2 | 10 | 18 |
| GFDI | 4 | 3 | 4 | SI | 0 | 11 | m,v | i | 3 | 0 | 0 | 0 | se | 1 | 2 | 1 | 8 | 16.5 |
| FFBT | 1 | 2 | 3 | SI | 0 | 6 | m,v | i | 3 | 0 | 0 | 0 | se | 1 | 1 | 0 | 6 | 12 |
| SFDI | 5 | 5 | 5 | SI | 0 | 15 | m | i | 2 | 1 | 0 | 1 | se | 1 | 1 | 1 | 7 | 17.5 |
| LFDI | 4 | 4 | 4 | SI | 0 | 12 | m,h | i | 3 | 0 | 0 | 0 | se | 1 | 2 | 1 | 8 | 17 |
| FMA | 5 | 5 | 5 | SI | −1 | 14 | m | i | 2 | 0 | 0 | 0 | ea | 1 | 2 | 1 | 5 | 14 |
| FMA+ | 5 | 4 | 5 | SI | −1 | 13 | m | i | 2 | 0 | 0 | 0 | ea | 1 | 2 | 1 | 5 | 13.5 |
| IRM | 5 | 4 | 5 | SI | 0 | 14 | m | i | 2 | 0 | 0 | 0 | e | 1 | 1 | 1 | 5 | 14 |
| RF | 3 | 2 | 3 | SI | 0 | 8 | m,v | i | 3 | 1 | 0 | 1 | se | 1 | 2 | 2 | 9 | 17 |
| EPI | 5 | 5 | 5 | SI | −1 | 14 | m,h | i | 3 | 0 | 0 | 0 | a | −1 | 1 | 1 | 1 | 11 |
| PEI | 5 | 5 | 5 | SI | −1 | 14 | m,h | i | 3 | 0 | 0 | 0 | a | −1 | 1 | 1 | 1 | 11 |
| r (Orieux) | 2 | 3 | 4 | SI | −1 | 8 | m,h | i | 3 | 1 | 0 | 1 | ea | 1 | 2 | 1 | 5 | 13 |
| I87 | 2 | 3 | 4 | SI | −1 | 8 | m,h | i | 3 | 0 | 1 | 1 | sa | −1 | 2 | 1 | 4 | 12 |
| Numerical | 2 | 4 | 5 | SI | −1 | 10 | m | i | 2 | 1 | 1 | 2 | sa | 1 | 1 | 1 | 5 | 14 |
| Lourenco | 5 | 5 | 5 | SI | 0 | 15 | m | i | 2 | 0 | 0 | 0 | a | 1 | 2 | 1 | 4 | 13.5 |
| Lourenco_m100 | 5 | 4 | 5 | SI | 0 | 14 | m | i | 2 | 0 | 0 | 0 | a | 1 | 2 | 1 | 4 | 13 |
| Lourenco_f | 5 | 5 | 4 | SI | 0 | 14 | m | i | 2 | 0 | 0 | 0 | ea | 1 | 2 | 1 | 5 | 14 |
| Ifa | 4 | 4 | 5 | SI | −1 | 12 | m | i | 2 | 0 | 0 | 0 | se | 1 | 2 | 1 | 8 | 16 |
| ICONA | 3 | 1 | 3 | SI | 0 | 7 | m,v,t | i | 4 | 1 | 0 | 1 | se | 1 | 2 | 1 | 8 | 16.5 |
| CFS | 3 | 3 | 3 | SI | −1 | 8 | m,h | i | 3 | 0 | 0 | 0 | sa | 1 | 2 | 1 | 6 | 13 |
| IREPI | 3 | 5 | 5 | SI | 0 | 13 | h | i | 2 | 0 | 0 | 0 | a | −1 | 2 | 0 | 1 | 9.5 |
| IFI | 2 | 0 | 1 | SI | 0 | 3 | m,v,h,t | i | 5 | 1 | 0 | 1 | sa | 1 | 1 | 0 | 4 | 11.5 |
| DMRIF | 4 | 3 | 4 | SI | −1 | 10 | m,h | i | 3 | 0 | 1 | 1 | sa | 1 | 2 | 1 | 6 | 15 |
| AI | 5 | 5 | 5 | SI | 0 | 15 | m | i | 2 | 0 | 0 | 0 | sa | 1 | 3 | 3 | 9 | 18.5 |
| BIt | 4 | 4 | 5 | SI | −1 | 12 | m,h | i | 3 | 0 | 0 | 0 | ea | 1 | 1 | 1 | 4 | 13 |
| IBr | 5 | 5 | 4 | SI | −1 | 13 | m | i | 2 | 0 | 0 | 0 | a | −1 | 1 | 1 | 1 | 9.5 |
| TLI | 5 | 4 | 5 | SI | −1 | 13 | m | i | 2 | 0 | 0 | 0 | sa | 1 | 2 | 2 | 7 | 15.5 |
| NI | 5 | 5 | 4 | SI | −1 | 13 | m,h | i | 3 | 0 | 0 | 0 | s | 1 | 3 | 3 | 10 | 19.5 |
| mNI | 4 | 4 | 4 | SI | −1 | 11 | m,h | i | 3 | 0 | 0 | 0 | se | 1 | 1 | 1 | 7 | 15.5 |
| Zhdanko | 4 | 4 | 4 | SI | −1 | 11 | m,h | i | 3 | 0 | 0 | 0 | se | 1 | 1 | 1 | 7 | 15.5 |
| M68 | 3 | 4 | 4 | SI | −1 | 10 | m,h | i | 3 | 0 | 0 | 0 | se | 1 | 1 | 1 | 7 | 15 |
| mM68 | 3 | 4 | 4 | SI | −1 | 10 | m,h | i | 3 | 0 | 0 | 0 | se | 1 | 2 | 1 | 8 | 16 |
| DW | 2 | 0 | 0 | SI | 0 | 2 | m,h | i | 3 | 0 | 0 | 0 | se | 1 | 2 | 1 | 8 | 12 |
| MDI | 5 | 5 | 5 | SI | −1 | 14 | h | i | 2 | 0 | 0 | 0 | s | −1 | 1 | 1 | 4 | 13 |
| KBDI | 4 | 3 | 4 | O | −1 | 9 | m,h | i | 3 | 0 | 0 | 0 | se | 1 | 3 | 3 | 11 | 18.5 |
| SDI | 3 | 3 | 3 | SI | −1 | 8 | m,h | i | 3 | 0 | 0 | 0 | se | 1 | 3 | 2 | 10 | 17 |
| PDSI | 1 | 2 | 1 | O | −1 | 2 | m,h | i | 3 | 0 | 0 | 0 | se | 0 | 3 | 2 | 9 | 13 |
| RDI | 5 | 5 | 4 | SI | −1 | 13 | m,h | i | 3 | 0 | 0 | 0 | s | 0 | 1 | 0 | 4 | 13.5 |
| CWD | 4 | 3 | 3 | SI | 0 | 10 | h | i | 2 | 0 | 0 | 0 | a | −1 | 2 | 1 | 2 | 9 |
| VPD | 5 | 5 | 5 | SI | 0 | 15 | m | i | 2 | 0 | 0 | 0 | e | −1 | 2 | 2 | 5 | 14.5 |
| DI | 3 | 1 | 1 | SI | 0 | 5 | h | i,S | 3 | 0 | 0 | 0 | s | −1 | 0 | 0 | 2 | 7.5 |
| NDVI | 5 | 5 | 5 | SI | 0 | 15 | v | i,S | 3 | 0 | 0 | 0 | s | −1 | 3 | 3 | 8 | 18.5 |
| RG | 5 | 5 | 4 | SI | −1 | 13 | v | i,S | 3 | 0 | 1 | 1 | se | −1 | 2 | 2 | 7 | 17.5 |
| VG | 5 | 5 | 4 | SI | −1 | 13 | v | i,S | 3 | 0 | 1 | 1 | se | −1 | 1 | 1 | 5 | 15.5 |
| NDWI | 5 | 5 | 5 | SI | 0 | 15 | v | i,S | 3 | 0 | 0 | 0 | s | −1 | 1 | 1 | 4 | 14.5 |
| NDWIm | 5 | 5 | 5 | SI | 0 | 15 | v | i,S | 3 | 0 | 0 | 0 | s | −1 | 0 | 1 | 3 | 13.5 |
| NDII6 | 5 | 5 | 5 | SI | 0 | 15 | v | i,S | 3 | 0 | 0 | 0 | s | −1 | 0 | 1 | 3 | 13.5 |
| NDII7 | 5 | 5 | 5 | SI | 0 | 15 | v | i,S | 3 | 0 | 0 | 0 | s | −1 | 0 | 1 | 3 | 13.5 |
| NMDI | 5 | 5 | 5 | SI | 0 | 15 | v | i,S | 3 | 0 | 0 | 0 | s | −1 | 0 | 1 | 3 | 13.5 |
| SAVI | 5 | 5 | 5 | SI | 0 | 15 | v | i,S | 3 | 0 | 0 | 0 | s | −1 | 0 | 1 | 3 | 13.5 |
| EVI | 5 | 5 | 5 | SI | 0 | 15 | v | i,S | 3 | 0 | 0 | 0 | s | −1 | 0 | 1 | 3 | 13.5 |
| VARI | 5 | 5 | 5 | SI | 0 | 15 | v | i,S | 3 | 0 | 0 | 0 | s | −1 | 0 | 1 | 3 | 13.5 |
| FPI | 2 | 3 | 4 | SI | −1 | 8 | m,v | i,S | 4 | 0 | 1 | 1 | se | −1 | 2 | 2 | 7 | 16 |
| FPI_m1 | 3 | 3 | 4 | SI | −1 | 9 | m,v | i,S | 4 | 0 | 1 | 1 | se | −1 | 1 | 1 | 5 | 14.5 |
| FPI_m2 | 3 | 3 | 4 | SI | −1 | 9 | m,v | i,S | 4 | 0 | 1 | 1 | se | −1 | 1 | 1 | 5 | 14.5 |
| Legend (Column heading) | ||||||||||||||||||
| S1 | Computational procedure | D | Units | L | Validation | B | Behavior | |||||||||||
| S2 | Fire characteristics | E | Accumulated index | M | Adaptability | S | Severity | |||||||||||
| S3 | Modularity | F | Fire danger variables | N | Accuracy | A | Arbitrary | |||||||||||
| S4 | Credibility | G | Fire danger aspect | M | Meteorology | E | Empirical | |||||||||||
| Σ | Sum | H | Useful subcomponents | V | Vegetation | S | Scientific | |||||||||||
| A | Calculation complexity | I | Embodiment of other indices | T | Topography | Si | International system | |||||||||||
| B | Required data volume | J | Development basis | H | Hydrology | O | Other | |||||||||||
| C | Input data complexity | K | Output interpretation | I | Ignition | |||||||||||||
| Index | Score | Index | Score | Index | Score |
|---|---|---|---|---|---|
| NI | 0.68 | Zhdanko | 0.56 | pmM68 | 0.51 |
| KBDI | 0.65 | M68 | 0.55 | HDWI | 0.49 |
| SFDI | 0.64 | CBI | 0.55 | FMA | 0.49 |
| FFDI5 | 0.62 | RF | 0.55 | RDI | 0.49 |
| SDI | 0.61 | DMRIF | 0.54 | CFS | 0.48 |
| LFDI | 0.60 | IRM | 0.54 | EPI | 0.47 |
| GFDI5 | 0.59 | Fosberg | 0.53 | Numerical | 0.46 |
| TLI | 0.59 | MDI | 0.53 | FMA+ | 0.46 |
| CFFDRS | 0.59 | Lourenco_f | 0.53 | I87 | 0.44 |
| Ifa | 0.59 | Lourenco | 0.53 | DW | 0.44 |
| AI | 0.58 | BIt | 0.52 | r (Orieux) | 0.43 |
| NFDRS | 0.58 | Lourenco_m100 | 0.52 | IBr | 0.43 |
| mNI | 0.57 | Fosberg+ | 0.51 | IFI | 0.42 |
| VPD | 0.57 | mM68 | 0.51 | PEI | 0.41 |
Disclaimer/Publisher’s Note: The statements, opinions and data contained in all publications are solely those of the individual author(s) and contributor(s) and not of MDPI and/or the editor(s). MDPI and/or the editor(s) disclaim responsibility for any injury to people or property resulting from any ideas, methods, instructions or products referred to in the content. |
© 2023 by the authors. Licensee MDPI, Basel, Switzerland. This article is an open access article distributed under the terms and conditions of the Creative Commons Attribution (CC BY) license (https://creativecommons.org/licenses/by/4.0/).
Share and Cite
Zacharakis, I.; Tsihrintzis, V.A. Environmental Forest Fire Danger Rating Systems and Indices around the Globe: A Review. Land 2023, 12, 194. https://doi.org/10.3390/land12010194
Zacharakis I, Tsihrintzis VA. Environmental Forest Fire Danger Rating Systems and Indices around the Globe: A Review. Land. 2023; 12(1):194. https://doi.org/10.3390/land12010194
Chicago/Turabian StyleZacharakis, Ioannis, and Vassilios A. Tsihrintzis. 2023. "Environmental Forest Fire Danger Rating Systems and Indices around the Globe: A Review" Land 12, no. 1: 194. https://doi.org/10.3390/land12010194