Article

Integrated Risk Assessment of Agricultural Drought Disasters in the Major Grain-Producing Areas of Jilin Province, China

1
College of Earth Sciences, Jilin University, Changchun 130061, China
2
College of Geo-Exploration Science and Technology, Jilin University, Changchun 130026, China
*
Author to whom correspondence should be addressed.
Land 2023, 12(1), 160; https://doi.org/10.3390/land12010160
Submission received: 12 December 2022 / Revised: 26 December 2022 / Accepted: 31 December 2022 / Published: 3 January 2023
(This article belongs to the Topic Natural Hazards and Disaster Risks Reduction)

Abstract

:
The impact of global climate change has intensified, and the frequent occurrence of meteorological disasters has posed a serious challenge to crop production. This article conducts an integrated risk assessment of agricultural drought disasters in the main grain-producing areas of Jilin Province using the temperature and precipitation data of the study area from 1955 to 2020, the sown area of crops, historical disaster data, regional remote sensing images, and statistical yearbook data. The agricultural drought integrated risk assessment model was built around four factors: drought hazards, vulnerability of hazard-bearing bodies, sensitivity of disaster-pregnant environments, and stability of disaster mitigation capacity. The results show that the study area has shown a trend of changing from wet to dry and then wet over the past 66 years, with the occasional occurrence of severe drought, and a decreasing trend at a rate of −0.089. (10a)−1 overall. The integrated risk of drought in the study area exhibits regional clustering, and the overall risk level has some relationship spatially with the regional geological tectonic units, with the high-risk level concentrated in the central area of Song Liao Basin and close to the geological structure of Yishu Graben and the low risk level concentrated in the marginal area of Song Liao Basin. Based on the results of the risk factor analysis, integrated risk prevention suggestions for drought in the main grain-producing areas of Jilin Province were put forward from four aspects. Fine identification and evaluation of high-risk areas of agricultural drought can provide a quantitative basis for effective drought resistance activities in relevant areas.

1. Introduction

Global warming and urbanization have brought about changes in the intensity and frequency of weather-causing factors and the exposure of crop-bearing bodies, which have important implications for agricultural production’s ability to withstand natural disasters [1,2]. The IPCC Fourth Assessment Report (AR4) and Fifth Assessment Report (AR5) point out that global warming has led to an increase in the frequency and intensity of droughts, and the risk of drought is expected to show an increasing trend in the future. The Sixth Assessment Report (AR6) indicates that droughts in northern China have tended to increase since 1960 [3]. Drought is the most serious meteorological disaster that impacts on agricultural production. In agricultural sectors, it refers to the phenomenon of water deficit in crops caused by the continuous lack of soil moisture during the crop reproductive period, which affects the normal growth and development of the crop [4]. Therefore, an objective evaluation of the risk of drought disasters and the current state of regional disaster mitigation capacity is of great significance to ensure the sustainable development of regional agriculture.
Agricultural production relies on the natural environment for animal and plant growth and is more vulnerable to natural disasters than other industries. In recent years, agricultural disaster risk assessment has been carried out in various regions. Villani et al. presented a complete drought risk assessment methodology, applied to the agricultural systems of five Italian coastal watersheds, introducing a simple robustness evaluation method to validate the assessment tool and archetype analysis to link the outputs with adaptation strategies [5]. Liu et al. used an integrated multi-indicator evaluation combined with an entropic information diffusion model to assess the risk of agricultural droughts and floods in the middle and lower reaches of the Yangtze River, and proposed relevant policy suggestions based on the assessment results [6]. Summarizing previous research, it is concluded that there is a less integrated risk assessment for agricultural meteorological catastrophes, which primarily focuses on the study of disaster risk. At the same time, regions or nations serve as the primary assessment units for the risk assessment outcomes. Gridding-based refined evaluations are scarce due to the extent of the available data statistics, and there is insufficient advice for disaster risk assessment and work in tiny regions. Additionally, there is limited evaluation of the regional disaster preventive and mitigation capability and the quantified disaster-pregnant environment system, and the study on these topics is still in the qualitative analysis stage.
China is a major grain-producing and consuming country. Natural disasters have posed a major challenge to food security in China. The regional meteorological disasters have obvious seasonal changes and regional differences in the western part of Jilin Province. It is a typical climate ‘vulnerable area’ in China [7,8]. The total grain output of Jilin Province in 2021 was 80.784 billion pounds, maintaining the fifth place in the national ranking, and the yield continued to maintain the fourth place in the country (http://www.moa.gov.cn/xw/qg/202112/t20211227_6385576.htm/, accessed on 20 October 2022). All data reflect that Jilin Province’s grain security production cannot be ignored. As China’s important commodity grain-production base distribution area, China’s top five regions (Yushu, Nongan, Gongzhuling, Lishu, Fuyu) are located in this area. Therefore, the agricultural development of the main grain-producing areas in central and western Jilin Province is very important to ensure national food security. Previous studies have shown that the recurrence period of drought disasters in the study area is short, about 1–2 years, which seriously threatens the regional economy and food security [9]. In order to comprehensively consider the impact of drought disasters on regional agricultural systems, the study area was finely divided into a grid, and an integrated agricultural drought risk assessment model was constructed from four aspects: drought hazards, the vulnerability of hazard-bearing bodies, the sensitivity of disaster-pregnant environments, and the stability of disaster mitigation capacity. The risk of agricultural drought in the region is analyzed and evaluated, the spatial variation of the risk level and integrated risk of agricultural drought in different time scales is obtained, and suggestions for sustainable development of regional agriculture are made. This article is expected to provide refined guidance for relevant departments to scientifically formulate drought prevention and mitigation policies and plans.

2. Materials and Methods
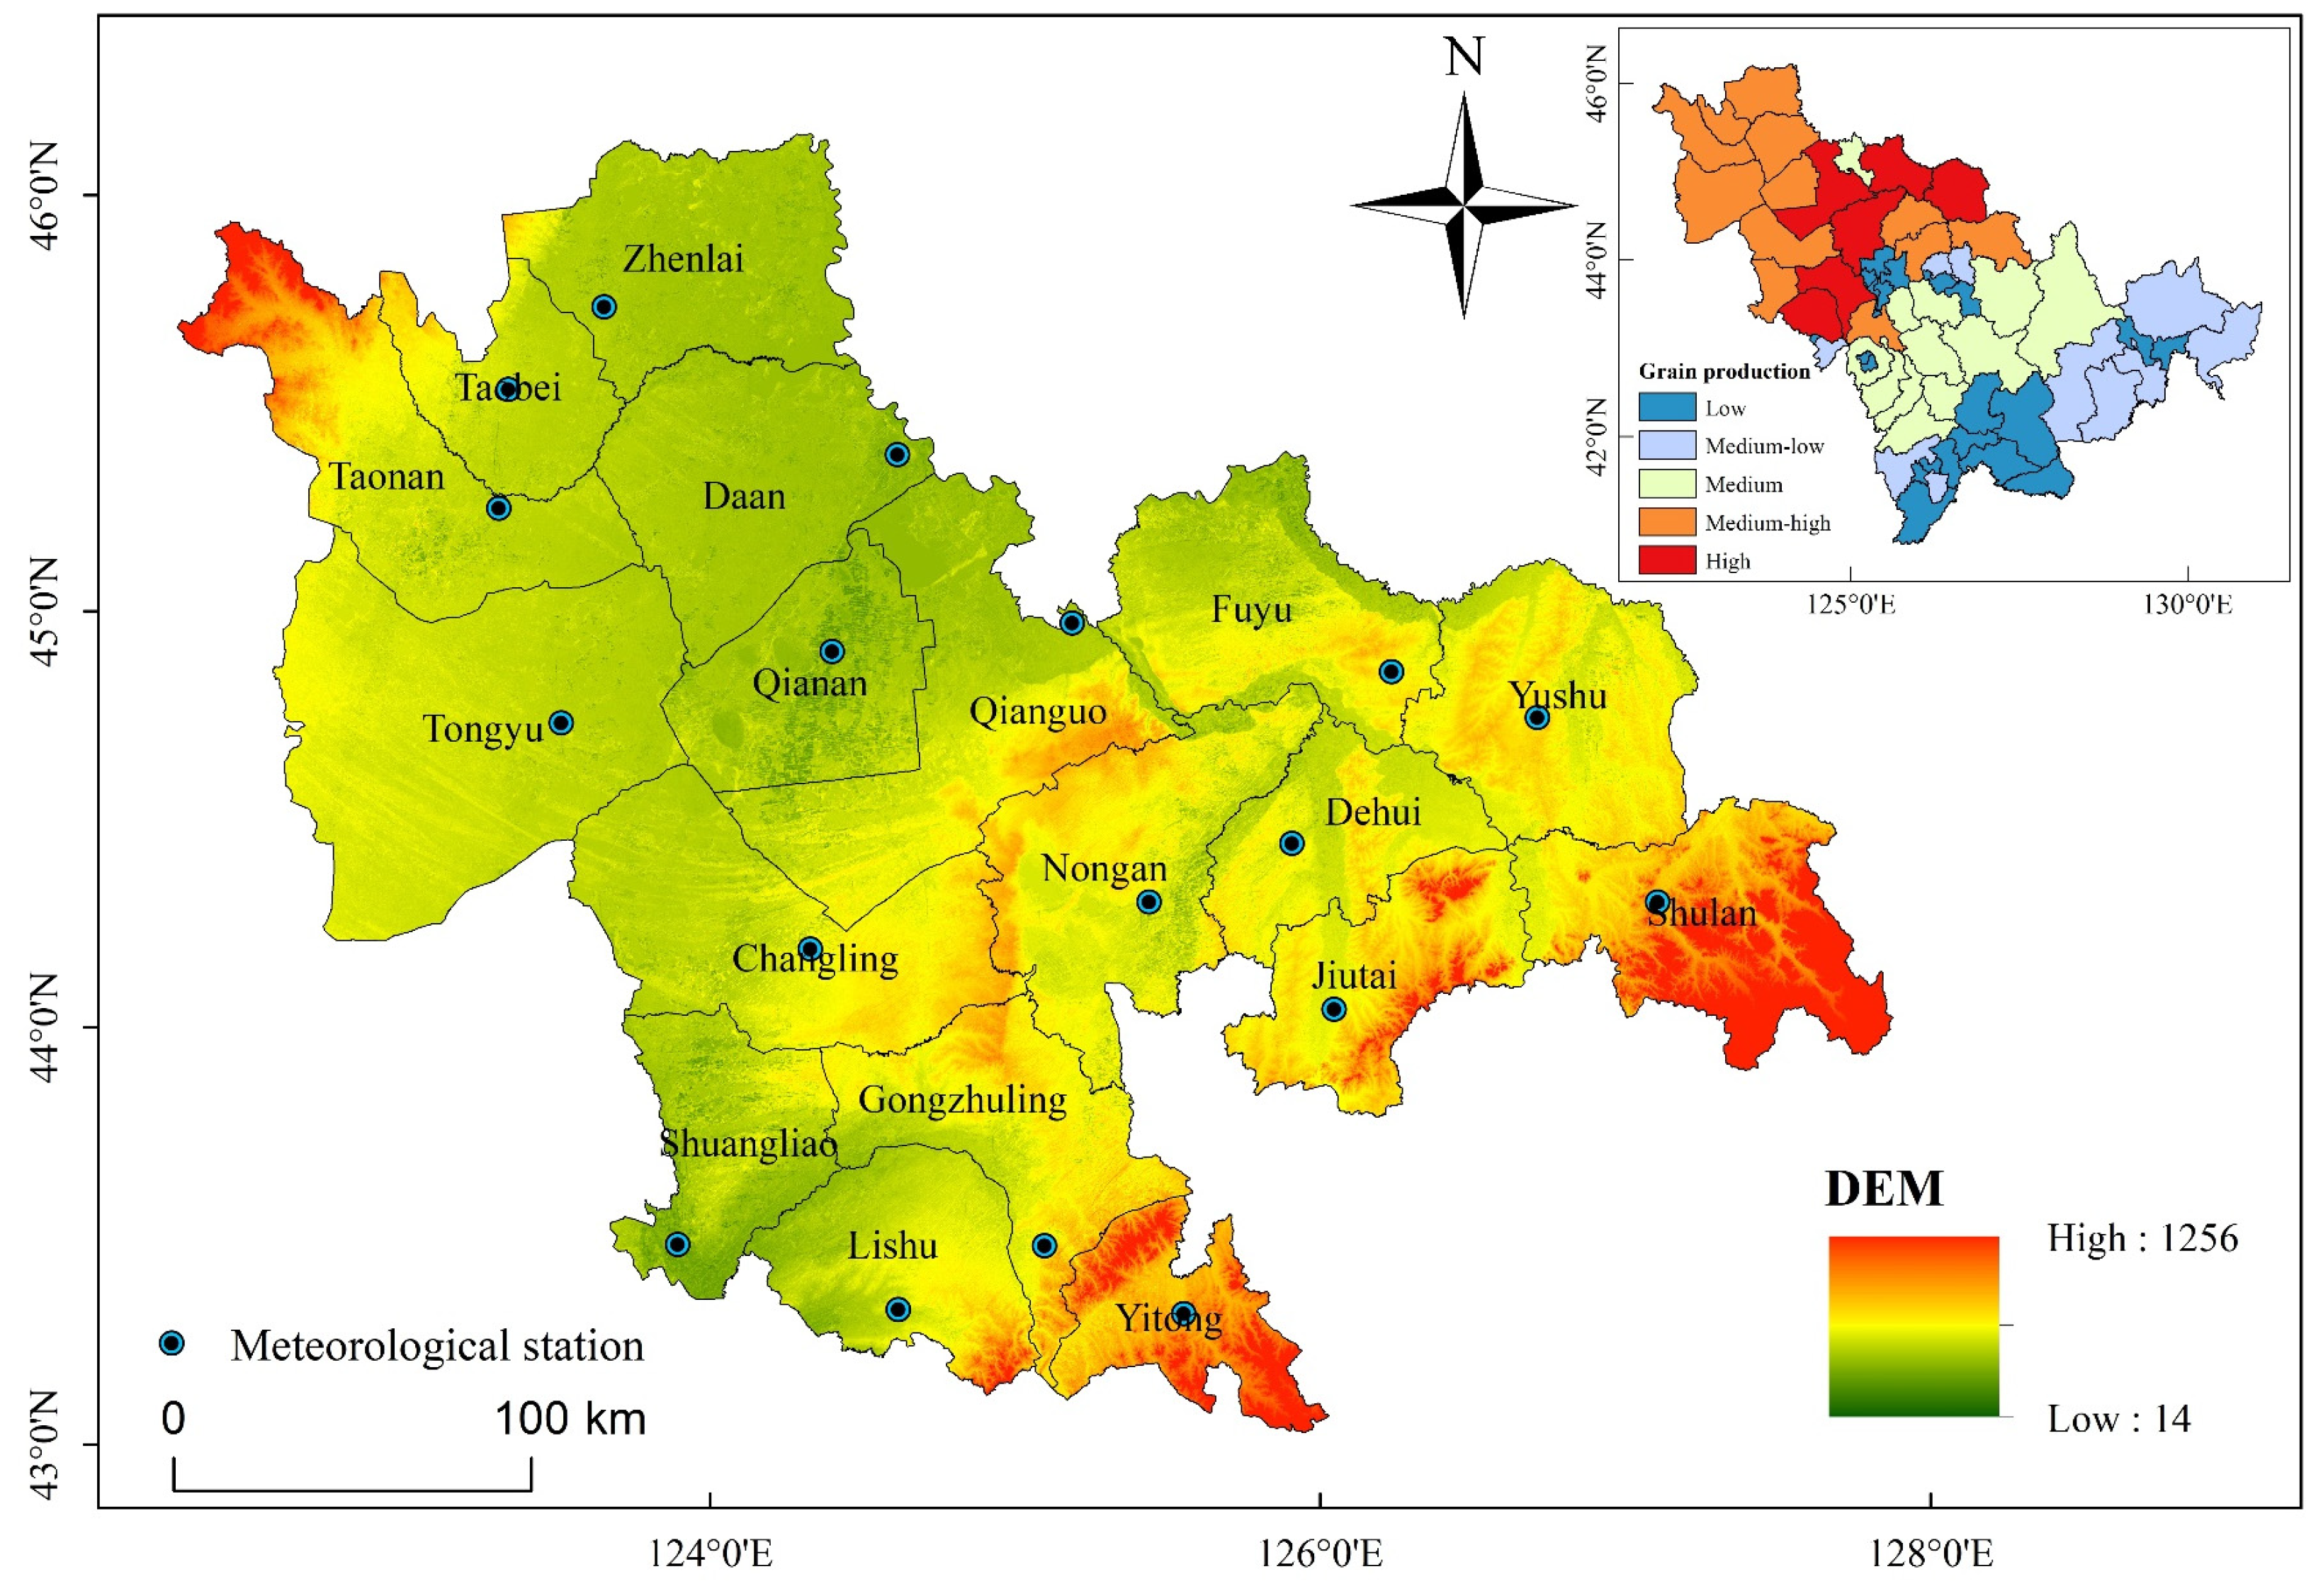
2.1. Study Area

Jilin province is located at mid-latitudes on the eastern side of the Eurasian continent (121°38′ E–131°19′ E, 40°52′ N–46°18′ N). It has a cultivated land area of about 749.85 million hectares. The fertile soil in the region mainly produces corn and rice. Jilin Province has an average annual temperature of 5.2 °C and average yearly sunshine hours range from 2133 to 2903 h. The distribution of temperature and sunshine in the province decreases from west to east. The average annual precipitation in Jilin Province is 612.2 mm, and it rises from west to east. Moreover, 60% of the yearly precipitation falls during the summer, the wettest of the four seasons, whereas just 14% of the precipitation falls between April and May. As a result, Jilin Province has several spring droughts, particularly in its western region, where “nine droughts in ten years” are believed to have occurred [10]. Combining the available data, the article classifies the province’s grain yield using the natural intermittent classification method based on the grain yield data of 60 districts in Jilin province in 2020, and finally obtains 18 districts with high and medium–high yield grades as the study area. The study area is mainly located in the central and western regions of Jilin Province (Figure 1). The main grain-producing area of Jilin Province is located in the transition zone with a semi-humid to semi-arid climate in the middle temperate zone [11,12]. The region is flat, vast farmland, a fertile land, which is one of the worlds’ three black soil distribution centers. The grain output of 18 major grain-producing areas in the study area is more than 800,000 tons in 2020 (Table 1). Through the integrated risk assessment of drought in major grain-producing areas, it is expected to provide a reference for the sustainable development of regional agriculture and the protection of regional food security.

2.2. Data Sources and Indicator Selection

Risks do not exist in a vacuum. The motion of the Earth as a whole, as well as changes in other systems, are thought to govern and impact natural hazard systems, which are seen as an essential component of the Earth’s surface system. The more commonly used disaster risk assessment models internationally are UN-DRO, NOAA, APELL, and others. They mainly include the identification of risk events, hazard analysis of risk factors, vulnerability or exposure analysis of disaster-bearing bodies, risk classification and impact analysis [13,14,15,16]. Disasters caused by drought have a more difficult time developing. The sensitivity of the environment to hazards and disasters, susceptibility of disaster-bearing entities, and mitigation capability all play a role in the integrated risk of agricultural drought hazards in this study. The research area’s drought integrated risk assessment model may be constructed using the equation below:
F = X H × X S × X V X R
In the formula: F is the integrated risk index of agricultural drought disaster; X H , X S , X V , and X R represent the disaster-causing hazard, the sensitivity of the agricultural disaster-pregnant environment, and the vulnerability of the hazard-bearing body and drought resistance of the agricultural system, respectively. The calculation results are reclassified to obtain the integrated risk level of agricultural drought disasters.

2.2.1. Disaster-Causing Hazard

Drought-disaster-causing hazard refers to a water shortage due to persistently dry weather. The analysis of precipitation level changes cannot fully reflect the degree of drought, and the influence of evapotranspiration needs to be included to characterize the regional risk status of disaster-causing factors. In this study, monthly data from 18 meteorological stations in the study area, including temperature, precipitation, and other meteorological elements, were selected for the period 1955–2020, and the above data were obtained from the National Tibetan Plateau Scientific Data (https://data.tpdc.ac.cn/zh-hans/, accessed on 22 October 2022). The average temperature and average precipitation data for each meteorological station in the study area for 792 months were extracted in batches using Python software. At the same time, the standardized evapotranspiration index (SPEI) was calculated at different time scales (monthly, seasonal, and annual scales), i.e., SPEI-1, SPEI-3, and SPEI-12. The data from each meteorological station was classified into drought classes, and the frequency of drought at the station was calculated based on the classification results. In order to visualize and synthesize the danger that precipitation and temperature may trigger in the formation of drought, the standardized evapotranspiration index (SPEI) at SPEI-1 (monthly), SPEI-3, and SPEI-12 was selected. The standardized evapotranspiration index (SPEI) on the SPEI-1 scale was selected as the hazard index in the study. Based on the inverse distance weighting method in ArcGIS, the drought frequency at the corresponding monthly scale of meteorological stations was interpolated into raster data, and the results were assigned to a 1 km by 1 km grid in the study area.
The standardized Precipitation Evapotranspiration Index (SPEI) is an index calculated using precipitation and air temperature data to characterize wet and dry conditions. It is further developed from the SPI normalized precipitation index, and incorporates the effect of evapotranspiration, making it more applicable in areas with significant temperature trends, especially for long-time-scale studies. The article analyzes the temporal trends and spatially significant characteristics of the SPEI index at different time scales using data from 18 meteorological stations in the study area for the last 66 years and is used to characterize the risk of drought-causing factors in the study area. The SPEI is obtained by normalizing the difference between the average annual precipitation and potential evapotranspiration, and the SPEI calculation method considers the influence of meteorological factors on the potential evapotranspiration and is suitable for drought assessment in the study area because of the large potential evapotranspiration [17,18,19]. The specific calculation steps are as follows:
Calculating the difference ( D i ) between potential evapotranspiration and monthly precipitation:
D i = P i E T i
where: P i is the accumulated precipitation in month i, mm; E T i is the potential evapotranspiration in month i, mm, and D i is the parameter reflecting the moisture surplus and deficit in month i, mm.
The water profit and loss accumulation sequence were constructed, the log–logistic probability distribution function was used, and the probability density was standardized to calculate the corresponding SPEI value:
I = { w C 0 + C 1 w + C 2 w 2 1 + d 1 w + d 2 w 2 + d 3 w 3 , p 0.5 ( w C 0 + C 1 w + C 2 w 2 1 + d 1 w + d 2 w 2 + d 3 w 3 ) , p > 0.5
where: I is the SPEI value; w probability weighted moments; p is the cumulative probability; C 0 , C 1 , C 2 , d 1 , d 2 , d 3 are constant terms, C 0 = 2.515517, C 1 = 0.802853, C 2 = 0.010328, d 1 = 1.432788, d 2 = 0.189269, d 3 = 0.00130. The drought grade standard of SPEI is: I ≤ −2.0 is severe drought, −2.0 < I ≤ −1.5 is heavy drought, −1.5 < I ≤ −1.0 is medium drought, −1.0 < I ≤ −0.5 is light drought, I > −0.5 is no drought. Because the amount of data is too large, the drought index is calculated in batches by R language. This paper calculates the SPEI values of three different time scales, namely, monthly scale (SPEI-1), seasonal scale (SPEI-3) and annual scale (SPEI-12). The division standard of four seasons: March to May is spring, June to August is summer, September to November is autumn, December to February is winter. For SPEI-3, April is spring, July is summer, October is autumn, and January is winter.
The times n of different time scales I ≤ −0.5 in the study area from 1955 to 2020 were counted, and its proportion in the total number of years N (N = 66) was calculated, which was the frequency of drought in the study area:
D = n N × 100 %

2.2.2. Vulnerability of Hazard-Bearing Body

The vulnerability of agricultural disaster-bearing bodies is an important indicator of the resistance of crops to the effects of disasters. Agriculture’s vulnerability and the recurrence period of drought are two perspectives that together reflect the magnitude of agricultural disaster-bearing bodies’ vulnerability. Exposure indicates the extent to which a crop may be affected by a drought during a disaster. In the study, the sown area of regional crops was obtained from the 2020 statistical yearbooks of 18 regions in study area and the exposure of agricultural disaster-bearing bodies was calculated. The Chinese meteorological dictionary was checked to find the area of crops affected by drought in history, and the fuzzy risk theory was used to calculate the recurrence period of drought disasters in each region. The weights of the above indicators were calculated using hierarchical analysis, and the weight values were all 0.5.

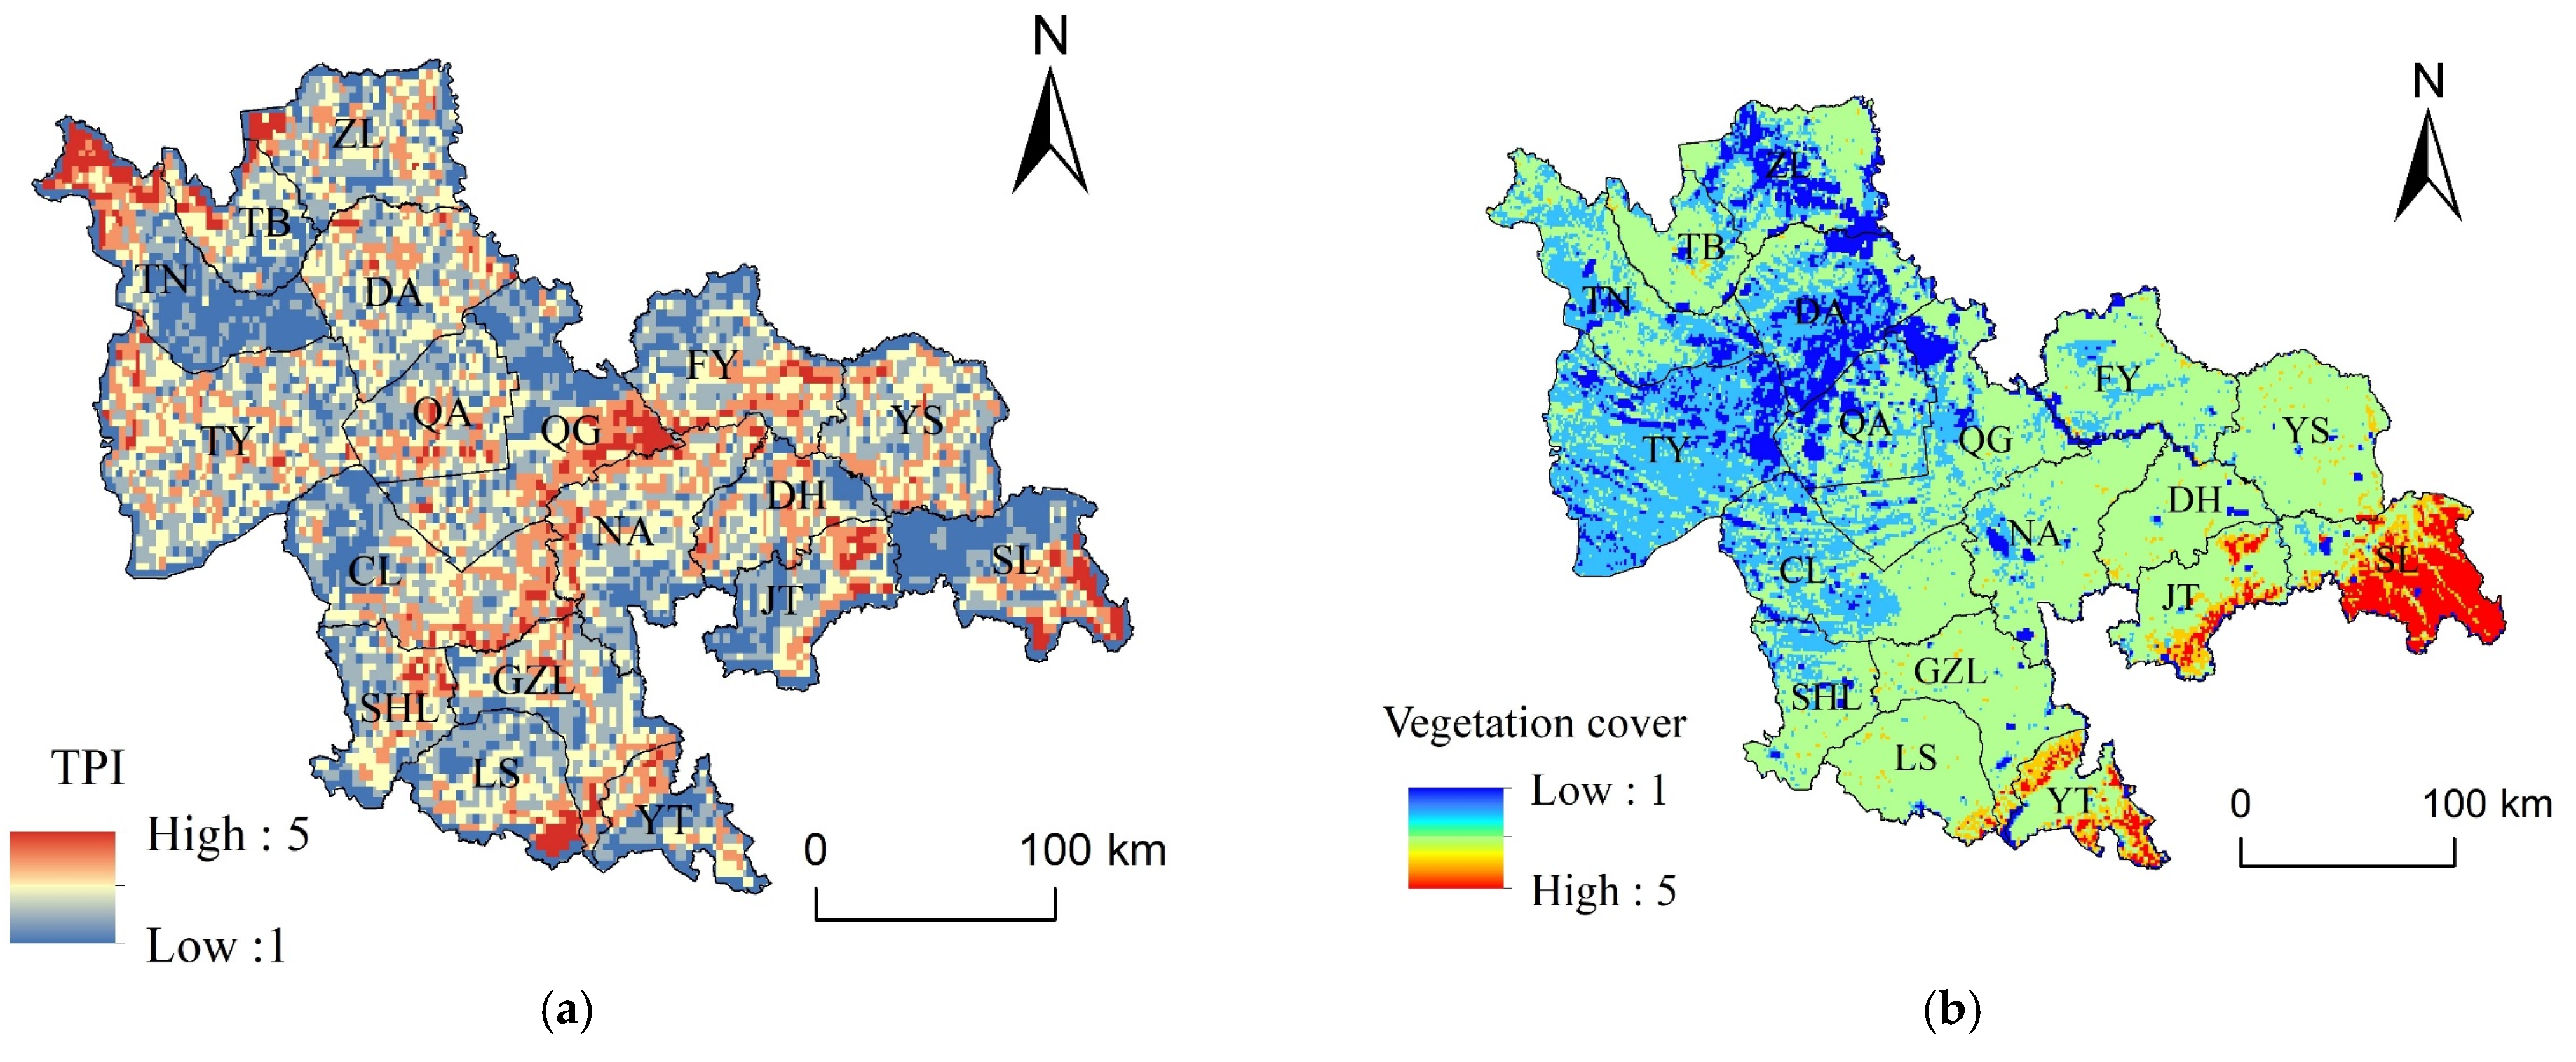
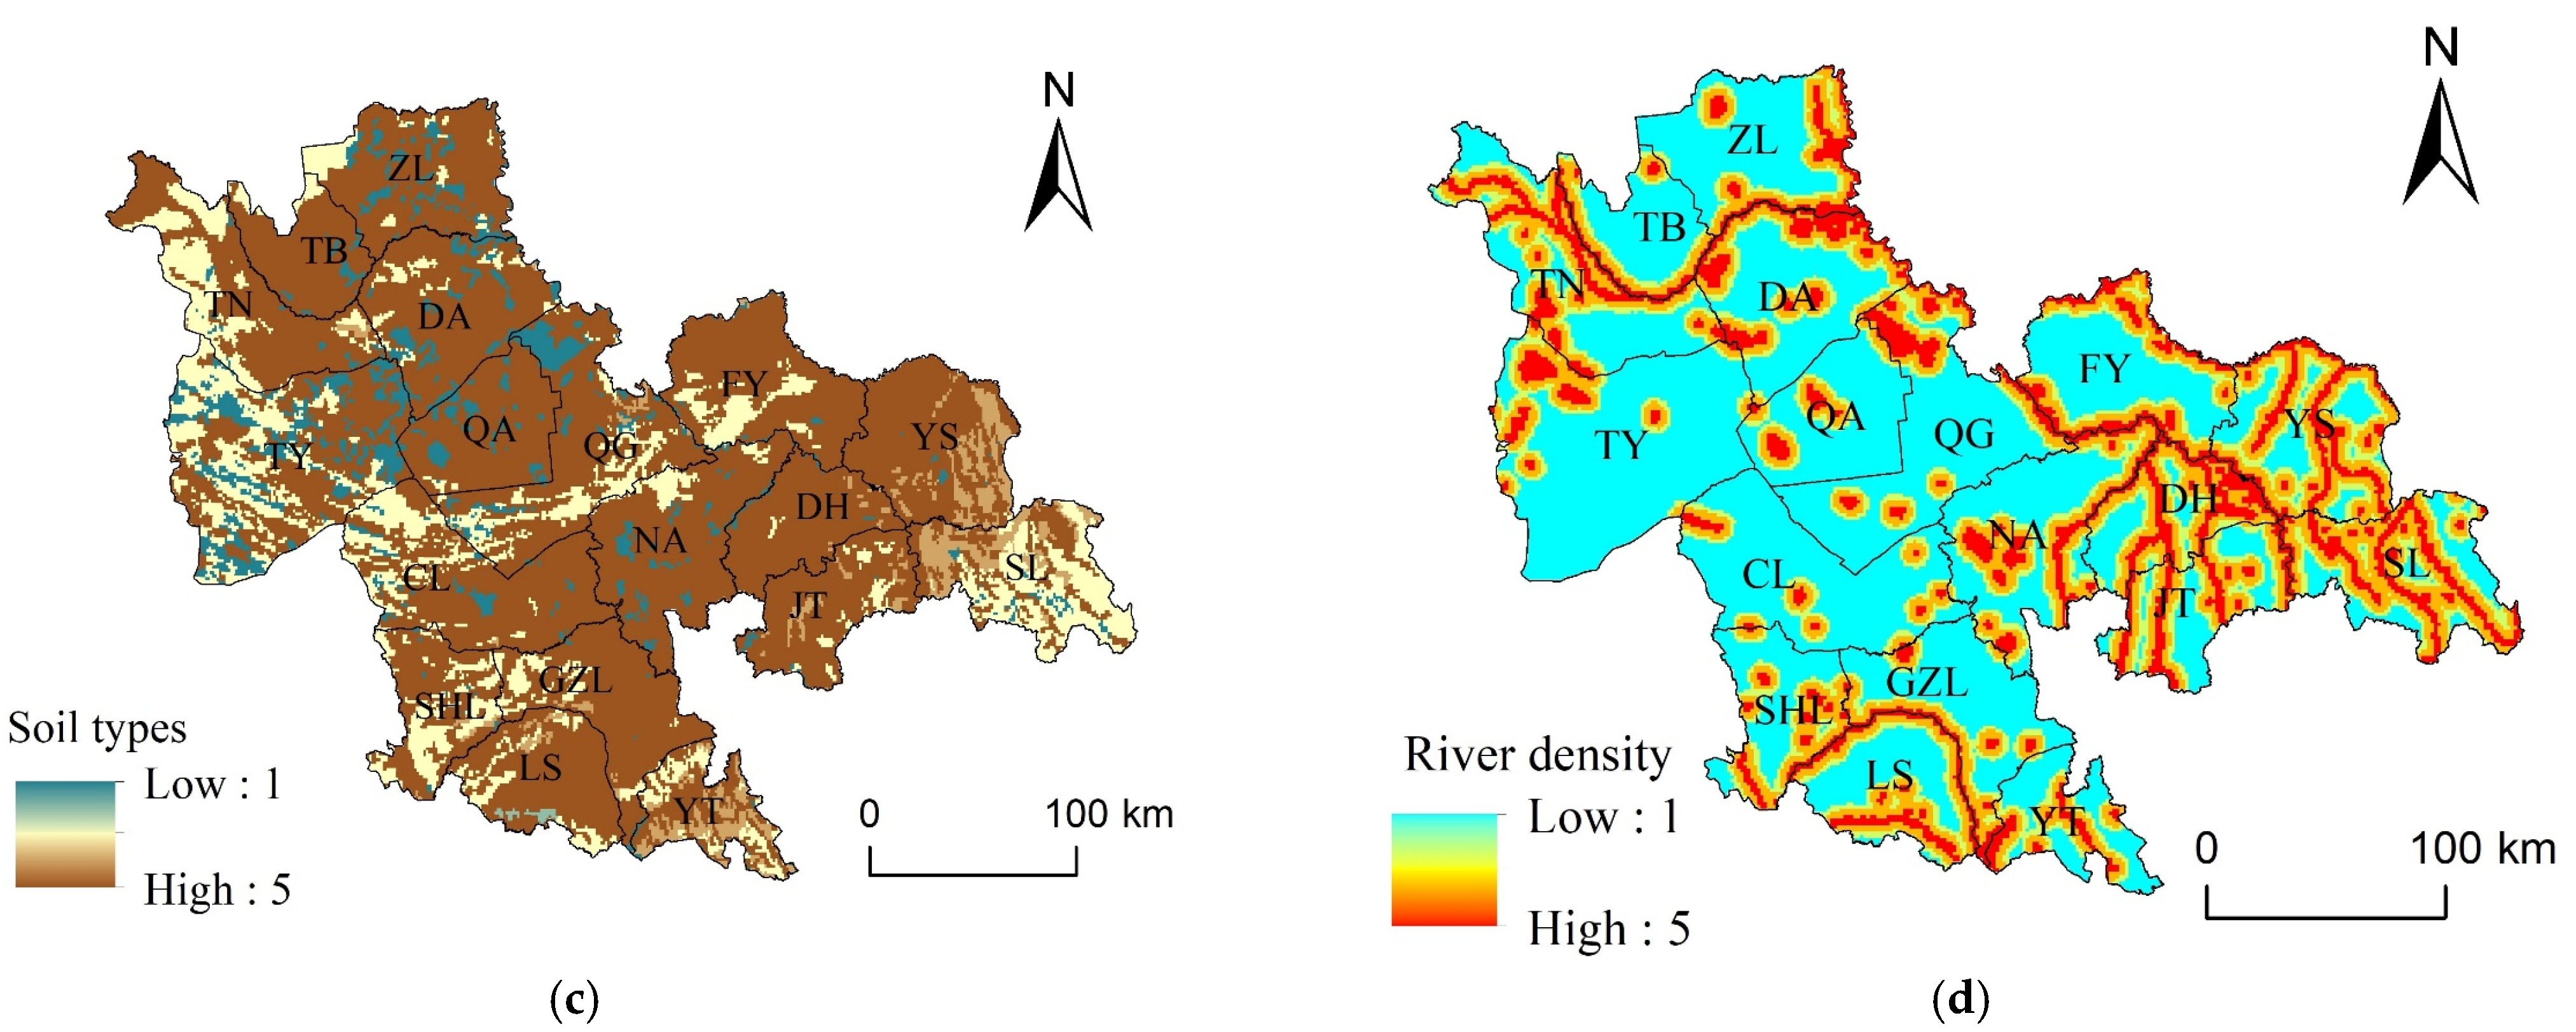
2.2.3. Sensitivity of Disaster-Pregnant Environment

The sensitivity of the disaster environment refers to the sensitivity of the external environment of agricultural drought-disaster-bearing bodies to disaster risk. The sensitivity analysis of the disaster-pregnant environment was carried out from four aspects: Topographic Position Index, river network density, vegetation coverage, and soil type. Among them, the elevation data of the terrain and the NDVI data of vegetation are from the NASA official website (https://search.earthdata.nasa.gov/, accessed on 30 November 2022), rivers and lakes data are from HydroSHEDS hydrological data (https://www.hydrosheds.org/, accessed on 30 November 2022), soil data is from the FAO soil data website (https://www.fao.org/soils-portal/en/, accessed on 30 November 2022).
As a basic element in the natural environment, topography plays an important role in human life and social development. The digital elevation model (DEM) of the study area extracts two basic topographic factors, namely slope and slope direction, for analysis and research and combines the ArcGIS modeling function to process the elevation and slope factors to obtain the topographic position index to analyze the overall characteristics of the topography of the study area [20,21]. The topographic position index can realize the collection of slope and elevation information to reflect the topographic conditions of a certain area in an integrated way, which is calculated as follows [22].
T = lg [ E E ¯ + 1 ] × [ S S ¯ + 1 ]
where: T is the topographic position index; E is the elevation value of any point in space; and E ¯ is the average elevation value in the region; S is the slope value of any point in space; S ¯ is the average slope value in the region. The higher the elevation and slope, the higher the topographic index value, and the more vulnerable the environment is to disaster.
The distribution of water systems largely determines the disaster-pregnant conditions for the occurrence of drought disasters in the study area. The closer the distance is to rivers, lakes, and reservoirs, the higher the grade of the rivers, and the larger the area of lakes and reservoirs, the greater their influence on the drought-gestation environment. In this paper, we primarily extract rivers with grades one through five, as well as large scale lakes and reservoirs, as river network water system factors, and we set the width of the three levels of river and lake buffer zones to 1 km, 3 km, and 5 km, respectively. ArcGIS software was used to calculate the buffer zones of each level of the river network water system of rivers and lakes, and the distribution map of the river network water system impact index was obtained after normalization and raster overlay calculation. The greater the water system’s buffer zone index, the denser the rivers in its area, and the less sensitive the drought disaster disaster-pregnant environment.
Vegetation cover is the percentage of the vertical projection of vegetation on the ground to the total area of the region. Vegetation has a strong shading capacity and can play a role in mitigating persistent drought disasters, to a certain extent [23]. The relationship between vegetation cover and drought disaster risk is proportional; the risk of disaster is low where vegetation density is high, and conversely, where vegetation density is low, the possibility of disaster is increased [24]. The vegetation cover can be calculated based on an elementary dichotomous model equation.
V F C = N D V I N D V I m i n N D V I m a x N D V I m i n
In the formula, VFC is vegetation coverage, N D V I is normalized vegetation index, and the NDVI values with cumulative probabilities of 5 and 90 percent are taken as N D V I m i n and N D V I m a x , respectively.
Soil type is also an important aspect in determining the environmental sensitivity of the potential disaster. Based on soil type, organic matter content, soil water retention, and local experts’ experiences, different soil types in northeast China were ranked for drought resistance and assigned vulnerability levels, respectively.

2.2.4. Stability of Disaster Mitigation Capacity

Drought resilience characterizes the ability of a region to reduce the damage caused by drought based on human measures taken before and during drought-causing disasters. Regional drought resilience mainly includes the following three aspects: first, the management countermeasures that can be quickly recovered before, during, or after a disaster, i.e., emergency management capacity. The second is the reserve of materials needed in case of disasters, i.e., resources supporting capacity; the third is the use of modern science and technology to manage agriculture, i.e., the level of agricultural modernization. The weights of the three indicators in the calculation of disaster prevention and mitigation characterization values are determined by the entropy weight method. The specific indicators are listed in Table 2.

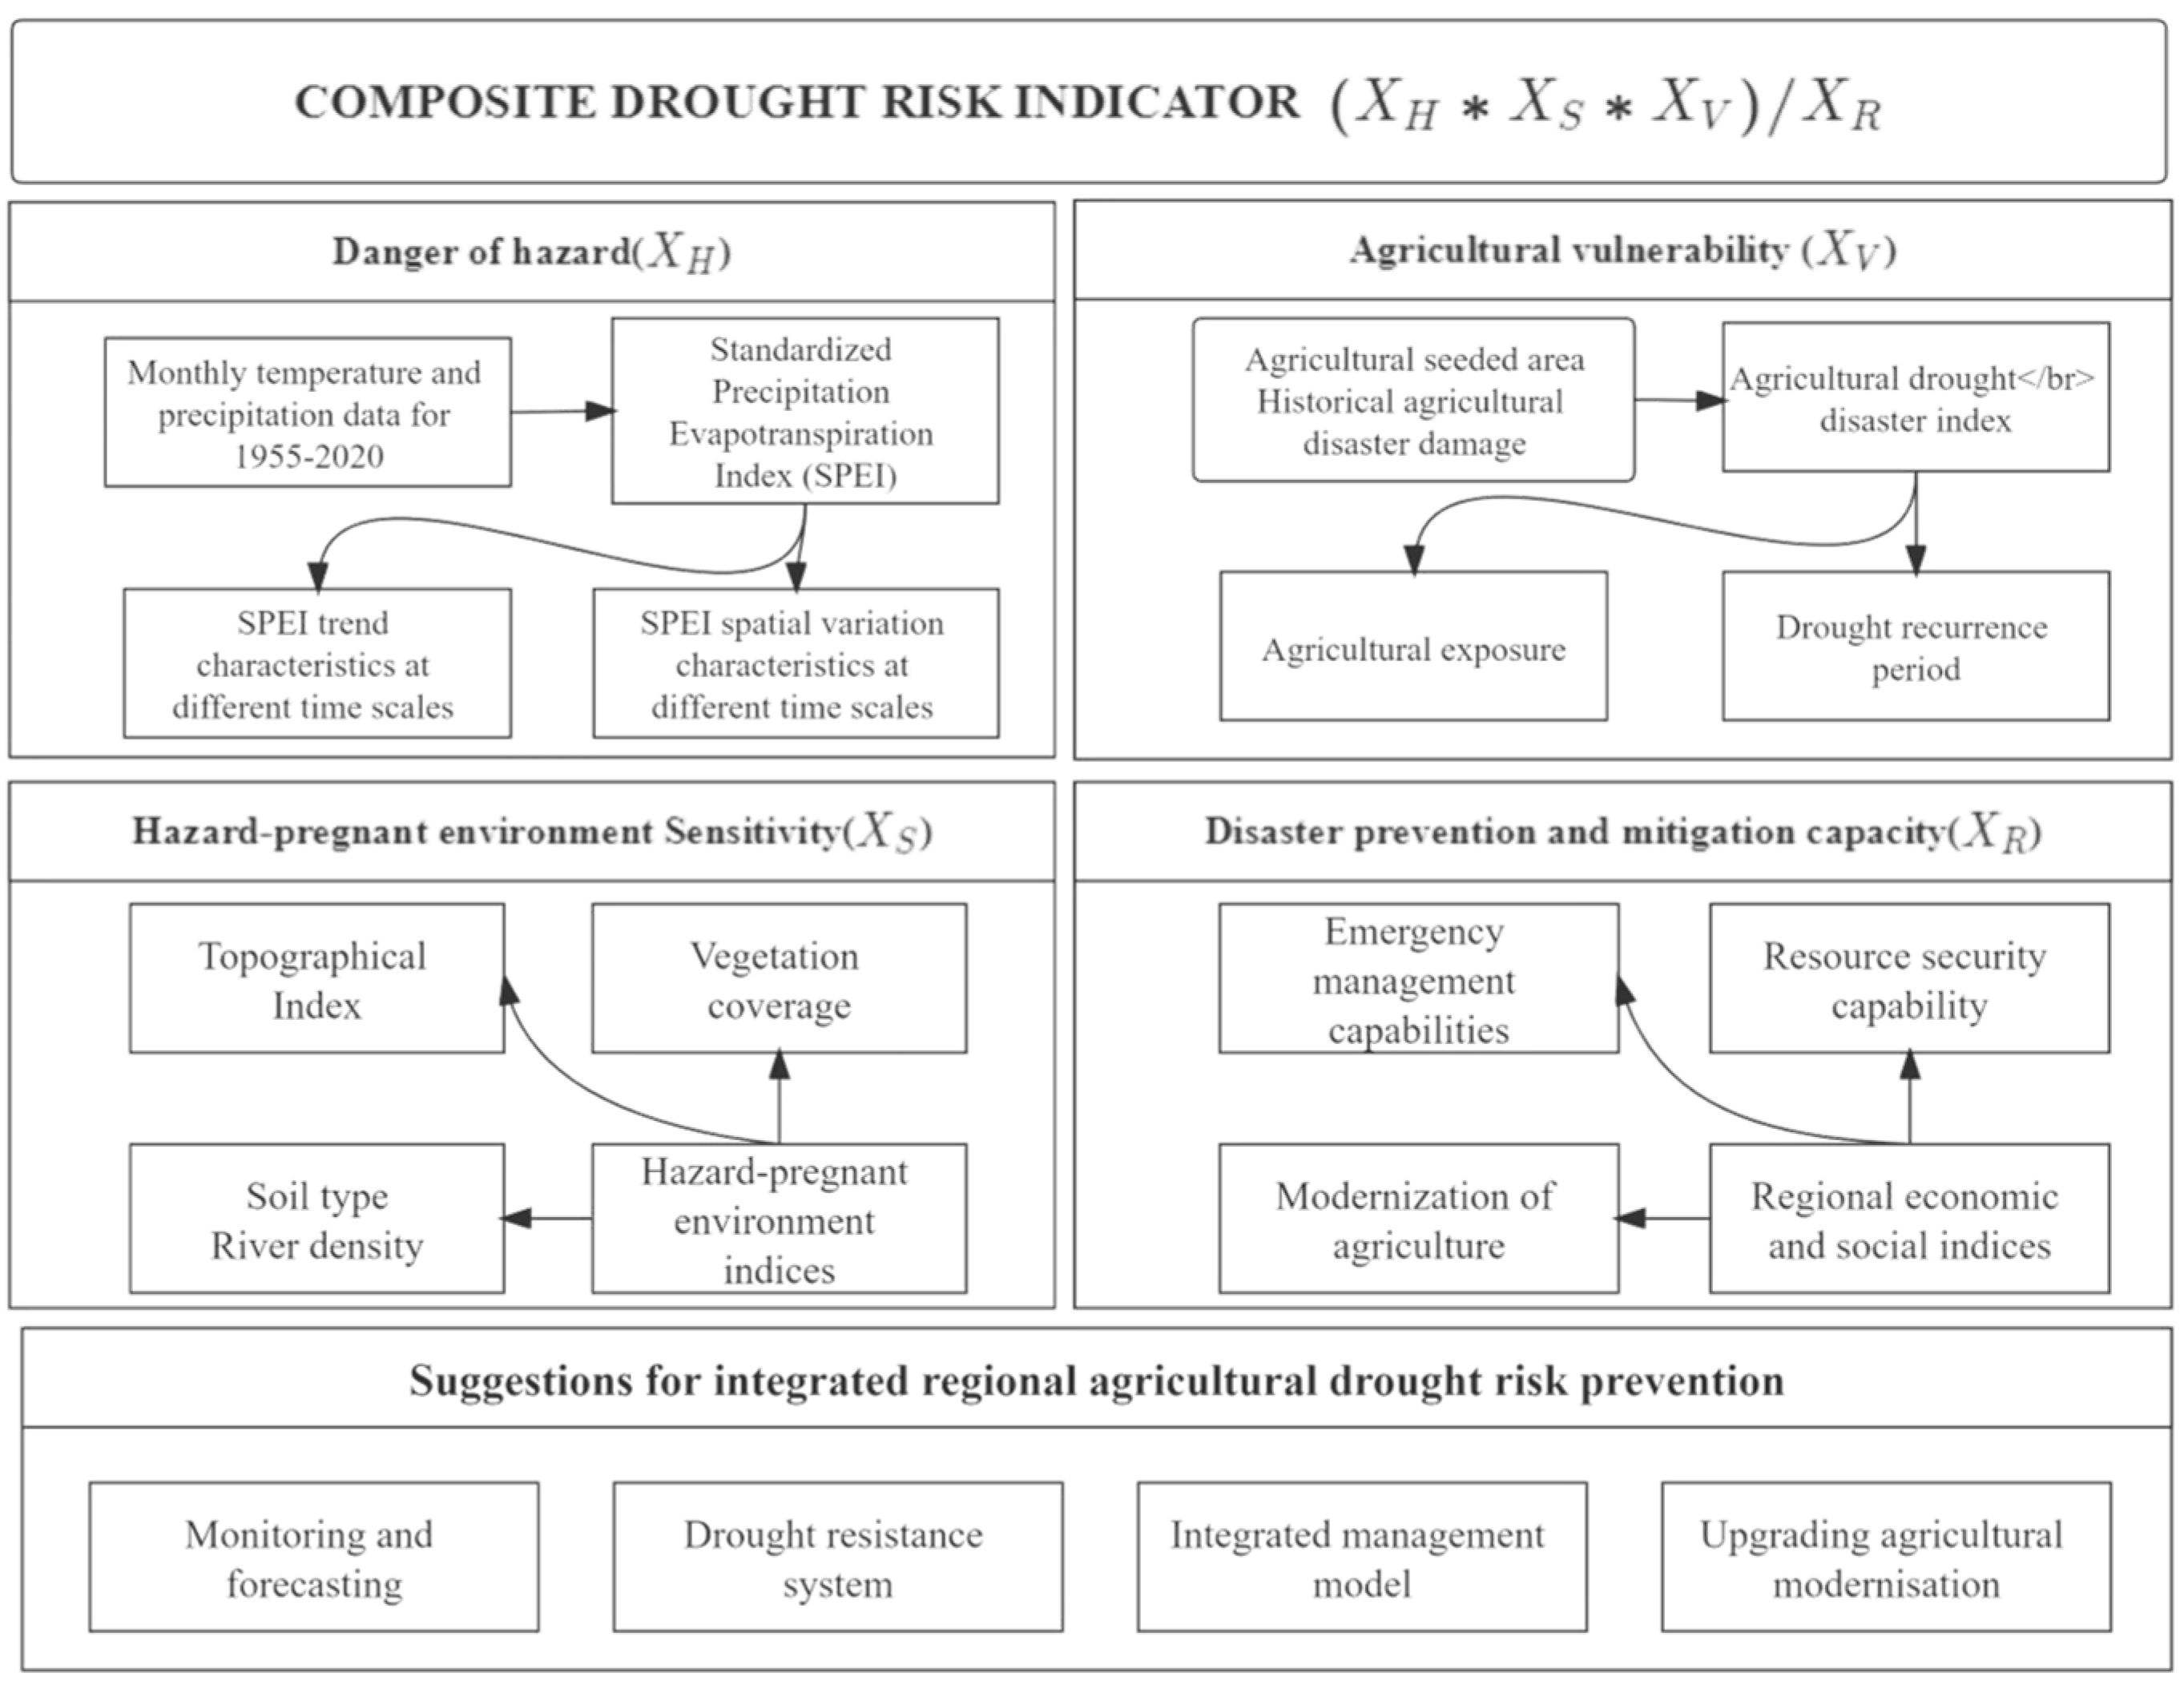
2.3. Research Method

The article builds an integrated risk assessment model of agricultural drought disaster using research findings from integrated disaster risk assessment, evaluates agricultural drought risk in the primary grain-producing regions of Jilin Province, determines the spatial distribution of agricultural drought risk, and offers regional integrated agricultural risk prevention suggestions from various angles (Figure 2). Process details: (1) Determine the drought risk scenario. The drought index was created by calculating the average temperature and precipitation for each month over 66 years in order to determine the regional and temporal distribution of drought risk. (2) Define vulnerable regions. A thorough computation was done to determine the highly sensitive locations in the research area based on four environmental indicators: topography, river network density, plant cover, and soil type. These four environmental indicators all have an impact on crop development. (3) Calculate agriculture vulnerability. The exposure of crops and the duration of drought recurrence were assessed using the area of crops sown in the area and the historical disaster damage index of crops, and the vulnerability of crops was thoroughly computed. (4) Measure the capability for catastrophe mitigation and prevention. To evaluate the regional integrated disaster reduction capacity and determine the current state of agricultural disaster reduction in each region, the three disaster reduction indicators of emergency management capacity, resource security capacity, and degree of agricultural modernization are used. (5) Based on the results of the risk assessment for drought disasters, construct an integrated risk prevention model for agricultural disasters in the key grain-producing districts of Jilin Province and offer suggestions for the sustainable development of local agriculture.

2.3.1. Fuzzy Risk Assessment Model

Based on the fuzzy mathematical method, the traditional observation sample point set is valorized to solve the problem of insufficient sample data and achieve the purpose of improving the accuracy of information processing [25,26,27]. With the help of the disaster index reflecting the degree of agricultural disaster, the single sample observation value is converted into fuzzy by the information diffusion coefficient, and the quantitative analysis of a regional agricultural drought disaster is carried out to calculate the probability value and risk value of each evaluation unit under different disaster indices for multiple disaster species [9]. The specific operation steps are as follows:
Assume that y 1 , y 2 , , y m   are the actual values (observations) of risk factor indicators (hazard indicators) in year m, and the set of observation samples are:
y j = { y 1 , y 2 , , y m }
where: y j —sample observation points; m—total number of sample observations.
Let the universe of y j ( u i ) , u i ( i = 1 , 2 n ) be the control point of the universe of disaster index:
u i = { u 1 , u 2 , , u n }
where: u i —any discrete real value obtained by discretizing at a fixed interval in the interval [0, 1]; n—the total number of discrete points.
The information carried by each single observation sample value y j is diffused to each member of the indicator domain u i based on the following equation, the information diffusion equation for y j .
f j ( u i ) = 1 h 2 π e [   ( y j u i ) 2 2 h 2 ]
where h—the diffusion coefficient, which is determined according to the number of samples, is given by the following equation.
h = { 0.8146 ( b a ) , m = 5 0.5690 ( b a ) , m = 6 0.4560 ( b a ) , m = 7 0.3860 ( b a ) , m = 8 0.3362 ( b a ) , m = 9 0.2986 ( b a ) , m = 10 2.6851 ( b a ) ( m 1 ) , m 11
b—the maximum value in the sample set; a—the minimum value in the sample set; m—the number of samples.
If marked:
C j = i = 1 n f j ( u i ) ,   j = 1 , 2 , , m
Then any observation sample y j   becomes a fuzzy set with μ y j ( u i ) as the affiliation function, and the affiliation function of the corresponding fuzzy subset is:
μ y j ( u i ) = f j ( u i ) c j
c j   is the sum of f j ( u i ) ; μ y j ( u i ) is the normalized information distribution of sample y j . Then, let:
Q ( u i ) = j = 1 m μ y j ( u i )
From the set of observation samples { y 1 , y 2 , , y m } , sample observation can only take one of { u 1 , u 2 , , u n } , the number of samples with observation u i is q ( u i ) when all y j are considered as sample representatives. q ( u i ) is usually not a positive integer, but must be a number not less than 0.
Q = i = 1 n q ( u i )
Q is the sum of the number of samples at each u i point, theoretically it should be Q = m, but with the error of numerical calculation, Q is slightly different from m.
P ( u i ) = q ( u i ) Q
P( u i ) is the probability value of the sample falling at u i , which can be used as a probability estimate. For a single-valued observation sample indicator y j = { y 1 , y 2 , , y m } , take y j as an element u i in the theoretical domain u. The probability value of exceeding u i   should be:
P ( u u i ) = k = i n P ( u i )  
P( u i ) is the value of the frequency of the sample falling at u i which is the value of the probability of exceeding u i   ; P ( u u i ) is called the risk value or loss value of the hazard factor.

2.3.2. Sen + M-K Trend Analysis

Theil–Sen Median (Sen) Trend Analysis is a robust nonparametric statistical trend calculation method by calculating the median in the series, which can well reduce noise interference [28]. The Mann–Kendall test (M-K) is very effective for change tests of changing elements from one relatively stable state to another and is widely used in hydrology, climate, chemistry, mineral composition, and other aspects. It is widely used and has many benefits for analyzing trends in long time series [29,30]. In this research, we utilize the Sen trend to assess the multi-scale drought changes in the study region, and use the Mann–Kendall test to examine the trend and significance test of the temporal features of SPEI in the primary grain producing area of Jilin Province. The specific calculation formula is as follows:
The Sen trend is calculated as:
S e n = M e d i a n ( x j x i j i ) , i > j
where: x i and x j are time series data, Median is the median of the series, Sen > 0 means the time series is in an upward trend; Sen < 0 means the time series is in a downward trend.
The Mann–Kendall statistical test for drought index mutation characteristics was used for analysis to construct the order column S k :
S k = i = 2 k j = 1 j 1 R i j     ( k = 2 , 3 , 4 , n )
R i j = { 1 ,     x i > x j 0 ,     x i x j
Statistical variables:
U F k = S k E ( S k ) V a r ( S k )     ( k = 1 , 2 , 3 , n )
where: U F 1 = 0, E ( S k ) and V a r ( S k ) are the mean and variance of S k . x1, x2... xn are independent and have the same continuous distribution, the formulas of E ( S k ) and V a r ( S k ) are:
E ( S k ) = k ( k + 1 ) 4     ( k = 2 , 3 , , n )
V a r ( S k ) = k ( k 1 ) ( 2 k + 5 ) 72     ( k = 2 , 3 , , n )
The M-K test calculates the positive series statistic U F k and the inverse series statistic U B k by computing the rank of each sample, U B k = U F k . If U F k and U B k curves intersect, the moment corresponding to the intersection is the mutation point.

3. Results and Discussion

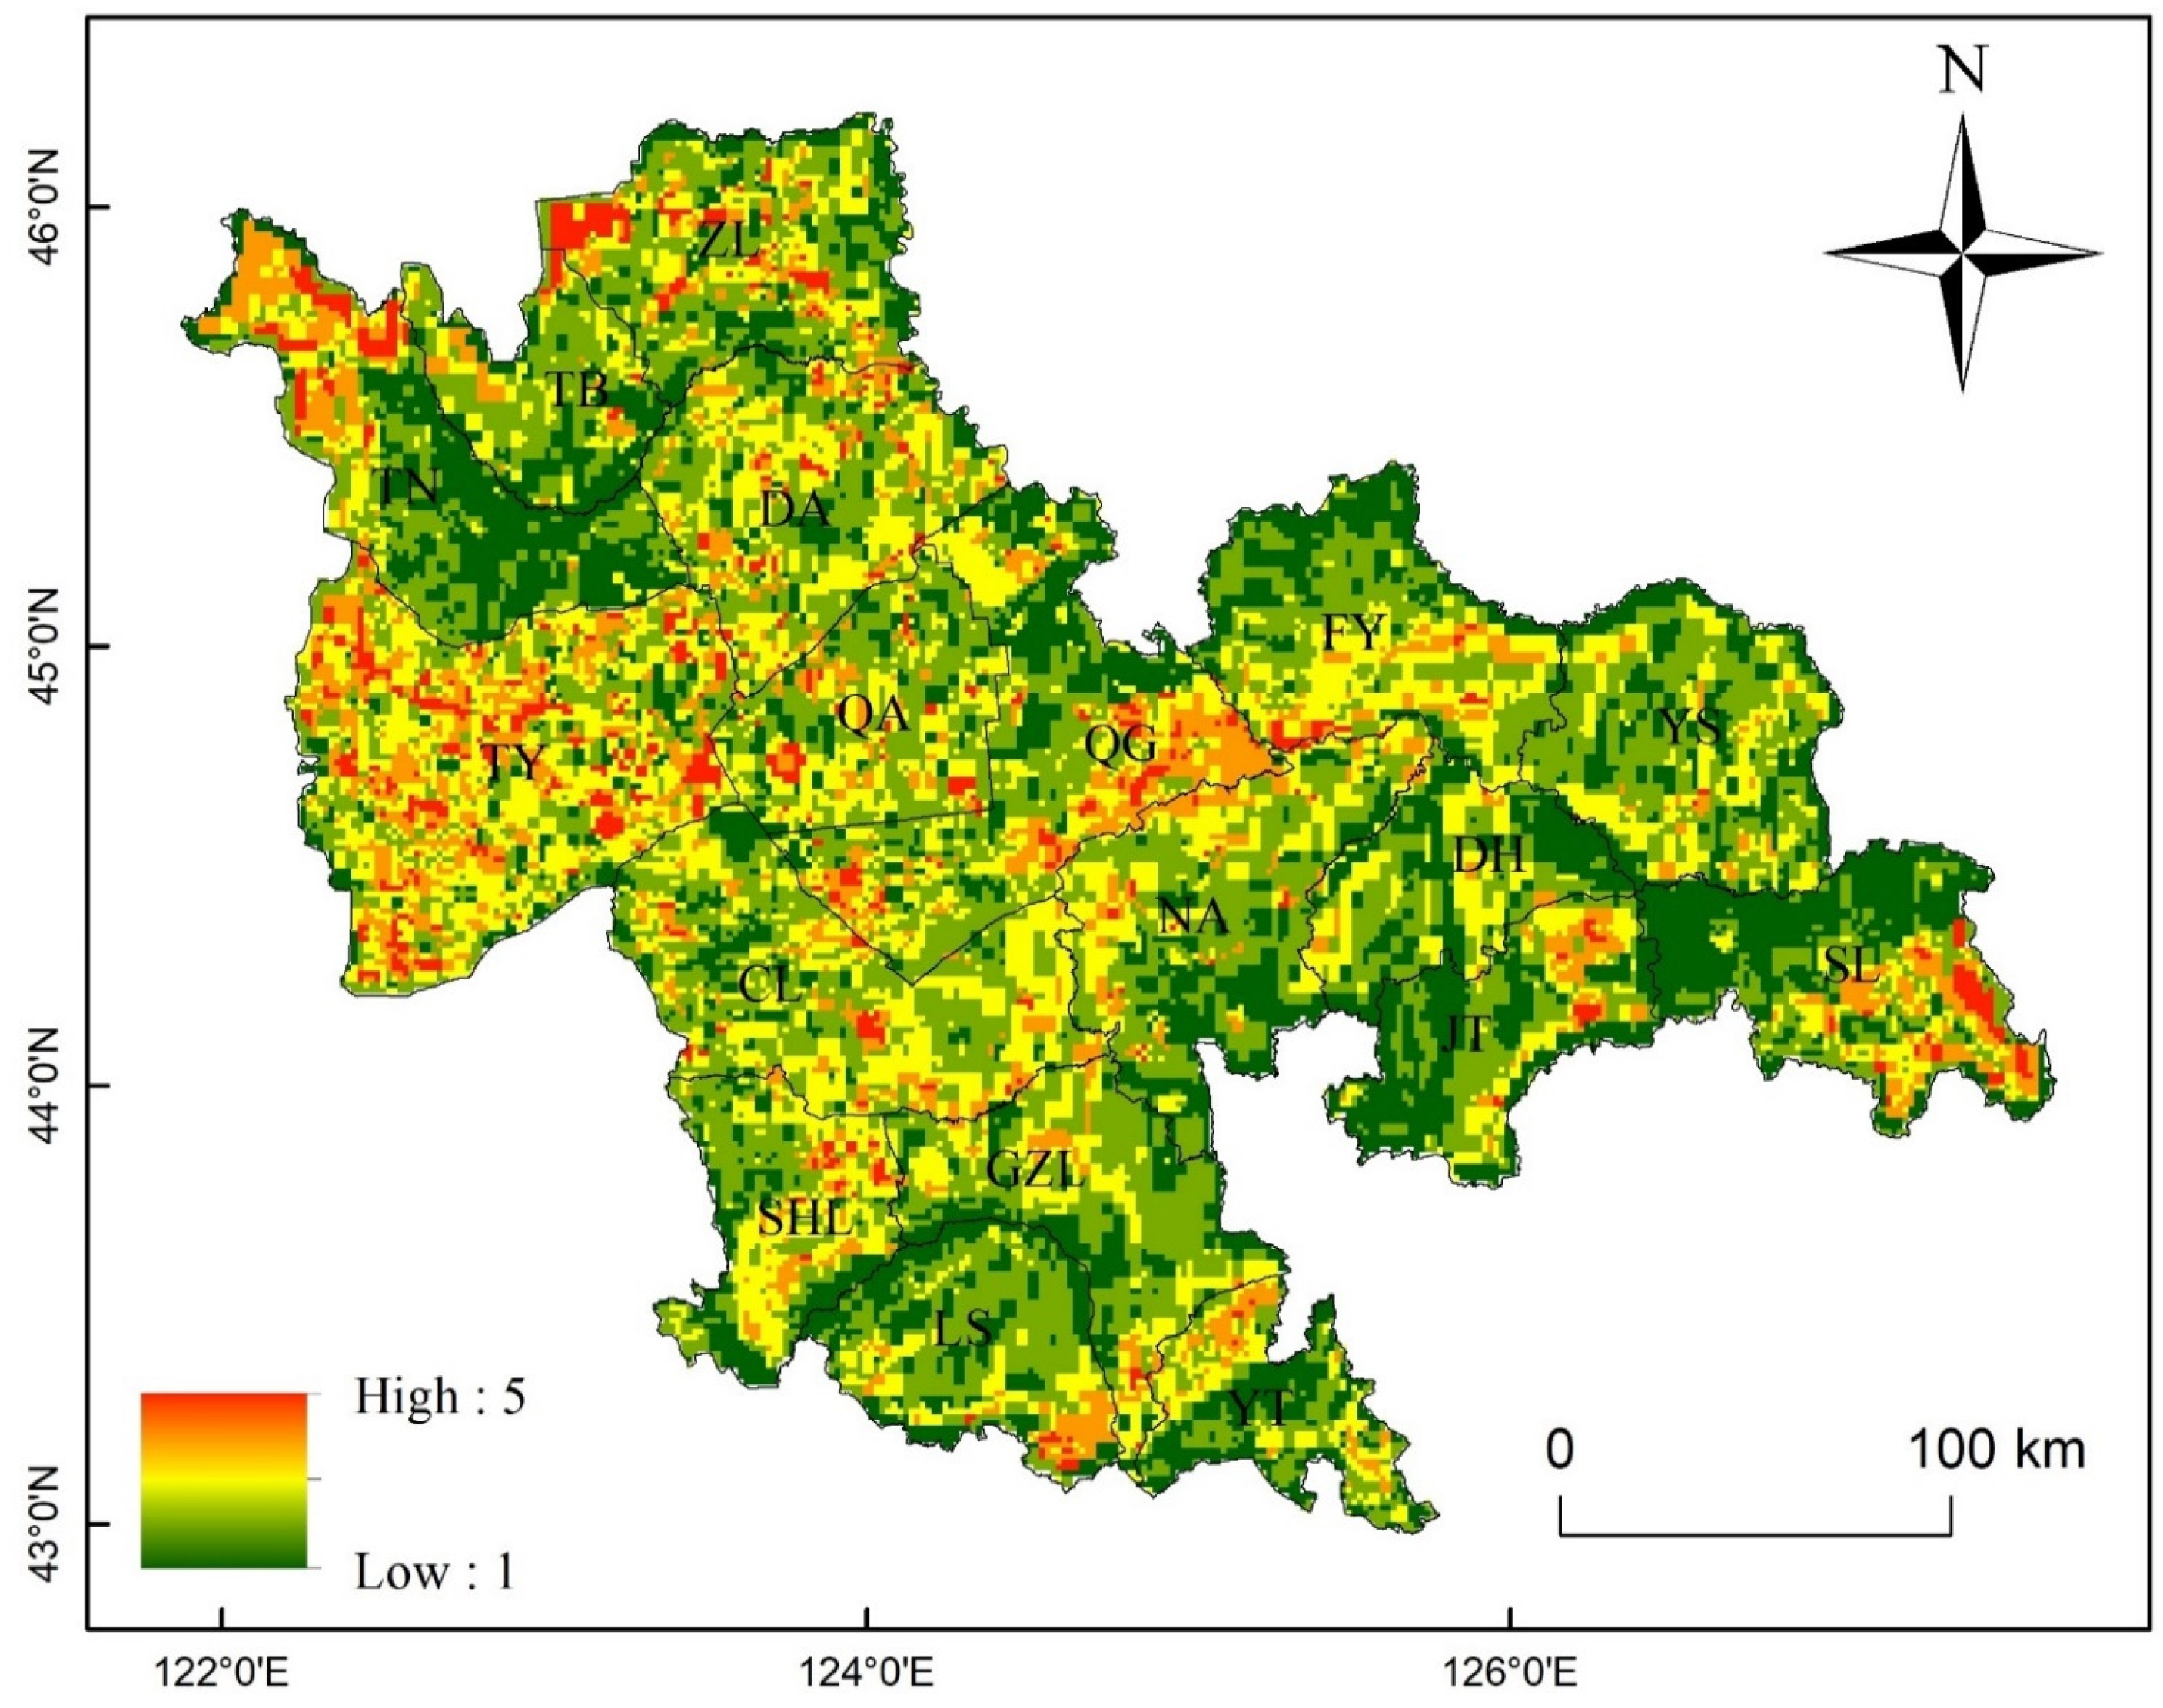
3.1. Drought Hazard Assessment

3.1.1. Interannual Variation Characteristics of SPEI Index

The Mann–Kendall (M-K) mutation test was used to the yearly scale SPEI in the research region in order to examine the change and mutation of the index. From 1955 to 2020, the research area’s SPEI-12 index varied around the 0-value line, and the overall trend was declining at a rate of −0.089 (10a)−1 (Figure 3), showing that the study area’s drought trend has progressively been worsening over the previous 66 years. The years 1960–1965 and 1980–1990 were the wet stages, and there was little to no drought, generally. The years 1975–1981 and 2000–2010 were the aridification stages (except 2005). Due to decreased precipitation, rising temperatures, and increasing evapotranspiration currently, there was a significant water loss, particularly in 1981 and 2001. From 2010 to 2020, it was back in the wetting stage. However, there was a severe drought that was congruent with the actual occurrence of the drought in 2014. According to the Jilin Province’s 2014 drought work report, the province saw consistently high temperatures and minimal rain from 1 July to 17 August, with an average rainfall of 132.0 mm, 46% less than the same time in a typical year. At its worst, the drought in the province devastated 958,000 hectares of dry land, mostly in eight regions in the province’s center and west: Changling, Shuangliao, Qianguo, Qianan, Tongyu, Nongan, Lishu, and Gongzhuling [31]. SPEI is therefore well suited for use in the research area’s drought monitoring. The UF line alternatively showed increasing and declining trends. The UF and UB curves have four mutation sites, mostly concentrated in 1958–1963 and 2017. The drought scenario was noteworthy since the UF lines for the neighboring years of 1982 and 2010 crossed the 0.05 crucial line. The management of continuous agricultural drought resistance should be strengthened.

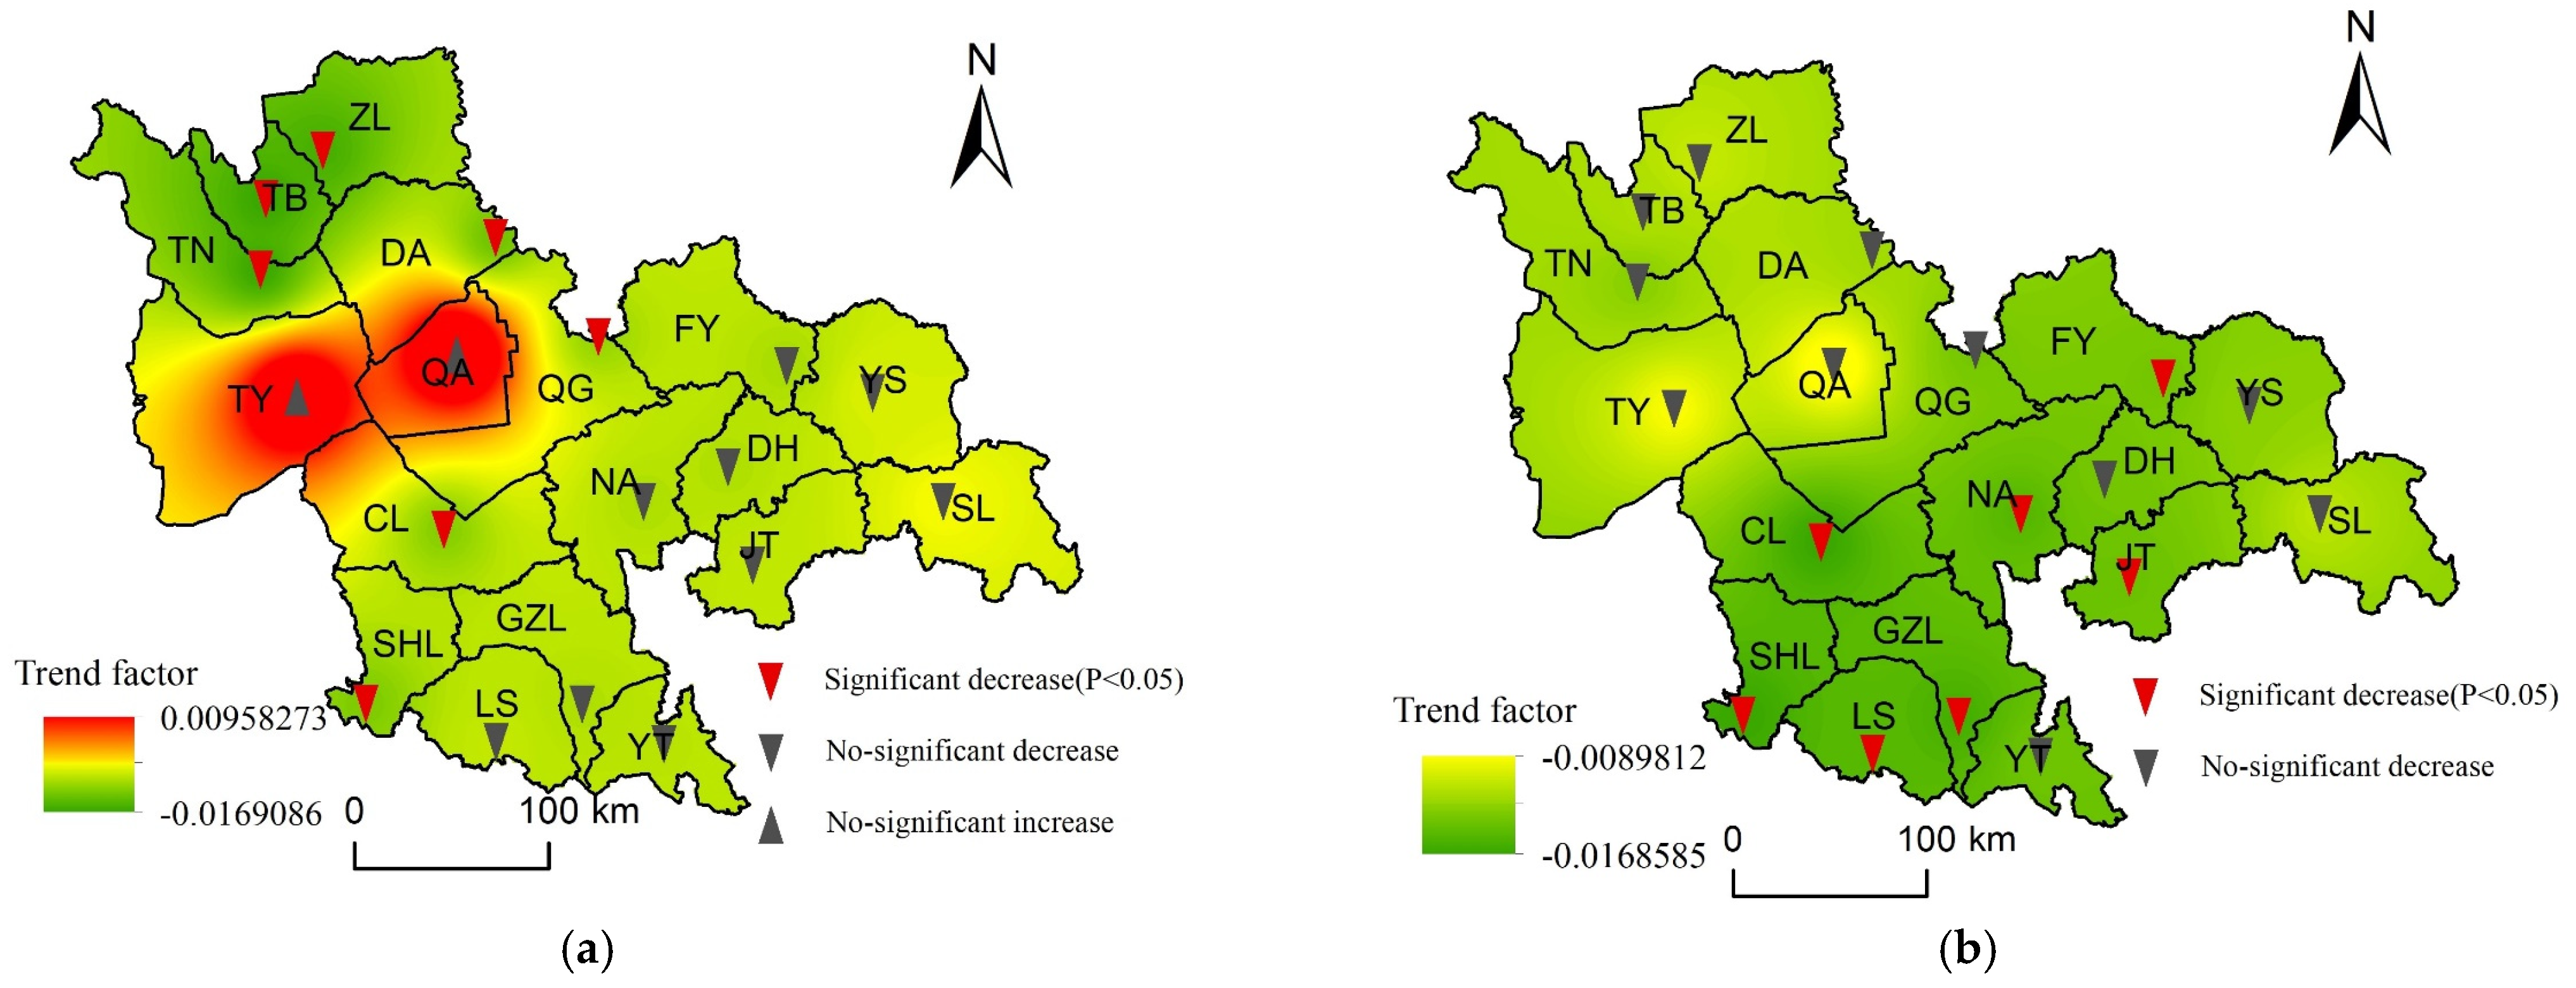
3.1.2. Spatial Variation Characteristics of Drought at Different Time Scales

Seasonal variations in the SPEI-3 spatial patterns in the research region showed a substantial difference on a seasonal scale. Drought has the greatest impact on agriculture during the growing season. The cropping system in the study area is mainly “one crop per year”. The whole cycle from sowing to harvesting takes place mainly from March to September. Therefore, in order to make the analysis more effective, the SPEI-3 (seasonal scale) is analyzed mainly in the spring and summer. The SPEI-3 index’s spring trends were declining and growing, accounting for 88.8% and 11.2% of the total. The spring drought in Qianan and Tongyu exhibited a growing tendency, and farmers in these two regions need to be mindful of its effects while planting during the early stages of crop growth. However, the declining trend was not significant in nine locations, including the eastern portion of the research, and it is important to highlight that an intermittent spring drought can occur. The summer decreasing tendency in the study area is also a regional trend. In the southern portion of the research region, in places like Shuangliao, Lishu, and Gongzhuling, summer drought is significantly on the decline (p < 0.05). The formation of an episodic persistent drought in the summer should be observed, and the drought reduction trend in the western section of the research region, including Zhenlai and Daan, decreases significantly when seasonal precipitation declines (Figure 4a,b).
The likelihood of drought-related disasters was calculated by examining the spatial variation pattern of regional drought frequency and intensity. Based on Equation (4), the frequency of various drought types at the regional monthly scale was calculated (Table 3). The 1960s, the early 21st century, and 2010 were the main time periods in which the regional special drought occurred, with Tongyu and Qianan having the highest concentration of occurrences. The frequency of the regional special drought was 1.12%. Additionally, the analytical hierarchy technique was used to calculate the weights of various drought intensities (AHP). The regional drought risk rating was derived by adding the risk rating to the weightings based on the frequency of drought. The weightings for special drought, severe drought, medium drought, and light drought were 0.4, 0.3, 0.2, and 0.1, respectively. After raster reclassification of the local disaster-causing hazard levels, the results were obtained (Figure 5). The findings indicate that Qianan and Yitong, where droughts occur frequently and intensely, are the primary locations with a high risk of drought.

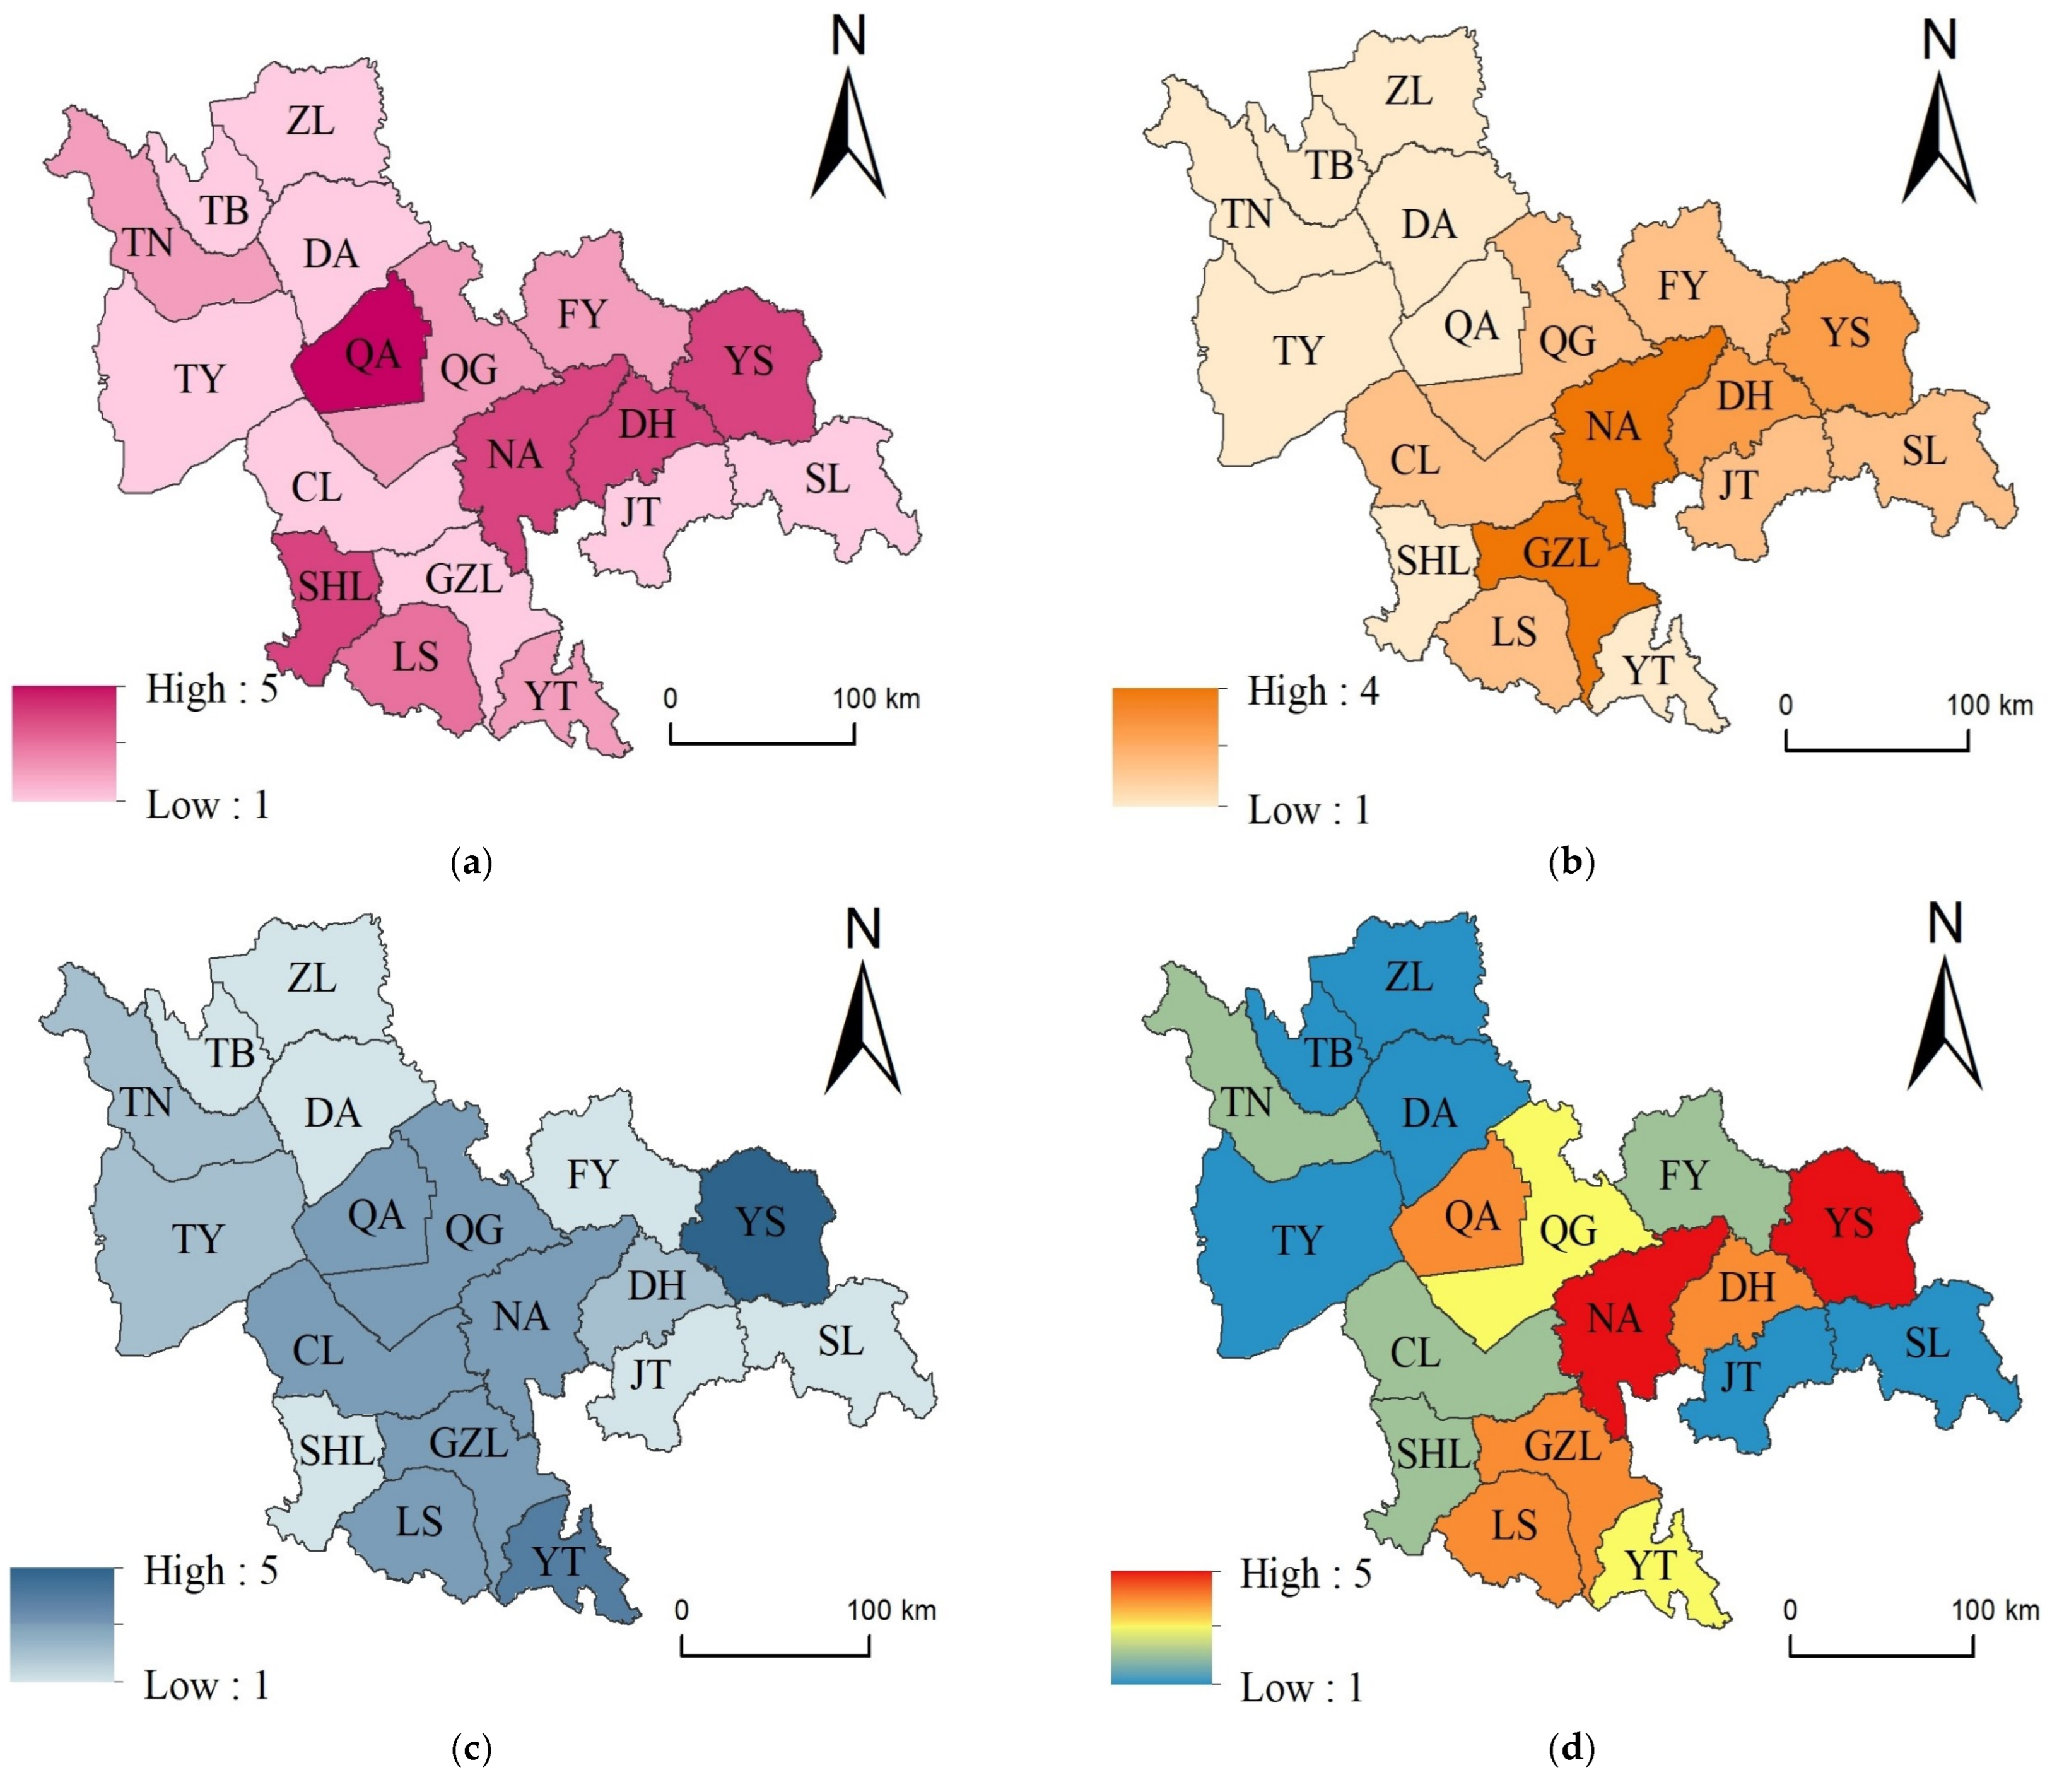
3.2. Vulnerability Assessment of Agricultural Disaster-Bearing Bodies

The vulnerability of the crop transporter is an essential measure for characterizing crop resilience to disaster impact. The article reflects the vulnerability of the crop carrier from two perspectives: the exposure of the carrier and the recurrence period of disasters. The vulnerability of the disaster-bearing body in each major grain-producing region is reflected by the sown area of crops in the region and the historical disaster exposure.
Based on the agricultural fuzzy risk analysis model to estimate the drought disaster risk values of 18 major grain-producing areas in Jilin Province, the discrete domain was constructed according to the maximum and minimum values of the disaster-causing range and intensity and their possible values, and the disaster risk probabilities under different disaster indices in each major grain producing area could be obtained based on Equations (7)–(16). The probability density responds to the probability of occurrence of major hydrometeorological disasters under different disaster indices in the main grain-producing areas of Jilin Province, so as to infer the magnitude of the probability of occurrence of different disaster levels (Figure 6); the results show that the disaster indices of drought disasters in all districts and counties except Shulan, Tongyu, Dehui, Nongan, and Gongzhuling almost cross 80% of the disaster index axis and all have the possibility of occurrence of large-scale disasters.
The excess probability density can laterally reflect the level of agricultural vulnerability in the study area under different disaster indices of major meteorological hazards (Figure 7); the results show that the risk values of drought hazards all decrease with the increase of the disaster index, and the hazard values of the main food production areas of Lishu, Fuyu, and Qianguo are at a higher level under the same disaster index.
The risk recurrence period grading criterion (T = 1/P) was used to calculate the risk levels of meteorological hazards under various disaster indices. To aid in the analysis and evaluation of the spatial distribution characteristics of agricultural drought disaster risk in the study area’s main grain producing areas, a disaster reoccurrence period with a disaster index of 30% was chosen for each main grain producing area, and the vulnerability of the disaster-bearing body was assessed and classified into five levels using the natural interruption point method (Figure 8a). The findings revealed that the historical recurrence periods of drought in the research area’s Yushu, Lishu, Dehui, Taonan, and Qianguo regions were small in comparison to other regions, and the frequency of catastrophes was high.
Using the sown area data of crops in each town, the exposure of agricultural disaster-bearing bodies in the entire study area was determined using the Kriging interpolation analysis method of ArcGIS software. The outcomes revealed that Yushu, Dehui, Gongzhuling, and Lishu had the highest exposure to agricultural disaster-bearing bodies in the study area, which had spatial distribution features of high in the east and low in the west (Figure 8b).
The vulnerability of regional crop disaster-bearing bodies was obtained by overlaying the raster images with equal weights for the exposure of disaster-bearing bodies and the recurrence period of drought disasters (Figure 9). The results show that the vulnerability of crop disaster-bearing bodies in Yushu, Dehui, and Lishu is large, i.e., the exposure of disaster-bearing bodies is large and the recurrence period of disaster occurrence is small. When disasters occurred, the damage caused by drought damage was more serious than in other places.

3.3. Sensitivity Assessment of Agricultural Disaster-Pregnant Environment

The environmental sensitivity of the potential disaster refers to the sensitivity of the external environment of the area threatened by the disaster to the disaster or damage. In the case of a disaster of equal intensity, the higher the sensitivity, the more severe the damage caused by the drought, and the greater the risk of disaster. In order to quantify and analyze the indicators of a disaster-predisposing environment, several disaster-predisposing environment indicators are superimposed on a refined grid using four evaluation factors: topographic position index, river density, vegetation cover, and soil type.
The topographic position index is a topographic feature value describing the height and slope, and the topographic position index is large in areas with high elevation and slope, and the larger the topographic position index value is, the more likely it is to breed drought disasters. The high and medium-high risk of topographic position index in the study area accounts for about 20%, which is sporadically distributed in the study area, among which the western edge of the study area, the east side of Qianguo, and the southeast side of Lishu present a concentrated distribution (Figure 10a).
Vegetation cover is usually defined as the ratio of forest area to total land area, which has an important regulating role for land surface and the hydrological cycle, promoting rainfall redistribution, influencing soil moisture movement, changing the conditions of water production and sink flow, and playing a role in flood reduction and mitigation, controlling soil erosion, and improving water quality in the watershed. Therefore, vegetation cover has high vegetation density and high soil water storage capacity. The results showed that the vegetation cover in the study area showed a distribution pattern of high in the east and low in the west, which was mainly distributed near Dahei Mountain and Yishu Graben, and the vegetation cover in Tongyu, Daan, and Qianan was low, with strong environmental sensitivity to drought pregnancy and relatively weak drought resistance (Figure 10b).
Most of the research region lies in the zone of transition between black land and semi-arid steppe chestnut-calcium soil. From east to west, the zone’s zonal soils are black calcium soil, light black calcium soil, and chestnut calcium soil, according to the distribution of soil types. Marsh soil, saline soil, meadow soil, and wind-sand soil are the non-zonal soils of alkali lake flat land and sandy land. While the distribution region of light black calcium soil contains both basic and general farmland, the distribution area of black calcium soil is now mostly a basic farming protection area [32,33]. Varied soil types include different amounts of organic matter, which affects how well the soil retains water. The vulnerability levels of each soil type are displayed in Table 4, and different levels are allocated to soil types based on soil type and organic matter level, respectively. The findings indicate that the majority of the research area’s regions are classified as high or greater risk, with only Tongyu and Shulan having higher soil susceptibility due to their locations in salty and highly vegetated areas (Figure 10c).
The disaster-pregnant environment for the development of drought disasters in the research region are mostly determined by the dispersion of the river network’s water system. The impact on the ecosystem during a drought season is greater the closer one is to a river, the higher the river’s level, and the larger the lake’s area. To establish the buffer zone range for rivers in the research region and gauge the extent to which the river network affects flood dangers, ArcGIS software’s buffer zone analysis feature is employed. The distribution of the buffer zone index of the water system was determined by raster superposition after normalizing the buffer zones of each water system. The greater the buffer zone index, the denser the local river network and the less vulnerable the disaster-pregnant environment to drought hazards. The results show that the river network density in Dehui, Yushu, and Shulan is denser than that in other areas, and the rivers are well supplied with water so that water resources can be deployed in case of persistent drought (Figure 10d).
Based on the assessment results of the four indicators of an agricultural disaster-pregnant environment, the weights of the topographic position index, soil type, vegetation cover, and river network density of the study area were determined based on the characteristics of the study area using hierarchical analysis (AHP). The weights were 0.5, 0.3, 0.1, and 0.1, respectively, and the final integrated calculation was carried out to obtain the integrated index of regional agricultural disaster-pregnant environments. The results showed that 14.17% of the study area had medium-high or high sensitivity to the regional disaster-pregnant environment, mainly distributed in most areas of Tongyu, the eastern area of Qianguo, and near the Yishu Graben. All the indicators of the disaster-pregnant environment in the region were of medium or higher level, and the regional disaster-pregnant environment was more sensitive (Figure 11).

3.4. Stability Assessment of Disaster Reduction Capacity

The evaluation of regional agricultural drought mitigation capacity is an important part of agricultural drought disaster risk assessment, which is an estimation of regional capacity to defend against agricultural drought and mitigate agricultural drought losses. The evaluation is carried out in three aspects: emergency management capacity, resource security capacity, and agricultural modernization, which can provide a basis for the formulation of regional disaster mitigation planning and sustainable development of agricultural production. After standardizing the data indicators in Table 1, the agricultural drought mitigation model was obtained, and the weights of each indicator were calculated using the classical entropy weight method. The three weights of emergency management capacity, resource security capacity, and agricultural modernization level were 0.29, 0.24, and 0.47, respectively. Using the agricultural drought mitigation model, the agricultural drought mitigation capacity index was calculated for the main grain-producing areas in Jilin province. In order to reflect the current situation and differences of disaster reduction capacity more objectively among regions [34], the mean-standard deviation ranking method was used to classify the agricultural drought disaster reduction capacity index in the main grain-producing areas of Jilin Province (Table 5), and the index was plotted into a graph using GIS software.
The results of emergency management capacity show that the emergency management capacity of Qianan and Yishu are at strong and stronger levels because of the high percentage of experts and emergency management teams and disaster reduction funds invested in these two regions (Figure 12a); the results of resource security capacity show that the resource security capacity of Nongan and Gongzhuling are at stronger levels because of the high capacity of agriculture, forestry, water affairs, and total agricultural machinery (Figure 12b); the results of agricultural modernization level show that the modernization levels of Yushu and Yitong are at higher levels because of the neighboring provinces and their policies (Figure 12c).
The emergency management capacity, resource security capacity, and agricultural modernization degree of the study area were overlaid and calculated according to the weights. The evaluation results were reclassified to finally obtain the regional agricultural drought integrated disaster reduction capacity grade (Figure 12d). The results show that the integrated disaster reduction capacity of Yushu and Nongan is at a high level, and all indicators for the two regions are at a medium level or above. The integrated disaster reduction capacity of the western part of the study area is generally weak and needs to be improved in terms of disaster preparedness, response, and relief.

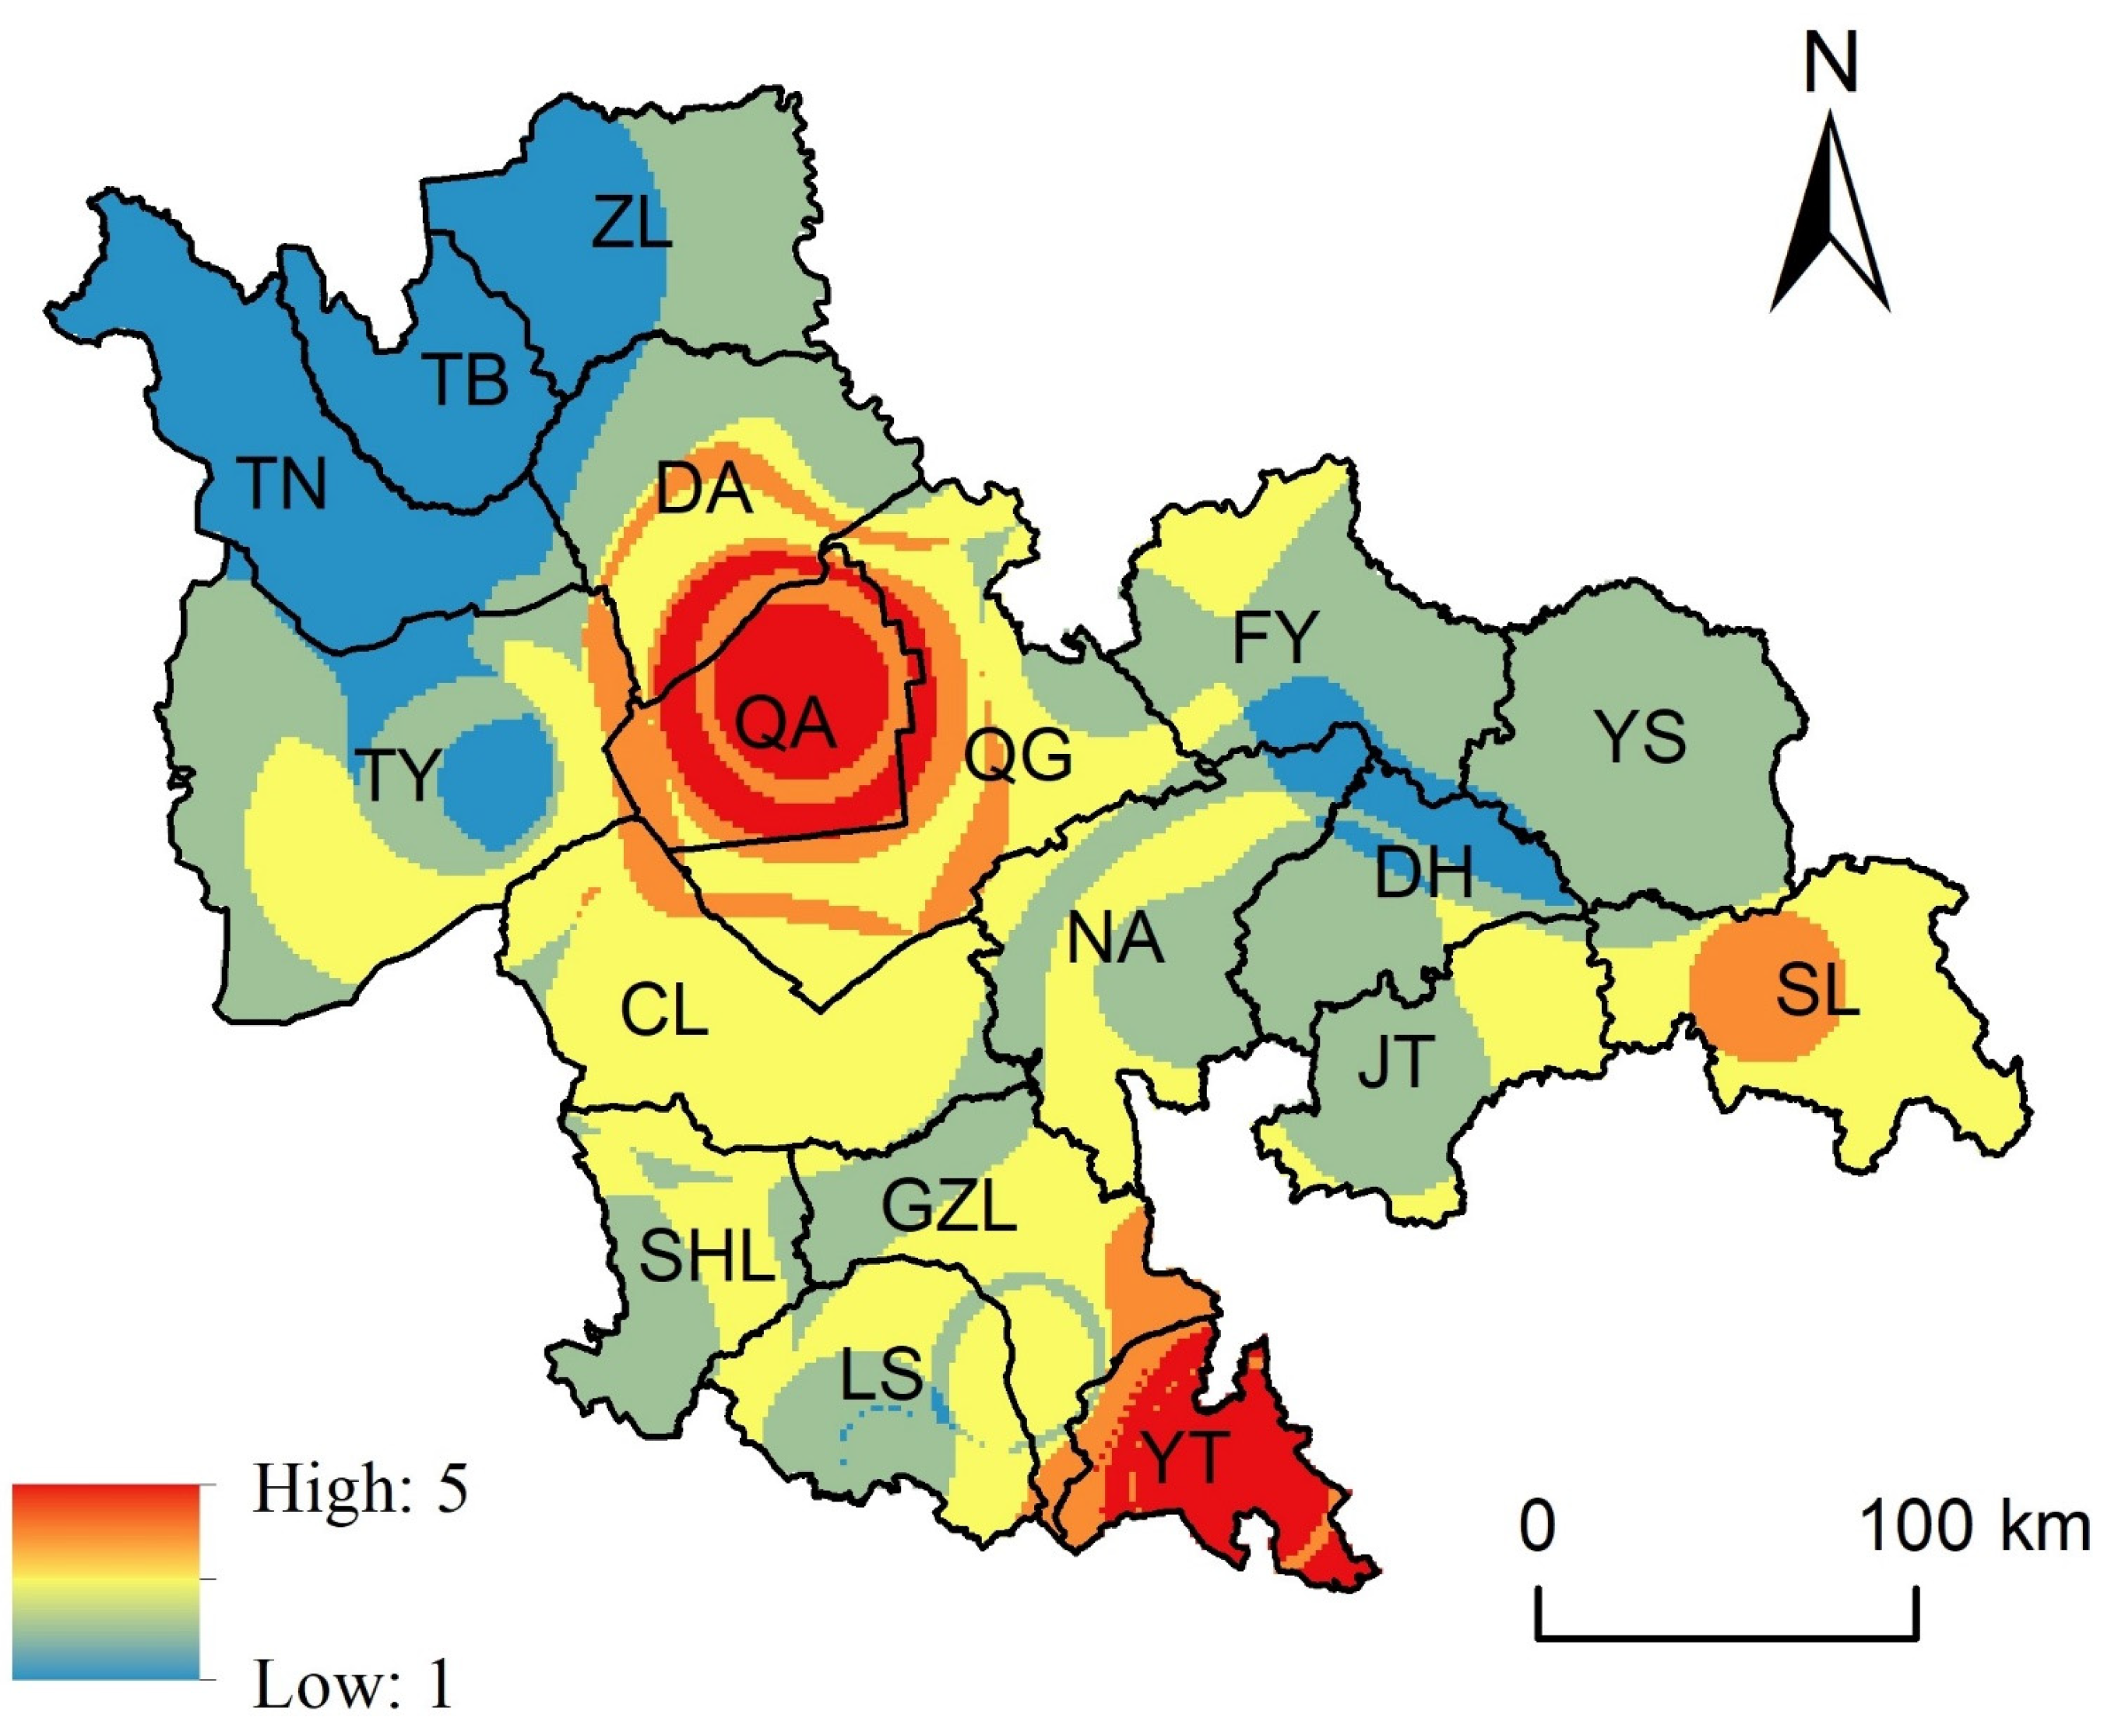
3.5. Integrated Risk Assessment of Agricultural Drought

Based on the above calculation results, the regional integrated drought risk is calculated according to Formula 1, including disaster-causing hazards, vulnerability of hazard-bearing bodies, sensitivity of disaster-pregnant environments, and stability of disaster mitigation capacity. The risk level results are reclassified according to the method of natural discontinuity points to obtain the integrated risk assessment results of the regional agricultural drought (Figure 13). The integrated risk level of drought in the main grain-producing areas of Jilin Province presents regional agglomeration, and the integrated risk level has a certain relationship with the regional geological structure unit. The high-risk level is concentrated in the central area of Song Liao Basin and near the geological structure of Yishu Graben, and the low risk level is concentrated in the marginal area of Song Liao Basin.
In particular, the four evaluation indices in Taonan, Taobei, and Zhenlai in the western half of the research area are all at the medium-low or below level, and the total drought risk in these three locations is primarily of low grade. The integrated risk of agricultural drought is medium-high or high-grade in Tongyu and Daan, in the eastern section of the western fault line tectonics and southwest uplift area, with considerable environmental sensitivity and limited integrated disaster mitigation ability in this area. The central arrondissement primarily consists of Qianan, Qianguo, and Changling. The overall agricultural drought integrated risk is medium and medium-low risk, with the Daan uplift tectonic unit being primarily medium-high and medium-risk areas, the Changling depression tectonic unit being primarily medium risk, and the Shuangtuozi uplift tectonic unit being primarily medium risk [35,36]. However, there are high-risk areas close to Changchun Bulge and Yishu Graben due to the sensitivity of agricultural disaster-inducing environments and the vulnerability of disaster-bearing bodies in this region [37], which is the focus of agricultural drought risk prevention. The integrated risk level of agricultural drought in the Southeast Uplift region is primarily low, and the integrated disaster mitigation capacity in this region is strong. In conclusion, Tongyu, Daan, and northeastern Jiutai have high levels of integrated agricultural risk, and drought has a significant impact on regional agricultural production, which is the focus of regional integrated agricultural risk prevention and should be prioritized in the ensuing drought risk warning, supply deployment, etc.

4. Suggestions on Sustainable Development of Regional Agriculture from the Perspective of Drought

Based on the results of integrated agricultural drought risk assessment, high-risk zones with grid-level refinement are identified. A regional integrated risk prevention model for agricultural drought is created after analyzing the shortcomings of high-risk areas (Figure 14). Four areas are addressed in the suggestions for sustainable agricultural development: monitoring and early warning, institutional framework, management model, and modernization.

4.1. Improving Disaster Risk Perception and Strengthening Drought Monitoring Systems

The cornerstones of drought mitigation are monitoring and early warning. Based on observed indicators, drought occurrence likelihood, timing, intensity, and other features are evaluated, and monitoring and early warning information on the onset and progression of drought is disseminated to the government and the general public through a variety of channels. One of the first nations to begin work on an integrated drought monitoring and early warning system was the United States. The United States created a national drought classification and monitoring system at the end of the 20th century. This system integrates numerous techniques, including geological surveys, artificial observations, remote sensors, and aerospace remote sensing [38,39]. It also regularly summarizes and analyzes meteorological data as well as monitoring data from various localities and other related agencies. Information on drought monitoring and warning will be made available as soon as possible. Considering this, it is imperative to complete the building of drought sub-centers, drought monitoring stations, soil moisture monitoring sites, as well as the installation of the drought monitoring system in the western dry zone of the research area. A full network system for monitoring, reporting, and summarizing drought information in the western drought zone should be established in order to understand the dynamics of drought occurrence and changes in the region in a timely way and to assess and anticipate the development trend. To better comprehend the development of vegetation and crops in the area and to provide timely and accurate information and decisions for the local government to take charge, make decisions, and organize drought relief, evaporation monitoring stations can be built, concentrating on drought-prone areas and areas with sparse station network density.

4.2. Formulating Drought Resistance System and Strengthening Whole Process Risk Management

The execution of command and decision-making by various management departments is based on the ideal drought resistance system. The National Drought Policy Act, which was passed by the United States in 1998, and the drought accident and emergency response plan, which was released by Australia in 2002, were just two examples of the developed nations that successively promulgated drought-resistant technical standards and regulations at the turn of the century. However, China’s mechanism for addressing drought was launched later. The National Flood Control and Drought Relief Emergency Plan, which was promulgated in 2005, marked the formal start of the system’s development in China. China’s existing flood control and drought technical standards are almost entirely formulated by government organizations, mainly involving the Ministry of Water Resources, the Ministry of Construction, and other departments. In the standards, there are relevant provisions of duplication and mutual reference phenomena [40,41]. At present, there are fewer laws and regulations in the study area, a lack of systematic basic research and extensive publicity and training, and the overall drought mitigation management system is not yet sound, and an effective drought protection mechanism has not yet been formed. Firstly, strengthening the reserve of drought equipment is the most practical and effective way to improve emergency drought resistance; secondly, we should improve the frequent and dangerous water conservancy projects to improve their water storage capacity, carry out the construction of farmland water conservancy infrastructure, and build more various drought emergency facilities according to local conditions; finally, we should vigorously develop the facilities of machine irrigation and electric irrigation to improve the ability to resist drought in agriculture. At the same time, the government should give farmers certain financial support and issue relevant drought facilities to farmers to improve the emergency drought prevention capacity.

4.3. Optimizing Integrated Management Model and Establishing Drought Risk Responsibility Mechanism

To achieve an optimized integrated management model requires promotion of regionally coordinated drought disaster risk reduction plans and setting up a network for exchanging information about drought disasters. According to the historical frequency of drought in each location, the National Integrated Drought Information System (NIDIS), developed in the U.S. in 2003, separates the drought level into five levels, ranging from low to high. The NIDIS publishes weekly data on the drought situation for the previous week, the severity of the present drought in each region, and the anticipated trends for the drought over the following week. Its customers include federal government agencies, stock and futures dealers, legislative representatives, and agricultural producers and business owners. The entire disaster management process, from pre-disaster planning to disaster response, post-disaster relief, and the cycle of recovery and reconstruction, integrates the resources of the entire society for disaster management, and an administrative organization for disaster risk management is formed from upper to lower levels to effectively coordinate the strengths of all facets of society, efficiently allocate limited resources, and vigorously pursue recovery and reconstruction [42]. To actualize an integrated system, insurance, relief, and services with the purpose of preventing and resolving drought risks before disasters and coping with drought risk consequences after disasters, a drought disaster network information sharing platform needs to be established. For regional drought and food security, improving the coherence of integrated drought disaster risk prevention is essential.

4.4. Improving the Modernization Level of Drought Resistance and Strengthening Drought Infrastructure Construction

Regional drought resistance is significantly influenced by the upgrading of drought-resistant infrastructure and level. The United States started water conservation projects earlier and compensated for the lack of surface water sources by creating reservoirs, transferring water between basins, and developing groundwater resources. such as the large-scale water conservation initiatives in the Midwest and the California North–South Water Diversion Project [43], in response to the lack of drought resistance in the study area. Firstly, we should carry out engineering construction, and build key water conservancy projects such as the introduction of Nen Jiang into Bai Cheng, the Hadashan Water Conservancy Project, Daan Irrigation District, and the water transfer of the central urban agglomeration, make full use of the rich surface water resources such as Songhua River and Nen River, realize the reallocation of water resources, increase the water supply of life and production, agriculture and ecology in the western region, and improve the drought and water shortage in the arid areas of the western region. Secondly, changing the cropping system and changing the cultivation method reasonably is one of the effective ways to overcome the continuous cropping obstacle. Because the natural precipitation in the western arid region cannot meet the water demand of crop growth, we try to explore the feasibility of adjusting the traditional cropping system in the western region from ‘one crop a year’ to ‘two crops a year’. Finally, the construction of water-saving projects such as channel anti-seepage, pipeline water conveyance, sprinkler irrigation, and drip irrigation should be done well. In key water-scarce cities, necessary backup water sources should be constructed. To ensure the introduction of water in drought years, alleviate the drought in the year, and maintain the local ecology and environment, key areas such as nature reserves and wetlands should undergo necessary engineering construction and certain backup water sources.

5. Conclusions

In order to evaluate the integrated agricultural drought risk in the primary grain-producing regions of Jilin Province, this article builds an integrated agricultural drought risk assessment model using drought hazards, vulnerability of disaster-bearing bodies, sensitivity of disaster-pregnant environments, and disaster mitigation capacity. In order to grow regional agriculture sustainably, guidelines for the geographical variation of drought risk in agriculture were obtained. The conclusions showed the following:
(1)
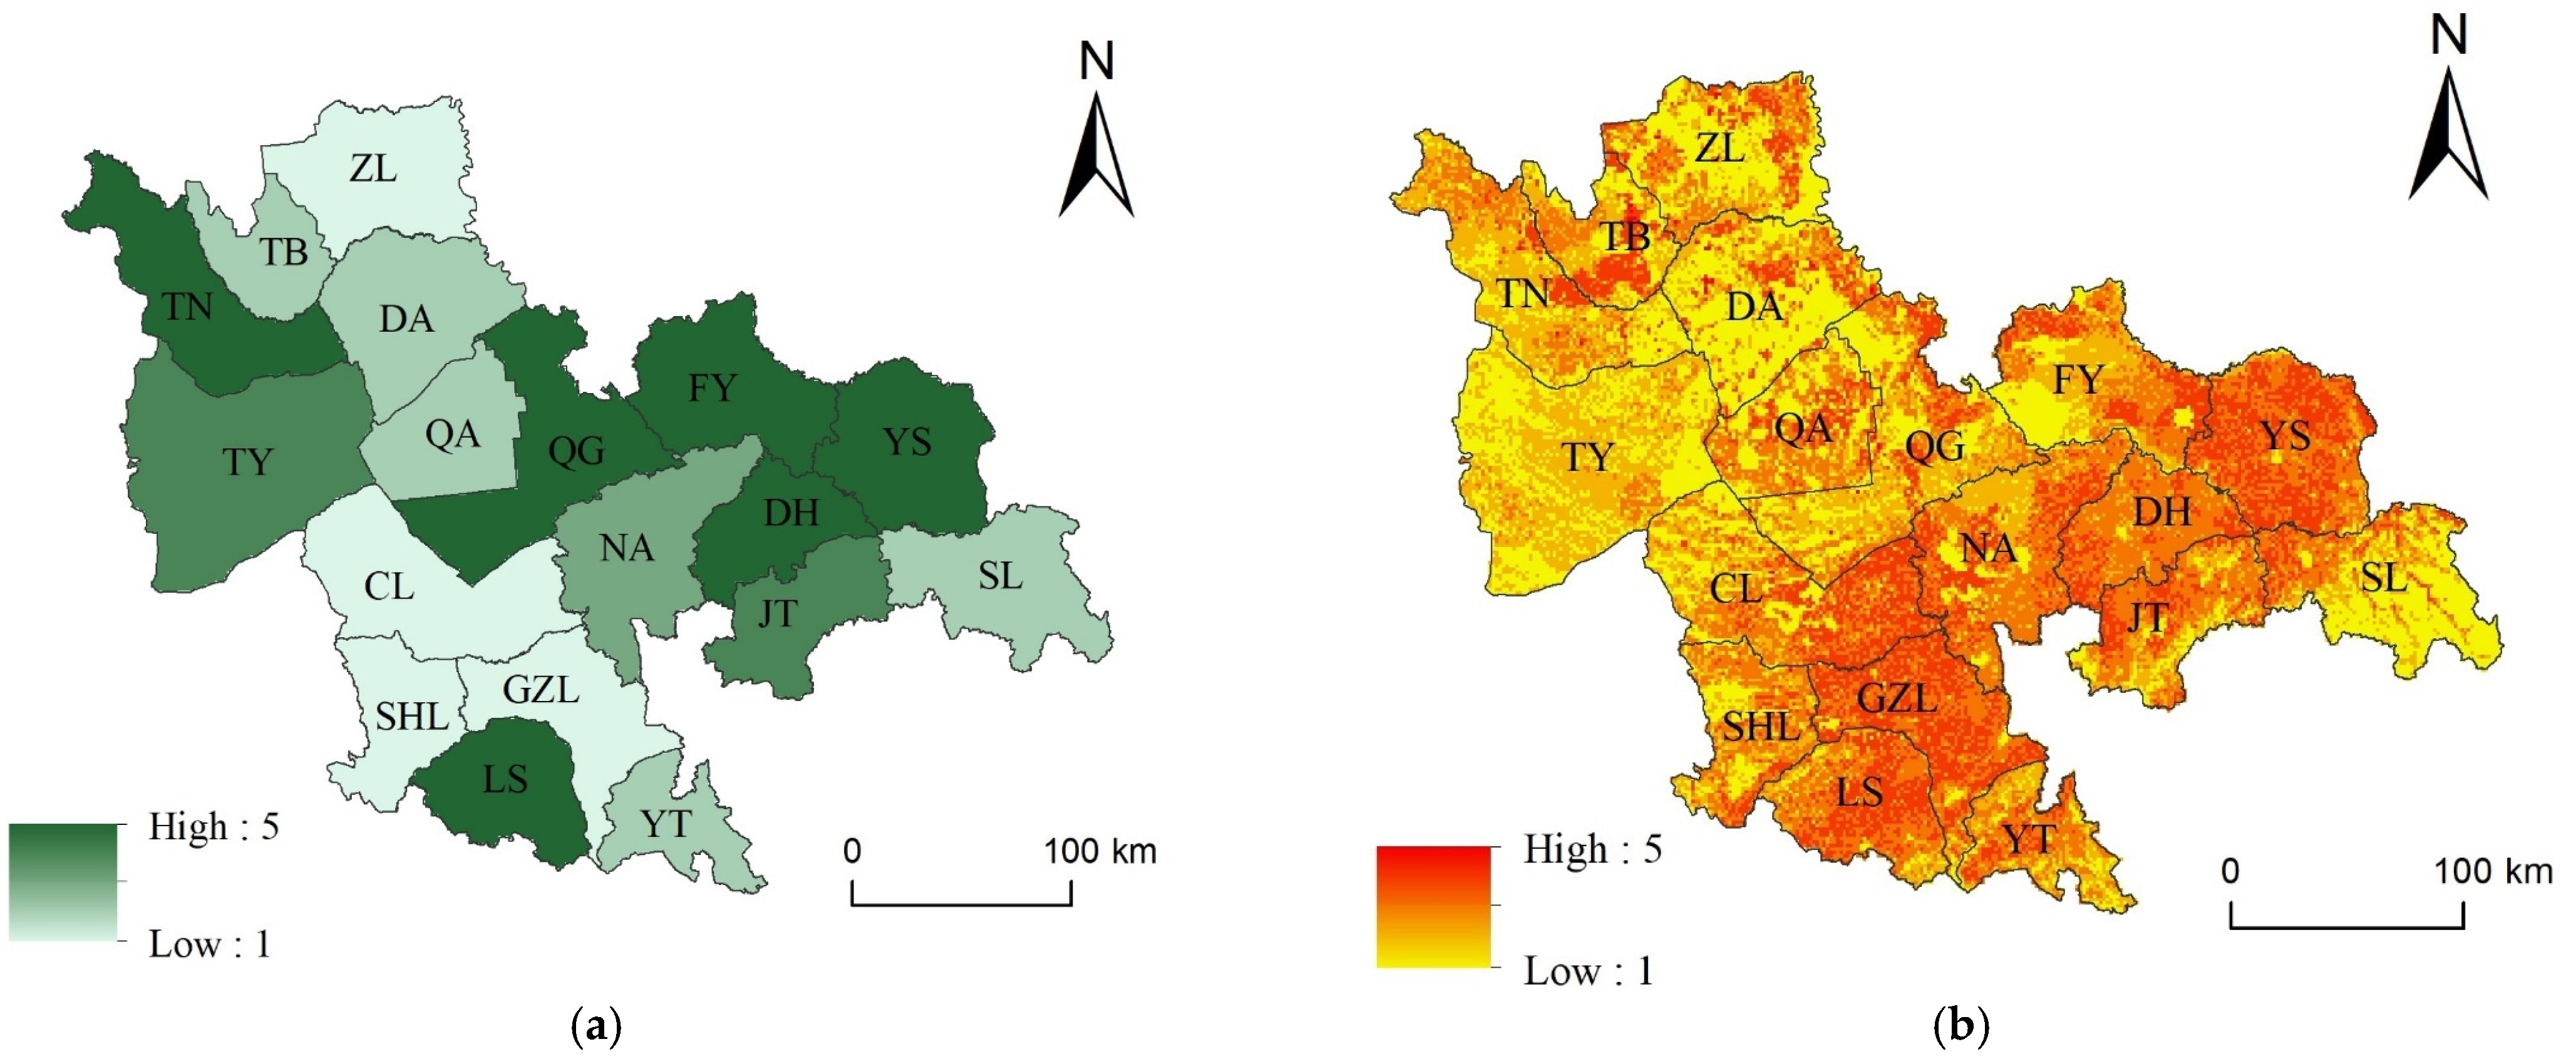
Over the previous 66 years, the study area has demonstrated a trend of slow transition from wet to dry to wet, with occasional severe droughts, and an overall declining trend at a rate of −0.089. (10a)−1. Except for Qianan, all other places showed significant characteristics, and the areas with high risk of regional drought hazards were mainly concentrated in Qianan and Yitong, with high frequencies and high intensities of drought. Yushu, Dehui, and Lishu are agricultural disaster-prone areas because of their high susceptibility, which is characterized by their high exposure and short repetition time of disaster occurrence. Drought damage losses are more severe than losses in other areas when calamities strike. The majority of Tongyu, the eastern portion of Qianguo, and the area close to the Yishu Graben were among the regions in the study area where 14.17% of the regional disaster-bearing environments were medium-high or highly sensitive, and where all the indicators of disaster-pregnant environments were at medium-level or above. All indicators in Yushu and Nongan are at a medium-level or above, indicating that the two areas have a high degree of capacity for integrated disaster mitigation. In terms of readiness, response, and relief for disasters, the western portion of the research area’s overall disaster reduction capability is typically inadequate and urgently requires development.
(2)
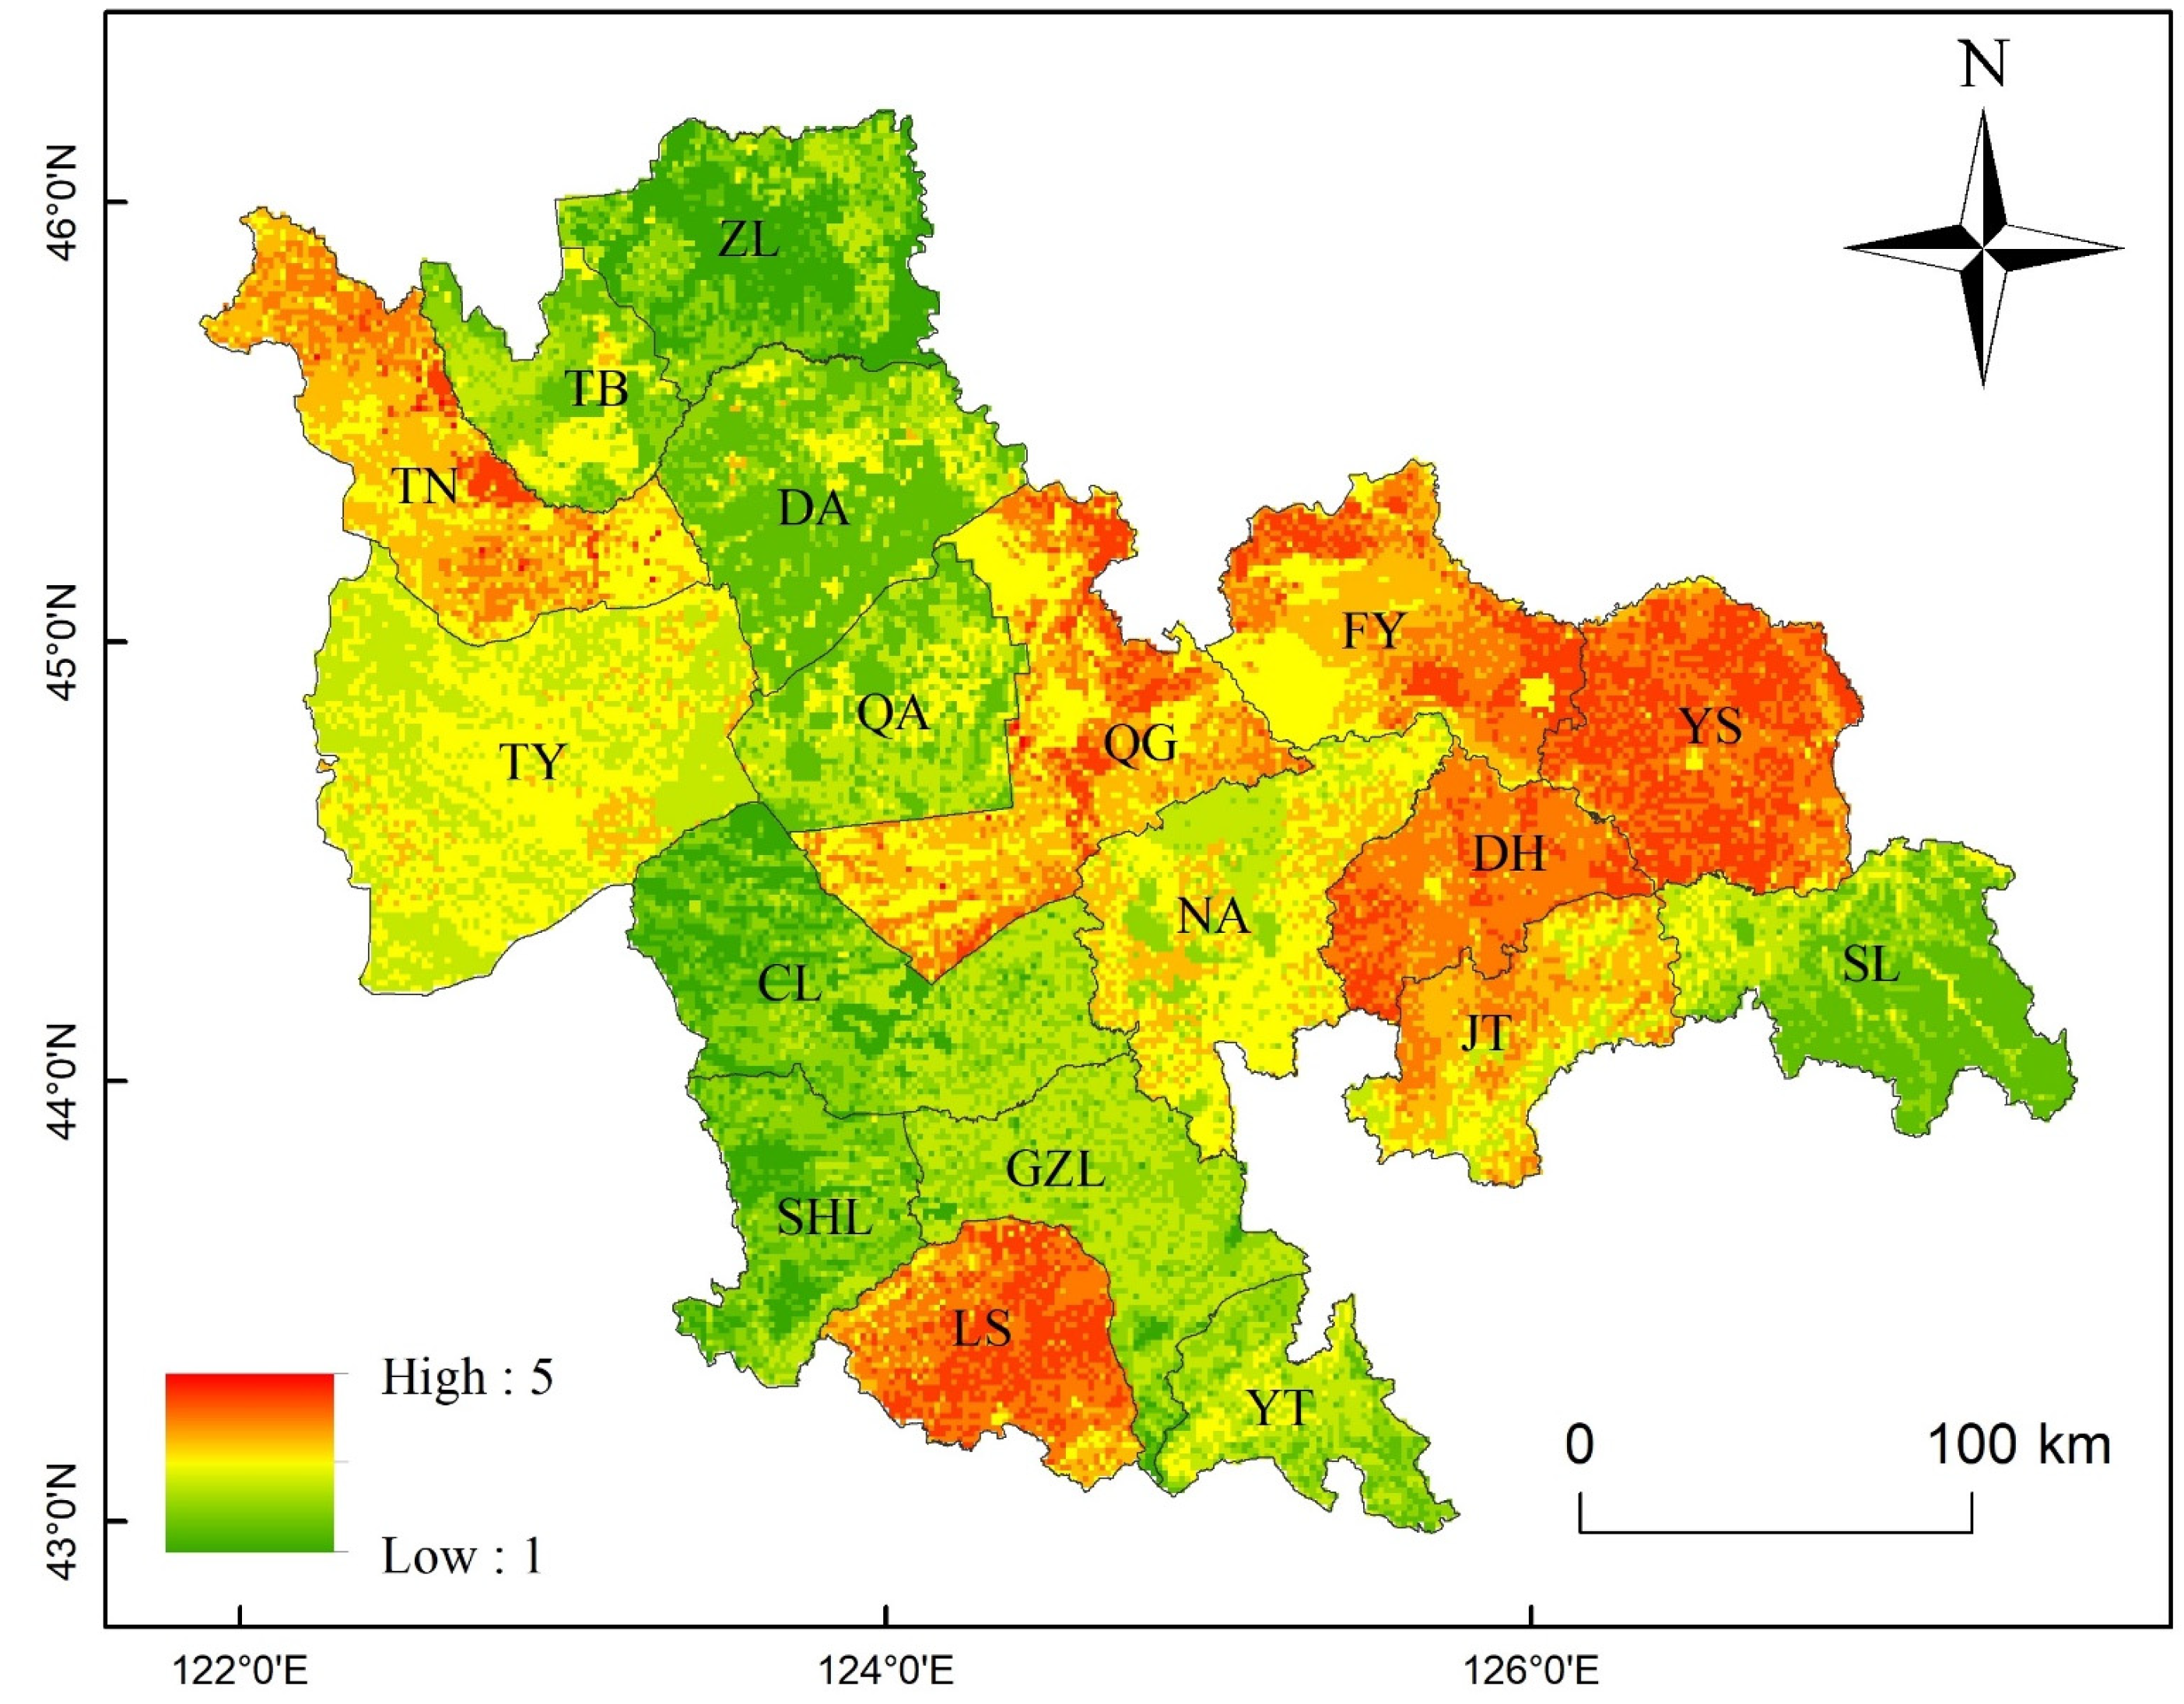
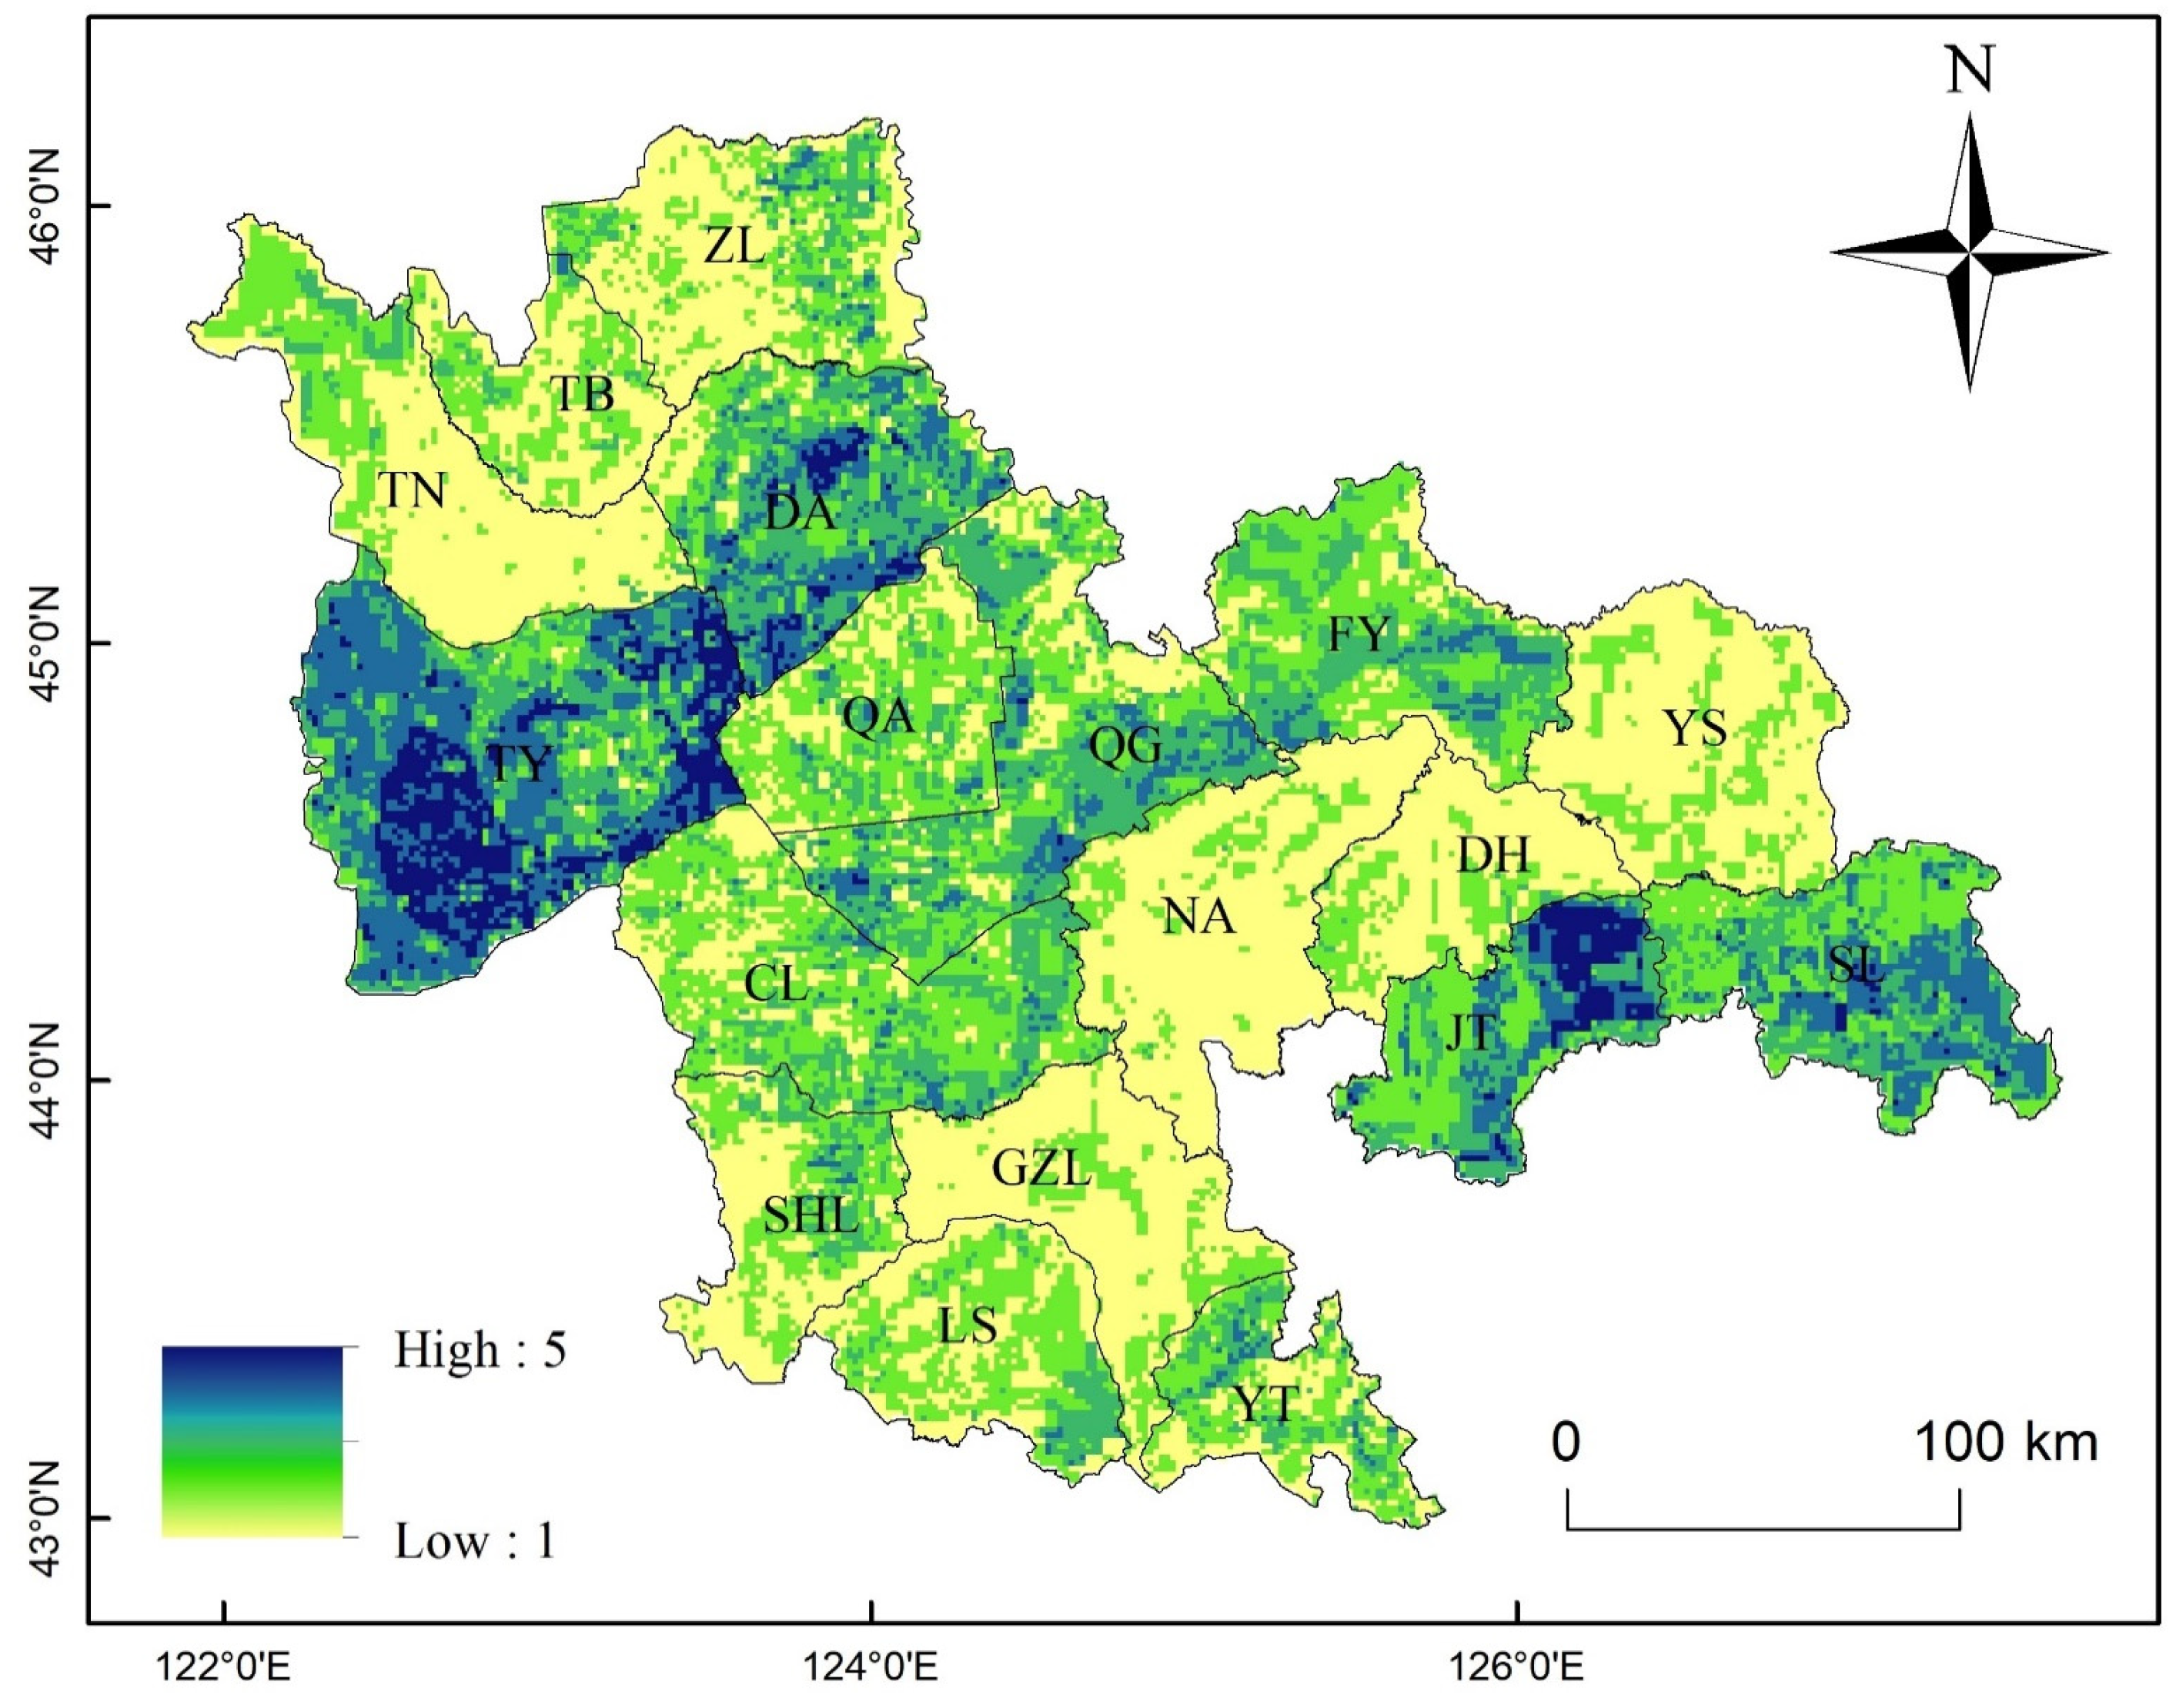
The integrated risk of drought in the primary grain-producing areas of Jilin Province exhibits regional clustering, and the overall risk level has some relationship spatially with the regional geological tectonic units, with the high-risk level concentrated in the central area of Song Liao Basin and close to the geological structure of Yishu Graben and the low risk level concentrated in the marginal area of Song Liao Basin. In Tongyu, Daan, and northeastern Jiutai, the integrated risk level of agricultural drought is high. Because drought has a significant impact on regional agricultural production, prevention of regional integrated agricultural risk should be a top priority, as should the subsequent drought risk warning and drought supply deployment.
(3)
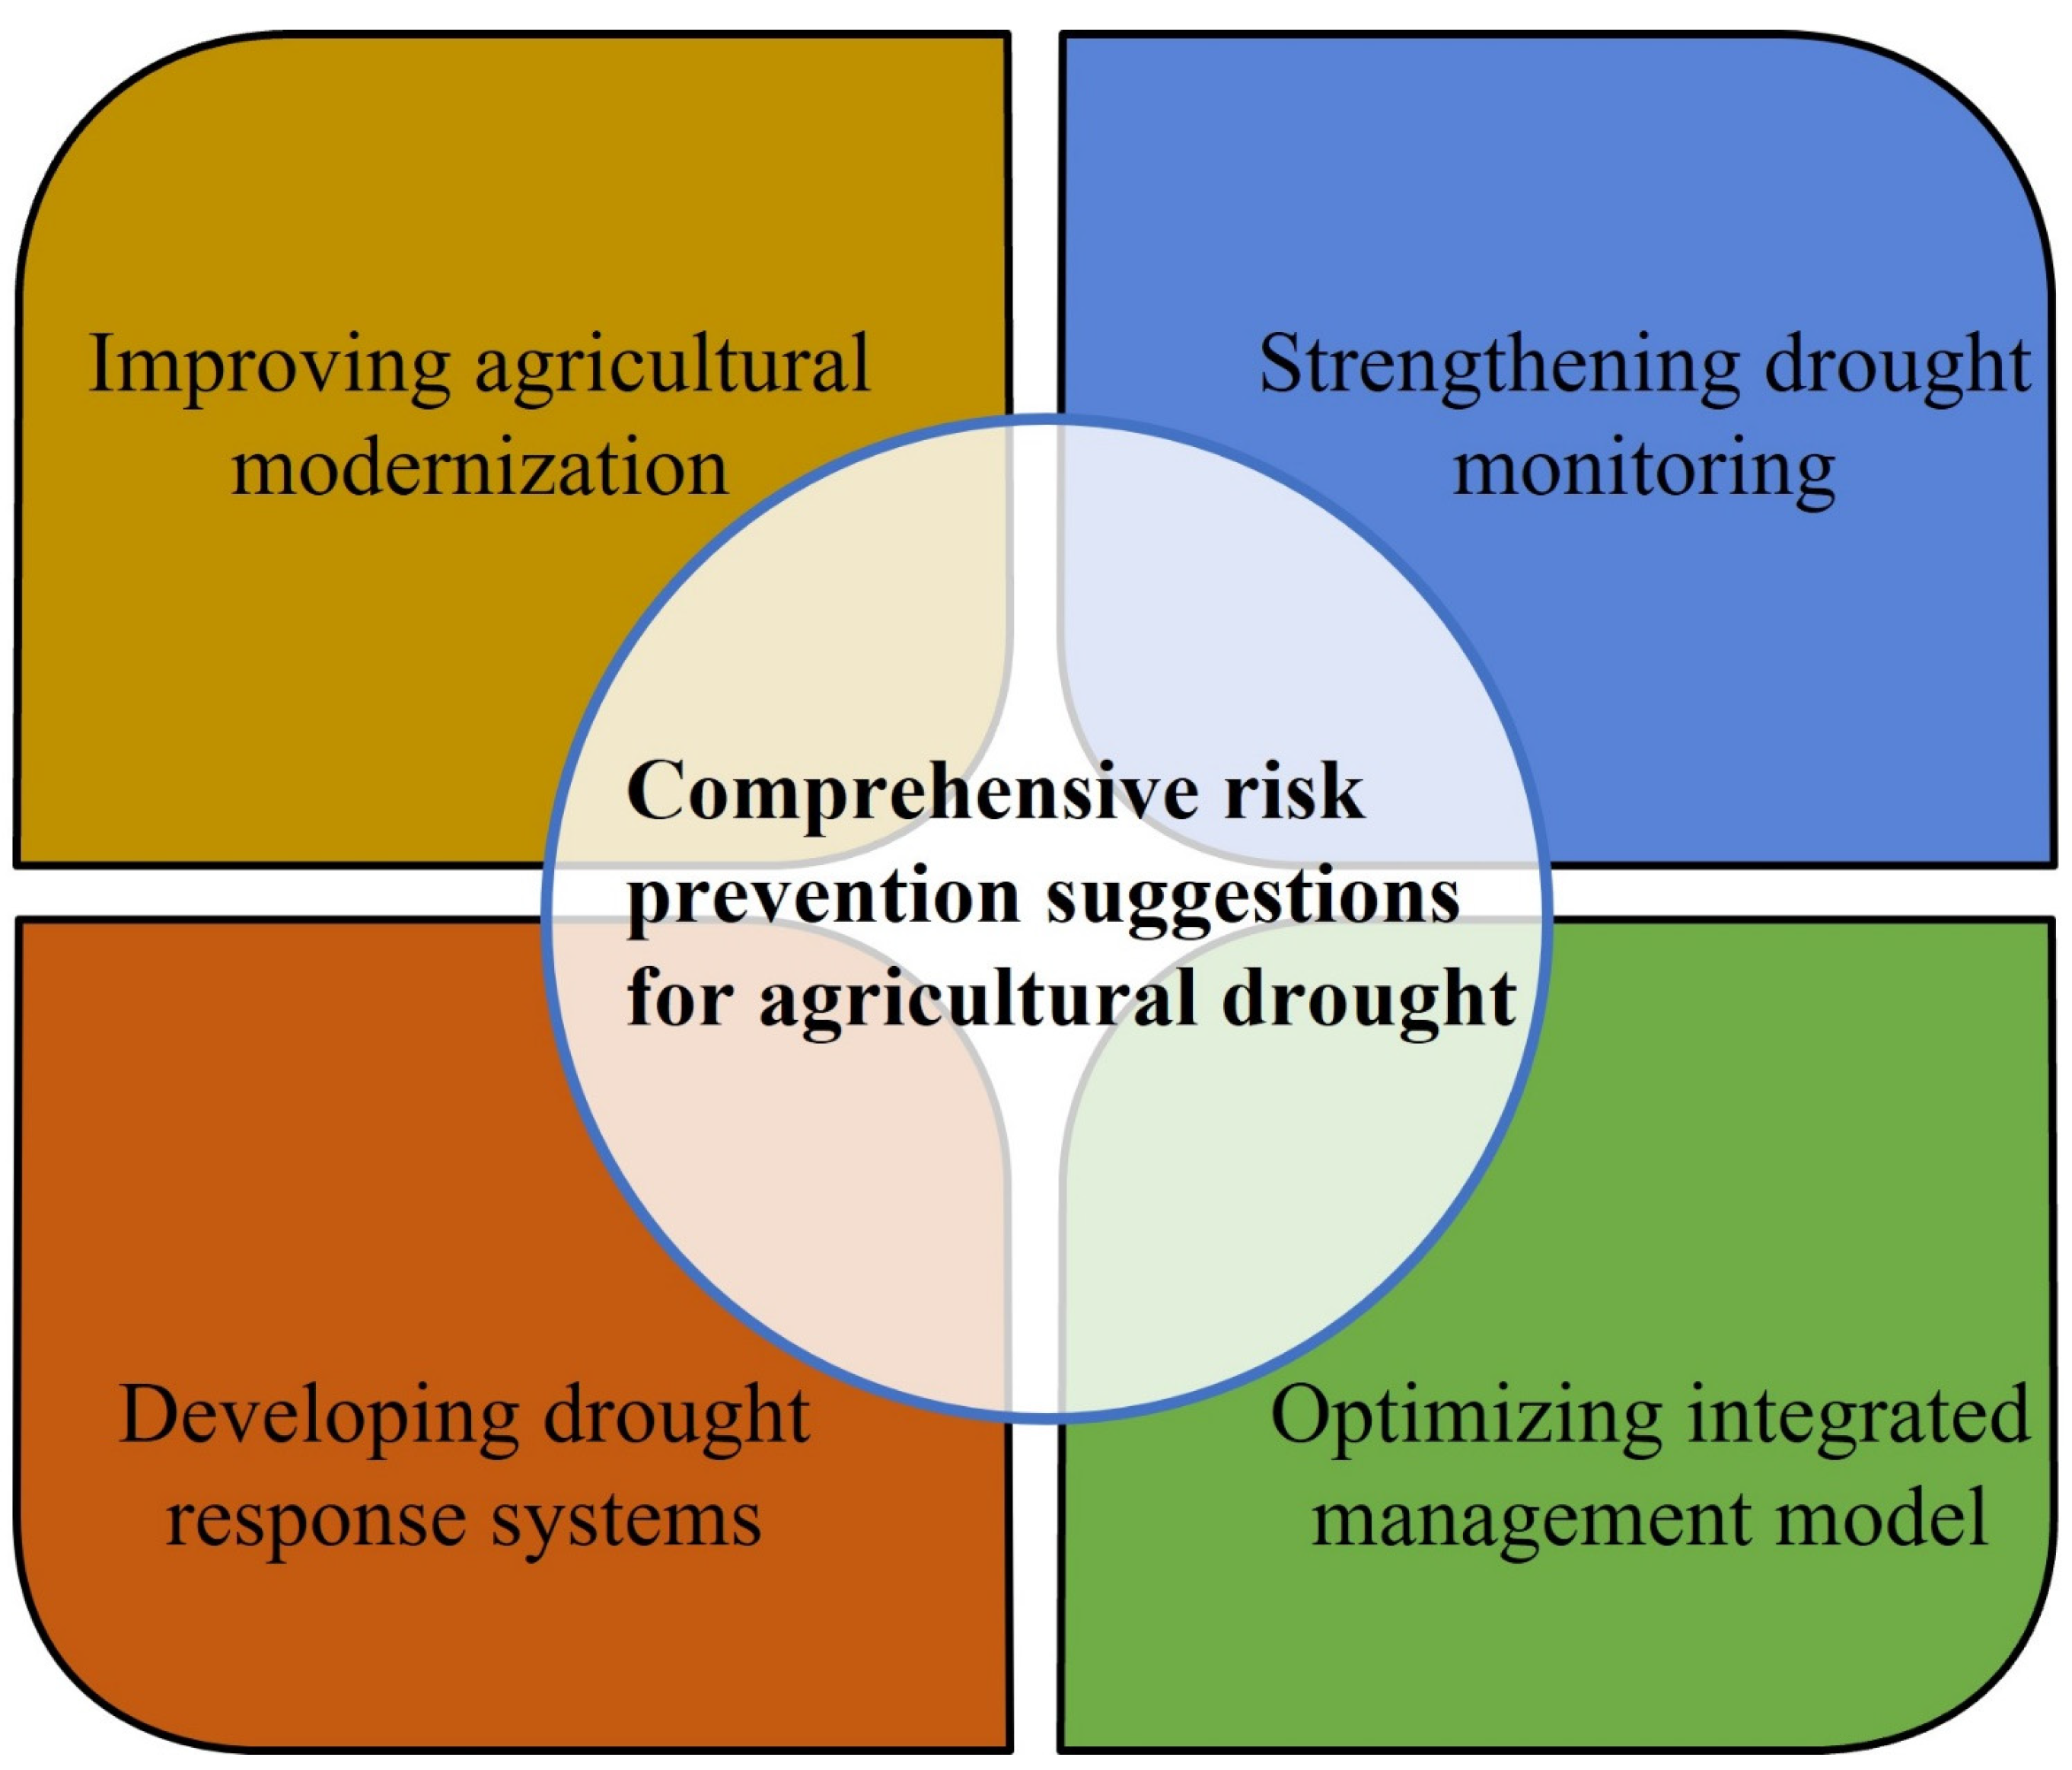
High-risk regions with grid-level refinement are selected based on the findings of the regional integrated agricultural drought risk assessment. In order to give more precise instructions to the relevant departments for the scientific formulation of drought mitigation policies and plans, a regional integrated agricultural drought risk prevention model is established, and suggestions for the sustainable development of regional agriculture are put forward in four aspects: monitoring and early warning, institutional systems, management model, and modernization construction.

Author Contributions

Conceptualization, formal analysis, and methodology, J.Z. and J.W.; investigation and resources, S.C., M.W., S.T. and W.Z.; writing—original draft preparation, J.Z.; writing—review and editing, J.W. All authors have read and agreed to the published version of the manuscript.

Funding

The authors gratefully acknowledge the support provided by National Key R&D Program of China (No.2021YFD1500104-4), National Natural Science Foundation of China (No.42171407, 42077242), Natural Science Foundation of Jilin Province (No.20210101098JC), and Natural disaster risk census project in Jilin Province (No.JLSZC202002826).

Data Availability Statement

Not applicable.

Acknowledgments

The authors thank the anonymous reviewers for providing such valuable comments.

Conflicts of Interest

The authors declare no conflict of interest.

References

  1. Jat, R.K.; Meena, V.S.; Kumar, M.; Jakkula, V.S.; Reddy, I.R.; Pandey, A.C. Direct Seeded Rice: Strategies to Improve Crop Resilience and Food Security under Adverse Climatic Conditions. Land 2022, 11, 382. [Google Scholar] [CrossRef]
  2. Tong, M.; Dai, E.; Wu, C. Hotspots of Yield Loss for Four Crops of the Belt and Road Terrestrial Countries under 1.5 °C Global Warming. Land 2022, 11, 163. [Google Scholar] [CrossRef]
  3. Naidoo, S. Commentary on the contribution of Working Group III to the Sixth Assessment Report of the Intergovernmental Panel on Climate Change. S. Afr. J. Sci. 2022, 118, 1–4. [Google Scholar] [CrossRef] [PubMed]
  4. Mukherjee, S.; Mishra, A.; Trenberth, K.E. Climate Change and Drought: A Perspective on Drought Indices. Curr. Clim. Change Rep. 2018, 4, 145–163. [Google Scholar] [CrossRef]
  5. Villani, L.; Castelli, G.; Piemontese, L.; Penna, D.; Bresci, E. Drought risk assessment in Mediterranean agricultural watersheds: A case study in Central Italy. Agric. Water Manag. 2022, 271, 107748. [Google Scholar] [CrossRef]
  6. Liu, Y.; You, M.; Zhu, J.; Wang, F.; Ran, R. Integrated risk assessment for agricultural drought and flood disasters based on entropy information diffusion theory in the middle and lower reaches of the Yangtze River, China. Int. J. Disaster Risk Reduct. 2019, 38, 101194. [Google Scholar] [CrossRef]
  7. Zou, T.; Chang, Y.; Chen, P.; Liu, J. Spatial-temporal variations of ecological vulnerability in Jilin Province (China), 2000 to 2018. Ecol. Indic. 2021, 133, 108429. [Google Scholar] [CrossRef]
  8. Li, X.; Li, Y.; Wang, B.; Sun, Y.; Cui, G.; Liang, Z. Analysis of spatial-temporal variation of the saline-sodic soil in the west of Jilin Province from 1989 to 2019 and influencing factors. Catena 2022, 217, 106492. [Google Scholar] [CrossRef]
  9. Zhang, J.; Wang, J.; Chen, S.; Tang, S.; Zhao, W. Multi-Hazard Meteorological Disaster Risk Assessment for Agriculture Based on Historical Disaster Data in Jilin Province, China. Sustainability 2022, 14, 7482. [Google Scholar] [CrossRef]
  10. Li, Q.; Willardson, L.S.; Deng, W.; Li, X.; Liu, C. Crop water deficit estimation and irrigation scheduling in western Jilin province, Northeast China. Agric. Water Manag. 2005, 71, 47–60. [Google Scholar] [CrossRef]
  11. Ma, Y.; Guga, S.; Xu, J.; Liu, X.; Tong, Z.; Zhang, J. Evaluation of Drought Vulnerability of Maize and Influencing Factors in Songliao Plain Based on the SE-DEA-Tobit Model. Remote Sens. 2022, 14, 3711. [Google Scholar] [CrossRef]
  12. Ma, Y.; Zhang, J.; Zhao, C.; Li, K.; Dong, S.; Liu, X.; Tong, Z. Spatiotemporal Variation of Water Supply and Demand Balance under Drought Risk and Its Relationship with Maize Yield: A Case Study in Midwestern Jilin Province, China. Water 2021, 13, 2490. [Google Scholar] [CrossRef]
  13. Wu, J.; Xing, Y.; Bai, Y.; Hu, X.; Yuan, S. Risk assessment of large-scale winter sports sites in the context of a natural disaster. J. Saf. Sci. Resil. 2022, 3, 263–276. [Google Scholar] [CrossRef]
  14. Jia, J.; Ha, L.; Liu, Y.; He, N.; Zhang, Q.; Wan, X.; Zhang, Y.; Hu, J. Drought risk analysis of maize under climate change based on natural disaster system theory in Southwest China. Acta Ecol. Sin. 2016, 36, 340–349. [Google Scholar] [CrossRef]
  15. Cui, P.; Peng, J.; Shi, P.; Tang, H.; Ouyang, C.; Zou, Q.; Liu, L.; Li, C.; Lei, Y. Scientific challenges of research on natural hazards and disaster risk. Geogr. Sustain. 2021, 2, 216–223. [Google Scholar] [CrossRef]
  16. Zarghami, S.A.; Dumrak, J. A system dynamics model for social vulnerability to natural disasters: Disaster risk assessment of an Australian city. Int. J. Disaster Risk Reduct. 2021, 60, 102258. [Google Scholar] [CrossRef]
  17. Laimighofer, J.; Laaha, G. How standard are standardized drought indices? Uncertainty components for the SPI & SPEI case. J. Hydrol. 2022, 613, 128385. [Google Scholar] [CrossRef]
  18. Ghasemi, P.; Karbasi, M.; Nouri, A.Z.; Tabrizi, M.S.; Azamathulla, H.M. Application of Gaussian process regression to forecast multi-step ahead SPEI drought index. Alex. Eng. J. 2021, 60, 5375–5392. [Google Scholar] [CrossRef]
  19. Muse, S.K.; Nyaga, J.M.; Dubow, A.Z. SPEI-based spatial and temporal evaluation of drought in Somalia. J. Arid. Environ. 2021, 184, 104296. [Google Scholar] [CrossRef]
  20. Roy, L.; Das, S. GIS-based landform and LULC classifications in the Sub-Himalayan Kaljani Basin: Special reference to 2016 Flood. Egypt. J. Remote Sens. Space Sci. 2021, 24, 755–767. [Google Scholar] [CrossRef]
  21. Mieza, M.S.; Cravero, W.R.; Kovac, F.D.; Bargiano, P.G. Delineation of site-specific management units for operational applications using the topographic position index in La Pampa, Argentina. Comput. Electron. Agric. 2016, 127, 158–167. [Google Scholar] [CrossRef] [Green Version]
  22. Jeroen, D.R.; Jean, B.; Machteld, B.; Ann, Z.; Vanessa, G.; Philippe, D.S.; Wei, C.; Marc, A.; Philippe, D.M.; Peter, F.; et al. Application of the topographic position index to heterogeneous landscapes. Geomorphology 2013, 186, 39–49. [Google Scholar] [CrossRef]
  23. Wei, Y.; Wang, W.; Tang, X.; Li, H.; Hu, H.; Wang, X. Classification of Alpine Grasslands in Cold and High Altitudes Based on Multispectral Landsat-8 Images: A Case Study in Sanjiangyuan National Park, China. Remote Sens. 2022, 14, 3714. [Google Scholar] [CrossRef]
  24. Atefi, M.R.; Miura, H. Detection of Flash Flood Inundated Areas Using Relative Difference in NDVI from Sentinel-2 Images: A Case Study of the August 2020 Event in Charikar, Afghanistan. Remote Sens. 2022, 14, 3647. [Google Scholar] [CrossRef]
  25. Du, X.; Li, X.; Zhang, S.; Zhao, T.; Hou, Q.; Jin, X.; Zhang, J. High-accuracy estimation method of typhoon storm surge disaster loss under small sample conditions by information diffusion model coupled with machine learning models. Int. J. Disaster Risk Reduct. 2022, 82, 103307. [Google Scholar] [CrossRef]
  26. Zhang, M.; Qin, S.; Zhu, X. Information diffusion under public crisis in BA scale-free network based on SEIR model—Taking COVID-19 as an example. Phys. A Stat. Mech. Its Appl. 2021, 571, 125848. [Google Scholar] [CrossRef]
  27. Boardman, A.; Vertinsky, I.; Whistler, D. Using information diffusion models to estimate the impacts of regulatory events on publicly traded firms. J. Public Econ. 1997, 63, 283–300. [Google Scholar] [CrossRef]
  28. Kisi, O.; Ay, M. Comparison of Mann–Kendall and innovative trend method for water quality parameters of the Kizilirmak River, Turkey. J. Hydrol. 2014, 513, 362–375. [Google Scholar] [CrossRef]
  29. Milan, G.; Slavisa, T. Analysis of changes in meteorological variables using Mann-Kendall and Sen’s slope estimator statistical tests in Serbia. Glob. Planet. Change 2013, 100, 172–182. [Google Scholar] [CrossRef]
  30. Khaled, H.H. Trend detection in hydrologic data: The Mann–Kendall trend test under the scaling hypothesis. J. Hydrol. 2008, 349, 350–363. [Google Scholar] [CrossRef]
  31. Zhou, H.; Qu, H. Drought and drought resistance work in Jilin Province in 2014. China Flood Drought Manag. 2014, 5, 14–16. [Google Scholar] [CrossRef]
  32. Wu, D.; Zhang, B.; Chen, P. Community Composition and Structure of Soil Macro-Arthropods Under Agricultural Land Uses in the Black Soil Region of Jilin Province, China. Agric. Sci. China 2006, 5, 451–455. [Google Scholar] [CrossRef]
  33. Li, X.; Wang, D.; Ren, Y.; Wang, Z.; Zhou, Y. Soil quality assessment of croplands in the black soil zone of Jilin Province, China: Establishing a minimum data set model. Ecol. Indic. 2019, 107, 105251. [Google Scholar] [CrossRef]
  34. Maryann, E.H.; Patrick, R.S.; Amy, G.V.; Asa, L.F. Assessing the impact of standards-based grading policy changes on student performance and practice work completion in secondary mathematics. Stud. Educ. Eval. 2022, 75, 101211. [Google Scholar] [CrossRef]
  35. Zhu, C.Y.; Gao, R.; Zhao, G. Permian to Cretaceous tectonic evolution of the Jiamusi and Songliao blocks in NE China: Transition from the closure of the Paleo-Asian Ocean to the subduction of the Paleo-Pacific Ocean. Gondwana Res. 2022, 103, 371–388. [Google Scholar] [CrossRef]
  36. Ma, Y.; Liu, Y.; Peskov, A.Y.; Wang, Y.; Song, W.; Zhang, Y.; Qian, C.; Liu, T. Paleozoic tectonic evolution of the eastern Central Asian Orogenic Belt in NE China. China Geol. 2022, 5, 555–578. [Google Scholar] [CrossRef]
  37. Derrick, H.; Jacqueline, A.H.; Alan, S.C.; Martin, H.; Corné, K.; Matthew, G.G.; Stijn, G. New Maps of Global Geological Provinces and Tectonic Plates. Earth-Sci. Rev. 2022, 231, 104069. [Google Scholar] [CrossRef]
  38. Hanen, B.; Ben Abbes, A.; Nedra, M.; Imed Riadh, F.; Yanfang, S.; Myriam, L. A review of drought monitoring with big data: Issues, methods, challenges and research directions. Ecol. Inform. 2020, 60, 101136. [Google Scholar] [CrossRef]
  39. Hao, Z.; Xia, Y.; Luo, L.; Singh, V.P.; Ouyang, W.; Hao, F. Toward a categorical drought prediction system based on U.S. Drought Monitor (USDM) and climate forecast. J. Hydrol. 2017, 551, 300–305. [Google Scholar] [CrossRef]
  40. Lv, Y.; He, H.; Ren, X.; Zhang, L.; Qin, K.; Wu, X.; Niu, Z.; Feng, L.; Xu, Q.; Zhang, M. High resistance of deciduous forests and high recovery rate of evergreen forests under moderate droughts in China. Ecol. Indic. 2022, 144, 109469. [Google Scholar] [CrossRef]
  41. Wang, D.; Yue, D.; Zhou, Y.; Huo, F.; Bao, Q.; Li, K. Drought Resistance of Vegetation and Its Change Characteristics before and after the Implementation of the Grain for Green Program on the Loess Plateau, China. Remote Sens. 2022, 14, 5142. [Google Scholar] [CrossRef]
  42. Ford, T.W.; Labosier, C.F. Meteorological conditions associated with the onset of flash drought in the Eastern United States. Agric. For. Meteorol. 2017, 247, 414–423. [Google Scholar] [CrossRef]
  43. Williams, J.D.; Long, D.S.; Reardon, C.L. Productivity and water use efficiency of intensified dryland cropping systems under low precipitation in Pacific Northwest, USA. Field Crops Res. 2020, 254, 107787. [Google Scholar] [CrossRef]
Figure 1. Research area map.
Land 12 00160 g001
Figure 2. Research flowchart.
Land 12 00160 g002
Figure 3. Characteristics of interannual variation of SPEI−12 in study area from 1955 to 2020.
Land 12 00160 g003
Figure 4. Seasonal trends of SPEI−3 index in study area from 1955–2020: (a) spring; (b) summer.
Land 12 00160 g004
Figure 5. Drought hazard level of the study area.
Land 12 00160 g005
Figure 6. Drought probability density under different disaster index.
Land 12 00160 g006
Figure 7. Drought exceedance probability density under different disaster index.
Land 12 00160 g007
Figure 8. Distribution of different disaster-bearing bodies factor: (a) distribution of agricultural drought disaster recurrence levels; (b) distribution of exposure levels of agriculture.
Land 12 00160 g008
Figure 9. Distribution of vulnerability levels of agricultural disaster-bearing bodies.
Land 12 00160 g009
Figure 10. Distribution of different disaster-pregnant environmental factors: (a) distribution of topographic position index (TPI) levels; (b) distribution of vegetation cover levels; (c) distribution of soil types levels; (d) distribution of river density levels.
Land 12 00160 g010aLand 12 00160 g010b
Figure 11. Distribution of agricultural disaster-pregnant environment integrated index.
Land 12 00160 g011
Figure 12. Various disaster mitigation capabilities in study area: (a) distribution of emergency management capacity levels; (b) distribution of resource security capacity levels; (c) distribution of agricultural modernization levels; (d) distribution of integrated disaster reduction capacity levels.
Land 12 00160 g012
Figure 13. Integrated risk level of agricultural drought.
Land 12 00160 g013
Figure 14. Integrated risk prevention model for agricultural drought.
Land 12 00160 g014
Table 1. Overview of the situation in each region.
Region NameAbbreviationGrain Production in 2020
(Million Tons)
Region Area
(Million Hectares)
Sown Area in 2020
(Million Hectares)
NonganNA305.00465442.6
FuyuFY30046.5833.3771
YushuYS296.57456647.2238.0681
GongzhulingGZL250.362340.2731.3891
LishuLS20042.0926.4963
QianguoQG194.48497032.2881
ChanglingCL173.6892657.28433.1743
DehuiDH142.2534.3520.2009
TongyuTY138.184.7628.0806
ShuangliaoSHL120.3531.21218.9896
JiutaiJT119.750828.7519.4158
TaonanTN116.1519651.0321.9038
ZhenlaiZL116.0504347.3717.4508046
QiananQA110.100236.16616.2898
YitongYT104.192225.2312.5333
TaobeiTB100.5675525.2514.98984
ShulanSL96.00345.570513.7887
DaanDA86.589748.7915.3928
Table 2. Regional agricultural drought mitigation capacity indicator system.
First-Level IndicatorsSecondary IndicatorsSecondary Indicator ExplanationData Source
Emergency management capacityNumber of expert managersNumber of technical experts and managersSurvey Data *
Disaster reduction funding inputProportion of investment in disaster reduction to GDP
Number of emergency plansNumber of Regional Emergency Management Plans
Resources supporting capacityEnergy conservation expenses ratioExpenditure on energy conservation, forest protection, pollution reduction to forests, renewable energy, and natural ecological protectionStatistical Yearbooks *
Agriculture affairs expenses ratioExpenditure on livestock, farm machinery, etc.
Regional GDPRegional GDP in 2020
Rural population ratioProportion of rural population in regional population
Agricultural modernization levelTotal power of agricultural machineryThe total power of each power machine used in agriculture, forestry, and animal husbandryStatistical Yearbooks *
Large and medium machinery farm toolsNumber of agricultural machines
Effective irrigation areaThe sum of the area of paddy and watered land capable of normal irrigation
Fertilizer load per unit areaProportion of Chemical Fertilizer Application in Cultivated Land
* Questionnaire source (https://www.doc88.com/p-64087194059392.html/, accessed on 20 May 2022); Statistical yearbook source (http://tjj.jl.gov.cn/tjsj/tjnj/, accessed on 24 November 2022).
Table 3. Drought frequency at monthly scale (SPEI-1) in the study area.
Drought TypeSPEI ValueFrequencyDrought Hazard Grade
No droughtSPEI > −0.566.08%1
Light drought−1.0 < SPEI ≤ −0.519.63%2
Medium drought−1.5 < SPEI ≤ −1.010.33%3
Heavy drought−2.0 < SPEI ≤ −1.52.85%4
Severe droughtSPEI ≤ −2.01.12%5
Table 4. Drought resistance of soil type in study area.
Drought ResistanceSoil TypeGrade Value
StrongBlack soil, black calcium soil, meadow soil5
StrongerAlluvial soils, whitish soil, paddy soil4
MediumDark brown soil, sandy soil, chestnut soil3
WeakerBrown soil2
WeakAlkaline soil, limestone soil, swamp soil, peat soil, salt soil1
Table 5. Mean-standard deviation method of classification.
ScopeGradeGrade Value
[μ + 1.5 σ, 1]Strong5
[μ + 0.5 σ, μ + 1.5 σ]Stronger4
[μ − 0.5 σ, μ + 0.5 σ]Medium3
[μ − 1.5 σ, μ − 0.5 σ]Weaker2
[0, μ − 1.5 σ]Weak1
μ represents the mean, σ represents the standard deviation.
Disclaimer/Publisher’s Note: The statements, opinions and data contained in all publications are solely those of the individual author(s) and contributor(s) and not of MDPI and/or the editor(s). MDPI and/or the editor(s) disclaim responsibility for any injury to people or property resulting from any ideas, methods, instructions or products referred to in the content.

