Article

Land Use Transition and Its Ecosystem Resilience Response in China during 1990–2020

1
College of Economics and Management, Changsha University, Changsha 410022, China
2
School of Geographic Sciences, Hunan Normal University, Changsha 410081, China
3
School of Public Administration, Guangxi University, Nanning 530004, China
4
Institute of Geographic Sciences and Natural Resources Research, Chinese Academy of Sciences, Beijing 100101, China
5
College of Geography and Tourism, Hengyang Normal University, Hengyang 421002, China
*
Author to whom correspondence should be addressed.
Land 2023, 12(1), 141; https://doi.org/10.3390/land12010141
Submission received: 2 December 2022 / Revised: 28 December 2022 / Accepted: 29 December 2022 / Published: 31 December 2022
(This article belongs to the Collection Land Use Transitions and Land System Science)

Abstract

:
Land use transition and its eco-environmental effects are important research topics. Its essence is the process that human activities exert interference to the ecological environment in the process of social and economic development, and the ecosystem resists interference and recovers and adapts to interference. The article starts from the transition of land use dominant morphology and takes ecological resilience as the breakthrough point. Based on four periods of land use data, this article studied the spatio-temporal evolution of land use and ecological resilience and the response of ecological resilience to land use transition in China from 1990 to 2020. The results showed as follows: (1) During the study period, the construction land in China continued to increase, and the forest land, grassland, and farmland showed a fluctuating trend. (2) The spatial distribution pattern of ecological resilience showed the characteristics of “high in the southeast and low in the northwest”. The mean value and total value of ecological resilience in the region decreased first and then increased, taking 2010 as the dividing line. The difference in ecological resilience increased first and then decreased. (3) Ecological land and construction land are the main types of land that affect the changes in ecological resilience. The higher the proportion of ecological lands such as forest land, grassland, and waters, the smaller the variable coefficient of ecological resilience. The higher the proportion of construction land, the greater the difference in ecosystem elasticity among different types of areas.

1. Introduction

Achieving sustainable environmental management and improving the living conditions of human beings is the long-term goal of global environmental protection, and it is also an inevitable choice in the current economic construction and environmental protection situation. Especially since the 21st century, the rapid urbanization process has brought about a series of resource and environmental problems, such as the growth of the urban population, the rapid spread of industrial pollution, and the deterioration of the ecological environment, which have made the ecological environment under unprecedented pressure and challenge [1,2]. About 23% of the expansion of human activity between 2000 and 2020 occur at high elevations in Asia, resulting in soil erosion, landscape fragmentation, and potential effects on biodiversity loss, degradation of ecosystem services, and global warming [3,4]. Unsustainable, high-pollution and high-emission agricultural production modes have pushed the productive capacity of the land to its limits. This has caused serious degradation of land and environmental services and gradually sharpened the contradiction between the carrying capacity of the ecological environment and the sustainable development goals [5]. Thereby, the United Nations has taken a series of measures to restructure, rebuild and reshape the ecosystem. For example, the United Nations Office for Disaster Risk Reduction (UNDRR) pointed out in its report in March 2013 that “Resilience cities” should be built around the world to cope with natural disasters. In 2021, the United Nations Environment Programme (UNEP) and the Food and Agriculture Organization of the United Nations (FAO) launched the “Decade of Ecosystem Restoration (2021–2030)”, which is committed to promoting the protection and repair of ecosystems around the world [6]. In the same year, at the United Nations Climate Conference in Glasgow, more than 140 countries signed the «Declaration on Forests and Land Use», which aims to “protect forests and other land ecosystems and accelerate its recovery” [7].
Resilience is the ability of a system to withstand disturbances and still maintain its basic structure and function [8]. It is the key to maintaining regional sustainability [9]. In 1973, Holling introduced the concepts of resilience and stability into the ecosystem, believing that ecological resilience is the amount of disturbance that the system can absorb by adjusting parameters such as system state variables and driving variables on the premise that the structure, function, and feedback of the system remain unchanged [10]. As the contradiction between human and land relationships, more and more scholars pay attention to ecological resilience. Current research on ecological resilience mainly focuses on the following aspects: (1) Discussion of ecological resilience theory. With the deepening of regional sustainable development, the definition of ecosystem resilience has been enriched and developed. The view that ecosystems have the ability of self-regulation and self-recovery has gradually been recognized. For example, Westman believed that resilience force refers to the process, mode, and speed of the initial structure and functional recovery in the ecosystem after disturbance, which reflects the character and complexity of stable processes in the ecosystem [11]. Walker [12] and Sasaki et al. [13] believe that the anti-interference ability of an ecosystem to keep its original structure and characteristics unchanged within a certain period of time is called ecological resilience. Gao believed that ecological resilience is the ability of an ecosystem to self-sustain, self-regulate and resist various pressures and disturbances [14]. Some scholars have also analyzed the connotation of ecological resilience. For example, Gao [14] and Sterk et al. [15] believe that the connotation of ecological resilience can be summarized into two aspects, one is the resilience strength of the system, and the other is the resilience limit of the system. The former depends on the state of the system, while the latter depends on the coverage types and levels of land cover, as well as the diversity of land cover. However, Cote [16] believes that ecosystem resilience includes two independent processes: disturbance amplitude and recovery speed. Some scholars have analyzed ecological resilience from two dimensions: structural resilience and functional resilience [17]. (2) Quantitative evaluation of ecosystem resilience, such as land net primary productivity [18], leaf area index [19], hydroclimatic efficiency model [20], comprehensive indicators [21], and other methods to quantify the ecological resilience of specific geographical spaces such as the large urban agglomerations [17], mining areas [22], river basins [23], plateaus and nature reserves [24,25]. (3) Sustainable construction of society-ecosystem under the guidance of resilience thinking. For example, urban planning under the concept of resilience [26], the recovery of the social ecosystem after disasters [27], and the improvement path of ecological resilience of resource-based cities [28].
The ecosystem is a complex and open adaptive system that is affected by the comprehensive influence of nature and human factors and responds to various disturbances through a series of feedback mechanisms. With the rapid progress of urbanization, the comprehensive carrying capacity of the ecological environment is increasing, and the ecological environment problems caused by human and natural factors such as land use and climate change make the ecological system face far more disturbance than the system itself can resist [29,30]. The vulnerability of the ecosystem is gradually becoming a major scientific issue that affects or even restricts human survival and sustainable development. As the underlying surface factor of global environmental change, land use change is the most direct human driving factor that causes global and regional environmental change. In the past 30 years, China’s urban size has expanded rapidly, the land cover has changed significantly, and the ecological environment has been continuously disturbed by human activities. Particularly, the land use change in urban agglomerations is very drastic, which seriously threatens the ecosystem structure and service function. Existing studies have explored the relevant theories, measures, and spatio-temporal differentiation of ecological resilience, but there are few studies on the ecological resilience of land use change. The land is the space carrier of the main economic and social activities of human beings. The rapid urbanization process has brought a great impact on the ecological environment by changing the use of land [31]. Under the background of implementing the sustainable development strategy and building a beautiful China, it is urgent to deeply analyze the causal relationship between the change in land use structure and ecological resilience in China. Based on the above scientific question, this article references the theory of land use transition and takes the remote sensing data of regional land use monitoring in China from 1990 to 2020 as the main data source, making the following marginal contributions. (1) Overcome the limitation of previous studies focusing on specific regions and provinces, quantitatively estimate the state of ecological resilience in different regions of China, and grasp the spatio-temporal characteristics of ecological resilience in China from the macro level. (2) A depth analysis of the response of ecological resilience to land use transition and its regional differences from the perspective of dominant morphology, which makes up for the lack of the internal heterogeneity of regional ecosystem resilience in previous studies. The research is expected to provide decision support for the stability of the regional ecosystem and provide scientific evidence for achieving sustainable development.

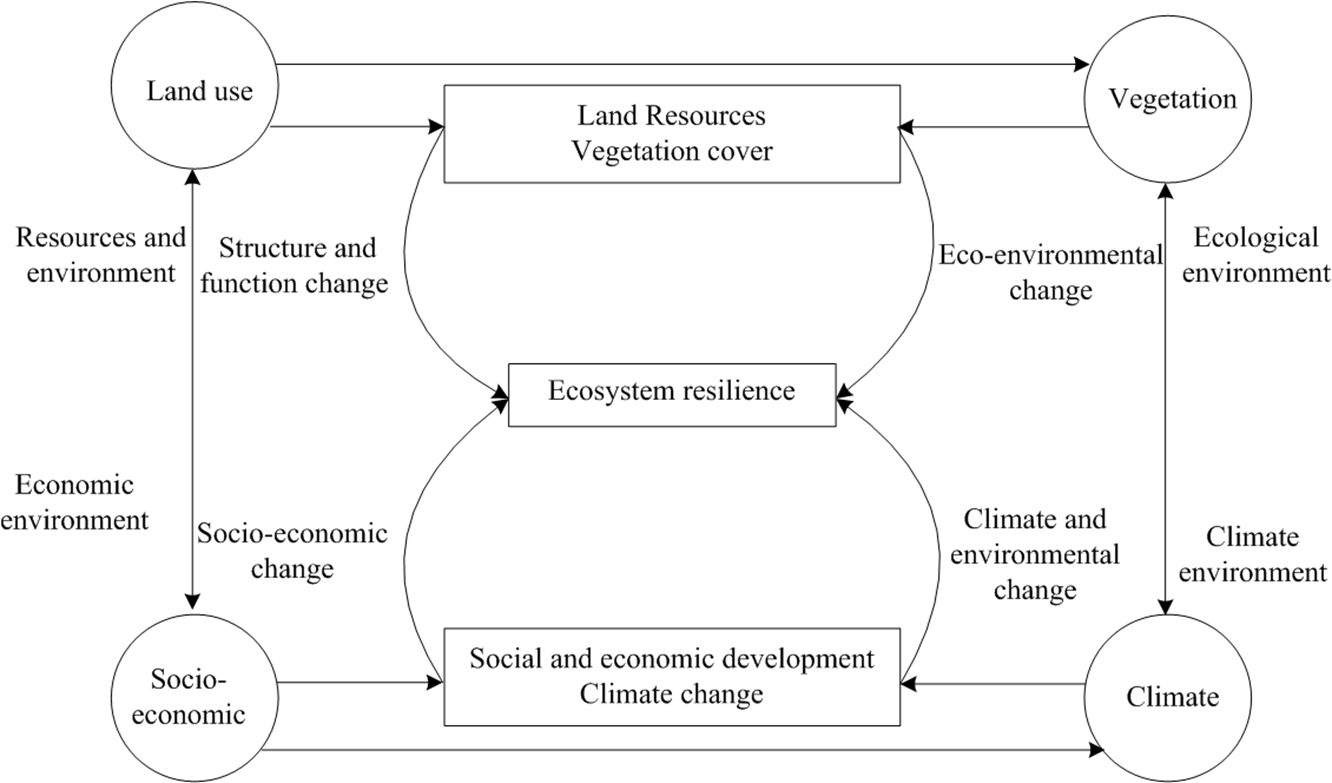
2. Theoretical Analysis of Driving Mechanism

Ecological resilience refers to the ability of the ecosystem to self-maintain, self-regulate and resist various external pressures and disturbances after it deviates from the non-equilibrium state. Due to the ecosystem being a dynamic, open system, it is under various pressures, disturbances, and changes at any time to provide a relative stability environment for life in the system. The reason this relative stability environment can be maintained is the self-maintenance and self-regulation function of the ecosystem [14]. Therefore, the existence of ecosystem resilience lays the foundation for human survival and development. At the same time, it is the result of the synthetical effect of human activities and natural environmental elements. In the ecosystem, climate conditions, vegetation, and land use determine the characteristics of the ecosystem. The different combinations of these factors constitute different types of ecological environments and also determine the ability of the ecological system to resist interference and recovery after disturbance. Vegetation status is the main factor in maintaining the stability and anti-interference ability of the ecosystem. Vegetation determines the morphological structure of the ecosystem, and the photosynthesis of green plants provides energy for the operation of the ecosystem. Vegetation cover is closely related to meteorological factors. Through water vapor transmission, vegetation adapts to climate change and represents climate change to a certain extent. Vegetation participates in and influences the global water cycle and energy balance process [32] and has a biogenic influence on ecosystem change. Different vegetation types have different water absorption capacities and requirements. The higher the rainfall, the faster the vegetation growth and the greater the ecological and environmental benefits. Land use change is an important reason for ecosystem change. In the process of urbanization and industrialization, the agglomeration of population and industries to urban increases the demand for construction land. It will inevitably squeeze agricultural land, forest land, grassland, and unused land and compress the ecological space, thus driving the change of ecosystem services and functions. The change in land use structure and function leads to the change in vegetation cover type and its combination [33] (Figure 1). Social and economic development is the basic reason driving the change in the ecosystem and ecological resilience. In the process of social and economic development, human activities such as production activities, environmental pollution, population growth, transportation, and planning goals will exert great pressure on the ecosystem and affect its quality and stability.
As the main embodiment of human activities on the land surface system, land use is a long-term and periodic management and governance of land by human beings according to the natural characteristics of the land and certain socio-economic objectives [34]. Land use transition refers to the temporal changes of land use morphology driven by economic and social changes and innovations, including dominant and recessive morphology [35,36]. The former refers to the structure composed of main land types, including quantitative attributes such as area and share and spatial structure attributes. The latter refers to the land use morphology that is not easily detected and can be obtained through analysis, testing, monitoring, and investigation. Land use transition is related to economic and social development. The rapid development of industrialization and urbanization drives the change of land use morphology, especially the dominant morphology, such as land quantity and spatial structure, due to the economic and social development stage as well as the existing institutions and policy system differences [37]. Therefore, the dominant morphology of land use in a traditional agricultural area, urban agglomeration area, and nature reserve are different. This article mainly discusses the response of ecological resilience to land use transition from the perspective of land uses dominant morphology.

3. Materials and Methods

3.1. Data Collection

The data used in this article include land use data, meteorological data, and socioeconomic data. Four periods of land use data (1990, 2000, 2010, and 2020) were generated by artificial visual interpretation using Landsat remote sensing of the United States as the main information source. According to the standard of the land resource classification system in China, land use types were divided into farmland, forest land, grassland, waters, construction land, and unused land. The vegetation index of 2000, 2010, and 2020 was based on SPOT/VEGETATION NDVI satellite remote sensing data and was generated by the maximum synthesis method. The vegetation index of 1990 was derived from Landsat satellite remote sensing data. The data of meteorological data in China from 1990 to 2020 are based on the daily observation data of meteorological elements at more than 2400 observation stations in China. By calculating the annual value of each meteorological element, the spatial interpolation data of each annual meteorological element are generated by Anuspl interpolation software. The above data come from the resource and environmental science data center of the institute of Geographic Sciences and Natural Resources Research, with a spatial resolution of 1 km. Urbanization level data are derived from the Chinese City Statistical Yearbook and the provincial Statistics Yearbook.

3.2. Methodology

3.2.1. Ecosystem Resilience

The concept and connotation of ecological resilience can be summarized into two aspects: system resilience strength and resilience limit. The specific calculation model is as follows:
    E = λ × μ × E C O r e s    
In the formula, E is ecosystem resilience, λ is the adjustment coefficient (The value is 0.01 according to reference [38]), μ is the resilience strength coefficient of the ecosystem, E C O r e s is the ecological system resilience limit.
The resilience strength of an ecosystem can be determined by the characteristic factors of the ecosystem, such as climate and vegetation. The resilience limit of the ecosystem is related to the type of land cover and its resilience score (grade status).
μ = H × N P × C
E C O r e s = H i = 1 m S i × L i
In the formula, H is the landscape diversity index, N is the vegetation index, P is the annual precipitation change rate, C is the annual temperature change rate. S i is the resilience score of land type i. Referring to existing research, the resilience scores of farmland, grassland, forest land, waters, construction land, and unused land are 0.5, 0.6, 0.9, 0.8, 0.4, and 0.3, respectively [39,40]. L i is the proportion of land i.

3.2.2. Landscape Diversity Index

The resilience limit of ecosystems depends not only on the type and grade of land cover but also on the diversity of land types. The landscape diversity index reflects the diverse degree and proportion change of landscape types in the study area. The higher the index, the greater the diversity of the landscape type and the greater the resilience of the ecosystem. The calculation formula is:
H = i = 1 n p i ln p i
In the formula, H is the landscape diversity index, p i is the proportion of landscape type i; n is the number of landscape types in the study area.

3.2.3. Annual Precipitation Change Rate and Annual Temperature Change Rate

Precipitation change rate refers to the possible fluctuation or oscillation range of precipitation events. The greater the change rate, the more frequent abnormal precipitation, the stronger the climate heterogeneity, and the greater the impact on the ecological environment [41]. The annual precipitation change rate refers to the inter-annual change of precipitation, which can be divided into absolute precipitation change rate and relative precipitation change rate. Generally, precipitation change rate refers to the relative change rate of precipitation [42], which can be expressed as the percentage of the absolute change rate of precipitation and the average annual precipitation. The value reflects the stability or reliability of precipitation.
Ρ = 1 n i = 1 n R i R R × 100 % ,   ( i = 1 ,   2 ,   3 ,   n )
In the formula, p is the relative change rate of annual mean precipitation in the study area, R i is the actual precipitation in i, R is the average annual precipitation.
The annual temperature change rate refers to the inter-annual change in temperature, expressed as the relative change rate of inter-annual temperature. The calculation formula is as follows:
C = 1 n i = 1 n T i T T × 100 % ,   ( i = 1 ,   2 ,   3 ,   n )
In the formula, C is the relative change rate of annual mean temperature in the study area, T i is the actual temperature in i, T is the average annual temperature.

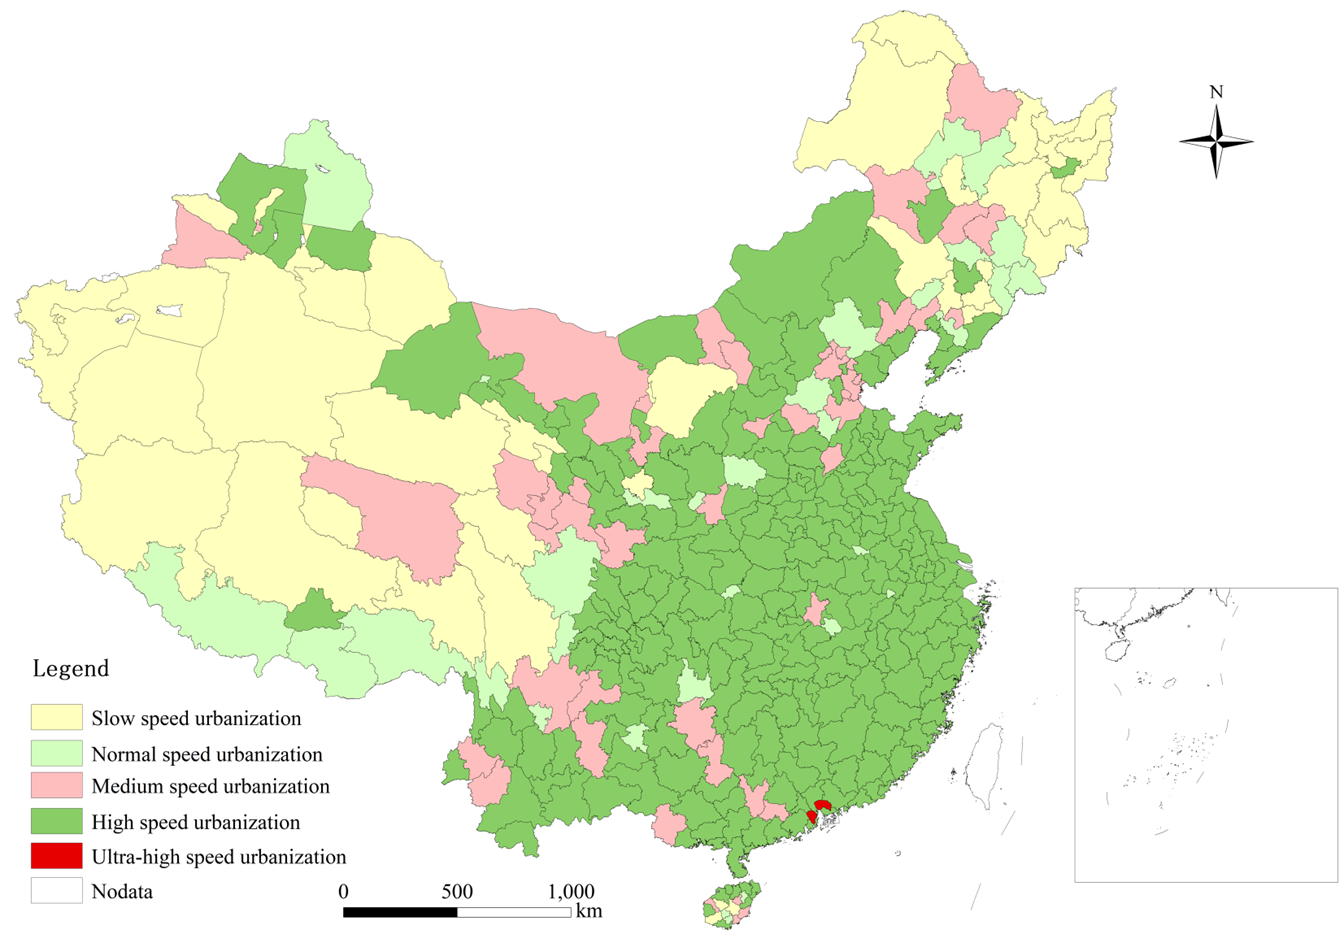
3.2.4. Urbanization Speed

Urbanization is the process in which the development of industrialization, non-agricultural economic activities are concentrated in urban areas. Rural labor and its family members are migrated from rural to urban and change to the urban population. Non-agricultural is the main feature of urbanization. The increase in population and economic activities in urban will lead to an increase in demand for land resources and then lead to a change in land use. Therefore, the proportion of the non-agricultural population in the total population is used to represent the urbanization level. The non-agricultural population and total population are resident populations within the region. Urbanization speed refers to the average growth rate of urbanization level in a period of time. The formula is as follows:
T a = 1 n p t + n p n  
In the formula,     T a is the urbanization speed; n is time interval; p t + n and p n were the urbanization levels in t+n and t year, respectively. According to the research of Luo [43], the average annual growth rate of urbanization speed can be divided into five categories: slow speed urbanization (0.1–0.6), normal speed urbanization (0.6–0.8), medium speed urbanization (0.8–1), high speed urbanization (1–2) and ultra-high speed urbanization (2–4). It is used to analyze the differences in regional socio-economic development and the impact of urbanization speed on land use changes and ecosystem resilience.

4. Results

4.1. Land Use Transitions in China from 1990 to 2020

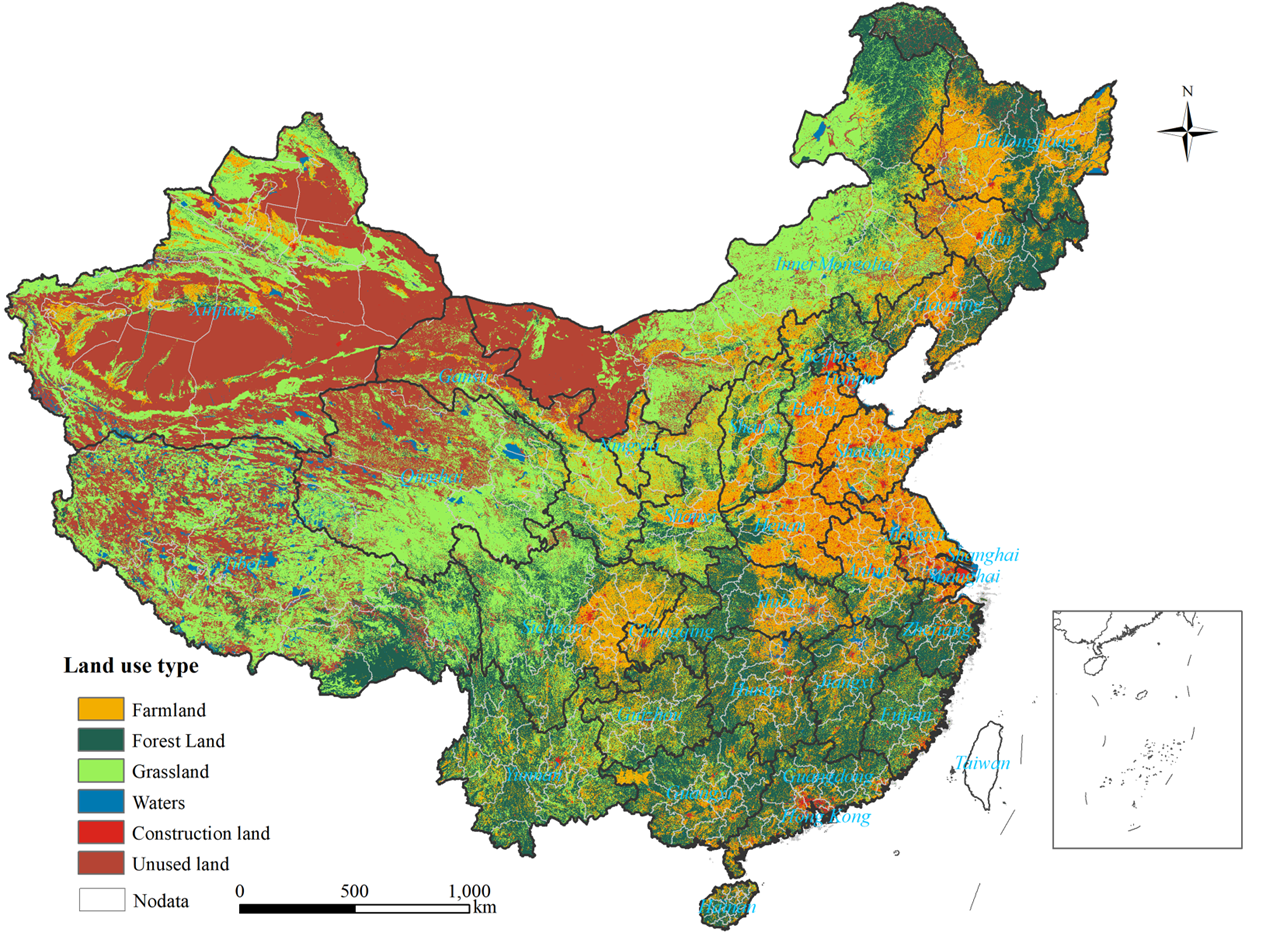
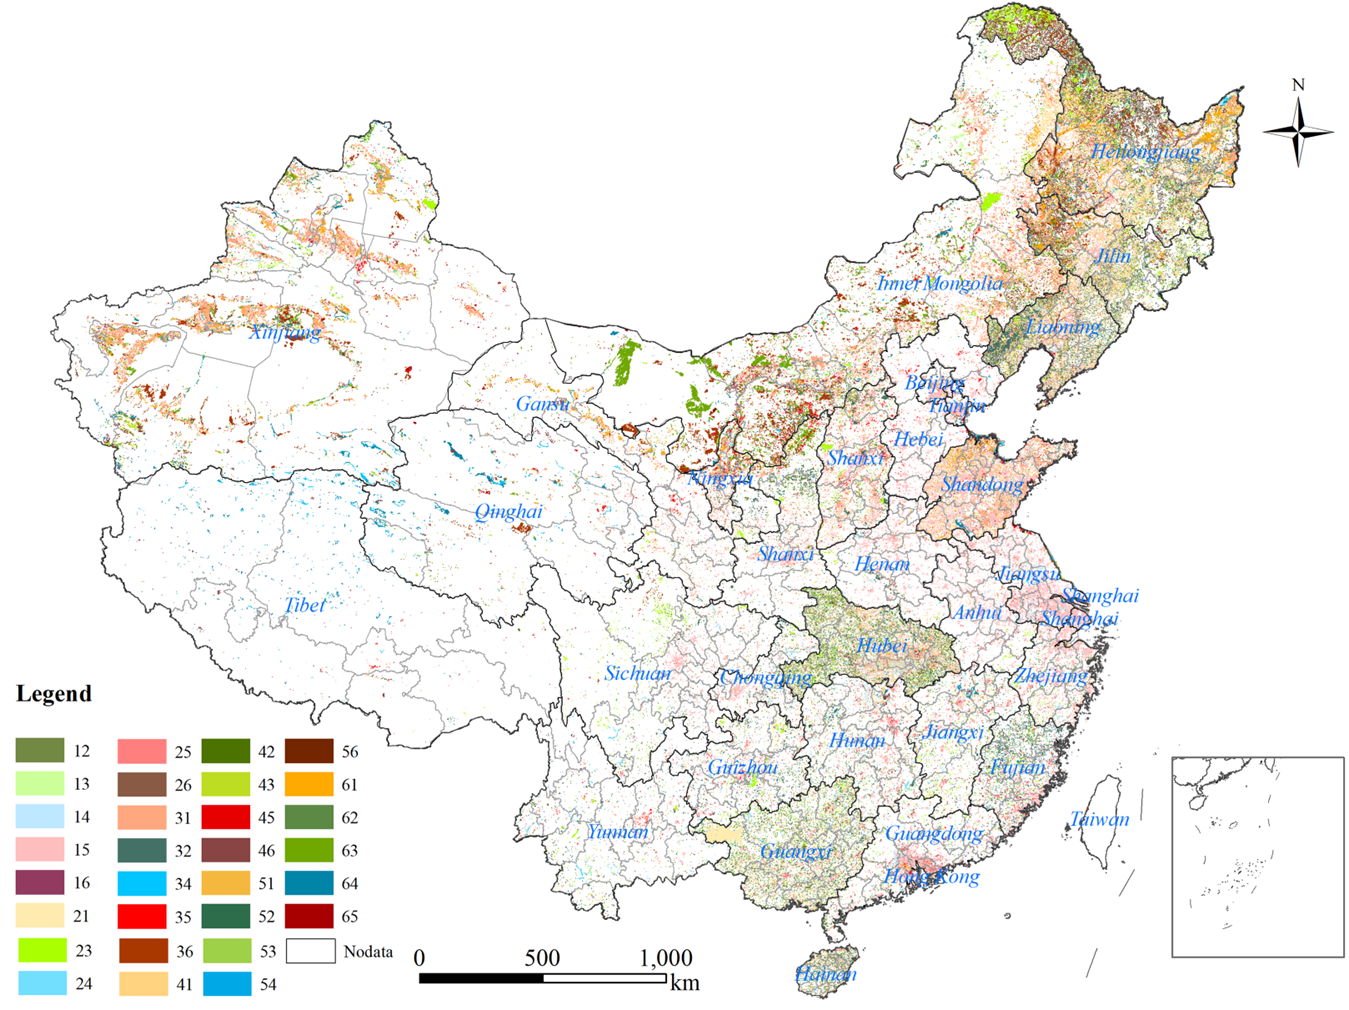
4.1.1. The Spatial-Temporal Pattern of Land Use

Forest land and grassland are the most widely distributed land use types in China. The area of forest land and grassland in China is, respectively, 22,603.12 × 104 hm2 and 27,110.51 × 104 hm2. Forest land is concentrated in the southern mountainous region and northeast China. Grassland is mainly distributed in northwest China, such as Tibet, Inner Mongolia, Xinjiang, Qinghai, Gansu and other provinces. In the same period, the proportion of unused land and farmland was relatively high, while the proportion of waters and construction land was relatively small. The unused land area is 21,883.55 × 104 hm2, accounting for 23% of the total land of the country, which is concentrated in the northwest and northern regions, such as Inner Mongolia, Qinghai, Tibet, Xinjiang and other places, indicating that the reserve land resources in western China are sufficient (Figure 2).
From 1990 to 2020, the pattern of land use in China has changed significantly. The forest land showed a fluctuation change trend, which showed first a decrease, then an increase and then a decrease, and the turning points were in 2000 and 2010, respectively. The farmland and grassland showed an obvious transition trend.The farmland increased first and then decreased, and the turning point was in 2010, while the grassland showed a trend of decreasing first and then increasing, and the turning point was also in 2010. Construction land continued to rise during the study period, but the rate of increase was slowing and there was no obvious turning point. The unused land showed a trend of first decreasing, then increasing and then decreasing, and the peak point was in 2010. In general, the area of forest land and grassland decreased, while the area of construction land, waters and farmland increased (Table 1). Specifically, the forest land and grassland decreased by 375.92 × 10⁴ hm2 (0.5%) and 743.63 × 10⁴ hm2 (0.91%), respectively. Construction land, waters and farmland increased by 1000.48 × 104 hm2, 89.16 × 10⁴ hm2 and 196.28 × 10⁴ hm2, respectively. The growth of construction land is the largest, which indicates that with the rapid improvement of urbanization, the demand of construction land for social and economic development is increasing.
In order to further analyze the land use of regions with different urbanization levels in China during the study period, the urbanization speed of cities in China was calculated and divided according to formula (7). The results are shown in Figure 3. Generally, from 1990 to 2020, most of the Chinese cities belong to high speed urbanization, and these cities are mainly distributed in the eastern region. Slow urbanization areas are mainly distributed in northeast and northwest China. The spatial distribution of medium speed and normal speed urbanization area is relatively dispersed. From the perspective of regional land use change, in the slow urbanization area, the farmland and construction land increased year by year, the forest decreased year by year, the grassland and waters decreased first, and then increased after 2010. The unused land increased from 1990 to 2010, and then decreased slightly in 2020. The farmland and forest land fluctuated in the normal speed urbanization area. However, compared with 1990, the area of farmland increased and the area of forest land was smaller at the end of the study. The proportion of grassland, waters and unused land decreased year by year. The farmland and forest land fluctuated in the normal speed urbanization area, but compared with 1990, the area of farmland increased and the area of forest land was smaller in 2020. The proportion of grassland, waters and unused land decreased year by year. In the medium-speed urbanization area, the farmland and grassland increased first and then decreased, and the turning point was in 2010. By 2020, the proportion of farmland in the medium-speed urbanization area had been higher than 1990, and the grassland had not recovered. The forest land and waters fluctuated and the proportion of unused land increased year by year. In the high speed urbanization area, the farmland decreased year by year, the forest land increased from 1990 to 2010, and the proportion decreased from 2010 to 2020. The proportion of grassland decreased from 1990 to 2010, and recovered in 2020. The proportion of waters has experienced a process of increase, decrease and increase, the turning point was in 2010, and by the end of 2020, it had basically recovered to the initial state. In the ultra-high speed urbanization area, the proportion of farmland, forest land and waters decreased year by year, and the proportion of grassland also showed a decreasing trend. In addition, with the improvement of urbanization, the construction land in each type increased year by year during the study period (Figure 4).

4.1.2. Land Use Transition Model

The internal conversion of different land use types in China during the study period was explored. Based on the land use data, the spatial analysis function of ArcGIS software was used to make an intersect analysis of the land use in different periods, and the conversion map between different land types in the study area during 1990–2020 were obtained (Figure 5). According to the transition model of different land use types (Table 2), construction land and farmland increased, grassland, forest land and unused land decreased during 1990–2020. Specifically, (1) The expansion for construction mainly derived from farmland, forest land and grassland, with 851.47 × 10⁴ hm2 of farmland,122.64 × 104 hm2 of forest land and 107.86 × 10⁴ hm2 of grassland converted into construction land, respectively. The transition of farmland to construction land mainly occurs in eastern and central China, such as Shandong, Jiangsu, Shanghai, Beijing, Tianjin, and other provinces. Due to the rapid gathering of economic development and the population, regional construction land has expanded rapidly, and a large amount of farmland is convert into construction land. The transition of forest land to construction land is mainly distributed in southern China, while the conversion of grassland to construction land is mainly in northern China. (2) In addition to being converted to construction land, farmland in some areas is mainly converted into forest land, which mainly occurs in Guangxi, Liaoning, Jilin, the west of Hubei, and the south of Heilongjiang. The conversion of this type is largely related to policies. In order to protect and improve the ecological environment, some provinces in China successively carried out the plan of returning farmland to forest in 1999, stopping the cultivation of sloping land, and carrying out afforestation project according to local conditions. At the same time, some forest land, grassland and unused land were converted into farmland, and the converted area was 593.1 × 10⁴ hm2, 723.82 × 10⁴ hm2 and 260.84 × 10⁴ hm2, respectively. In general, the transfer-in area is greater than the transfer-out area, and the total increase of farmland is 194.55 × 10⁴ hm2, which also shows the effect of the policy of “protecting farmland” in China. (3) In addition to the transfer of grassland into construction land, grassland was also mainly transferred into farmland, unused land and forest land, and the transferred area of grassland was 723.82 × 10⁴ hm2, 409.14 × 10⁴ hm2 and 361.99 × 10⁴ hm2, respectively. The transfer of grassland to farmland is mainly distributed in eastern Xinjiang, Shandong Peninsula, and eastern Inner Mongolia. Grassland transformed into unused land was distributed in Inner Mongolia, Heilongjiang, Xinjiang and other provinces, while grassland transformed into forest land mainly occurred in southwest Liaoning, northern and eastern Heilongjiang. (4) The decrease of forest land is resulting from the transfer of forest land into farmland, grassland and construction land. By 2020, 593.1 × 10⁴ hm2 of forest land was converted into farmland, mainly distributed in Guangxi, Hubei and northeast China. The conversion of forest land to grassland is mainly distributed in northern Heilongjiang and Hubei.

4.2. Ecological Resilience Change and Its Response to Land Use

4.2.1. Ecological Resilience Change

Formula (1) can be used to calculate the ecosystem resilience. From the perspective of time dimension, the mean and sum of the ecosystem resilience from 1990 to 2020 shows a trend of first decreasing and then increasing. The mean values of ecological resilience in 1990, 2000, 2010, and 2020 were 0.237, 0.209, 0.184, and 0.233, respectively. The variable coefficient of ecological resilience increased first and then decreased, which were 0.158, 0.204, 0.254, and 0.216, respectively. These results indicate that the adjustment and resistance capacity of ecosystems decreased from 1990 to 2010, and the differences of ecological resilience within regions increased. However, after 2010, the ecological resilience recovered and the differences within regions decreased.
In order to clarify the regional differences of ecological resilience in China during the study period, the natural break point classification method was adopted to classify the ecological resilience coefficients in 1990, 2000, 2010, and 2020, as shown in Figure 6. In general, the spatial distribution of ecological resilience in China is higher in the southeast and lower in the northwest. The regions with high values of ecological resilience are mainly distributed in Hunan, Yunnan, Guanxi, Guangdong, Zhejiang, Fujian, Hainan and other provinces. The ecological resilience of Xinjiang, Tibet, Qinghai, Gansu, Ningxia, Inner Mongolia and other northwest regions is low, at about 0.2. At the space dimension, the mean value of ecological resilience in any region decreases first and then increases (Figure 7). From 1990 to 2010, the mean value of ecological resilience in slow, normal, medium, high and ultra-high speed urbanization areas decreased year by year. In 2010, there were an obvious turning point and the mean value of ecological resilience began to rise, but it did not recover to the level of 1990.
In general, China’s ecological resilience has undergone a significant trend turning point in the past 30 years, showing a decline from 1990 to 2010, but a trend reversal after 2010. There is no obvious regional difference, and the same rule is shown in all regions with any speed of urbanization. In the five types of urbanization areas, the ecological resilience showed a trend of decline first and then increase, but there were certain regional differences in the degree of recovery of ecological resilience from 2010 to 2020. According to the mean value of ecological resilience in regions with different urbanization, the recovery degree of ecological resilience in the ultra-high speed urbanization areas is the smallest (0.046), followed by the slow speed urbanization areas, the normal speed urbanization areas and the medium speed urbanization areas.

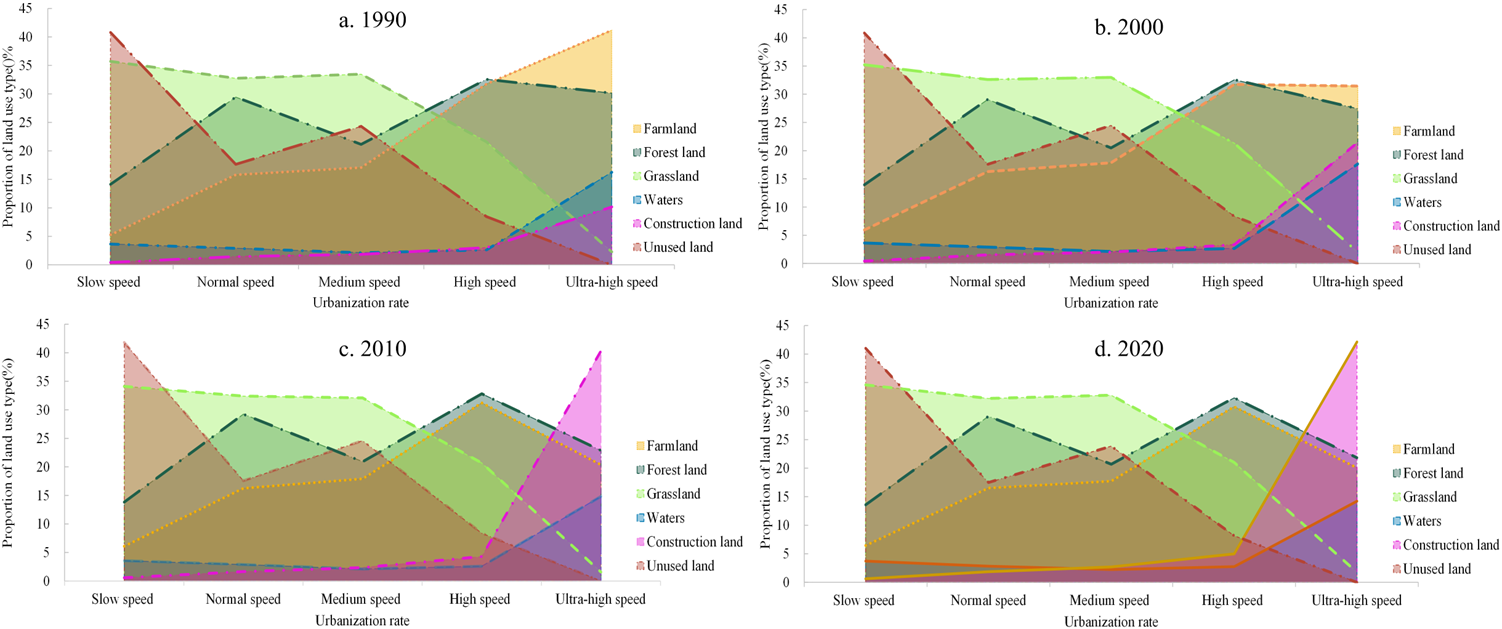
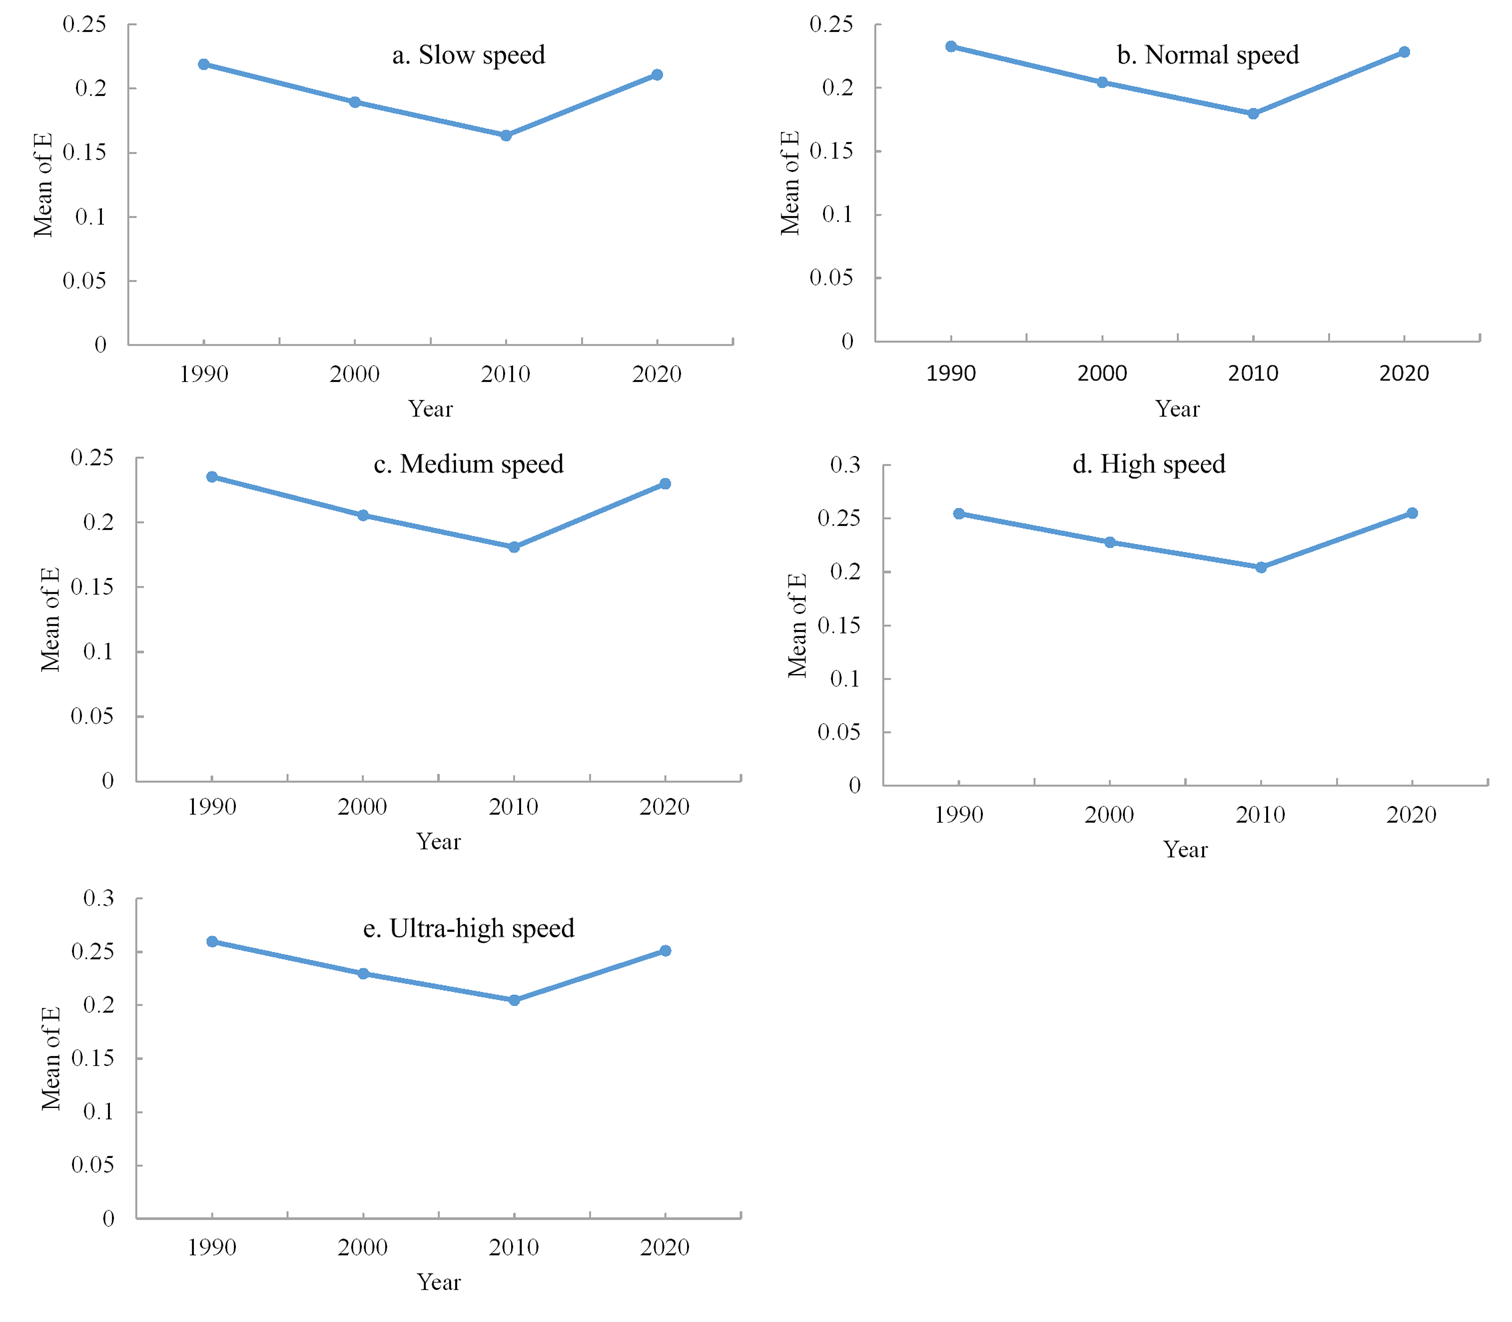
4.2.2. The Response of Ecological Resilience to Land Use

The development of human civilization is a process in which agricultural space and urban space continue to expand, squeezing and absorbing natural ecological space. The resilience of an ecosystem is related to ecological space/land use. In the study area, the proportion of grassland is the largest among the three types of ecological land (forest land, grassland and waters). During the study period, the ecological land in China changed obviously. The proportion of grassland and waters showed a trend of decreasing first and then increasing, and the two types of land showed a trend of increasing after 2010. In general, compared with 1990, the proportion of forest land decreased by 0.5% that of grassland decreased by 0.91%, and waters increased by 0.08% (Figure 8). The total area of grassland and waters accounted for more than 30%, which was significantly higher than that of forest land. Therefore, grassland and waters play a dominant role in the ecological space of the study area. Influenced by the proportion of ecological land, the mean and sum of ecological resilience in the region and different urbanization area in China also showed a trend of first decreasing and then increasing, and the turning point was in 2010. After 2010, the ecological resilience of different urbanization area showed internal heterogeneity.
According to the regional ecological land proportion and the variable coefficient of ecological resilience, the following two rules can be obtained: (1) From the time dimension, the proportion of ecological land is negatively correlated with the ecological resilience variable coefficient (Table 3), and the correlation coefficient is 0.6 or above.This indicates that no matter whether the urbanization speed is fast or slow, all regions show that the higher the proportion of ecological land, the smaller the variable coefficient of ecological resilience. Increasing regional ecological land can reduce the internal differences of ecological resilience. (2) From the perspective of cross-section, the slow urbanization is mainly located in the arctic-alpine, desert and other ecological barrier areas, and the proportion of ecological land is relatively high. The urban space expansion speed is slow with the slow urbanization speed. The degree of land use change in the region is small, and the internal difference of ecological resilience is small, which leads to the small variable coefficient of ecological resilience. Therefore, in the process of cross-sectional analysis, except for the slow urbanization, the same rule can be found in the remaining four regions. The ecological land proportion is negatively correlated with the variable coefficient of ecological resilience. The higher the ecological land proportion is, the smaller the variable coefficient of ecological resilience is (Table 4). Based on the results of time series and cross-section analysis, there is a correlation between the ecological land proportion and the variable coefficient of ecological resilience. For the same type and different types in the same time period, the higher the proportion of ecological land, the smaller the variable coefficient of ecological resilience, showing the consistency of the spatio-temporal effect.
As an important material carrier of human activities, land’s spatial expansion is the direct manifestation of social and economic processes. In the process of urbanization, the expansion of construction land has a strong disturbance to the ecological environment, resulting in a greater spatial deviation between land use and ecological environmental protection [44]. In general, the proportion of construction land in China has increased significantly from 1990 to 2020. The proportion of construction land in various urbanization is in the order of slow speed, normal speed, medium speed, high speed and ultra-high speed. From the relationship between construction land and ecological resilience, it can be found that during the study period, the proportion of construction land in China was significantly positively correlated with the variable coefficient of ecological resilience (Table 5), and there was a strong correlation between the two. With the increase of construction land, the variable coefficient of ecological resilience in each urbanization area also increased. It shows that the disturbances of various forms such as land use structure, development mode, and human activity in the process of urbanization have increased the difference of ecosystem resilience in the region. From slow urbanization area to ultra-high-speed urbanization area, with the increase of urbanization, the proportion of construction land in each region increases significantly, and the variable coefficient of ecological resilience also increases (Table 6). However, regional differences also exist. From the perspective of cross-section, the correlation coefficient between the proportion of construction land in the slow urbanization area and the variable coefficient of ecological resilience in the ultra-high-speed urbanization area is gradually increasing. The correlation coefficients between the proportion of construction land and the variable coefficient of ecological resilience in the slow, normal, medium, high and ultra-high speed urbanization areas were 0.39, 0.54, 0.66, 0.69, and 0.85, respectively. This indicates that with the increase of the proportion of construction land, the variable coefficient of ecological resilience will increase, and the faster the urbanization speed, the more obvious this effect is.

5. Discussion

Quantitative analysis land use change and its eco-environmental effects are of great significance to regional ecological security and sustainable development. Based on the relationship between land use dominant morphology and ecological resilience, this article quantitatively explored the spatio-temporal evolution of land use dominant morphology and ecological resilience in China from 1990 to 2020, as well as the response of ecological resilience to land use transitions. It can provide a scientific basis for regional ecological environmental protection and sustainable development, as well as territory spatial planning, ecological management policy formulation, etc. Based on the research contents, the main research findings and ecological environment optimization approaches under land use transition are discussed as follows:
(1) Land use transition and its eco-environmental effects are compatible with the stage of socio-economic development. The morphology of regional land use corresponds to its economic and social development stage [45,46], thus driving the change of ecological resilience. The research shows that the pattern of land use in China has changed significantly in the past 30 years. The forest land and grassland showed a fluctuation trend of decreasing first and then increasing. The turning point was in 2010, and the construction land continued to increase. The ecological resilience of the study area decreased first and then increased, and the turning point was in 2010. This indicates that China’s ecosystem adjustment capacity and resistance capacity have been enhanced after 2010, which is closely related to the development speed of China’s urbanization and national policies. From 1995 to 2010, China was in the stage of rapid urbanization, with the urbanization rate increasing from 29% to 50% [47]. In terms of space, China’s urbanization gradually expanded from the eastern coastal areas to the central and western regions. By 2011, the urban population exceeded the rural population for the first time, and China entered the middle stage of urbanization. The upgrading of industrial structure, the flow of production factors and the national requirements for energy conservation and pollution reduction is driving the transformation of Chinese cities. To this end, the 18th National Congress report in 2012 put forward the strategic decision of “Ecological civilization construction” and “Constructing a beautiful China”. Under the promotion of the policy, the ecological environment quality continues to improve, the area of forest land and grassland increases significantly, and the proportion of the forest and grassland increases significantly. Thus, the adjustment ability and resistance of regional ecosystem are enhanced, and the ecological resilience is increased.
(2) The spatial pattern of ecological resilience is closely related to the conditions of ecological environment. It was found that the ecological resilience was higher in the southeast and lower in the northwest. This spatial distribution pattern is closely related to the conditions of the ecological environment. The topography of the eastern coast and the central and western regions of China is mainly plains and hills. The climate condition and natural resources are more appropriate and superior to economic growth and urbanization development. The southwest and northwest of China are dominated by Qinghai-Tibet Plateau, Hengduan Mountains region, Inner Mongolia Plateau, northwest desert region, and agric-pasture transitional zone. With annual precipitation of less than 400 mm, they are arid and semi-arid areas. Most of them are ecologically fragile regions with a serious lack of water and soil resources, weak anti-interference ability and poor stability of the ecosystem.
(3) Ecological resilience optimization under land use transition. The results show that the variable coefficient of ecological resilience is inversely proportional to the proportion of ecological land and positively proportional to the proportion of construction land in different urbanization. China is a vast territory country with complex and diverse geographical conditions. Based on the differences in social and economic development conditions and natural endowments, different regulatory measures should be adopted. According to the forest transition theory, the transition from rapid expansion to stagnation determines the process of ecological restoration. Therefore, at the national dimensional, slow urbanization areas are also important ecological functional areas. The national parks should be used as the main carriers to strengthen ecological environmental protection and maintain the function of ecological barriers by applying the concept of rewilding ecological restoration and combining dynamic and process oriented ecological restoration methods to explore the “city-rural-wild”systemic recycling pathway. Restoring complex ecosystems to self-sustaining capacity, by repairing interconnected ecological processes that mutually promote and reduce or eradicate human intervention. At the regional dimensional, the speed of urbanization varies, but all are disturbed by human activities. Urban space, agricultural space and ecological space coexist, with complex elements and high land use dynamic index. We should compile and supervise the implementation of territory spatial planning, strictly implement the “three control lines”: ecological conservation redline, permanent prime farmland and urban development boundary. We should strengthen the comprehensive improvement of territory spatial, ensure the positive operation of regional ecosystems, and ensure ecological resilience maintaining stability.
(4) Land use change is an important factor to change the structure and function of the ecosystem. Although domestic scholars have analyzed the evolution of land use and ecological resilience [48], because of data limitations, most research takes a certain regional or provincial for instance. It is difficult to grasp the characteristics of ecological resilience at the macro level. From the perspective of land use dominant morphology, this article explores the relationship between land use transition and ecological resilience across the country by using raster spatial data. Then, considering social and economic factors and taking urbanization speed as the basis of zoning, the internal difference analysis of land use transition and ecological resilience among different types was carried out. The method adopted in this study highly preserves the spatial information of various indicators. It is convenient to identify areas with serious ecological problems and can provide reference for regional sustainable development. The research findings of this article based on the national scale are consistent with the research results of some domestic scholars on regional or provincial units. For example, ecological land and construction land are the main types that affect the regional ecological resilience. The decrease of forest land and the increase of construction land has a counteractive on ecological resilience, which is consistent with the results of Dou and Xu’s research [21,48]. Affected by the development of nature and socio-economic, ecological resilience presents a fluctuation state, which is consistent with reference [49].
There are some limitations in this study. First, the resolution of land use and meteorological data at the national scale is low, which leads to the weak description of the spatial details of ecological resilience. Second, this article analyzes the spatial and temporal characteristics of land use transition and ecological resilience in China, and uses mathematical models to analyze the relationship between ecological land, construction land and ecological resilience. However, further quantitative research is needed to determine to what extent changes in the two types of land can cause ecological resilience change. Therefore, more detailed research can be carried out on typical areas, such as farming pastoral zones and nature reserves, with grid or vector land use data of 30 m and 100 m resolution to explore the internal mechanism of ecological resilience. In addition, the ecosystem is a complex and open giant system, it is affected by many variables. Therefore, based on the research on the internal mechanism of ecological resilience, we can find the key variables that cause the change of ecological resilience. By controlling key variables, we can simulate the state and change of ecological resilience in specific situations. In this way, to find the key threshold of ecological resilience change caused by land use transition, and use sustainable system management measures to adjust the key threshold to improve ecosystem resilience.

6. Conclusions

(1) From 1990 to 2020, the overall situation of land use dominant morphology transition in China was as follows: the area of forest land and grassland decreased, while the area of construction land, waters and farmland increased. The forest land, grassland and farmland showed a fluctuating trend, and the turning point was in 2010.
(2) During the study period, the ecological resilience of China generally showed a trend of decreasing first and then increasing. From 1990 to 2010, the adjustment and resistance capacity of China’s ecosystems declined, and the ecological resilience within the region had a large difference. After 2010, the ecological resilience recovered and the difference within the region narrowed. The high value area of ecological resilience is mainly distributed in southeast China, while the low value area is mainly distributed in northwest China.
(3) The main land use types causing the change of ecological resilience are ecological land and construction land. For the same type of area and different types of area in the same time period, the higher the proportion of ecological land, such as forest land, grassland and waters, the smaller the variable coefficient of ecological resilience. Increasing the regional ecological land can reduce the internal differences of the region ecological resilience. There was a significant positive correlation between the proportion of construction land and the variable coefficient of ecological resilience. The higher the proportion of construction land, the greater the difference of ecosystem resilience among different types.

Author Contributions

Conceptualization, H.L. and L.L; methodology, E.M.; software, L.L; validation, H.L., E.M. and X.P.; formal analysis, L.L.; investigation, X.P; resources, H.L.; data curation, L.L.; writing—original draft preparation, H.L.; writing—review and editing, L.L.; visualization, E.M.; supervision, H.L.; project administration, H.L.; funding acquisition, H.L. All authors have read and agreed to the published version of the manuscript.

Funding

This research was funded by National Natural Science Foundation of China (Grant No. 42101198); Natural Science Foundation of Guangxi Zhuang Autonomous Region (Grant No. 2018GXNSFDA281032); Project of Hunan Province Social Science Achievement Appraisal Committee (Grant No. XSP22YBZ182).

Data Availability Statement

Not applicable.

Conflicts of Interest

The authors declare no conflict of interest.

References

  1. Pu, W.; Zhang, A.; Wen, L. Can China’s resource-saving and environmentally friendly society really improve the eficiency of industrial land use? Land 2021, 10, 751. [Google Scholar] [CrossRef]
  2. Tian, J.; Zeng, S.; Zeng, J.; Wang, S. How urban expansion triggers spatio-temporal differentiation of systemic risk in suburban rural areas: A case study of Tianjin, China. Land 2022, 11, 1877. [Google Scholar] [CrossRef]
  3. Yang, C.; Liu, H.; Li, Q.; Wang, X.; Ma, W.; Liu, C.; Fang, X.; Tang, Y.; Shi, T.; Wang, Q.; et al. Human expansion into Asian highlands in the 21st Century and its effects. Nat. Commun. 2022, 13, 4955. [Google Scholar] [CrossRef]
  4. Wang, X.; Pan, T.; Pan, R.; Chi, W.; Ma, C.; Ning, L.; Wang, X.; Zhang, J. Impact of land transition on landscape and ecosystem service value in Northeast Region of China from 2000–2020. Land 2022, 11, 696. [Google Scholar] [CrossRef]
  5. Food and Agriculture Organization of the United Nations. The State of the World’s Land and Water Resources for Food and Agriculture: Systems at Breaking Point. 2021. Available online: https://www.fao.org/land-water/solaw2021/en/ (accessed on 25 October 2022).
  6. UNEP-FAO. United Nations Decade on Ecosystem Restoration 2021–2030. Available online: http://aoc.ouc.edu.cn/2021/0618/c9829a338201/page.htm (accessed on 16 June 2021).
  7. UN Climate Change Conference UK 2021. Glasgow leaders’ Declaration on Forests and Land Use. Available online: https://ukcop26.org/glasgow-leaders-declaration-on-forests-and-land-use/ (accessed on 18 January 2022).
  8. Walker, B.; Salt, D. Resilience Thinking Sustaining Ecosystems and People in a Changing World; Higher Education Press: Beijing, China, 2010. [Google Scholar]
  9. Yuan, Y.; Bai, Z.; Zhang, J.; Xu, C. Increasing urban ecological resilience based on ecological security pattern: A case study in a resource-based city. Ecol. Eng. 2022, 175, 106486. [Google Scholar] [CrossRef]
  10. Holling, C. Resilience and stability of ecological systems. Annu. Rev. Ecol. Syst. 1973, 4, 1–23. [Google Scholar] [CrossRef] [Green Version]
  11. Westman, W. Measuring the inertia and resilience of ecosystems. Bioscience 1978, 28, 705–710. [Google Scholar] [CrossRef]
  12. Walker, B.; Holling, C.; Carpenter, S.; Kinzig, A. Resilience, adaptability and transformability in social-ecological systems. Ecol. Soc. 2004, 9, 5. [Google Scholar] [CrossRef]
  13. Sasaki, T.; Furukawa, T.; Iwasaki, Y.; Seto, M.; Mori, A. Perspectives for ecosystem management based on ecosystem resilience and ecological thresholds against multiple and stochastic disturbances. Ecol. Indic. 2015, 57, 395–408. [Google Scholar] [CrossRef]
  14. Gao, J. Exploration of Sustainable Development Theory: Ecological carrying capacity theory, Method and application. China Environ. Sci. Press 2001, 1, 24–25. [Google Scholar]
  15. Sterk, M.; Gort, G.; Klimkowska, A.; Ruijven, J.; van Teeffelen, A.; Wamelink, G.W.W. Assess ecosystem resilience: Linking respones and effect traits to environmental variability. Ecol. Indic. 2013, 30, 21–27. [Google Scholar] [CrossRef]
  16. Cote, I.; Darling, E. Rethinking ecosystem resilience in the face of climate change. PLoS Biol. 2010, 8, e1000438. [Google Scholar] [CrossRef]
  17. Wang, T.; Li, H.; Huang, Y. The complex ecological network’s resilience of the Wuhan metropolitan area. Ecol. Indic. 2021, 130, 108101. [Google Scholar] [CrossRef]
  18. Anjos, L.; Mann, D.; Silva, L. Measuring resilience and assessing vulnerability of terrestrial ecosystems to climate change in South America. PLoS ONE 2018, 13, e0194654. [Google Scholar] [CrossRef] [Green Version]
  19. Wu, J.; Liang, S. Assessing terrestrial ecosystem resilience using satellite leaf area index. Remote Sens. 2020, 12, 595. [Google Scholar] [CrossRef] [Green Version]
  20. Ponce-Campos, G.E.; Moran, S.M.; Huete, A.; Zhang, Y.; Bresloff, C.; Huxman, T.E.; Eamus, D.; Bosch, D.D.; Buda, A.R.; Gunter, S.A.; et al. Ecosystem resilience despite large-scale altered hydroclimatic conditions. Nature 2013, 494, 349–353. [Google Scholar] [CrossRef]
  21. Dou, M.; Tang, L.; Xu, X.; Yang, D. The spatial-temporal variations and influence factors of ecological resilience in Anhui Province. Ecol. Sci. 2018, 37, 184–190. [Google Scholar]
  22. Xiao, W.; Chen, W.; Deng, X. Coupling and coordination of coal mining intensity and social-ecological resilience in china. Ecol. Indic. 2021, 131, 108167. [Google Scholar] [CrossRef]
  23. Yang, J.; Xie, B.; Zhang, D. Spatial–temporal evolution of ESV and its response to land use change in the Yellow River Basin, China. Sci. Rep. 2022, 12, 13103. [Google Scholar] [CrossRef]
  24. Cao, J.; Li, M.; Deo, R.; Adamowski, J.; Cerdà, A.; Feng, Q.; Liu, M.; Zhang, J.; Zhu, G.; Zhang, X.; et al. Comparison of social-ecological resilience between two grassland management patterns driven by grassland land contract policy in the Maqu, Qinghai-Tibetan Plateau. Land Use Policy 2018, 74, 88–96. [Google Scholar] [CrossRef] [Green Version]
  25. Rescia, A.J.; Willaarte, B.A.; Schmitz, M.F.; Aguilera, P.A. Changes in land use and management in two nature reserves in Spain: Evaluating the social ecological resilience of cultural landscapes. Landsc. Urban Plan. 2010, 98, 26–35. [Google Scholar] [CrossRef]
  26. Lloyd, M.G.; Peel, D.; Duck, R.W. Towards a social-ecological resilience framework for coastal planning. Land Use Policy 2013, 30, 925–933. [Google Scholar] [CrossRef]
  27. Adger, W.; Hughes, T.; Folke, C.; Carpenter, S.; Rockstrom, J. Social-ecological resilience to coastal disasters. Science 2005, 309, 1036–1039. [Google Scholar] [CrossRef] [Green Version]
  28. Jin, Y.; Lu, Z.; Tan, F.; Zhang, M.; Zhang, H. Assessment of ecological carrying capacity on the typical resources-based cities: A case study of Tangshan City. Acta Ecologica Sinica 2015, 35, 4852–4859. [Google Scholar]
  29. Bessey, K.M. Structure and dynamics in an urban landscape: Toward a multiscale view. Ecosystems 2002, 5, 360–375. [Google Scholar] [CrossRef]
  30. Li, T.; Dong, Y.; Liu, Z. A review of social-ecological system resilience: Mechanism, assessment and management. Sci. Total Environ. 2020, 723, 138113. [Google Scholar] [CrossRef]
  31. Dong, Z.; Rong, A.; Zhang, J.; Tong, Z.; Han, A.; Zhi, F. Study on the evolutionary features and driving factors of land-use system in Xilingol, China. Land 2022, 11, 526. [Google Scholar] [CrossRef]
  32. Han, X.; Zuo, D.; Li, P.; Xu, Z.; Gao, X. Spatiotemporal variability of vegetation cover and its response to climate change in Yarlung Zangbo River Basin. Adv. Sci. Technol. Water Resour. 2021, 41, 16–23. [Google Scholar]
  33. Senay, G.B.; Elliott, R.L. Combining AVHRR-NDVI and landuse data to describe temporal and spatial dynamics of vegetation. For. Ecol. Manag. 2000, 128, 83–91. [Google Scholar] [CrossRef]
  34. Fu, B.; Zhang, L. Land use change and ecosystem services: Concepts, methods and progress. Prog. Geogr. 2014, 33, 441–446. [Google Scholar]
  35. Long, H. Land Use Transitions and Rural Restructuring in China; Springer Nature: Singapore, 2020. [Google Scholar]
  36. Long, H. Theorizing land use transitions: A human geography perspective. Habitat Int. 2022, 128, 102669. [Google Scholar] [CrossRef]
  37. Niu, X.; Liao, F.; Liu, Z.; Wu, G. Spatial–temporal characteristics and driving mechanisms of land–use transition from the perspective of urban–rural transformation development: A case study of the Yangtze River Delta. Land 2022, 11, 631. [Google Scholar] [CrossRef]
  38. Janssen, M.; Anderies, J.; Walker, B. Robust strategies for managing rangelands with multiple stable attractors. J. Environ. Econ. Manag. 2004, 47, 140–162. [Google Scholar] [CrossRef]
  39. Liu, X.; Li, P.; Ren, Z.; Miao, Z.; Zhang, J.; Liu, X.; Li, Z.; Wang, T. Evaluation of ecosystem resilience in Yulin, China. Acta Ecol. Sin. 2016, 36, 7479–7491. [Google Scholar]
  40. Niu, Q.; Zhou, X.; Zhang, J.; Jiang, X.; Yang, J. Evolution of ecosystem resilience in mountainous cities of Karst—Taking Guiyang Urban Area as an example. Resour. Environ. Yangtze Basin 2019, 28, 722–730. [Google Scholar]
  41. Zhang, W.; Furtado, K.; Wu, P.; Zhou, T.; Chadwick, R.; Marzin, C.; Rostron, J.; Sexton, D. Increasing precipitation variability on daily-to-multiyear time scales in a warmer world. Sci. Adv. 2021, 7, eabf8021. [Google Scholar] [CrossRef]
  42. Gong, Y.; Hua, J.; Chen, Y. The analysis of change rate of precipitation and qunatity change of precipitation in the past 50a multiple temporal scales in Tangshan. Chin. Agric. Sci. Bull. 2008, 24, 448–451. [Google Scholar]
  43. Luo, Z. Discussions about the speed of urbanization and related studies. Urban Plan. Forum 2007, 172, 60–66. [Google Scholar]
  44. Yang, Q.; Duan, X.; Wang, L.; Wang, Y. Mechanism of interaction between urban land expansion and ecological environment effects in the Yangtze River Delta. Prog. Geogr. 2021, 40, 220–231. [Google Scholar] [CrossRef]
  45. Li, X.; Wang, L.; Pijanowski, B.; Pan, L.; Omrani, H.; Liang, A.; Qu, Y. The spatio-temporal pattern and transition mode of recessive cultivated land use morphology in the Huaibei Region of the Jiangsu Province. Land 2022, 11, 1978. [Google Scholar] [CrossRef]
  46. Long, H.; Kong, X.; Hu, S.; Li, Y. Land use transitions under rapid urbanization: A perspective from developing China. Land 2021, 10, 935. [Google Scholar] [CrossRef]
  47. Su, H.; Wei, H. The course, inspiration and expectation of China’s urbanization over the past 40 years of reform and opening-up. Reform 2018, 11, 49–59. [Google Scholar]
  48. Xu, Z.; Zhou, J. The evolution of land use and ecological resilience in Gez River. Soil Water Conserv. China 2021, 11, 49–53. [Google Scholar]
  49. Zheng, X.; Cheng, Y.; Ren, C.; Zhou, L. Evaluation of ecological resilience in Ordos City. Ecol. Sci. 2019, 38, 185–192. [Google Scholar]
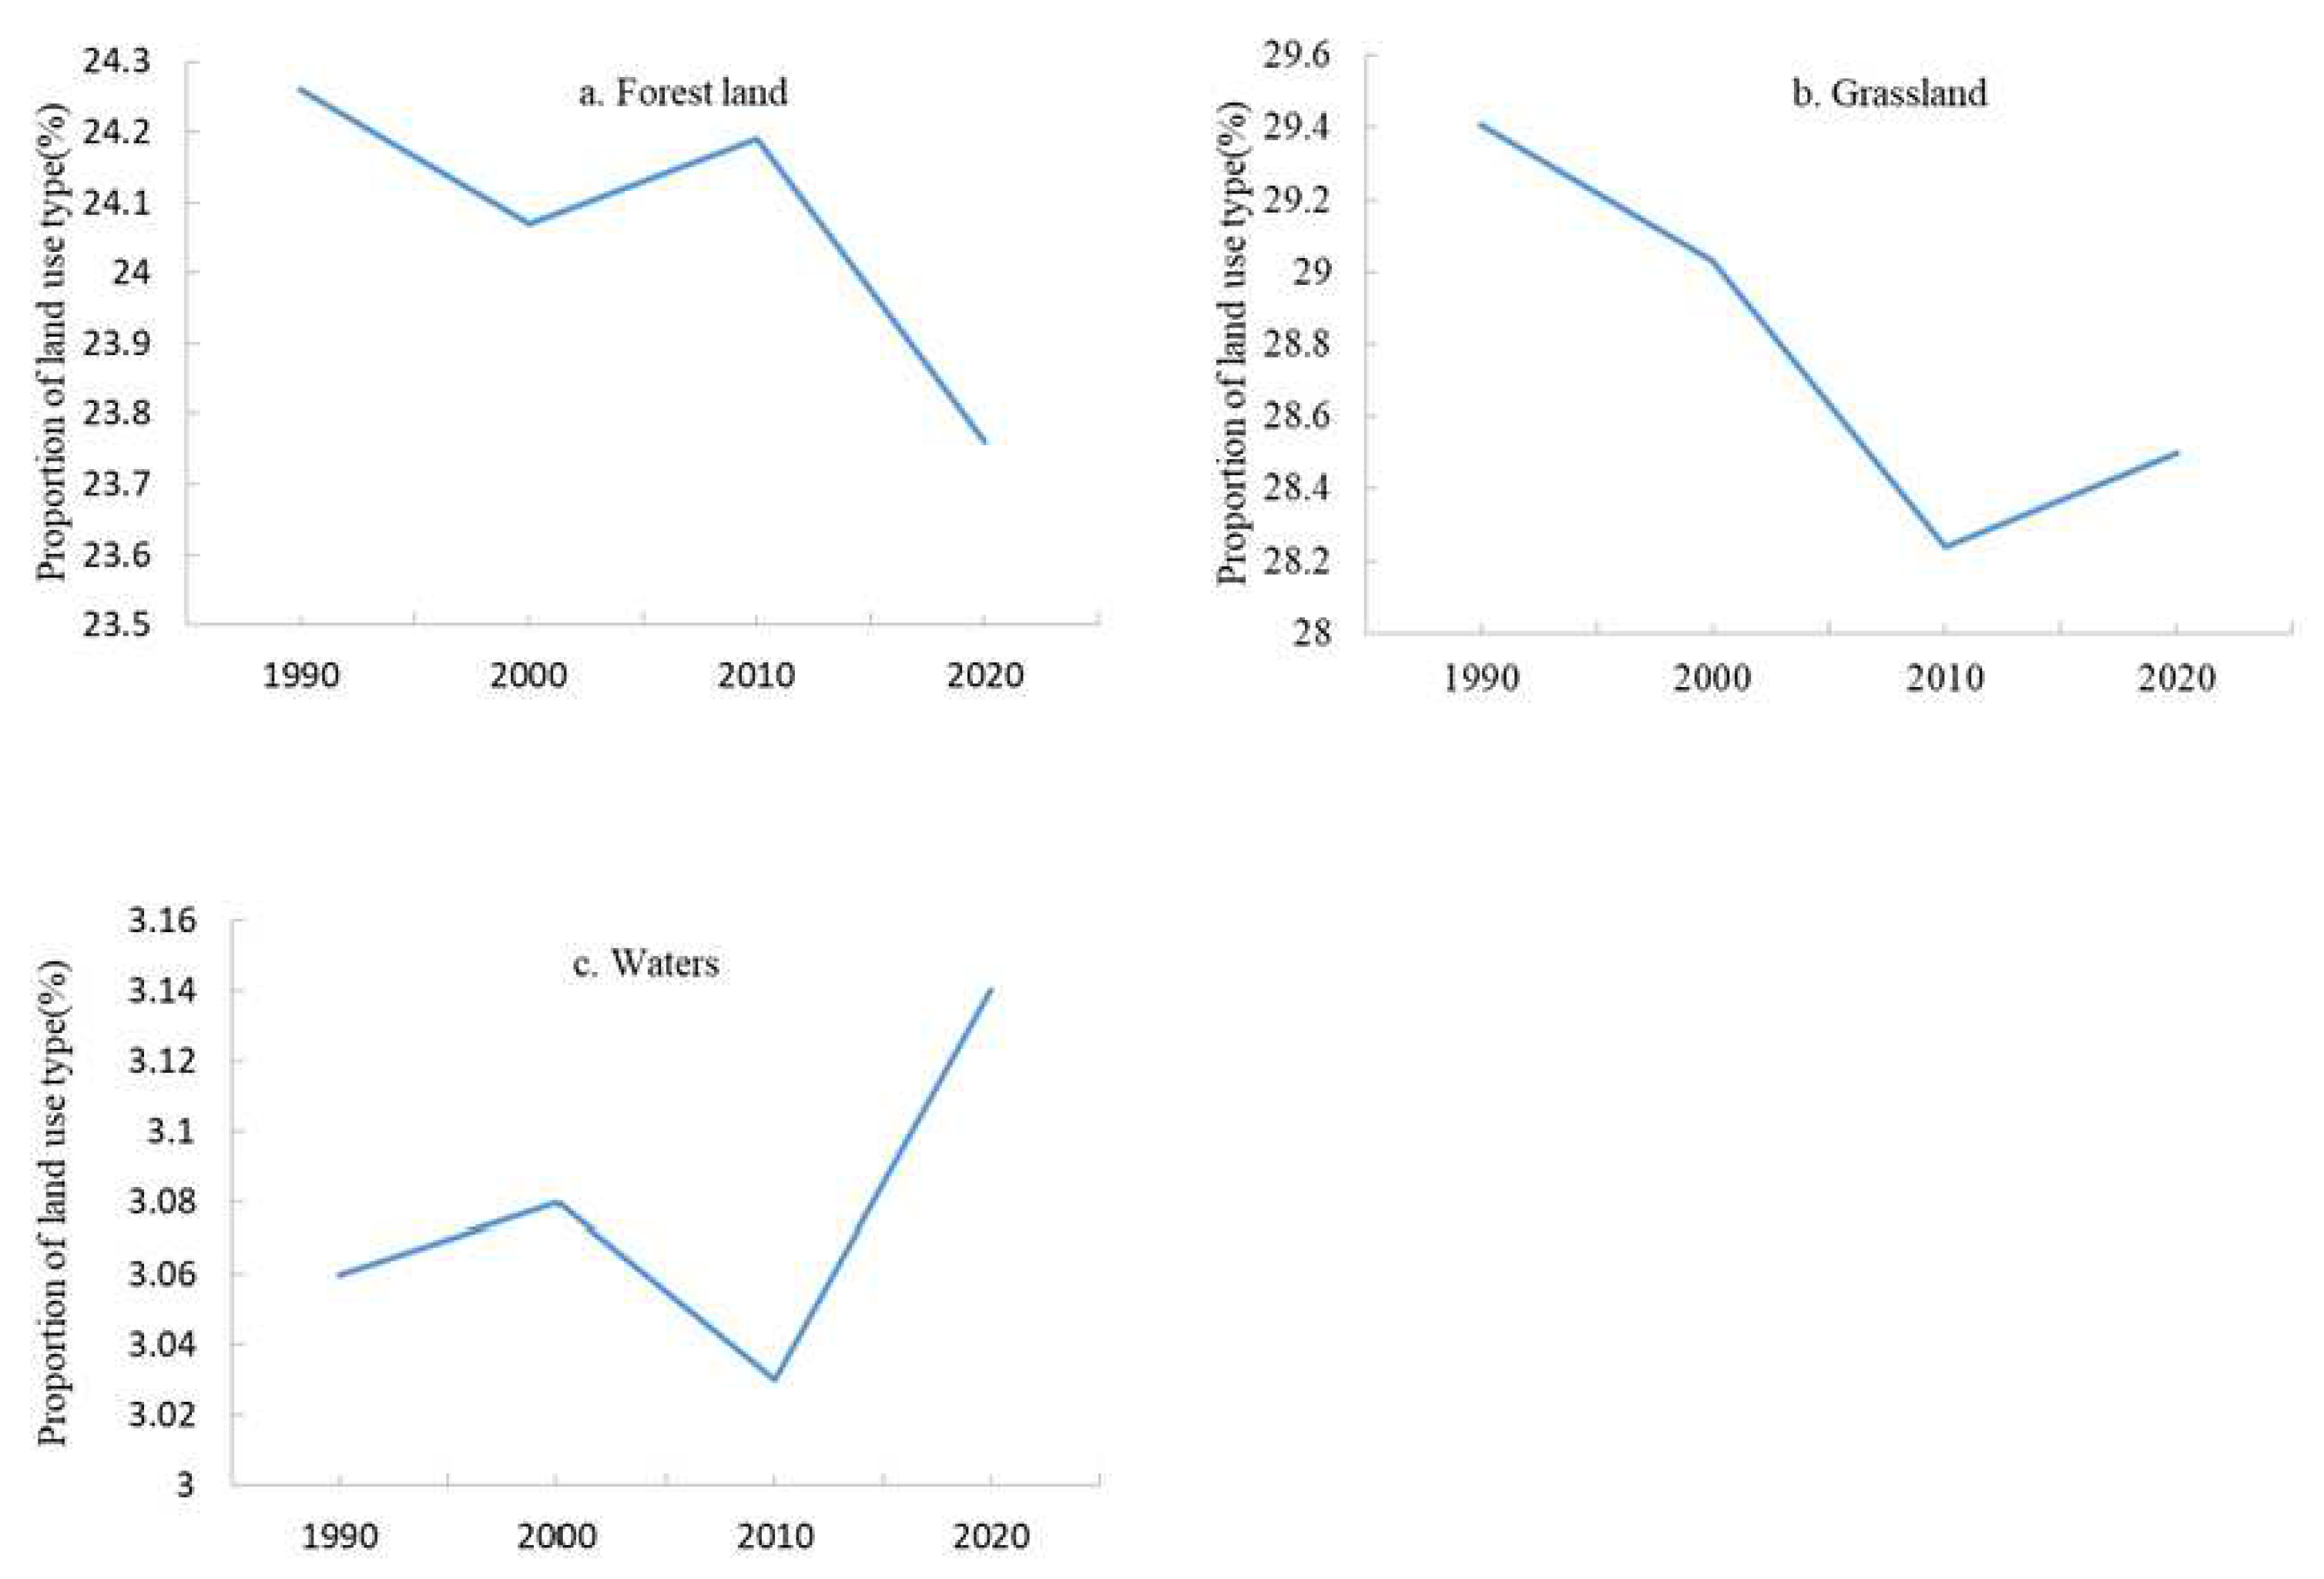
Figure 1. The driving mechanism of ecological resilience.
Land 12 00141 g001
Figure 2. Land use in 2020.
Land 12 00141 g002
Figure 3. Urbanization speed of cities from 1990 to 2020.
Land 12 00141 g003
Figure 4. Land use in different urbanization from 1990 to 2020.
Land 12 00141 g004
Figure 5. Land use change in China from 1990 to 2020. Notes: 1–6 represent farmland, forest land, grassland, waters, construction land, and unused land. 12: Farmland→Forest land; 13: Farmland→Grassland; 14: Farmland→Waters; 15: Farmland→Construction land; 16: Farmland→Unused land; 21: Forest land→Farmland; 23: Forest land→Grassland; 24: Forest land→Waters; 25: Forest land→Constructionnland; 26: Forest land→Unused land; 31: Grassland→Farmland; 32: Grassland→Forest land; 34: Grassland→Waters; 35: Grassland→Construction land; 36: Grassland→Unused land; 41: Waters→Farmland; 42: Waters→Forest land; 43: Waters→Grassland; 45: Waters→Construction land; 46: Waters→Unused land; 51: Construction land→Farmland; 52: Construction land→Forest land; 53: Construction land→Grassland; 54: Construction land→Waters; 56: Construction land→Unused land; 61: Unused land→Farmland; 62: Unused land→Forest land; 63: Unused land→Grassland; 64: Unused land→Waters; 65: Unused land→Construction land.
Land 12 00141 g005
Figure 6. Ecological resilience changes in China from 1990 to 2020.
Land 12 00141 g006
Figure 7. Mean changes of ecological resilience in different urbanization.
Land 12 00141 g007
Figure 8. Ecological land proportion changes in China from 1990 to 2020.
Land 12 00141 g008
Table 1. Proportion and change of land in China from 1990 to 2020 (%).
TimeFarmlandForest LandGrasslandWatersConstruction LandUnused Land
199018.6324.2629.413.061.8022.84
200019.0324.0729.033.081.9622.82
201018.8924.1928.243.032.4723.18
202018.7623.7628.503.142.8423.00
1990–20000.40−0.19−0.380.020.17−0.02
2000–2010−0.140.12−0.79−0.050.510.36
2010–2020−0.13−0.430.260.110.37−0.18
1990–20200.12−0.50−0.910.081.040.16
Table 2. Transfer matrix of land use in China from 1990 to 2020 (104 hm2).
Land Use Types in 1990Land Use Types in 2020
FarmlandForest LandGrasslandWatersConstruction LandUnused LandTotal
Farmland15,996.83356.74248.3143.54851.4751.517,648.38
Forest land593.121,797.65291.6448.1122.64125.0322,978.16
Grassland723.82361.9926,172.3978.84107.86409.1427,854.04
Waters119.7825.0740.022544.9253.67105.282888.74
Construction land148.5616.9210.6311.141506.776.411700.43
Unused land260.8440.39345.28118.7240.1321,184.5521,989.91
Total17,842.9322,598.7627,108.262945.262682.5421,881.9195,059.66
Table 3. Time series regression analysis of ecological land proportion and ecological resilience variable coefficient.
Model Summary and F-testRegression Coefficient and t Test
TimeR2Adjust R2Standard Error
Estimates
FSig. Unstandardized CoefficientstSig.
BStandard Error
19900.9370.9050.01729.600.032constant0.6230.0837.4800.017
x−0.7940.146−5.4400.032
20000.900.8470.02317.600.052constant0.7070.1176.0480.026
x−0.8710.208−4.1950.052
20100.9450.9210.02836.0340.027constant0.7700.0829.3320.011
x−0.9080.151−6.0030.027
20200.9150.8720.02721.4320.044constant0.5780.0757.6710.017
x−0.6420.139−4.6290.044
Table 4. Cross-sectional regression analysis of ecological land proportion and variable coefficient of ecological resilience.
Model Summary and F-testRegression Coefficient and t Test
TimeR2Adjust R2Standard Error EstimatesFSig. Unstandardized CoefficientstSig.
BStandard Error
Slow speed0.4490.3390.0064.0740.100constant0.4110.1662.4700.057
x−0.6410.317−2.0180.100
Normal speed0.5010.4020.0185.0280.075constant3.5311.5072.3430.066
x−5.2332.334−2.2420.075
Medium speed0.9450.9340.00885.750.000constant3.2510.3299.8710.000
x−5.4710.591−9.2600.000
High speed0.7970.7570.01919.6890.007constant6.6721.4494.6040.006
x−11.4092.571−4.4370.007
Ultra-high speed0.6730.6080.03710.2890.024constant0.7690.1385.5570.003
x−1.0220.319−3.2080.024
Table 5. Time series regression analysis between construction land proportion and ecological resilience variable coefficient.
Model Summary and F-testRegression Coefficient and t Test
TimeR2Adjust R2Standard Error
Estimates
FSig. Unstandardized CoefficientstSig.
BStandard Error
19900.8330.8090.02434.8860.001constant0.1010.0128.6320.000
x1.5880.2695.9060.001
20000.6220.5680.05011.5070.012constant0.1460.0216.9460.000
x0.8420.2483.3920.012
20100.6880.5840.0786.6130.082constant0.1850.0424.4510.021
x0.5880.2292.5720.087
20200.6220.5680.05511.5220.012constant0.1590.0227.2050.000
x0.4610.136−3.3940.012
Table 6. 1990–2020 Ecological land, construction land and the variable coefficient of ecological resilience.
TimeTypes of
Urbanization
Proportion of
Ecological Land
Proportion of
Construction Land
Variable Coefficient
1990Slow speed53.520.430.07
Normal speed65.081.470.11
Medium speed56.731.850.15
High speed56.773.030.18
Ultra-high speed48.6610.160.25
2000Slow speed52.780.440.07
Normal speed64.601.540.15
Medium speed55.632.030.19
High speed56.563.340.24
Ultra-high speed47.0821.470.30
2010Slow speed51.510.580.09
Normal speed64.541.650.18
Medium speed55.112.360.24
High speed56.094.290.29
Ultra-high speed39.2940.300.41
2020Slow speed51.900.640.07
Normal speed64.141.860.15
Medium speed55.722.700.21
High speed56.075.000.25
Ultra-high speed37.8142.100.33
Disclaimer/Publisher’s Note: The statements, opinions and data contained in all publications are solely those of the individual author(s) and contributor(s) and not of MDPI and/or the editor(s). MDPI and/or the editor(s) disclaim responsibility for any injury to people or property resulting from any ideas, methods, instructions or products referred to in the content.

