
Threats in Water–Energy–Food–Land Nexus by the 2022 Military and Economic Conflict

 , ,
, ,  and
and 
Abstract
:1. Introduction
1.1. The Role of Water–Energy–Food–Land Nexus and Clustering to Prosperity
1.2. The Elements of War
The tribe mentality always results in a dichotomy of an ‘us’ vs. a ‘them’ and engenders a latent fear of the ‘other’ whose culture is at odds with, or at least different from, one’s own. This fear, coupled with a desire to expand, or protect, necessary resources, often results in war.
2. Methodology
- The correlation of energy consumption with gross domestic product (GDP) per capita and life expectancy is our first indicator. The bulk of the extant literature has assumed a causal relationship between energy consumption and GDP and life expectancy [38,39,40,41,42,43,44,45,46]. By another viewpoint, economics dominated by the narrative of ecology [47] question the role between energy and prosperity [48,49,50,51,52,53]. However, in our approach, using recently available data (2022), we find correlations that yield clear trends. Using them as indicators, we estimate the effect of energy consumption changes in GDP per capita and life expectancy.
- The archetypical measure of wealth is not gold, silver or money. As wheat is the base element of the digestive menu of humans, an acceptable method to evaluate real wealth is by the estimation of the wheat wages (i.e., the liters of wheat that can be bought by a daily wage) [6,54,55,56,57,58,59,60,61,62]. This allows us to create an important comparison of economic wellbeing. The prices of wheat in countries’ markets differ from the prices of global markets; however, by assuming that local retail prices are double the global wholesale ones, we find an indicative relation of wheat wages based on the average GDP per capita. With this method we evaluate the effect on real wages according to the alterations of wheat prices.
- In an attempt to assess whether current Western policies incorporate rationality, by using publicly available data, we evaluate the limitations and the strategies that are presented as a defense of the availability of the WEF nexus (fertilizers and novel installation of renewable-energy infrastructures).
- Clustering is a method of growth and is supported by large-scale infrastructures. Partitioning is a method of protection and can be applied to many different threats such as viruses (social distancing), wars, and wildfires [2,63]. Using satellite images and publicly available data, we evaluate by Climacogram Integral the evolution of spatial clustering in Europe (1990–2010) using Hurst–Kolmogorov dynamics [2,64,65,66,67,68,69,70,71]. Urbanization is reflected in the increasing trend of cities’ clustering, which we have observe lately. This leads to a transformation of social structures, guiding people far from the WEF nexus, making societies vulnerable to WEF nexus limitations.
3. Russia’s Special Military Operation in Ukraine 2022
3.1. The Cause of Rurssia’s SPO
3.2. The Demolition of Supply Chain
4. Evaluating the Limitation of Energy and the Rally of Food Prices
4.1. Energy
4.2. Food
5. The Acceleration of “Green Growth” as a Defensive Method of West
Richer people care about “the environment”–which is, after all, outside the primary and fundamental concern of those desperate for their next meal.
5.1. Fertilizers
5.2. Energy
6. Clustering Conflicts of Land Use
7. Discussion
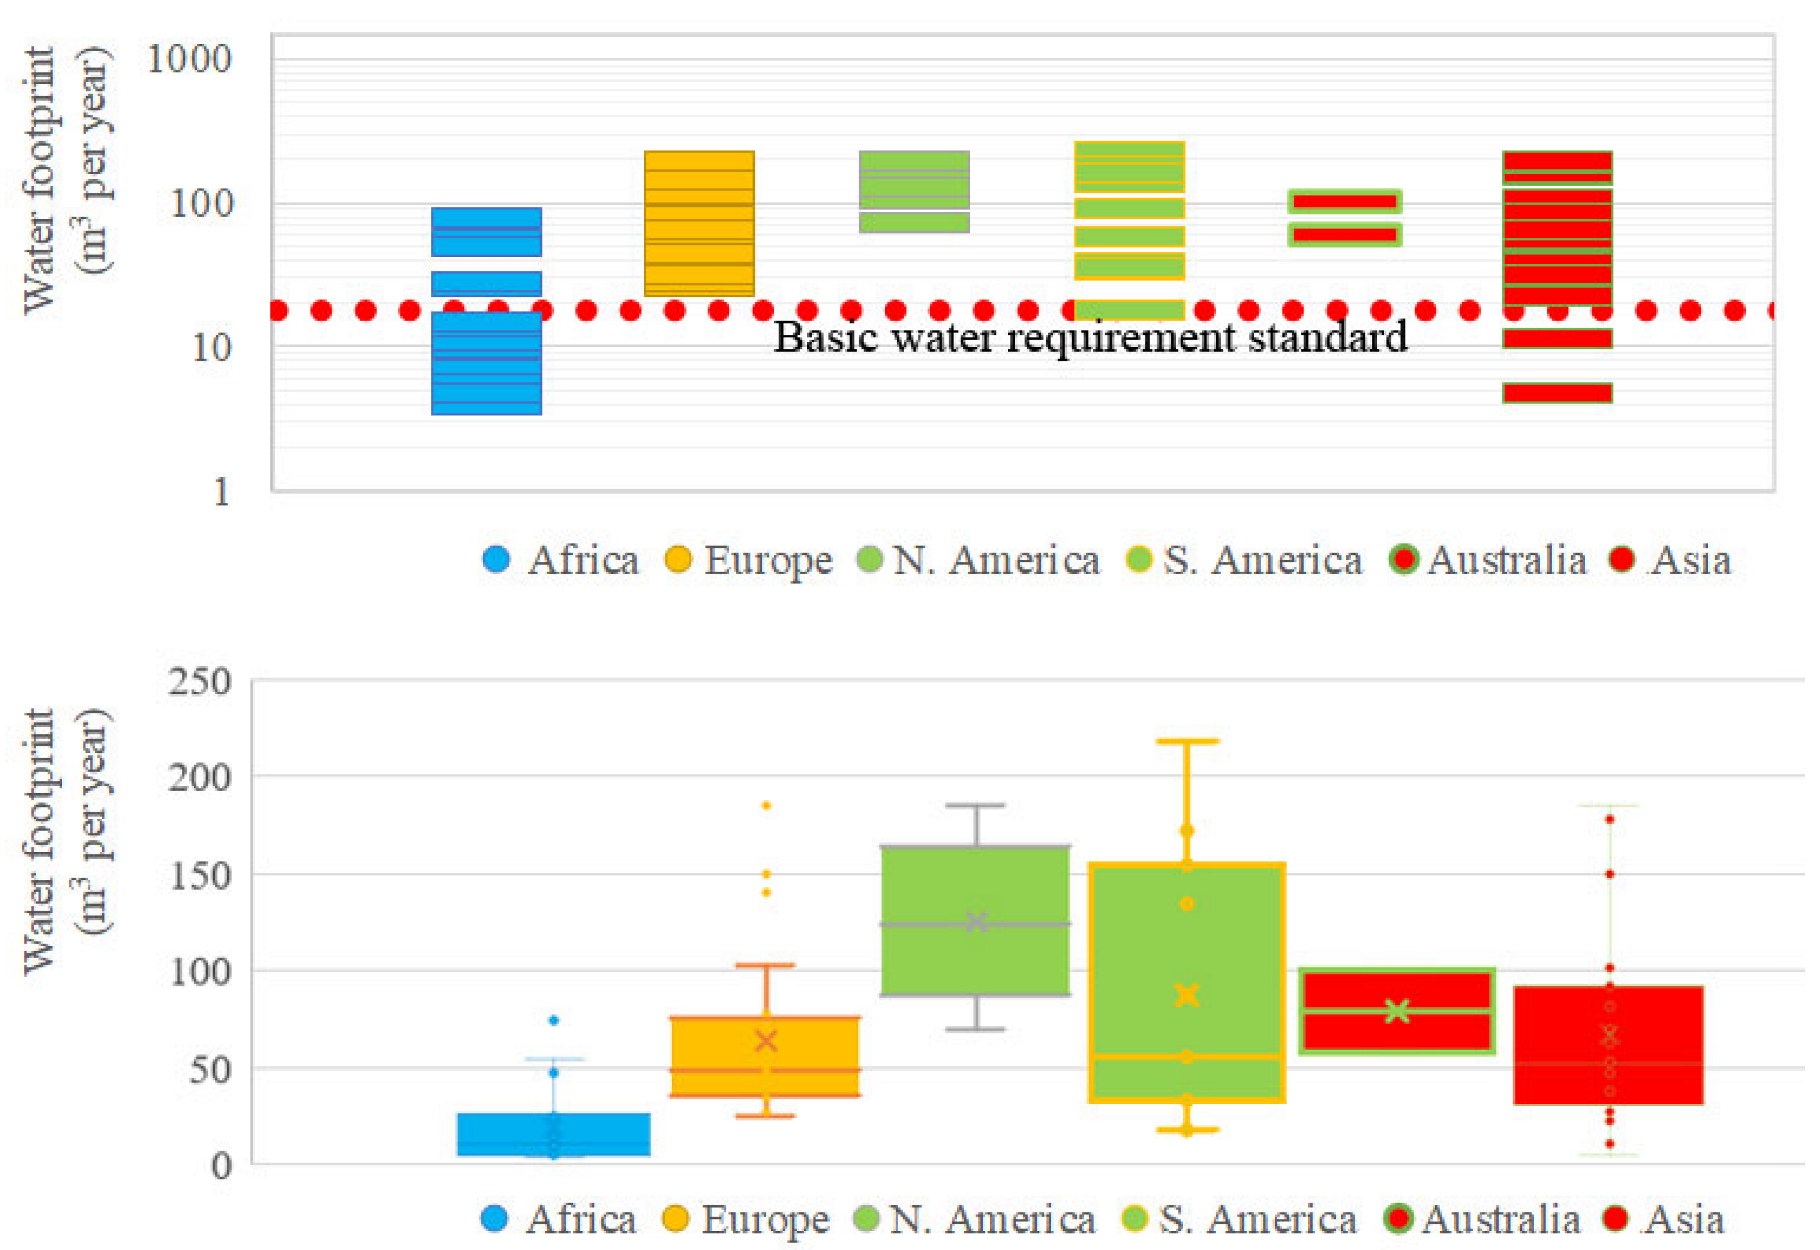
The water supply and sanitation facility for each person must be continuous and sufficient for personal and domestic uses. These uses ordinarily include drinking, personal sanitation, washing of clothes, food preparation and personal and household hygiene. According to the World Health Organization (WHO), between 50 and 100 litres of water per person per day are needed to ensure that most basic needs are met and few health concerns arise.

8. Conclusions
While human social clustering increases the chances for social progress and prosperity, it also increases exposure and vulnerability to different kinds of risk. For the first time in human history more people live in cities than in rural areas. This rapid growth in the number of people living in cities and urban landscapes is increasing the world’s susceptibility to natural disasters and other threats.
… the most ill-conceived and counterproductive policy in recent international history.
The Collective West Self-Justification Show staged to obliterate its ritualized suicide offers no hint of transcending sacrifice implied in a ceremonial seppuku. All they do is to wallow in the adamant refusal to admit they could be seriously mistaken.
Author Contributions
Funding
Data Availability Statement
Acknowledgments
Conflicts of Interest
References
- Sargentis, G.-F.; Siamparina, P.; Sakki, G.-K.; Efstratiadis, A.; Chiotinis, M.; Koutsoyiannis, D. Agricultural Land or Photovoltaic Parks? The Water–Energy–Food Nexus and Land Development Perspectives in the Thessaly Plain, Greece. Sustainability 2021, 13, 8935. [Google Scholar] [CrossRef]
- Sargentis, G.-F.; Iliopoulou, T.; Sigourou, S.; Dimitriadis, P.; Koutsoyiannis, D. Evolution of Clustering Quantified by a Stochastic Method—Case Studies on Natural and Human Social Structures. Sustainability 2020, 12, 7972. [Google Scholar] [CrossRef]
- Sargentis, G.-F.; Iliopoulou, T.; Dimitriadis, P.; Mamassis, N.; Koutsoyiannis, D. Stratification: An Entropic View of Society’s Structure. World 2021, 2, 153–174. [Google Scholar] [CrossRef]
- Braund, D. Black Sea Grain for Athens? From Herodotus to Demosthenes. Black SeaAntiq. Reg. Interreg. Econ. Exch. 2007, 6, 39. Available online: https://antikmuseet.au.dk/fileadmin/www.antikmuseet.au.dk/Pontosfiler/BSS_6/BSS6_03_braund.pdf (accessed on 13 February 2022).
- Garnsey, P. Grain for Athens. Hist. Political Thought 1985, 6, 62–75. [Google Scholar]
- Sargentis, G.-F.; Defteraios, P.; Lagaros, N.D.; Mamassis, N. Values and Costs in History: A Case Study on Estimating the Cost of Hadrianic Aqueduct’s Construction. World 2022, 3, 260–286. [Google Scholar] [CrossRef]
- Chatzimpiros, P.; Lagos, G.; Sargentis, G.-F. Man and City, Myth and Vision. In Proceedings of the 10th International Conference on Environmental Science and Technology, Kos Island, Greece, 5–7 September 2007. [Google Scholar] [CrossRef]
- WEF Background. Available online: www.water-energy-food.org/mission (accessed on 25 July 2022).
- IRENA. Global Energy Transformation: A Roadmap to 2050. 2019. Available online: https://www.irena.org/publications/2019/Apr/Global-energy-transformation-A-roadmap-to-2050-2019Edition (accessed on 25 July 2022).
- Koutsoyiannis, D.; Makropoulos, C.; Langousis, A.; Baki, S.; Efstratiadis, A.; Christofides, A.; Karavokiros, G.; Mamassis, N. HESS Opinions: “Climate, hydrology, energy, water: Recognizing uncertainty and seeking sustainability”. Hydrol. Earth Syst. Sci. 2009, 13, 247–257. [Google Scholar] [CrossRef]
- Zhang, C.; Chen, X.; Li, Y.; Ding, W.; Fu, G. Water-energy-food nexus: Concepts, questions and methodologies. J. Clean. Prod. 2018, 195, 625–639. [Google Scholar] [CrossRef]
- WEF (World Economic Forum). Global Risks 2011, Sixth Edition: An Initiative of the Risk Response Network. 2011. Available online: http://reports.weforum.org/global-risks-2011/ (accessed on 27 June 2021).
- Food and Agriculture of the United Nations. The Water-Energy-Food Nexus. A New Approach in Support of Food Security and Sustainable Agriculture. 2014. Available online: http://www.fao.org/3/bl496e/bl496e.pdf (accessed on 27 June 2021).
- Leck, H.; Conway, D.; Bradshaw, M.; Rees, J.A. Tracing the Water–Energy–Food Nexus: Description, Theory and Practice. Geogr. Compass 2015, 9, 445–460. [Google Scholar] [CrossRef]
- Yang, J.; Yamazaki, A. Water and Energy Nexus: A Literature Review. Water West, Stanford University, 1, 146. 2013. Available online: https://waterinthewest.stanford.edu/sites/default/files/Water-Energy_Lit_Review_0.pdf (accessed on 27 June 2021).
- Chang, Y.; Li, G.; Yao, Y.; Zhang, L.; Yu, C. Quantifying the Water-Energy-Food Nexus: Current Status and Trends. Energies 2016, 9, 65. [Google Scholar] [CrossRef]
- Endo, A.; Tsurita, I.; Burnett, K.; Orencio, P.M. A review of the current state of research on the water, energy, and food nexus. J. Hydrol. Reg. Stud. 2017, 11, 20–30. [Google Scholar] [CrossRef] [Green Version]
- WEF Nexus Index. Available online: https://wefnexusindex.org/ (accessed on 27 June 2021).
- Albrecht, T.R.; Crootof, A.; Scott, C.A. The Water-Energy-Food Nexus: A systematic review of methods for nexus assessment. Environ. Res. Lett. 2018, 13, 043002. [Google Scholar] [CrossRef]
- Michel, J.-B.; Shen, Y.K.; Aiden, A.P.; Veres, A.; Gray, M.K.; Pickett, J.P.; Hoiberg, D.; Clancy, D.; Norvig, P.; Orwant, J.; et al. Quantitative Analysis of Culture Using Millions of Digitized Books. Science 2011, 331, 176–182. [Google Scholar] [CrossRef]
- Google Books. Data Retrieved on 2022.02.17. Available online: https://books.google.com/ngrams/ (accessed on 25 July 2022).
- Scopus. Data Retrieved on 2022.02.17. Available online: https://www.scopus.com/ (accessed on 25 July 2022).
- Michael, D.; Sockol, D.; Raichlen, A.; Herman, P. Chimpanzee locomotor energetics and the origin of human bipedalism. Proc. Natl. Acad. Sci. USA 2007, 104, 12265–12269. [Google Scholar]
- Boyer, D.M.; Harrington, A.R. Scaling of bony canals for encephalic vessels in euarchontans: Implications for the role of the vertebral artery and brain metabolism. J. Hum. Evol. 2018, 114, 85–101. [Google Scholar] [CrossRef]
- Von Clausewitz, C. On War; Princeton University Press: Princeton, NJ, USA, 2008. [Google Scholar] [CrossRef]
- Dalio, R. Principles for Dealing with the Changing World Order; Simon & Schuster, Inc.: New York, NY, USA, 2021; ISBN 978-1-9821-6027-2. [Google Scholar]
- Kelsay, J. Islam and War: A Study in Comparative Ethics; Westminster John Knox Press: Loulsville, KY, USA, 1993; Available online: https://books.google.gr/books?hl=en&lr=&id=f4gOh1keuUkC&oi (accessed on 25 July 2022).
- Martin, D. Does Christianity Cause War? Regent College Publishing: Vancouver, BC, Canada, 1997; Available online: https://books.google.gr/books?hl=en&lr=&id=-xT84chEU0IC&oi=fnd&pg (accessed on 25 July 2022).
- Van Evera, S. Causes of War. In Power and the Roots of Conflict; Cornell University Press: London, UK, 1999; Available online: https://books.google.gr/books?hl=en&lr=&id=i08gUtnQFm0C&oi=fnd&pg (accessed on 25 July 2022).
- Stergiou, A.; Karagianni, M. Does Energy Cause Ethnic War?: East Mediterranean and Caspian Sea Natural Gas and Regional Conflicts; Cambridge Scholars Publishing: Newcastle, Australia, 2019. [Google Scholar]
- Andrews, E. 6 Wars Fought for Ridiculous Reasons. Available online: https://www.history.com/news/6-wars-fought-for-ridiculous-reasons (accessed on 25 July 2022).
- Mark, J.J. War in Ancient Times, World History Encyclopedia. 2009. Available online: https://www.worldhistory.org/war/ (accessed on 25 July 2022).
- Evans, M. The Continental School of Strategy: The Past, Present and Future of Land Power; Land Warfare Studies Centre: Duntroon, Australia, 2004. Available online: https://researchcentre.army.gov.au/sites/default/files/sp305_continental_school_of_strategy-michael_evans.pdf (accessed on 25 July 2022).
- Prendergast, J.; Bickel, S.; Walgren, J. Scorched-Earth War. Afr. Rep. 1994, 39, 37. Available online: https://link.gale.com/apps/doc/A16009574/AONE?u=anon~1e4da592&sid=googleScholar&xid=37fcadfc (accessed on 25 July 2022).
- Kreike, E. Scorched Earth. In Environmental Warfare as a Crime against Humanity and Nature; Princeton University Press: Prinnceton, NJ, USA, 2021. [Google Scholar] [CrossRef]
- Kern, P.B. Ancient Siege Warfare; Indiana University Press: Bloomington, IN, USA, 1999. [Google Scholar]
- Bradbury, J. The Medieval Siege; The Boydell Press: Rochester, NY, USA, 1992. [Google Scholar]
- Cleveland, C.J.; Costanza, R.; Hall, C.A.S.; Kaufmann, R. Energy and the U.S. Economy: A Biophysical Perspective. Science 1984, 225, 890–897. [Google Scholar] [CrossRef]
- Ostwald, W. Energetische Grundlagen der Kulturwissenschaft; Creative Media Partners, LLC.: Sacramento, CA, USA, 2015. [Google Scholar]
- Oh, W.; Lee, K. Causal relationship between energy consumption and GDP revisited: The case of Korea 1970–1999. Energy Econ. 2004, 26, 51–59. [Google Scholar] [CrossRef]
- Yang, H.-Y. A note on the causal relationship between energy and GDP in Taiwan. Energy Econ. 2000, 22, 309–317. [Google Scholar] [CrossRef]
- Griffin, J.M.; Gregory, P.R. An intercountry translog model of energy substitution responses. Am. Econ. Rev. 1976, 66, 845–857. [Google Scholar]
- Berndt, E.R.; Wood, D.O. Engineering and economic interpretation of energy-capital complementarity. Am. Econ. Rev. 1979, 69, 343–354. [Google Scholar]
- Berndt, E.R. Energy use, technical progress and productivity growth: A survey of economic issues. J. Prod. Anal. 1990, 2, 67–83. [Google Scholar] [CrossRef]
- Kraft, J.; Kraft, A. On the relationship between energy and GNP. J. Energy Dev. 1978, 3, 401–403. Available online: https://www.jstor.org/stable/24806805 (accessed on 25 July 2022).
- Soytas, U.; Sari, R. Energy consumption and GDP: Causality relationship in G-7 countries and emerging markets. Energy Econ. 2003, 25, 33–37. [Google Scholar] [CrossRef]
- Payne, J.E. Survey of the international evidence on the causal relationship between energy consumption and growth. J. Econ. Stud. 2010, 37, 53–95. [Google Scholar] [CrossRef]
- Narayan, P.K.; Narayan, S.; Popp, S. A note on the long-run elasticities from the energy consumption–GDP relationship. Appl. Energy 2010, 87, 1054–1057. [Google Scholar] [CrossRef]
- Stern, D.I. Economic growth and energy. In Encyclopedia of Energy; Cleveland, C.J., Ed.; Elsevier: Amsterdam, The Netherlands, 2004; Volume 2, pp. 35–51. [Google Scholar]
- Al-Iriani, M.A. Energy–GDP relationship revisited: An example from GCC countries using panel causality. Energy Policy 2006, 34, 3342–3350. [Google Scholar] [CrossRef]
- Lee, C.-C. The causality relationship between energy consumption and GDP in G-11 countries revisited. Energy Policy 2006, 34, 1086–1093. [Google Scholar] [CrossRef]
- Huang, B.-N.; Hwang, M.; Yang, C. Causal relationship between energy consumption and GDP growth revisited: A dynamic panel data approach. Ecol. Econ. 2008, 67, 41–54. [Google Scholar] [CrossRef]
- Mazur, A. Does increasing energy or electricity consumption improve quality of life in industrial nations? Energy Policy 2011, 39, 2568–2572. [Google Scholar] [CrossRef]
- Van Wees, H. Mass and elite in solon’s athens: The property classes revisited. In The Book: Solon of Athens; Blok, J., Lardinois, A., Eds.; Brill: Leiden, The Netherlands, 2006. [Google Scholar] [CrossRef]
- Scheidel, W. Real Wages in Early Economies: Evidence for Living Standards from 1800 BCE to 1300 CE. J. Econ. Soc. Hist. Orient 2010, 53, 425–462. [Google Scholar] [CrossRef]
- Milanovic, B.; Lindert, P.; Williamson, J. Measuring Ancient Inequality. In NBER Working Paper; Working Paper No. 13550 October 2007 JEL No. D3, N3, O1; National Bureau of Economic Research: Cambridge, MA, USA, 50 October. [CrossRef]
- Jursa, M. Aspects of the Economic History of Babylonia in the First Millennium BC; Ugarit-Verlag: Münster, Germany, 2010. [Google Scholar]
- Loomis, W. Wages, Welfare Costs and Inflation in Classical Athens; University of Michigan Press: Chicago, IL, USA, 1998. [Google Scholar] [CrossRef]
- International Institute of Social History. Value of the Guilder versus Euro. A Comparison of the Purchasing Power of the Guilder from the Year 1450 to Another Year. Available online: https://iisg.amsterdam/en/research/projects/hpw/calculate.php#Europe (accessed on 25 January 2022).
- Milanovic, B. An estimate of average income and inequality in byzantium around year 1000. Rev. Income Wealth 2006, 52, 449–470. [Google Scholar] [CrossRef]
- Van Zanden, J.L. Wages and the standard of living in Europe, 1500–1800. Eur. Rev. Econ. Hist. 1999, 3, 175–197. [Google Scholar] [CrossRef]
- Malanima, P. When did England overtake Italy? Medieval and early modern divergence in prices and wages. Eur. Rev. Econ. Hist. 2013, 17, 45–70. [Google Scholar] [CrossRef]
- Sargentis, G.-F.; Ioannidis, R.; Bairaktaris, I.; Frangedaki, E.; Dimitriadis, P.; Iliopoulou, T.; Koutsoyiannis, D.; Lagaros, N.D. Wildfires vs. Sustainable Forest Partitioning. Conservation 2022, 2, 195–218. [Google Scholar] [CrossRef]
- Sargentis, G.-F.; Dimitriadis, P.; Iliopoulou, T.; Koutsoyiannis, D. A Stochastic View of Varying Styles in Art Paintings. Heritage 2021, 4, 333–348. [Google Scholar] [CrossRef]
- Dimitriadis, P.; Iliopoulou, T.; Sargentis, G.-F.; Koutsoyiannis, D. Spatial Hurst–Kolmogorov Clustering. Encyclopedia 2021, 1, 1010–1025. [Google Scholar] [CrossRef]
- Sargentis, G.-F.; Ioannidis, R.; Iliopoulou, T.; Dimitriadis, P.; Koutsoyiannis, D. Landscape Planning of Infrastructure through Focus Points’ Clustering Analysis. Case Study: Plastiras Artificial Lake (Greece). Infrastructures 2021, 6, 12. [Google Scholar] [CrossRef]
- Sargentis, G.-F.; Dimitriadis, P.; Koutsoyiannis, D. Aesthetical Issues of Leonardo Da Vinci’s and Pablo Picasso’s Paintings with Stochastic Evaluation. Heritage 2020, 3, 283–305. [Google Scholar] [CrossRef]
- Sargentis, G.-F.; Dimitriadis, P.; Ioannidis, R.; Iliopoulou, T.; Koutsoyiannis, D. Stochastic Evaluation of Landscapes Transformed by Renewable Energy Installations and Civil Works. Energies 2019, 12, 2817. [Google Scholar] [CrossRef]
- Sargentis, G.-F.; Ioannidis, R.; Chiotinis, M.; Dimitriadis, P.; Koutsoyiannis, D. Aesthetical Issues with Stochastic Evaluation. In Data Analytics for Cultural Heritage; Belhi, A., Bouras, A., Al-Ali, A.K., Sadka, A.H., Eds.; Springer: Cham, Switzerland, 2021; pp. 173–193. [Google Scholar] [CrossRef]
- Sargentis, G.-F.; Dimitriadis, P.; Iliopoulou, T.; Ioannidis, R.; Koutsoyiannis, D. EGU2018-17740-1; Stochastic investigation of the Hurst-Kolmogorov behaviour in arts, European Geosciences Union General Assembly 2018, Geophysical Research Abstracts; European Geosciences Union: Vienna, Austria, 2018; Volume 20. [Google Scholar]
- Dimitriadis, P. Hurst-Kolmogorov dynamics in hydrometeorological processes and in the microscale of turbulence. Ph.D. Thesis, National Technical University of Athens, Athens, Greece, 2017. [Google Scholar]
- Sargentis, G.-F.; Koutsoyiannis, D.; Angelakis, A.; Christy, J.; Tsonis, A.A. Environmental Determinism vs. Social Dynamics: Prehistorical and Historical Examples. World 2022, 3, 357–388. [Google Scholar] [CrossRef]
- Kirby, P. Why Has Russia Invaded Ukraine and What Does Putin Want? BBC. 9 May 2022. Available online: https://www.bbc.com/news/world-europe-56720589 (accessed on 25 July 2022).
- Address by the President of the Russian Federation Vladimir Putin. 24 February 2022, 06:00 The Kremlin, Moscow. Available online: http://en.kremlin.ru/events/president/news/67843 (accessed on 25 July 2022).
- Clark, C. The Sleepwalkers: How Europe Went to War in 1914. Penguin Books. Available online: https://books.google.gr/books?hl=en&lr=&id=unxCQH3LKBcC&oi (accessed on 13 February 2022).
- The Heavy Price of Santiago’s Privatised Water. Available online: https://www.theguardian.com/sustainable-business/2016/sep/15/chile-santiago-water-supply-drought-climate-change-privatisation-neoliberalism-human-right (accessed on 25 July 2022).
- Burch, D.; Clapp, J.; Murphy, S. Cereal Secrets: The World’s Largest Grain TRaders and Global Agriculture. Oxfam 2012. Available online: https://oxfamilibrary.openrepository.com/bitstream/10546/237131/10/rr-cereal-secrets-grain-traders-agriculture-30082012-en.pdf (accessed on 13 February 2022).
- The Big 4 of Agriculture Unlikely to Exit Russia Despite Mounting Pressure. Available online: https://www.spglobal.com/commodityinsights/en/market-insights/blogs/agriculture/041922-russia-ukraine-war-food-adm-bunge-cargill-louis-dreyfus (accessed on 13 February 2022).
- Latschan, T. Ukraine: No Smooth Sailing for GRain via the Black Sea. DW. 13 August 2022. Available online: https://www.dw.com/en/ukraine-no-smooth-sailing-for-grain-via-the-black-sea/a-62799432 (accessed on 13 February 2022).
- Kammer, A.; Azour, J.; Selassie, A.A.; Goldfajn, I.; Rhee, C. How War in Ukraine Is Reverberating Across World’s Regions. 15 March 2022. Available online: https://blogs.imf.org/2022/03/15/how-war-in-ukraine-is-reverberating-across-worlds-regions/ (accessed on 13 February 2022).
- Borrel, J. Russia’s Invasion of Ukraine Puts the Global Economy at Risk. 16 May 2022. Available online: https://www.eeas.europa.eu/eeas/russia%E2%80%99s-invasion-ukraine-puts-global-economy-risk_en (accessed on 25 July 2022).
- International Monetary Fund. IMF DATA. Access to Macroeconomic and Financial Data. Available online: https://data.imf.org/ (accessed on 25 July 2022).
- EIA. U.S. Energy Information Administration. Available online: http://www.eia.gov/dnav/pet/pet_pri_spt_s1_m.htm (accessed on 25 July 2022).
- Tzu, S. The Art of War. Allanndale Online Publishing, Leicester LE2 1WS, England. 2000. Available online: https://sites.ualberta.ca/~enoch/Readings/The_Art_Of_War.pdf (accessed on 25 July 2022).
- United Nations. Global Impact of the War in Ukraine: Billions of People Face the Greatest Cost-of-Living Crisis in a Generation. 8 June 2022. Available online: https://news.un.org/pages/wp-content/uploads/2022/06/GCRG_2nd-Brief_Jun8_2022_FINAL.pdf (accessed on 25 July 2022).
- Guterres, A.; Secretary-General of United Nations. Act Now to End Food, Energy and Finance Crisis, Guterres Urges World Leaders. Available online: https://news.un.org/en/story/2022/06/1119962 (accessed on 25 July 2022).
- In the Ukraine War, a Battle for the Nation’s Mineral and Energy Wealth. Available online: https://www.washingtonpost.com/world/2022/08/10/ukraine-russia-energy-mineral-wealth/ (accessed on 13 February 2022).
- Praseeda, K.I.; Reddy, B.V.V.; Mani, M. Life-Cycle Energy Assessment in Buildings: Framework, Approaches, and Case Studies; Abraham, M.A., Ed.; Encyclopedia of Sustainable Technologies; Elsevier: Amsterdam, The Netherlands, 2017; pp. 113–136. ISBN 9780128047927. [Google Scholar] [CrossRef]
- Tam, V.W.Y.; Le, K.N. (Eds.) Chapter 5—Life Cycle Energy Consumption of Buildings; Embodied + Operational; Sustainable Construction Technologies; Butterworth-Heinemann: Oxford, UK, 2019; pp. 123–144. ISBN 9780128117491. [Google Scholar] [CrossRef]
- Dixit, M.K.; Fernández-Solís, J.L.; Lavy, S.; Culp, C.H. Identification of parameters for embodied energy measurement: A literature review. Energy Build. 2010, 42, 1238–1247. [Google Scholar] [CrossRef]
- Perryman, M.E.; Schramski, J.R. Evaluating the relationship between natural resource management and agriculture using embodied energy and eco-exergy analyses: A comparative study of nine countries. Ecol. Complex. 2015, 22, 152–161. [Google Scholar] [CrossRef]
- Smith, A.B. Ancient and Traditional Agriculture, Pastoralism, and Agricultural Societies in Sub-Saharan Africa. Oxf. Res. Encycl. Environ. Sci. 2019. [Google Scholar] [CrossRef]
- Jiang, Y.; Zhang, Q.; Niu, J.; Wu, J. Pastoral Population Growth and Land Use Policy Has Significantly Impacted Livestock Structure in Inner Mongolia—A Case Study in the Xilinhot Region. Sustainability 2019, 11, 7208. [Google Scholar] [CrossRef]
- Davis, J.; Hatfield, R. The economics of mobile pastoralism: A global summary. Nomadic Peoples 2007, 11, 91–116. Available online: http://www.jstor.org/stable/43123794 (accessed on 25 July 2022). [CrossRef]
- Coughenour, M.B.; Ellis, J.E.; Swift, D.M.; Coppock, D.L.; Galvin, K.; McCabe, J.T.; Hart, T.C. Energy Extraction and Use in a Nomadic Pastoral Ecosystem. Science 1985, 230, 619–625. [Google Scholar] [CrossRef]
- Smil, V. Conversion of Energy: People and Animals. In Cleveland, Encyclopedia of Energy; Cutler, J., Ed.; Elsevier: Amsterdam, The Netherlands, 2004; pp. 697–705. ISBN 9780121764807. [Google Scholar] [CrossRef]
- Smil, V. World history and energy. Encycl. Energy 2004, 6, 549. [Google Scholar]
- Singh, H.; Mishra, D.; Nahar, N. Energy use pattern in production agriculture of a typical village in arid zone, India––part I. Energy Convers. Manag. 2002, 43, 2275–2286. [Google Scholar] [CrossRef]
- Canakci, M.; Topakci, M.; Akinci, I.; Ozmerzi, A. Energy use pattern of some field crops and vegetable production: Case study for Antalya Region, Turkey. Energy Convers. Manag. 2005, 46, 655–666. [Google Scholar] [CrossRef]
- Kander, A.; Warde, P. Energy Availability from Livestock and Agricultural Productivity in Europe, 1815–1913: A New Comparison. Econ. Hist. Rev. 2011, 64, 1–29. Available online: http://www.jstor.org/stable/27919479 (accessed on 30 November 2020). [CrossRef] [PubMed]
- Schnepf, R. Energy Use in Agriculture: Background and Issues, CRS Report for Congress, Received through the CRS Web. 2004. Available online: https://nationalaglawcenter.org/wp-content/uploads/assets/crs/RL32677.pdf (accessed on 5 October 2020).
- Jean-Richard, V.; Crump, L.; Abicho, A.A.; Abakar, A.A.; Ii, A.M.; Béchir, M.; Eckert, S.; Engesser, M.; Schelling, E.; Zinsstag, J. Estimating population and livestock density of mobile pastoralists and sedentary settlements in the south-eastern Lake Chad area. Geospat. Health 2015, 10, 307. [Google Scholar] [CrossRef] [PubMed]
- Household Energy Price Index. Available online: https://www.energypriceindex.com/ (accessed on 25 July 2022).
- Google Finance. Euro to Dollars. Available online: https://www.google.com/finance/quote/EUR-USD?window=5Y (accessed on 25 July 2022).
- Ivanova, I. Russia’s Ruble Is the Strongest Currency in the World This Year. CBS NEWS 28 June 2022. Available online: https://www.cbsnews.com/news/russia-ukraine-ruble-currency-russian-economy-sanctioms-2022/ (accessed on 25 July 2022).
- Our. World in Data. Energy. Available online: https://github.com/owid/energy-data (accessed on 25 July 2022).
- Save Gas for a Safe Winter: Commission Proposes Gas Demand Reduction Plan to Prepare EU for Supply Cuts. Available online: https://ec.europa.eu/commission/presscorner/detail/en/ip_22_4608 (accessed on 25 July 2022).
- Maddison Project Database 2020. Available online: https://www.rug.nl/ggdc/historicaldevelopment/maddison/releases/maddison-project-database-2020 (accessed on 25 July 2022).
- Wheat Production by Country 2022. Available online: https://worldpopulationreview.com/country-rankings/wheat-production-by-country (accessed on 25 July 2022).
- Ukraine Produced a Lot of Grain—Can Farmers Elsewhere Replace the Crops Lost to War? Available online: https://theconversation.com/ukraine-produced-a-lot-of-grain-can-farmers-elsewhere-replace-the-crops-lost-to-war-180380# (accessed on 25 July 2022).
- FAQs: Global Poverty Line Update. Available online: https://www.worldbank.org/en/topic/poverty/brief/global-poverty-line-faq# (accessed on 25 July 2022).
- Rohwerder, B. Poverty and Inequality: Topic Guide. Birmingham, UK: GSDRC, University of Birmingham. 2016. Available online: https://gsdrc.org/topic-guides/poverty-and-inequality/ (accessed on 25 July 2022).
- Ravallion, Μ. Poverty Comparisons: A Guide to Concepts and Methods, The World Bank. 1992. Available online: https://documents1.worldbank.org/curated/en/290531468766493135/pdf/multi-page.pdf (accessed on 25 July 2022).
- COVID-19 to Add as Many as 150 Million Extreme Poor by 2021. Available online: https://www.worldbank.org/en/news/press-release/2020/10/07/covid-19-to-add-as-many-as-150-million-extreme-poor-by-2021 (accessed on 25 July 2022).
- The Coming Food Catastrophe. The Economist. 19 May 2022. Available online: https://www.economist.com/leaders/2022/05/19/the-coming-food-catastrophe (accessed on 25 July 2022).
- Income Mountains. Available online: https://www.gapminder.org/fw/income-mountains/ (accessed on 25 July 2022).
- Malthus, T.R. An Essay on the Principle of Population; J. Johnson: London, UK, 1798. [Google Scholar]
- Meadows, D.H.; Meadows, D.L.; Randers, J.; Behrens, W.W., III. The Limits to Growth, A Report for the CLUB OF ROME’S Project of the Predicament of Mankind, Universe Books. 1972. Available online: http://www.donellameadows.org/wp-content/userfiles/Limits-to-Growth-digital-scan-version.pdf (accessed on 5 June 2021).
- Ehrlich, P.R. The Population Bomb; Sierra Club/Ballantine Books: New York, NY, USA, 1968. [Google Scholar]
- Jackson, T. Prosperity without Growth? The Transition to a Sustianable Economy, UK Govement, Sustainable Development Commission. March 2009. Available online: http://www.sd-commission.org.uk/data/files/publications/prosperity_without_growth_report.pdf (accessed on 13 February 2022).
- Latouche, S. The Path to Degrowth for a Sustainable Society. In Factor X. Eco-Efficiency in Industry and Science; Lehmann, H., Ed.; Springer: Cham, Switzerland, 2018; Volume 32. [Google Scholar] [CrossRef]
- Latouche, S. Degrowth Economics. Le Monde Diplomatique. 2004. Available online: https://www.jussemper.org/Resources/Economic%20Data/Resources/Degrowth%20economics,%20by%20Serge%20Latouche.pdf (accessed on 13 February 2022).
- Agenda 21. United Nations Conference on Environment & Development Rio de Janerio, Brazil. 3–14 June 1992. Available online: https://sustainabledevelopment.un.org/content/documents/Agenda21.pdf (accessed on 13 February 2022).
- United Nations. Sustainable Development Goals. Available online: https://www.un.org/sustainabledevelopment/ (accessed on 13 February 2022).
- Constable, J. Europe’s Green Experiment. A Costly Failure in Unilateral Climate Policy. The Global Warming Policy Foundation, Report 52. 2022. Available online: https://www.thegwpf.org/content/uploads/2022/08/EU-Climate-Policy-Failure.pdf (accessed on 13 February 2022).
- Barmby, R. Trudeau’s Irrational and Immoral Emissions Plan Will Have Dire Results. ClimateChangeDispach, 11 August 2022. Available online: https://climatechangedispatch.com/trudeaus-irrational-and-immoral-emissions-plan-will-have-dire-results/ (accessed on 13 February 2022).
- Peterson, J. Peddlers of Environmental Doom Have Shown Their True Totalitarian Colours. The Telegraph 15 August 2022. Available online: https://www.telegraph.co.uk/news/2022/08/15/peddlers-environmental-doom-have-shown-true-totalitarian-colours/ (accessed on 13 February 2022).
- Holligan, A. Why Dutch Farmers Are Protesting over Emissions Cuts. BBC 29 July 2022. Available online: https://www.bbc.com/news/world-europe-62335287 (accessed on 13 February 2022).
- Peltier, E.; Barry, J.Y. Protests Turn Deadly in Sierra Leone Over Rising Cost of Living. The New York Times. 15 August 2022. Available online: https://www.nytimes.com/2022/08/12/world/africa/sierra-leone-protests.html (accessed on 13 February 2022).
- Aquino, M. Peru Truckers, Farmers to Strike over Fuel, Fertilizer Costs. Reuters. 26 June 2022. Available online: https://www.reuters.com/world/americas/peru-truckers-farmers-strike-over-fuel-fertilizer-costs-2022-06-26/ (accessed on 13 February 2022).
- Stancil, K. Argentine Unions Lead Mass Demonstrations for Higher Wages, Lower Prices. Common Dreams. 18 August 2022. Available online: https://www.commondreams.org/news/2022/08/18/argentine-unions-lead-mass-demonstrations-higher-wages-lower-prices (accessed on 13 February 2022).
- Ridley, M. Eco-Extremism Has Brought Sri Lanka to Its Knees. The Telegraph. 14 July 2022. Available online: https://www.telegraph.co.uk/news/2022/07/14/eco-extremism-has-brought-sri-lanka-knees/ (accessed on 13 February 2022).
- Kmau, R. Inflation Protests Span Sri Lanka, Albania, Argentina, Panama, Kenya, Ghana—How Long Before They Hit The United States? Forbe. 11 July 2022. Available online: https://www.forbes.com/sites/rufaskamau/2022/07/11/inflation-protests-span-sri-lanka-albania-argentina-panama-kenya-ghanahow-long-before-they-hit-the-united-states/?sh=41e9ec0174c2 (accessed on 13 February 2022).
- How Much Fertilizer Do We Produce and Consume? Available online: https://ourworldindata.org/fertilizers#total-fertilizer-production-by-nutrient (accessed on 13 February 2022).
- Fertilizer Consumption (% of Fertilizer Production)—Russian Federation. Available online: https://data.worldbank.org/indicator/AG.CON.FERT.PT.ZS?locations=RU (accessed on 25 July 2022).
- Erisman, J.W.; Sutton, M.A.; Galloway, J.; Klimont, Z.; Winiwarter, W. How a century of ammonia synthesis changed the world. Nat. Geosci. 2008, 1, 636–639. [Google Scholar] [CrossRef]
- Smil, V. Enriching the Earth: Fritz Haber, Carl Bosch, and the Transformation of World Food Production; MIT Press: Cambridge, MA, USA, 2004; ISBN 9780262194495. [Google Scholar]
- Stewart, W.M.; Dibb, D.W.; Johnston, A.E.; Smyth, T.J. The Contribution of Commercial Fertilizer Nutrients to Food Production. Agron. J. 2005, 97, 1–6. [Google Scholar] [CrossRef]
- Gellings, C.W.; Parmenter, K.E. Energy efficiency in fertilizer production and use. In Efficient Use and Conservation of Energy; Gellings, C.W., Ed.; Encyclopedia of Life Support Systems; UNESCO-EOLSS A Nonprofit Global Effort: Paris, France, 2016; pp. 123–136. Available online: http://eolss.net/Sample-Chapters/C08/E3-18-04-03.pdf (accessed on 25 July 2022).
- Press Statement by President von der Leyen on the Commission’s Proposals Regarding REPowerEU, Defence Investment Gaps and the Relief and Reconstruction of Ukraine. Available online: https://ec.europa.eu/commission/presscorner/detail/en/statement_22_3164 (accessed on 25 July 2022).
- Crawford, R. Life cycle energy and greenhouse emissions analysis of wind turbines and the effect of size on energy yield. Renew. Sustain. Energy Rev. 2009, 13, 2653–2660. [Google Scholar] [CrossRef]
- Piasecka, I.; Bałdowska-Witos, P.; Piotrowska, K.; Tomporowski, A. Eco-Energetical Life Cycle Assessment of Materials and Components of Photovoltaic Power Plant. Energies 2020, 13, 1385. [Google Scholar] [CrossRef]
- Our World in Data. Renewable Energy. 2020. Available online: https://ourworldindata.org/renewable-energy (accessed on 25 July 2022).
- From Where We Import Energy? Eurostat. Available online: https://ec.europa.eu/eurostat/cache/infographs/energy/bloc-2c.html (accessed on 25 July 2022).
- Can Europe Survive Painlessly without Russian Gas? Available online: https://www.bruegel.org/2022/01/can-europe-survive-painlessly-without-russian-gas/ (accessed on 25 July 2022).
- Ioannidis, R.; Koutsoyiannis, D. A Review of Land Use, Visibility and Public Perception of Renewable Energy in the Context of Landscape Impact. Appl. Energy 2020, 276, 115367. [Google Scholar] [CrossRef]
- Denholm, P.; Hand, M.; Jackson, M.; Ong, S. Land-use requirements of modern wind power plants in the United States National Renewable Energy Laboratory. 2009. Available online: https://www.nrel.gov/docs/fy09osti/45834.pdf (accessed on 25 July 2022).
- Union of Concerned Scientists [UCS]. Environmental Impacts of Solar Power. 2013. Available online: https://www.ucsusa.org/clean_energy/our-energy-choices/renewable-energy/environmental-impacts-solar-power.html#.W-mX5-L-tPa (accessed on 25 July 2022).
- Hone, D. How to Survive Mass Extinction. The Guardian. 20 September 2022. Available online: https://www.theguardian.com/science/lost-worlds/2012/sep/20/dinosaurs-fossils (accessed on 25 July 2022).
- Sargentis, G.-F. Issues of Prosperity: Stochastic Evaluation of Data Related to Environment, Infrastructures, Economy and Society. Ph.D. Thesis, National Technical University of Athens, School of Civil Engineering, Athens, Greece, 2022. [Google Scholar] [CrossRef]
- EAT. Cities. Available online: https://eatforum.org/initiatives/cities/ (accessed on 25 July 2022).
- Unhabitat. Energy. Available online: https://unhabitat.org/topic/energy (accessed on 25 July 2022).
- Tackling Food Insecurity at the Urban Level—Turning Global Commitments into Local Realities. FAO, UN. Available online: https://www.fao.org/news/story/en/item/1181196/icode/ (accessed on 25 July 2022).
- World Bank. Urban Population (% of Total Population); The World Bank Group: Washington, DC, USA, 2019; Available online: https://data.worldbank.org/indicator/SP.URB.TOTL.in.zs (accessed on 25 July 2022).
- National Oceanic and Atmospheric Administration. National Centers for Environmental Information. Version 4 DMSP-OLS Nighttime Light Time Series. Available online: https://ngdc.noaa.gov/eog/dmsp/downloadV4composites.html (accessed on 13 February 2022).
- The World Bank. Agricultural Land. Available online: https://data.worldbank.org/indicator/AG.LND.AGRI.K2 (accessed on 25 July 2022).
- The World Bank. Population. Available online: https://data.worldbank.org/indicator/SP.POP.TOTL (accessed on 25 July 2022).
- World Bank. World Bank National Accounts Data—GDP Per Capita (Current US$). Available online: https://data.worldbank.org/indicator/NY.GDP.PCAP.CD (accessed on 25 July 2022).
- Koutsoyiannis, D.; Kundzewicz, Z.W. Atmospheric Temperature and CO2: Hen-Or-Egg Causality? Science 2020, 2, 83. [Google Scholar] [CrossRef]
- Xanthopoulos, T. Requiem with Crescendo? Homo Sapiens the Ultimate Genus of Human, Volume A; National Technical University of Athens: Athens, Greece, 2017. (In Greek) [Google Scholar]
- Xanthopoulos, T. Requiem with Crescendo? Homo Sapiens the Ultimate Genus of Human, Volume B, End of 15th Century–Beginning of 21st Century; National Technical University of Athens: Athens, Greece, 2020. (In Greek) [Google Scholar]
- Xanthopoulos, T. Requiem with Crescendo? Trapped in the Despotisms and Whirlpools of the Artificial Pangea and Panthalassa, Emancipate, Volume C, Tracking the Exit in 21st Century; National Technical University of Athens: Athens, Greece, 2020. (In Greek) [Google Scholar]
- Savropoulos, S. I Had a Dream. Available online: https://www.parapolitika.gr/skitsa/article/1202695/to-skitso-kai-to-keimeno-tou-stathi-eida-ena-oneiro/ (accessed on 13 February 2022). (In Greek).
- Sargentis, G.-F.; Ioannidis, R.; Karakatsanis, G.; Sigourou, S.; Lagaros, N.D.; Koutsoyiannis, D. The Development of the Athens Water Supply System and Inferences for Optimizing the Scale of Water Infrastructures. Sustainability 2019, 11, 2657. [Google Scholar] [CrossRef]
- Sargentis, G.-F.; Dimitriadis, P.; Ioannidis, R.; Iliopoulou, T.; Frangedaki, E.; Koutsoyiannis, D. Optimal utilization of water resources for local communities in mainland Greece (case study of Karyes, Peloponnese). Procedia Manuf. 2020, 44, 253–260. [Google Scholar] [CrossRef]
- Sargentis, G.-F.; Meletopoulos, I.T.; Iliopoulou, T.; Dimitriadis, P.; Chardavellas, E.; Dimitrakopoulou, D.; Siganou, A.; Markantonis, D.; Moraiti, K.; Kouros, K.; et al. Modelling water needs from past to present. Case study The Municipality of Western Mani. In Proceedings of the IAHS-AISH Scientific Assembly 2022, Montpellier, France, 29 May–3 June 2022; 2022. [Google Scholar]
- United Nations. The Human Right to Water and Sanitation Media Report. International Decade for Action ‘Water for Life’ 2005–2015. Available online: http://www.un.org/waterforlifedecade/pdf/human_right_to_water_and_sanitation_media_brief.pdf (accessed on 25 July 2022).
- Hoekstra, A.Y.; Mekonnen, M.M. The water footprint of humanity. Proc. Natl. Acad. Sci. USA 2012, 109, 3232–3237. [Google Scholar] [CrossRef]
- Water Footprint Network. National Water Footprint Statistics. Available online: https://waterfootprint.org/en/resources/waterstat/national-water-footprint-statistics/ (accessed on 25 July 2022).
- Tainter, J. The Collapse of Complex Societies; Cambridge University Press: London, UK, 1988. [Google Scholar]
- Middleton, G.D. Understanding Collapse; Cambridge University Press: Cambridge, UK, 2017. [Google Scholar] [CrossRef]
- Boztas, S. ‘Emotion and Pain’ as Dutch Farmers Fight Back against Huge Cuts to Livestock, The Guardian 21 July 2022. Available online: https://www.theguardian.com/environment/2022/jul/21/emotion-and-pain-as-dutch-farmers-fight-back-against-huge-cuts-to-livestock (accessed on 13 February 2022).
- Manning, J. WATCH: Farmers in Poland and Italy join Netherlands in Mass European Protests. EuroWeekly News 8 July 2022. Available online: https://euroweeklynews.com/2022/07/08/watch-farmers-in-poland-and-italy-join-netherlands-in-mass-european-protests/ (accessed on 13 February 2022).
- Roser, M. Breaking out of the Malthusian Trap: How Pandemics Allow Us to Understand Why Our Ancestors Were Stuck in Poverty. 26 November 2020. Available online: https://ourworldindata.org/breaking-the-malthusian-trap (accessed on 13 February 2022).
- Koutsoyiannis, D.; Mamassis, N. From mythology to science: The development of scientific hydrological concepts in the Greek antiquity and its relevance to modern hydrology. Hydrol. Earth Syst. Sci. 2021, 25, 2419–2444. [Google Scholar] [CrossRef]
- Jenkins, S. The Ruble is Soaring and Putin Is Stronger than ever—Our Sanctions Have Backfired. The Guardian 29 July 2022. Available online: https://www.theguardian.com/commentisfree/2022/jul/29/putin-ruble-west-sanctions-russia-europe (accessed on 13 February 2022).
- Escobar, P. The Second Coming of the Heartland. Strategic Culture Foundation. 13 August 2022. Available online: https://www.strategic-culture.org/news/2022/08/13/the-second-coming-of-the-heartland/ (accessed on 13 February 2022).
- Koutsoyiannis, D.; Sargentis, G.-F. Entropy and Wealth. Entropy 2021, 23, 1356. [Google Scholar] [CrossRef]
- Reuters. EU Ban on Russian Coal Imports to Kick in on Thursday. 10 August 2022. Available online: https://www.reuters.com/markets/commodities/eu-ban-russian-coal-imports-kick-thursday-2022-08-10/ (accessed on 13 February 2022).
- Secor, L. Henry Kissinger is Worried About ‘Disequilibrium’. The Wall Street Journal, 12 August 2022. Available online: https://www.wsj.com/articles/henry-kissinger-is-worried-about-disequilibrium-11660325251 (accessed on 13 February 2022).
- Roberts, P.G. When We are at War with Russia, What Will We be Fighting For? Institute of Political Economy. 17 July 2022. Available online: https://www.paulcraigroberts.org/2022/07/17/when-we-are-at-war-with-russia-what-will-we-be-fighting-for/ (accessed on 13 February 2022).


Publisher’s Note: MDPI stays neutral with regard to jurisdictional claims in published maps and institutional affiliations. |
© 2022 by the authors. Licensee MDPI, Basel, Switzerland. This article is an open access article distributed under the terms and conditions of the Creative Commons Attribution (CC BY) license (https://creativecommons.org/licenses/by/4.0/).
Share and Cite
Sargentis, G.-F.; Lagaros, N.D.; Cascella, G.L.; Koutsoyiannis, D. Threats in Water–Energy–Food–Land Nexus by the 2022 Military and Economic Conflict. Land 2022, 11, 1569. https://doi.org/10.3390/land11091569
Sargentis G-F, Lagaros ND, Cascella GL, Koutsoyiannis D. Threats in Water–Energy–Food–Land Nexus by the 2022 Military and Economic Conflict. Land. 2022; 11(9):1569. https://doi.org/10.3390/land11091569
Chicago/Turabian StyleSargentis, G.-Fivos, Nikos D. Lagaros, Giuseppe Leonardo Cascella, and Demetris Koutsoyiannis. 2022. "Threats in Water–Energy–Food–Land Nexus by the 2022 Military and Economic Conflict" Land 11, no. 9: 1569. https://doi.org/10.3390/land11091569