Article

Climate Change Effect on Water Use Efficiency under Selected Soil and Water Conservation Practices in the Ruzizi Catchment, Eastern D.R. Congo

by
Espoir M. Bagula
1,2,*,
Jackson Gilbert M. Majaliwa
2,3,
Gustave N. Mushagalusa
1,
Twaha A. Basamba
2,
John-Baptist Tumuhairwe
2,
Jean-Gomez M. Mondo
1,
Patrick Musinguzi
2,
Cephas B. Mwimangire
1,
Géant B. Chuma
1,
Anthony Egeru
2,3 and
Moses M. Tenywa
2
1
Faculty of Agriculture and Environmental Sciences, Université Evangélique en Afrique, Bukavu P.O. Box 3323, Democratic Republic of the Congo
2
College of Agriculture and Environmental Sciences, Makerere University, Kampala P.O. Box 16811, Uganda
3
Regional Universities Forum for Capacity Building in Agriculture, Kampala P.O. Box 16811, Uganda
*
Author to whom correspondence should be addressed.
Land 2022, 11(9), 1409; https://doi.org/10.3390/land11091409
Submission received: 25 July 2022 / Revised: 20 August 2022 / Accepted: 23 August 2022 / Published: 27 August 2022

Abstract

:
Concerns have been raised on the effectiveness and sustainability of Soil and Water Conservation (SWC) practices as adaptation options to climate change and high intra– and inter–annual rainfall variabilities in eastern Democratic Republic of Congo (DRC). This study was conducted in the Ruzizi Plain, a dryland area, to assess the performance of maize (Zea mays L.) under two Representative Concentration Pathways (RCP 4.5 and 8.5) and two SWC practices (tied ridges and conventional tillage). The AgMIP’s Regional Integrated Assessment (RIA) approach was used to simulate Water Use Efficiency (WUE) under the Cropping System Model–Crop Environment Resource Synthesis (CSM–CERES–Maize) of the Decision Support System for Agro–technology Transfer (DSSAT). The model was calibrated using experimental data from nine cropping seasons (2011–2018) and 100 farms. The model sensitivity was assessed as a function of temperature, water, and SWC practices for the same environments. Initial conditions of crop management practices were used as input data for CSM–CERES–Maize. Current climate data were extracted from AgMERRA datasets corrected with local data for the period of 1980 to 2021. Future climate projections (2022–2099) were obtained after down−scaling the data from the 29 General Circulation Models (GCMS) of Coupled Model Intercomparison Project 5 (CMIP5) and subsetted to five GCMs based on climate regimes. GCMS results were a strong indicator that climate change in this DRC dryland will result in an increase in average annual temperatures for both RCP 4.5 and 8.5, with the highest increase (3.05 °C) under hot/dry conditions for RCP8.5 and the lowest (1.04 °C) under cool/dry conditions for RCP 4.5. All the models selected for five climate regimes for 2022–2099 showed no change in the rainfall trends for RCP 4.5 (p > 0.05). The models projected yield declines of 5–25%, with less yield losses under tied ridges as an adaptation practice. The use of efficient SWC practices could therefore be a promising strategy in reducing potential losses from climate change in drylands of eastern DRC.

1. Introduction

Water is an essential input for crop production, but it is increasingly scarce in agriculture due to competition from rapid population growth, industrialization, and urbanization [1]. In Sub–Saharan Africa (SSA), water is the limiting factor affecting crop yields most because of climate change, which has affected rainfall distribution across cropping seasons and years [2]. This limitation is most experienced in semi–arid areas of the tropical regions, characterized by high evapotranspiration rates as a consequence of high net global solar radiation [3,4]. It is important to note that crop production in these areas intrinsically depends on the rainfall, with an irregular regime, both at the inter–annual and intra–annual scales [5,6]. Apart from the high inter–annual and intra–annual rainfall variabilities, dry regions are experiencing an increase of consecutive dry days during the rainy seasons [7], a situation that increases uncertainty in crop production and results in harvest loss [8].
Ruzizi Plain is one of the eastern Democratic Republic of Congo (DRC) regions characterized by high inter–annual and intra–annual (600–900 mm) uncertainty in rainfall events [9,10]. Consequently, planning rainfed agriculture has become challenging as irrigation facilities and appropriate soil–water conservation practices are still limited. Thus, farmers tend not to invest in sustainable, productive, and economically promising practices since the farming outcomes are unpredictable. Many researchers suggested increasing the water productivity in such regions by investing in soil and water conservation (SWC) practices [11,12]. SWC practices such as tied ridges showed potential in reversing the negative impacts of climate variability and climate change in semi–arid areas of SSA [13,14]. These authors showed an increase of 7.1 to 82% of yield in different African countries. However, the effectiveness of these practices is affected by the inter– and intra–seasonal rainfall variabilities, which are expected to increase with climate change. Furthermore, the International Panel on Climate Change [15] and other researchers have warned that climate change will significantly affect agriculture as a unique economic sector that directly relies on using weather parameters [16,17]. The global mean surface temperature may increase by 2–6 °C in the period between the near future and the end of century and may strongly have a negative influence on the yield response (roughly 0.5 t ha−1 per °C) [16,17]. Therefore, it is necessary to investigate how different SWC practices allow maintaining reasonable yields of different crops under current and future climatic conditions.
Evaluating the long–term effects of climate variability on agricultural production requires costly and time–consuming longitudinal studies [18]. In addition, the Ruzizi Plain presents significant gaps and inconsistencies in the relationships between weather parameters and yield. To address the issue, it is recommended that use be made of an accepted strategy of combining the results of short–term experiments with robust and validated dynamic crop models [18,19,20]. Physiology–based crop models have become an essential tool for predicting the impact of climate change from limited experimental data across different climate zones, soil types, crop management regimes, and broader climate change scenarios [21]. Many studies have used crop models to assess the response to different farming systems, soil management, and changes in the magnitude and intensity of climatic factors in many regions to support policy decisions [22,23,24,25]. These research projects reported that maize production would result in a yield reduction of 1.7–16 and 28–46.8% for RCP 4.5 and RCP 8.5, respectively, by the middle of the century without adaptation measures [22,23,24,25]. Furthermore, these simulation models can be used to assess the impact of long–term climate variability on crop productivity for a range of soil and water management strategies [20,26].
Several models, especially the Decision Support System for Agro–technology Transfer (DSSAT), have been tested in a wide range of soils, crop management, and climatic conditions in smallholder farming systems in SSA [27,28,29]. DSSAT was selected because of the ability of the CSM–CERES–Maize model to simulate maize growth, yield, water use efficiency (WUE), and soil water balance [18,30,31]. However, limited research has been conducted in SSA on how soil and water conservation practices will respond to crop models and be long–term solutions in the context of climate change. To meet the growing demand for climate change impact assessment, maize WUE needs to be simulated using crop and climate models so as to evaluate the sustainability of SWC practices under climate change scenarios. This study used the Regional Integrated Assessment (RIAs) approach proposed by the AgMIP [30,31,32], which includes the utilization of climate and crop models to evaluate the climate change impact on maize crop. The objectives of this study were: (1) to characterize climate change dynamics in Ruzizi Plain, (2) to evaluate the ability of the CSM–CERES–Maize model to predict grain yield and WUE under different climate change scenarios, and (3) to assess how SWC practices as adaptation measures affect maize yield and WUE under different climate change scenarios.

2. Materials and Methods

2.1. Study Site and Data Collection

This study was conducted in the Ruzizi Plain, which spreads over three countries, i.e., DRC, Rwanda, and Burundi, and covers 175,000 ha (Supplementary Figure S1). For conducting climate change evaluation, data from field experiments and farms were collected. The Ruzizi Plain has a type Aw4 tropical climate according to the Köppen climatic classification and is characterized by a bimodal rainfall regime. The long rainy season commences in October and ends in February, while the short rainy season starts in February and ends in June. The short rainy season is followed by a four–month dry season (June to September). The Ruzizi Plain receives annual rainfall ranging from 600 to 900 mm. Minimum and maximum temperatures vary between 18 and 32 °C, with very high daily temperature variations (14 °C) in some areas within the plain [33].

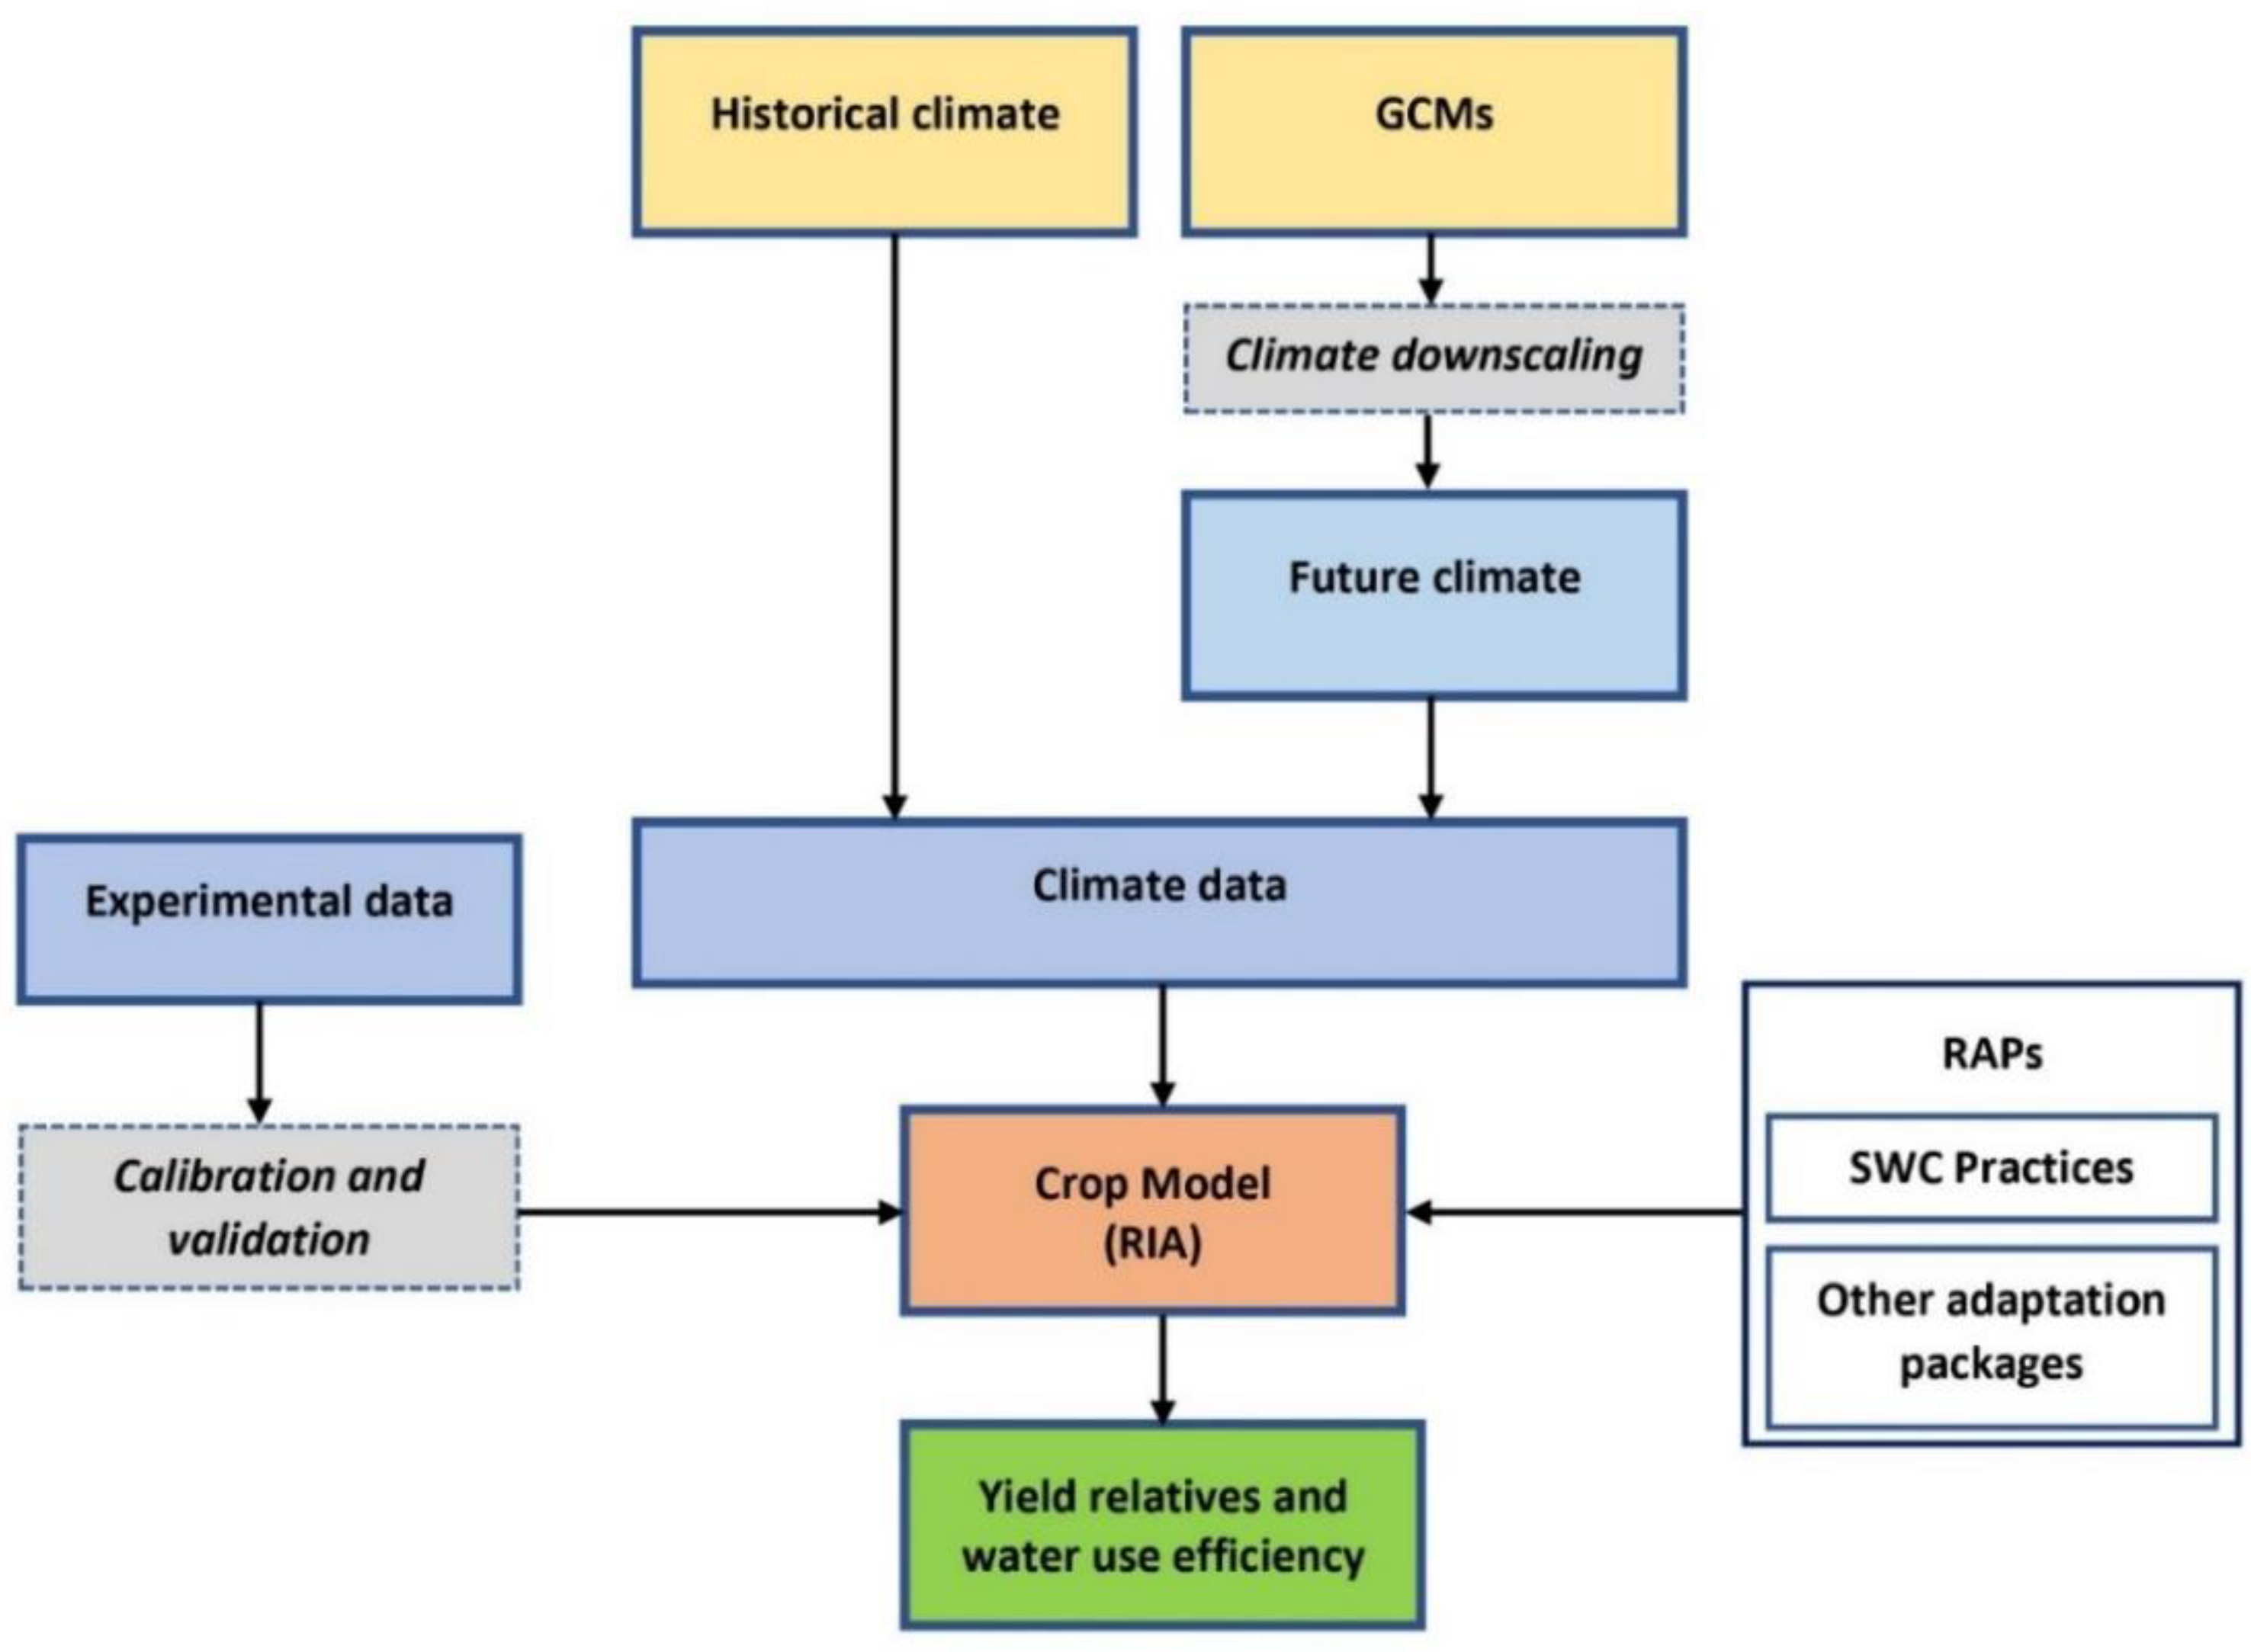
2.2. Methodological Approach

This study used the AgMIP’s Regional Integrated Assessment (RIA) approach to assess the vulnerability of agricultural systems to climate change [32,34,35]. Four main questions are addressed in the RIA. First, what is the sensitivity of current agricultural production systems to climate change? Second, what are the benefits of interventions in current agricultural systems? Third, what are the impacts of climate change on future agricultural production systems? Finally, what are the benefits of adaptations to climate change? Therefore, current and future climate change data should be used in the crop model to simulate current and future yields, water use efficiency, and soil water balance. Figure 1 presents the analytical flow chart for answering the questions raised in the RIA approach.

2.2.1. Collection and Correction of Historical Climate Data

The RIA approach to climate change impact assessment requires daily climate data for crop modeling. However, eastern DRC is generally a data–scarce agricultural region where long–term daily climatic data are unavailable. Therefore, the AgMIP climate forcing dataset (AgMERRA) provided by Modern–Era Retrospective Analysis for Research and Applications (MERRA), a NASA platform, was used to fill the gaps in observed climate data as suggested by Rienecker et al. [36]. The data collected from AgMERRA were corrected gridded of rainfall, minimum and maximum temperatures, wind speed, relative humidity, and solar radiation covering the 1980–2010 period, as suggested by Ruane et al. [37]. The observed data consisted of long–term monthly data of maximum temperature (Tmax), minimum temperature (Tmin), and rainfall obtained from the Centre de Recherche en Hydrobiologie (CRH)–Uvira and the Burundi State Department of Meteorology located in Mparambo, Ruzizi Plain. Data gap filling was used to fit daily climate data from AgMERRA with the collected monthly field data. Precipitation data were corrected using the Double Mass Curve Analysis (DMCA) derived from the arithmetic mean, multiple linear regression, and the non–linear iterative partial least–squares algorithm [38]. Temperature data were corrected using exponential equations and the non–linear iterative partial least–squares algorithm as supported by Kashani and Dinpashoh (2012). The period 1980–2009 was considered a reference period because of the availability of complete AgMERRA climatic datasets. The 30–year reference period considered in this study consists of a daily meteorological record for a fixed atmospheric CO2 concentration of 360 ppm [22].

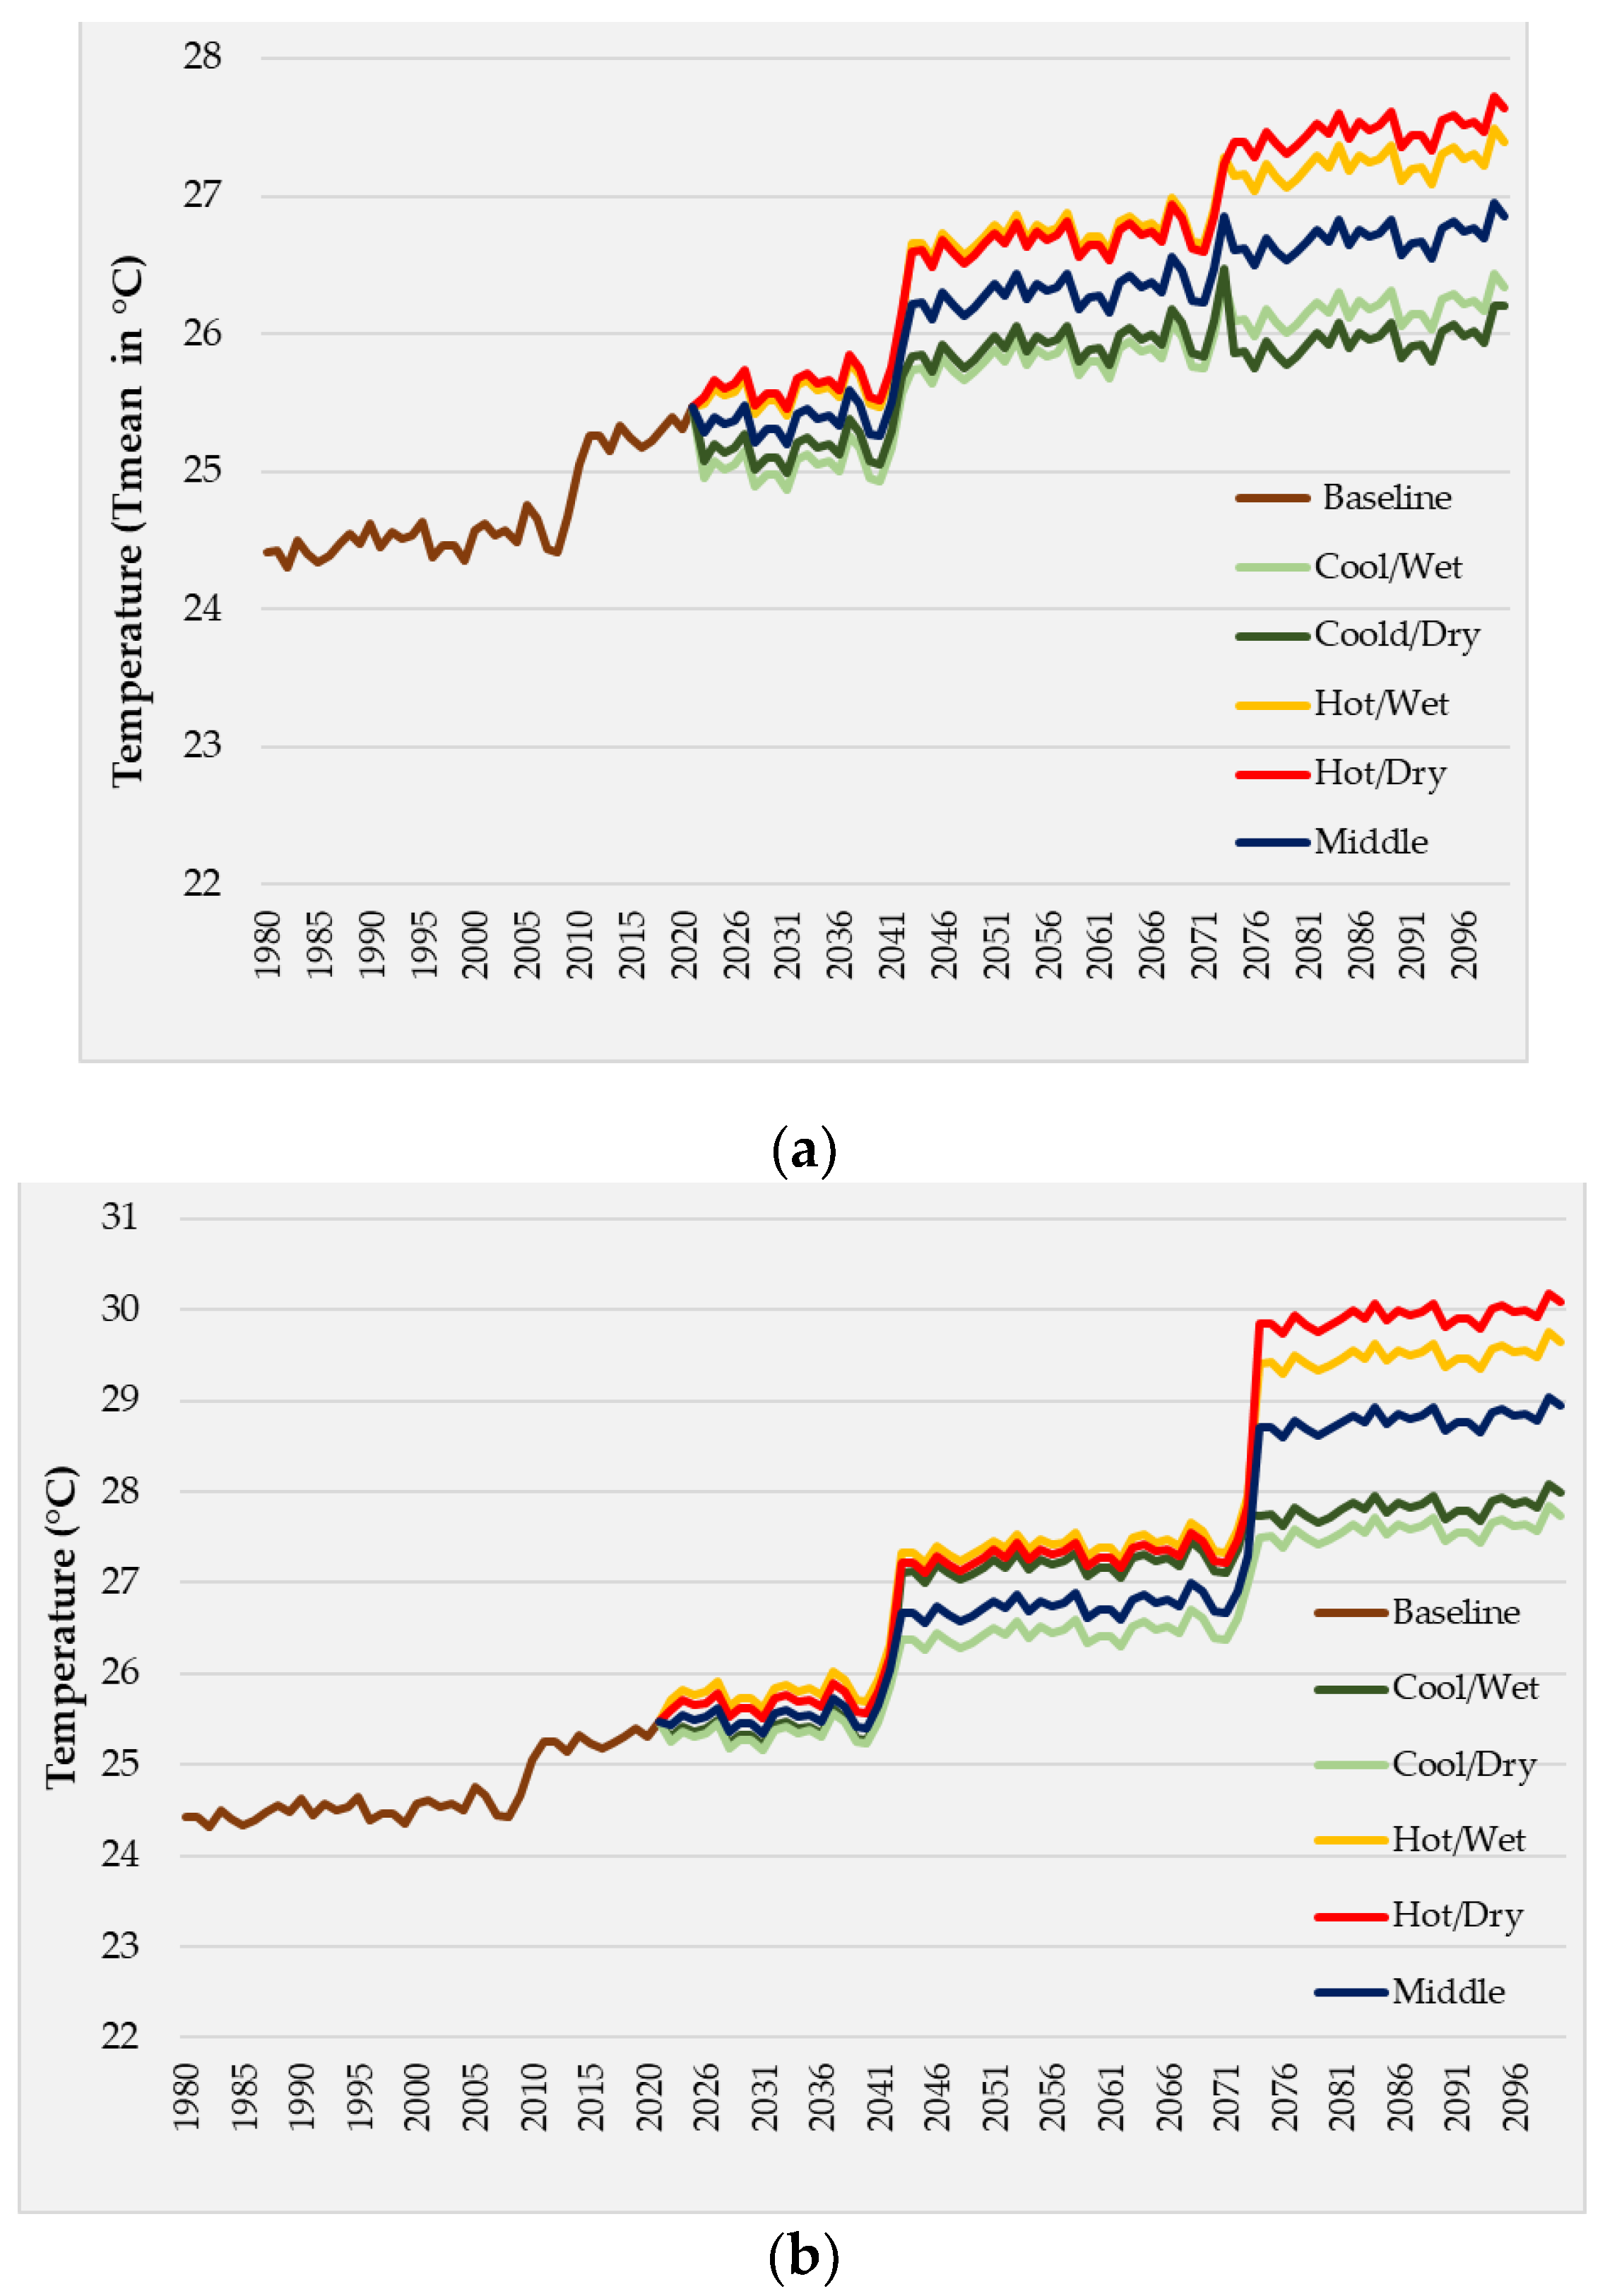
2.2.2. Future Climate Projection and Statistical Downscaling of GCMs

Future climate data were obtained from downscaling the 29 climate models of the family of Coupled Model Inter–comparison Project Phase 5 (CIMP5) of the World Climate Research Program (Supplementary Table S1) under two Representative Concentration Pathways (RCP 4.5 and RCP 8.5). Three periods were selected for RIA, i.e., the near future (2022–2039), the mid–century (2040–2069), and the end of century (2070–2099). RCPs are a series of trajectories of greenhouse gases, air energy, land use, pollutant emission, socio–economic change, and technological development reported by IPCC based on different 21st Century pathways [39]. Since it is not practical to assess the impacts of climate change on agricultural systems at a local scale with coarse data from the 29 GCMs, location–specific climate change scenarios were downscaled using a simple Delta method. The Delta method is a statistical downscaling of GCMs in which monthly changes in temperature and precipitation from a GCM, calculated at the grid–scale, are added to the corresponding observed station data. The method assumes that future biases for both the mean and variability will be the same as the current [37,40]. One of the objectives of AgMIP is to provide some advice on creating climate change scenarios to agricultural experts who are not familiar with climate modeling. However, impact assessments in the sectors have often been influenced by bias in selection, leading to inconsistencies between studies. For example, White et al. [41] revealed differences between crop modeling studies in the number and types of GCMs used. Many studies use a small number of models. AgMIP regional integrated assessments and many inter–comparison projects use five GCMs depending on their prominence in the literature, the length of participation in the CMIP program, and the spatial resolution [37,39].
Due to the high number of combinations of individual elements in an integrated assessment framework, it was important to subset GCMs in order to reduce the loss of information by selecting practical and consistent GCMs for use in RIA. Therefore, based on the subset method that Ruane and McDermid [39] developed, five of 29 GCMs of the CMIP5 family were selected to generate the climate change projections under each Representative Concentration Pathway (RCP 4.5 and RCP 8.5) for each time period. It represents the uncertainty in projected temperature and rainfall changes for the study site. The criteria for selecting these GCMs were based on scatter plots of the mean change in temperature versus the percentage change in precipitation for different periods [22,39]. Ruane and McDermid [39] suggested to characterize the location–specific changes in temperature and precipitation projected by an individual model in terms of deviation from the ensemble median, in order to identify the fundamental classes of climate change projected for the study area over a specific time period and RCP. Therefore, the projections for a GCM were relatively cool or hot and relatively wet or dry. Thus, a GCM with low levels of global warming may be classified as “relatively cool” for a given region if it is cooler than the median of all GCMs. Similarly, a GCM with a slight long–term drying trend may still be “relatively wet” if the median of all GCMs projects a more extreme drying trend. The GCM projections were then classified into four climate regimes: cool/wet, cool/dry, hot/wet, and hot/dry). A fifth classification, “middle”, is also introduced to capture the patterns that represent the junction of these quadrants around the median of the ensemble. In selecting a representative model for each quadrant, it was not necessary for the model representing a given quadrant to be centered in the quadrant. The philosophy developed by the RIA approach is to choose a model at the center of the GCMs that fall in that quadrant, whose role is to represent the types of change projected by these models. Therefore, the selection of a representative model was facilitated by calculating the center of mass of the quadrant for temperature and precipitation changes. This is achieved by plotting the average change in temperature and precipitation for all GCMs that fall in a given quadrant (Supplementary Figure S2). Table 1 presents the five models selected after subsetting the 29 GCMs of the CMIP5 family under RCP 4.5 and RCP 8.5. The five models were selected based on the period of simulation, the near future (2022–2030), mid–century (2040–2069), and end of the century (2070–2100). The climate downscaling and subsetting was computed using R 4.0 (https://cran.r–project.org/bin/windows/base/old/4.0.1/ (accessed on 11 November 2021)) through the packages R.matlab, R.methodss3, and R.utils.

2.2.3. Projected Trend and Relative Change

The projected annual temperature and rainfall trends were determined and quantified using Mann–Kendall statistical test and Sen’s slope estimator based on the “MAKESENS” Microsoft Excel template developed by the Finish Meteorological Institute [42]. The relative change (Δ) was the main matrix for defining the changes in rainfall or temperature in this study. According to Hsiao et al. [43], for any quantity X, the relative change (%) compared to its reference state (Xref) is defined by Equation (1):
Δ ( X ) = ( X X r e f X r e f ) × 100
where Xref denotes the quantity over the early period.

2.3. Water Use Efficiency and Yield Simulation by CSM–CERES–Maize

2.3.1. Crop Model Description

Three important parameters were set before running the model. These are soil conditions, climate, and crop management parameters. Root growth factors were set at 1.0 as non–limiting in the Ruzizi Plain, as suggested by Jones et al. [18], for all root depths above 30 cm. In addition, the soil physical and chemical properties data of Ruzizi Plain were obtained through soil analyses, and the details are described by Bagula et al. [10]. Other conditions such as slope were set in the model. Runoff potential and drainage rate conditions were estimated automatically and, respectively, based on the Natural Resource Conservation Service–Curve Number method (NRCS–CN) and soil water balance based on the Ritchie equations [18]. These conditions were defined differently according to SWC practices (Table 2).
Experiments’ information on the variety, initial conditions (previous crop sown, remaining crop, and root residues weight) and crop management (sowing date, tillage, amount of fertilizer, irrigation, harvest date, etc.) were recorded. This farm and experiment management information was used to create input files for the CSM–CERES–Maize model. The most widely cultivated maize variety in the region is Ecavel, and it was used for calibration and simulation processes. Ecavel is an open–pollinated variety with a crop cycle of 90–110 days and a yield potential of 1.5–3 t ha−1. This variety is recommended at 800–1300 m above sea level. However, no report on its drought resistance exists [44]. The planting density of 50,000 plants per hectare was estimated for each farm. Fertilizer was applied at 30 kg of N per ha to allow for model sensitivity. Since DSSAT (CSM–CERES–Maize) does not have a soil and water conservation practices component [45], it was necessary to define more parameters influenced by SWC practices. For sensitivity analysis, the percentage of water availability was incorporated into the model to determine the stress factor for each SWC practice.

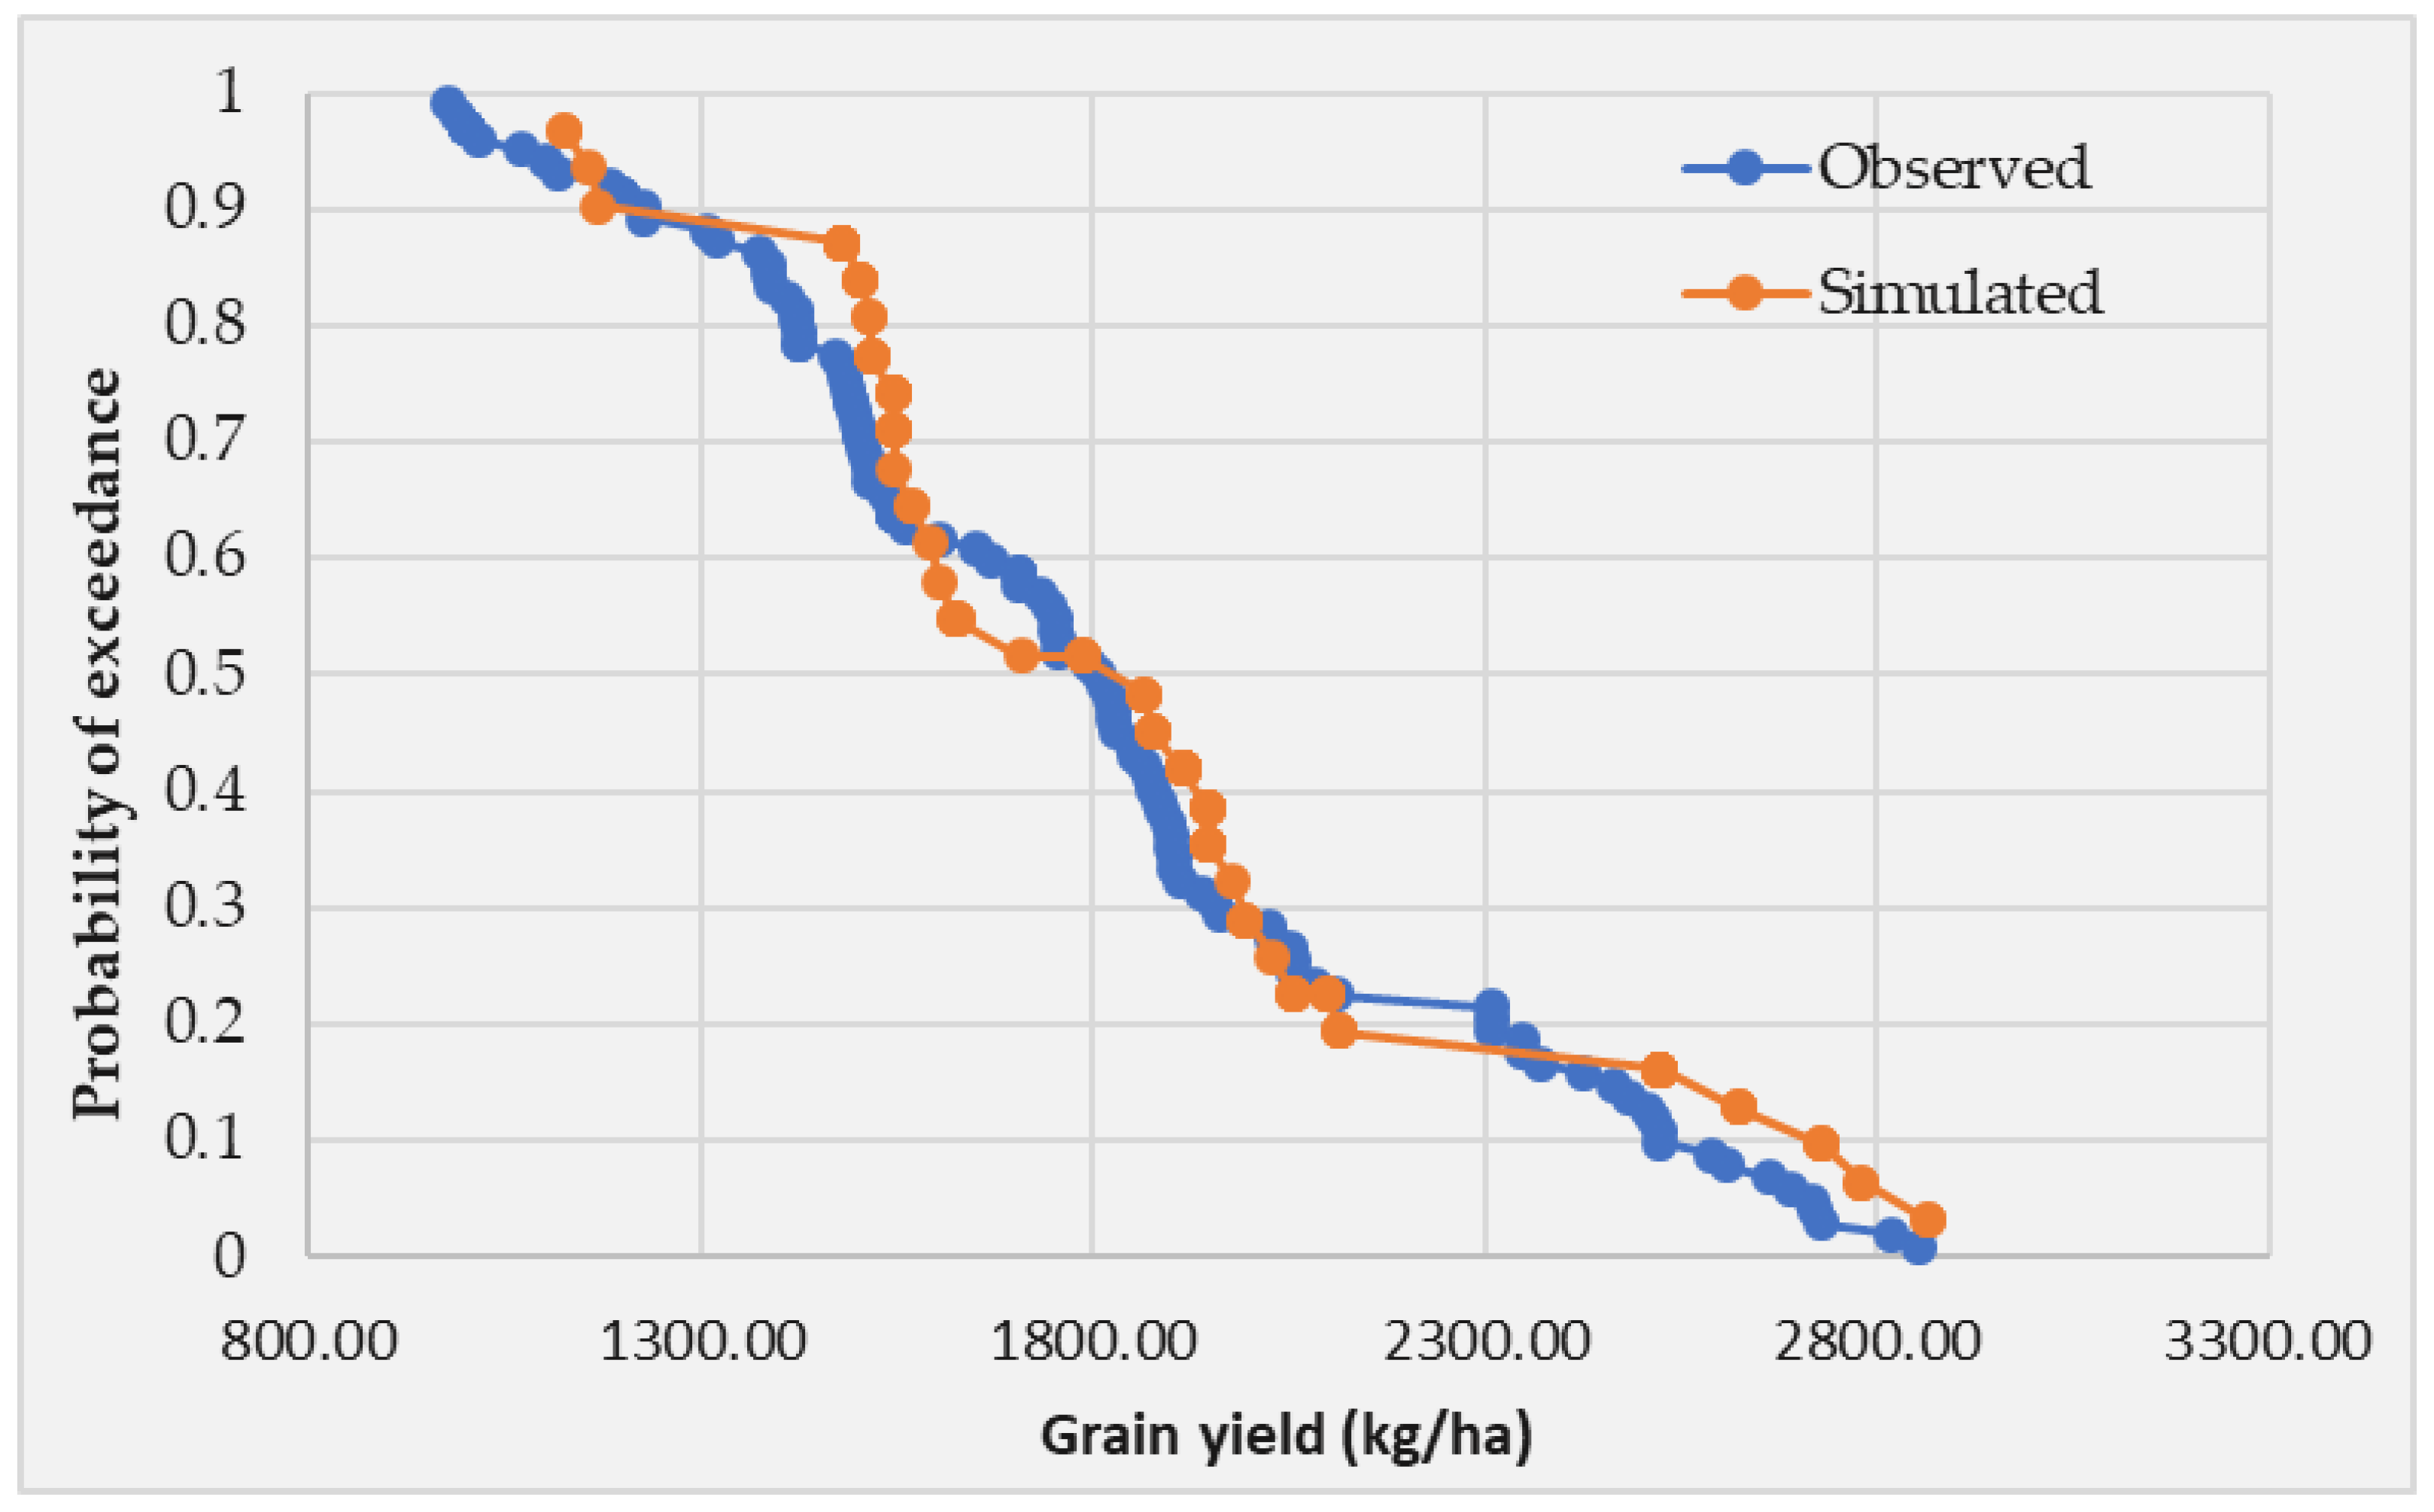
2.3.2. Crop Model Calibration and Evaluation

Model calibration was conducted to adjust model parameters to fit the simulated values with the observed data. Simulated crop yield values were compared with observed values so as to evaluate model performance. Crop yield data were collected from 2011 to 2019. Data were obtained from trials of 9 agricultural seasons conducted by Bagula et al. [10,46,47] and 100 maize farms surveyed in the Ruzizi Plain for the 2018 growing season. Farms were selected using a simple random sampling method. Farm data included only conventional tillage practice, while experimental data included both tied ridges and conventional tillage practices. The genotype coefficients were calibrated using the GenCalc method [18]. Three common statistical indicators were used to quantify the goodness of model fitting, i.e., the root–mean–squared error (RMSE), coefficient of determination, and the degree of model agreement (D–index) [27,48]. These indices were calculated using the following formulae:
R M S E = 1 n 1 n ( P i O i ) 2
D i n d e x = 1 [ i = 1 n ( P i O i ) 2 i = 1 n [ | P i | + | O i | ] 2 ]
with Pi and Oi the predicted and observed yields, respectively, and Ō the average observed yields over all replications in the group. The exceedance probability was used to measure the agreement between simulated and observed values [49]. The validation aims to determine whether the model is accurate enough for its application as defined by the objectives of the simulation study [50]. The model was evaluated for validation using again the coefficient of determination, the RMSE, and the D–index

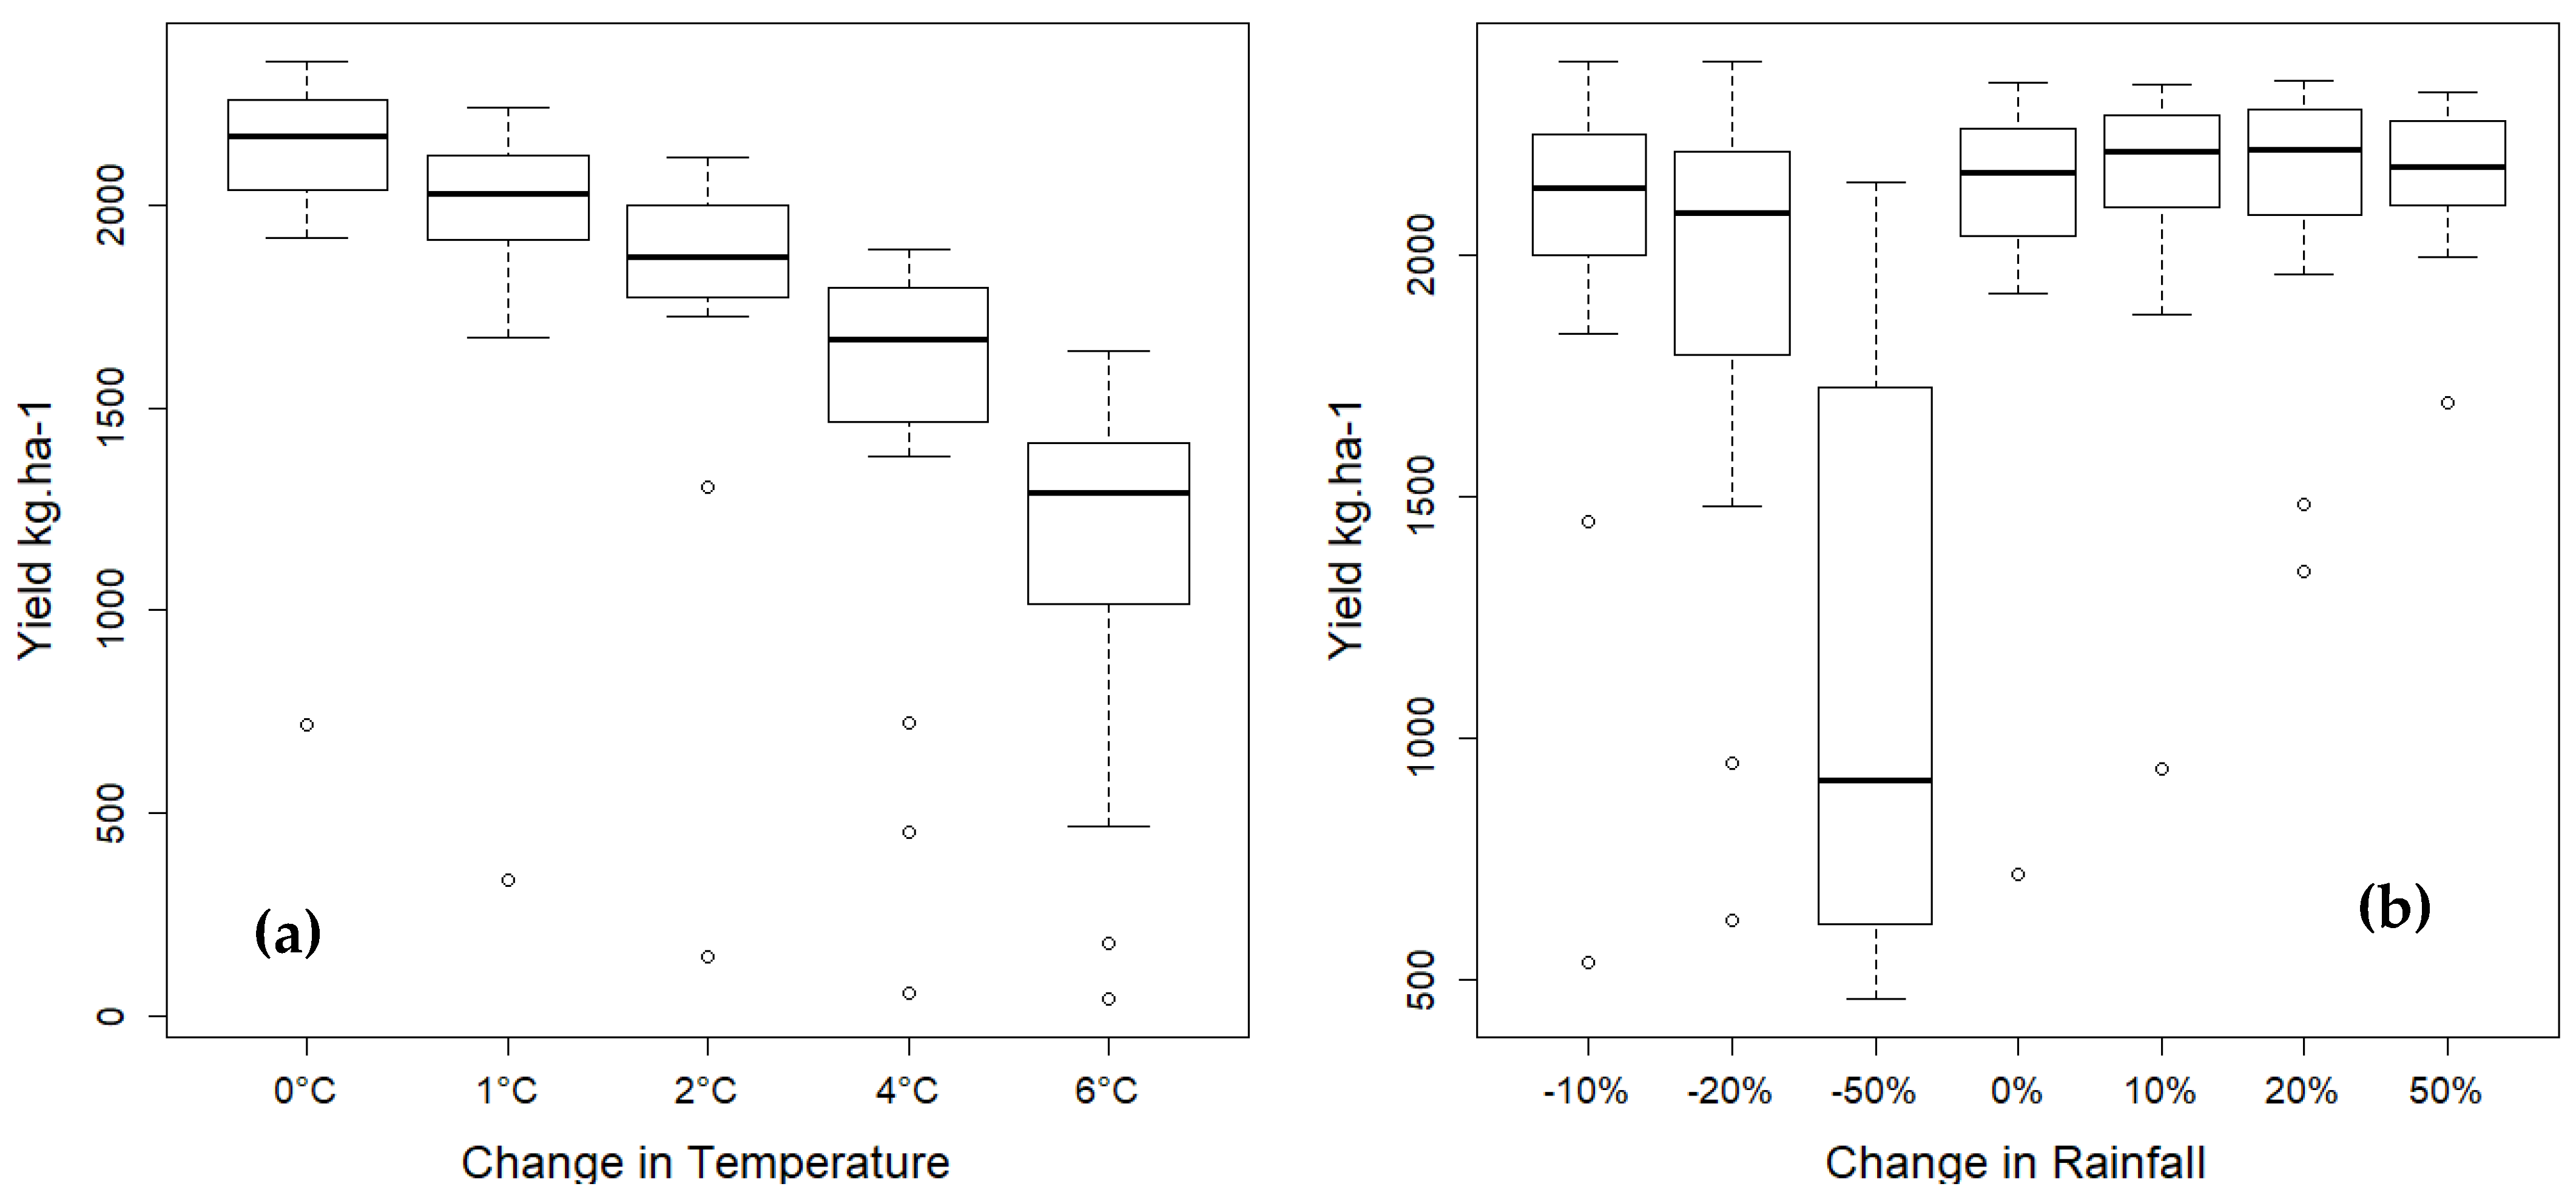
2.3.3. Sensitivity Analysis to Climate and Soil and Water Conservation Practices

The CSM–CERES–Maize model sensitivity analysis was performed for various temperatures, rainfall, and SWC practices while other parameters were fixed at their normal values. This analysis provides guidance to improve the quality of assessment practices and decision support systems used in agricultural and environmental decision–making [51]. Climate data of 30 years (1980–2010) were used for the sensitivity analysis. The observed daily maximum and minimum temperatures were modified by −4, −2, +2, +4, and +6 °C. The precipitation was adjusted to 25, 50, 75, 100, and 200% of the daily values as proposed by Ahmad et al. [22]. Water availability for initial conditions was adjusted at 20, 40, 60, and 80% for soil and water practices sensitivity.

2.4. Model Simulation for Climate Change Scenarios and SWC Adaptation Packages

The outputs of the climate models were used to run the DSSAT model to assess the impacts of climate change on maize yield, water use efficiency, and soil water balance under two SWC practices (tied ridges and conventional tillage). Other practices were maintained constant. Selected climate model data were aggregated for 2022 to 2099 in one file for each RCP, and each climate subsetting was considered a climate regime. For climate change impact assessment, crop simulations were performed by combining climate and crop management (CM), designated as the CM1 to CM4 codes (Table 3).
A CM code represents a combination of climate impact and crop management as suggested by Ahmad et al. [22]. CM1 analysis was conducted using the current production system with the current climate (1980–2020). For CM2, current production systems were simulated with future climate scenarios. For CM3, simulations were performed using the current climate with SWC practices designed for climate adaptations. Finally, in CM4, simulations were performed using SWC practices designed for climate adaptation under different climate change scenarios.

3. Results

3.1. Historical and Future Climate Patterns in Ruzizi

The results of the reference period (1980–2020) indicated a significant increase in temperature of ~0.02 °C each year (p < 0.01). There was also a strong indication that climate change in the target region would increase the average annual temperature. Table 4 shows the average temperatures for the RCP 8.5 and RCP 4.5 scenarios. The highest temperature increase was 3.05 °C under hot/dry conditions for RCP 8.5, while the lowest increase was 1.04 °C under cool/dry conditions for RCP 4.5. The trends of temperature changes for RCP 4.5 under middle, cool/wet, and hot/wet followed the same trends as the baseline. For RCP 4.5, only the cool/dry condition showed a temperature trend below the baseline average, while models predicting hot/dry conditions showed an increment of 1.98 °C above the current increase in the baseline. All scenarios of RCP 8.5 showed that at the end of the century, the annual average temperature would increase significantly compared to the current trends (Figure 2).
The rainfall of the baseline and future climate data showed different trends. It is noteworthy that high inter–annual variability was observed in the Ruzizi Plain, increasing uncertainty in predicting events (Table 5). The mean annual rainfall of the selected period was 785.1 mm, with a standard deviation of 242.8 mm, a coefficient of variation (CV) of 30.9%, and a Sen slope of 4.67. The minimum and maximum annual values of recorded rainfalls were 272.1 mm (in 1997—the driest year) and 1231.6.5 mm (in 1989—the wettest year), respectively. The result of the normality test (using the Shapiro–Wilk test) indicated that cumulated annual rainfall data were not normally distributed at the significance level of 5%. After correcting data with AgMERRA for the series of weather data (1980–2019), the CV became 10.01% and a Sen’s slope of 2.41. No change in trend was observed again for rainfall data (p > 0.05).
The five climate regimes/subsettings selected for the period 2022–2099 showed no change in the precipitation trends for RCP 4.5 (p > 0.05). The CVs remained low (9.54–9.95%) and showed a low inter–annual variability in precipitation. A similar trend to the baseline will continue to be observed until the end of the century for RCP 4.5. In contrast, a slight trend of increasing precipitation in the RCP 8.5 scenarios was shown by the Sen’s slope for the models that predicted cool/wet (2.48) and hot/wet (1.82) future and middle conditions (1.11). However, the climate data showed no change in precipitation trend for the models that predict a hot/dry and a cool/dry future (p > 0.05). However, the model that predicted a cool and wet future for RCP 8.5 in the Ruzizi Plain showed an increment in inter–annual variability (CV = 14.8%) compared to the baseline (CV = 10.01%). This trend increases the uncertainties in the prediction of events.
Beyond the increases in temperature and inter–annual rainfall variabilities, data from the climate change projection models showed an increase in the delay in the return of rain at the start of the seasons (Table 5). The reference period recorded an average of a 10–day delay in the return of rainfall at the start of the seasons (1 November for Season A and 1 March for Season B) with a CV of 81%. Climate change data for RCP 4.5 showed an increase in delay of rainfall return for models that predicted a cool/dry condition (15.3 days) and a middle condition (15.9 days), with CVs of 101 and 109%, respectively. On the other hand, for RCP 8.5, there was an increase in the return period of rainfall of 27.4 days and 15.1 days for the models predicting hot/wet and cool/wet conditions, respectively, with CVs of 87.7 and 95.5%.

3.2. Climate Change Impacts on Current and Future Maize Production Systems

3.2.1. Model Calibration and Evaluation

Figure 3 shows the good performance of the CSM–CERES–Maize model for variety Ecavel to simulate yields. The model performed with an R2 of 82.1%, a coefficient of agreement of 0.94, and an RMSE of 203.6 kg ha−1. After calibration and sensitivity tests, the CSM–CERES–Maize model simulated values were slightly higher than the observed on–farm yield data. It was noted that for an exceedance probability of 90%, observed and simulated yields were greater than or equal to 1300 kg ha−1. An exceedance probability of only 20% showed a yield greater or equal to 2300 kg ha−1. The CSM–CERES–Maize model can hence accurately simulate maize yield under different soil practices and climate scenarios. However, the model was sensitive to changes in rainfall and temperature (Table 6).
The results show that it takes 212 °C growing days (p1) for the variety Ecavel to progress from seedling to active growth. Each hour beyond 12.5 h of plant exposure to light and solar radiation reduced the equivalent development of the day by 25%. Furthermore, a total of 800 °C days are required during grain filling. The PHINT genotypic coefficient indicates that 40 °C days are needed for a leaf tip to appear. The coefficients G2 and G3 are related to crop yield and express the amount of radiation available. It can be seen, for example, that a total of 800 W/m2 is required.

3.2.2. CSM–CERES–Maize Sensitivity to Temperature and Rainfall Variation

Simulated grain yield response to changes in precipitation and temperature is shown in Figure 4. The model was sensitive to precipitation, temperature, and water availability changes. Grain yield was negatively affected by an increase in temperature; it decreased by 7.2% when the temperature increased by 1 °C and decreased by 14.9 to 28.6% when temperatures increased by 2 to 4 °C. The highest grain yield loss (46.3%) was observed at a temperature increase of 6 °C. There was a slight positive response of the model to the increase in rainfall. When rainfall increased from 10 to 50%, the grain yield increment ranged from 1.35–3.38%, and when it decreased from 10 to 20%, yield losses also ranged from 2.6–8.78%. The model responded strongly to the decrease in rainfall by 50%, resulting in a yield loss of 47.37%.

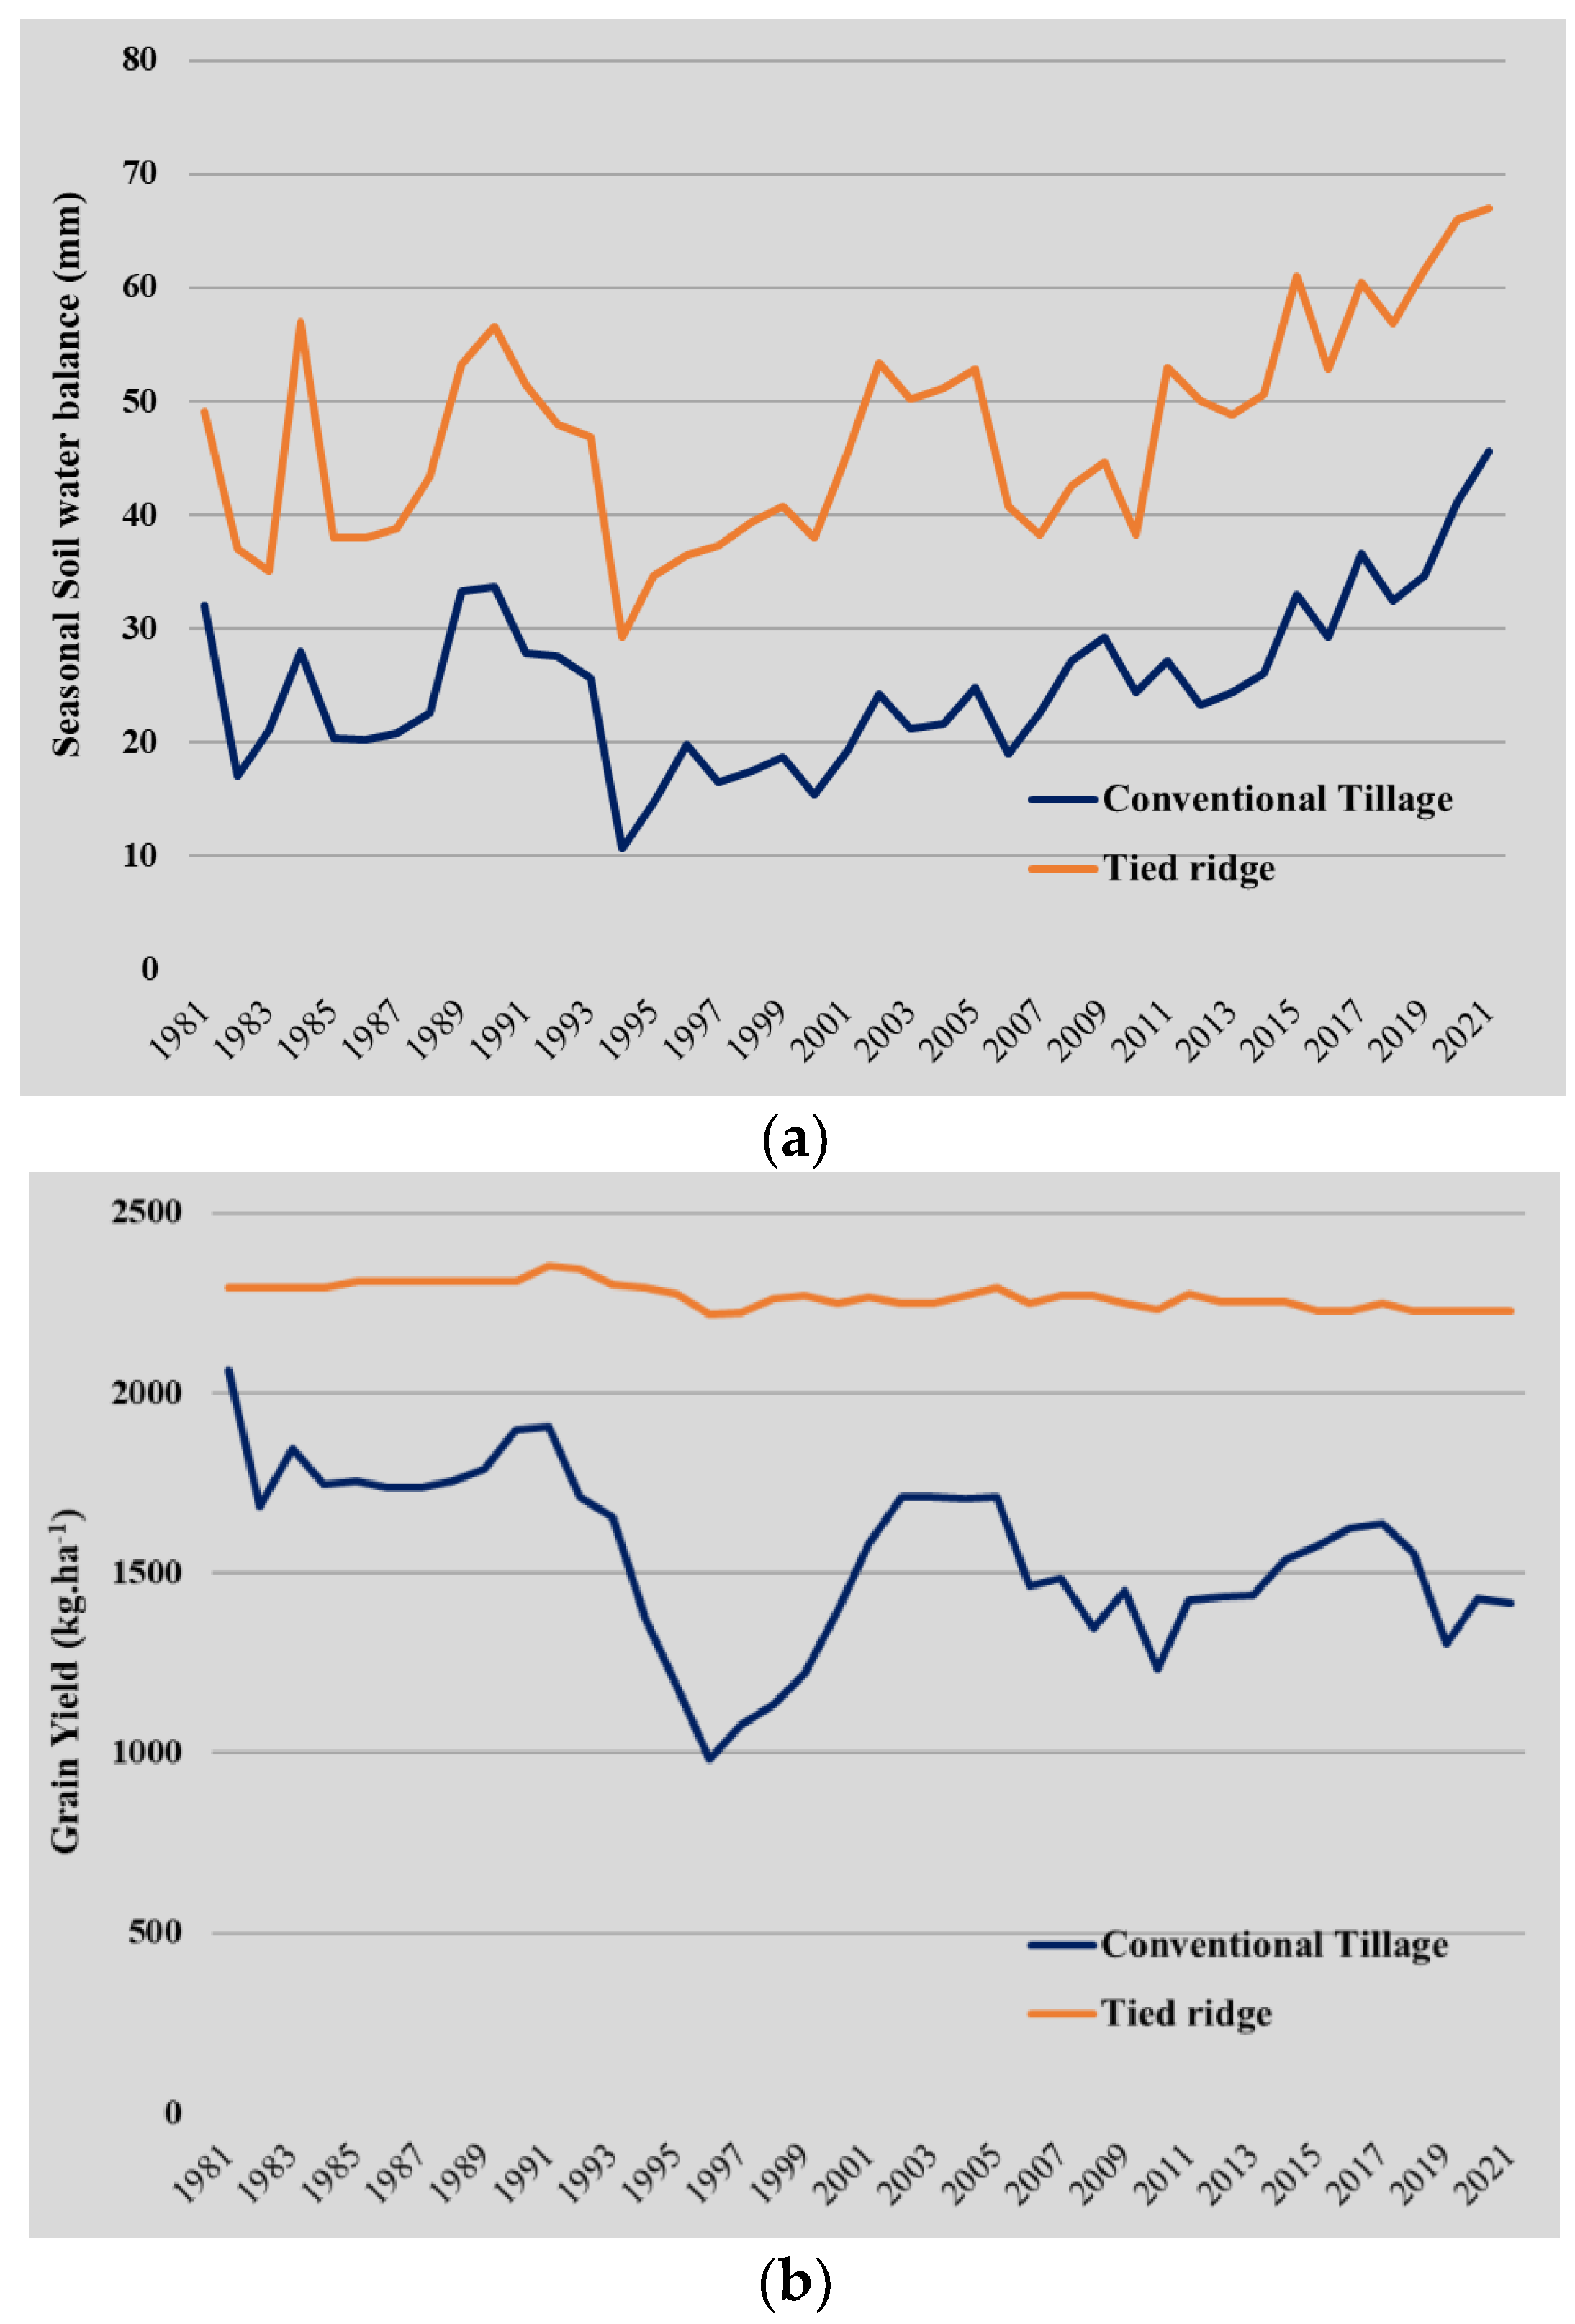
3.2.3. Change in Maize Yield, Water Use Efficiency, and Soil Water Balance under the Current Agricultural Production System and Adaptation

Historical simulation data (Figure 5) showed that maize yields in the current production system varied over time, with a gap around the year 1995. Average yield under conventional tillage was 1531.3 kg ha−1 with a CV of 19.25% for the period 1981 to 2020. This high coefficient of variation follows the trends related to rainfall data observed in the region. The soil water balance also changed with peaks, declines, and rebounds for the period 1981 to 2020. Seasonal soil water balance was 25 mm for conventional tillage with a high CV (29.2%). Changes in climatic parameters greatly influenced the crop growth rate and, consequently, the change in soil water balance. WUE showed considerable variation similar to the maize yield trend. The average was around 16.23 kg ha−1 mm−1 with a CV of 17.4%. These CVs in this parameter raise concerns about reducing uncertainty in predicting yield, water use efficiency, and soil water balance.
Tied ridges as a SWC adaptation technology reduced the CV (2%) and, therefore, uncertainty of yield prediction, despite a slight decrease in yield over time. An average of 2268 kg ha−1 was observed from 1981 to 2020. As for the water use efficiency, tied ridges yielded 19.35 kg ha−1 mm−1 with a CV of 4.51%. Despite significant increases observed under tied ridges (47.15 mm) for the soil water balance, the CV remained high (19.7%). The climate adaptation on the current production system (CM3/CM1) was improved by 48.2% and 19% for yield and WUE, respectively, when tied ridges were adopted as an SWC adaptation option.

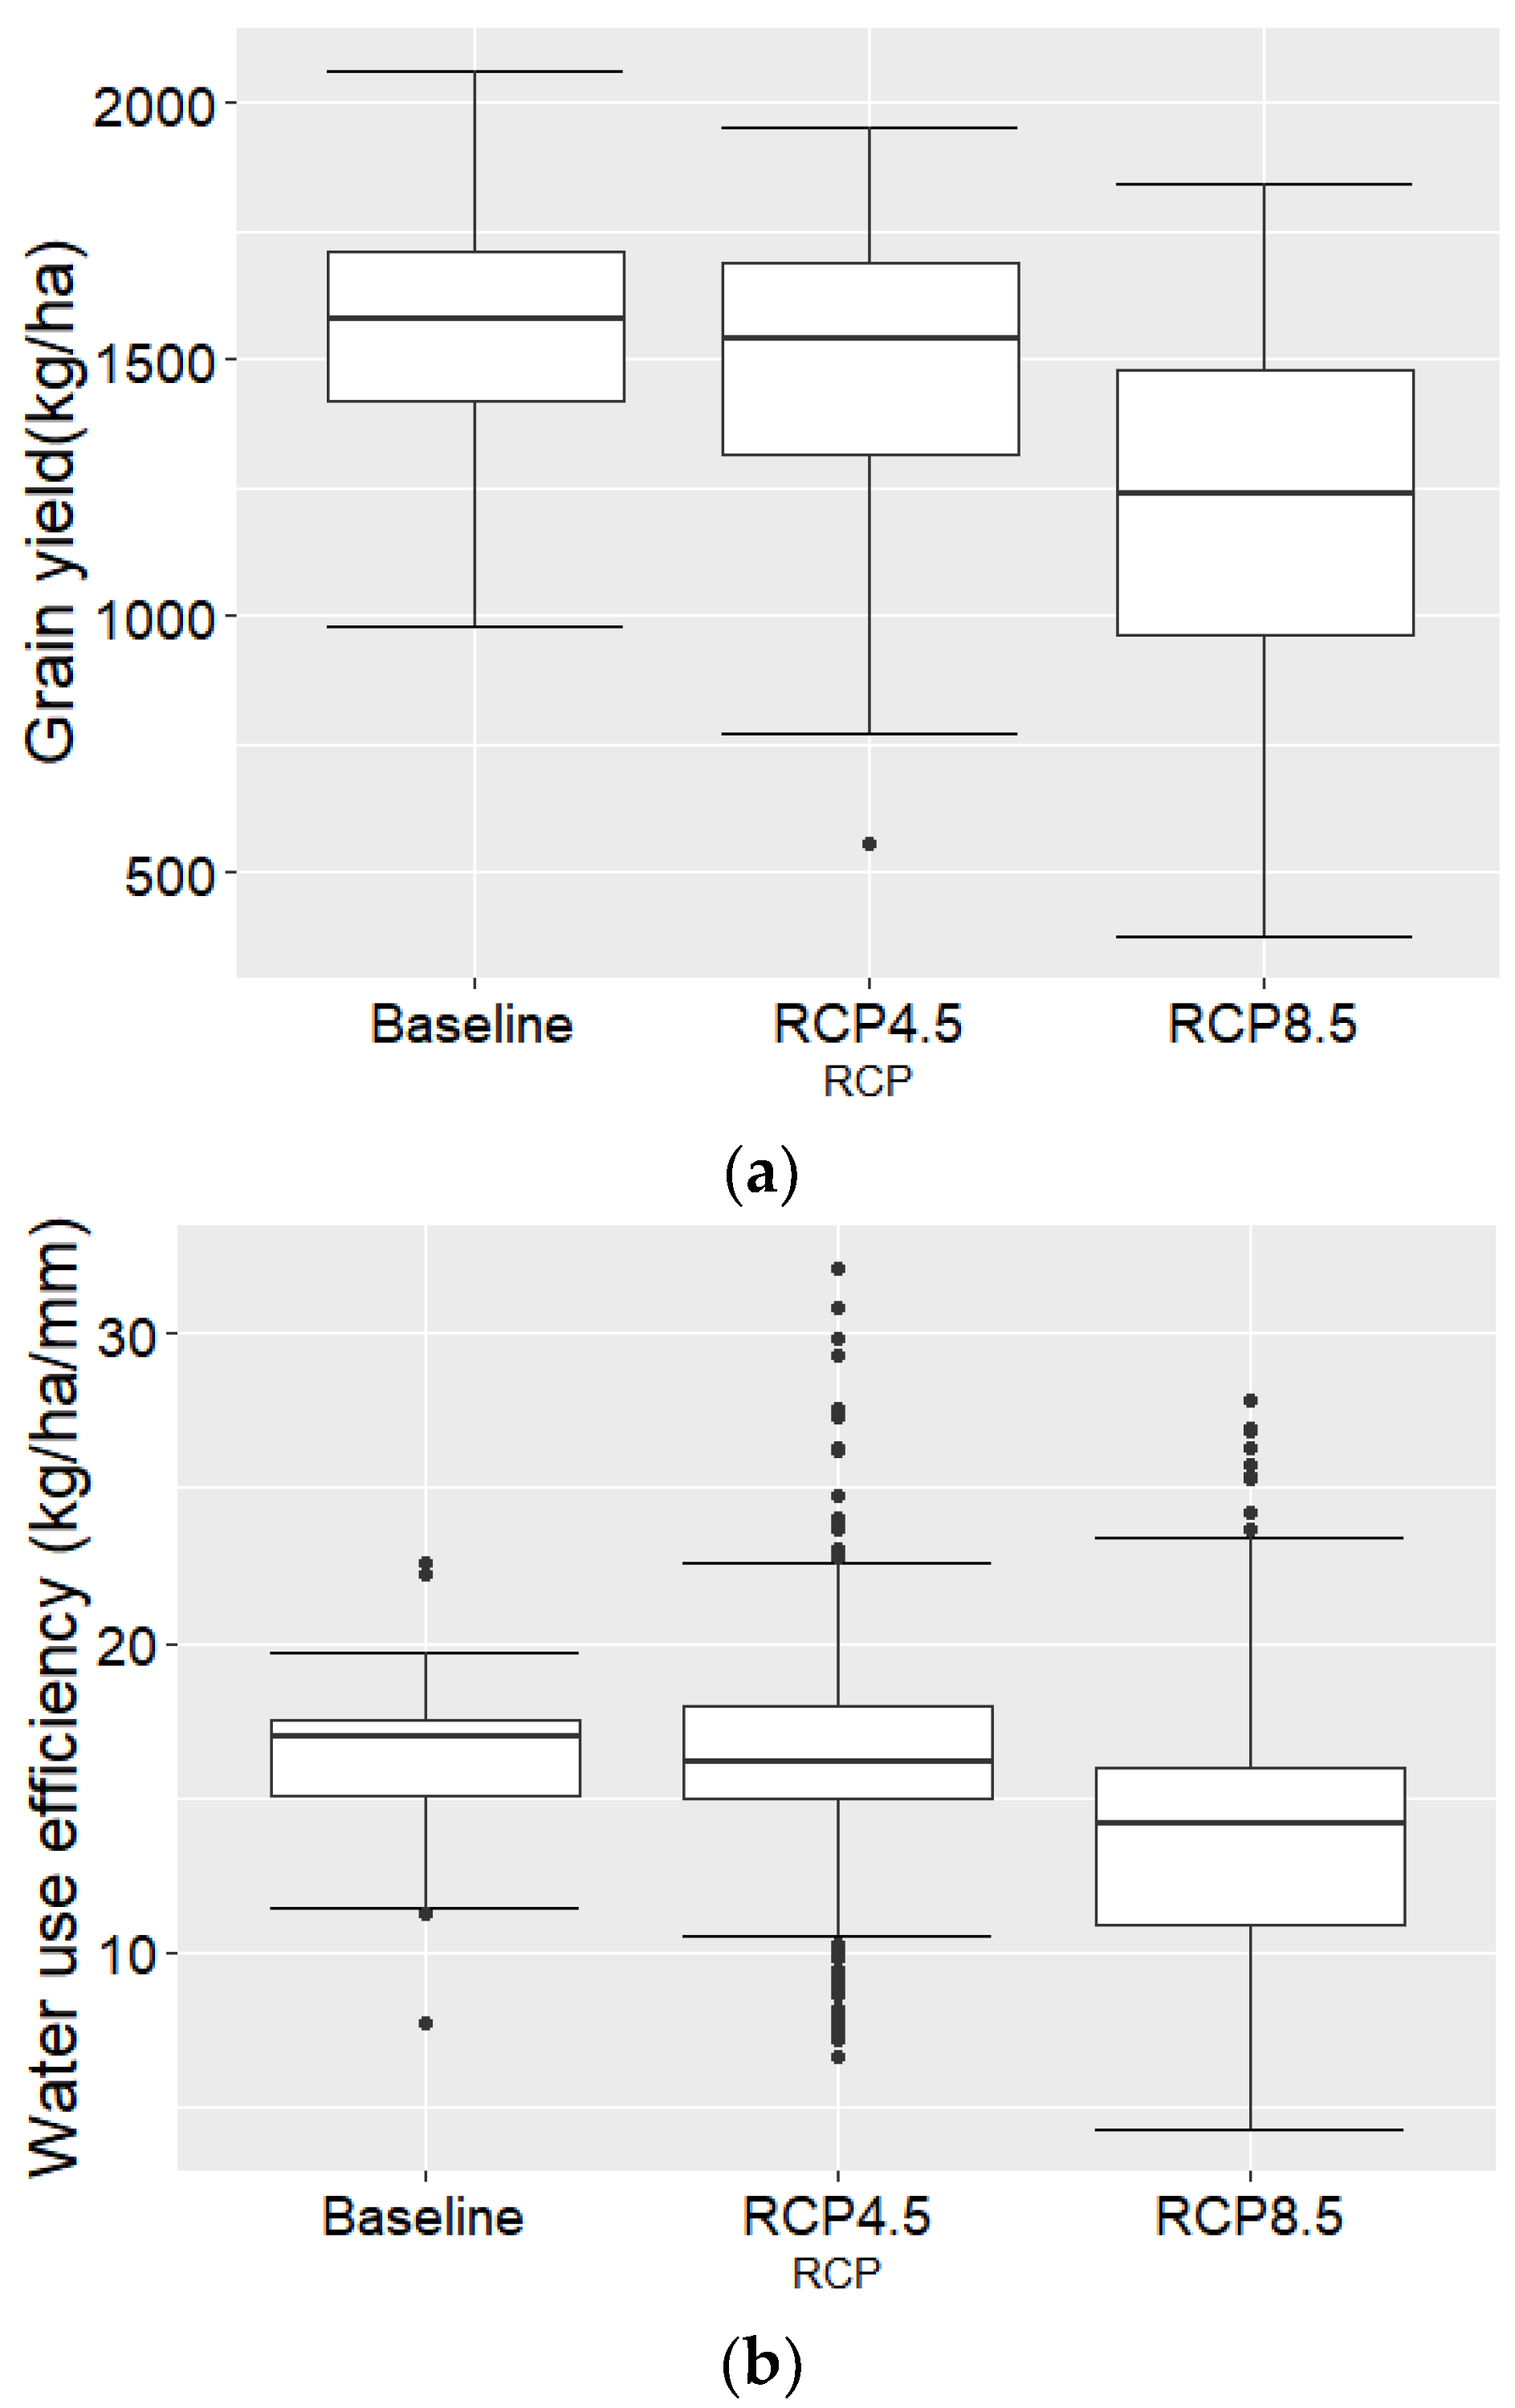
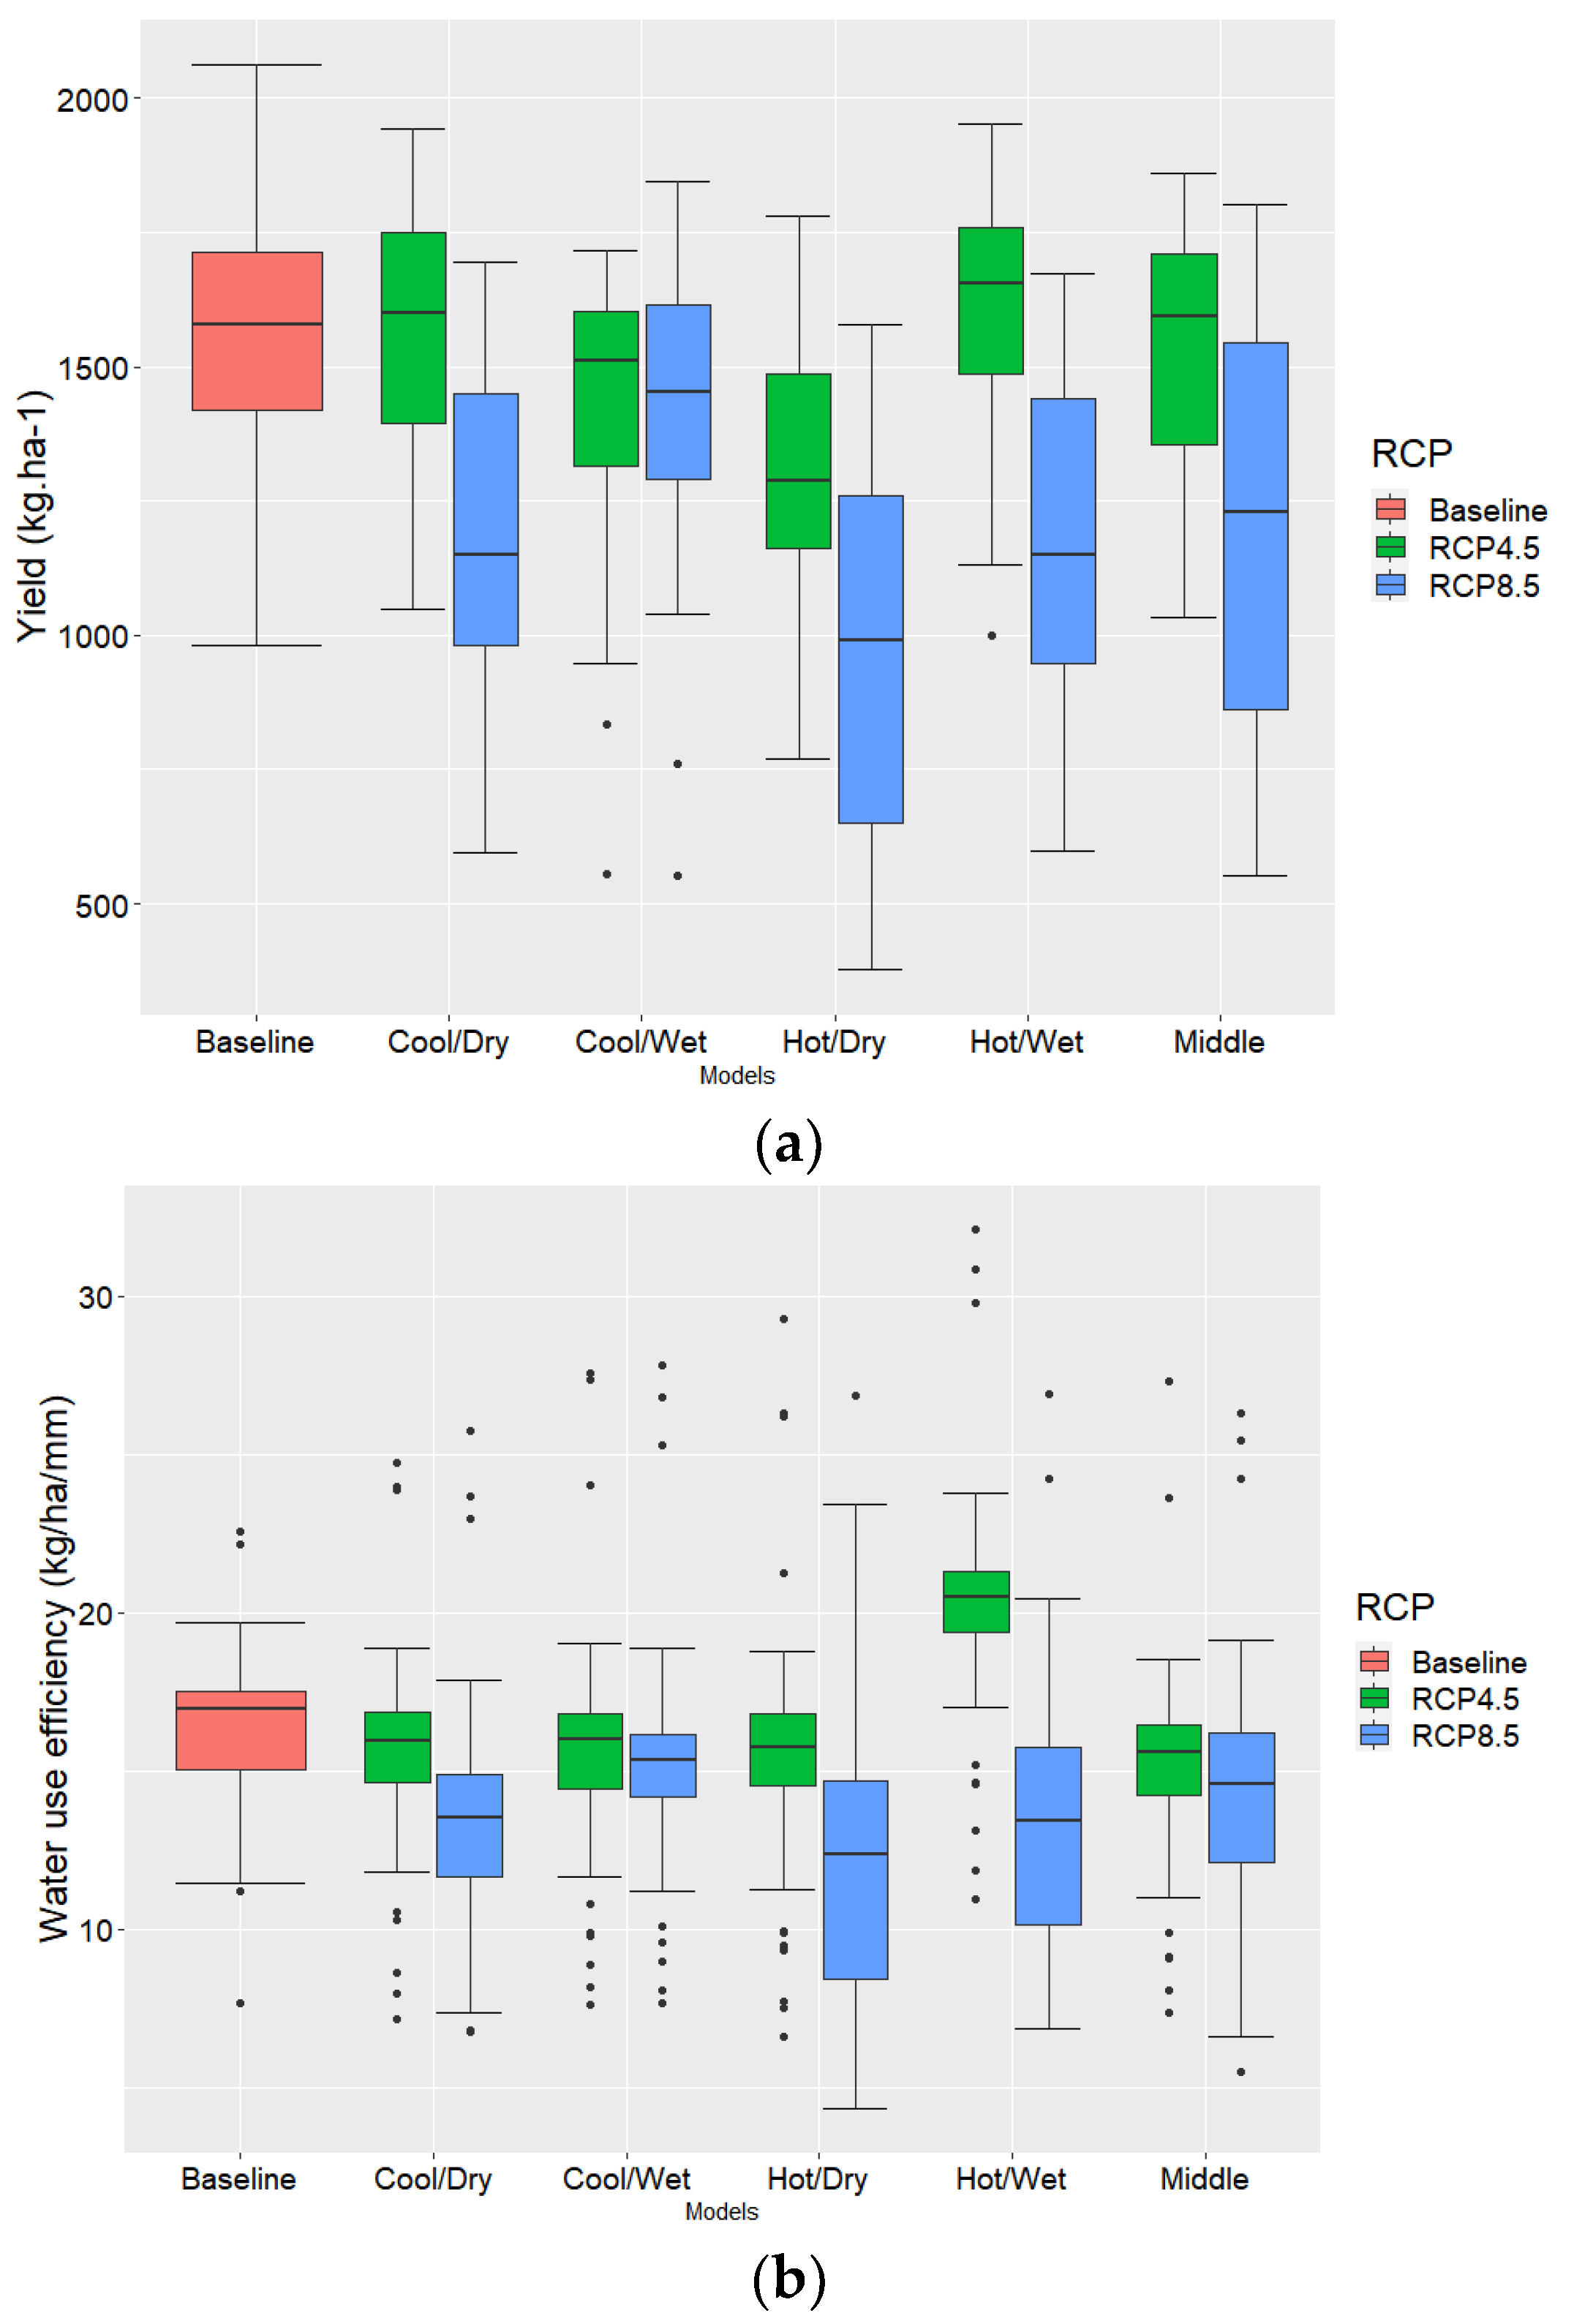
3.2.4. Impact of Climate Change on Future Maize Production in Ruzizi Plain

The projected climate change data (Figure 6) showed that in both RCP scenarios (4.5 and 8.5), maize grain yield, WUE, and soil water balance will be affected. A yield reduction of 3% compared to the baseline (1547 kg ha−1) will be observed for RCP 4.5 with a CV of 16.3%. On the other hand, a reduction of 26.2% yield will be observed if the climate follows the RCP 8.5, with a high CV (28.3%), and therefore, it will increase the uncertainty in maize production. The results showed no change in WUE for RCP 4.5, but there will be an increment in the uncertainty (CV 22.5%). In contrast, a decrease of 16.45% in WUE will be observed for RCP 8.5 with an increment of CV (28.4%).
Considering the five models representing different climate regimes separately (Figure 7), differences were observed in predicting yield, water use efficiency, and soil water balance. For RCP 4.5, most of the models showed a similarity in yield, with baseline conditions (1547 kg ha−1), with a slight advantage for the model predicting a cool/dry scenario (1570 kg ha−1) and a hot/wet scenario (1608 kg ha−1). Only the model predicting a hot/dry condition showed a lower yield (1311 kg ha−1) compared to the reference period, i.e., a yield reduction of 15.2%. Regarding future yield uncertainties, we noted that when the climate follows the RCP 4.5 trajectory, the inter–annual variation in yield would remain in the range of 13.7 to 18.4%. It is almost the same range as the baseline (15.6%). However, if the climate follows the RCP 8.5 trajectory, the uncertainty in agricultural production will be high. The models already predicted a reduction in yield ranging from 21.4 to 37.2%. The lowest yield reduction was observed for the model predicting a cool and wet climate (1431.5 kg ha−1), while the lowest yield was observed for the model predicting a hot/dry climate (971 kg ha−1). The model predicting a cool/wet condition had once again the lowest CV (16.3%). In contrast, the other models showed CVs ranging from 23.9 to 35.14% in the future. The model predicted that the highest variation in yield (35.14%) would be recorded when the future climate predicted will be hot/dry. In this circumstance, farmers will have challenges predicting their production and, thus, increase their vulnerability to climate change. Regarding the climate change impacts on the current production system (CM2/CM1), the CSM–CERES–Maize model showed no significant yield changes for all climate conditions under RCP 4.5, except for hot/dry conditions, where the model showed a future yield loss of 14%. In contrast, major changes were observed for all climate conditions under RCP 8.5, with the highest yield loss for hot/dry conditions (37%) and the lowest yield losses for the models predicting cool/dry conditions (7%).

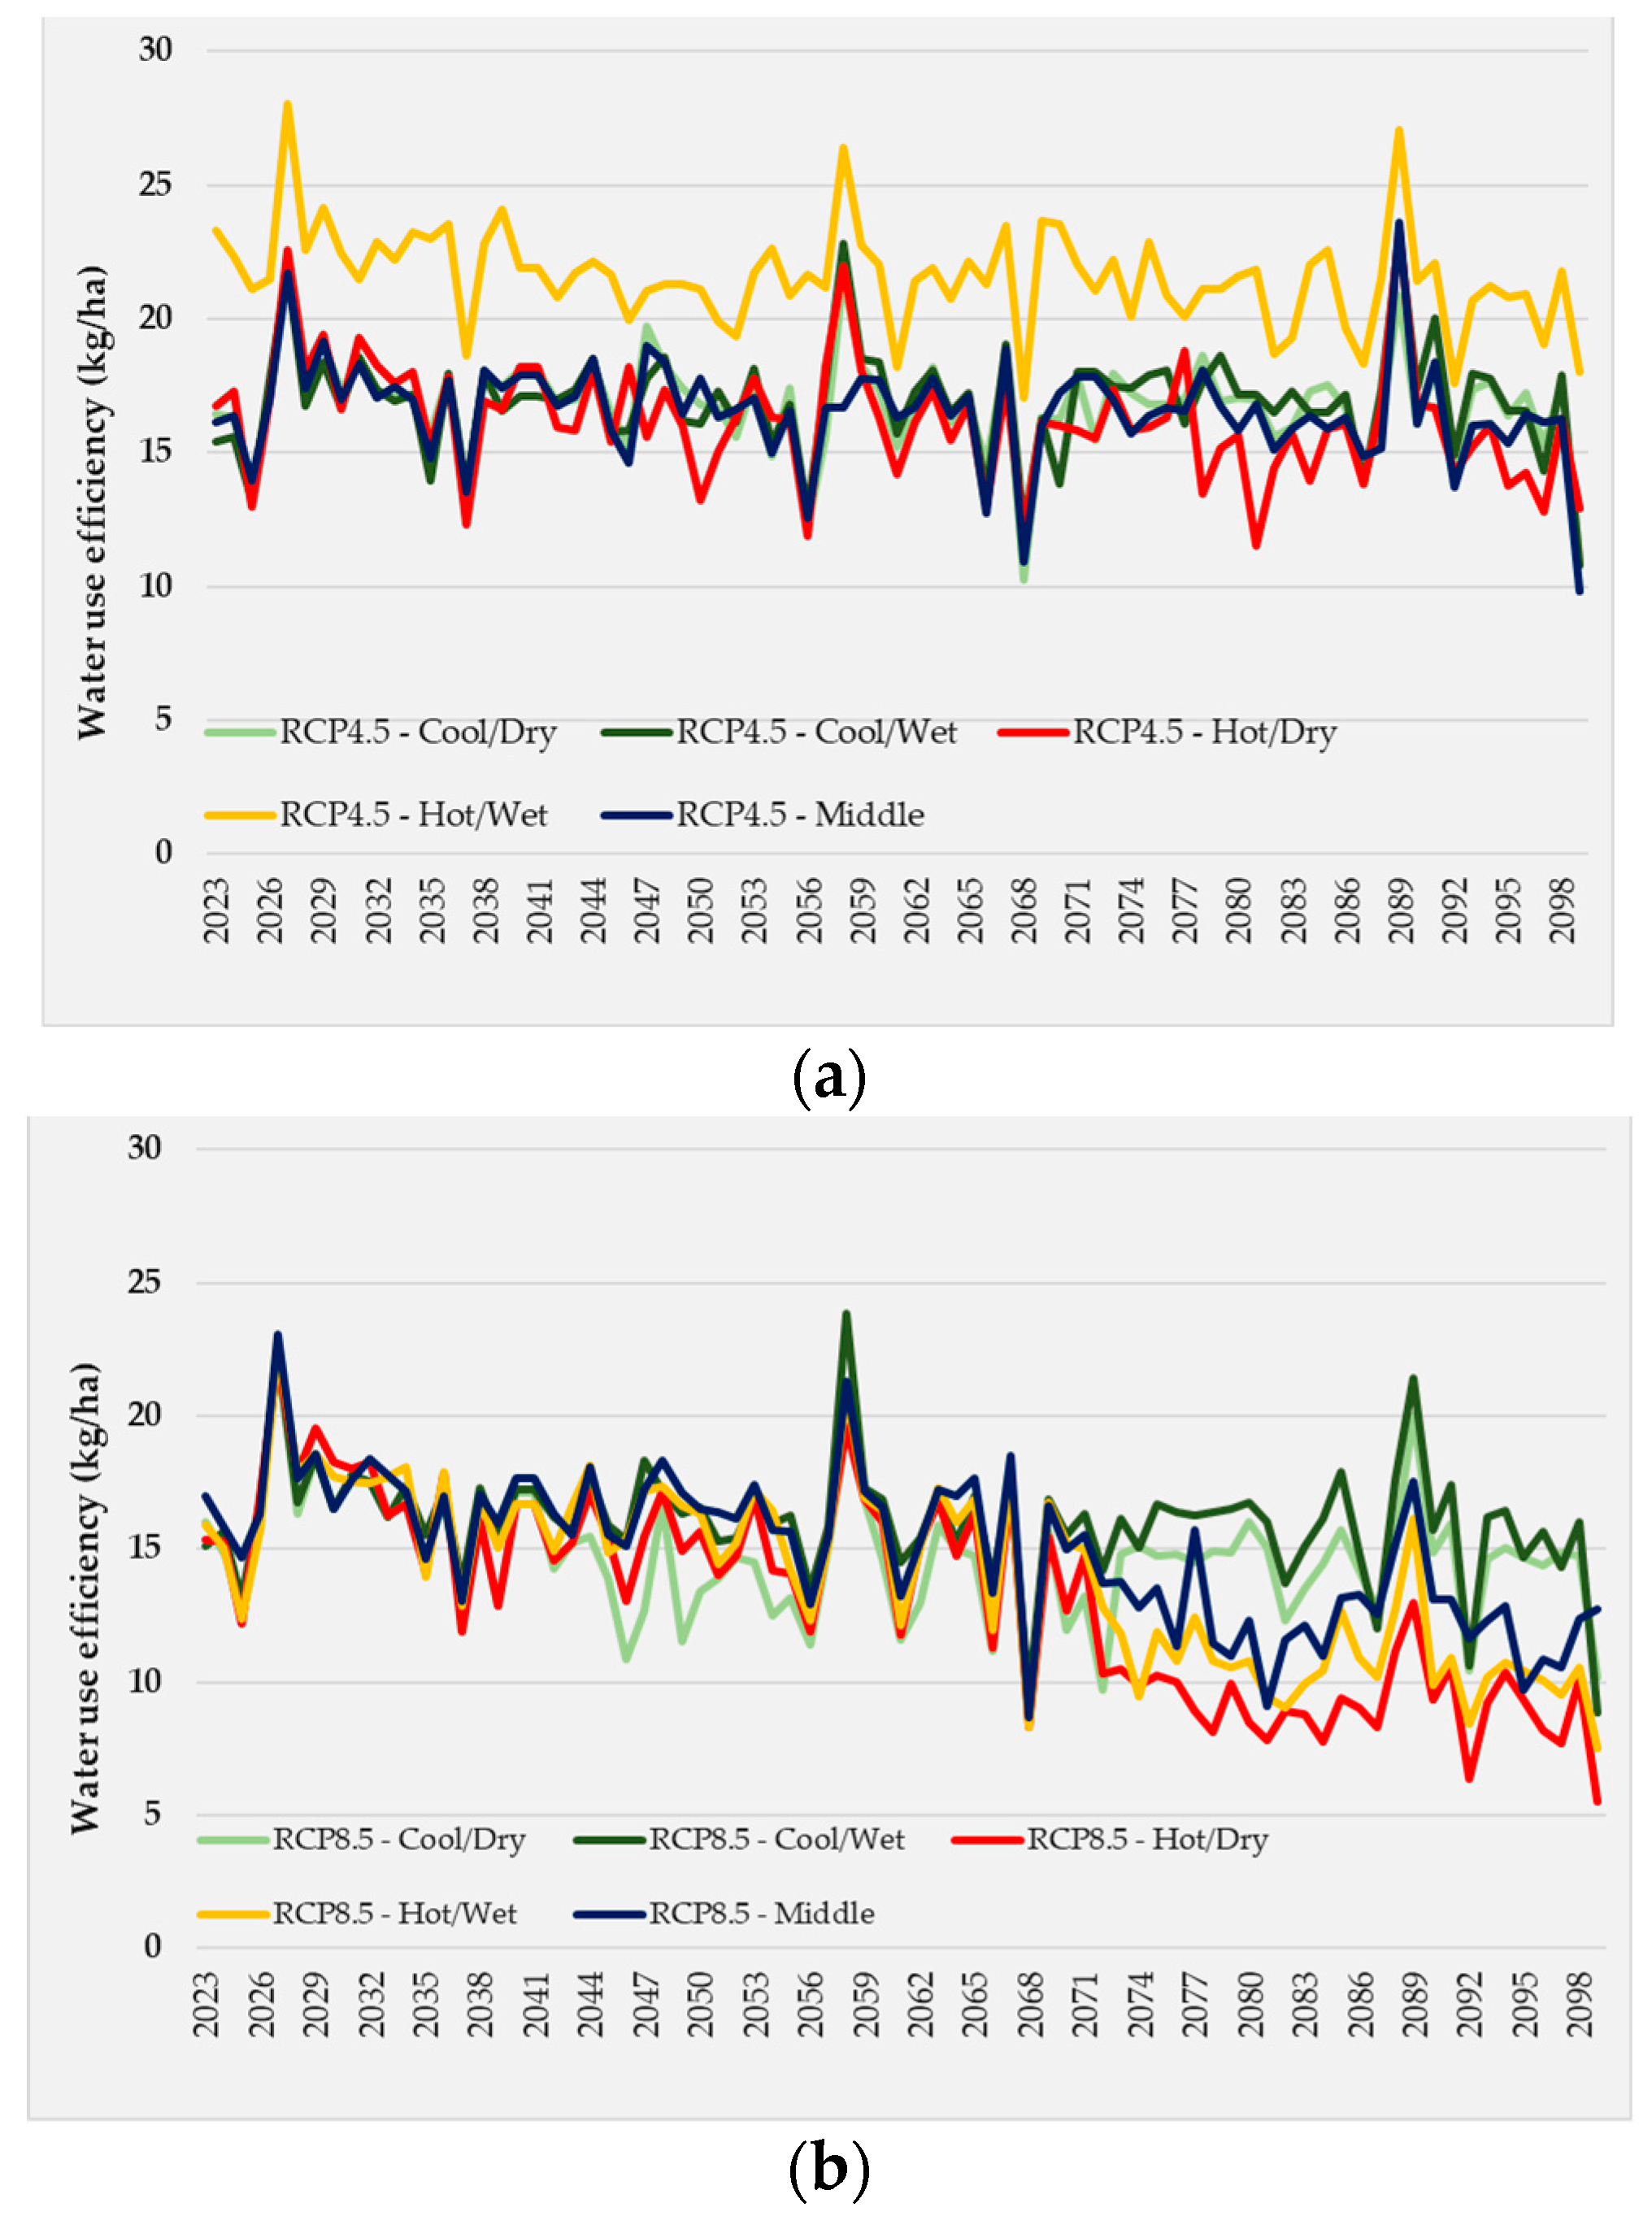
3.2.5. Change over Time in Water Use Efficiency for Different Climate Change Conditions under RCP 4.5 and RCP 8.5

Figure 8 presents a change in water use efficiency over time (from the near future to the end of the century). Considering RCP 4.5, the change over time showed a slight decrease in maize’s water use efficiency. The models that predict a hot and wet future climate showed a higher WUE (20.3 kg ha−1 mm−1) than others (15.5 kg ha−1 mm−1). Periods of rainfall rebound also showed a drastic change in WUE according to the rainfall trajectory, with maxima ranging from 24.72 to 32.08 kg ha−1 mm−1 and minima ranging from 6.6 to 10.9 kgha−1 mm−1. Towards 2075–2085, a decrease in WUE will be observed for the model that predicts a hot and dry climate until reaching a WUE of less than 13.9 kg ha−1 mm−1.
On the other hand, for an extreme climate path (RCP 8.5), all models predicted lower efficiencies (around 17 kg ha−1 mm−1) until the 2050s. From 2050 to 2070, periods of intense fluctuations in water use efficiency (CV = 22.4 to 31.8%) will be observed for all models before following periods of drastic falls of WUE at the end of the century (2070–2099). The highest decline of WUE will be observed for the model that predicts a hot and dry future climate, with an average of 8.13 kg ha−1 mm−1 during the period 2070–2100, and will reach a minimum of 4.3 kgha−1 mm−1. Certain stationarity (slight change) of water use efficiency could be achieved when the model predicts a cool and wet future.

3.2.6. Impact of Climate Change on Future Maize Production in Ruzizi Plain

The Figure 9 answers the question: What are the benefits of climate change adaptation strategies? The SWC adaptation strategy proposed in this study (tied ridge) has proven its benefits in previous experiments in the Ruzizi Plain and is well documented in Sub–Saharan African scientific literature. It is noted that under climate scenarios, tied ridges will increase maize yields compared to conventional tillage by 38.2 and 50.2% for RCP 4.5 and 8.5, respectively. In addition, tied ridges will decrease inter–annual variability compared to conventional tillage from 22.24 to 14.1% when the climate follows the RCP 4.5 scenario and from 28.4 to 19.83% for RCP 8.5. Considering the models separately, it was noticed that higher yields with tied ridges were obtained for the GCMs selected for RCP 4.5. However, for RCP 8.5, despite the comparative advantages over conventional tillage for all models, tied ridges would give better yield under a cool/wet condition (1949 kg ha−1). Therefore, WUE will observe an increase linked to the adoption of tied ridges, i.e., for RCP 4.5 and RCP 8.5, an increase of 12.1 and 15.3%, respectively, is likely to occur. Once again, the tied ridges will reduce the inter–annual variability of WUE, i.e., 5.45 and 17.2%, respectively, for the RCP 4.5 and RCP 8.5 trajectories. Considering the different models separately, we noticed that the tied ridges technique would allow a higher water use efficiency (22.7 kg ha−1 mm−1) under hot and wet GCMs for RCP 4.5, while the lowest WUE will be obtained for a hot and dry (14.5 kg ha−1 mm−1) and warm and wet (14.9 kg ha−1 mm−1) models. There is no doubt that WUE would remain higher when tied ridges are used as an adaptation option for all GCMS compared to traditional tillage. By using tied ridges as a soil water conservation option, soil water balance will improve the soil water balance by more than 62.1% for RCP 4.5 and 69.6% for RCP 8.5.
Examining the climate impact and adoption of SWC as potential adaptation options (CM4/CM2), tied ridges offer a guarantee of 48.2% in improving yields under the current maize production. With the predicted future climate change, adopting tied ridges would allow an improvement of 27–51% for RCP 4.5. The highest improvement will be observed under the hot/dry climate conditions (51%) and the lowest under hot/wet conditions. Although the model predicts a decrease in yield and WUE under RCP 8.5, tied ridges as an adaptation option will improve yield under all climatic conditions. The lowest improvement will be observed in a cool/wet condition (38%), while the highest in a hot/dry condition (68%).

4. Discussion

4.1. Historical and Future Climate Change

The 40–year historical climate trends confirm the fact that rainfall and temperature are the most critical components for maize growth and production. These results showed changes in yield for the RCP 4.5 and RCP 8.5 scenarios if no adaptation measure is undertaken. These changes are reflected in temperature increases of up to 3.05 °C for RCP 8.5 and high rainfall variability. An increase in temperature and rainfall variability in the region aligns with many studies conducted in East Africa [52,53]. These scholars considered that the increase in rainfall variability was more important than the rainfall mean values’ increase (climate change). However, for temperature, a mean value increase was considered more important than its variability. Gebrechorkos et al. [7] showed that seasonal rainfall had not changed significantly in large parts of East Africa in a study of long–term rainfall trends using high–resolution climate datasets. East Africa is known for its inter–annual rainfall variability [54], particularly modulated by large–scale climate forcings and changes in sea surface temperature, which affects the rainfall amount by modifying wind patterns and moisture fluxes [55]. Rainfall variability in this region is linked, according to several studies, to the El Nĩno Southern Oscillation (ENSO), the Indian Ocean Dipole (IOD), and the movement of the Intertropical Convergence Zone (ITCZ) [54,56]. The predicted temperature changes for the study region align with existing warming trends estimates [57,58,59]. This change will affect the trend of agricultural productivity and the loss of yield for major crops. IPCC [15] reports that rising global temperatures will be linked with changes in rainfall patterns and the frequency and duration of heat waves and droughts, which can affect crop health and productivity. Higher temperatures also affect the length of growing seasons and accelerate crop maturity. Soybean and rice projections showed a decline in some regions, but at the global scale, the different models still disagree on the overall impacts from climate change [15,30]. For maize and wheat, the climate effect was much clearer, with most of the model results pointing in the same direction. North and Central America, West Africa, East Africa, Central Asia, Brazil, and China will potentially see their maize yields decline in the coming years and beyond as average temperatures rise across these breadbasket regions, putting more stress on the plants [15,22,23,30].

4.2. Model Calibration and Sensitivity Analysis

The CERES–Maize model predicted a yield with a low root mean square (203.6 kg ha−1), a high d–index (0.94), and an acceptable R2 (0.82). Similar results [22,60] showed that the CSM–CERES–Maize model simulated maize yield and phenology with less difference between simulated and observed values in a semi–arid environment. The calibration result showed that grain yield was simulated more accurately with minimum data input. It can be attributed to the large number of datasets used for calibration, i.e., nine cropping seasons in the experiment and many selected farms. These results align with other research [61,62], which suggested that more accurate yield prediction is observed when data are collected from multiple locations and seasons. The DSSAT manual recommends to calibrate the CSM–CERES–Maize model under irrigated and pest–free conditions to obtain the most accurate results [18,45]. However, this study and many others, including those using the RIA approach of AgMIP [22], have successfully calibrated DSSAT using data from a rainfed crop, indicating that it is acceptable for simulating growth under rainfed conditions. Therefore, it is recommended to simulate complex and diverse farming systems in the tropics to assess the effects of climate change on rainfed agricultural production systems [63].
Sensitivity analysis indicated a high confidence level in model reliability when assessing yield response to climate change (temperature and precipitation) and the selected SWC adaptation strategies. The CSM–CERES–Maize model responded more to temperature and less to rainfall among the climate parameters investigated. The model response to temperature indicated that grain yield decreased by 7.2 to 46.3% with the increase of the current temperature from +1 to +6 °C. These changes could be explained by the fact that higher temperatures shorten the length of the growing season due to rapid growth, which reduces grain development/filling time and ultimately limits the attainable grain yield [22,64]. In addition, Hatfield and Prueger [65] emphasized that an increase in temperature may also decrease the opportunity to capture more radiation by shortening the growing cycle length.
In contrast to the response of the CSM–CERES–Maize model to temperature change, our results indicate a low response of maize to rainfall change. Values of the crop coefficients selected in the calibration process had already considered the high variability in rainfall for the historical data used. The probability of exceeding yields of 2800 kg ha−1 in the calibration is less than 1%. This is different from other farms where yields exceed 3500 kg ha−1, for which only a drastic decrease in rainfall can have significant changes in rainfall for these crop coefficient values.

4.3. Maize Production under Current and Future Climate Scenarios with and without SWC Adaptation Strategies

The CSM–CERES–Maize model predicted differences in yield, WUE, and SWB under different climate change scenarios. A slight decrease in yield (3%) with 16.45% CV was simulated when the climate trajectory followed RCP4.5. However, a significant decrease in yield (26.2%) compared to the baseline with 28.4% CV was simulated for RCP 8.5. These results align with those obtained by other researchers [66,67], who showed that the CSM–CERES–Maize model often simulates differences in maize yield between RCP scenarios. The slight change in the yield, WUE, and SWB for RCP 4.5 can be partially attributed to the slight change in temperature, while the change in yield and WUE variability follows the path of rainfall variability. The significant changes observed for RCP 8.5 can also be attributed to high temperature changes (1.84 to 3.08 °C compared to the baseline). This predicted yield loss is to be considered when it is known that the temperature change trends in the Ruzizi Plain (2 °C) already follow the RCP 8.5 predicted by IPCC across most drylands of SSA. Thus, the IPCC report [15] predicts a 2 °C difference in annual mean temperature above the baseline by the middle of the 21st Century and exceeding a 4 °C difference across most SSA drylands in the late 21st Century. The increase in yield, WUE, and SWB variability is also linked to an increase in rainfall variability for RCP 8.5. The yield, WUE, and SWB variabilities from this study agreed with many studies that have often shown that the East African climate is associated with high inter–annual variations, mainly in rainfall and recurrent dry and wet periods [68,69]. Among the five GCM models under RCP 4.5, only the model predicting a hot/dry climate showed that climate change will have a slight negative effect on maize yield, while others showed stationarity in yield compared to the baseline. On the other hand, a slight increase is observed when the GCMs predict a cool/wet future.
In contrast, all five models predicted a decrease in maize yield due to climate change under RCP 8.5, with a drastic decline for GCMs predicting a hot/dry future. This result can be explained by the trends of the temperature increment in all of these models and scenarios and is in agreement with the findings obtained by Ahmad et al. [22] and Yasin et al. [70]. Some scholars also predicted a slight increase in maize yield from the baseline under a sub–humid climate, whereas a significant decrease under semi–arid conditions [71]. The Regional Impact Assessment of AgMIP project studies found significant variations in yield predictions and range between −20 and −45% for maize yield by 2100 [72,73]. These researchers explained that the decrease in yield would mainly be due to the increase in temperature and less to the decrease in rainfall, causing considerable losses to small–scale farmers. In terms of water availability, predictions of the temperature increment will influence more evapotranspiration, which is a crucial component of the soil water balance. Studies have shown that projected maize grain yield, WUE, and SWB will also be related to changes in evapotranspiration [25,74,75]. In Ruzizi Plain, water losses due to potential evapotranspiration will continue to exceed available rainfall supplies, indicating a risk of increased water deficits.
The use of adaptation technologies would reduce the uncertainty of future maize production with more likelihood of a decline in productivity predicted by the models. Therefore, SWC practices are appropriate adaptation measures to reduce the vulnerability of current production systems to climate change. Our findings indicate that the tied ridges SWC practice is likely to increase and stabilize maize grain yield, WUE, and SWB for all five climate regimes under the RCP4.5 and RCP8.5 scenarios compared to conventional tillage. The high effectiveness of tied ridges compared to conventional tillage in improving grain yield, WUE, and SWB can be attributed to improved soil moisture storage and availability in rainfed production systems [76]. In addition, tied ridges tend to increase lateral and vertical water flows in ridges, thereby improving soil water storage. Small amounts of rainfall are more likely to be retained in the micropores and constitute the soil water reserve. Large amounts of rainfall increase soil water–logging, significantly decreasing oxygen amounts, and this affects the WUE. Many scholars found the ability of tied ridges to reduce surface runoff and to induce a favorable distribution of soil water [12,77]. Our results agree with Wolka et al. [12], finding that 83% of reviewed trials in SSA recorded a positive effect of tied ridges in improving soil water storage and WUE in low rainfall areas (<1000 mm year−1). Other researchers [78,79,80,81] also observed that tied ridges had the highest potential to save water compared to conventional tillage in the Sahelian region.
Given the contrast in yield predicted by the five GCMs, there is need for further studies on the reliability of climate model data to increase the accuracy of crop prediction. The pattern of maize yield change predicted by the CSM–CERES–Maize model could be attributed to other factors such as temperature and practical SWC, but less to rainfall. It should be noted that the inter–annual variability of rainfall captured in the historical data was already considered in the calibration. The sensitivity analysis showed that only rainfall changes of about 50% allow a change in the yield predicted by the CERES model. Thus, global and regional climate models (GCMs and RCMs) raise questions about the reliability of rainfall information. Many researchers have shown that GCMs have a poor representation of the temporal variability of precipitation [82,83]. Although RCMs present several advantages, we are still far from obtaining an accurate simulation of the temporal sequence of daily rainfall. For example, the Delta method used in the RIA approach for generating RCMs’ data for this study assumes that historical rainfall occurrence remains unchanged in the future [82]. This is not true in real–world climate systems, as indicated by many studies that found the occurrences are not stationary for future periods [84]. Thus, the IPCC underlines the need for further research on climate change scenarios for improving agricultural impact assessment [15]. Beyond the aspects related to the improvement of climate projection data, it is also important to concentrate efforts on building components related to soil and water management practices in DSSAT, which are key elements of climate change adaptation. Since the soil type change has an influence on modelling outcomes at the regional scale, we would recommend that future studies include the soil type as a factor for more refined results [85,86].

5. Conclusions

This study was conducted in the Ruzizi Plain, a dryland area, to assess the performance of maize under two Representative Concentration Pathways (RCP 4.5 and 8.5) and two SWC practices (tied ridges and conventional tillage). The RIA approach was used to quantify the changes due to climate. The temperature will continue to increase with different magnitudes according to the RCPs, with the highest increase when the future follows RCP 8.5. Crop model simulations showed that maize yield and WUE would decline with climate change following the RCP 8.5 scenario. However, adopting tied ridges as a SWC adaptation option showed potential to reduce the effects of long–term climate change to a certain extent. Therefore, it can be a promising adaptation package for increasing maize yield and WUE in the Ruzizi Plain and other areas of the world experiencing similar climatic conditions.

Supplementary Materials

The following supporting information can be downloaded at: https://www.mdpi.com/article/10.3390/land11091409/s1, Figure S1: Location of the experimental site, Ruzizi plain, eastern D.R. Congo; Figure S2: Temperature-precipitation change scatter plots for selection of appropriate GCMs; Table S1: Summary of 29 CMIP5 GCMs that form the ensemble of climate projections that was used.

Author Contributions

Conceptualization and design of the study: E.M.B. and J.G.M.M.; formal analysis: E.M.B. and C.B.M.; funding acquisition: J.G.M.M. and G.N.M.; investigation: E.M.B.; supervision: J.G.M.M., T.A.B., and P.M.; visualization: E.M.B.; writing—original draft: E.M.B.; writing—review and editing: J.-G.M.M., J.G.M.M., G.B.C., T.A.B., J.-B.T., G.N.M., P.M., M.M.T., A.E., and C.B.M. All authors have read and agreed to the published version of the manuscript.

Funding

Financial support for this research was provided by the Capacity–Building Competitive Grant “Training the Next Generation of Scientists for Africa”, funded by Carnegie Cooperation of New York, through the Regional Universities Forum for Capacity Building in Agriculture (RUFORUM). The research received also funding from UK Research and Innovation (UKRI) through the Global Challenges Research Fund (GCRF) programme, Grant Ref: ES/P011306/ under the project Social and Environmental Trade-offs in African Agriculture (SENTINEL) led by International Institute for Environment and Development (IIED) in part implemented by the Regional Universities Forum for Capacity Building in Agriculture (RUFORUM).

Institutional Review Board Statement

Not applicable.

Informed Consent Statement

Not applicable.

Data Availability Statement

Most of the data are contained within the article and Supplementary Files. Additional data are available upon request from the corresponding author.

Acknowledgments

We are grateful for the support of the Université Evangélique en Afrique in data collection.

Conflicts of Interest

The authors declare no conflict of interest.

References

  1. Wang, Y.; Wu, H.; Li, Z. Assessment of Sectoral Virtual Water Flows and Future Water Requirement in Agriculture Under SSP–RCP Scenarios: Reflections for Water Resources Management in Zhangye City. Front. Ecol. Evol. 2022, 10, 901873. [Google Scholar]
  2. Goenster, S.; Wiehle, M.; Gebauer, J.; Mohamed Ali, A.; Stern, R.D.; Buerkert, A. Daily rainfall data to identify trends in rainfall amount and rainfall–induced agricultural events in the Nuba Mountains of Sudan. J. Arid. Environ. 2015, 122, 16–26. [Google Scholar] [CrossRef]
  3. Dimitriadou, S.; Nikolakopoulos, K.G. Evapotranspiration Trends and Interactions in Light of the Anthropogenic Footprint and the Climate Crisis: A Review. Hydrology 2021, 8, 163. [Google Scholar]
  4. Sultan, B.; Defrance, D.; Iizumi, T. Evidence of crop production losses in West Africa due to historical global warming in two crop models. Sci. Rep. 2019, 9, 12834. [Google Scholar] [CrossRef] [PubMed]
  5. Kyei–Mensah, C.; Kyerematen, R.; Adu–Acheampong, S. Impact of Rainfall Variability on Crop Production within the Worobong Ecological Area of Fanteakwa District, Ghana. Adv. Agric. 2019, 2019, 7930127. [Google Scholar] [CrossRef]
  6. Bodner, G.; Nakhforoosh, A.; Kaul, H.-P. Management of crop water under drought: A review. Agron. Sustain. Dev. 2015, 35, 401–442. [Google Scholar]
  7. Gebrechorkos, S.H.; Hülsmann, S.; Bernhofer, C. Long–Term trends in rainfall and temperature using high–resolution climate datasets in East Africa. Sci. Rep. 2019, 9, 11376. [Google Scholar]
  8. Gherardi, L.A.; Sala, O.E. Effect of interannual precipitation variability on dryland productivity: A global synthesis. Glob. Chang. Biol. 2019, 25, 269–276. [Google Scholar]
  9. Ministry of Foreign Affairs of the Netherlands. Climate Change Profile: East African Great Lakes and Ruzizi Plain. In The Hague; 2018. Available online: https://www.government.nl/binaries/government/documenten/publications/2019/02/05/climate–change–profiles/Great+Lakes.pdf (accessed on 15 July 2021).
  10. Bagula, E.M.; Majaliwa, J.G.; Mushagalusa, G.N.; Basamba, T.A.; Tumuhairwe, J.B.; Akello, S.; Mondo, J.G.M.; Geofrey, G.; Musinguzi, P.; Mwimangire, B.C.; et al. Water and nutrient balances under selected soil and water conservation practices in semi–arid Ruzizi plain, Eastern Democratic Republic of Congo. Afr. J. Agric. Res. 2021, 17, 1407–1419. [Google Scholar]
  11. Zougmoré, R.B.; Partey, S.T.; Ouédraogo, M.; Torquebiau, E.; Campbell, B.M. Facing climate variability in sub–Saharan Africa: Analysis of climate–smart agriculture opportunities to manage climate–related risks. Cah. Agric. 2018, 27, 34001. [Google Scholar]
  12. Wolka, K.; Mulder, J.; Biazin, B. Effects of soil and water conservation techniques on crop yield, runoff and soil loss in Sub–Saharan Africa: A review. Agric. Water Manag. 2018, 207, 67–79. [Google Scholar] [CrossRef]
  13. Araya, A.; Stroosnijder, L. Effects of tied ridges and mulch on barley (Hordeum vulgare) rainwater use efficiency and production in Northern Ethiopia. Agric. Water Manag. 2010, 97, 841–847. [Google Scholar] [CrossRef]
  14. Adimassu, Z.; Langan, S.; Johnston, S.R.; Mekuria, W.; Amede, T. Impacts of Soil and Water Conservation Practices on Crop Yield, Run-off, Soil Loss and Nutrient Loss in Ethiopia: Review and Synthesis. Environ. Manag. 2017, 59, 87–101. [Google Scholar] [CrossRef]
  15. IPCC. Climate Change 2022: Mitigation of Climate Change; Cambridge University Press: Cambridge, MA, USA, 2022; Volume 1454, Available online: https://www.ipcc.ch/report/ar6/wg3/ (accessed on 18 February 2022).
  16. Ochieng, J.; Kirimi, L.; Mathenge, M. Effects of climate variability and change on agricultural production: The case of small scale farmers in Kenya. NJAS Wagening. J. Life Sci. 2016, 77, 71–78. [Google Scholar] [CrossRef]
  17. Gornall, J.; Betts, R.; Burke, E.; Clark, R.; Camp, J.; Willett, K.; Wiltshire, A. Implications of climate change for agricultural productivity in the early twenty–first century. Philos. Trans. Royal Soc. B Biol. Sci. 2010, 365, 2973–2989. [Google Scholar] [CrossRef]
  18. Jones, J.W.; Hoogenboom, G.; Porter, C.H.; Boote, K.J.; Batchelor, W.D.; Hunt, L.A.; Ritchie, J.T. The DSSAT cropping system model. Eur. J. Agron. 2003, 8, 235–265. [Google Scholar] [CrossRef]
  19. Holzworth, D.P.; Huth, N.I.; deVoil, P.G.; Zurcher, E.J.; Herrmann, N.I.; McLean, G.; Keating, B.A. APSIM—Evolution towards a new generation of agricultural systems simulation. Environ. Model. Softw. 2014, 62, 327–350. [Google Scholar] [CrossRef]
  20. Tovihoudji, P.G.; Akponikpè, P.B.I.; Agbossou, E.K.; Bielders, C.L. Using the DSSAT Model to Support Decision Making Regarding Fertilizer Microdosing for Maize Production in the Sub–humid Region of Benin. Front. Environ. Sci. 2019, 7, 13. [Google Scholar] [CrossRef]
  21. Lorite, I.J.; Ruiz–Ramos, M.; Gabaldón–Leal, C.; Cruz–Blanco, M.; Porras, R.; Santos, C. Chapter 1—Water Management and Climate Change in Semiarid Environments. In Water Scarcity and Sustainable Agriculture in Semiarid Environment; García Tejero, I.F., Durán Zuazo, S.E., Eds.; Academic Press: Cambridge, MA, USA, 2018; pp. 3–40. [Google Scholar]
  22. Ahmad, I.; Ahmad, B.; Boote, K.; Hoogenboom, G. Adaptation strategies for maize production under climate change for semi–arid environments. Eur. J. Agron. 2020, 115, 126040. [Google Scholar] [CrossRef]
  23. Li, Y.; Tian, D.; Feng, G.; Yang, W.; Feng, L. Climate change and cover crop effects on water use efficiency of a corn–soybean rotation system. Agric. Water Manag. 2021, 255, 107042. [Google Scholar] [CrossRef]
  24. López–Cedrón, F.X.; Boote, K.J.; Piñeiro, J.; Sau, F. Improving the CERES–Maize model ability to simulate water deficit impact on maize production and yield components. Agron. J. 2008, 100, 296–307. [Google Scholar] [CrossRef]
  25. Zizinga, A.; Mwanjalolo, J.G.M.; Tietjen, B.; Bedadi, B.; Pathak, H.; Gabiri, G.; Beesigamukama, D. Climate change and maize productivity in Uganda: Simulating the impacts and alleviation with climate smart agriculture practices. Agric. Syst. 2022, 199, 103407. [Google Scholar] [CrossRef]
  26. Ngwira, A.R.; Aune, J.B.; Thierfelder, C. DSSAT modelling of conservation agriculture maize response to climate change in Malawi. Soil Tillage Res. 2014, 143, 85–94. [Google Scholar] [CrossRef]
  27. Corbeels, M.; Chirat, G.; Messad, G.; Thierfelder, C. Performance and sensitivity of the DSSAT crop growth model in simulating maize yield under conservation agriculture. Eur. J. Agron. 2016, 76, 41–53. [Google Scholar] [CrossRef]
  28. Adnan, A.A.; Jibrin, J.M.; Kamara, A.Y.; Abdulrahman, B.L.; Shaibu, A.S.; Garba, I.I. CERES–Maize Model for Determining the Optimum Planting Dates of Early Maturing Maize Varieties in Northern Nigeria. Front. Plant. Sci. 2017, 8, 1118. [Google Scholar] [CrossRef]
  29. MacCarthy, D.S.; Adiku, S.G.; Freduah, B.S.; Kamara, A.Y.; Narh, S.; Abdulai, A.L. Evaluating maize yield variability and gaps in two agroecologies in northern Ghana using a crop simulation model. South Afr. J. Plant Soil 2018, 35, 137–147. [Google Scholar] [CrossRef]
  30. Thorburn, P.J.; Boote, K.J.; Hargreaves, J.N.G.; Poulton, P.L.; Jones, J.W. Cropping systems modeling in AgMIP: A new protocol-driven approach for regional integrated assessments. In Handbook of Climate Change and Agroecosystems; Imperial College Press: London, UK, 2015; Volume 3, pp. 79–99. [Google Scholar]
  31. Rosenzweig, C.; Hillel, D. Introduction: The role of the agricultural model intercomparison and improvement project. In Handbook of Climate Change and Agroecosystems; Imperial College Press: London, UK, 2015; Volume 3, pp. xxiii–xxvii. [Google Scholar]
  32. Rosenzweig, C.; Jones, J.W.; Hatfield, J.L.; Ruane, A.C.; Boote, K.J.; Thorburn, P.; Winter, J.M. The Agricultural Model Intercomparison and Improvement Project (AgMIP): Protocols and pilot studies. Agric. For. Meteorol. 2013, 170, 166–182. [Google Scholar] [CrossRef] [Green Version]
  33. Eisenberg, J.; Muvundja, F.A. Quantification of Erosion in Selected Catchment Areas of the Ruzizi River (DRC) Using the (R)USLE Model. Land 2020, 9, 125. [Google Scholar] [CrossRef]
  34. Rosenzweig, C.; Jones, J.W.; Hatfield, J.L.; Antle, J.M.; Ruane, A.C.; Mutter, C.Z. The agricultural model intercomparison and improvement project: Phase I activities by a global community of science. In Handbook of Climate Change and Agroecosystems; Imperial College Press: London, UK, 2015; Volume 3, pp. 3–24. [Google Scholar]
  35. Antle, J.M.; Homann–KeeTui, S.; Descheemaeker, K.; Masikati, P.; Valdivia, R.O. Using AgMIP Regional Integrated Assessment Methods to Evaluate Vulnerability, Resilience and Adaptive Capacity for Climate Smart Agricultural Systems BT—Climate Smart Agriculture: Building Resilience to Climate Change; Lipper, N., McCarthy, D., Zilberman, S., Asfaw, G., Branca, L., Eds.; Springer International Publishing: Cham, Switzerland, 2018; pp. 307–333. [Google Scholar]
  36. Rienecker, M.M.; Suarez, M.J.; Gelaro, R.; Todling, R.; Bacmeister, J.; Liu, E.; Woollen, J. MERRA: NASA’s Modern–Era Retrospective Analysis for Research and Applications. J. Clim. 2011, 24, 3624–3648. [Google Scholar] [CrossRef]
  37. Ruane, A.C.; Goldberg, R.; Chryssanthacopoulos, J. Climate forcing datasets for agricultural modeling: Merged products for gap–filling and historical climate series estimation. Agric. For. Meteorol. 2015, 200, 233–248. [Google Scholar] [CrossRef]
  38. Kashani, M.H.; Dinpashoh, Y. Evaluation of efficiency of different estimation methods for missing climatological data Evaluation of efficiency of different estimation methods for missing climatological data. Stoch. Environ. Res. Risk Assess 2012, 26, 59–71. [Google Scholar] [CrossRef]
  39. Ruane, A.C.; McDermid, S.P. Selection of a representative subset of global climate models that captures the profile of regional changes for integrated climate impacts assessment. Earth Perspect. 2017, 4, 1. [Google Scholar] [CrossRef]
  40. Mote, P.W.; Salathé, E.P. Future climate in the Pacific Northwest. Clim. Change 2010, 102, 29–50. [Google Scholar] [CrossRef]
  41. White, J.W.; Hoogenboom, G.; Kimball, B.A.; GWall, W. Methodologies for simulating impacts of climate change on crop production. F. Crop. Res. 2011, 124, 357–368. [Google Scholar] [CrossRef]
  42. Salmi, T.; Määttä, A.; Anttila, P.; Ruoho–Airola, T.; Amnell, T. Detecting Trends of Annual Values of Atmospheric Pollutants by Mann–Kendal Test and Sen’s Slope Estimates–The Excel Template Application MAKESENS, Finnish Meteorological Institute, Publications on Air Quality, 2002, 31p. Available online: https://www.worldcat.org/title/1075517762 (accessed on 13 February 2022).
  43. Hsiao, W.T.; Maloney, E.D.; Barnes, E.A. Investigating Recent Changes in MJO Precipitation and Circulation in Multiple Reanalyses. Geophys. Res. Lett. 2020, 47, e2020GL090139. [Google Scholar] [CrossRef]
  44. Kulimushi, P.Z.; Basime, G.C.; Nachigera, G.M.; Thonart, P.; Ongena, M. Efficacy of Bacillus amyloliquefaciens as biocontrol agent to fight fungal diseases of maize under tropical climates: From lab to field assays in south Kivu. Environ. Sci. Pollut. Res. 2018, 25, 29808–29821. [Google Scholar] [CrossRef]
  45. Hoogenboom, G.; Porter, C.H.; Boote, K.J.; Shelia, V.; Wilkens, P.W.; Singh, U.; Jones, J.W. The DSSAT Crop Modeling Ecosystem; Burleigh Dodds Science Publishing: Cambridge, UK, 2019; pp. 173–216. [Google Scholar]
  46. Bagula, E.M.; Mapatano, S.; Katcho, K.; Mushagalusa, N.G. Efficiency of soil water and fertility management practices on maize yields in semiarid regions: Case of the Ruzizi plain (South Kivu, Democratic Republic of Congo)). VertigO 2013, 17. [Google Scholar] [CrossRef]
  47. Bagula, M.E.; Pypers, P.; Mushagalusa, N.G.; Muhigwa, J.B. Assessment of Fertilizer Use Efficiency of Maize in the Weathered Soils of Walungu District, DR Congo; Springer: Cham, Switzerland, 2016; pp. 187–199. [Google Scholar]
  48. Timsina, J.; Humphreys, E. Performance of CERES–Rice and CERES–Wheat models in rice–wheat systems: A review. Agric. Syst. 2006, 90, 5–31. [Google Scholar] [CrossRef]
  49. Gaydon, D.S.; Wang, E.; Poulton, P.L.; Ahmad, B.; Ahmed, F.; Akhter, S.; Roth, C.H. Evaluation of the APSIM model in cropping systems of Asia. Field Crop. Res. 2017, 204, 52–75. [Google Scholar] [CrossRef]
  50. Jiang, Y.; Zhang, L.; Zhang, B.; He, C.; Jin, X.; Bai, X. Modeling irrigation management for water conservation by DSSAT–maize model in arid northwestern China. Agric. Water Manag. 2016, 177, 37–45. [Google Scholar] [CrossRef]
  51. Mwazembe, D.J.; Ankumah, R.; Rwehumbiza, F.; Kajumla, S.M. Sensitivity of CERES–maize simulated yields to biogeochemical components. In Proceedings of the Fifth African Higher Education Week and RUFORUM Biennial Conference 2016, “Linking Agricultural Universities with Civil Society, the Private Sector, Governments and Other Stakeholders in Support of Agricultural Development in Africa”, Cape Town, South Africa, 17–21 October 2016; pp. 431–436. [Google Scholar]
  52. Egeru, A.; Barasa, B.; Nampijja, J.; Siya, A.; Makooma, M.T.; Majaliwa, M.G. Past, Present and Future Climate Trends Under Varied Representative Concentration Pathways for a Sub–Humid Region in Uganda. Climate 2019, 7, 35. [Google Scholar] [CrossRef]
  53. Massawe, W.C.; Xiao, Z. Analysis of rainfall variability over Tanzania in late austral summer. Atmos. Ocean. Sci. Lett. 2021, 14, 100049. [Google Scholar] [CrossRef]
  54. Endris, H.S.; Omondi, P.; Jain, S.; Lennard, C.; Hewitson, B.; Chang’A, L.; Tazalika, L. Assessment of the performance of CORDEX regional climate models in simulating East African rainfall. J. Clim. 2013, 26, 8453–8475. [Google Scholar] [CrossRef]
  55. Endris, H.S.; Lennard, C.; Hewitson, B.; Dosio, A.; Nikulin, G.; Artan, G.A. Future changes in rainfall associated with ENSO, IOD and changes in the mean state over Eastern Africa. Clim. Dyn. 2019, 52, 2029–2053. [Google Scholar] [CrossRef]
  56. Endris, H.S.; Lennard, C.; Hewitson, B.; Dosio, A.; Nikulin, G.; Panitz, H.-J. Teleconnection responses in multi–GCM driven CORDEX RCMs over Eastern Africa. Clim. Dyn. 2016, 46, 2821–2846. [Google Scholar] [CrossRef]
  57. Dike, V.N.; Shimizu, M.H.; Diallo, M.; Lin, Z.; Nwofor, O.K.; Chineke, T.C. Modelling present and future African climate using CMIP5 scenarios in HadGEM2–ES. Int. J. Climatol. 2015, 35, 1784–1799. [Google Scholar] [CrossRef]
  58. Fitzpatrick, R.G.; Parker, D.J.; Marsham, J.H.; Rowell, D.P.; Jackson, L.S.; Finney, D.; Stratton, R. How a typical West African day in the future–climate compares with current–climate conditions in a convection–permitting and parameterised convection climate model. Clim. Change 2020, 163, 267–296. [Google Scholar] [CrossRef]
  59. Eyring, V.; Cox, P.M.; Flato, G.M.; Gleckler, P.J.; Abramowitz, G.; Caldwell, P.; Williamson, M.S. Taking climate model evaluation to the next level. Nat. Clim. Chang. 2019, 9, 102–110. [Google Scholar] [CrossRef]
  60. Mubeen, M.; Ahmad, A.; Wajid, A.; Khaliq, T.; Hammad, H.M.; Sultana, S.R.; Nasim, W. Application of CSM–CERES–Maize model in optimizing irrigated conditions. Outlook Agric. 2016, 45, 173–184. [Google Scholar] [CrossRef]
  61. Adnan, A.A.; Diels, J.; Jibrin, J.M.; Kamara, A.Y.; Craufurd, P.; Shaibu, A.S.; Tonnang, Z.E.H. Options for calibrating CERES–maize genotype specific parameters under data–scarce environments. PLoS ONE 2019, 14, e0200118. [Google Scholar] [CrossRef] [PubMed]
  62. Anothai, J.; Patanothai, A.; Pannangpetch, K.; Jogloy, S.; Boote, K.J.; Hoogenboom, G. Reduction in data collection for determination of cultivar coefficients for breeding applications. Agric. Syst. 2008, 96, 195–206. [Google Scholar] [CrossRef]
  63. Dilla, A.; Smethurst, P.J.; Barry, K.; Parsons, D.; Denboba, M. Potential of the APSIM model to simulate impacts of shading on maize productivity. Agrofor. Syst. 2018, 92, 1699–1709. [Google Scholar] [CrossRef]
  64. Wang, R.; Dungait, J.A.; Buss, H.L.; Yang, S.; Zhang, Y.; Xu, Z.; Jiang, Y. Base cations and micronutrients in soil aggregates as affected by enhanced nitrogen and water inputs in a semi–arid steppe grassland. Sci. Total Environ. 2017, 575, 564–572. [Google Scholar] [CrossRef]
  65. Hatfield, J.L.; Prueger, J.H. Temperature extremes: Effect on plant growth and development. Weather Clim. Extrem. 2015, 10, 4–10. [Google Scholar] [CrossRef]
  66. Dong, X.; Chen, J.; Ma, Y.; Wang, J.; Chan–Park, M.B.; Liu, X.; Chen, P. Superhydrophobic and superoleophilic hybrid foam of graphene and carbon nanotube for selective removal of oils or organic solvents from the surface of water. Chem. Commun. 2012, 48, 10660–10662. [Google Scholar] [CrossRef]
  67. Dimes, J.; Twomlow, S.; Carberry, P. Application of APSIM in smallholder farming systems in the semi–arid tropics. In Decision Support Tools for Smallholder Agriculture in Sub–Saharan Africa: A Practical Guide; IFDC and CTA: Brisbane, QLD, Australia, 2003; pp. 85–99. [Google Scholar]
  68. Adhikari, U.; Nejadhashemi, A.P.; Woznicki, S.A. Climate change and eastern Africa: A review of impact on major crops. Food Energy Secur. 2015, 4, 110–132. [Google Scholar] [CrossRef]
  69. Segele, Z.T.; Leslie, L.M.; Lamb, P.J. Evaluation and adaptation of a regional climate model for the Horn of Africa: Rainfall climatology and interannual variability. Int. J. Climatol. 2009, 29, 47–65. [Google Scholar] [CrossRef]
  70. Yasin, M.; Ahmad, A.; Khaliq, T.; Habib–ur–Rahman, M.; Niaz, S.; Gaiser, T.; Hoogenboom, G. Climate change impact uncertainty assessment and adaptations for sustainable maize production using multi–crop and climate models. Environ. Sci. Pollut. Res. 2022, 29, 18967–18988. [Google Scholar] [CrossRef]
  71. Araya, A.; Kisekka, I.; Gowda, P.H.; Prasad, P.V.V. Evaluation of water–limited cropping systems in a semi–arid climate using DSSAT–CSM. Agric. Syst. 2017, 150, 86–98. [Google Scholar] [CrossRef]
  72. Bassu, S.; Brisson, N.; Durand, J.L.; Boote, K.; Lizaso, J.; Jones, J.W.; Waha, K. How do various maize crop models vary in their responses to climate change factors? Glob. Chang. Biol. 2014, 20, 2301–2320. [Google Scholar] [CrossRef]
  73. Müller, C.; Elliott, J.; Kelly, D.; Arneth, A.; Balkovic, J.; Ciais, P.; Yang, H. The Global Gridded Crop Model Intercomparison phase 1 simulation dataset. Sci. Data 2019, 6, 50. [Google Scholar]
  74. Abeysingha, N.S.; Islam, A.; Singh, M. Assessment of climate change impact on flow regimes over the Gomti River basin under IPCC AR5 climate change scenarios. J. Water Clim. Chang. 2018, 11, 303–326. [Google Scholar] [CrossRef]
  75. Stuch, B.; Alcamo, J.; Schaldach, R. Projected climate change impacts on mean and year–to–year variability of yield of key smallholder crops in Sub–Saharan Africa. Clim. Dev. 2021, 13, 268–282. [Google Scholar] [CrossRef]
  76. Biazin, B.; Stroosnijder, L. To tie or not to tie ridges for water conservation in Rift Valley drylands of Ethiopia. Soil Tillage Res. 2012, 124, 83–94. [Google Scholar]
  77. McHugh, O.V.; Steenhuis, T.S.; Abebe, B.; Fernandes, E.C.M. Performance of in situ rainwater conservation tillage techniques on dry spell mitigation and erosion control in the drought–prone North Wello zone of the Ethiopian highlands. Soil Tillage Res. 2007, 97, 19–36. [Google Scholar] [CrossRef]
  78. Grum, B.; Assefa, D.; Hessel, R.; Woldearegay, K.; Ritsema, C.J. Improving on–site water availability by combining in–situ water harvesting techniques in semi–arid Northern Ethiopia. Agric. Water Manag. 2017, 193, 153–162. [Google Scholar]
  79. Grum, B.; Assefa, D.; Hessel, R.; Woldearegay, K.; Kessler, A.; Ritsema, C.; Geissen, V. Effect of In Situ Water Harvesting Techniques on Soil and Nutrient Losses in Semi–Arid Northern Ethiopia. Land Degrad. Dev. 2017, 28, 1016–1027. [Google Scholar]
  80. Grum, B.; Woldearegay, K.; Hessel, R.; Baartman, J.E.; Abdulkadir, M.; Yazew, E.; Geissen, V. Assessing the effect of water harvesting techniques on event–based hydrological responses and sediment yield at a catchment scale in northern Ethiopia using the Limburg Soil Erosion Model (LISEM). Catena 2017, 159, 20–34. [Google Scholar] [CrossRef]
  81. Cofie, O.; Amede, T. Water management for sustainable agricultural intensification and smallholder resilience in sub–Saharan Africa. Water Resour. Rural Dev. 2015, 6, 3–11. [Google Scholar] [CrossRef]
  82. Chen, J.; Zhang, X.J. Challenges and potential solutions in statistical downscaling of precipitation. Clim. Change 2021, 165, 63. [Google Scholar] [CrossRef]
  83. Knox, J.; Hess, T.; Daccache, A.; Wheeler, T. Climate change impacts on crop productivity in Africa and South Asia. Environ. Res. Lett. 2012, 7, 034032. [Google Scholar]
  84. Polade, S.D.; Pierce, D.W.; Cayan, D.R.; Gershunov, A.; Dettinger, M.D. The key role of dry days in changing regional climate and precipitation regimes. Sci. Rep. 2014, 4, 4364. [Google Scholar] [CrossRef] [Green Version]
  85. Zhao, D.; Wang, J.; Zhao, X.; Triantafilis, J. Clay content mapping and uncertainty estimation using weighted model averaging. Catena 2022, 209, 105791. [Google Scholar] [CrossRef]
  86. Zare, E.; Wang, J.; Zhao, D.; Arshad, M.; Triantafilis, J. Scope to map available water content using proximal sensed electromagnetic induction and gamma–ray spectrometry data. Agric. Water Manag. 2021, 247, 106705. [Google Scholar]
Figure 1. The Regional Integrated Assessment Approach development framework used in the study.
Land 11 01409 g001
Figure 2. Trends in temperature for future climate for RCP 4.5 (a) and RCP 8.5 (b).
Land 11 01409 g002
Figure 3. Probability of exceedance for observed and simulated yields for model calibration in Ruzizi Plain.
Land 11 01409 g003
Figure 4. Simulated yield response to rainfall and temperature changes for sensitivity analysis: (a) change in temperature; (b) change in rainfall.
Land 11 01409 g004
Figure 5. Simulated soil water balance (a) and grain yield (b) for the reference period (1981–2021).
Land 11 01409 g005
Figure 6. Impact of climate change on maize grain yield (a) and water use efficiency (b) under RCP 4.5 and 8.5.
Land 11 01409 g006
Figure 7. Climate change effect on yield and water use efficiency under two RCPs: (a) grain yield and (b) water use efficiency.
Land 11 01409 g007
Figure 8. Annual changes in water use efficiency for RCP 4.5 (a) and RCP 8.5 (b).
Land 11 01409 g008
Figure 9. Effect of soil and water conservation practices on yield under RCP 4.5 and RCP 8.5.
Land 11 01409 g009
Table 1. Models selected for Regional Integrated Assessment for climate change scenarios.
PeriodNear Future (2022–2039)Mid–Century (2040–2069)End of Century (2070–2099)
Climate Regime/RCPsRCP 4.5RCP 8.5RCP 4.5RCP 8.5RCP 4.5RCP 8.5
Cool/WetGFDL–ESM2MIPSL–CM5B–LRIPSL–CM5B–LRCESM1–BGCCESM1–BGC CESM1–BGC
Cool/DryFGOALS–g2FGOALS–g2BNU–ESMMIROC5INMCM4NorESM1–M
Hot/WetIPSL–CM5A–MRCanESM2GISS–E2–HCanESM2GISS–E2–HCanESM2
Hot/DryACCESS1–0ACCESS1–0CMCC–CMACCESS1–0CMCC–CMACCESS1–0
MiddleBCC–CSM1–1IPSL–CM5A–MRMPI–ESM–LRBCC–CSM1–1MPI–ESM–LRGISS–E2–H
GFDL–ESM: NOAA/Geophysical Fluid Dynamic Laboratory–Earth System Model; IPSL–CM: Institute Pierre Simon Laplace–Coupled Model; CESM1–BGC: Community Earth System Model, version 1–Biogeochemistry; FGOALS–g2: The flexible global ocean–atmosphere–land system model, Grid–point Version 2; BNU–ESM: Beijing Normal University Earth System Model; MIROC5: Model for Interdisciplinary Research on Climate Version 5; CanESM2: The second generation Canadian Earth System Model; GISS–E2–H: NASA/Goddard Institute for Space Studies–ModelE/Hycom; ACCESS1–0: Australian Community Climate Earth–System Simulator version 1; NorESM1–M: The Norwegian Earth System Model version 1; CMCC–CM: Euro–Mediterranean Centre on Climate Change–Carbon cycle Model; BCC–CSM1–1: Beijing Climate Center Climate System Model version 1; INMCM4: Institute of Numerical Mathematics Climate Model, version 4.0; MPI–ESM–LR: Max Planck Institute–Earth System Model–Low Resolution.
Table 2. Definition of CSM–CERES parameters for SWC practices.
ParameterTied RidgeConventional Tillage
DrainageSomewhat excessiveSomewhat excessive
TillageCultivator, ridge tillDisk, 1–way
Tillage depth3010
Fertility factor0.70.7
Runoff potentialLowestModerately high
Runoff curve number6191
Drainage rate0.750.75
Water availability0.80.5
Table 3. Climate change analyses for the evaluation of potential changes in the agricultural system.
Production SystemAdaptationYield Change Ratio
Climate impacts on current production systemNoCM2/CM1
Climate adaptation on current production systemYesCM3/CM1
Climate impact and SWC as potential adaptation optionYesCM4/CM2
CM1: current climate, current management, CM2: climate change, current management, CM3: current climate, management with SWC adaptation, CM4: climate change, management with SWC adaptation.
Table 4. Change in trends of temperature and rainfall data from the reference period and projected data trends under RCP 4.5 and RCP 8.5.
TemperatureRainfall
RCPModel SubsettingTest ZSen SΔT (°C)pTest ZSen SCVΔPr (mm)p
BaselineUncorrected5.810.02p < 0.010.854.6730.9p > 0.05
BaselineCorrected5.810.02p < 0.011.472.4110.01p > 0.05
RCP 4.5Cool/Dry6.810.011.04p < 0.01−0.18−0.119.71−38.74p > 0.05
RCP 8.5Cool/Dry10.070.041.84p < 0.010.350.149.87−24.40p > 0.05
RCP 4.5Cool/Wet9.770.021.05p < 0.01−0.32−0.1810.2875.50p > 0.05
RCP 8.5Cool/Wet10.040.032.23p < 0.013.292.4814.8428.27p < 0.01
RCP 4.5Hot/Dry10.210.031.97p < 0.01−0.99−0.469.54−61.83p > 0.05
RCP 8.5Hot/Dry10.220.073.05p < 0.010.280.129.84−39.89p > 0.05
RCP 4.5Hot/Wet10.040.021.90p < 0.010.650.319.9598.23p > 0.05
RCP 8.5Hot/Wet10.220.062.98p < 0.013.271.8211.27115.34p < 0.01
RCP 4.5Middle9.850.021.5p < 0.011.480.79.6317.76p > 0.05
RCP 8.5Middle10.160.052.41p < 0.012.221.1110.4720.51p < 0.01
Legend: RCP: Representative Concentration Pathways; CV: coefficient of variation; Sen S: Sen slope; ΔT (°C): difference of temperature, ΔPr: difference in rainfall.
Table 5. Delay in rainfall at the start of the season as predicted by GCMs.
BaselineRCP 4.5RCP 8.5
MeanCV (%)MeanCV (%)MeanCV (%)
Baseline10.081.0
Cool/Dry 15.3101.311.792.8
Cool/Wet 8.980.415.195.5
Hot/Dry 10.278.910.680.5
Hot/Wet 8.780.327.487.7
Middle 15.9109.610.376.8
Legend: RCP: Representative Concentration Pathways; CV: coefficient of variation.
Table 6. Genetic coefficients for the maize variety Ecavel.
CoefficientDescriptionInitial ValueCalibrated Value
P1 (◦ days)Thermal time from seedling emergence to the end of juvenile phase165212
P2 (◦ days)Delay in development for each hour that day length is above 12.5 h0.10.75
P5 (◦ days)Thermal time from silking to time of physiological maturity476800
G2 Maximum kernel number per plant442800
G3
(mg day−1)
Kernel growth rate during linear grain filling stage under optimum conditions5.358.5
PHINT
(°C day tip−1)
Thermal time between successive leaf tip appearance4040
Publisher’s Note: MDPI stays neutral with regard to jurisdictional claims in published maps and institutional affiliations.

