Article

Analysis Long-Term and Spatial Changes of Forest Cover in Typical Karst Areas of China

1
College of Resources and Environmental Engineering, Guizhou University, Guiyang 550025, China
2
State Key Laboratory of Environmental Geochemistry, Institute of Geochemistry, Chinese Academy of Sciences, Guiyang 550081, China
3
CAS Center for Excellence in Quaternary Science and Global Change, Xi’an 710061, China
4
Guizhou Provincial Key Laboratory of Geographic State Monitoring of Watershed, Guizhou Education University, Guiyang 550018, China
5
College of Resources and Environmental, Beibu Gulf University, Qinzhou 535011, China
6
College of Public Management, GuiZhou University of Finance and Economics, Guiyang 550025, China
7
University of Chinese Academy of Sciences, Beijing 100049, China
*
Author to whom correspondence should be addressed.
Land 2022, 11(8), 1349; https://doi.org/10.3390/land11081349
Submission received: 7 June 2022 / Revised: 5 August 2022 / Accepted: 15 August 2022 / Published: 18 August 2022
(This article belongs to the Special Issue Karst Land System and Sustainable Development)

Abstract

:
In recent decades, China has exhibited the fastest and most remarkable social-economic development in the world. As a result of such development, the forest cover of the country has undergone radical changes. This paper aims to develop a method for analyzing long-term and spatial changes in forest cover based on historical maps and remote sensing images. Moreover, we will focus on the reduction or restoration of forests distributed at different altitudes, slopes, soils, and lithologic types in different periods, to reveal the problems that should be paid attention to in forest restoration in karst areas. A typical county of China was selected as the study area. A historical military operation map was considered the principal source of basic data. These data were then combined with Landsat satellite images to conduct quantitative analysis on changes in the spatial area and location of forest cover with a long time series. The findings are as follows: in terms of time series, the forest area in the study area showed a trend of decreasing at first and then increasing, with the year 1986 as the turning point. In terms of spatial patterns, a considerable difference is observed in regions with changes in forest cover under different historical periods. Changes are obvious in limestone areas, rock soil areas, and areas with an elevation of 2000–2500 m and a slope gradient of 6°–15°. Spatial–temporal changes in forest cover reflect the effects of the war, national policy, and economic development to some extent. All these results indicate that, despite its limitations, a historical map is a valuable document for studying an ecological environment.

1. Introduction

Forests play an important role in maintaining the ecological balance of the earth [1,2]. The forest is a significant symbol of the ecological environment [3], and it is the material base for forestry production [4,5]. Forest can not only regulate atmospheric circulation and water cycle, but also affect climate change, and play an important role in protecting water and soil resources and preventing wind and sand [6,7,8]. The rapid change in forest cover is causing the loss of habitat, biodiversity, and climate change [9,10]. Social and economic conditions in different periods have different impacts on land vegetation cover [11]. The spatial reconstruction of historical forests is helpful for a better understanding of the changes human beings have made to the surface and their impacts on the environment [12]. Therefore, long-term and spatial dynamic changes in forest cover have been an important concern for global ecologists, environmentalists, and so on [13,14,15,16].
Remote sensing data can provide the continuous change in surface elements in time and space, and it plays an irreplaceable role in regional ecological environment monitoring [17]. However, during the period when satellites were not yet launched, satellite images were unavailable, and the surface of the Earth and its features could not be located accurately [18]. Thus, studies on the spatial framework of an ecological environment are limited to the years after 1972 [19]. This issue has always been a challenge for some ecologists [20]. With openness and sharing of data, an increasing number of available historical maps, especially historical military maps, can be obtained easily on the Internet or in libraries [21,22]. Thus, historical maps are an important data source for scientists to reveal the changes in the surface landscape before remote sensing images. Some internationally well-known scholars have conducted a considerable amount of valuable research with the use of these maps [23,24,25,26].
Because of the important ecological and economic functions of forests, it is very important to monitor long-term changes by using old maps and written sources, because this method enables people to monitor trends from different time dimensions and find the reasons for the current situation [16,27]. For example, Skaloš et al. [28] carried out a comparison of landscape developments in Sweden and the Czech Republic by using old maps. Pelorosso et al. [29] used historical maps and recent remote sensing-derived maps to reduce misleading changes and to assess spatial aggregation errors based on a data integration procedure using landscape metrics in Italy. Skaloš et al. [16] analyzed long-term land-cover changes in central Bohemia and contributed to a better understanding of the dynamics of forest land using old military survey maps and orthophotograph maps, covering more than 250 years. Furthermore, researchers of some countries have used military maps to study past land cover changes in Slovenia [30,31], Germany [32], Sweden [33], Norway [34,35], and the Czech Republic [28,36,37].
On the other hand, many researchers have studied the long-term land cover in China. He et al. [11] reconstructed the forest cover in China from 1700–2000, and found that the deforestation mainly occurred in southwest China, the hilly regions of south China, the southeast of Gansu province, and northeast China from 1700 to the 1960s. Yang et al. [38] evaluated the reliability of global historical land-use scenarios for forest data in China and pointed out that these global historical land-use scenarios could not accurately reveal the spatial and temporal pattern of China’s forests due to differences in data sources, reconstruction methods and spatial scales. Li et al. [39] used the historical forest area allocation model to reconstruct forest cover between 1780 and 1940 in Northeast China. Liu et al. [40] synthesized historical maps and aerial images to describe long-term land-use change and landscape dynamics for a region near Chancellorsville, USA, from 1867 to 2014. In a word, many researchers use historical maps combined with remote sensing images to reveal long-term changes in forest/land cover and proved that climate change and human activities are the main influencing factors, but mainly on the national and regional scales. Aiming at the change in long-time series forest cover in karst areas, Tanacs et al. [41] used an integrated GIS of historical data (18th–19th century military maps, old forest management plans, aerial imagery, etc.) to describe the example of the Haragistya karst plateau and how the forests of the Aggtelek karst region were used in the last few centuries and to what extent they were affected by anthropogenic activity. However, there is still a lack of research on long-time series forest cover in typical karst areas of China.
The southwest China karst area is located in the center of East Asia karst area, and it is one of the three largest karst areas in the world [42]. Karst ecosystem is a fragile ecosystem, which is affected and restricted by the special geological background [43,44]. Because of the special geological and climatic conditions, the bedrock in this area is exposed, which has the basic characteristics of little soil reserves, discontinuous soil distribution, complex and diverse micro-landforms, etc. [45,46]. These characteristics have caused some problems in karst areas, such as high rock exposure rate, slow soil formation speed, easy loss, and weak soil water and fertilizer retention capacity [47,48]. Among them, karst rocky desertification with a large scale and high frequency of change is the most serious ecological disaster in Southwest China [49,50]. In the past, intense human activities have significantly changed the structure of karst ecosystems, especially the change in land cover [51,52,53]. The whole karst ecosystem is more sensitive to changes in environmental conditions [54]. Taking the vegetation in the karst area as an example, the research shows that the geochemistry of karst bedrock can affect the growth of vegetation by adjusting the water-holding capacity of the weathered layer, which makes the vegetation productivity in the karst area more susceptible to drought [55]. The fragility and stability of karst ecology and the fragile natural recovery ability have brought challenges to local economic development and environmental protection [56,57]. It is of great significance for karst ecosystems to cope with global changes and achieve sustainable development by exploring the long-time sequence of forest cover changes in karst areas [58].
This study mainly reveals the dynamic changes in forest cover in a long time series from 1944 to 2013 in typical karst areas of Southwest China through historical maps and remote sensing image data and analyzes the different spatial distribution patterns of forest cover from four aspects: altitude, slope, soil type, and lithology. Furthermore, we try to explore the possible influencing factors of forest cover increase or decrease in different change periods. It is hoped that our research results can fully understand the dynamics and temporal and spatial differences in the evolution process and trend of forest cover in recent decades, provide theoretical reference for comprehensive control of rocky desertification in karst mountain areas and rural revitalization, and provide the certain theoretical basis for promoting the sustainable development of karst areas in southwest China.

2. Materials and Methods
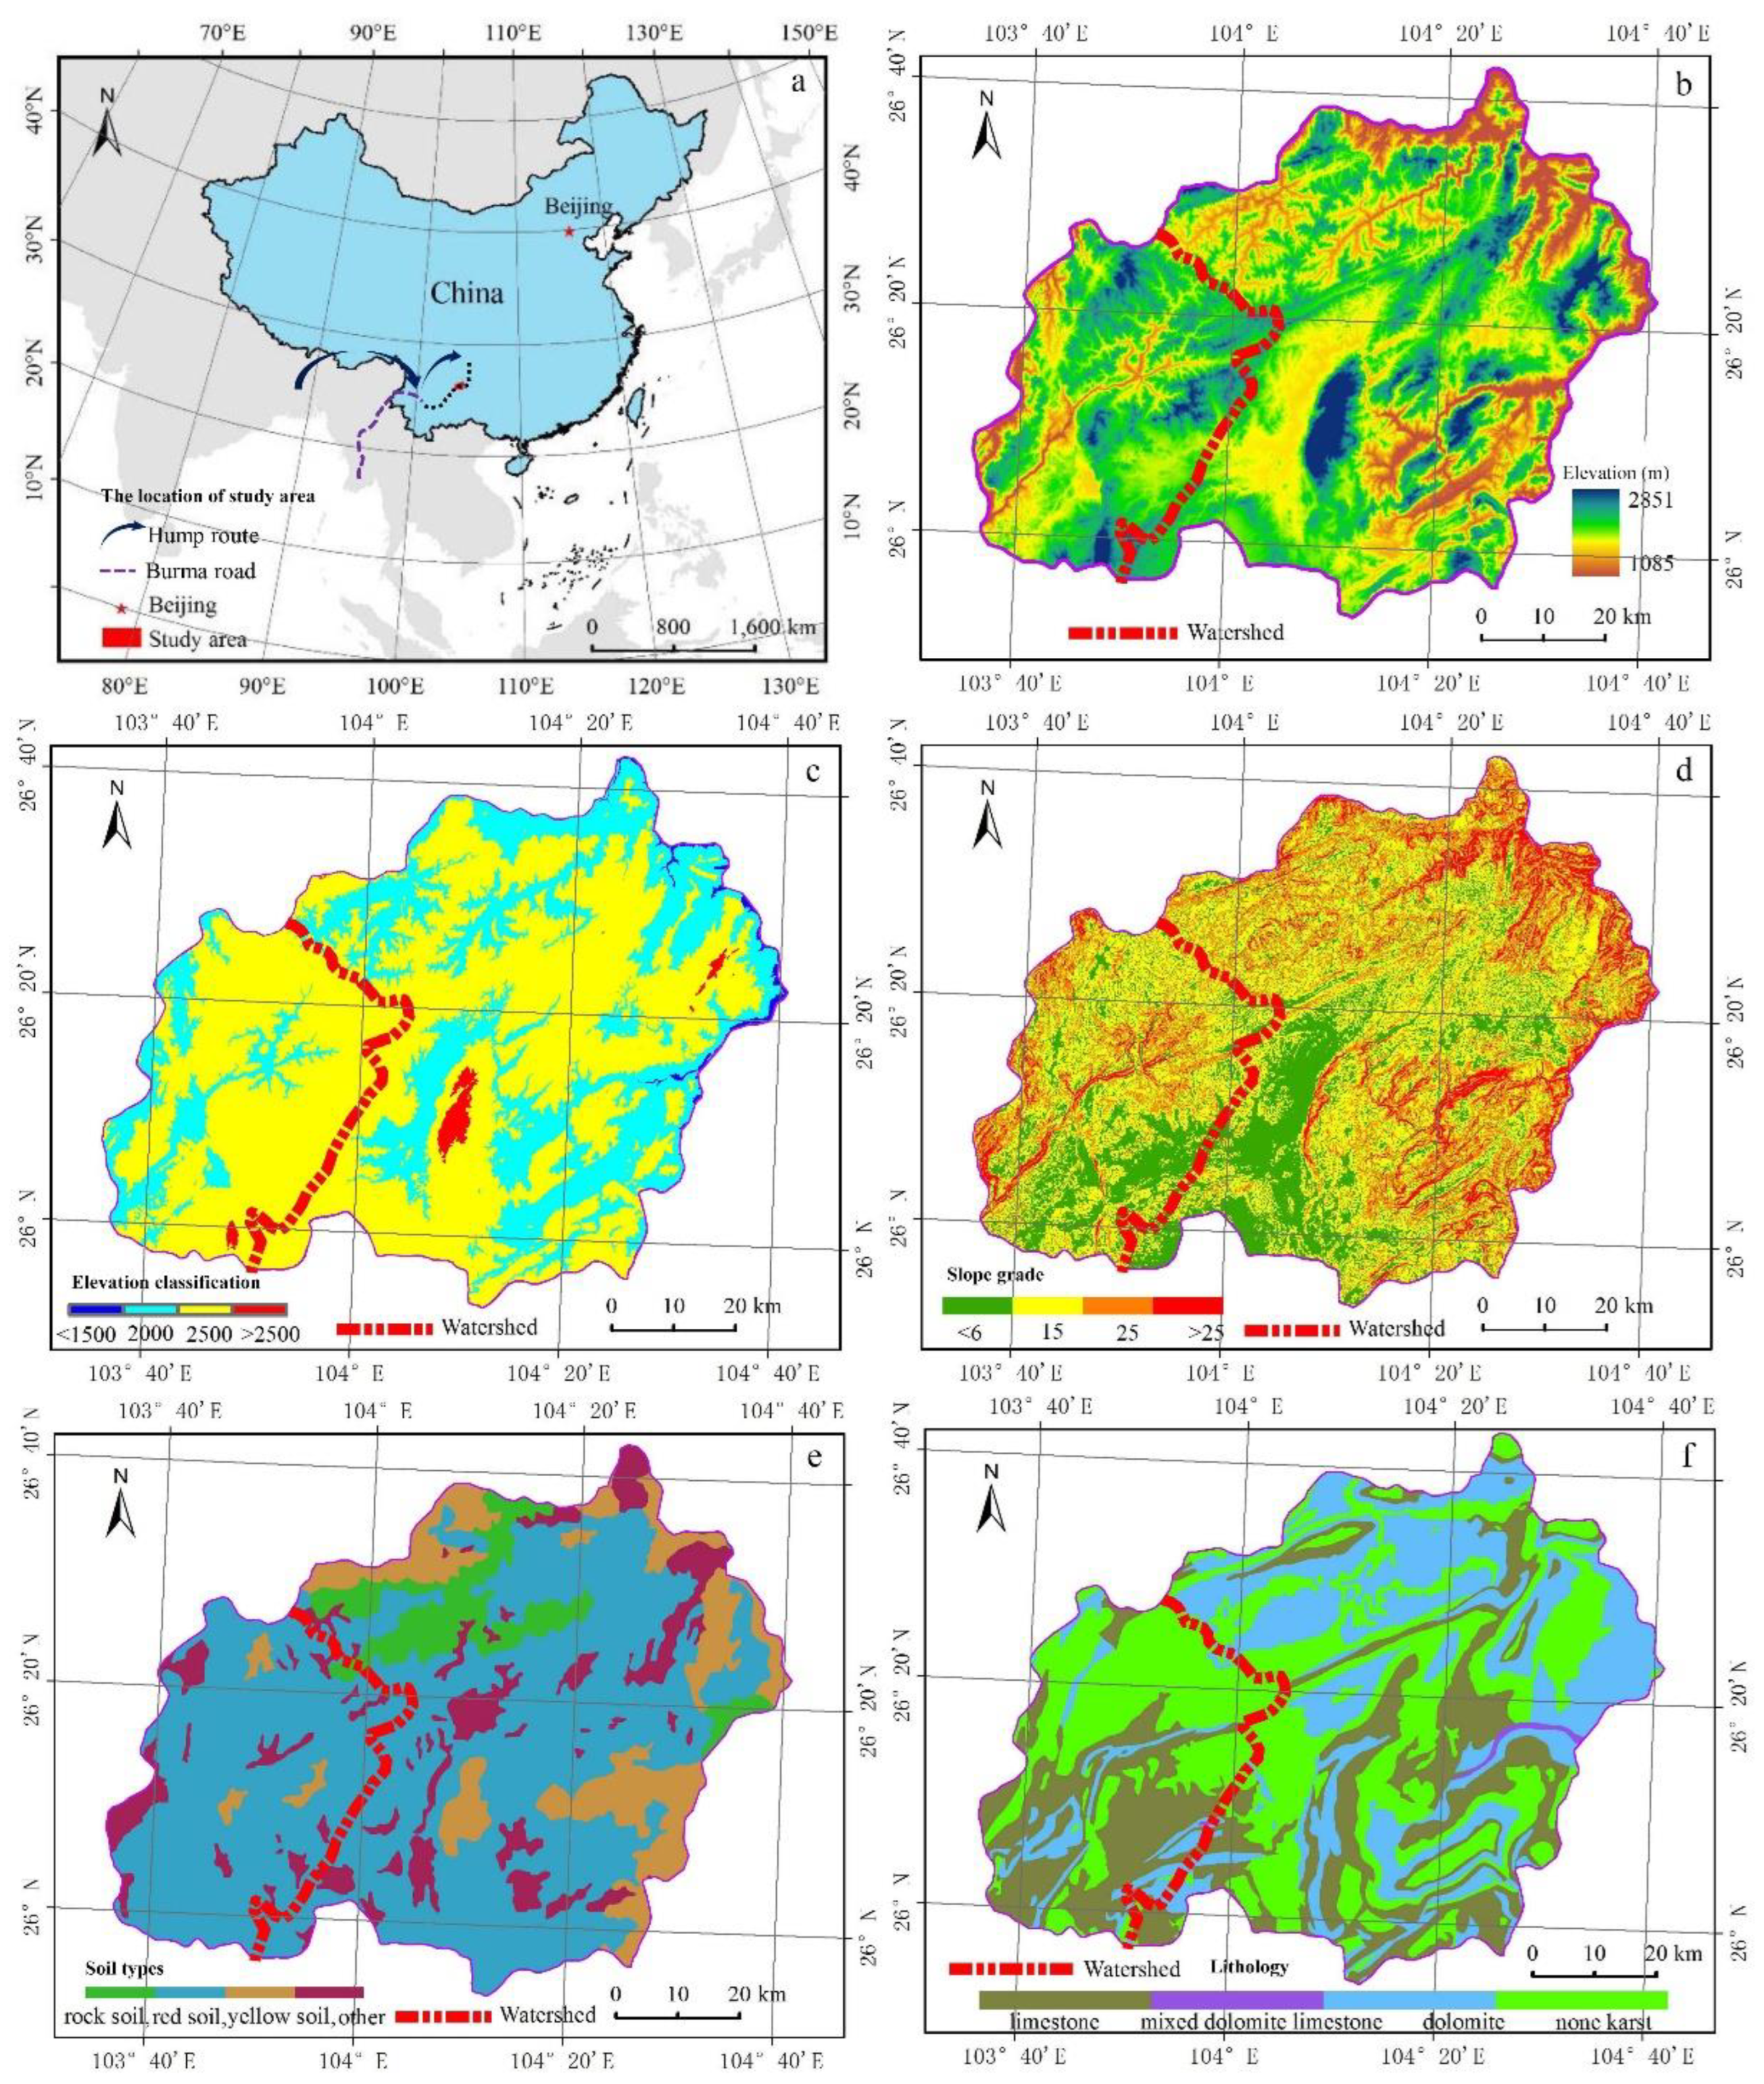
2.1. Study Area

Xuanwei County in Yunnan Province, Western China was selected as the study area. Xuanwei has a land area of 6502 km2, with a low-latitude highland monsoonal climate, average annual precipitation of 986 mm, and an average annual temperature of 13.3 °C. The area is located in the watershed zone between Yangtze River and Pearl River, which has a maximum elevation of 2868 m, a minimum elevation of 920 m, a relative altitude difference of 1948 m, numerous sloping fields, and few mountainous areas, and a relatively large slope gradient. The karst landform in the area spreads widely, with the outcrop reaching 3300 km2 and accounting for 52.74% of the entire land area of the county. The soil in the study area mainly consists of red earth and limestone. Xuanwei County is located in the “Hump Course” of World War II. The critical section of Yunnan–Burma, and Yunnan–Guizhou Highway played a significant role in the victory of the Allies during World War II (Figure 1). To guarantee smooth passage in this important transport corridor during the war, the U.S. army conducted several detailed works to study the geographical elements of the forests in this region, and the resulting historical military maps reflect the actual and ecological landscapes in the area during that period.

2.2. Data Collection and Processing

2.2.1. Historical Map

The horizontal axis Mercator projection and the U.S. Hayford ellipsoid were applied in 1990 to the military topographic map from China drawn by the Army Map Service of the U.S. Army Corps of Engineers during World War II. The map was drawn based on the supergraph of the topographic map that was investigated and drawn by Japan during the height of its military aggression in 1942. This map reflects the situation in 1944. It was revised in 1945 and published in 1954. This map can be freely obtained from the website of the University of Texas libraries (http://www.lib.utexas.edu/maps/ams/) (accessed on 12 November 2021).

2.2.2. Remote Sensing Images

The period was from 1977 to 2013, with a total of five periods. Data from each period were obtained from the University of Maryland (http://glcf.umiacs.umd.edu/data/landsat/) (accessed on 18 December 2020), and the data sharing plan for Earth observation was obtained from the website of the Chinese Academy of Sciences (http://ids.ceode.ac.cn/query.html) (accessed on 18 December 2020). The latter included the following images: Landsat Multispectral Scanner in 1977; Landsat with Thematic Mapper (TM) in 1986, 2000, and 2007; Landsat with Enhanced TM Plus in 2013. To guarantee data accuracy, the seasons of the images that are used are consistent.
Other data.
Digital elevation model (DEM) data with a resolution of 90 m were obtained from the International Scientific Data Service platform (http://datamirror.csdb.cn/) (accessed on 18 December 2020). Lithological spatial distribution and soil type data were gathered from the preliminary study materials of the project group [8,28].

2.2.3. For the Historical Military Map

The original historical military map was scanned, the boundaries were cut, and a seamless splice was created using Adobe Photoshop. The resulting map was then combined with a civilian topographic map to conduct overall scanning or accuracy check of the original historical military map (Figure 2). The contents for examination include the karst cave and its size and location, the morphological characteristics of the mountains, the trend of rivers, and the quantity and form of depressions. If the aforementioned features on the historical military map correspond with those on the civilian topographic map, then the historical military map is accurate and the preliminary scanning is acceptable. The location and distribution of the forest were then examined when the preliminary scanning was acceptable. If the preliminary scanning was not acceptable, then the causes of inconsistencies should be examined. If the scanning failed again, then the historical military map might be inaccurate and should thus be abandoned. During the examination of forest location and distribution, local chronicles, local history, agricultural literature, medical materials, military climate graphs, military hydrographs, military environmental diagrams, military installation diagrams, and analysis diagrams of the combat capacity of war zones should be used as references to achieve a comprehensive analysis. If the findings passed the examination, then the historical military map satisfied the research requirements. The historical military map was then cut according to the size of the study area, and digitization and vectorization were implemented to generate a preliminary diagram of forest distribution. In the statistical calculation of the area and sample inspection, an accuracy rate not lower than 95% should be guaranteed. A diagram of forest distribution during wartime could then be generated. A vector diagram of the spatial distribution of forest cover was obtained to establish the spatial and attribute databases of the forest pattern in the study area in 1944 (Figure 3a). The procedure should be repeated if the accuracy rate could not be guaranteed because of problems during digitization and vectorization.

2.2.4. For the Remote Sensing Images

All Landsat images applied near-infrared, red light, and green light wave bands to perform standard false color composition. Radiation correction was performed to achieve spectrum enhancement, radiation enhancement, and geometric precision correction for five-period images under ERDAS IMAGINE environment. The geometric precision correction was performed to scan and input a 1:50,000 topographic map into the computer to conduct projection disposal. This map was used as the main control data source to correct remote sensing images, and the average position error was controlled within a pixel. Field type samples were selected to perform visual interpretation under man–machine interaction, and then the supervised classification was applied. The obtained data were combined with DEM, weather, hydrological, vegetation, soil, land-use change, forest monitoring, and the corresponding social statistics data of the study area to check and amend the forest distribution diagram, establish the forest spatial and attribute databases in the study area beginning in 1977, and generate a vector diagram of spatial distribution information of the forest cover for the following periods: 1977, 1986, 2000, 2007, and 2013 (Figure 3b–f, respectively).

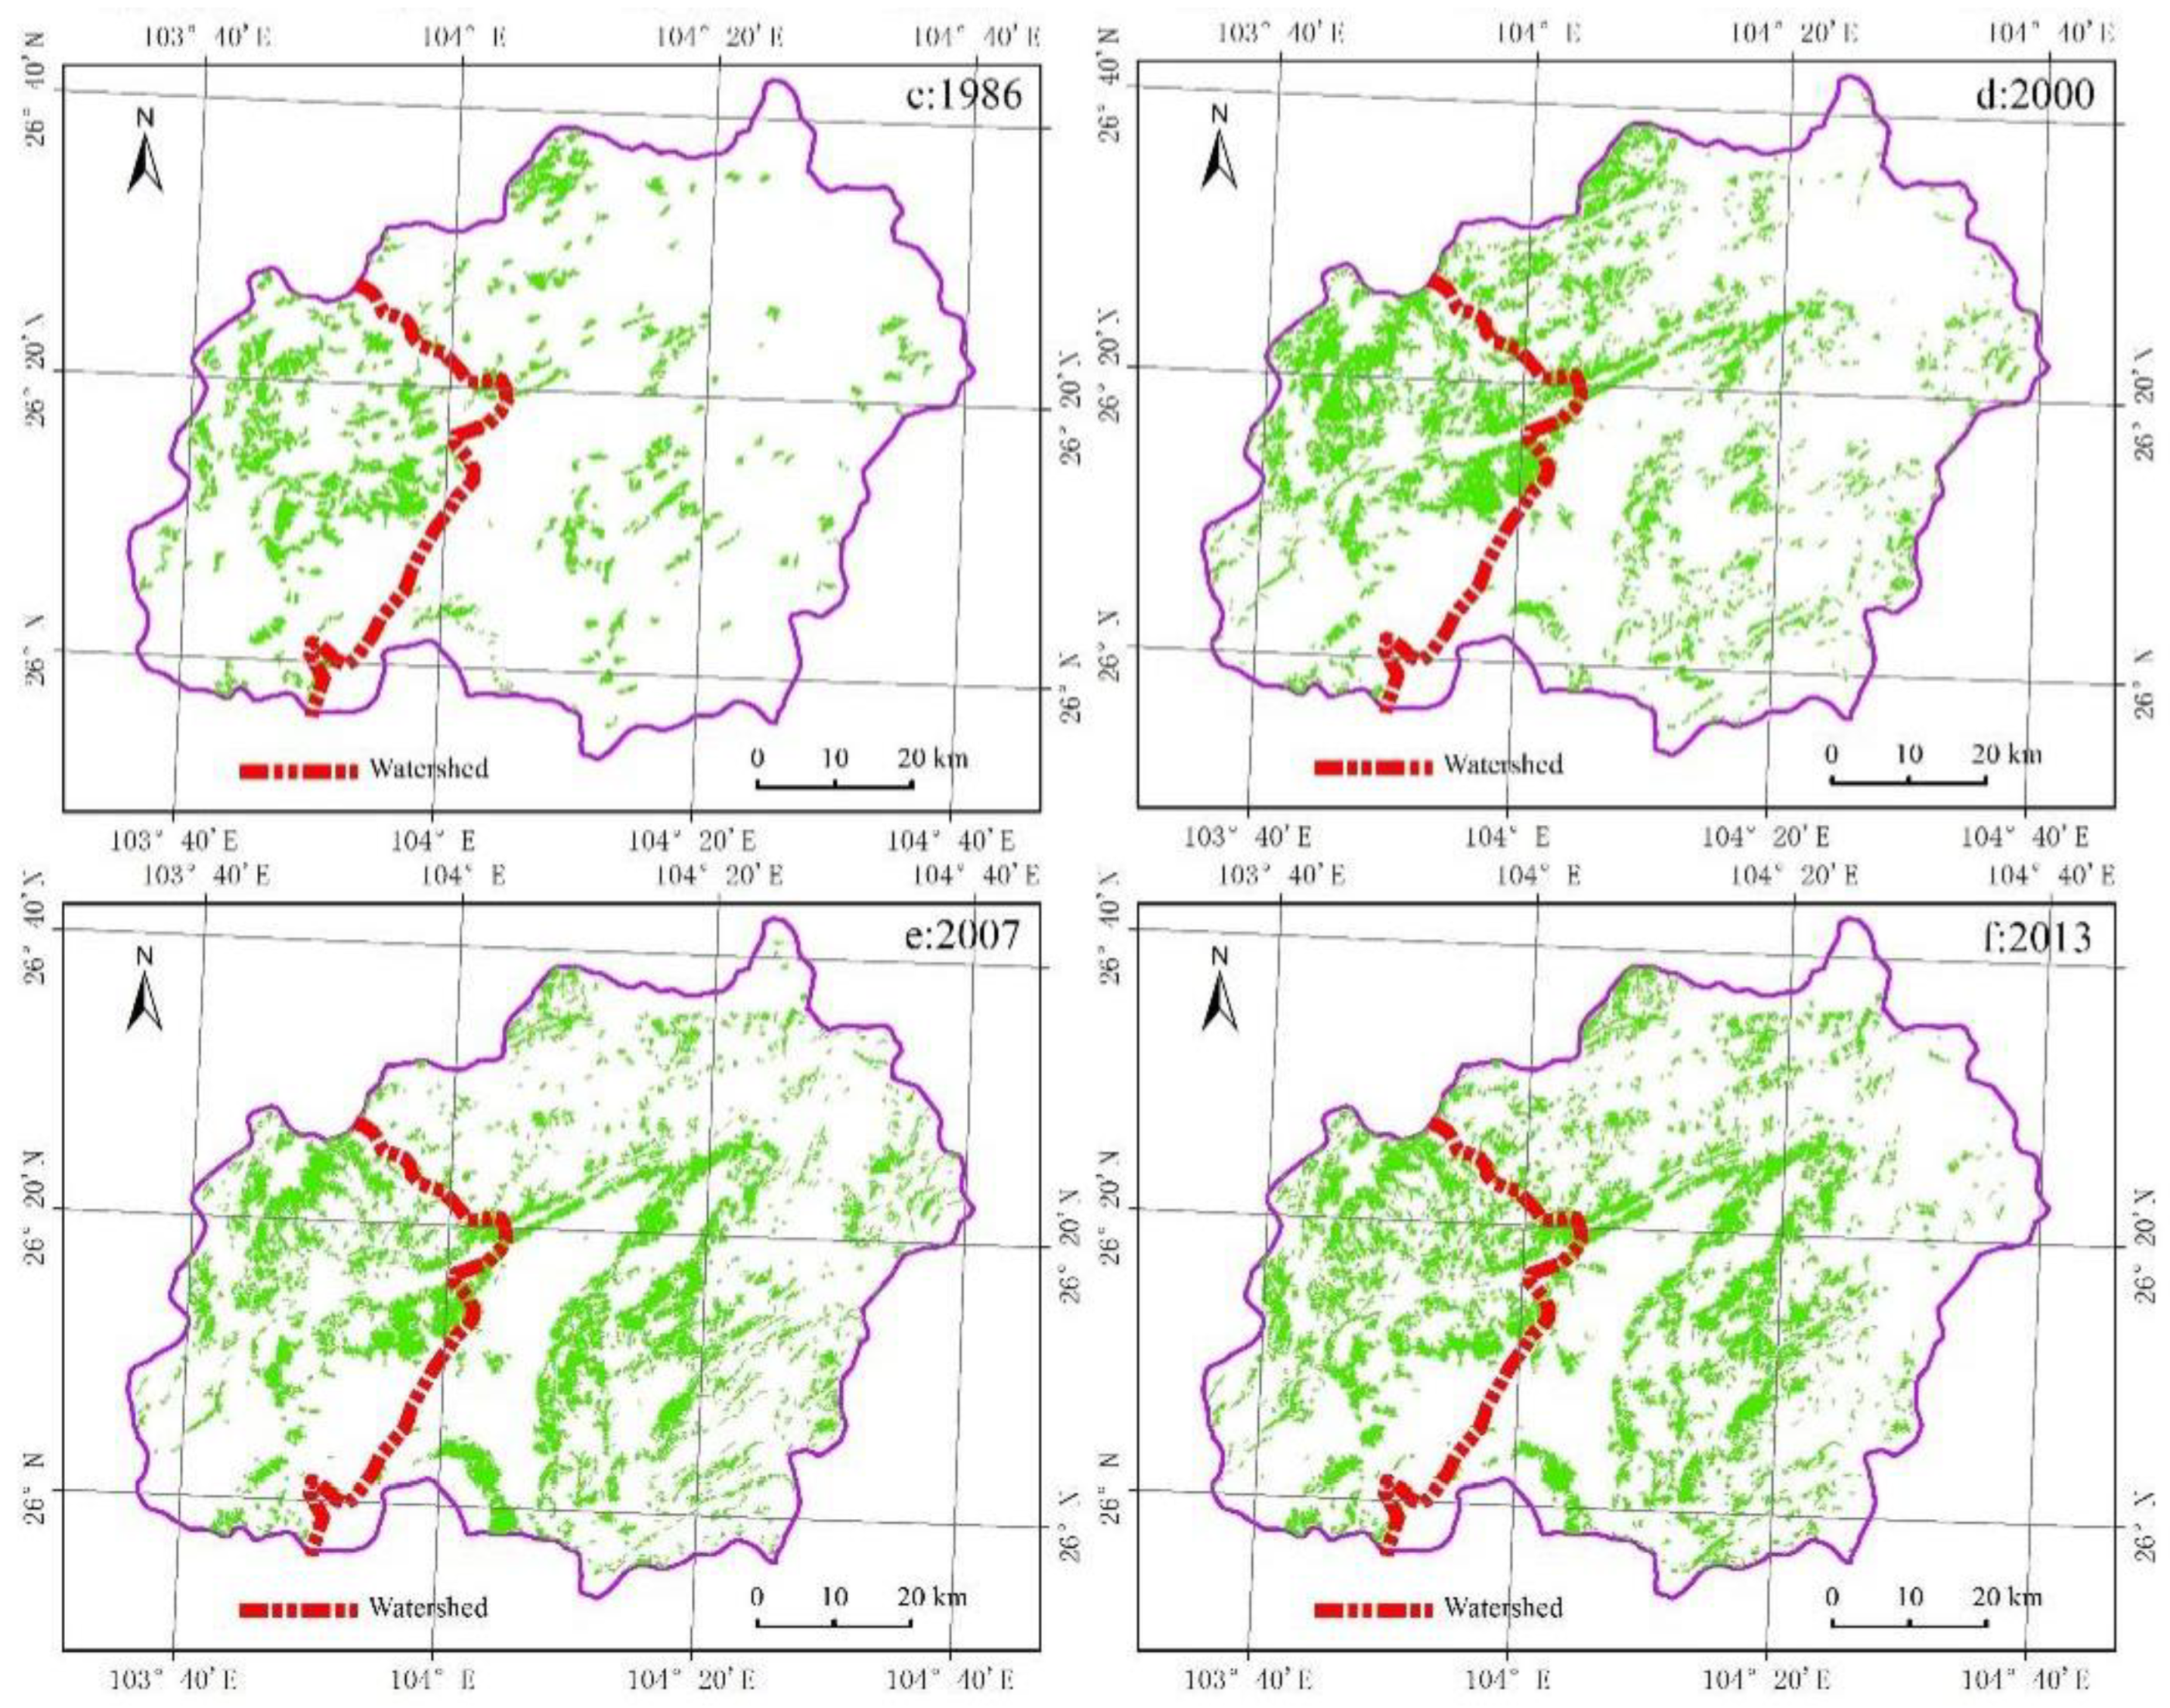
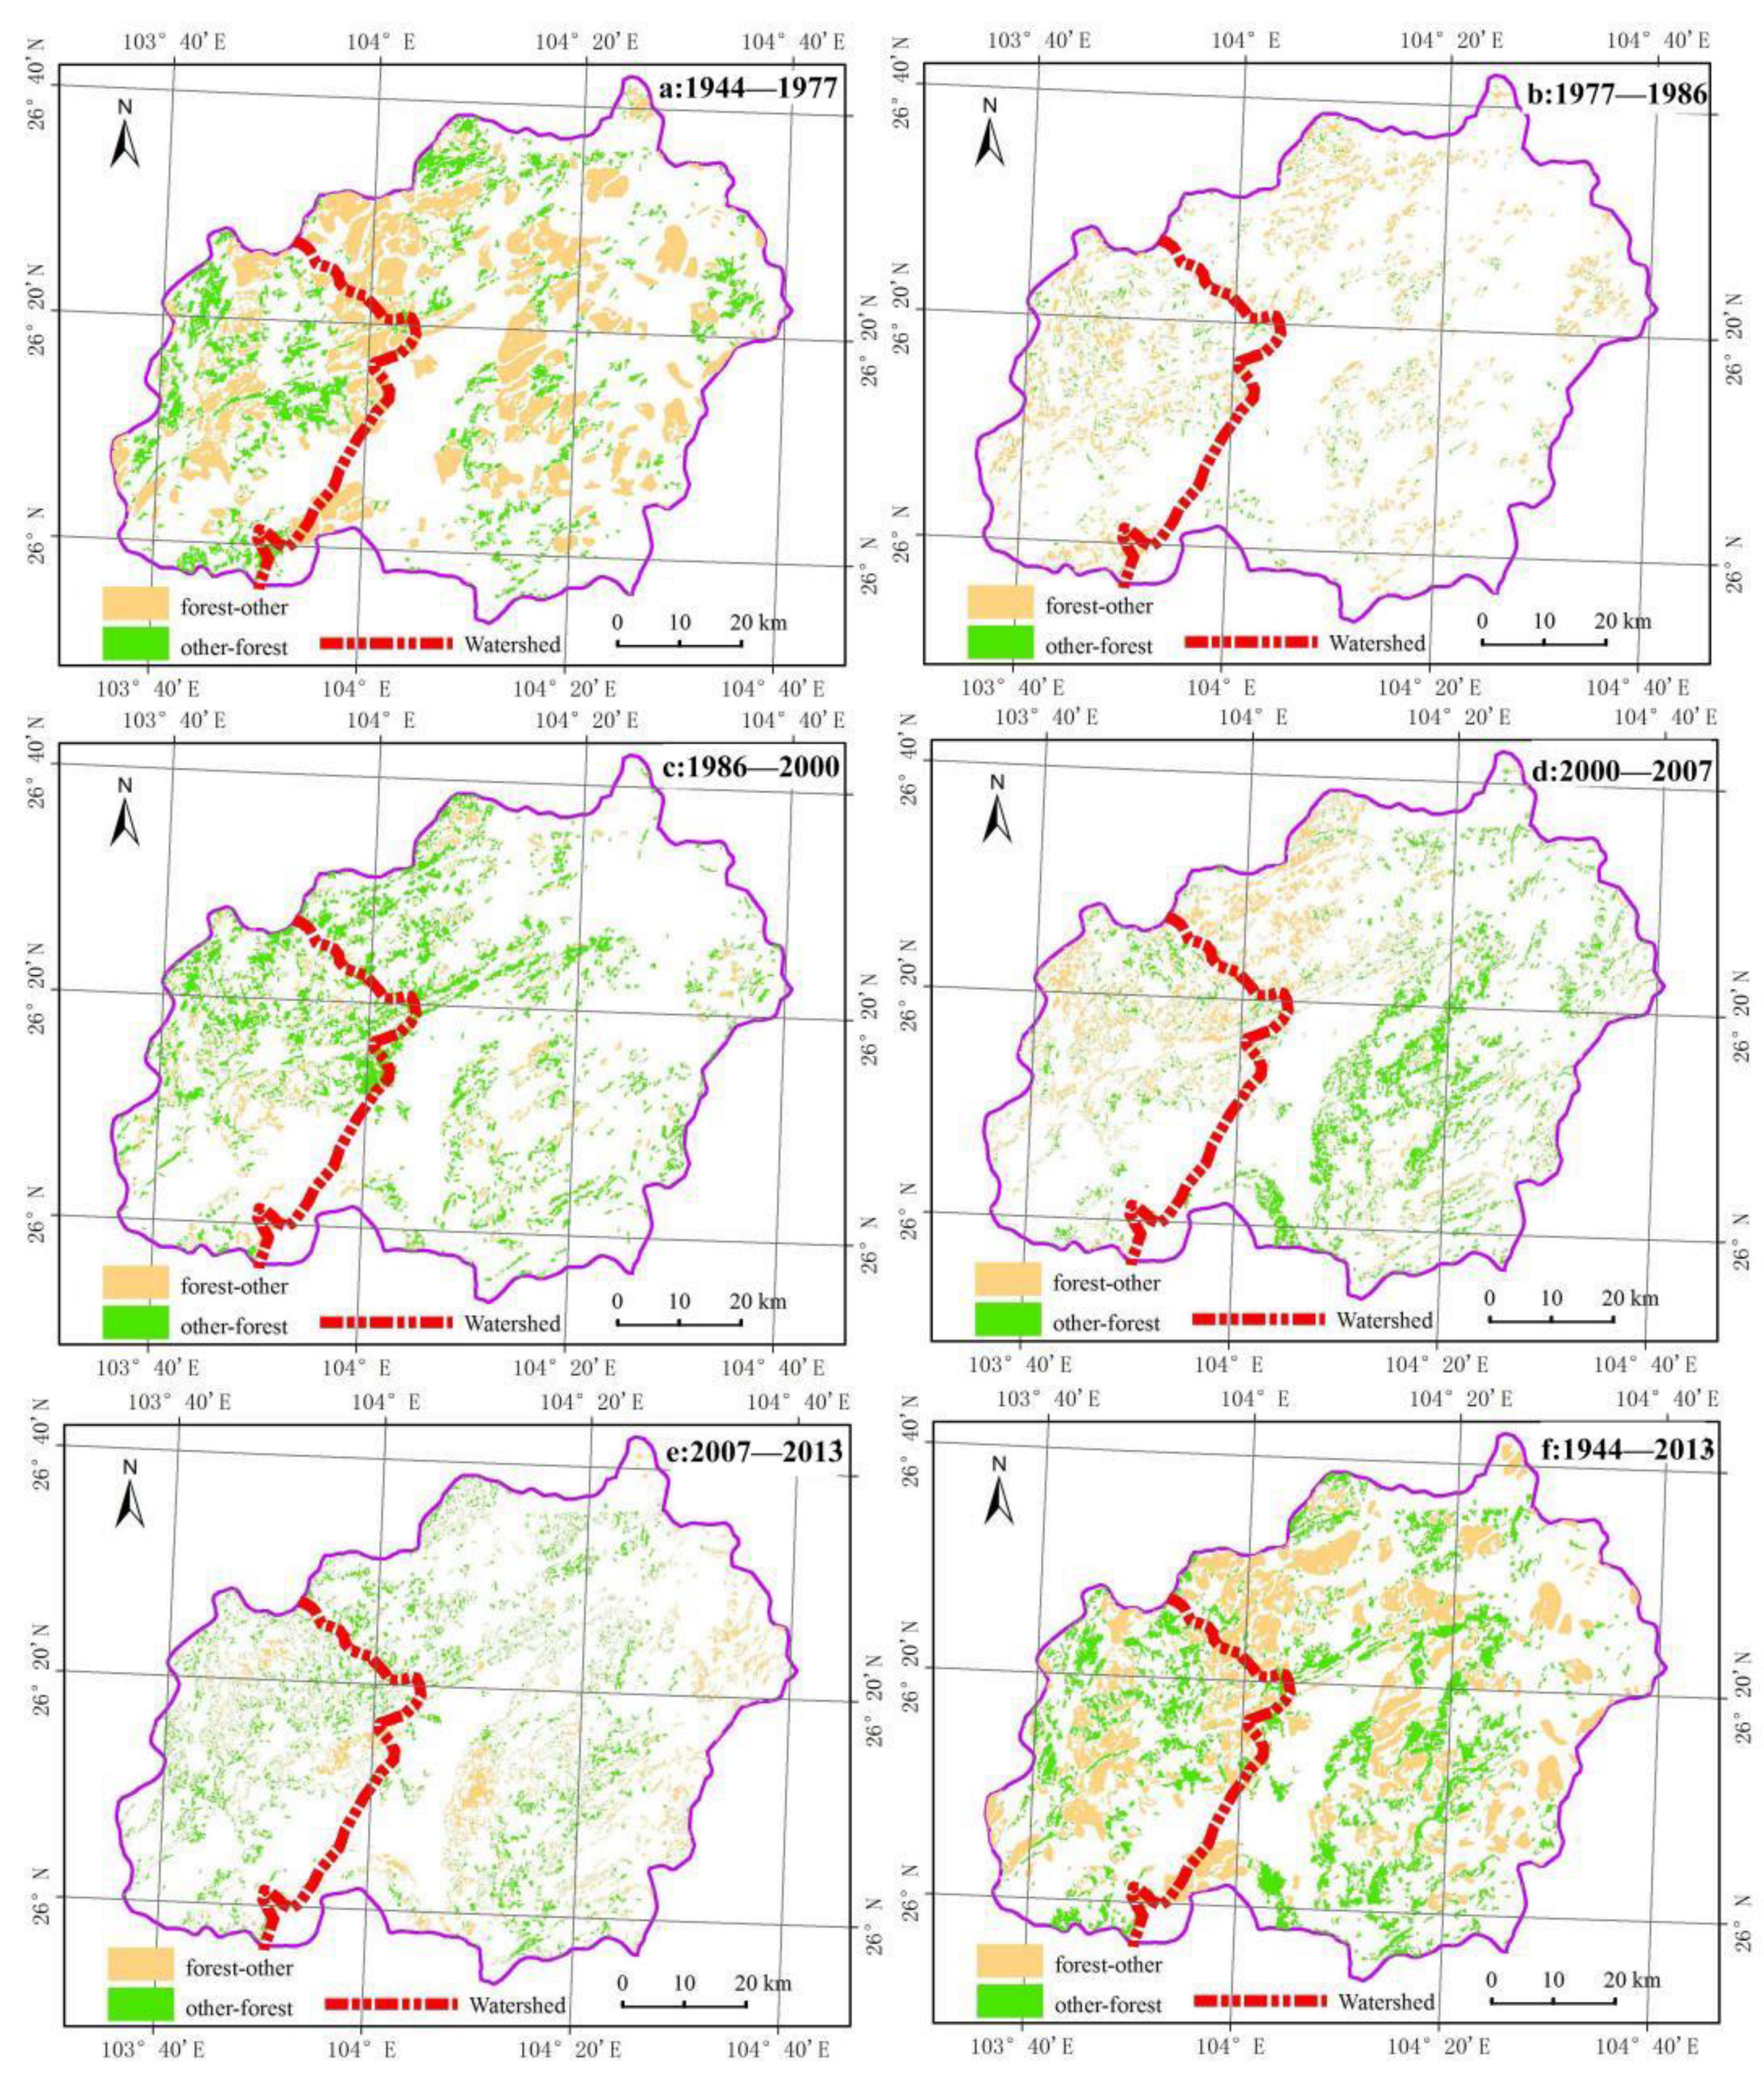
2.2.5. Analyzing Spatial–Temporal Evolvement of the Forest Cover

The dissolve tool was used to integrate spatial distribution data of forest cover for six periods into ArcGIS, which were classified into two codes: forest land and non-forest land. The intersect tool was used to calculate data intersection between two periods as a group. The area field was added to the attribute table and calculated. Next, the attribute table was converted into shapefile attribute format (.dbf) and opened in Microsoft Excel. The commands “Pivot Table” and “Pivot Diagram” in the data menu were implemented, which generated a transfer matrix of the forest cover with two periods after appropriate changes were made. A transfer matrix with different periods was generated when the preceding process was repeated.
Data on soil type, elevation, soil, and lithology were generated from the distribution layer of soil type, sea level elevation, slope gradient, and lithology, respectively. Overlay analysis of the layers of spatial distribution information on forest cover under different historical periods was performed with the aforementioned layers in OVERLAY EVENTS. Under different classification conditions, the spatial distribution information of the forest cover was extracted under various periods concerning different soil types, elevation, gradient, and lithology. The corresponding distribution diagrams were drawn, and the area calculation function of ARC/INFO was used to establish area statistics. The transfer matrix method was used to calculate the area and direction of spatial transfer for the forest cover under different periods and natural backgrounds.

3. Results

3.1. Overall Changed Process and Characteristics in Time

From Figure 4 and Figure 5, it can be seen that the change in forest area and scale showed a trend of first decreasing and then increasing in the study area from 1944 to 2013, and an obvious turning point appeared in 1986. These changes can be roughly divided into two stages: forest degradation before 1986 and forest restoration after 1986. It can be seen intuitively from Figure 4 that the forest coverage of the six years studied is quite different. The forest area was at its maximum in 1944 (up to 24.28% of the study area) and its minimum in 1986 (only 8.5% of the study area), with a difference of 2.84 times. The forest area decreased annually before 1986 and gradually increased after 1986, reaching 19.97% of the study area in 2013. However, even though ecological restoration and improvement were carried out from 2000 to 2013 (Figure 5), the forest coverage rate still did not reach the scale at the beginning of the research period.

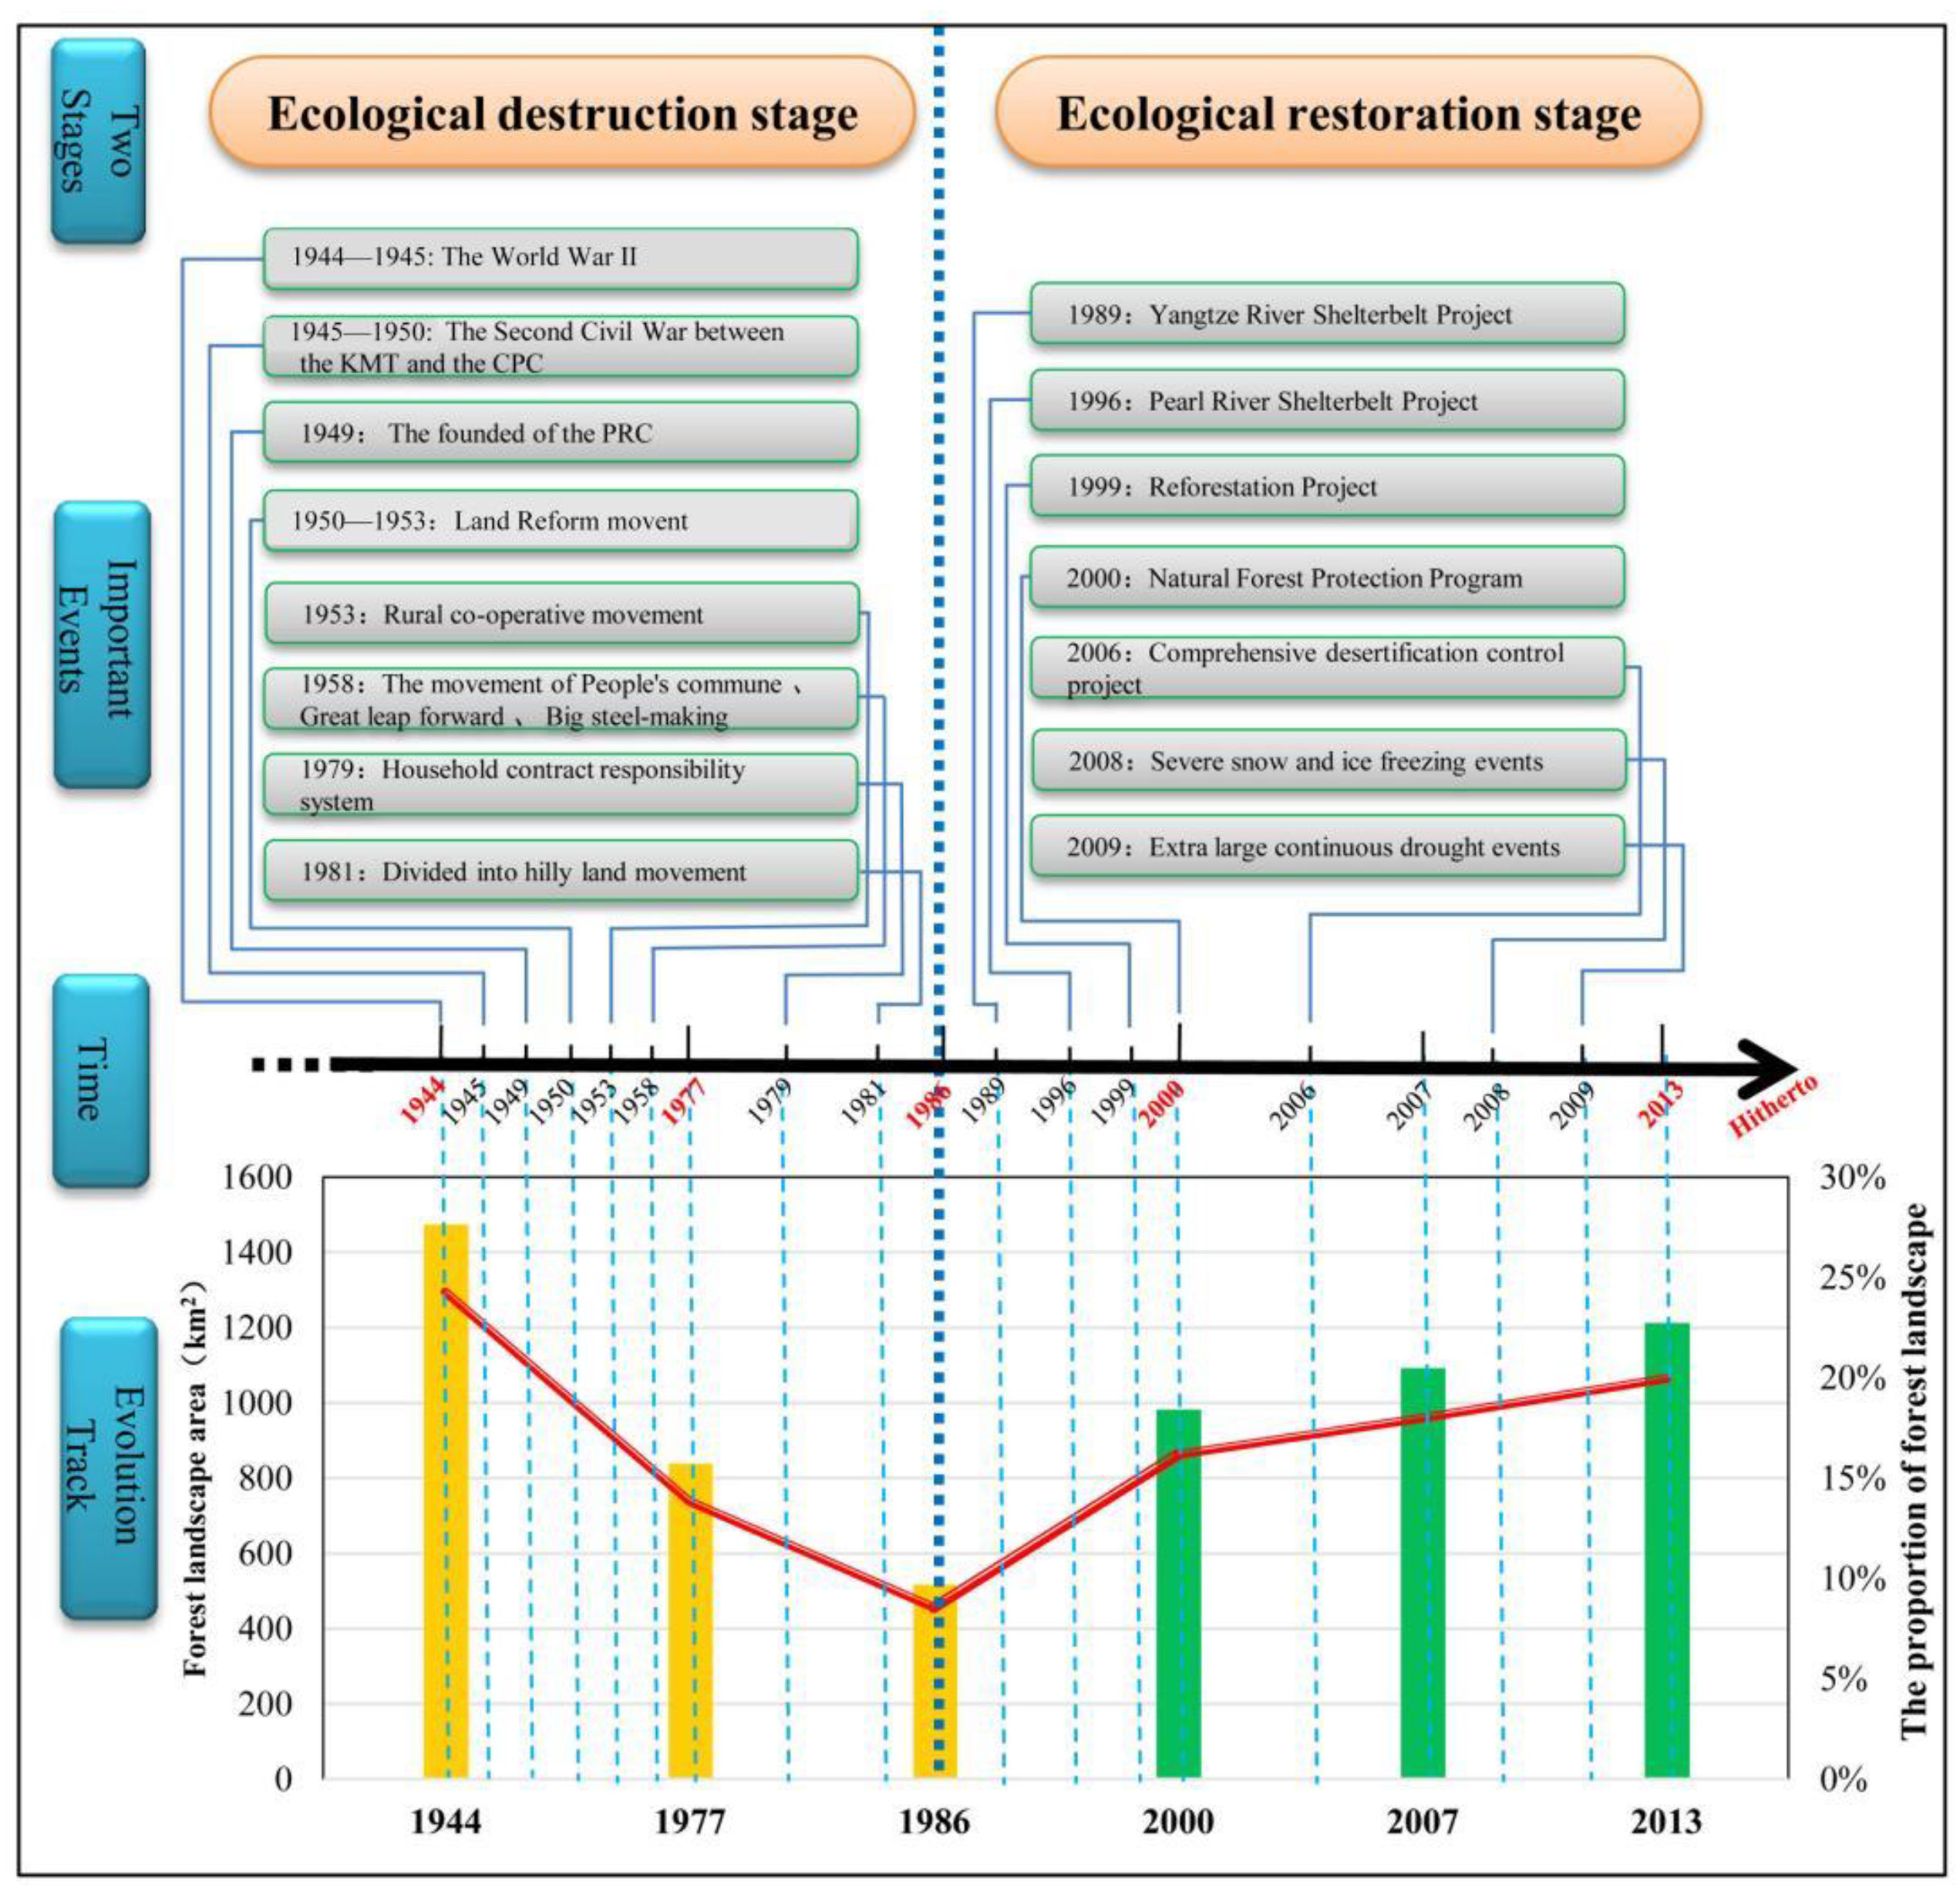
3.1.1. Rate of Change in the Forest Cover under Different Historical Periods

In the analysis of the previous part, it has been found that the evolution trend of forest cover area in the whole study period is first decreasing and then increasing. However, it remains to be analyzed which period changes more quickly. It can be seen from Table 1 that before 1986, the evolution frequency was negative (referring to the decrease in forest area), and after 1986, it was positive (the increase in forest area).
Specifically, from 1944 to 1977, although the overall change rate was −10.43%, the average annual change frequency was only −0.32% because the two years were separated by 33 years. The minimum frequency of change was from 2000 to 2007, with a change rate of only 1.82%. The difference between the highest and lowest frequency of change is nearly 5.73 times. However, a big change does not necessarily mean a quick change rate. This variable is also related to the number of years. From 1986 to 2000, the annual average rate of change was the largest, about 0.52%. Although the overall frequency of change in this period is 7.61%, which is lower than 10.43% in 1944–1977, the average annual frequency of change was higher. It shows that in this period from 1986 to 2000, a series of national ecological protection projects and policies have obvious effects on the restoration of forest cover, such as the Yangtze River Shelter-belt Project (1989), Pearl river Shelter-belt Project (1996), and Reforestation Project (1999) (Figure 5).

3.1.2. Transfer Direction of the Forest Cover under Different Time Series

It can be seen from Figure 6 that there are obvious differences in changes between forest and other land types in various historical periods. Specifically, from 1944 to 1977, the conversion of forest to other land types was 1165 km 2, which was significantly larger than the conversion area of other land types to forest in this period (Figure 6a). From 1977 to 1986, although the changes from forest to other land types and the changes from other land types to forested land were scattered in space, it was also obvious that the changes from the forest to other land types were more (Figure 6b). From 1986 to 2000, the change in other land types to the forests was the most obvious, which was the fastest period of ecological restoration, mainly in the northwest of the study area (Figure 6c). From 2000 to 2007, other land types still changed to forest (467 km2), which mainly happened in the southeast of the study area (Figure 6d). From 2007 to 2013, the forest was converted into other land types (255 km2), mainly occurring in the middle of the study area, which may be related to the increase in temporary forest in construction land caused by urbanization during this period [59]. At the same time, during this period, other land types of 366 km2 were also converted into forest (Figure 6e). From the whole research period from 1944 to 2013, the conversion of forests to other land types is higher than that of other land types (Figure 6f), which is also consistent with the overall analysis results of the previous part of forest coverage.

3.2. Changes in Forest Cover under Different Influencing Factors

The changes in forest cover under the different elements of factors such as elevation, slope, soil types and lithology in different time periods are shown in Table 2 and Figure 7. Table 2 shows the change area of forest under various factor levels in different time periods. Figure 7 shows the percentage of forest change area in different factor levels in the total forest area in different historical periods. In Figure 7, the positive and negative values before the abscissa percentage indicate the changing direction of forest increase and decrease, respectively. The negative percentage indicates the proportion of decreased area in the total forest area at the beginning of this period, and the positive percentage indicates the proportion of increased forest area in the total forest area.

3.2.1. Changes under Different Elevations

Under different levels of elevation, the forest area in three altitude ranges, 1000–1500, 1500–2000 and 2000–2500 m, decreased from 1944 to 2013 (Table 2). Specifically, the forest distributed in 2000–2500 m reached the highest value of 1103.26 km2 at the beginning of the study, with the largest decrease of 458.77 km2 in 1986, and then gradually recovered. Only the forest area in the range of 2500–3000 m above sea level shows an increasing trend, which may be related to fewer human activities in high altitude areas [60].
The percentage of forest change area in different elevations in the total forest area can be seen more intuitively from Figure 7a. Among them, the biggest change area percentage was from 1944 to 1977, and the change area percentage of the forest with 2000–2500 m was −26.45%. Secondly, from 1986 to 2000, the change area percentage of 2000–2500 m forest was 23.26%.

3.2.2. Changes under Different Slopes

Table 2 also shows the forest area under different slopes, from 1944 to 2013, only the forest area with a slope >25° increased, while the other three slopes included a decrease in the forest areas with a slope ≤6°, 6–15° and 15–25°. Among them, the reduced area is mostly distributed in the range of slope 6–15°, which decreased from 813.51 km2 in 1944 to only 681.41 km2 in 2013, indicating that forests with gentle slope in this range is more likely to be occupied by cultivated land or other land types. Forests with steep slopes, such as those with a slope of more than 25°, are more likely to be preserved, because they are less damaged [61,62].
The difference in forest changes area percentage between different periods and slope is shown in Figure 7b. The period 1986 to 2000 presented a relatively large change area percentage, accounting for 48.26% at 6°–15° and 23.90% at 15°–25°, with a total of more than 72%. This result is significantly associated with the “grain for green” policy during this period. For the periods of 1944–1977 and 1977–1986, the changes were mainly negative, and the gradients mainly focused at 6°–15° and 15°–25°, respectively. Therefore, the region with the gradient 6°–25° was frequently interrupted by human activities [63].

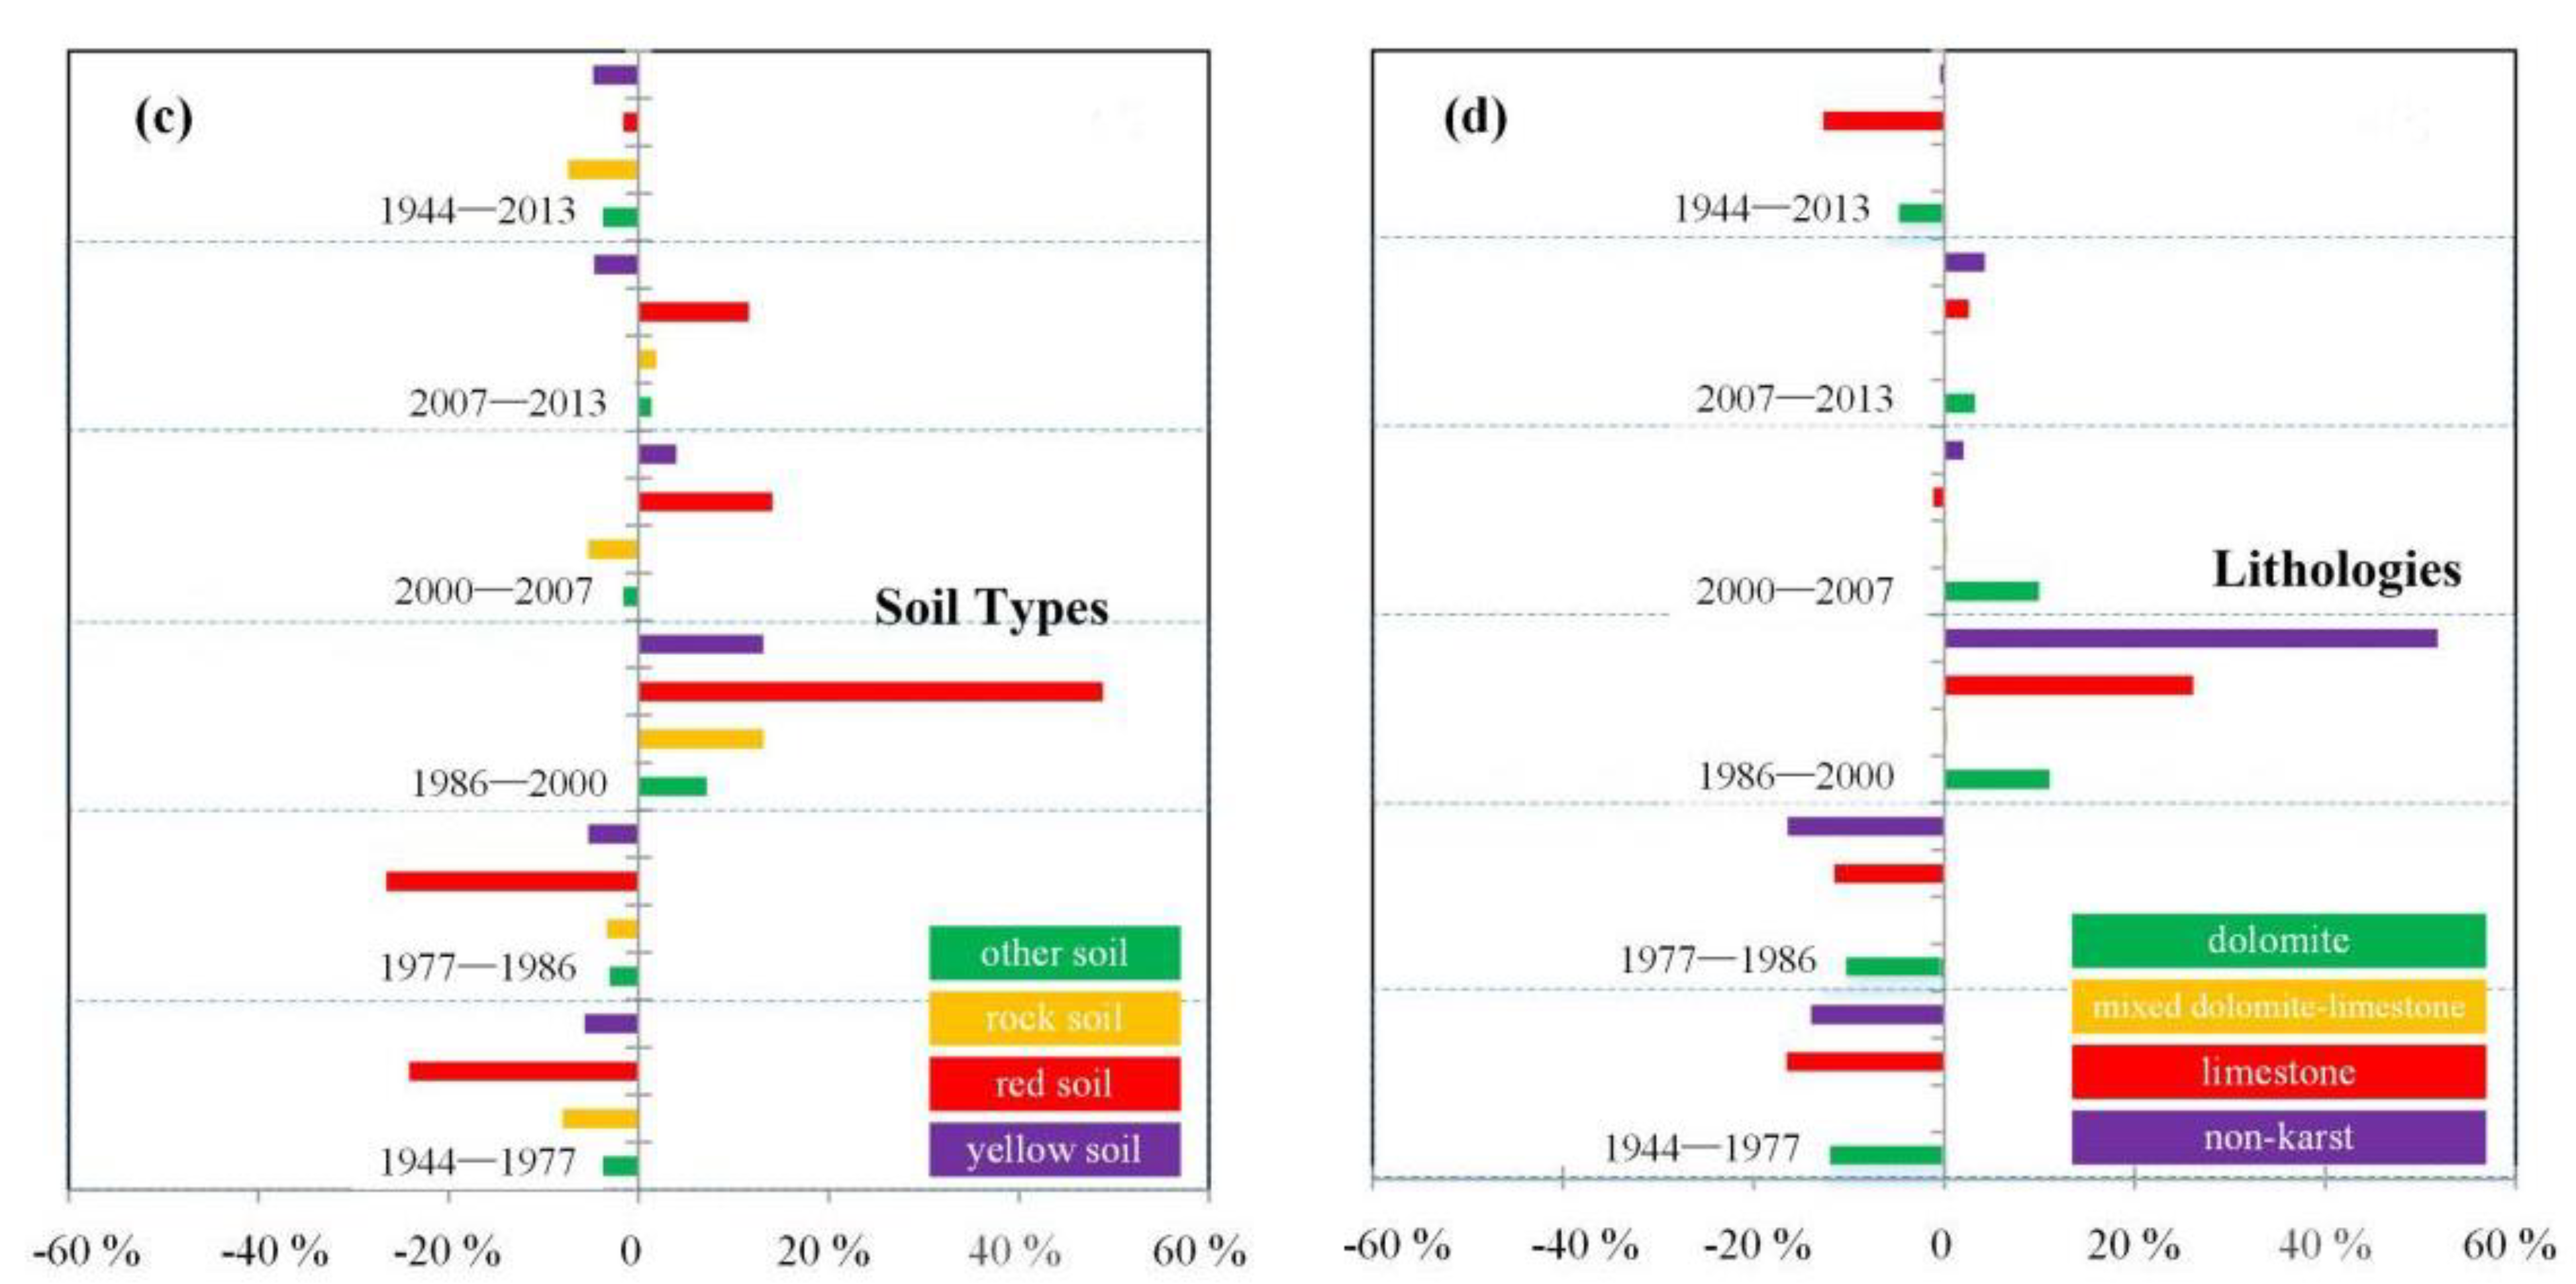
3.2.3. Changes under Different Soil Types

The forest area of four different soil types (other soil, rock soil, red soil and yellow soil) in the study area showed a decreasing trend from 1944 to 2013 (Table 2). Among them, the biggest decrease in forest was in rock soil, which dropped sharply from 168.49 km2 in 1944 to 22.86 km2 in 1986, and the ecological restoration after that only increased to 59.19 km2 in 2013. The largest forest distribution area is red soil, which was 966.61 km2 in 1944, and decreased sharply to 386.99 km2 in 1986. After that, the forest coverage gradually recovered to 943.19 km2 in 2013. Therefore, once the vegetation of karst rock soil type is destroyed, it is much more difficult to restore it than other soil types [64].
The changes in forests area percentage in different soil types in different periods are shown in Figure 7c, among which the biggest change area percentage is that the positive growth rate of forest distributed on red soil was 55.89%, from 1986–2000. However, before this, the negative percentage of change in this soil type were almost offset. Specifically, during the periods of 1944–1977 and 1977–1986, the reduction area percentage of forests distributed on red soil was −24.11% and −26.57%, respectively. However, the change area percentage of forests distributed in karst soil is −7.40%, which means that forests distributed in laterite is easier to recover after being destroyed than that in karst.

3.2.4. Changes under Different Lithologies

The distribution and change characteristics of forests under different lithology generally show that the reduced area of forests in karst lithology (including dolomite mixed with limestone) is obviously larger than that of non-karst lithology (Table 2). Among them, limestone is the largest forest decrease, which decreased sharply from 427.23 km2 in 1944 to 86.07 km2 in 1986, and then recovered to only 239.53 km2 in 2013, only recovering to nearly half of the forest area at the early stage. However, the forests distributed in non-karst lithology decreased by half from 1944 to 1986, and gradually increased to 656.72 km2 in 2013 in the process of restoration, which is similar to the forest area in 1944.
As shown in Figure 7d, the rapid growth of forest area percentage, that is, from 2000 to 2007, it was about 51.78% in non-karst areas and 26.11% for limestone areas, which may have a great relationship with the implementation of natural forest protection projects during this period. On the whole, the limestone area had the biggest negative area percentage from 1944 to 2013, which was −12.72%, and the dolomite area had −4.73%. It also shows that vegetation restoration in karst areas is difficult for non-karst areas [65,66].

4. Discussion

4.1. Comparison with Other Studies

This part of the discussion is mainly aimed at the comparative analysis of other studies that use historical maps combined with remote sensing images to reveal the temporal and spatial changes in long-time series forest cover. At the same time, the comparison is mainly carried out from two aspects: one is to cover all or part of the study period (1944–2013), and the other is to include or relate to the study area (typical karst area in southwest China).
He et al. [67] revealed the trend and main process of forest dynamics from 1700 to 1998 by using historical documents, modern surveys and statistical data, and the results of previous studies. Among them, during the rapid decline from 1700 to 1949, the northeast, southwest and southeast regions suffered the most serious decline, and the coverage rate of most provinces fell by more than 20%. During the recovery period from 1949 to 1998, the western provinces (including Yunnan) increased by over 5%. In addition, another article by the researcher [11] shows that from 1700 to the 1960s, deforestation mainly occurred in southwest China. Judging from the changing trend and the general turning point, the trend of first worsening and then recovering is consistent. In addition, other studies using historical maps and remote sensing images to reveal the long-term changes in forests do not include or involve the study area of this paper, such as Taiwan Province Province [68], Hainan Island [69], Heilongjiang Province [70], etc.
Although there is a lack of research on forest evolution in southwest karst area by using historical maps and remote sensing images, much research that only uses remote sensing data to reveal forest or vegetation cover changes in karst area can also provide a reference for the second period of this study (the forest restoration stage after 1986). For example, Tong et al. [71] used the gimms-3 g Normalized Difference Vegetation Index (NDVI) from the period 1982–2012 to evaluate the effect of ecological engineering vegetation restoration in Yunnan, Guizhou and Guangxi. It was found that although the whole vegetation area was afforested, the restoration rates were different in different areas. On this foundation, Zhang et al. [72] also used the gimms-3 g NDVI from 1982 to 2016 to study the trend of vegetation change in Guizhou, Guangxi and Yunnan, and they found that the trend of vegetation greening in karst areas was strengthened from 1982 to 2016, and ecological engineering was the main reason for the increase in vegetation in karst areas, while the climate was the main driving factor for the decrease in vegetation in non-karst areas. This is consistent with the trend of forest restoration after 1986 in this research. Similarly, using NDVI data, Xu et al. [73] examined the vegetation mutation in Southwest China from 1982 to 2015, and found that the mutation point appeared in 2001, and the trend of NDVI changed from no significant increase to significant increase after the mutation point. For the above researches on forest or vegetation cover in karst areas of southwest China, the time scale mainly concentrated after 1982, and the forest cover showed a consistent increasing trend.
In the last 30 years, there is still a consensus that vegetation will turn green, whether in China [74,75,76] or in the region [77,78]. The research at the China national level before the 1970s shows that southwest China is a region with significant reduction in vegetation cover [11,67], but the research on forests in southwest karst area before 1970s is very scarce. It may be limited by the difficulty in obtaining remote sensing image data, and it also highlights the advantages of this research in combining historical maps with remote sensing images to deal with this problem.

4.2. Events and Factors That Dominate Forest Cover Changes in Different Periods

Forest deterioration from 1944 to 1986: Many incidents occurred during this period, including World War II (also called the “Anti-Japanese War” in China), the civil war between the Chinese Nationalist Party and the Chinese Communist Party from 1945 to 1950 (the Liberation War), the founding of the People’s Republic of China in 1949, the shifting in the national system from capitalism to socialism, the land reform movement in 1950 (i.e., the transformation from feudal land ownership to private land ownership for peasants), the rural cooperative movement in 1953 (i.e., the transformation from private land ownership for peasants to collectivization and socialization of agricultural land), the population policy (i.e., “many hands make work easy”) in 1958, the “Great Leap Forward,” the smelting of steel, and the movement to establish communes for rural residents in 1958. World War II, the Chinese Civil War, the change in the national system, the change in land ownership, or the smelting of steel might have resulted in the sharp deterioration and even the loss of forest vegetation. The policy on family contract business was implemented, particularly the transfer of the collective operation of lands and forests to families or individual corporations, the implementation of a “system of fixed output for households, work contracted to households, and mountain contracted to households,” and the policy to divide privately farmed hilly lands and forest lands among individuals. Farmers were afraid of the change in ownership of such lands, Thus, they engaged in large-scale firewood gathering and logging, which might have damaged forest vegetation.
Forest recovery from 1986 to 2013: Construction projects were conducted to protect the forest system of the Yangtze River Basin in 1989 and the Pearl River Basin in 1996. A project to return grain plots to forests was also implemented in 1999. This project involved ecological construction engineering with the strongest policy, largest investment, widest coverage, and the highest extent of public engagement in China. The project was also the largest one that supports and benefits farmers, with funds of more than CNY4.3 trillion provided by the central government, thereby becoming the largest ecological construction project in the world. The implementation of various projects effectively promoted the increase in forest coverage rate and the reduction in soil erosion incidents. China formally launched conservation programs for natural forest resources in 2000 to strictly manage and protect ecological public welfare forests, strongly develop forestation, and adjust and optimize the ecological structure of forest zones. These programs greatly improved the regional ecological environment and reduced water and soil erosion areas. The comprehensive termination of the stony desertification project was implemented in 2006. In this project, the drainage basin was considered as a unit, the damaged natural ecological system was gradually recovered by increasing the vegetation land cover and conserving water and soil, and the extent of karst rocky desertification was effectively reduced.
The change in forest cover is affected by both natural and human factors [79,80], but the dominant factors are different in different time periods [81]. Although the past forest destruction has brought about the deterioration of the ecological environment, fortunately, a series of ecological projects have made great contributions to the restoration of forest vegetation [82,83].

4.3. Limitations and Future Research Prospects

First of all, due to the limitation of data sources, there was a long period between 1944 and 1977, and only the historical map of 1944 was used, which caused uncertainty of forest change trend analysis at present. In future research, we can increase the number of historical maps obtained as reasonably as possible before the 1970s, or update the latest year to the latest year. Secondly, in the correlation analysis of influencing factors, this study only considered four factors: elevation, slope, soil types and lithology. Then, on the time scale of several decades, these four factors will not change much. In future research, climate factors such as temperature and precipitation can be considered for analysis.

5. Conclusions

Based on the historical map of 1944 and Landsat remote sensing satellite images, this paper quantitatively analyzed the spatial distribution and change in forests from 1944 to 2013, aiming at the evolution law of long-time series spatial distribution characteristics of forest cover in karst areas and the events and factors that may affect the forest changes in the unsustainable stage. The main conclusions are as follows: (1) the forest area in the study area showed a trend of decreasing at first and then increasing. From 1944 to 1986, the deterioration phase of forest area decreased, and from 1986 to 2013, the restoration phase of forest gradually increased. (2) The forest with an altitude of 2000~2500 m changes most frequently in the damage recovery stage, and the forest with a slope of 6~15° faces the greatest risk of damage. (3) The changing characteristics of forests with different soil types and lithology in different stages show that it is more difficult to restore forests in karst areas after they are destroyed. To sum up, the use of historical maps can better solve the temporal and spatial evolution of long-time series of forest cover before there is no remote sensing image due to the limitation of satellite launch time. At the same time, it is necessary to pay attention to forest protection in the subsequent social and economic development of karst areas, to avoid damage and increase the cost of rehabilitation.

Author Contributions

Conceptualization, X.B.; methodology, Y.T.; software, L.Q.; validation, Y.L. and Y.X.; formal analysis, J.W. and L.W.; investigation, C.L., C.R. and S.Z.; resources, F.L. and G.L.; data curation, X.B.; writing—original draft preparation, F.C.; supervision, X.B.; project administration, X.B.; funding acquisition, X.B. All authors have read and agreed to the published version of the manuscript.

Funding

This research work was supported jointly by the Western Light Cross-team Program of Chinese Academy of Sciences (No. xbzg-zdsys-202101), National Natural Science Foundation of China (No. 42077455 & No.42167032), Strategic Priority Research Program of the Chinese Academy of Sciences (No. XDB40000000 & No. XDA23060100), Guizhou Provincial Science and Technology Projects (No. 2022-198), High-level innovative talents in Guizhou Province (No. GCC [2022]015-1 & No. 2016-5648), Guizhou Provincial 2020 Science and Technology Subsidies (No. GZ2020SIG), Opening Fund of the State Key Laboratory of Environmental Geochemistry (No. SKLEG2022206 & No. SKLEG2022208).

Institutional Review Board Statement

Not applicable.

Informed Consent Statement

Not applicable.

Data Availability Statement

Not applicable.

Acknowledgments

We would like to thank all the authors and reviewers for their great guidance and help in writing this manuscript.

Conflicts of Interest

The authors declare no conflict of interest.

References

  1. Yang, J.P. The important role of forest ecological system in economic development. For. Econ. 1999, 4, 1–5. [Google Scholar]
  2. Bonan, G.B. Forests and climate change: Forcings, feedbacks, and the climate benefits of forests. Science 2008, 320, 1444–1449. [Google Scholar] [CrossRef] [PubMed]
  3. Hansen, M.C.; Potapov, P.V.; Moore, R.; Hancher, M.; Turubanova, S.A.; Tyukavina, A.; Thau, D.; Stehman, S.V.; Goetz, S.J.; Loveland, T.R.; et al. High-resolution global maps of 21st-century forest cover change. Science 2013, 342, 850–853. [Google Scholar] [CrossRef]
  4. Blonska, E.; Malek, S.; Januszek, K.; Józef, B.; Wanic, T. Changes in forest soil properties and spruce stands characteristics after dolomite, magnesite and serpentinite fertilization. Eur. J. For. Res. 2015, 134, 981–990. [Google Scholar] [CrossRef]
  5. Hansen, M.C.; Stehman, S.V.; Potapov, P.V. Quantification of global gross forest cover loss. Proc. Natl. Acad. Sci. USA 2010, 107, 8650–8655. [Google Scholar] [CrossRef]
  6. Mayer, A.L.; Kauppi, P.E.; Angelstam, P.K.; Zhang, Y.; Tikka, P.M. Importing timber, exporting ecological impact. Science 2005, 308, 359–360. [Google Scholar] [CrossRef] [PubMed]
  7. Elbakidze, M.; Andersson, K.; Angelstam, P.; Armstrong, G.W.; Axelsson, R.; Doyon, F.; Hermansson, M.; Jacobsson, J.; Pautov, Y. Sustained yield forestry in Sweden and Russia: How does it correspond to sustainable forest management policy? Ambio 2013, 42, 160–173. [Google Scholar] [CrossRef]
  8. Xu, Y.Q.; Xiao, F.J.; Yu, L. Review of spatio-temporal distribution of net primary productity in forest ecosystem and its responses to climate change in China. Acta Ecol. Sin. 2020, 40, 4710–4723. [Google Scholar]
  9. Hu, X.S.; Wu, C.Z.; Hong, W.; Qiu, R.Z.; Li, J.; Hong, T. Forest cover change and its drivers in the upstream area of the Minjiang River, China. Ecol. Indic. 2014, 46, 121–128. [Google Scholar] [CrossRef]
  10. Lin, Y.Y.; Hu, X.S.; Zheng, X.X.; Hou, X.Y.; Zhang, Z.X.; Zhou, X.N.; Qiu, R.Z.; Lin, J.G. Spatial variations in the relationships between road network and landscape ecological risks in the highest forest coverage region of China. Ecol. Indic. 2019, 96, 392–403. [Google Scholar] [CrossRef]
  11. He, F.N.; Li, S.C.; Zhang, X.Z. A spatially explicit reconstruction of forest cover in China over 1700–2000. Glob. Planet. Chang. 2015, 131, 73–81. [Google Scholar] [CrossRef]
  12. Hansen, M.C.; Potapov, P.V.; Pickens, A.H.; Tyukavina, A.; Hernandez-Serna, A.; Zalles, V.; Turubanova, S.; Kommareddy, I.; Stehman, S.V.; Song, X.P.; et al. Global land use extent and dispersion within natural land cover using Landsat data. Environ. Res. Lett. 2022, 17, 034050. [Google Scholar] [CrossRef]
  13. Blanco, V.; Brown, C.; Rounsevel, M. Characterising forest owners through their objectives, attributes and management strategies. Eur. J. For. Res. 2015, 134, 1027–1041. [Google Scholar] [CrossRef]
  14. Luo, G.J.; Wang, S.J.; Bai, X.Y.; Liu, X.M.; Liu, X.M.; Cheng, A.Y. Delineating small karst watersheds based on digital elevation model and eco-hydrogeological principles. Solid Earth 2016, 7, 457–468. [Google Scholar] [CrossRef]
  15. Skaloš, J.; Engstová, B. Methodology for mapping non-forest wood elements using historic cadastral maps and orthophoto maps as a basis for management. J. Environ. Manag. 2010, 91, 831–843. [Google Scholar] [CrossRef]
  16. Skaloš, J.; Engstová, B.; Trpáková, I.; Šantrůčková, M.; Podrázský, V. Long-term changes in forest cover 1780–2007 in central Bohemia, Czech Republic. Eur. J. For. Res. 2012, 131, 871–884. [Google Scholar] [CrossRef]
  17. Zhang, J. Extraction of Rocky Desertification Information in Karst Area of Southwest China Based on Time-Series Remote Sensing Data. Master’s Thesis, China University of Geosciences, Beijing, China, 2021. [Google Scholar]
  18. Bai, X.Y.; Wang, S.J.; Xiong, K.N. Assessing spatial-temporal evolution processes of karst rocky desertification land: Indications for restoration strategies. Land Degrad. Dev. 2013, 24, 47–56. [Google Scholar] [CrossRef]
  19. Li, Y.B.; Shao, J.A.; Yang, H.; Bai, X.Y. The relations between land use and karst rocky desertification in a typical karst area, China. Environ. Geol. 2009, 57, 621–627. [Google Scholar] [CrossRef]
  20. Li, Y.B.; Luo, G.J.; Bai, X.Y.; Wang, Y.Y.; Wang, S.J.; Xie, J.; Yang, G.B. The correlations among arable land, settlement and karst rocky desertification-cases study based on typical peak-cluster depression. Acta Ecol. Sin. 2014, 34, 2195–2207. [Google Scholar]
  21. Andraž, Č.; Marjan, J.; Krištof, O.S. Past and Present Forest Vegetation in NE Slovenia Derived from Old Maps. Appl. Veg. Sci. 1998, 1, 253–258. [Google Scholar]
  22. Alfonso, T.; Dina, S.; Pietro, P. Rural landscape planning through spatial modelling and image processing of historical maps. Land Use Policy 2015, 42, 71–82. [Google Scholar]
  23. Zámolyi, A.; Szekely, B.; Draganits, E.; Timar, G. Neotectonic control on river sinuosity at the western margin of the Little Hungarian Plain. Geomorphology 2009, 122, 231–243. [Google Scholar] [CrossRef]
  24. Lieskovsky, J.; Kaim, D.; Balazs, P.; Boltiziar, M.; Chmiel, M.; Grabska, E.; Kiraly, G.; Konkoly-Gyuro, E.; Kozak, J.; Antalova, K.; et al. Historical land use dataset of the Carpathian region (1819–1980). J. Maps 2018, 14, 644–651. [Google Scholar] [CrossRef]
  25. Roccati, A.; Faccini, F.; Luino, F.; De Graff, J.V.; Turconi, L. Morphological changes and human impact in the Entella River floodplain (Northern Italy) from the 17th century. Catena 2019, 182, 104122. [Google Scholar] [CrossRef]
  26. Fernandes, M.R.; Aguiar, F.C.; Martins, M.J.; Rivaes, R.; Ferreira, M.T. Long-term human-generated alterations of Tagus River: Effects of hydrological regulation and land-use changes in distinct river zones. Catena 2020, 188, 104466. [Google Scholar] [CrossRef]
  27. Zdenek, K.; Marika, S.; Jan, S. Analyzing Land Cover Change—The Impact of the Motorway Construction and Their Operation on Landscape Structure. J. Geogr. Inf. Syst. 2014, 6, 559–571. [Google Scholar]
  28. Skaloš, J.; Weber, M.; Lipský, Z.; Trpakova, I.; Santruckova, M.; Uhlirova, L.; Kukla, P. Using old military survey maps and orthophotograph maps to analyse long-term land cover changes—Case study (Czech Republic). Appl. Geogr. 2011, 31, 426–438. [Google Scholar] [CrossRef]
  29. Pelorosso, R.; Leone, A.; Boccia, L. Land cover and land use change in the Italián central Appeninnes: A comparison of assessment methods. Appl. Geogr. 2009, 29, 35–48. [Google Scholar] [CrossRef]
  30. Petek, F.; Urbanc, M. The Franziscean Land Cadaster as a key to understanding the 19th-Century cultural landscape in Slovenia—Franciscejski kataster kot ključ za razumevanje kulturne pokrajinev Slovenijiv 19. Acta Geogr. Slov. 2004, 44, 89–112. [Google Scholar] [CrossRef]
  31. Rajšp, V.; Ticho, M.; Grabnar, M.; Kološa, V.; Serše, A.; Trpin, D. Joseske mapovani Slovenija na vojaškem zemljevidu 1763–1787 opisi. (Josephinische Landesaufnahme 1763–1787 für das Gebiet der Republik Slowenien Landesbeschreibung). Ljublana 1995, 345, 19. [Google Scholar]
  32. Bender, O.; Boehmerb, H.J.; Jens, D.; Schumacher, K.P. Using GIS to analyse long-term cultural landscape change in Southern Germany. Landsc. Urban Plan 2005, 70, 111–125. [Google Scholar] [CrossRef]
  33. Cousins, S.A.O.; Eriksson, Å.; Franzén, D. Reconstructing past land use and vegetation patterns using palaeogeographical and archaeological data. A focus on grasslands in Nynäs by the Baltic Sea in south-eastern Sweden. Landsc. Urban Plan 2002, 61, 1–18. [Google Scholar] [CrossRef]
  34. Domaas, S.T. The reconstruction of past patterns of tilled fields from historical Cadastral Maps using GIS. Landsc. Res 2007, 32, 23–43. [Google Scholar] [CrossRef]
  35. Hamre, L.N.; Domaas, S.T.; Austad, I.; Rydgren, K. Land-cover and structural changes in a western Norwegian cultural landscape since 1865, based on an old cadastral map and a field survey. Landsc. Ecol. 2007, 22, 1563–1574. [Google Scholar] [CrossRef]
  36. Sklenička, P.; Molnarova, K.; Brabec, E.; Kumble, P.; Pittnerova, B.; Pixova, K.; Salek, M. Remnants of medieval field patterns in the Czech Republic: Analysis of driving forces behind their disappearance with special attention to the role of hedgerows. Agric. Ecosyst. Environ. 2009, 129, 465–473. [Google Scholar] [CrossRef]
  37. Trpák, P.; Trpáková, I. Landscape function analysis based on evaluation of indicator maps and sketches of stable cadastre maps, Krajina 2002. In Krajina 2002—Od Poznání k Integraci; Ministerstvo Životního Prostředí: Ústí nad Labem, The Czech Republic, 2002; pp. 85–91. (In Czech) [Google Scholar]
  38. Yang, F.; He, F.N.; Li, M.J.; Li, S.C. Evaluating the reliability of global historical land use scenarios for forest data in China. J. Geogr. Sci. 2020, 30, 1083–1094. [Google Scholar] [CrossRef]
  39. Li, S.C.; He, F.N.; Zhang, X.Z. An approach to spatially explicit reconstruction of historical forest in Northeast China. J. Geogr. Sci. 2014, 24, 1022–1034. [Google Scholar] [CrossRef]
  40. Liu, D.; Toman, E.; Zane Fuller, Z.; Chen, G.; Londo, A.; Zhang, X.S.; Zhao, K.G. Integration of historical map and aerial imagery to characterize long-term land-use change and landscape dynamics: An object-based analysis via Random Forests. Ecol. Indic. 2018, 95, 595–605. [Google Scholar] [CrossRef]
  41. Tanacs, E.; Szmorad, F.; Barany-Kevei, I. A review of the forest management history and present state of the Haragistya karst plateau (Aggtelek Karst, Hungary). Acta Carsolog. 2007, 36, 441–451. [Google Scholar] [CrossRef]
  42. Zhao, Z.Q.; Hou, L.S.; Cai, Y.L. The process and mechanism of soil degradation in karst area in Southwest China. Earth Sci. Front. 2006, 13, 185–189. [Google Scholar]
  43. Yuan, D.X. Rock desertification in the sutbtropical karst of South China. Z. Für Geomorphol. Neue Folge 1997, 108 (Suppl. Bd), 81–90. [Google Scholar]
  44. Cao, J.H.; Yuan, D.X.; Pan, G.X. Some soil features in karst ecosystem. Adv. Earth Sci. 2003, 18, 37–44. [Google Scholar]
  45. Wang, S.J.; Sun, C.X.; Feng, Z.G.; Liu, X.M. Mineralogical and geochemical characteristics of the limestone weathering profile. Acta Mineral. Sin. 2002, 22, 19–29. [Google Scholar]
  46. Cao, J.H.; Yuan, D.X.; Zhang, C.; Pan, G.X. Karst Ecosystem constrained by geological conditions in southwest China. Earth Environ. 2004, 32, 1–8. [Google Scholar]
  47. Wang, S.J.; Ji, H.B.; Ouyang, Z.Y.; Zhou, D.Q. The Preliminary Study of Carbonate Rock Weathering and Soil Formation. Sci. Sin. (Terrae) 1999, 5, 441–449. [Google Scholar]
  48. Cao, J.H.; Jiang, Z.C.; Yang, D.S.; Pei, J.G.; Yang, H.; Luo, W.Q. Soil loss tolerance and prevention and measurement of Karst area in southwest China. Soil Water Conserv. China 2008, 12, 40–45+72. [Google Scholar]
  49. Wang, S.J.; Li, R.L.; Sun, C.X.; Zhang, D.F.; Li, F.Q.; Zhou, D.Q.; Xiong, K.N.; Zhou, Z.F. How types of carbonate rock assemblages constrain the distribution of Karst rocky desertified land in Guizhou Province, PR China. Land Degrad. Dev. 2004, 15, 123–131. [Google Scholar] [CrossRef]
  50. Li, Y.B.; Bai, X.Y.; Qiu, X.C.; Zhou, G.F.; Lan, A.J.; Zhou, X.; Xiong, K.N. Karst rocky desertification and land use of correlation studies. Resour. Sci. 2006, 28, 67–73. [Google Scholar]
  51. Li, Y.B.; Bai, X.Y.; Wang, S.J.; Qin, L.Y.; Tian, Y.C.; Luo, G.J. Evaluating of the spatial heterogeneity of soil loss tolerance and its effects on erosion risk in the carbonate areas of southern China. Solid Earth 2017, 8, 661–669. [Google Scholar] [CrossRef]
  52. Chen, F.; Zhou, D.Q.; Bai, X.Y.; Xiao, J.Y.; Qian, Q.H. Spatial-temporal evolution of karst rocky desertification and future trends based on CA-Markov methods in typical karst valley. J. Agric. Resour. Environ. 2018, 35, 174–180. [Google Scholar]
  53. Li, H.W.; Wang, S.J.; Bai, X.Y.; Cao, Y.; Tian, Y.C.; Luo, G.J.; Chen, F.; Li, Q.; Wu, L.H.; Wang, J.F.; et al. Effects of climate change and ecological restoration on carbonate rock weathering carbon sequestration in the karst valley of Southwest China. Acta Ecol. Sin. 2019, 39, 6158–6172. [Google Scholar]
  54. Huang, Q.; Cai, Y.; Xing, X. Rocky desertification, anti desertification, and sustainable development in the karst mountain region of Southwest China. Ambio 2008, 37, 390–392. [Google Scholar] [CrossRef] [PubMed]
  55. Jiang, Z.H.; Liu, H.Y.; Wang, H.Y.; Peng, J.; Meersmans, J.; Green, S.M.; Quine, T.A.; Wu, X.C.; Song, Z.L. Bedrock geochemistry influences vegetation growth by regulating the regolith water holding capacity. Nat. Commun. 2020, 11, 2392. [Google Scholar] [CrossRef] [PubMed]
  56. Yuan, D.X. Global view on Karst rock desertification and integrating control measures and experiences of China. Pratacult. Sci. 2008, 25, 19–25. [Google Scholar]
  57. Jiang, Y.J.; Liu, X.M.; He, S.Y.; He, B.H.; Xie, J.P.; Luo, W.J.; Bai, X.Y.; Xiao, Q. Research and development of comprehensive rehabilitation measures for land rocky desertification in Karst trough valley area. Acta Ecol. Sin. 2016, 36, 7092–7097. [Google Scholar]
  58. Yu, M.; Li, Y.B.; Luo, G.J. Evolution trend of rocky desertification in karst mountain areas of southwest China. Acta Ecol. Sin. 2022, 42, 4267–4283. [Google Scholar]
  59. Liu, Y.S.; Wang, J.Y.; Deng, X.Z. Rocky land desertification and its driving forces in the karst areas of rural Guangxi, Southwest China. J. Mt. Sci. 2008, 5, 350–357. [Google Scholar] [CrossRef]
  60. Liu, H.Y.; Jiao, F.S.; Yin, J.Q.; Li, T.Y.; Gong, H.B.; Wang, Z.Y.; Lin, Z.S. Nonlinear relationship of vegetation greening with nature and human factors and its forecast—A case study of Southwest China. Ecol. Indic. 2020, 111, 106009. [Google Scholar] [CrossRef]
  61. Jiang, Z.C.; Lian, Y.Q.; Qin, X.Q. Rocky desertification in Southwest China: Impacts, causes, and restoration. Earth-Sci. Rev. 2014, 132, 1–12. [Google Scholar] [CrossRef]
  62. Chen, F.; Wang, S.J.; Bai, X.Y.; Liu, F.; Zhou, D.Q.; Tian, Y.C.; Luo, G.J.; Li, Q.; Wu, L.H.; Zheng, C.; et al. Assessing spatial-temporal evolution processes and driving forces of karst rocky desertification. Geocarto Int. 2021, 36, 262–280. [Google Scholar] [CrossRef]
  63. Zhang, Z.H.; Hu, G.; Zhu, J.D.; Luo, D.H.; Ni, J. Spatial patterns and interspecific associations of dominant tree species in two old-growth karst forests, SW China. Ecol. Res. 2010, 25, 1151–1160. [Google Scholar] [CrossRef]
  64. Xu, E.Q.; Zhang, H.Q.; Li, M.X. Mining spatial information to investigate the evolution of karst rocky desertification and its human driving forces in Chang Shun, China. Sci. Total Environ. 2013, 458–460, 419–426. [Google Scholar] [CrossRef]
  65. Chen, H.S.; Fu, Z.Y.; Zhang, W. Soil water processes and vegetation restoration in karst regions of southwest China. Chin. J. Nat. 2018, 40, 41–46. [Google Scholar]
  66. Zhu, X.C.; Ma, M.G.; Tateno, R.; He, X.H.; Shi, W.Y. Effects of vegetation restoration on soil carbon dynamics in Karst and non-karst regions in Southwest China: A synthesis of multi-source data. Plant Soil 2021, 1–15. [Google Scholar] [CrossRef]
  67. He, F.N.; Ge, Q.S.; Dai, J.H.; Rao, Y.J. Forest change of China in recent 300 years. J. Geogr. Sci. 2008, 18, 59–72. [Google Scholar] [CrossRef]
  68. Yang, X.; Jin, X.; Yang, Y.; Yang, Y.K.; Song, J.N.; Zhang, T.; Zhou, Y.K. Spatially explicit changes of forestland in Taiwan Province from 1910 to 2010. J. Geogr. Sci. 2022, 32, 441–457. [Google Scholar] [CrossRef]
  69. Lin, S.L.; Jiang, Y.Z.; He, J.K.; Ma, G.Z.; Xu, Y.; Jiang, H.S. Changes in the spatial and temporal pattern of natural forest cover on Hainan Island from the 1950s to the 2010s: Implications for natural forest conservation and management. PeerJ 2017, 5, e3320. [Google Scholar] [CrossRef] [PubMed]
  70. Zhang, L.; Liu, Z.; Liu, D.Y.; Xiong, Q.; Yang, N.; Ren, T.W.; Zhang, C.; Zhang, X.D.; Li, S.M. Crop Mapping Based on Historical Samples and New Training Samples Generation in Heilongjiang Province, China. Sustainability 2019, 11, 5052. [Google Scholar] [CrossRef]
  71. Tong, X.W.; Wang, K.L.; Yue, Y.M.; Brandt, M.; Liu, B.; Zhang, C.H.; Liao, C.J.; Fensholt, R. Quantifying the effectiveness of ecological restoration projects on long-term vegetation dynamics in the Karst regions of Southwest China. Int. J. Appl. Earth Obs. Geoinf. 2017, 54, 105–113. [Google Scholar] [CrossRef]
  72. Zhang, X.M.; Yue, Y.M.; Tong, X.W.; Wang, K.L.; Qi, X.K.; Deng, C.X.; Brandt, M. Eco-engineering controls vegetation trends in southwest China Karst. Sci. Total Environ. 2021, 770, 145160. [Google Scholar] [CrossRef]
  73. Xu, X.J.; Liu, H.Y.; Lin, Z.S.; Jiao, F.S.; Gong, H.B. Relationship of Abrupt Vegetation Change to Climate Change and Ecological Engineering with Multi-Timescale Analysis in the Karst Region, Southwest China. Remote Sens. 2019, 11, 1564. [Google Scholar] [CrossRef]
  74. Piao, S.L.; Yin, G.D.; Tan, J.G.; Cheng, L.; Huang, M.T.; Li, Y.; Liu, R.G.; Mao, J.F.; Myneni, R.B.; Peng, S.S.; et al. Detection and attribution of vegetation greening trend in China over the last 30 years. Glob. Chang. Biol. 2015, 21, 1601–1609. [Google Scholar] [CrossRef] [PubMed]
  75. Li, Z.D.; Wang, S.; Li, C.J.; Ye, C.C.; Gao, D.X.; Chen, P. The trend shift caused by ecological restoration accelerates the vegetation greening of China’s drylands since the 1980s. Environ. Res. Lett. 2022, 17, 044062. [Google Scholar] [CrossRef]
  76. Zhao, H.W.; Wu, C.Y.; Wang, X.Y. Large-scale forest conservation and restoration programs significantly contributed to land surface greening in China. Environ. Res. Lett. 2022, 17, 024023. [Google Scholar] [CrossRef]
  77. Wang, C.X.; Liang, W.; Yan, J.W.; Jin, Z.; Zhang, W.B.; Li, X.F. Effects of vegetation restoration on local microclimate on the Loess Plateau. J. Geogr. Sci. 2022, 32, 291–316. [Google Scholar] [CrossRef]
  78. Brandt, M.; Yue, Y.M.; Wigneron, J.P.; Tong, X.W.; Tian, F.; Jepsen, M.R.; Xiao, X.M.; Verger, A.; Mialon, A.; Al-Yaari, A.; et al. Satellite-observed major greening and biomass increase in South China karst during recent decade. Earth’s Future 2018, 6, 1017–1028. [Google Scholar] [CrossRef]
  79. Qiao, Y.N.; Chen, H.; Jiang, Y.J. Quantifying the impacts of lithology on vegetation restoration using a random forest model in a karst trough valley, China. Ecol. Eng. 2020, 156, 105973. [Google Scholar] [CrossRef]
  80. Li, Y.; Piao, S.L.; Laurent, Z.X.; Chen, A.P.; Wang, X.H.; Ciais, P.; Huang, L.; Lian, X.; Peng, S.S.; Zeng, Z.Z.; et al. Divergent hydrological response to large-scale afforestation and vegetation greening in China. Sci. Adv. 2018, 4, eaar4182. [Google Scholar] [CrossRef]
  81. Wang, J.; Liu, P.; Gao, Z.; Bai, S.B.; Cao, G.J.; Qu, G.X. Temporal-spatial variation of the channel in Jiangsu reach of the Yangtze River during the last 44 years. Dili Xuebao/Acta Geogr. Sin. 2007, 62, 1185–1193. [Google Scholar]
  82. Tong, X.W.; Brandt, M.; Yue, Y.M.; Horion, S.; Wang, K.L.; De, K.W.; Tian, F.; Schurgers, G.; Xiao, X.M.; Luo, Y.Q.; et al. Increased vegetation growth and carbon stock in China Karst via ecological engineering. Nat. Sustain. 2018, 1, 44–50. [Google Scholar] [CrossRef]
  83. Tong, X.W.; Brandt, M.; Yue, Y.M.; Ciais, P.; Jepsen, M.R.; Penuelas, J.; Wigneron, J.P.; Xiao, X.M.; Song, X.P.; Horion, S.; et al. Forest management in southern China generates short term extensive carbon sequestration. Nat. Commun. 2020, 11, 129. [Google Scholar] [CrossRef] [PubMed]
Figure 1. The maps of the location and main natural background of the study area. Note the following: (a) location; (b) elevation; (c) elevation classification; (d) slope grade; (e) soil type; (f) lithology. (We constructed this map using ArcGIS9.3 (http://www.esri.com/arcgis/about-arcgis) (accessed on 12 November 2021)).
Land 11 01349 g001
Figure 2. The technique flowchart showing the study of spatial patterns of forest landscape based on the military map and remote sensing images. (We constructed this figure using WPS office (https://platform.wps.cn/) (accessed on 29 November 2021)).
Land 11 01349 g002
Figure 3. The military map and remote sensing images in different times. (We constructed this map using ArcGIS9.3 (http://www.esri.com/arcgis/about-arcgis) (accessed on 19 December 2021)).
Land 11 01349 g003
Figure 4. The spatial distribution information maps of forest landscape in the different historical times. (We constructed this map using ArcGIS9.3 (http://www.esri.com/arcgis/about-arcgis) (accessed on 25 December 2021)).
Land 11 01349 g004aLand 11 01349 g004b
Figure 5. The evolution process of forest landscape and important historical events related to it. (We constructed this figure using WPS office (https://platform.wps.cn/) (accessed on 30 December 2021)).
Land 11 01349 g005
Figure 6. The space transfer matrix maps of forest landscape in different historical periods. (We constructed this map using ArcGIS9.3 (http://www.esri.com/arcgis/about-arcgis) (accessed on 27 December 2021)).
Land 11 01349 g006
Figure 7. The percentage of forests changing area with different elements grades in the total forest area in different historical periods. (We constructed this figure using WPS office (https://platform.wps.cn/) (accessed on 27 December 2021)).
Land 11 01349 g007aLand 11 01349 g007b
Table 1. The annual changing rates of forest landscape in different historical periods. (We constructed this table using WPS office (https://platform.wps.cn/) (accessed on 19 December 2021)).
TimeThe Annual Changing RatesChanging Rates
1944–1977−0.32%−10.43%
1977–1986−0.48%−5.29%
1986–20000.51%7.61%
2000–20070.26%1.82%
2007–20130.33%1.97%
Table 2. The distribution and change information of forest landscape under various natural background conditions during different historical stages (unit: km2). (We constructed this table using WPS office (https://platform.wps.cn/) (accessed on 19 December 2021)).
Background ConditionsClassificationTime Sequence
194419771986200020072013
Elevations1000–1500 m2.80 0.09 0.00 1.72 1.88 0.00
1500–2000 m358.17 119.16 52.02 169.28 114.50 160.79
2000–2500 m1103.26 712.82 458.77 800.70 951.19 1042.31
2500–3000 m11.78 14.74 12.49 16.91 31.76 10.27
Slope≤6°200.60 40.50 29.86 66.50 93.88 105.95
6–15°813.51 467.45 302.35 552.54 616.94 681.42
15–25°356.83 273.19 157.31 281.28 277.53 313.62
>25°96.87 61.11 31.00 82.96 104.82 105.68
Soil TapesOther soil116.01 47.83 22.14 59.29 43.84 58.08
Rock soil168.49 50.77 22.86 91.01 39.01 59.19
Red soil966.61 610.70 386.99 677.95 816.22 943.19
Yellow soil217.27 133.13 88.62 155.32 194.30 146.60
LithologiesDolomite Mixed375.64 200.78 115.28 172.80 270.57 305.81
dolomite-limestone2.27 1.31 0.34 1.80 4.59 4.99
Limestone427.23 183.21 86.07 221.99 210.99 239.53
Non-karst663.23 457.12 318.91 586.97 607.22 656.72
Publisher’s Note: MDPI stays neutral with regard to jurisdictional claims in published maps and institutional affiliations.

