Article

An Integrated Approach of Machine Learning, Remote Sensing, and GIS Data for the Landslide Susceptibility Mapping

1
Division of Earth Sciences and Geography, RWTH Aachen University, 52062 Aachen, Germany
2
School of Informatics, Computing, and Cyber Systems, Northern Arizona University, Flagstaff, AZ 86011, USA
3
Division of Earth and Planetary Science, University of Hong Kong, Hong Kong, China
4
Laboratory for Space Research, University of Hong Kong, Hong Kong, China
5
State Key Laboratory of Information Engineering in Surveying, Mapping and Remote Sensing, Wuhan University, Wuhan 430072, China
6
Department of Wildlife, Fisheries and Aquaculture, Mississippi State University, 775 Stone Boulevard, Starkville, MS 39762, USA
7
State Key Laboratory of Water Resources and Hydropower Engineering Science, Wuhan University, Wuhan 430072, China
8
Department of Botany, University of Gujrat, Hafiz Hayat Campus, Gujrat 50700, Pakistan
9
Georisk & Environment, Department of Geology, University of Liege, 4000 Liege, Belgium
*
Authors to whom correspondence should be addressed.
These authors contributed equally to this work.
Land 2022, 11(8), 1265; https://doi.org/10.3390/land11081265
Submission received: 12 July 2022 / Revised: 30 July 2022 / Accepted: 3 August 2022 / Published: 7 August 2022

Abstract

:
Landslides triggered in mountainous areas can have catastrophic consequences, threaten human life, and cause billions of dollars in economic losses. Hence, it is imperative to map the areas susceptible to landslides to minimize their risk. Around Abbottabad, a large city in northern Pakistan, a large number of landslides can be found. This study aimed to map the landslide susceptibility over these regions in Pakistan by using three Machine Learning (ML) techniques, specifically Linear Regression (LiR), Logistic Regression (LoR), and Support Vector Machine (SVM). Several influencing factors were used to identify the potential landslide areas, including elevation, slope degree, slope aspect, general curvature, plan curvature, profile curvature, landcover classification system, Normalized Difference Water Index (NDWI), Normalized Difference Vegetation Index (NDVI), soil, lithology, fault density, topographic roughness index, and road density. The weights of these factors were calculated using ML techniques. The weightage overlay tool is adopted to map the final output. According to three ML models, lithology, NDWI, slope, and LCCS significantly impact landslide occurrence. The area under the ROC curve (AUC) is applied to validate the performance of models, and the results show the AUC value of LiR (88%) is better than SVM (86%) and LoR (85%) models. ML models and final susceptibility map gives good accuracy, which can be reliable for the results. The study’s outcome provides baselines for policymakers to propose adequate protection and mitigation measures against the landslides in the region, and any other researcher can adopt this methodology to map the landslide susceptibility in another area having similar characteristics.

1. Introduction

One of the main reasons for the terrain transformation is the regular occurrence of landslides worldwide [1,2], which are prevalent geohazards globally, causing economic losses and causalities [3,4,5]. From 2008 to 2017, more than the US $2.7 billion of economic losses were caused by landslides, and over 3 million people were affected, with 10,338 fatalities globally [6,7]. In classifying natural disasters based on the involved natural processes, landslides rank at the third position of the most disastrous types of natural hazards [8,9,10]. Landslides have a heterogeneous spatial distribution, with Asia being the most prevalent geographical region [11].
About 60% of Pakistan’s entire area features rough mountainous topography and plateaus [12]. The Himalayan region in Pakistan represents the most hazard-prone region of the country. It is also exposed to widespread landslide activity due to heavy rainfall during the monsoon season, the high seismicity, the presence of high and steep slopes, and the locally thick unstable soil cover. The Kashmir earthquake initiated thousands of landslides in the northern region in 2005 [13,14]. The Abbottabad district, which is the target region of this study, is located in the foothills of the highly rugged Himalayas Mountains and is subject to the occurrence of many landslides. Abbottabad city lies at 43 km to the south of Balakot, where the 2005 Kashmir earthquake with a moment magnitude of 7.6 devastated the whole region [15,16].
In many regions, various types of natural hazards may be coupled and their combined effects may be strongly intensified [17]. In such circumstances, the recognition of the effect of each hazard becomes very challenging [18]. Landslides are difficult to predict, therefore it is essential to understand the causative factors of landslides and to map the areas which are susceptible to future landslide occurrence. For this purpose, landslide susceptibility (LS) mapping is carried out using remote sensing and geographic information system (GIS) data. LS map is categorized into different classes depending upon the degree of susceptibility (very low, low, moderate, high, very high) without considering the rate of occurrence [7,19].
Different methods have been developed and adopted for LS mapping globally, classified as qualitative and quantitative approaches [20,21,22]. The qualitative approach is a knowledge-driven method based on an expert’s knowledge. It is a relatively subjective or heuristic approach. It evaluates landslide susceptibility by weighing and ranking the influencing factors of landslides based on the researcher’s expertise [23,24,25]. Some qualitative techniques use analytical tools to perform rating and weighting and are considered semi-quantitative [26,27]. The commonly used subjective methods include simple additive weighting [28], ordered weighted average [29], analytical hierarchy process [30,31], analytical network process [32], TOPSIS [33,34], and the weighted linear combination [26,27].
The quantitative method is a data-driven method and an objective approach [20], which leveraged soft computing, deterministic methods, and statistical algorithms to evaluate the relationship between the landslide-influencing factors and slope instability and predict the probability of landslide [35,36]. Artificial neural network (ANN) [37,38], decision trees [39,40], logistic regression method (LoR) [35,41], support vector machine (SVM) [42,43], and linear regression (LiR) [44,45] are the commonly used quantitative methods. In this study, we propose the application of LiR, LoR, and SVM to landslide susceptibility mapping. Numerous studies have proven the outcomes of these models to be better than those of other conventional ML techniques [46,47]. The SVM model maximizes margin, it is slightly more efficient. The SVM supports kernels, allowing you to model non-linear relationships. It is based on a non-linear change of the covariates in a high-dimensional space where distinct classes can be separated linearly [48,49]. The LiR aims to identify the best-fitted line and is used to handle the regression problems and shows how landslide susceptibility changes as the standard deviation of independent variables and predictors changes [50]. The LoR tries fitting the line values to the sigmoid curve. It maximizes the posterior class probability. It uses independent variables to estimate the likelihood of an event occurring on any given piece of land. The fact that the dependent variable is dichotomous is crucial in LoR. The independent variables in this model can be measured on a nominal, ordinal, interval, or ratio scale and are predictors of the dependent variable. The dependent variable and independent variables have a nonlinear relationship [42,51].
Many studies have been completed so far to compare the performance of different models for evaluating and analyzing landslide susceptibility. For example, Hong et al. [39] conducted a study in 187 landslide locations using 14 landslide conditioning factors and concluded that the prediction capability is 81.1%, 84.2%, and 93.3% for KLR (Kernel Logistic Regression), SVM, and the ADT (Alternating Decision Tree), respectively [47]. The Analytical Hierarchy Process (AHP) and Logistic Regression (LoR) were compared with the combined fuzzy and SVM hybrid model. The results indicated that the combined fuzzy and SVM method with an accuracy of 85.73% performed better than AHP and LR. In another study in Inje, Korea, Park et al. [41] compared four models, Frequency Ratio (FR), AHP, LoR, and ANN methods with the AUC values 0.794, 0.789, 0.794, and 0.806, respectively, suggesting that the ANN led to a better result compared to the other three models.
The main goal of this research is to produce GIS-based LS maps over a broader scale of the Abbottabad district using three different machine learning (ML) techniques, including LiR, LoR, and SVM, and compare their accuracy. An extensive database of landslide inventory and influencing factors is formulated for training and validating the LS mapping. Fourteen causative factors broadly grouped into geomorphological, geological, hydrological, and topographical factors were used in this research. The factor analysis is performed to identify the critical parameters by weight. The LS models were validated using validation datasets based on the receiver operating characteristic (ROC) curve, and the area under the curve (AUC). The accuracy assessment is conducted at the end to validate the generated LS maps. There is extensive work previously performed by authors in the northern areas of Pakistan. Qing et al. [52] assessed the debris flow susceptibility mapping along the China-Pakistan Karakoram highway using support vector classification (SVC), and Ali et al. [53] assessed the LS mapping using AHP along the China-Pakistan Economic Corridor. Basharat et al. [54] produced an LS map covering a smaller portion of the study area using the weighted overlay method. Kamp et al. [15] presented landslide susceptibility analysis based on AHP. Torizin et al. [55] investigated the landslide susceptibility assessment of the Mansehra and Torghar districts by using the weight of evidence (WofE).
These studies are frequently associated with traditional quantitative and decision-making approaches, which are less precise than ML methods. We presented ML models in the present study. These models will improve the accuracy of susceptibility maps. Still, to our knowledge, no prior LS mapping has been performed in the Abbottabad district. This study will fill the gap by identifying the landslide-prone areas in the study area. Related outcomes may help disaster management authorities, researchers, government, planners, and decision-makers in land use planning to prevent causalities, economic losses, and depletion of land resources in the study area.

2. Materials and Methods
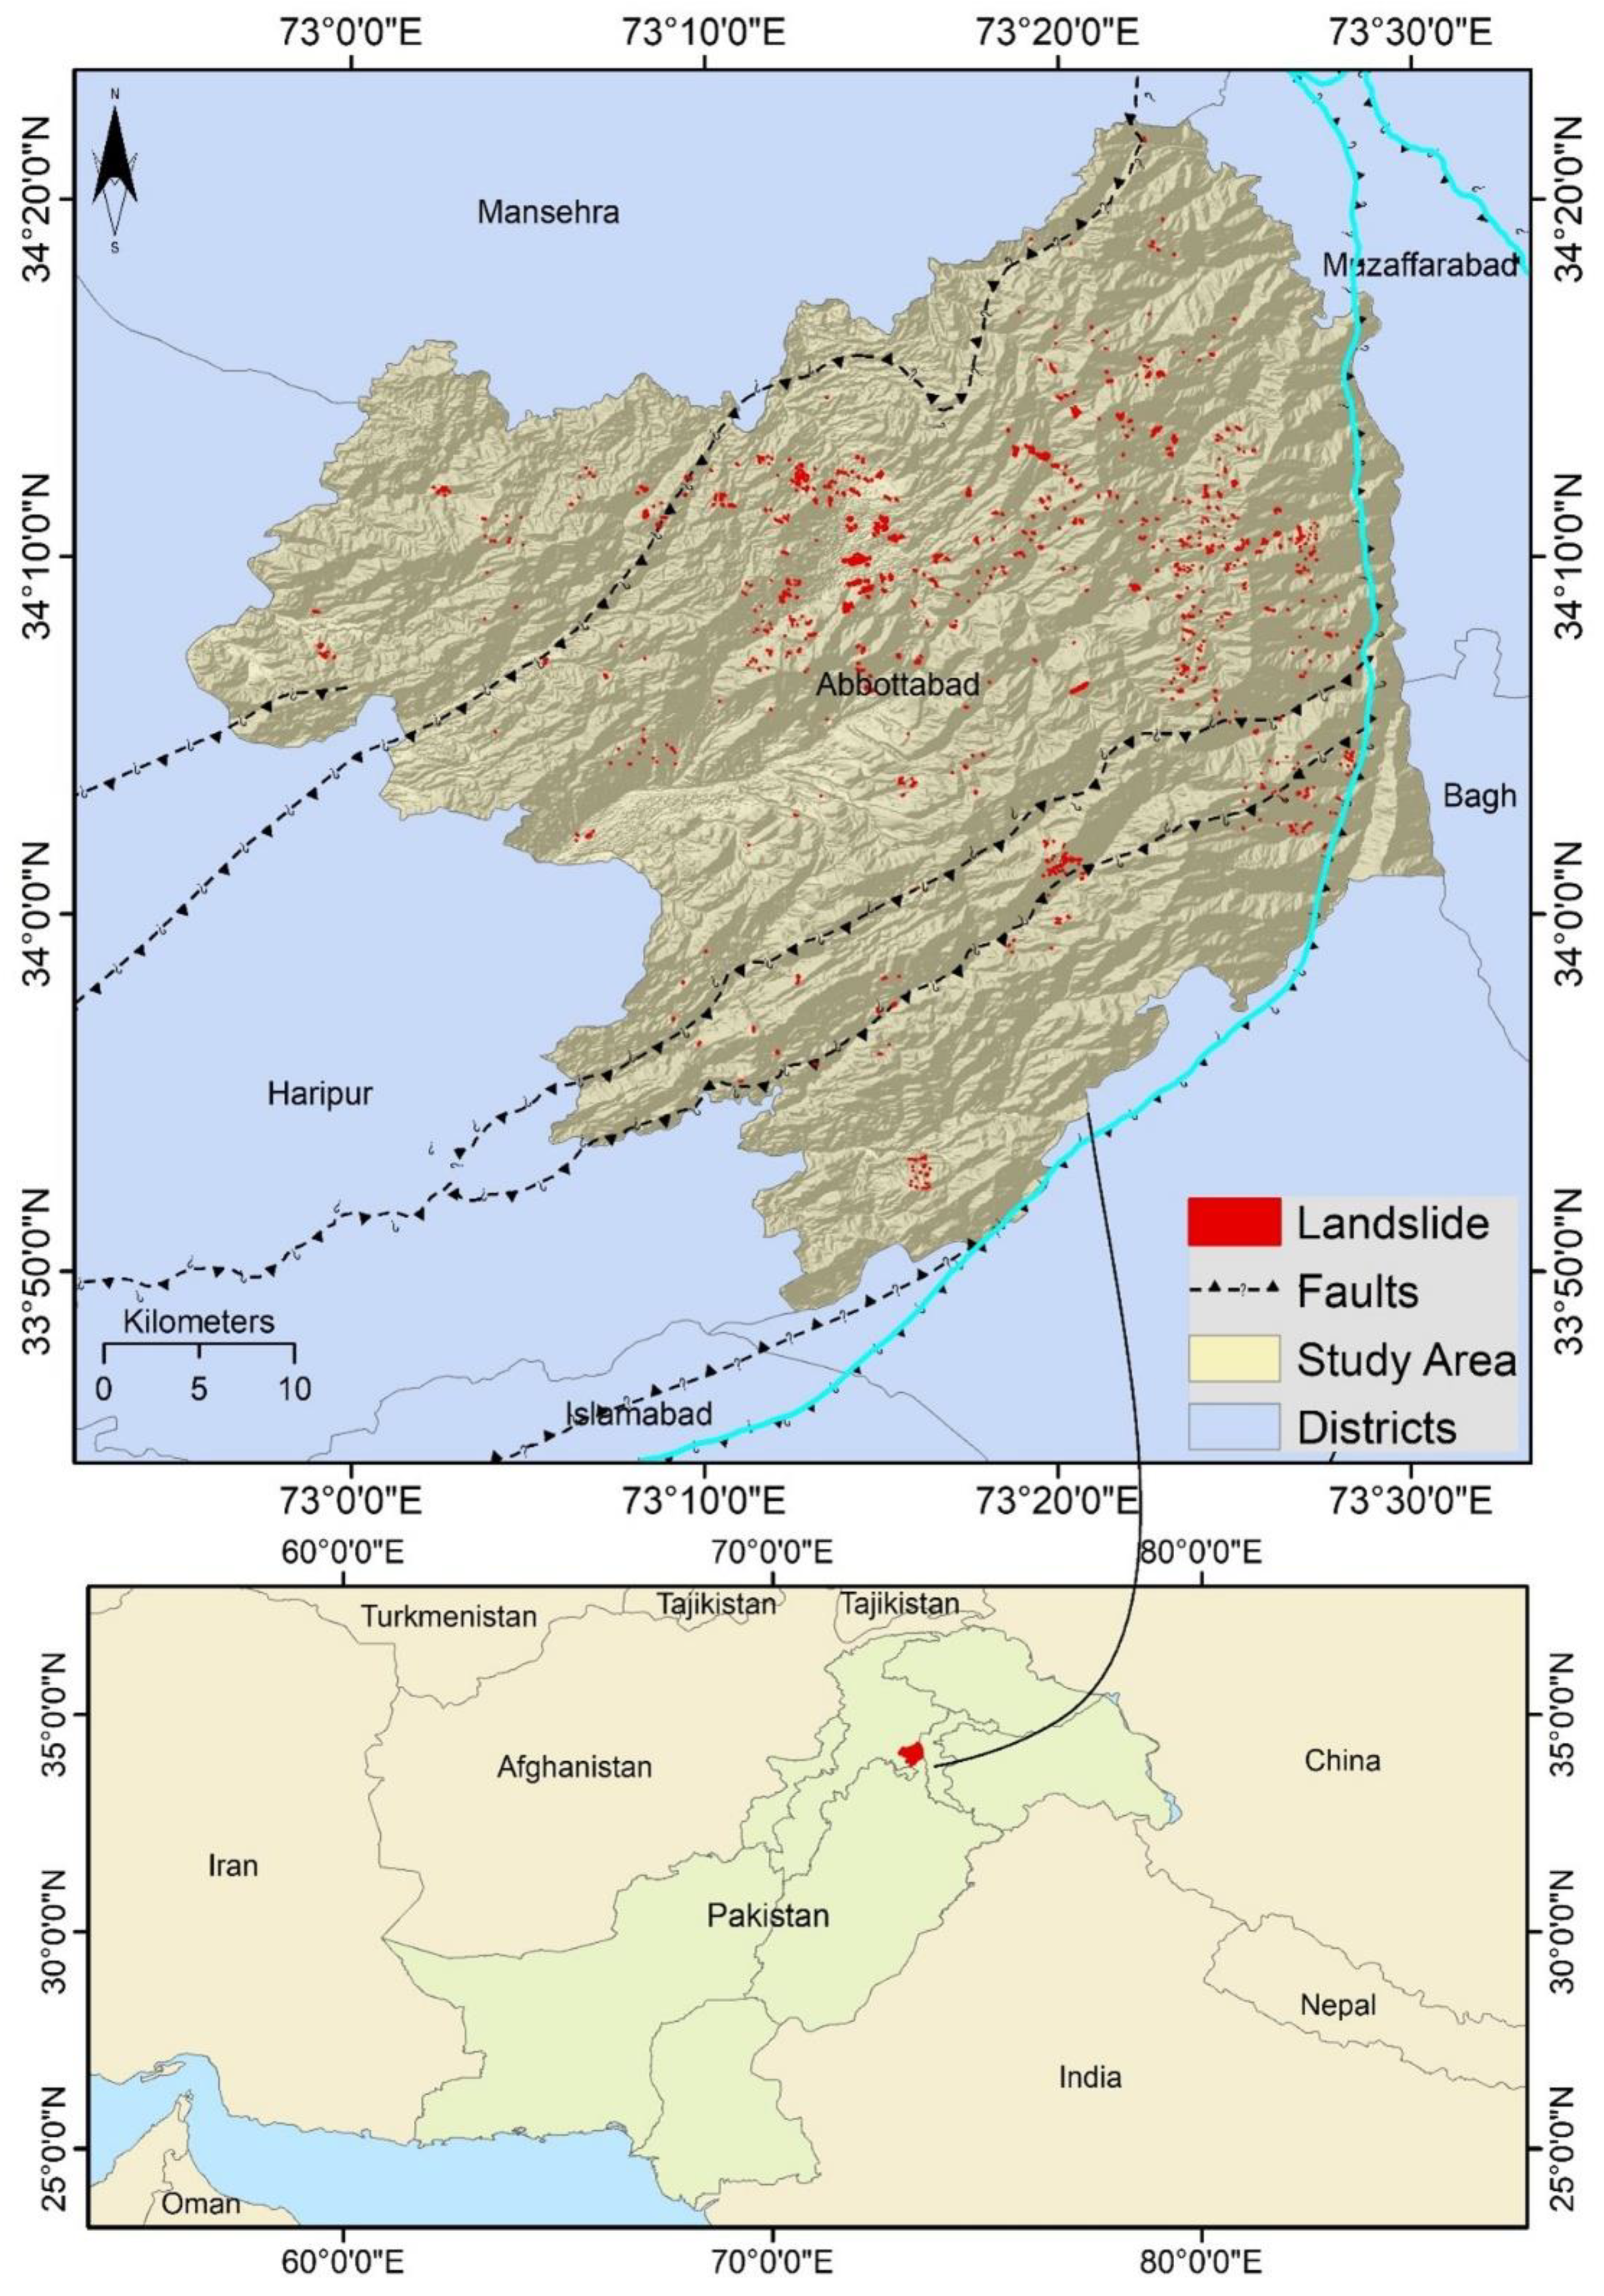
2.1. Study Area

The study area is the province of Abbottabad located in the Khyber Pakhtunkhwa province of Pakistan. It lies in the geographical coordinates 34.1688° N, 73.2215° E as shown in Figure 1, and covers an area of 1969 km2 with a population of 1,332,912 [56]. The Abbottabad district is situated to the south-west of Muzaffarabad district where the epicenter of the devastating Kashmir 2005 earthquake is located. The maximum elevation in the region is 2957 m above sea level. This region consists of fragile geology of igneous, metamorphic, and sedimentary rocks. According to Gansser et al., 1964 [57] classification of tectonostratigraphic zones, the study area is a part of the lesser Himalayan fold and thrust belt, enclosed to the south by main boundary thrust (MBT) and to the north by main mantle thrust (MMT) [58]. Panjal thrust, Nathia Gali thrust fault, Gandghar fault, Kuzagali fault, and MBT run across the Abbottabad district. Panjal thrust fault trends in a northeast-southwest direction with a dip facing south-east in most northern regions and a north-west dip facing the south-western. The Nathia Gali thrust fault is oriented roughly towards the southwest with a northwest dip direction.
The MBT is north-south-oriented with a dip direction towards the southwest. This area is mainly governed by the northwest-southeast-oriented compressional stresses, which makes the area tectonically active with high seismicity. The rivers of Dor and Salhad Nala, which flow through the eastern part of the Abbottabad district from north to south, represent the district’s most important drainage system. During the summer monsoon, these affluents cause temporary fluctuations in the river discharge system. The annual mean precipitation is 1262 mm. Precipitation increases during the monsoon season from July to September, resulting in frequent floods, making the study area susceptible to landslides. In summary, the study area is extremely exposed to slope failures due to intense rainfall caused by monsoon cycles, the ruggedness of the terrain, earthquakes occurring intermittently, and anthropogenic activities. Due to these conditions, the Abbottabad district is marked by a high level of geohazards. The further occurrence of landslides is a major threat that could cost economic losses and casualties.

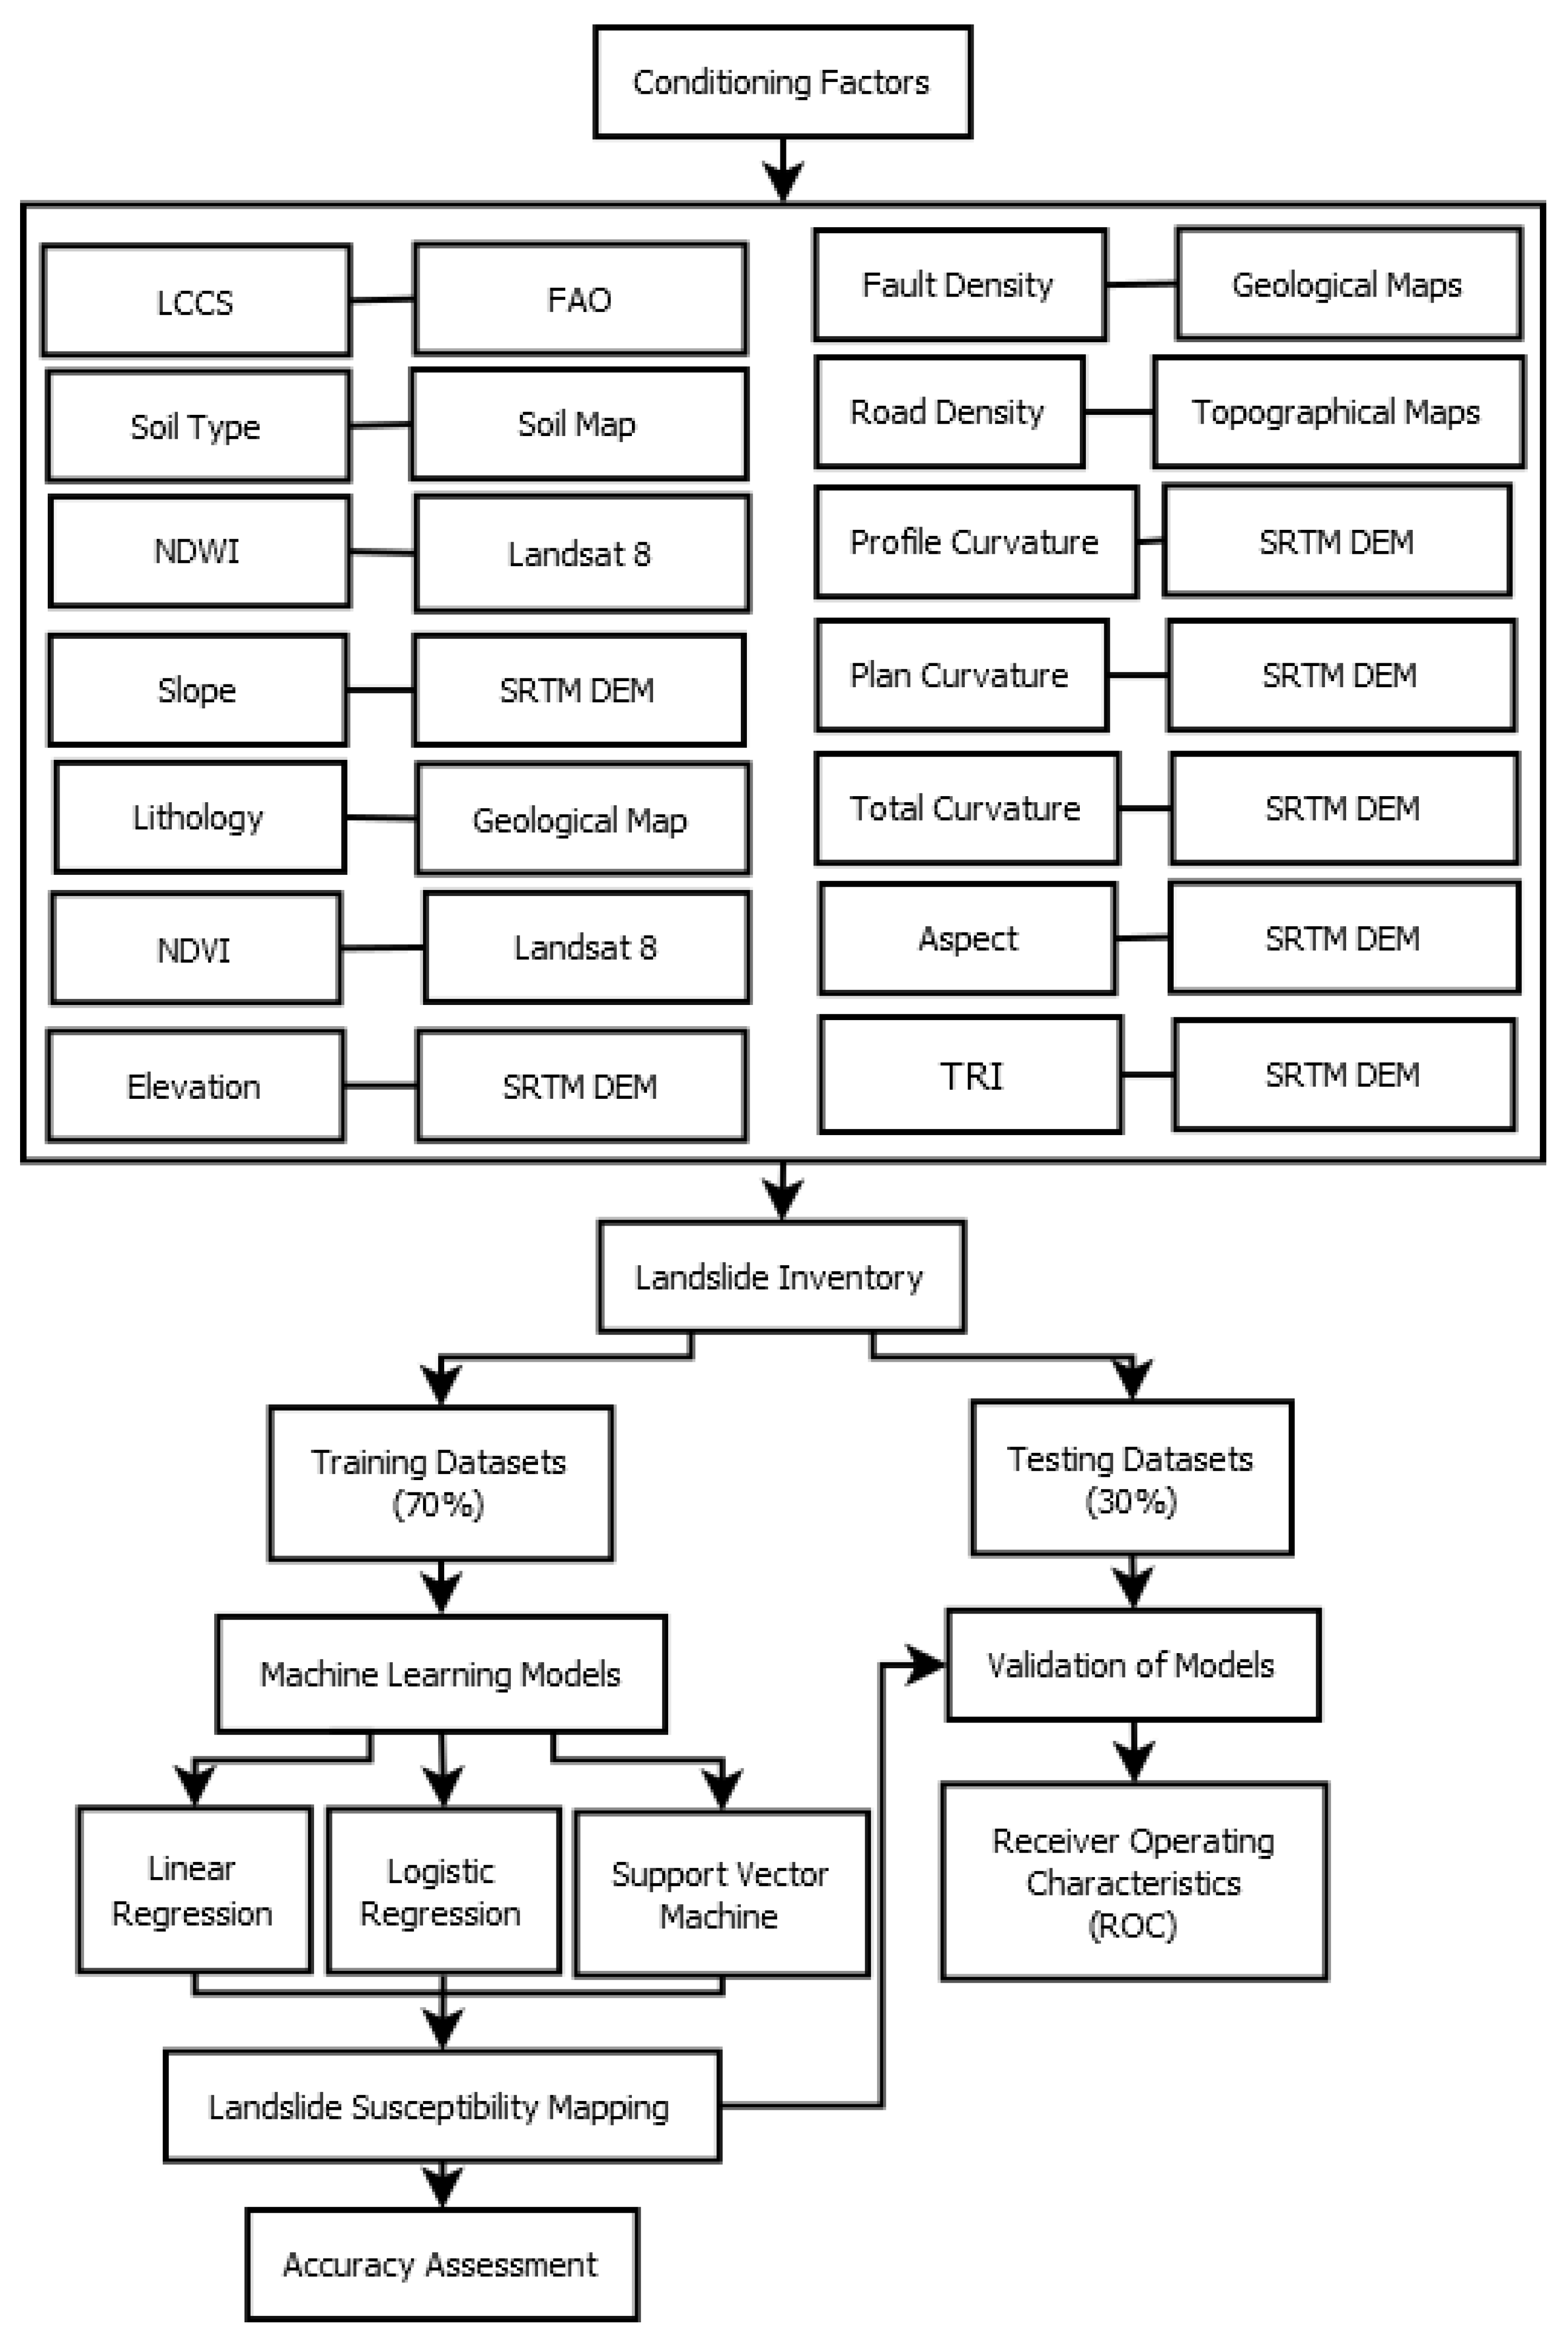
2.2. Methodological Framework

The methodological framework of this study is illustrated in Figure 2. The details about the different steps involved are presented in the following sections.

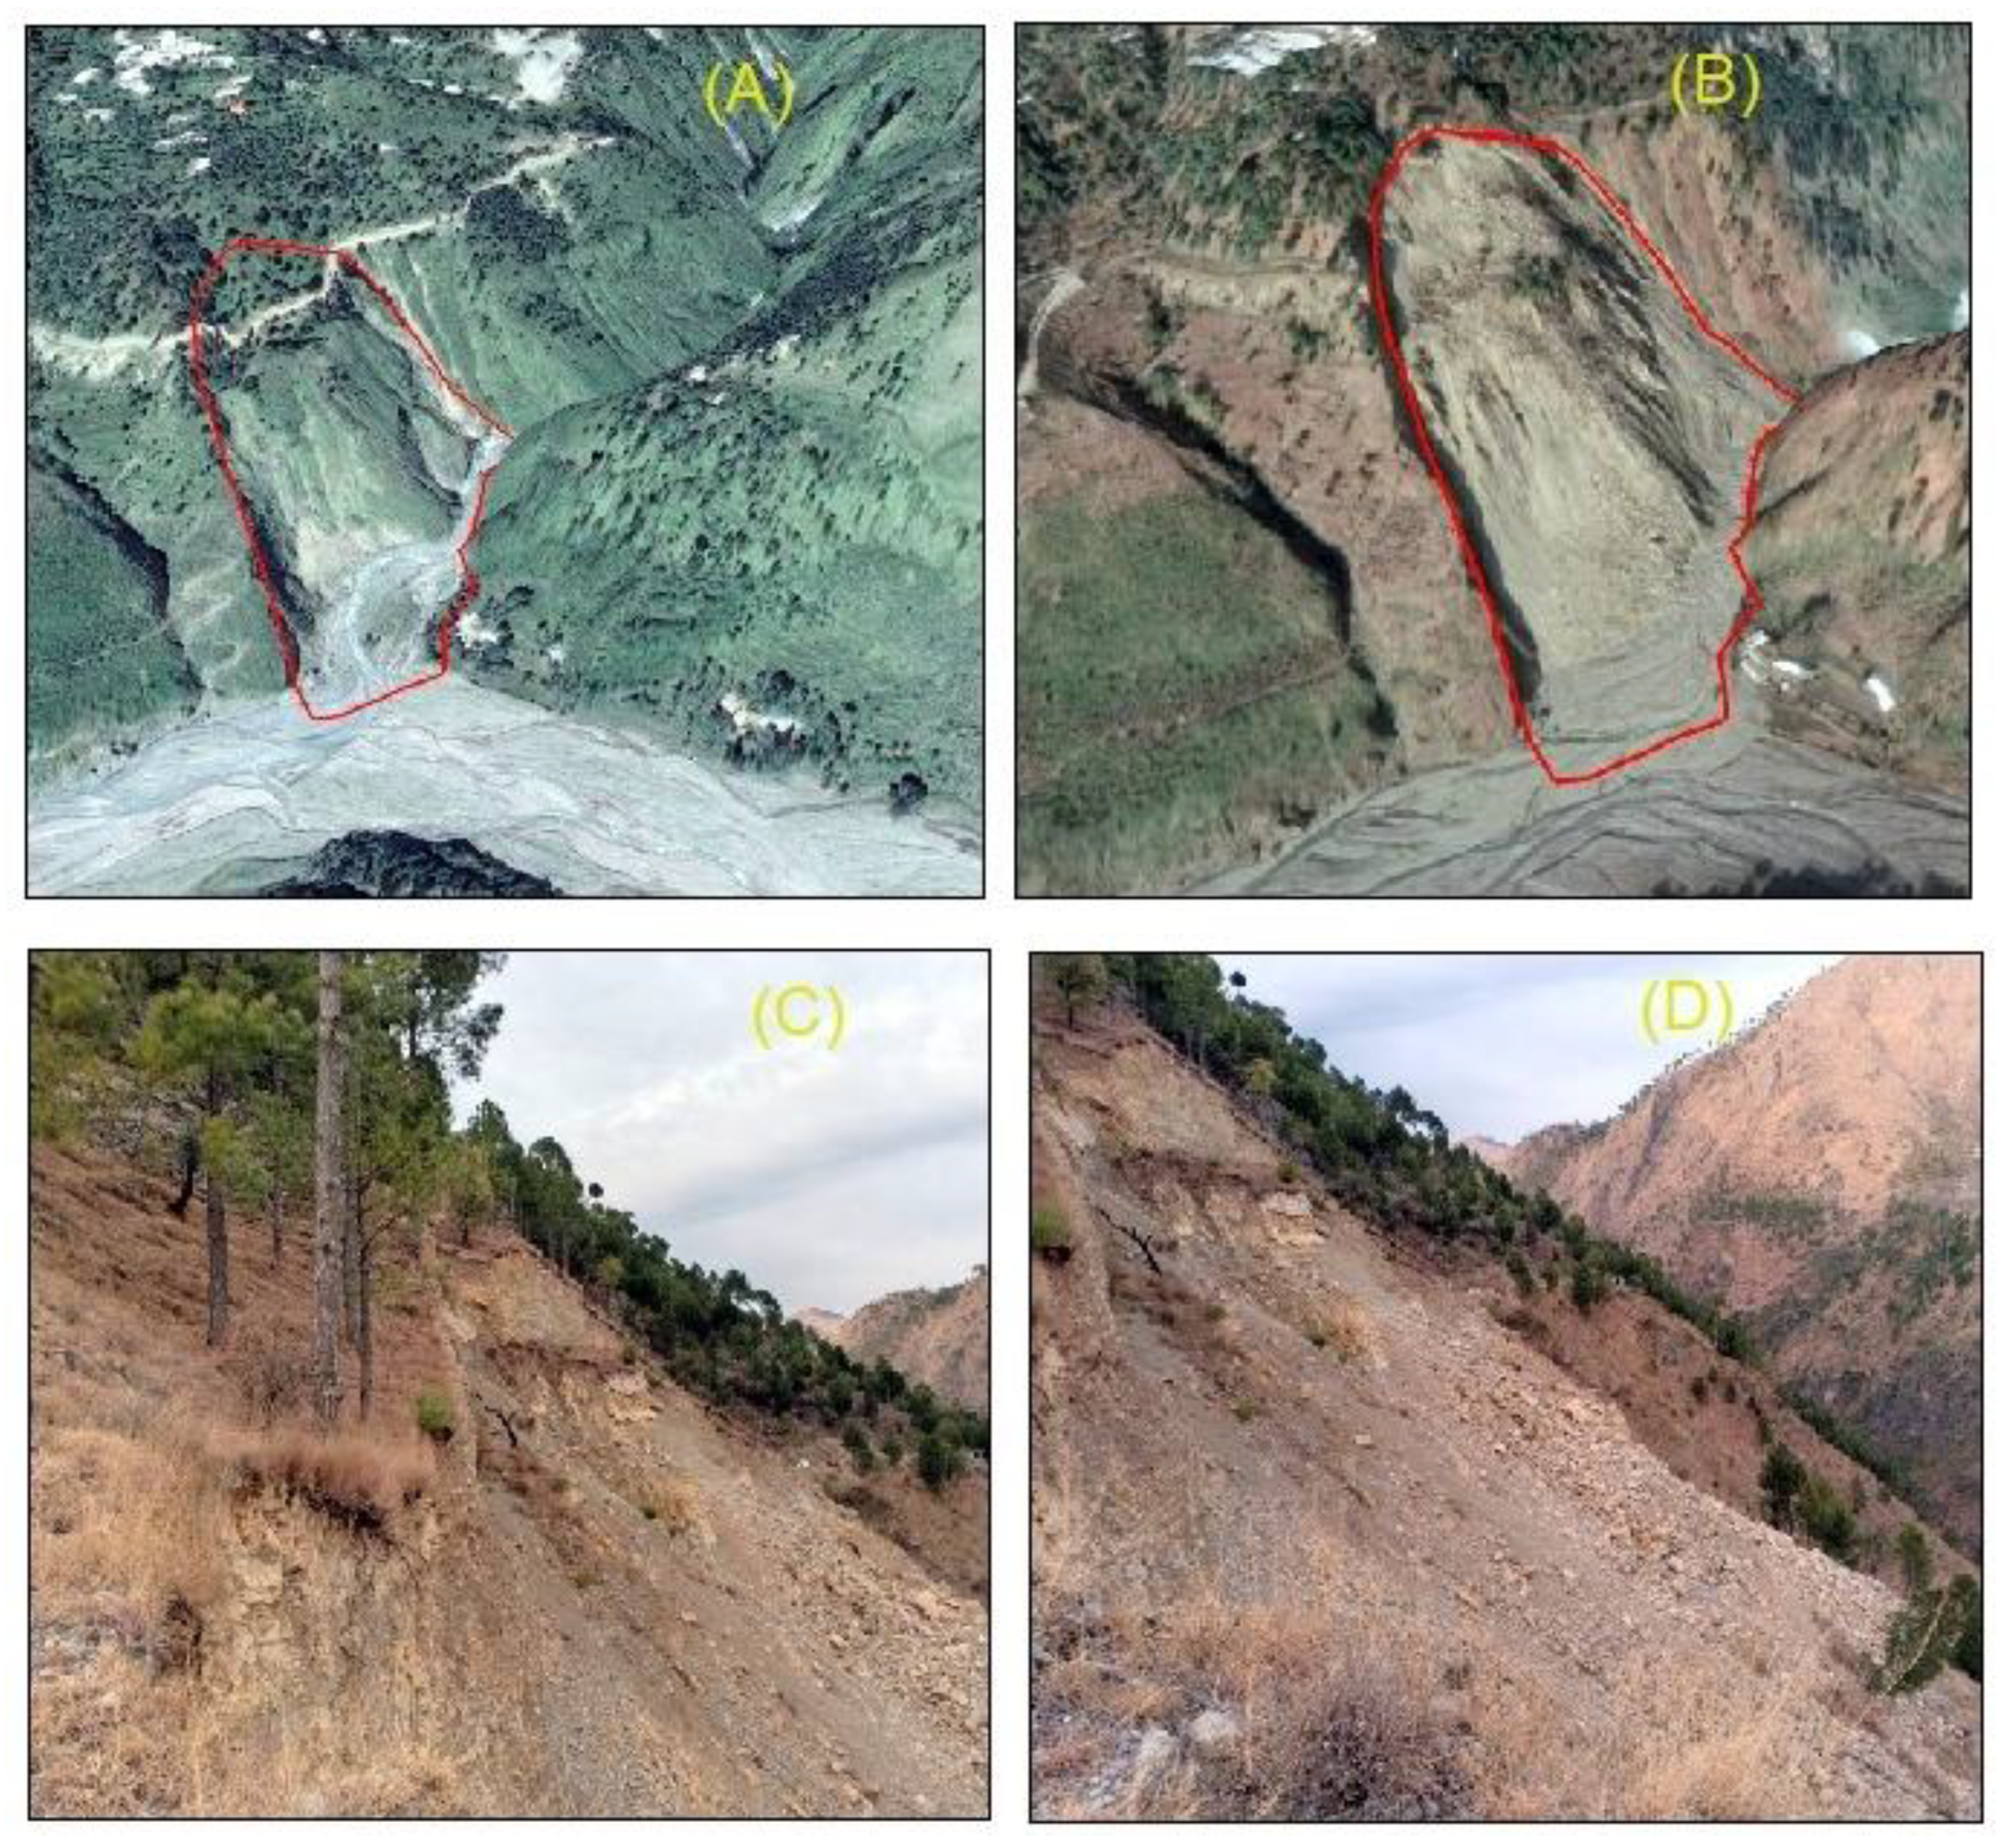
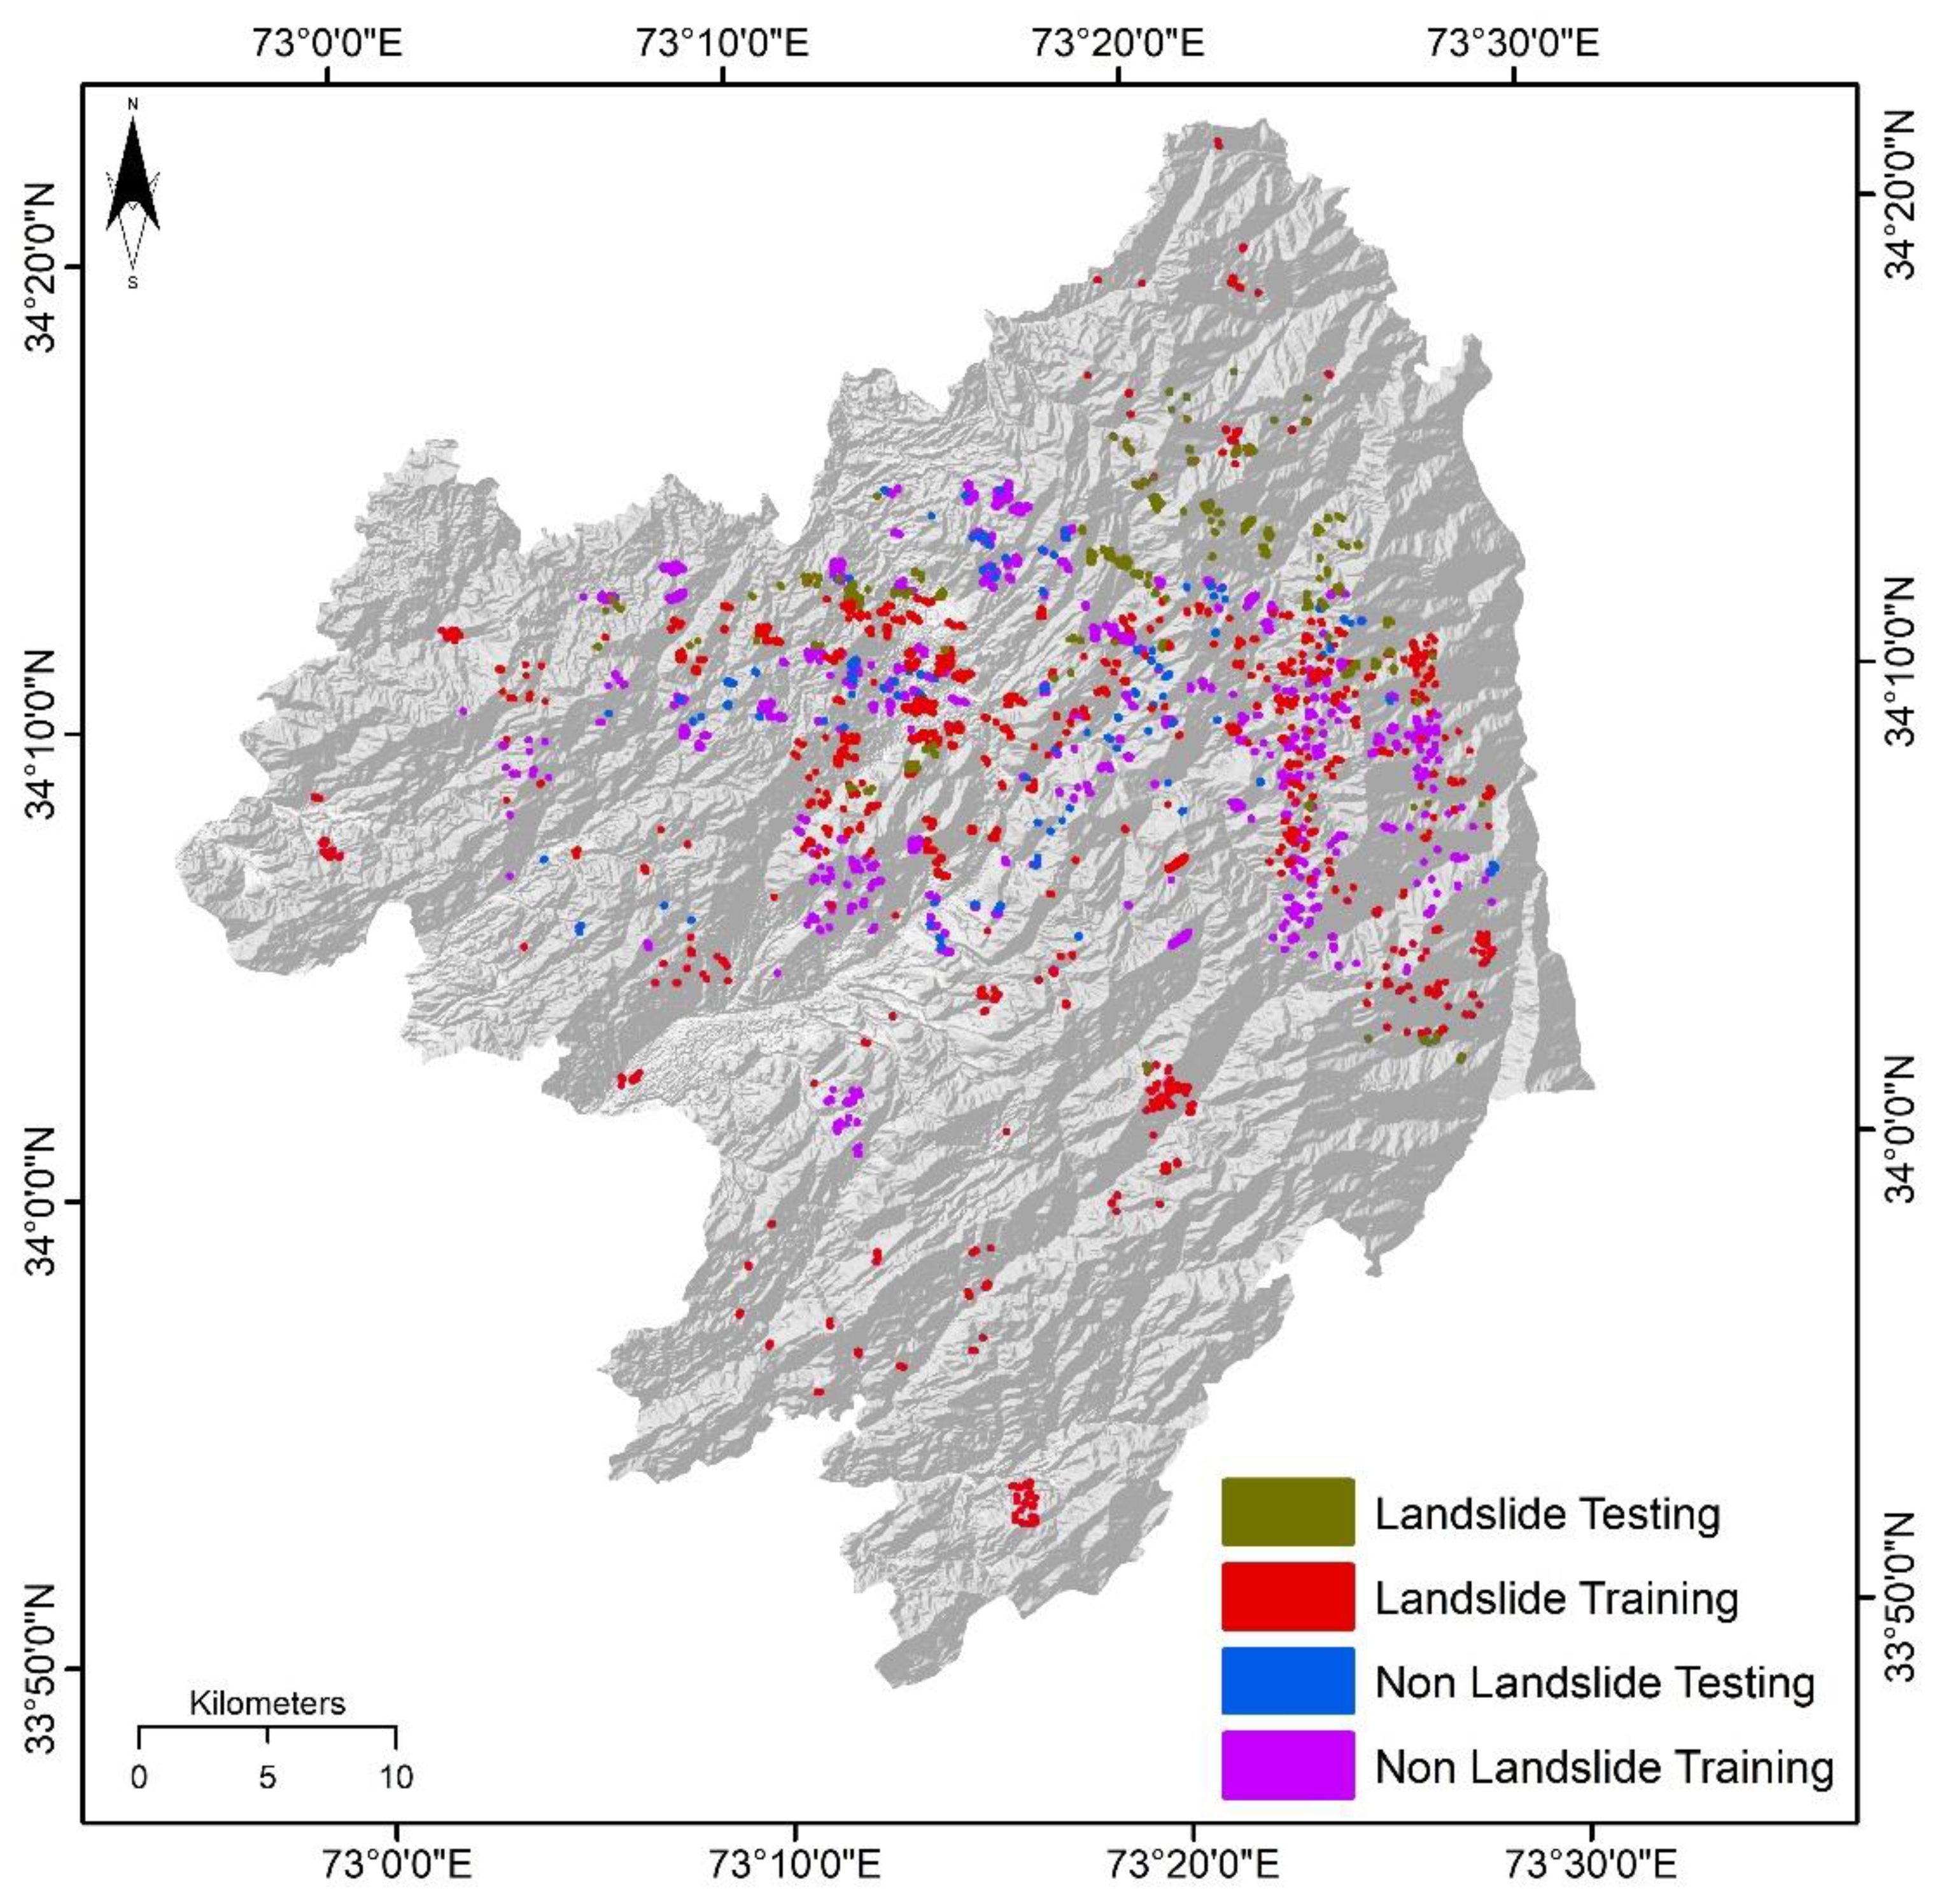
2.3. Landslide Inventory Dataset

A landslide inventory is essential to perform LS mapping, which helps us understand the relationship between the distribution of landslide occurrences and causative factors [39,59]. The past and present landslide events were the keys to forecast future landslides occurrences [20,60]. Data such as historical landslides, satellite images, field surveys, literature, and aerial photographs can be used to prepare the landslide inventory map. For this paper, the landslide location polygon (centroid) was developed using Landsat satellite imageries suitable for middle and large-scale slope failures due to its image resolution. The inventory is prepared by mapping these landslide locations based on Landsat imagery of pre-and post-event after 2005 major seismic and rainfall events. In this study, the earthquake and rainfall-induced landslides were considered for landslide inventory mapping. The inventory contains polygons of mass movements. The spatial distribution of the landslide polygons dataset from the satellite data is also verified from the ground truth of a field survey. The purpose of using the location data was to mark the extent and verify the landslide location and extent. The locations were also validated by visiting Poona Landslide, Havelian shown in Figure 3. This landslide was triggered after the earthquake of 7.5-moment magnitude (Mw) (with an epicenter in Afghanistan) and struck the northern area of Pakistan on 26 October 2015 [61].
The landslide classification is not provided in this research because of the unavailability of information on the landslide type and is challenging to distinguish them on the basis of landslide types for a large inventory. These studies [62,63,64] also used the mass movement inventory data for LS mapping.
A total of 116 landslide polygons were developed in the study area. Due to the low visibility and the small size of the inventory map, the 116 polygons were converted and depicted as points on the study area map in Figure 1. The 116 non-landslide points were also generated and were randomly distributed in ArcGIS using the random point tool, and in total 232 landslide and non-landslide points were used for training and testing data with a ratio of 70% and 30%, respectively, illustrated in Figure 4. The models were trained using the training dataset, and the testing dataset is used for assessing and validating their accuracy.

2.4. Landslide Conditioning Factors Dataset

Many natural and anthropogenic factors contribute to landslide activity, and these factors are important to be considered in examining landslide susceptibility in a local context. There are no standard rules or guidelines to select the landslide causative factors, and the selection greatly depends on data availability and also the local conditions of an area [59,65]. The causative factors are broadly grouped into geological, hydrological, topographical, geomorphological, and meteorological factors. In this study, a total of 14 causative factors, namely slope degree, slope aspect, curvature, plan curvature, profile curvature, landcover classification system (LCCS), normalized difference water index (NDWI), normalized difference vegetation index (NDVI), soil, lithology, fault density, topographic roughness index (TRI), and road density are considered for the landslide susceptibility analysis.
The slope aspect map shows the orientations of the slopes. TRI is a morphological factor that is commonly used in landslide analysis. It is computed from DEM by using a methodology developed by [66]. The curvature of an area shows convex, concave, and flat surfaces. Profile curvature presents the acceleration and deacceleration characteristics of the water flow down the slope and influences erosion and deposition. Whereas the curvature perpendicular to the slope direction is plan curvature. It affects the convergence and divergence of flow. The construction of roads disturbs the stability of the slope due to tremors caused by vehicles. Cutting the slope for road construction and additional load caused instability promoting landslides [59].
The shuttle radar topography mission (SRTM) digital elevation model (DEM) having a spatial resolution of 30 m was used to derive the factors of slope angle, slope aspect, curvature, elevation, profile curvature, TRI, and plan curvature. The tiles of SRTM DEM (30 m resolution) for the study area were mosaicked together in ArcGIS to produce a sink-free DEM. Landsat-8 images with a 30 m spatial resolution were derived from USGS Earth Explorer and were used to obtain the factors such as NDWI and NDVI. The NDWI is a causative factor and higher NDWI values denote the presence of higher moisture content. The NDWI is acquired from Landsat-8 satellite data. It is calculated from:
NDWI   = ( Green     NIR ) ( Green   +   NIR )  
The NDVI visualized vegetation density and is acquired from Landsat-8, which is calculated from:
NDVI   = ( NIR     RED ) ( NIR   +   RED )  
Fault density and lithology are extracted from geological maps of Pakistan obtained from the Survey of Pakistan. The roads were digitized from Google maps. The line density tool in Arc Map was used to calculate the density of roads and faults. The LCCS map of the study area is extracted from the landcover map of the Himalayas region (FAO-GLCN program). The soil map of the study area is acquired from the FAO data.
The thematic maps of these factors were prepared in an ArcGIS environment. The conditioning factors having distinct resolutions were resampled at a 30 m resolution to match the resolution with the factors acquired from SRTM DEM and Landsat-8. The data were standardized and normalized before being processed further in which redundancy in the dataset is minimized by structuring the data. The raster layer of each conditioning factor was standardized into five classes and these classes were assigned a weight from 1 (very low) to 5 (very high) depending on their importance in triggering landslides. All the maps prepared in this study have WGS 1984 datum and UTM zone 43 projection system.

2.5. Susceptibility Modeling Techniques

R-Studio is used to implement LoR, LiR, and SVM models. Following the training of the models, the final landslide susceptibility maps were generated by adopting the weighted overlay (WOM) technique in ArcMap 10.8. The WOM tool is used to create maps utilizing overlays of several raster layers, with each raster layer given a weight based on its importance [57]. The ML models were trained using a 10-fold cross-validation process.

2.5.1. Linear Regression

A multiple linear regression model, which includes two or more independent variables, is used to predict the variance of the landslide susceptibility. The linear regression model depicts the changes in landslide susceptibility with the change in the standard deviation of predictor variables. The equation of the multiple regression model is:
Y   =   β 0 +   β 1 X 1 +   β 2 X 2 + . +   β n X n + ε  
The right side of the equation contains a sum of linear parameters except for epsilon (error term). Y is the dependent variable depending on the presence or absence of landslides; β0 is an intercept and has a fixed value in the regression equation; β1 to βn are coefficients (weight); X1 to Xn represent the independent variables, and ε represents the model error term.

2.5.2. Logistic Regression

Logistic regression also allows for evaluating the relationship between the dependent variable and a set of independent parameters. Unlike the linear regression, the dependent variable in the LoR is dichotomous, which in this paper is the probability of the presence and absence of landslides. In contrast, the independent variable can be numerical, categorical, or both [67,68]. There is a non-linear relationship between the independent and dependent variables [69]. The relationship between the occurrence and its dependency on several variables can be illustrated quantitatively as:
P = 1 ( 1 + e z )  
where P represents the probability of landslide occurrence. On an S-shaped curve, the probability ranges from 0 to 1. Z represents the linear combination. It follows that the LoR involves fitting an equation into the following form of the data:
Z   = b 0 + b 1 x 1 + b 2 x 2 + + b n x n  
The presence (1) or absence (0) is illustrated by the dependent variable Z; b0 is the intercept of a mode; b1bn are the coefficients of the LoR model, and x1xn represent the independent variables.

2.5.3. Support Vector Machine

A support vector machine is a supervised ML method. It is based on statistical learning and optimization theories [70], which provide a non-linear perspective to regression and classification problems by mapping the input variables into a high-dimensional attribute space [70]. SVM is suitable for extreme cases. It draws a decision boundary known as a hyperplane between extreme data points, also known as support vectors, to separate the landslide and non-landslide classes. There are different kernel functions for various decision functions to find support vector classifiers in higher dimensions systematically. The classes are linearly separable in the Linear Support Vector Machine (LSVM) and have a linear decision boundary. SVM can increase prediction accuracy and lower the model complexity and error test by avoiding overfitting [71,72,73]. SVM used different kernel functions to map the data into higher dimensional space. The most popular kernel functions are linear, polynomial, radial, and sigmoid kernel functions. However, one of the most generally utilized kernels for landslide modeling is the radial kernel function which is also used in the present study. The equations for all the kernel functions are shown below:
Radial   kernel   function =   k ( x i   y i ) = e γ ( x i x j ) 2    

2.6. Model Evaluation and Accuracy Assessment

The receiver operating characteristic (ROC) curve is used to evaluate the overall performance of the models. The ROC curve graphs are constructed using the sensitivity versus the specificity in a two-dimensional space [74,75,76]. The ROC curve technique is appealing because it is unaffected by changes in the distribution of classes. The ROC curve remains unchanged when the proportions of landslide and non-landslide points in the validation dataset are changed. The area under the ROC curve (AUC) is a summary measure of the ROC analysis result that assesses the landslide models’ prediction capabilities using the validation data. The AUC equal to 1 suggests a flawless model, whereas AUC equal to 0 indicates a non-informative model. The landslide model performs best when the AUC value is close to 1 [77,78,79]. The landslide inventory was overlaid on the final maps to see how many landslides were falling in high landslide susceptibility areas, for the accuracy assessment of the final LS maps.

3. Results

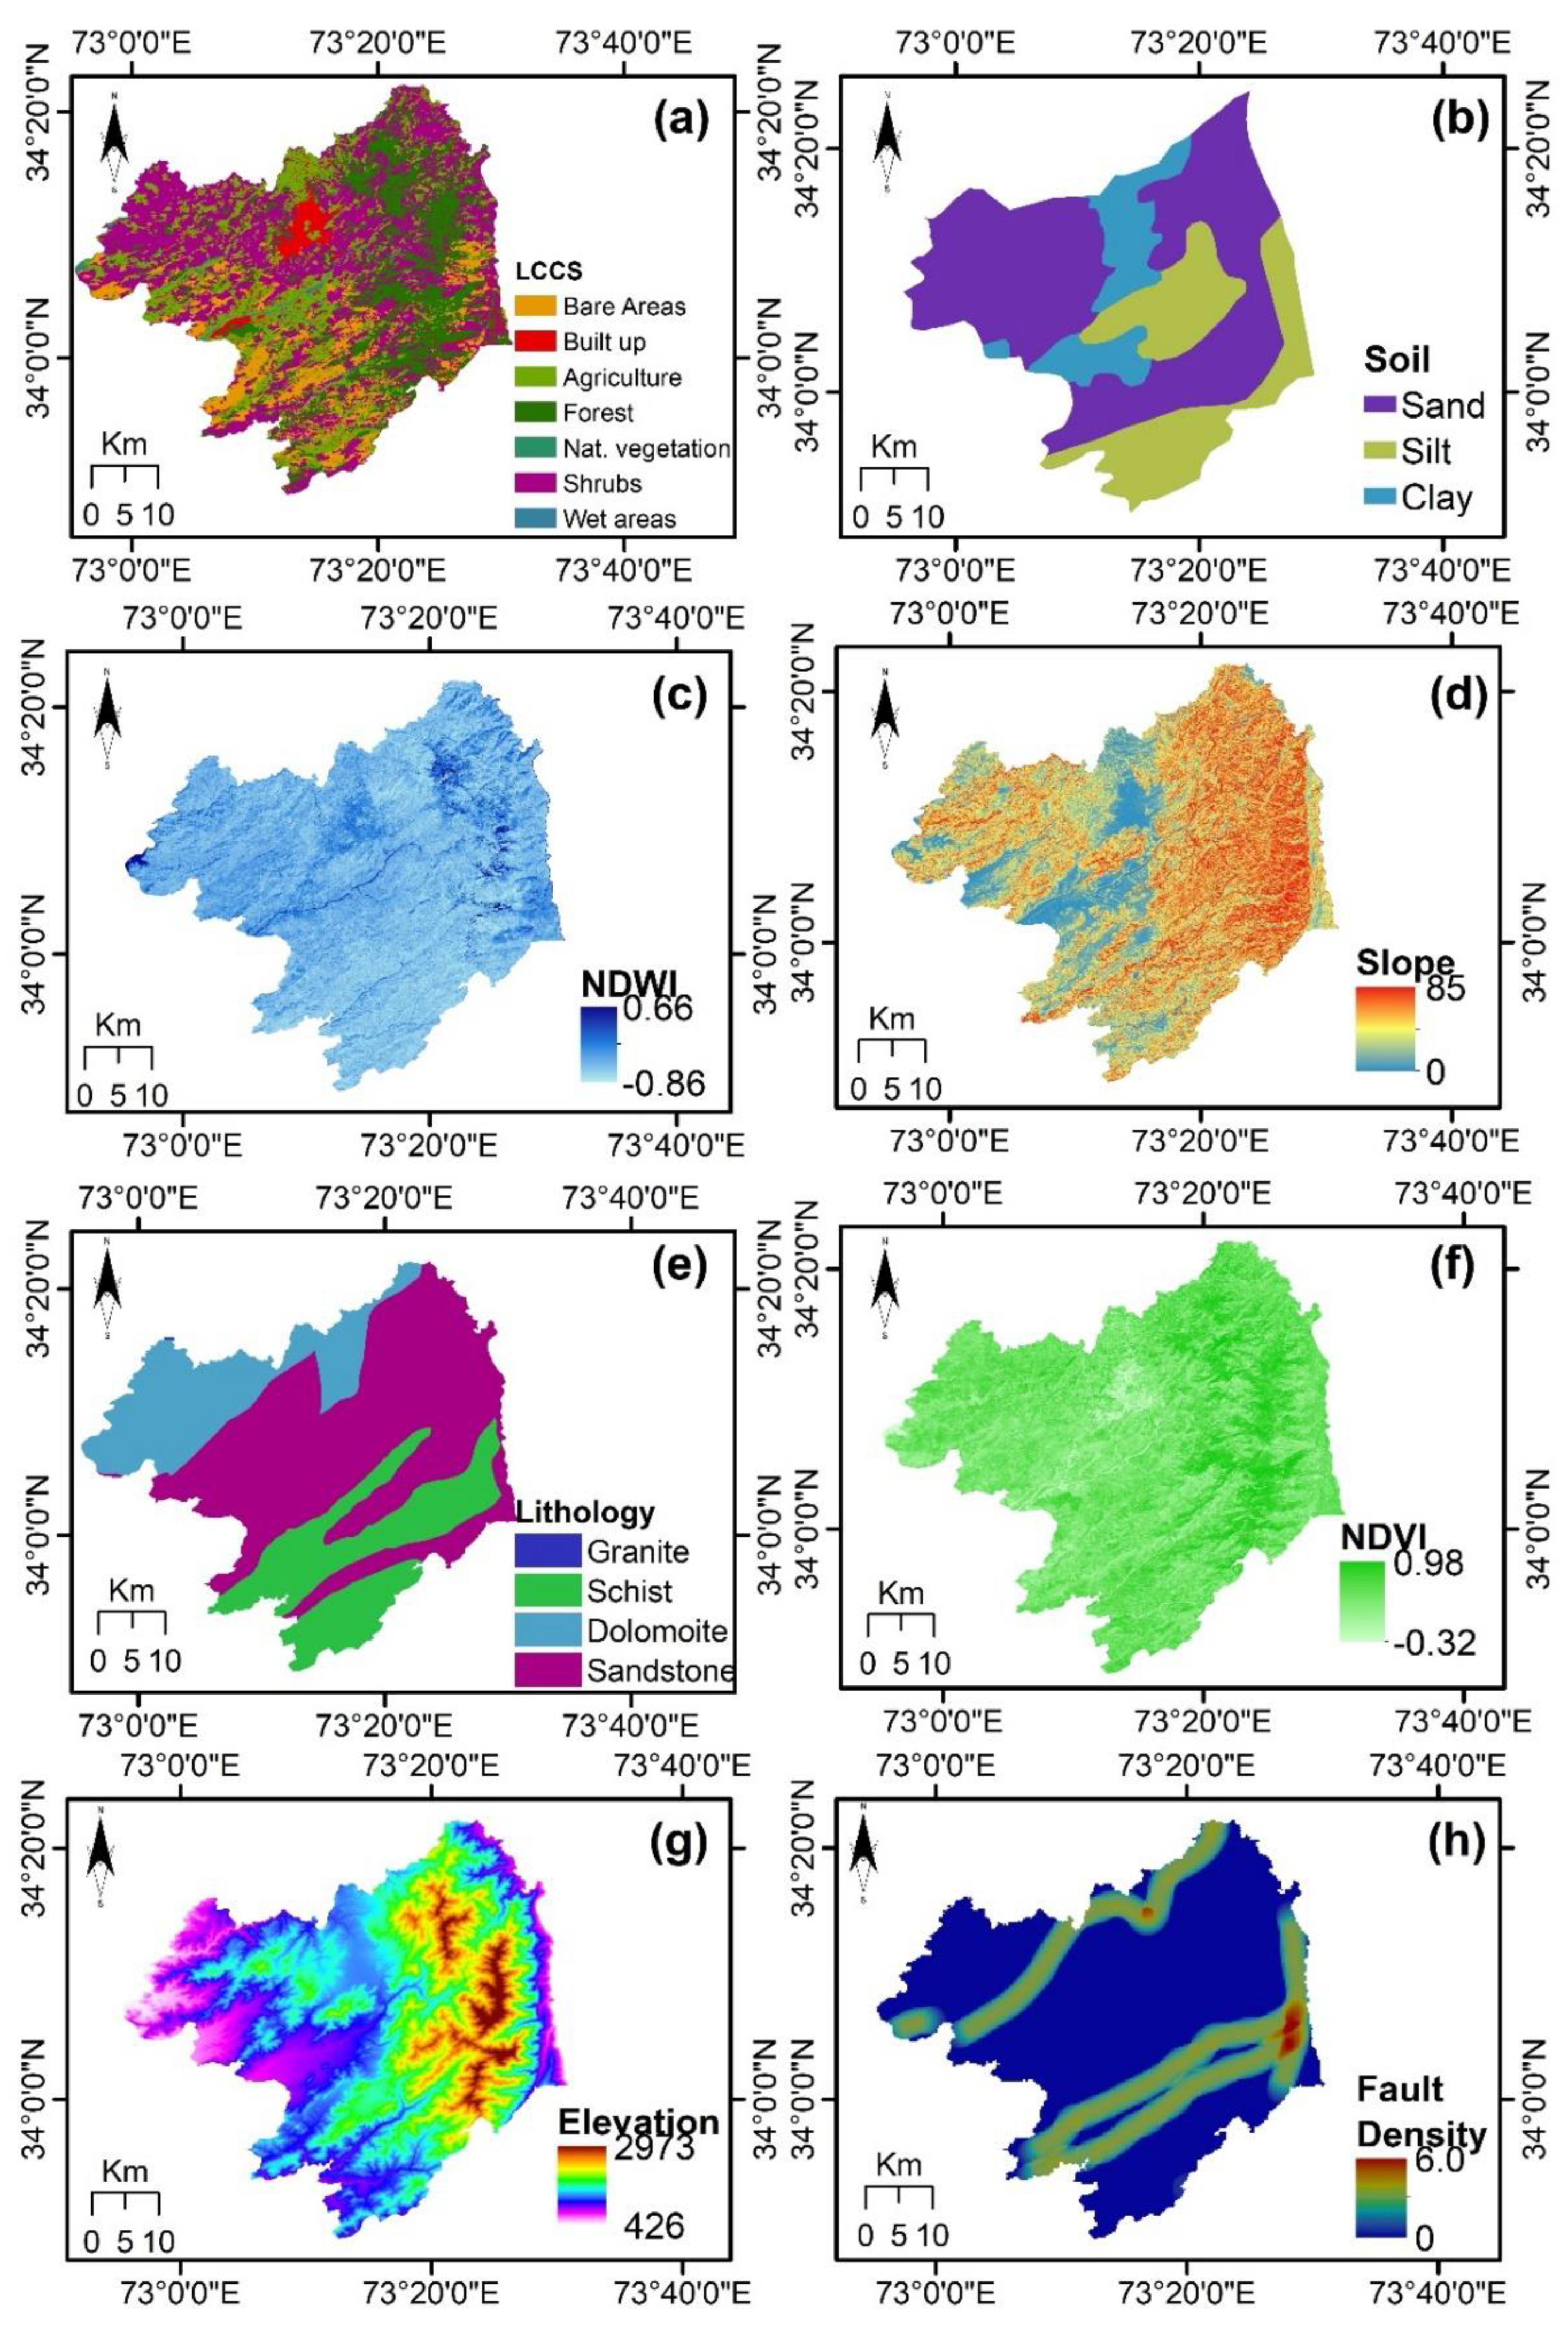
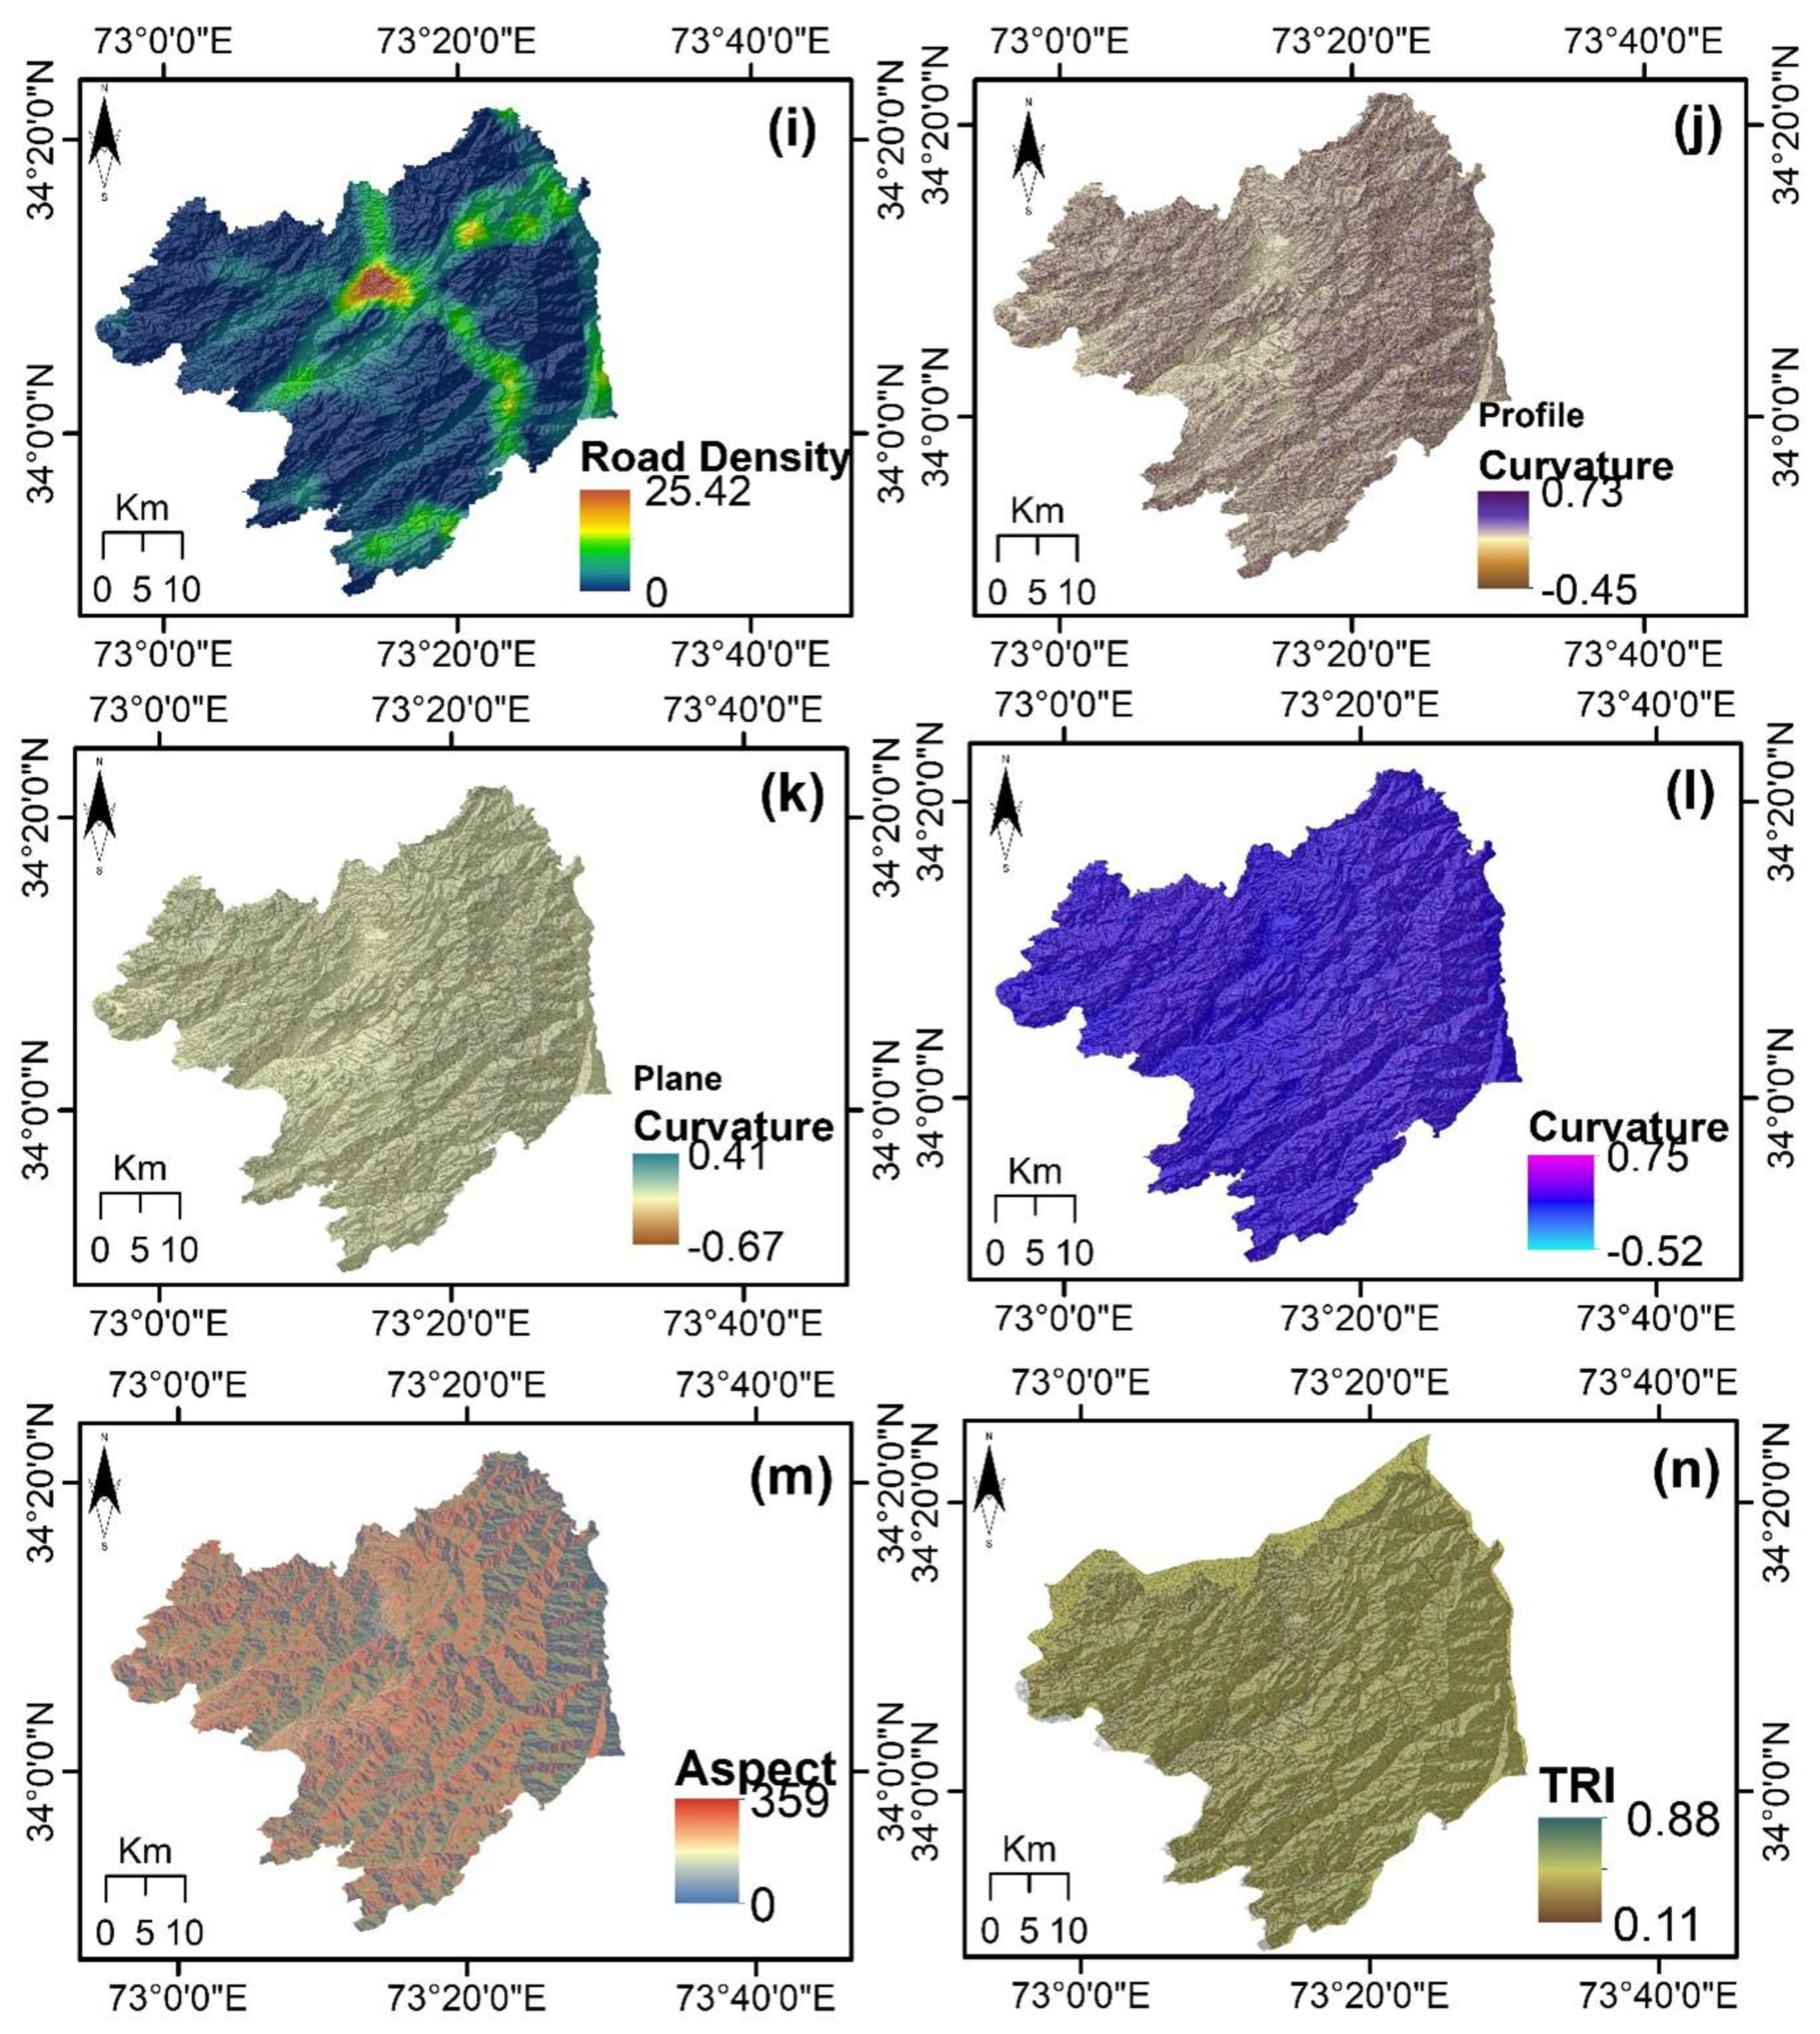
3.1. Thematic Maps of Conditioning Factors

The LCCS of the study area is categorized into agriculture, bare areas, natural herbaceous, trees, shrubs, urban areas, and water bodies, as can be seen from Figure 5a. Agriculture constitutes a large portion of the study area, followed by natural trees in the eastern region. The soil type map of the study area depicted in Figure 5b shows that the soil in the study area consists of sand, silt, and clay. The most dominant soil type is sand, followed by silt in the south-eastern region.
The presence of water bodies is marked by an NDWI greater than 0.5 as shown in Figure 5c. The areas having less water content are marked by a positive value between 0 and 0.2. The NDWI map is categorized into high and low classes. The central region of the study area shows a lower NDWI value and is less prone to landslides due to the built-up area and low moisture content. The slope angles value is ranging from 0 to 89 degrees. The north-eastern and eastern parts of the study area tend to have steep slopes, while the slope angle in the central part tended to be lower as can be observed from Figure 5d. The lithology of the study area comprised various units, classified into three classes: dolomite, schist, and sandstone, as illustrated in Figure 5e.
The NDVI map is classified into high and low values as depicted in Figure 5f. The highest values represent denser vegetation, and bare soil has a value close to zero. Vegetated areas have a positive NDVI value between 0.1 and 0.7. The NDVI values were lower in the western region and higher in the eastern region because of the dense vegetation in the eastern region. The elevation of the study area is also classified into high and low values, where the eastern region of the study area has a higher elevation as can be observed from Figure 5g. Fault density is also classified into high and low. There are five active faults that run across the Abbottabad district. The eastern and south-eastern areas are marked by the presence of numerous faults and are prone to landslides as depicted in Figure 5h. The nearness of roads increases the susceptibility of slopes to landslides. The road density of the study area is shown in Figure 5i.
The curvature is categorized into higher and lower values as illustrated in Figure 5l. Convex surfaces are marked by a positive curvature value. In contrast, a negative curvature value indicates a concave surface, and intermediate values a flat-lying surface. Profile curvature of the study area is shown in Figure 5j. Negative values represent the upwardly convex surfaces, while upwardly concave surfaces tend to have positive values. The plan curvature of the study area is represented in Figure 5k. The positive values show laterally convex surfaces, while the laterally concave surfaces are represented by negative values.
The slope aspect map of the study area is presented in Figure 5m. The hill slope oriented towards the south-west is more susceptible to landslide occurrence, followed by north-west oriented hill slopes as these slopes are affected by the highest amounts of seasonal monsoon precipitation. Figure 5n depicts the TRI of the research area. The high TRI of the study area signifies a rough terrain, whereas a lower value is a depiction of relatively less rough terrain.

3.2. Conditioning Factor Analysis

The weights of the used 14 conditioning factors obtained from different ML techniques are shown in Table 1. It can be perceived from Table 1 that a similar controlling element showed variation for distinct models. The weights were derived by processing the landslide inventory along with the thematic layers of the conditioning factors in the ML techniques. The weights of variables were computed by using the caret library in R-Studio by calculating the relative importance of each variable. The relative importance of each conditioning factor is the weight of a particular factor in all the three models. According to the results of the LiR model, the factors of slope, lithology, soil, and curvature with the weight of 9%, respectively, are the most crucial parameters for landslide events.
For the LoR model, the Lithology, slope, NDWI, and Land-use are vital parameters with 9% weight, respectively. In SVM, the NDWI and lithology have the highest importance with a weight of 10%, respectively. The LCCS and aspect are the second most important parameters with the resulting weight of 9%, respectively. In general, the study region’s most influencing factors to landslides are lithology, NDWI, slope, and LCCS. At the same time, the profile curvature played the slightest role in triggering landslides in the study region.

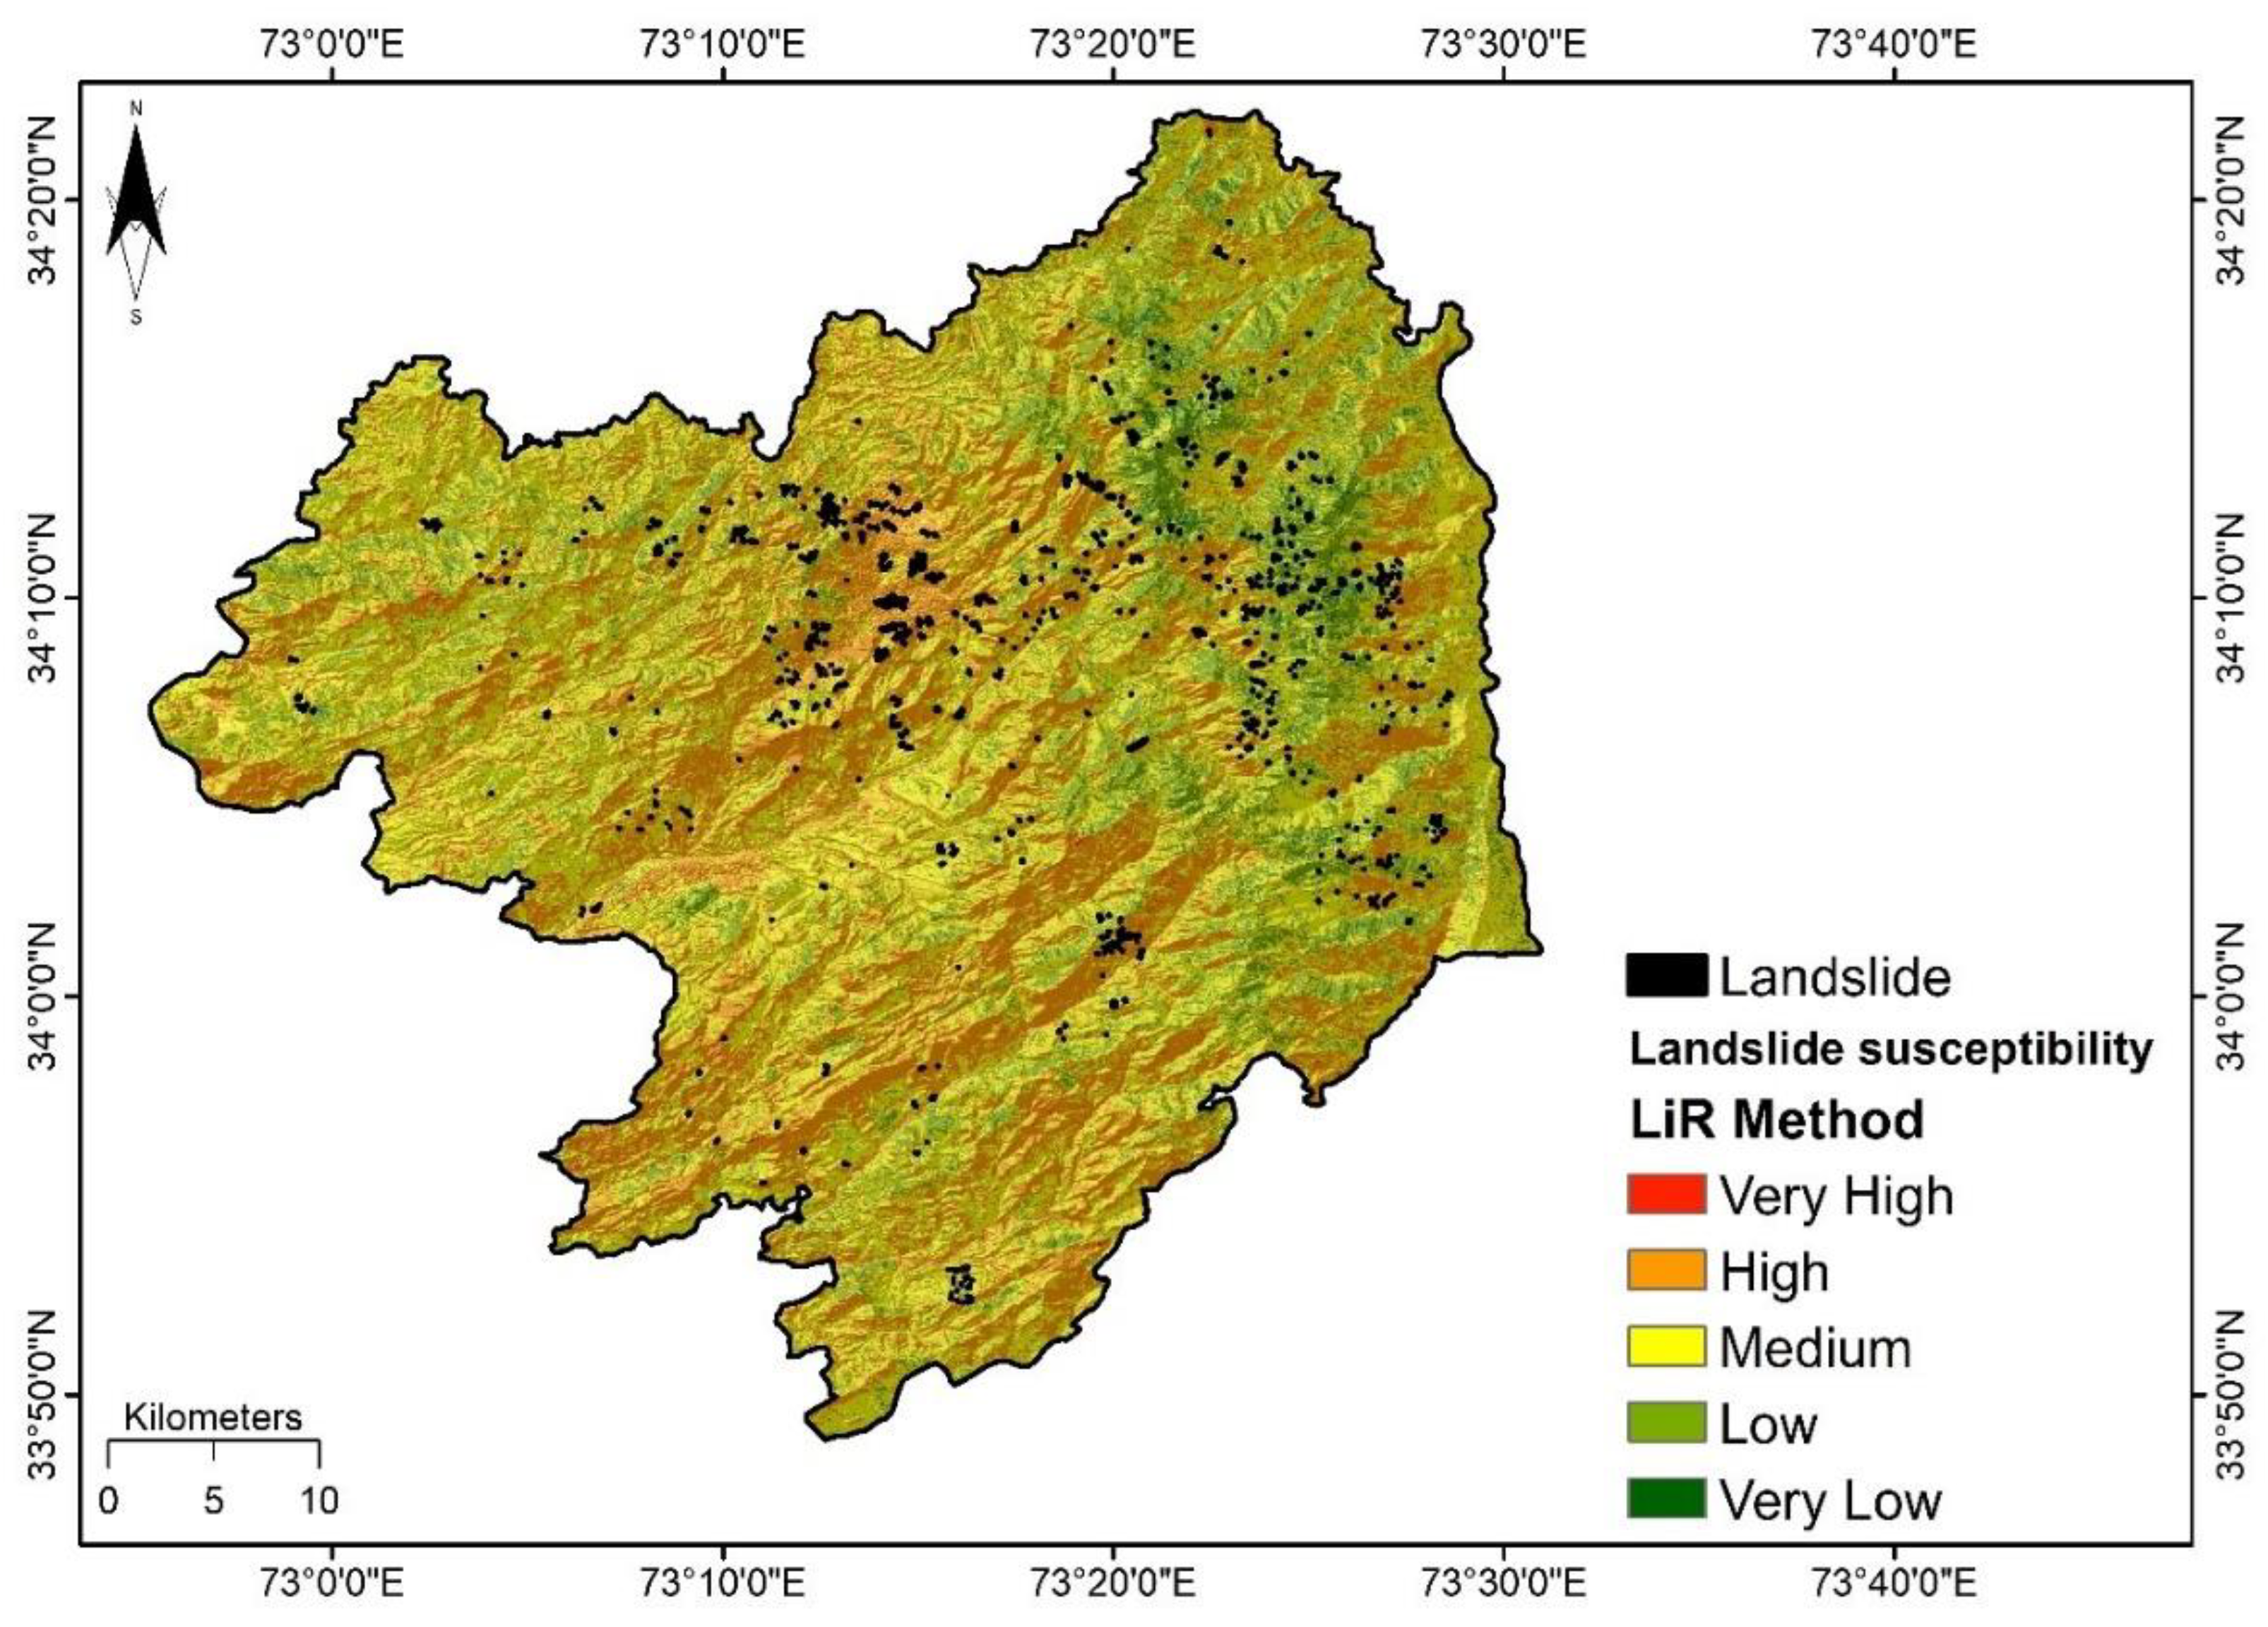
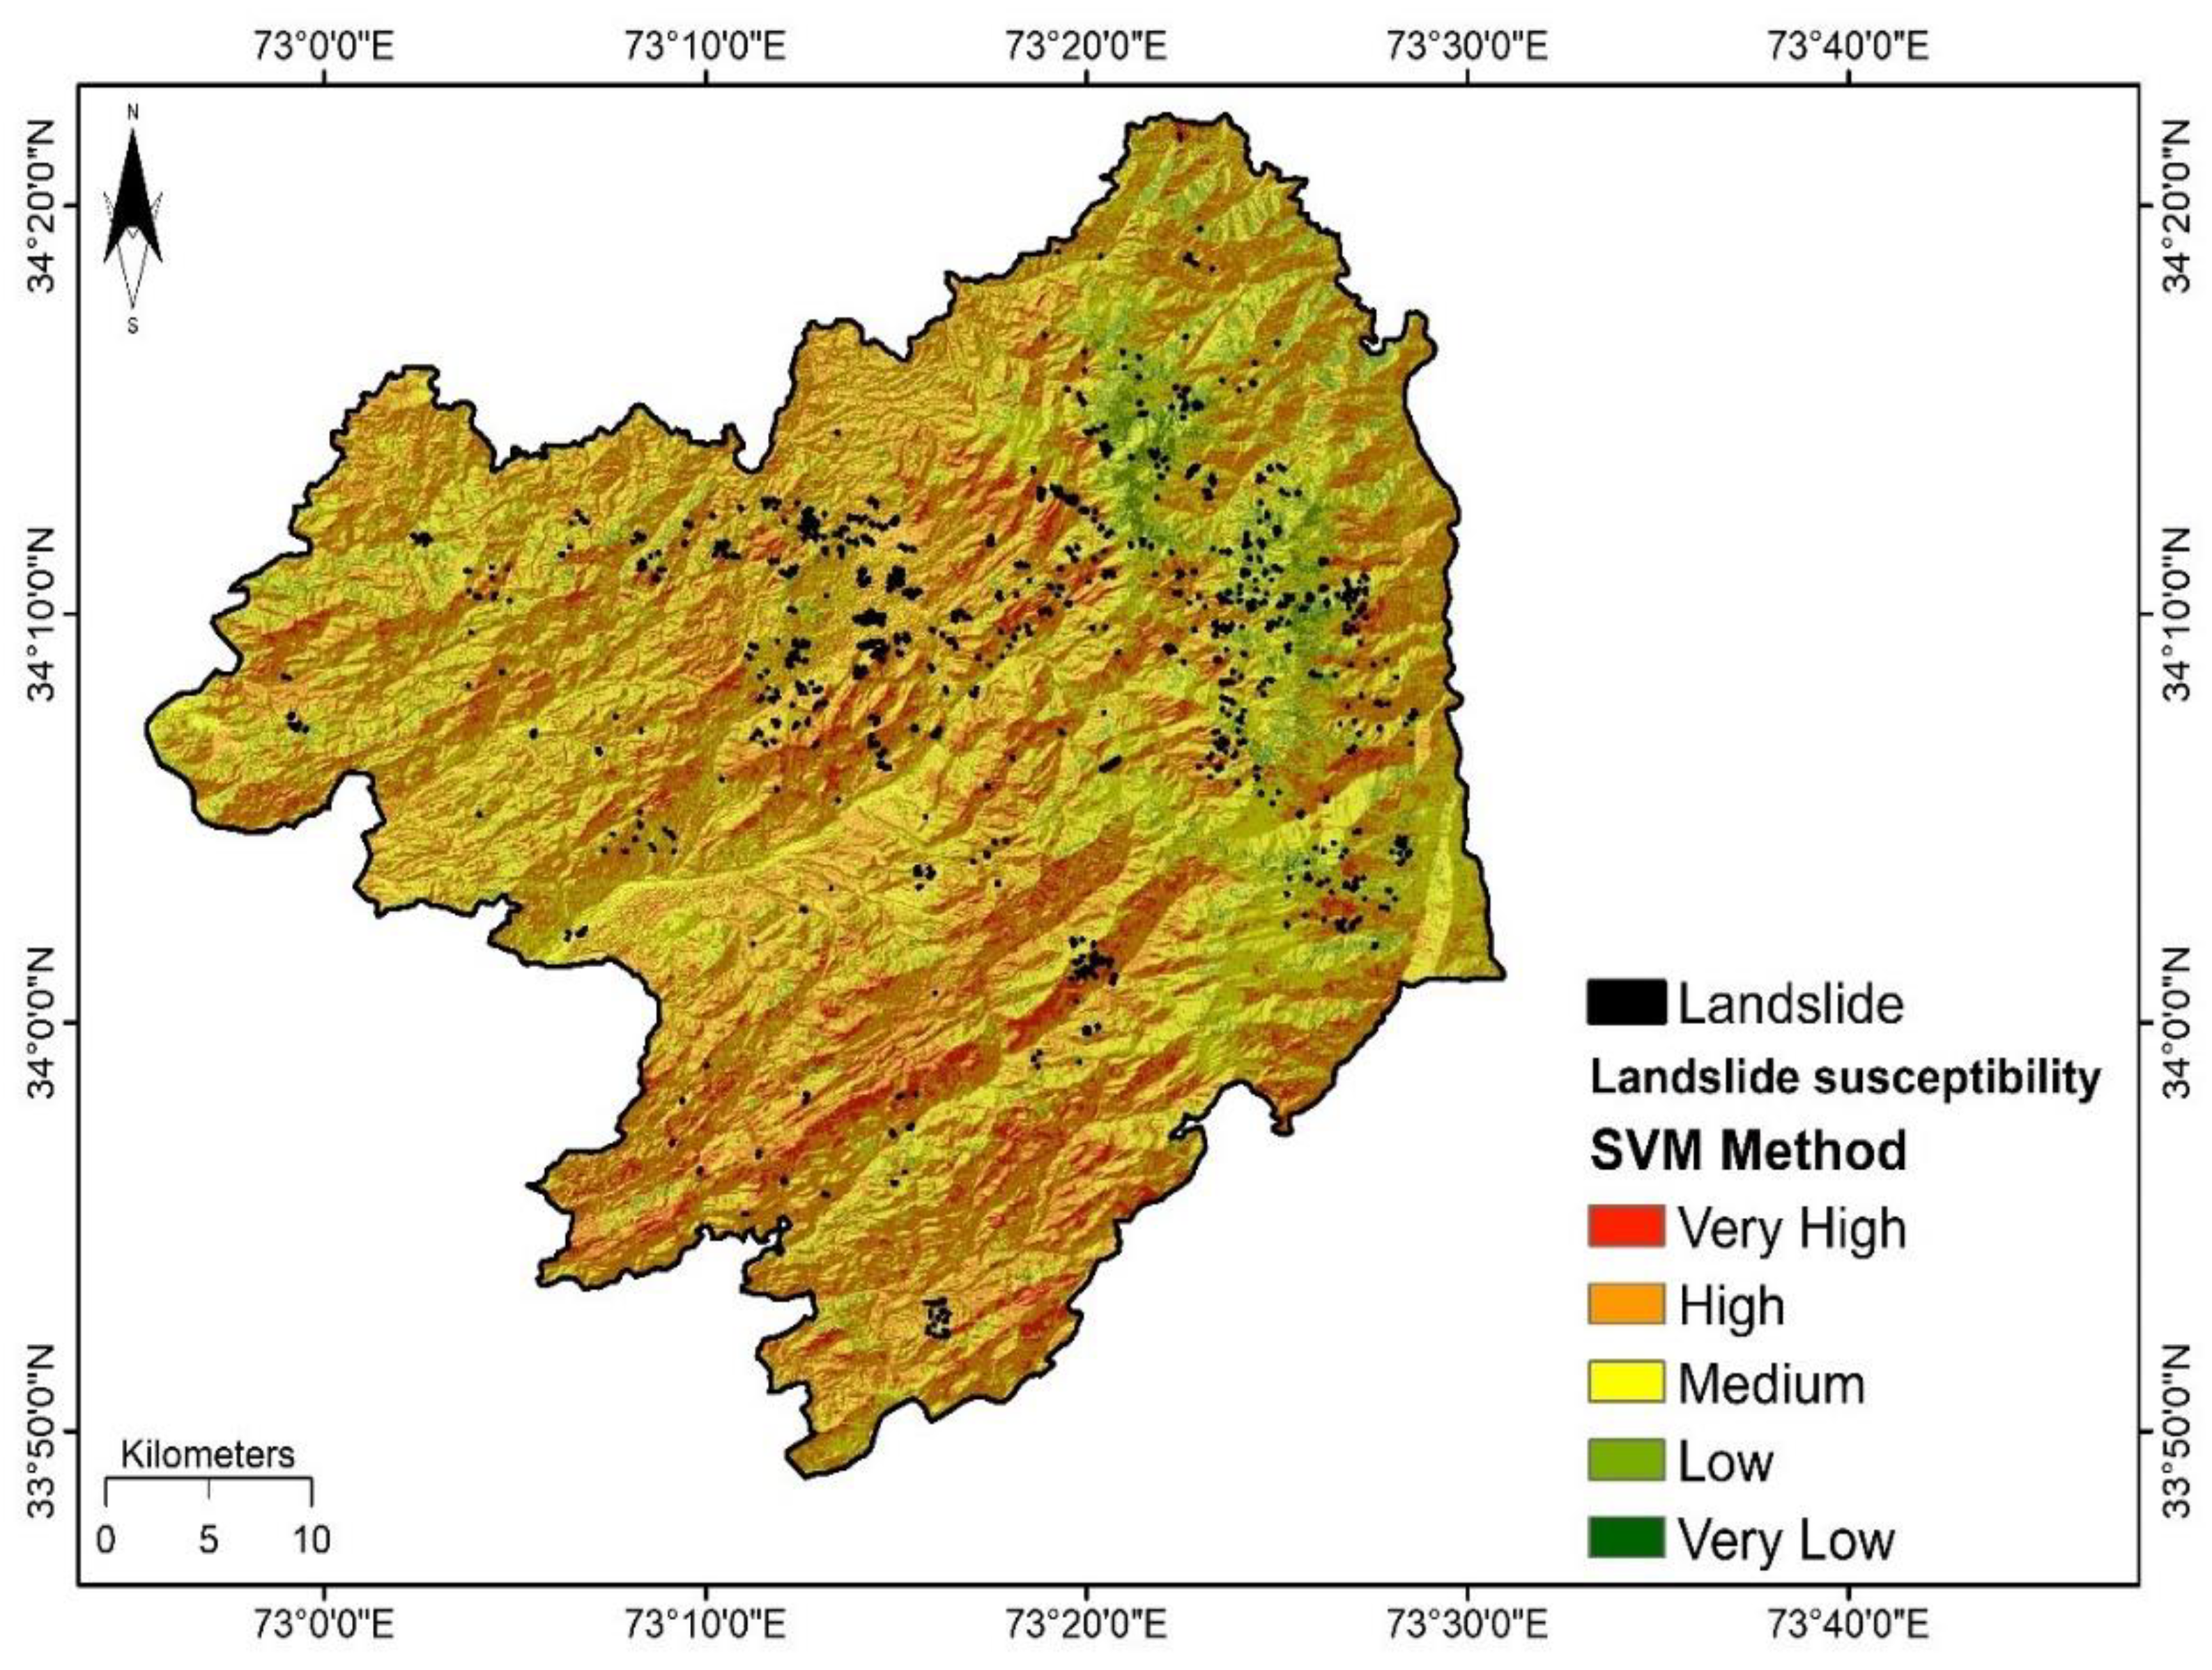
3.3. Landslide Susceptibility (LS) Maps

The produced LS maps were created by multiplying the derived weights with the factors through the weighted overlay in the GIS environment. The classification was performed using the Equal Intervals classification technique to split the final susceptibility map into five susceptibility classes: very low, low, medium, high, and very high.

3.3.1. Linear Regression (LiR)

The LS map derived from the LiR model is illustrated in Figure 6. Medium landslide susceptibility is observed for the western area, while the central and southern regions are marked by a high to very high susceptibility. In contrast, the marginal areas in the west and the higher mountain regions in the east are much less susceptible to landslide activity.

3.3.2. Logistic Regression (LoR)

From the LoR model, the produced LS map is shown in Figure 7. The southern and north-western regions show high to very high susceptibility, and the central part exhibits medium susceptibility. In contrast, the northeastern region of the study area exhibited very low to medium susceptibility.

3.3.3. Support Vector Machine

The LS map produced by the SVM model is depicted in Figure 8. The southern region exhibits a high to very high susceptibility. It also reveals that the marginal areas in the west and east have medium susceptibility. Very low and low susceptibility regions are in the middle part of the district towards the east side.

3.4. Model Validation

The AUC for the three models is calculated using the testing dataset shown in Figure 9. The sensitivity (true positive rate) is plotted against the 100-specificity (false positive rate) at different threshold values to generate the curve. The LiR (0.88) accomplished a greater AUC prediction rate than the SVM (0.86) and was followed closely by the LoR (0.85), which made LiR the highest precise model. The higher the AUC value indicated, the higher accuracy of the model.

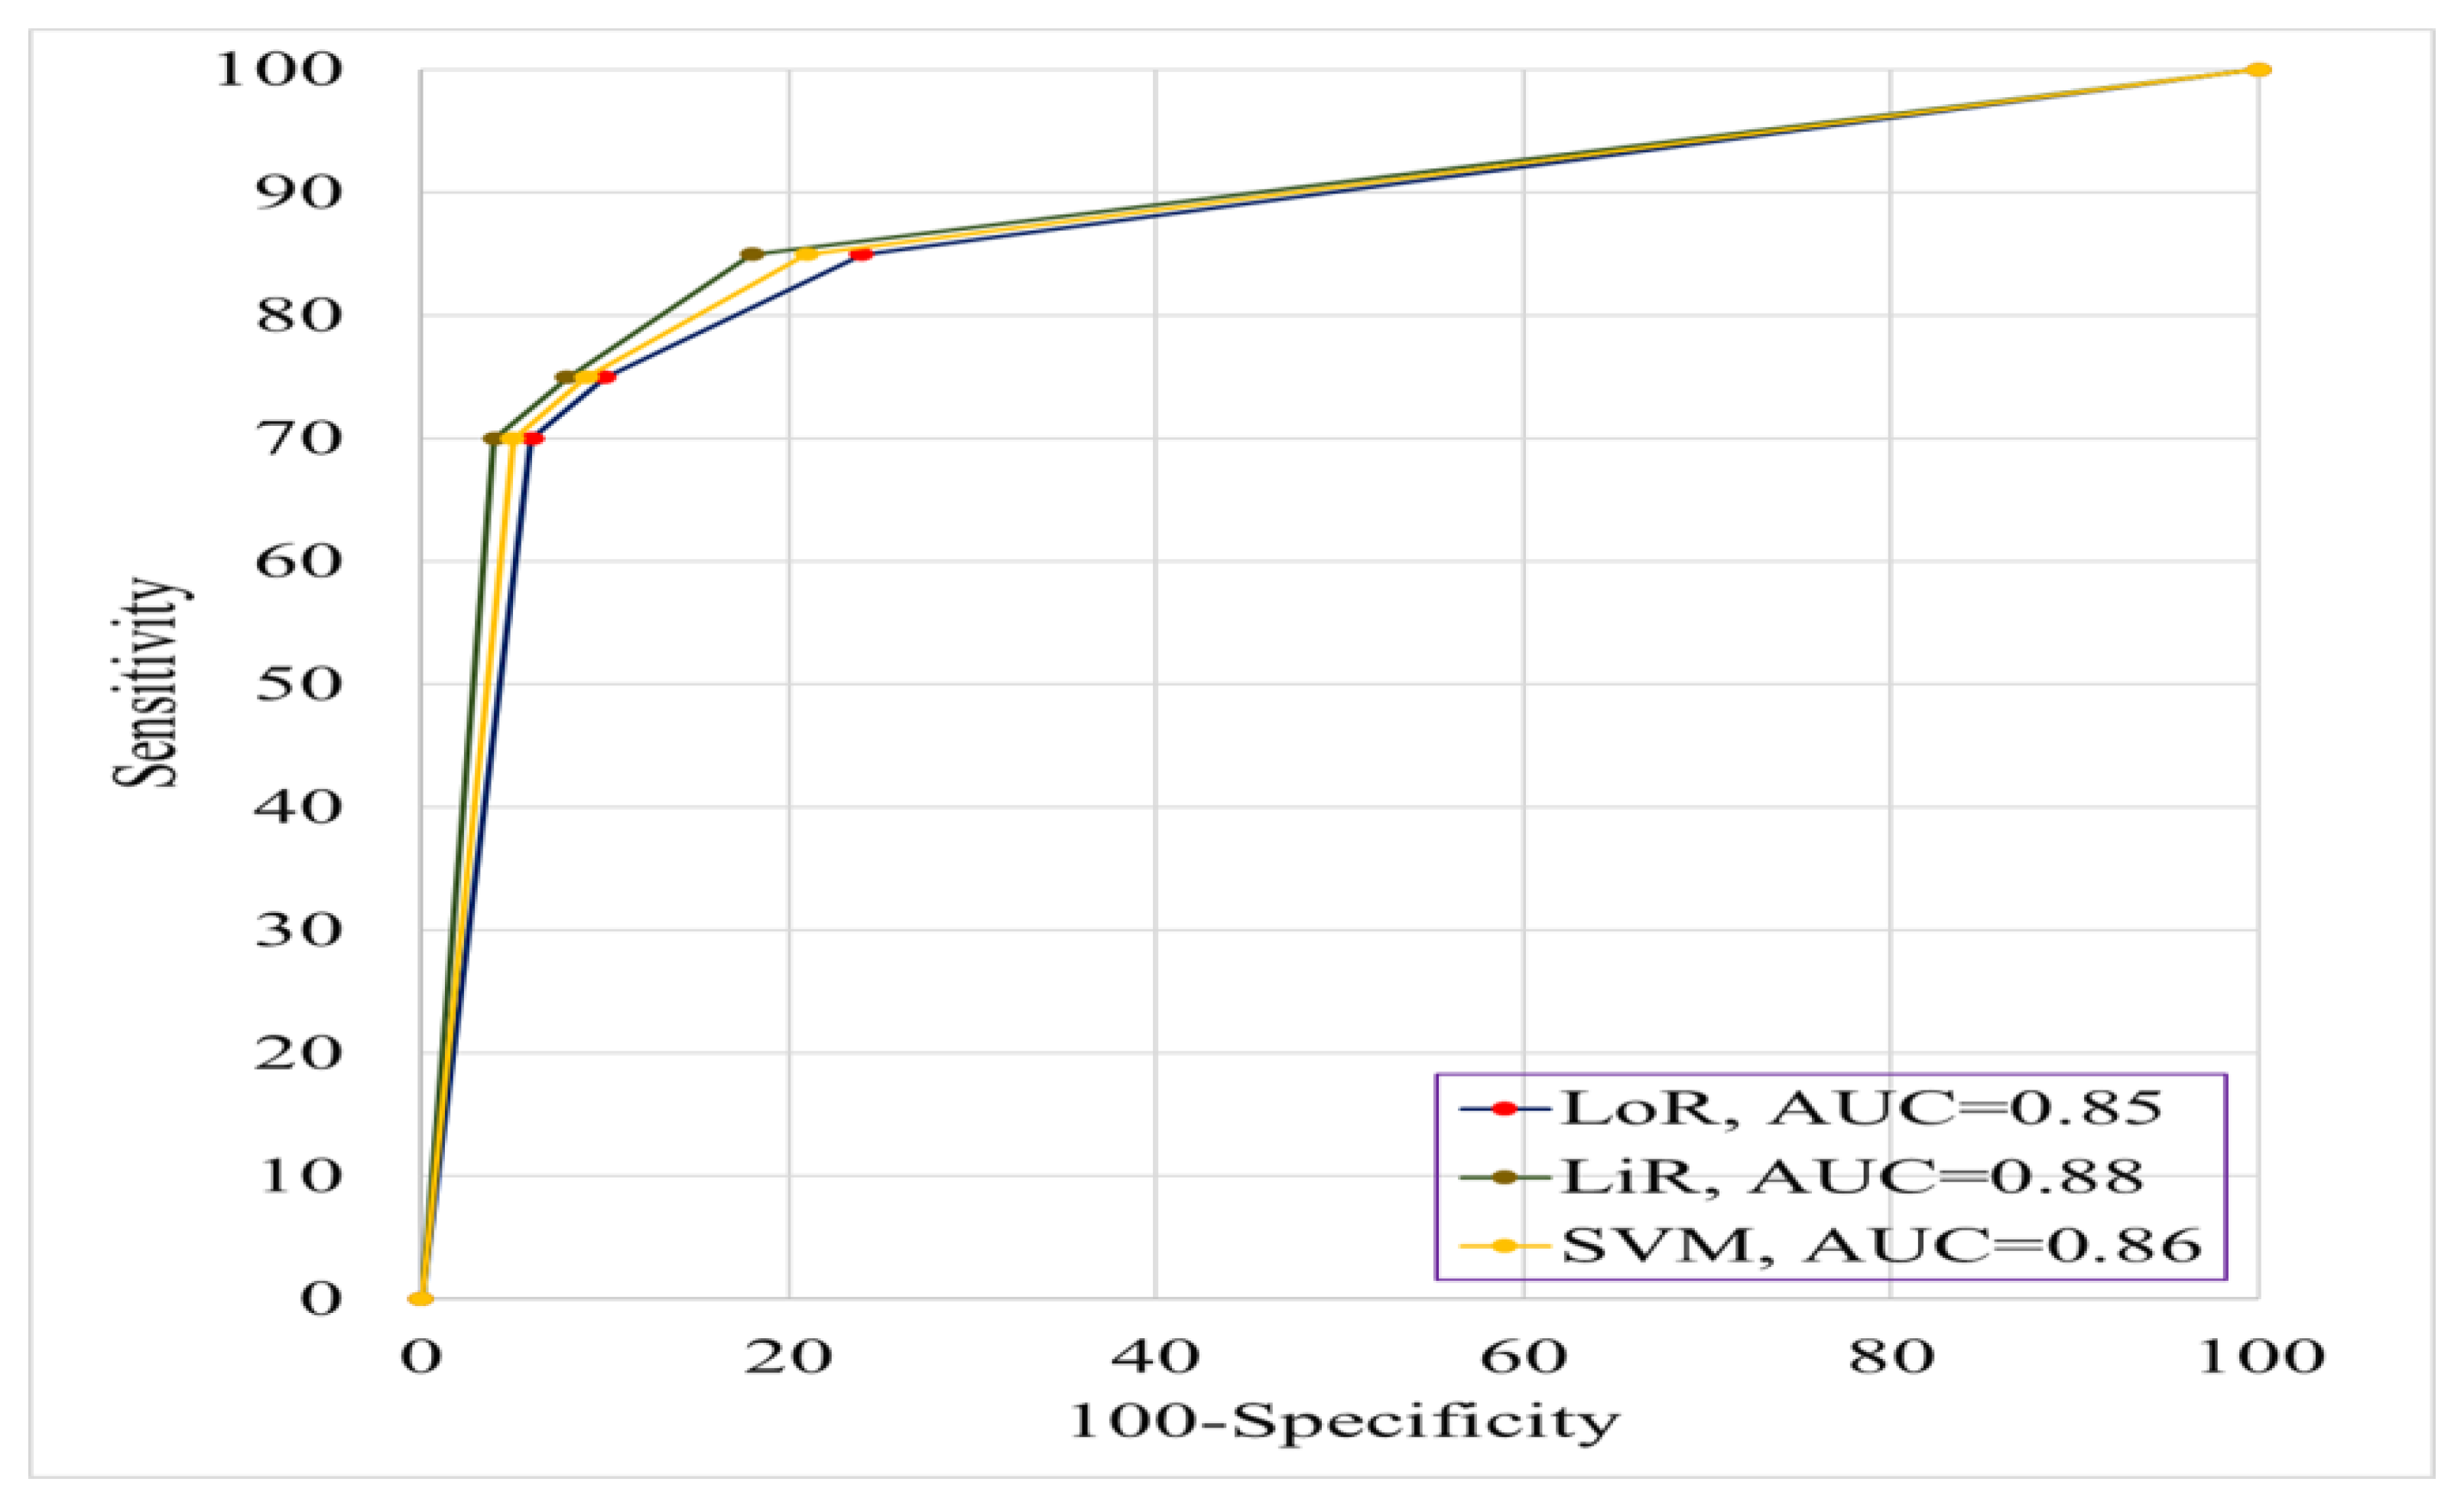
3.5. Accuracy Assessment

To assess the outcomes of landslide susceptibility analysis, the historical landslide positions were overlaid on the LS maps as shown in the produced LS maps from the different ML models (see Figure 6, Figure 7 and Figure 8). Accuracy assessment results illustrate that the LiR model attained an accuracy of 85%, followed by the SVM model at 83%, and the LoR model at 79%.

4. Discussion

Remote sensing and GIS technologies have been effectively used to assess landslide susceptibility by exercising different methods. The first step in the concerning work is to produce and validate landslide inventory. For this purpose, the Landsat satellite imageries are used to develop landslide inventory and assess the outcomes of pre, and post-landslide events and the landslide locations were verified from the field survey. The landslide points along with the equal number of non-landslide points were used as training (70%) and testing (30%) data. The second step involved the preparation of LS maps. In this study, 14 causative factors including land cover, type of soil cover, NDWI, slope, lithology, NDVI, elevation, fault density, road density, TRI, curvature, profile curvature, plan curvature, and aspect were considered and were standardized and normalized in an ArcGIS environment. Expert judgment, a critical investigation of existing literature, and landslide inventory were done in this study to determine the selection of the contributing factors. Their weighting during the normalization process was also based on the previously mentioned criteria.
The 14 chosen factors for this study were weighted using the considered ML models. Each model showed variations in terms of weights for each factor, as can be seen from Table 1. The conditioning factors considered the most effective by all the models were lithology, NDWI, slope, and LCCS. The high susceptibility areas occurred in steep slopes and weak lithologies. High susceptibility is found to be characteristic of slopes highly exposed to seismic and climatic effects on slope failure. The climatic influence is more represented by the NDWI and landcover factors while the seismic influence depends on the fault density, which contributes to the LS in our study area. This argument can also be supported by multiple examples of previous trends of landslide occurrences in the study area. One such example of landslides where both seismic and climatic influences are dominant is Poona Landslide, Havelian presented in Figure 2. The Poona landslide occurred in November 2015 approximately one month after the October 2015 earthquake; seismic shaking is supposed to have initiated landslide movements that were then intensified by subsequent rainfall which finally triggered a massive failure. These highly relevant conditioning factors that influence landslide occurrences can be extended to other areas because of their major contribution to initiating landslides for LS mapping in the future.
The explorative area for LS mapping is categorized into five LS classes: very low, low, medium, high, and very high, as can be seen from Figure 6, Figure 7 and Figure 8. The high susceptibility areas occurred in steep slopes and weak lithologies. Additionally, the region categorized as high/very high LS corresponds to zones having high moisture content and they align closely to the historical landslides. The results of susceptibility maps in terms of area under different susceptibility classes are summarized as a graphical representation in Figure 10. Figure 10 illustrates that most of the study area is classified as a very low susceptible zone by all three models. The maps produced by the three models illustrated that five LS classes have varied trends in terms of positions and percentages, as can be witnessed from Figure 6, Figure 7 and Figure 8 and Figure 10.
The third step involves the validation of a model. The trial-and-error process was carried out for ML methods to readjust and determine the ideal model to obtain higher estimation performance. The 10-fold cross-validation is used to avoid overfitting. All the models yielded very high prediction accuracy with AUC values between 0.85 and 0.88. The LiR model has the highest AUC value as compared to other models.
The LiR model outperformed the SVM and LoR models. Still, the SVM model shows higher proportions in terms of area under a very high susceptibility class. The results of the LiR model stand above other models in terms of area under high and medium susceptibility classes. The closer affinity of considered landslide conditioning factors with landslide occurrence resulted in the higher accuracy of the models in predicting landslides. Moreover, there was also no multicollinearity present among the considered conditioning factors.
The availability of high-quality data has a significant impact on the results, and the accuracy of the result improves as the number and suitability of factors increases. The selection of contributing factors proves to be highly appropriate. Kalantar et al., 2018 [80] also established in their study that quality data play an efficient role in the performance of the ML models. The authors employed 14 conditioning factors and used SVM, LoR, and artificial neural networks for assessing the effects of different training data on landslide susceptibility mapping. They achieved an overall accuracy of 79.82% for SVM and 81.42% for LoR which is less than the achieved accuracy for LoR (85%) and SVM (86%) in the present study.
The SVM is effective when the number of dimensions exceeds the number of samples because LoR usually required a sufficiently large sample size to accurately predict. When there is a small amount of training data and many features, both perform well. The LiR assumes no collinearity and that the input features are normally distributed, which may not be the case. Because linear and logistic regression is more susceptible to outliers than SVM, SVM outperforms LoR by a slight margin. Preprocessing is required in linear regression to remove multicollinearity, handle outliers, and reduce dimensionality.
This region is under the influence of frequent landslide occurrences and no proper study has been performed in the study area. So, this methodology can serve as a baseline for upcoming studies. The limitation is that feature extraction is not being performed in this study. The recommendation for future work would be to use feature extraction by using deep learning convolutional neural networks, which will improve the results. In addition, McNemar’s test could be performed for future analysis to compare the statistical significance of different ML models. Further, we recommend using deep learning to avoid the uncertainties in the factors caused by the subjective judgment by following the work of [37] to highlight the performance ability of the hybrid approach of combined fuzzy and SVM model in the area. We will focus more on risk analysis and incorporate the results with temporal factors and examine their effect in future work.

5. Conclusions

This study employed three ML models, namely LiR, LoR, and SVM to produce LS maps for the Abbottabad district of Khyber Pakhtunkhwa, Pakistan. Landslide inventory preparation, selection, and processing of the conditioning factors, susceptibility mapping, validation of the models, and accuracy assessment were the main stages in this study. A total of 14 conditioning factors were prepared, including LCCS, soil type, NDWI, slope, lithology, NDVI, elevation, fault density, road density, curvature, profile curvature, plan curvature, TRI, and aspect. The landslide inventory map comprised 232 samples, of which 116 were non-landslide, and 116 were landslide locations. These samples were utilized to calculate the weights of the conditioning factors using LiR, LoR, and SVM models. The results reveal that the most influencing factors are lithology, NDWI, slope, and LCCS. By adopting the weighted overlay technique, the weights of all conditioning factors were used to prepare the final landslide susceptibility maps. The study area is subjected to landslides induced both by seismic and climatic events. The areas having high susceptibility are marked by the presence of high and steep slopes having weaker lithologies and are exposed to high seismic shaking potential. The results indicate that most of the area is subjected to very low susceptibility. The AUC values of all the models were satisfactory. However, the LiR model achieved better results overall and stood above the other models concerning model validation and accuracy of produced susceptibility maps. The outcomes of this research will provide essential information to researchers, authorities, and planners, who aid in decision making, land management, and hazard mitigation in the Abbottabad district.

Author Contributions

Conceptualization, I.U. and B.A.; methodology, A.T. and I.U.; software, I.U. and A.T.; validation, A.T., B.A. and I.U.; formal analysis, S.H.I.A.S., A.T. and B.A.; investigation, A.T. and I.U.; resources, S.H.I.A.S., A.T. and S.Q.; data curation, I.U. and A.T.; writing—original draft preparation, I.U., S.Q., M.M. and A.T.; writing—review and editing, A.T., H.-B.H., I.U., S.Q. and B.A.; visualization, A.T. and B.A.; supervision, A.T.; project administration, S.Q.; funding acquisition, S.Q. All authors have read and agreed to the published version of the manuscript.

Funding

This research was funded by Postdoctoral Research Foundation of China (grant no.2020M682477) and the Fundamental Research Funds for the Central Universities (grant no.2042021kf0053).

Institutional Review Board Statement

Not applicable.

Informed Consent Statement

Not applicable.

Data Availability Statement

The data presented in this study are available on request from the first or corresponding authors.

Acknowledgments

We acknowledge the anonymous reviewers and editors of the journal’s special issue, which provided constructive comments that helped improve the final version of the manuscript. Alban Kuriqi acknowledges the Portuguese Foundation for Science and Technology (FCT) support through PTDC/CTA-OHR/30561/2017 (WinTherface).

Conflicts of Interest

The authors declare no conflict of interest.

References

  1. Varnes, D. Slope Movement Types and Processes. Transp. Res. Board Spec. Rep. 1978, 176, 11–33. [Google Scholar]
  2. Farooq, K.; Rogers, J.D.; Ahmed, M.F. Effect of Densification on the Shear Strength of Landslide Material: A Case Study from Salt Range, Pakistan. Earth Sci. Res. 2015, 4, 113–125. [Google Scholar] [CrossRef]
  3. Das, I.; Stein, A.; Kerle, N.; Dadhwal, V.K. Landslide susceptibility mapping along road corridors in the Indian Himalayas using Bayesian logistic regression models. Geomorphology 2012, 179, 116–125. [Google Scholar] [CrossRef]
  4. Haque, U.; Blum, P.; da Silva, P.F.; Andersen, P.; Pilz, J.; Chalov, S.R.; Malet, J.P.; Auflič, M.J.; Andres, N.; Poyiadji, E.; et al. Fatal landslides in Europe. Landslides 2016, 13, 1545–1554. [Google Scholar] [CrossRef]
  5. Papoutsis, I.; Kontoes, C.; Alatza, S.; Apostolakis, A.; Loupasakis, C. InSAR greece with parallelized persistent scatterer interferometry: A national ground motion service for big copernicus sentinel-1 data. Remote Sens. 2020, 12, 3207. [Google Scholar] [CrossRef]
  6. USAID; UCL. Natural disasters in 2017: Lower mortality, higher cost. Cent. Res. Epidemiol. Disasters 2018. Available online: https://reliefweb.int/report/world/cred-crunch-newsletter-issue-no-50-march-2018-natural-disasters-2017-lower-mortality (accessed on 24 April 2020).
  7. Chen, W.; Chen, Y.; Tsangaratos, P.; Ilia, I.; Wang, X. Combining evolutionary algorithms and machine learning models in landslide susceptibility assessments. Remote Sens. 2020, 12, 3854. [Google Scholar] [CrossRef]
  8. Zillman, J. The Physical impact of Disasters. In Natural Disaster Management. Leicester; Ingleton, J., Ed.; Tudor Rose Holdings Ltd.: Leicester, UK, 1999; p. 320. [Google Scholar]
  9. Feizizadeh, B.; Blaschke, T. Landslide Risk Assessment Based on GIS Multi-Criteria Evaluation: A Case Study in Bostan-Abad County Iran. J. Earth Sci. Eng. 2011, 1, 66–71. [Google Scholar]
  10. Tsironi, V.; Ganas, A.; Karamitros, I.; Efstathiou, E.; Koukouvelas, I.; Sokos, E. Kinematics of Active Landslides in Achaia (Peloponnese, Greece) through InSAR Time Series Analysis and Relation to Rainfall Patterns. Remote Sens. 2022, 14, 844. [Google Scholar] [CrossRef]
  11. Froude, M.J.; Petley, D.N. Global fatal landslide occurrence from 2004 to 2016. Nat. Hazards Earth Syst. Sci. 2018, 18, 2161–2181. [Google Scholar] [CrossRef]
  12. Hobbs, J.J.; Salter, C.L. Essentials of World Regional Geography; Brooks/Cole Thomson Learning: Melbourne, Australia, 2006; ISBN 9780534466008. [Google Scholar]
  13. Aslam, B.; Zafar, A.; Khalil, U. Comparison of multiple conventional and unconventional machine learning models for landslide susceptibility mapping of Northern part of Pakistan. Environ. Dev. Sustain. 2022, 1–28. [Google Scholar] [CrossRef]
  14. Mustafa, Z.U.; Ahmad, S.R.; Luqman, M.; Ahmad, U.; Khan, S.; Nawaz, M.; Javed, A. Investigating Factors of Slope Failure for Different Landsliding Sites in Murree Area, Using Geomatics Techniques. J. Geosci. Environ. Prot. 2015, 3, 39–45. [Google Scholar] [CrossRef]
  15. Kamp, U.; Growley, B.J.; Khattak, G.A.; Owen, L.A. GIS-based landslide susceptibility mapping for the 2005 Kashmir earthquake region. Geomorphology 2008, 101, 631–642. [Google Scholar] [CrossRef]
  16. Wei, Z.-L.; Shang, Y.-Q.; Sun, H.-Y.; Xu, H.-D.; Wang, D.-F. The effectiveness of a drainage tunnel in increasing the rainfall threshold of a deep-seated landslide. Landslides 2019, 16, 1731–1744. [Google Scholar] [CrossRef]
  17. Marjanović, M. Advanced Methods for landslide Assessment Using GIS. Ph.D. Thesis, Palacký University Olomouc, Olomouc, Czechia, 2013; pp. 1–128. [Google Scholar]
  18. Kanwal, S.; Atif, S.; Shafiq, M. GIS based landslide susceptibility mapping of northern areas of Pakistan, a case study of Shigar and Shyok Basins. Geomat. Nat. Hazards Risk 2017, 8, 348–366. [Google Scholar] [CrossRef]
  19. Ozdemir, A.; Altural, T. A comparative study of frequency ratio, weights of evidence and logistic regression methods for landslide susceptibility mapping: Sultan mountains, SW Turkey. J. Asian Earth Sci. 2013, 64, 180–197. [Google Scholar] [CrossRef]
  20. Guzzetti, F.; Carrara, A.; Cardinali, M.; Reichenbach, P. Landslide hazard evaluation: A review of current techniques and their application in a multi-scale study, Central Italy. Geomorphology 1999, 31, 181–216. [Google Scholar] [CrossRef]
  21. Zêzere, J.L.; Pereira, S.; Melo, R.; Oliveira, S.C.; Garcia, R.A.C. Mapping landslide susceptibility using data-driven methods. Sci. Total Environ. 2017, 589, 250–267. [Google Scholar] [CrossRef]
  22. Tariq, A.; Yan, J.; Gagnon, A.S.; Riaz Khan, M.; Mumtaz, F. Mapping of cropland, cropping patterns and crop types by combining optical remote sensing images with decision tree classifier and random forest. Geo-Spat. Inf. Sci. 2022, 1–19. [Google Scholar] [CrossRef]
  23. Tariq, A.; Mumtaz, F.; Zeng, X.; Baloch, M.Y.J.; Moazzam, M.F.U. Spatio-temporal variation of seasonal heat islands mapping of Pakistan during 2000–2019, using day-time and night-time land surface temperatures MODIS and meteorological stations data. Remote Sens. Appl. Soc. Environ. 2022, 27, 100779. [Google Scholar] [CrossRef]
  24. Shah, S.H.I.A.; Jianguo, Y.; Jahangir, Z.; Tariq, A.; Aslam, B. Integrated geophysical technique for groundwater salinity delineation, an approach to agriculture sustainability for Nankana Sahib Area, Pakistan. Geomat. Nat. Hazards Risk 2022, 13, 1043–1064. [Google Scholar] [CrossRef]
  25. Farhan, M.; Moazzam, U.; Rahman, G.; Munawar, S.; Tariq, A.; Safdar, Q.; Lee, B. Trends of Rainfall Variability and Drought Monitoring Using Standardized Precipitation Index in a Scarcely Gauged Basin of Northern Pakistan. Water 2022, 14, 1132. [Google Scholar] [CrossRef]
  26. Ayalew, L.; Yamagishi, H. The application of GIS-based logistic regression for landslide susceptibility mapping in the Kakuda-Yahiko Mountains, Central Japan. Geomorphology 2005, 65, 15–31. [Google Scholar] [CrossRef]
  27. Kouli, M.; Loupasakis, C.; Soupios, P.; Vallianatos, F. Landslide hazard zonation in high risk areas of Rethymno Prefecture, Crete Island, Greece. Nat. Hazards 2010, 52, 599–621. [Google Scholar] [CrossRef]
  28. Feizizadeh, B.; Blaschke, T. GIS-multicriteria decision analysis for landslide susceptibility mapping: Comparing three methods for the Urmia lake basin, Iran. Nat. Hazards 2013, 65, 2105–2128. [Google Scholar] [CrossRef]
  29. Ayalew, L.; Yamagishi, H.; Ugawa, N. Landslide susceptibility mapping using GIS-based weighted linear combination, the case in Tsugawa area of Agano River, Niigata Prefecture, Japan. Landslides 2004, 1, 73–81. [Google Scholar] [CrossRef]
  30. Sejrup, H.P.; Haflidason, H.; Flatebø, T.; Kristensen, D.K.; Grøsfjeld, K.; Larsen, E. Late-glacial to Holocene environmental changes and climate variability: Evidence from Voldafjorden, western Norway. J. Quat. Sci. 2001, 16, 181–198. [Google Scholar] [CrossRef]
  31. Alexakis, D.D.; Agapiou, A.; Tzouvaras, M.; Themistocleous, K.; Neocleous, K.; Michaelides, S.; Hadjimitsis, D.G. Integrated use of GIS and remote sensing for monitoring landslides in transportation pavements: The case study of Paphos area in Cyprus. Nat. Hazards 2014, 72, 119–141. [Google Scholar] [CrossRef]
  32. Neaupane, K.M.; Piantanakulchai, M. Analytic network process model for landslide hazard zonation. Eng. Geol. 2006, 85, 281–294. [Google Scholar] [CrossRef]
  33. Hwang, C.-L.; Yoon, K. Multiple Objective Decision Making-Methods and Applications. Lect. Notes Econ. Math. Syst. 1981, 1, 1–358. [Google Scholar] [CrossRef]
  34. Arabameri, A.; Pradhan, B.; Rezaei, K.; Conoscenti, C. Gully erosion susceptibility mapping using GIS-based multi-criteria decision analysis techniques. Catena 2019, 180, 282–297. [Google Scholar] [CrossRef]
  35. Bai, S.B.; Wang, J.; Lü, G.N.; Zhou, P.G.; Hou, S.S.; Xu, S.N. GIS-based logistic regression for landslide susceptibility mapping of the Zhongxian segment in the Three Gorges area, China. Geomorphology 2010, 115, 23–31. [Google Scholar] [CrossRef]
  36. Corominas, J.; van Westen, C.; Frattini, P.; Cascini, L.; Malet, J.P.; Fotopoulou, S.; Catani, F.; Van Den Eeckhaut, M.; Mavrouli, O.; Agliardi, F.; et al. Recommendations for the quantitative analysis of landslide risk. Bull. Eng. Geol. Environ. 2014, 73, 209–263. [Google Scholar] [CrossRef]
  37. Chen, W.; Pourghasemi, H.R.; Kornejady, A.; Zhang, N. Landslide spatial modeling: Introducing new ensembles of ANN, MaxEnt, and SVM machine learning techniques. Geoderma 2017, 305, 314–327. [Google Scholar] [CrossRef]
  38. Oh, H.J.; Lee, S. Shallow landslide susceptibility modeling using the data mining models artificial neural network and boosted tree. Appl. Sci. 2017, 7, 1000. [Google Scholar] [CrossRef]
  39. Hong, H.; Pradhan, B.; Xu, C.; Bui, D.T. Spatial prediction of landslide hazard at the Yihuang area (China) using two-class kernel logistic regression, alternating decision tree and support vector machines. Catena 2015, 133, 266–281. [Google Scholar] [CrossRef]
  40. Pradhan, B. A comparative study on the predictive ability of the decision tree, support vector machine and neuro-fuzzy models in landslide susceptibility mapping using GIS. Comput. Geosci. 2013, 51, 350–365. [Google Scholar] [CrossRef]
  41. Park, S.; Choi, C.; Kim, B.; Kim, J. Landslide susceptibility mapping using frequency ratio, analytic hierarchy process, logistic regression, and artificial neural network methods at the Inje area, Korea. Environ. Earth Sci. 2013, 68, 1443–1464. [Google Scholar] [CrossRef]
  42. Yao, X.; Tham, L.G.; Dai, F.C. Landslide susceptibility mapping based on Support Vector Machine: A case study on natural slopes of Hong Kong, China. Geomorphology 2008, 101, 572–582. [Google Scholar] [CrossRef]
  43. Bui, D.T.; Tuan, T.A.; Hoang, N.D.; Thanh, N.Q.; Nguyen, D.B.; Van Liem, N.; Pradhan, B. Spatial prediction of rainfall-induced landslides for the Lao Cai area (Vietnam) using a hybrid intelligent approach of least squares support vector machines inference model and artificial bee colony optimization. Landslides 2017, 14, 447–458. [Google Scholar] [CrossRef]
  44. Onagh, M.; Kumra, V.K.; Rai, P.K. Landslide Susceptibility Mapping in a Part of Uttarkashi District (India) By Multiple Linear Regression Method. Int. J. Geol. Earth Environ. Sci. 2012, 2, 102–120. [Google Scholar]
  45. Arabameri, A.; Pradhan, B.; Rezaei, K.; Sohrabi, M.; Kalantari, Z. GIS-based landslide susceptibility mapping using numerical risk factor bivariate model and its ensemble with linear multivariate regression and boosted regression tree algorithms. J. Mt. Sci. 2019, 16, 595–618. [Google Scholar] [CrossRef]
  46. Chen, W.; Peng, J.; Hong, H.; Shahabi, H.; Pradhan, B.; Liu, J.; Zhu, A.X.; Pei, X.; Duan, Z. Landslide susceptibility modelling using GIS-based machine learning techniques for Chongren County, Jiangxi Province, China. Sci. Total Environ. 2018, 626, 1121–1135. [Google Scholar] [CrossRef] [PubMed]
  47. Meng, Q.; Miao, F.; Zhen, J.; Wang, X.; Wang, A.; Peng, Y.; Fan, Q. GIS-based landslide susceptibility mapping with logistic regression, analytical hierarchy process, and combined fuzzy and support vector machine methods: A case study from Wolong Giant Panda Natural Reserve, China. Bull. Eng. Geol. Environ. 2016, 75, 923–944. [Google Scholar] [CrossRef]
  48. Aslam, B.; Zafar, A.; Khalil, U. Development of integrated deep learning and machine learning algorithm for the assessment of landslide hazard potential. Soft Comput. 2021, 25, 13493–13512. [Google Scholar] [CrossRef]
  49. Ballabio, C.; Sterlacchini, S. Support Vector Machines for Landslide Susceptibility Mapping: The Staffora River Basin Case Study, Italy. Math. Geosci. 2012, 44, 47–70. [Google Scholar] [CrossRef]
  50. Onagh, M.; Kumra, V.; Rai, P. Application of Multiple Linear Regression Model in Landslide Susceptibility Zonation Mapping the Case Study Narmab Basin. Int. J. Geol. Earth Environ. Sci. 2012, 2, 87–101. [Google Scholar]
  51. Lee, S.; Min, K. Statistical analysis of landslide susceptibility at Yongin, Korea. Environ. Geol. 2001, 40, 1095–1113. [Google Scholar] [CrossRef]
  52. Qing, F.; Zhao, Y.; Meng, X.; Su, X.; Qi, T.; Yue, D. Application of machine learning to debris flow susceptibility mapping along the China-Pakistan Karakoram Highway. Remote Sens. 2020, 12, 2933. [Google Scholar] [CrossRef]
  53. Ali, S.; Biermanns, P.; Haider, R.; Reicherter, K. Landslide susceptibility mapping by using a geographic information system (GIS) along the China-Pakistan Economic Corridor (Karakoram Highway), Pakistan. Nat. Hazards Earth Syst. Sci. 2019, 19, 999–1022. [Google Scholar] [CrossRef]
  54. Basharat, M.; Shah, H.R.; Hameed, N. Landslide susceptibility mapping using GIS and weighted overlay method: A case study from NW Himalayas, Pakistan. Arab. J. Geosci. 2016, 9, 292. [Google Scholar] [CrossRef]
  55. Torizin, J.; Fuchs, M.; Awan, A.A.; Ahmad, I.; Akhtar, S.S.; Sadiq, S.; Razzak, A.; Weggenmann, D.; Fawad, F.; Khalid, N.; et al. Statistical landslide susceptibility assessment of the Mansehra and Torghar districts, Khyber Pakhtunkhwa Province, Pakistan. Nat. Hazards 2017, 89, 757–784. [Google Scholar] [CrossRef]
  56. Pakistan Bureau of Statistics Census Pakistan. 2017. Available online: https://www.pbs.gov.pk/content/final-results-census-2017 (accessed on 7 May 2022).
  57. Gansser, A. Geology of the Himalayas; Interscience Publishers: London, UK; New York, NY, USA; Sydney, Australia, 1964; (tr. Zurich). [Google Scholar]
  58. Akhtar, S.; Rahim, Y.; Hu, B.; Tsang, H.; Ibrar, K.M.; Ullah, M.F.; Bute, S.I. Stratigraphy and Structure of Dhamtaur Area, District Abbottabad, Eastern Hazara, Pakistan. Open J. Geol. 2019, 9, 57–66. [Google Scholar] [CrossRef]
  59. Youssef, A.M.; Pourghasemi, H.R.; Pourtaghi, Z.S.; Al-Katheeri, M.M. Landslide susceptibility mapping using random forest, boosted regression tree, classification and regression tree, and general linear models and comparison of their performance at Wadi Tayyah Basin, Asir Region, Saudi Arabia. Landslides 2016, 13, 839–856. [Google Scholar] [CrossRef]
  60. Guzzetti, F.; Reichenbach, P.; Cardinali, M.; Galli, M.; Ardizzone, F. Probabilistic landslide hazard assessment at the basin scale. Geomorphology 2005, 72, 272–299. [Google Scholar] [CrossRef]
  61. Ismail, N.; Khattak, N. Observed failure modes of unreinforced masonry buildings during the 2015 Hindu Kush earthquake. Earthq. Eng. Eng. Vib. 2019, 18, 301–314. [Google Scholar] [CrossRef]
  62. Wu, Y.; Ke, Y.; Chen, Z.; Liang, S.; Zhao, H.; Hong, H. Application of alternating decision tree with AdaBoost and bagging ensembles for landslide susceptibility mapping. Catena 2020, 187, 104396. [Google Scholar] [CrossRef]
  63. Khan, H.; Shafique, M.; Khan, M.A.; Bacha, M.A.; Shah, S.U.; Calligaris, C. Landslide susceptibility assessment using Frequency Ratio, a case study of northern Pakistan. Egypt. J. Remote Sens. Sp. Sci. 2019, 22, 11–24. [Google Scholar] [CrossRef]
  64. Wang, Y.; Fang, Z.; Hong, H. Comparison of convolutional neural networks for landslide susceptibility mapping in Yanshan County, China. Sci. Total Environ. 2019, 666, 975–993. [Google Scholar] [CrossRef]
  65. Reichenbach, P.; Rossi, M.; Malamud, B.D.; Mihir, M.; Guzzetti, F. A review of statistically-based landslide susceptibility models. Earth-Sci. Rev. 2018, 180, 60–91. [Google Scholar] [CrossRef]
  66. Riley, S.J.; DeGloria, S.D.; Elliot, R. A Terrain Ruggedness that Quantifies Topographic Heterogeneity. Intermt. J. Sci. 1999, 5, 23–27. [Google Scholar]
  67. Lee, S.; Sambath, T. Landslide susceptibility mapping in the Damrei Romel area, Cambodia using frequency ratio and logistic regression models. Environ. Geol. 2006, 50, 847–855. [Google Scholar] [CrossRef]
  68. Dai, F.C.; Lee, C.F. Landslide characteristics and slope instability modeling using GIS, Lantau Island, Hong Kong. Geomorphology 2002, 42, 213–228. [Google Scholar] [CrossRef]
  69. Yesilnacar, E.; Topal, T. Landslide susceptibility mapping: A comparison of logistic regression and neural networks methods in a medium scale study, Hendek region (Turkey). Eng. Geol. 2005, 79, 251–266. [Google Scholar] [CrossRef]
  70. Vapnik, V. The support vector method of function estimation. In Nonlinear Modeling; Springer: Boston, MA, USA, 1998; pp. 55–85. [Google Scholar] [CrossRef]
  71. Tariq, A.; Shu, H.; Kuriqi, A.; Siddiqui, S.; Gagnon, A.S.; Lu, L.; Linh, N.T.T.; Pham, Q.B. Characterization of the 2014 Indus River Flood Using Hydraulic Simulations and Satellite Images. Remote Sens. 2021, 13, 2053. [Google Scholar] [CrossRef]
  72. Tariq, A.; Shu, H.; Siddiqui, S.; Mousa, B.G.; Munir, I.; Nasri, A.; Waqas, H.; Lu, L.; Baqa, M.F. Forest fire monitoring using spatial-statistical and Geo-spatial analysis of factors determining forest fire in Margalla Hills, Islamabad, Pakistan. Geomat. Nat. Hazards Risk 2021, 12, 1212–1233. [Google Scholar] [CrossRef]
  73. Waqas, H.; Lu, L.; Tariq, A.; Li, Q.; Baqa, M.F.; Xing, J.; Sajjad, A. Flash Flood Susceptibility Assessment and Zonation Using an Integrating Analytic Hierarchy Process and Frequency Ratio Model for the Chitral District, Khyber Pakhtunkhwa, Pakistan. Water 2021, 13, 1650. [Google Scholar] [CrossRef]
  74. Fawcett, T. An introduction to ROC analysis. Pattern Recognit. Lett. 2006, 27, 861–874. [Google Scholar] [CrossRef]
  75. Tariq, A.; Shu, H.; Siddiqui, S.; Imran, M.; Farhan, M. Monitoring Land Use and Land Cover Changes Using Geospatial Techniques, A Case Study of Fateh Jang, Attock, Pakistan. Geogr. Environ. Sustain. 2021, 14, 41–52. [Google Scholar] [CrossRef]
  76. Tariq, A.; Shu, H.; Gagnon, A.S.; Li, Q.; Mumtaz, F.; Hysa, A.; Siddique, M.A.; Munir, I. Assessing Burned Areas in Wildfires and Prescribed Fires with Spectral Indices and SAR Images in the Margalla Hills of Pakistan. Forests 2021, 12, 1371. [Google Scholar] [CrossRef]
  77. Vakhshoori, V.; Zare, M. Is the ROC curve a reliable tool to compare the validity of landslide susceptibility maps? Geomat. Nat. Hazards Risk 2018, 9, 249–266. [Google Scholar] [CrossRef]
  78. Tariq, A.; Shu, H. CA-Markov chain analysis of seasonal land surface temperature and land use landcover change using optical multi-temporal satellite data of Faisalabad, Pakistan. Remote Sens. 2020, 12, 3402. [Google Scholar] [CrossRef]
  79. Tariq, A.; Shu, H.; Siddiqui, S.; Munir, I.; Sharifi, A.; Li, Q.; Lu, L. Spatio-temporal analysis of forest fire events in the Margalla Hills, Islamabad, Pakistan using socio-economic and environmental variable data with machine learning methods. J. For. Res. 2021, 13, 12. [Google Scholar] [CrossRef]
  80. Kalantar, B.; Pradhan, B.; Amir Naghibi, S.; Motevalli, A.; Mansor, S. Assessment of the effects of training data selection on the landslide susceptibility mapping: A comparison between support vector machine (SVM), logistic regression (LR) and artificial neural networks (ANN). Geomat. Nat. Hazards Risk 2018, 9, 49–69. [Google Scholar] [CrossRef]
Figure 1. Location map of the study area showing Abbottabad district along with the distribution of faults and inventory of 116 landslides derived from Landsat 8 pre and post event imageries.
Land 11 01265 g001
Figure 2. Methodology flowchart used in the preparation of susceptibility map (NDWI is Normalized Difference Water Index, LCCS is Landcover Classification System, TRI is Topographic Roughness Index, FAO is Food and Agricultural Organization, and NDVI is Normalized Difference Vegetation Index).
Land 11 01265 g002
Figure 3. Google Earth Pro 7.3 is used to generate (A,B). Pre landslide imagery (2014) (A), and post landslide imagery (B). Picture (C,D) Illustrate field imagery of the Poona landslide, Havelian in the study area.
Land 11 01265 g003
Figure 4. Historical landslide and generated non-landslide points were used for testing and training in the study.
Land 11 01265 g004
Figure 5. Landslide conditioning factor maps used in this study: (a) LCCS, (b) soil type (from bedrock erosion), (c) NDWI, (d) slope, (e) lithology, (f) NDVI, (g) elevation, (h) fault density, (i) road density, (j) profile curvature, (k) plan curvature, (l) total curvature, (m) Aspect, (n) TRI.
Land 11 01265 g005aLand 11 01265 g005b
Figure 6. Landslide susceptibility map based on LiR model.
Land 11 01265 g006
Figure 7. Landslide susceptibility map based on LoR model.
Land 11 01265 g007
Figure 8. Landslide susceptibility map based on SVM model.
Land 11 01265 g008
Figure 9. ROC curve for the three landslide susceptibility models.
Land 11 01265 g009
Figure 10. A histogram shows susceptible areas from different models that fall into various classes.
Land 11 01265 g010
Table 1. Weights of conditioning factors from three ML models.
DatasetLoRSVMLiR
Aspect695
Curvature969
Elevation878
Lithology9109
NDVI688
NDWI9108
TRI768
Plane Curvature455
Profile Curvature534
Slope989
Faults766
Roads555
Soil789
LCCS997
Total100100100
Publisher’s Note: MDPI stays neutral with regard to jurisdictional claims in published maps and institutional affiliations.

