
Study on the Deformation of Filling Bodies in a Loess Mountainous Area Based on InSAR and Monitoring Equipment


Abstract
:1. Introduction
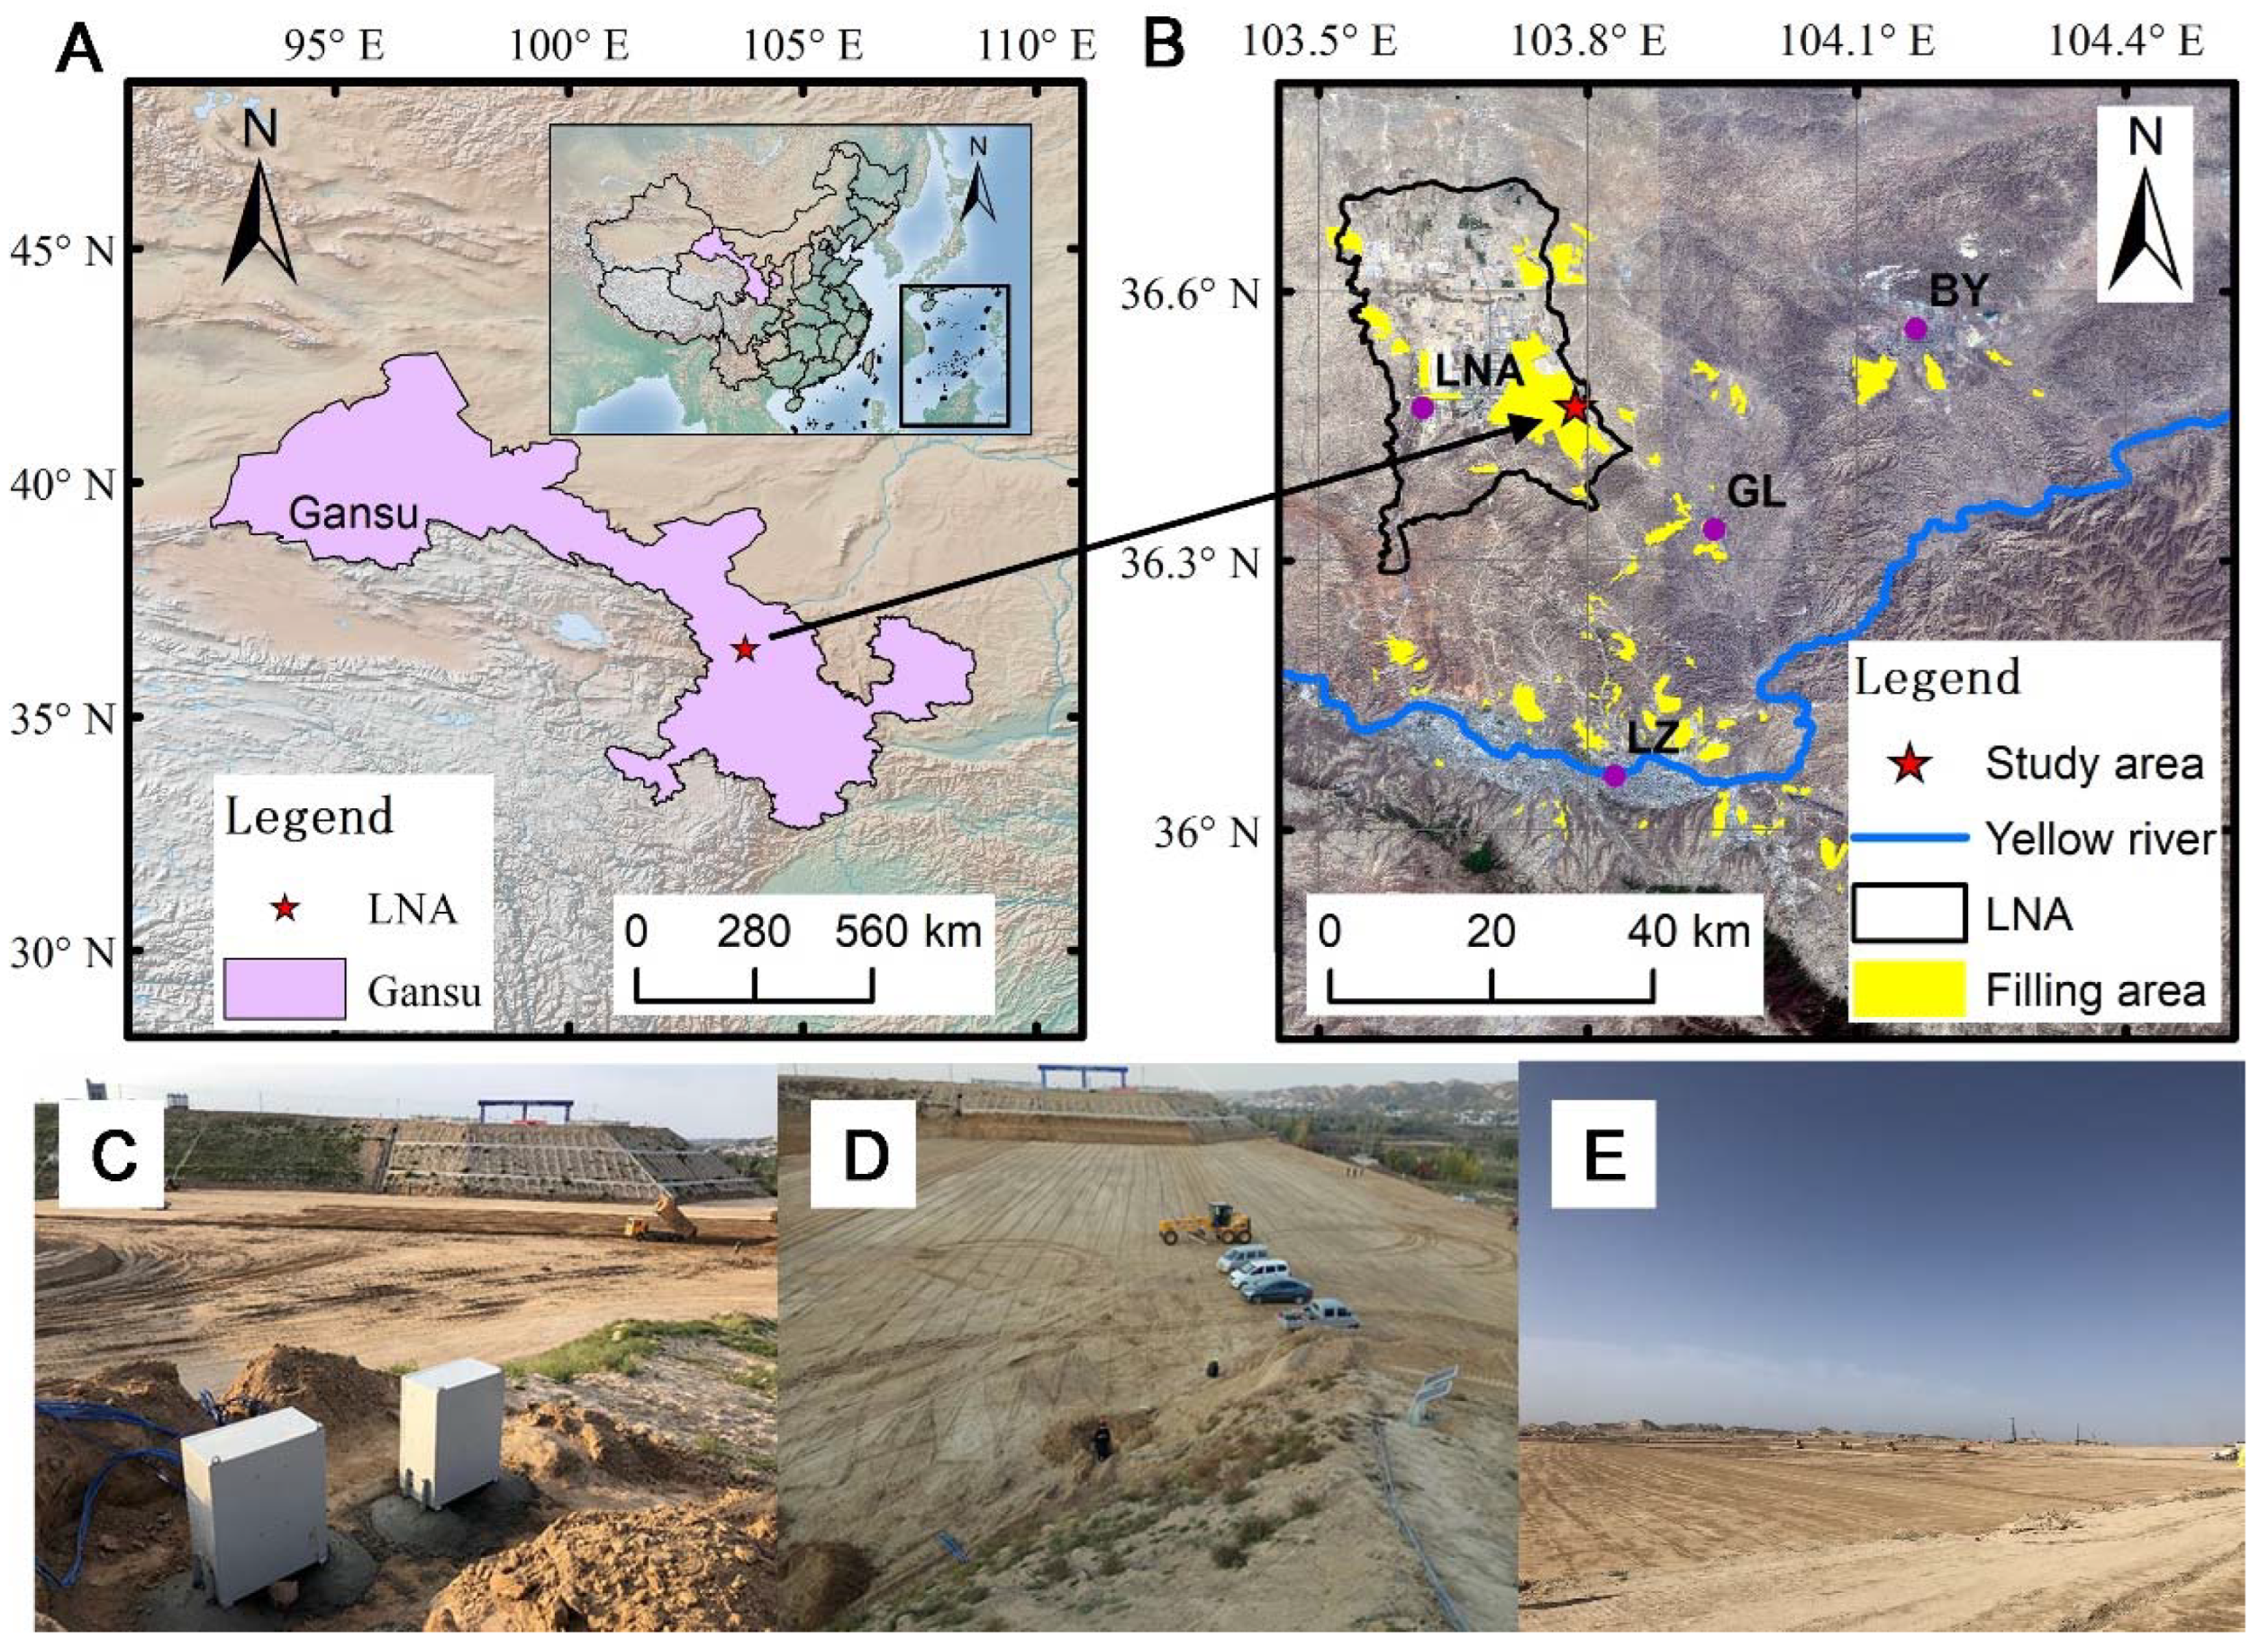
2. Study Area
3. Methods
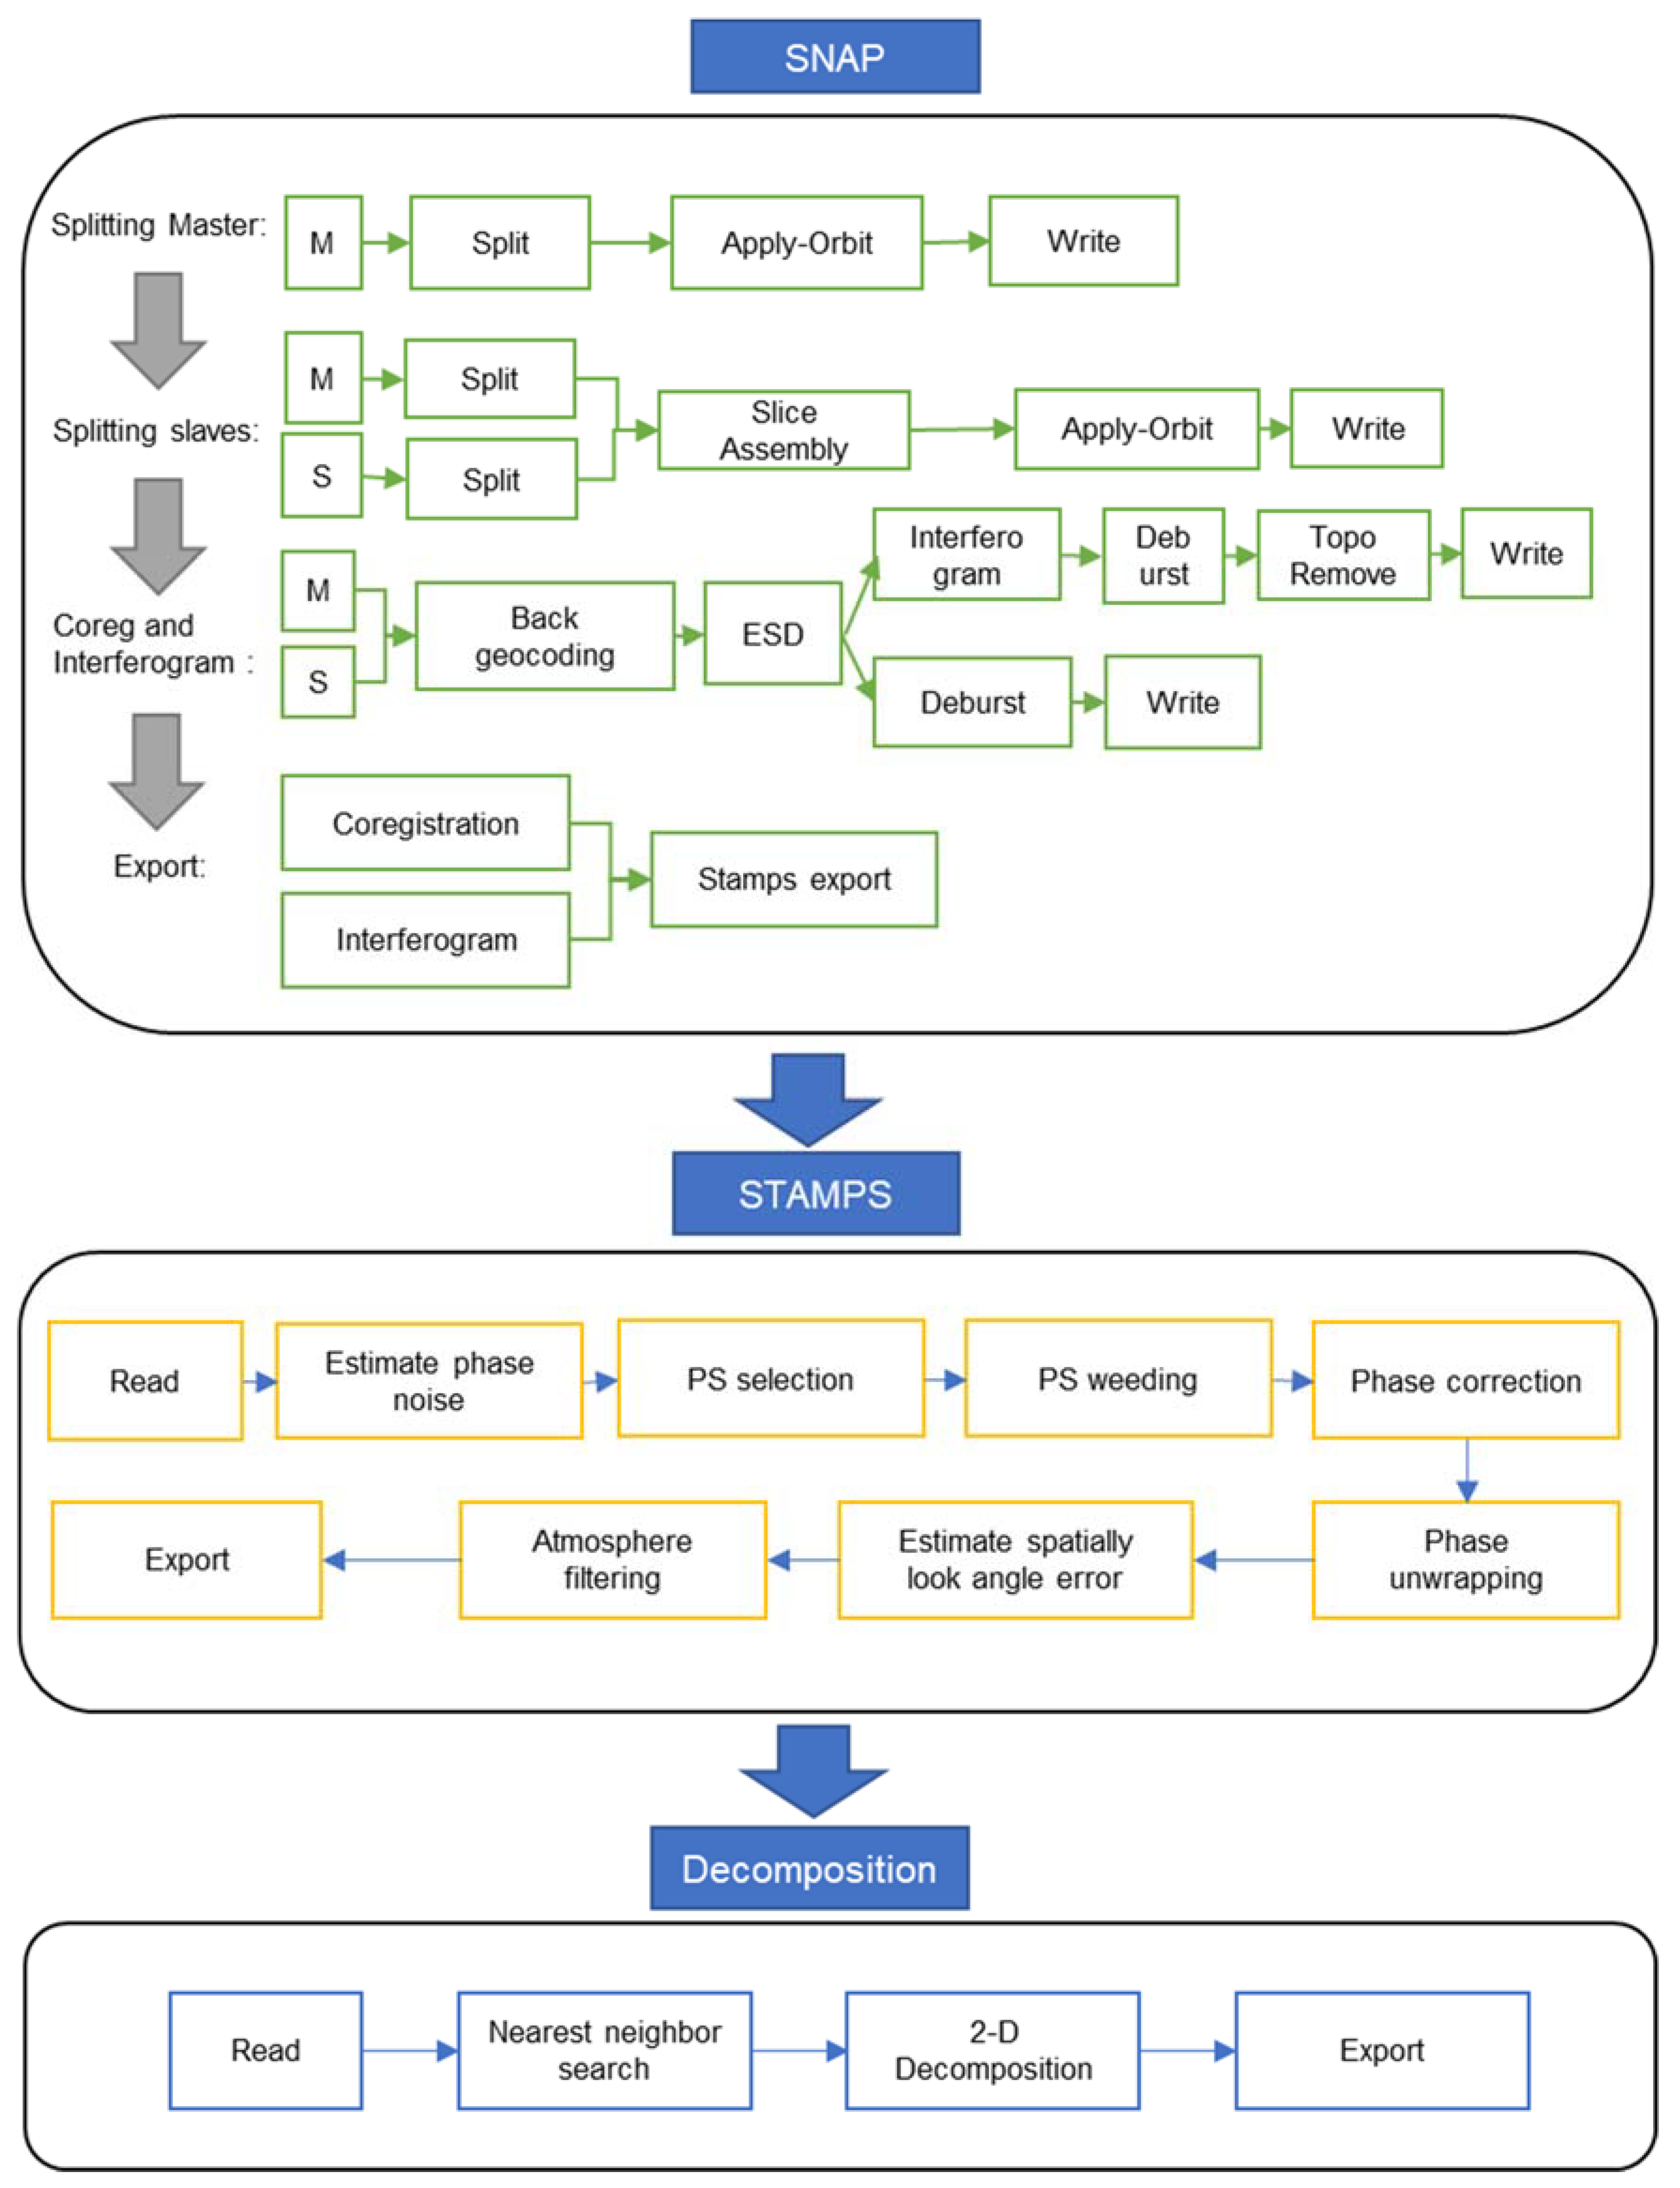
3.1. InSAR Process
3.2. 2-D Decomposition
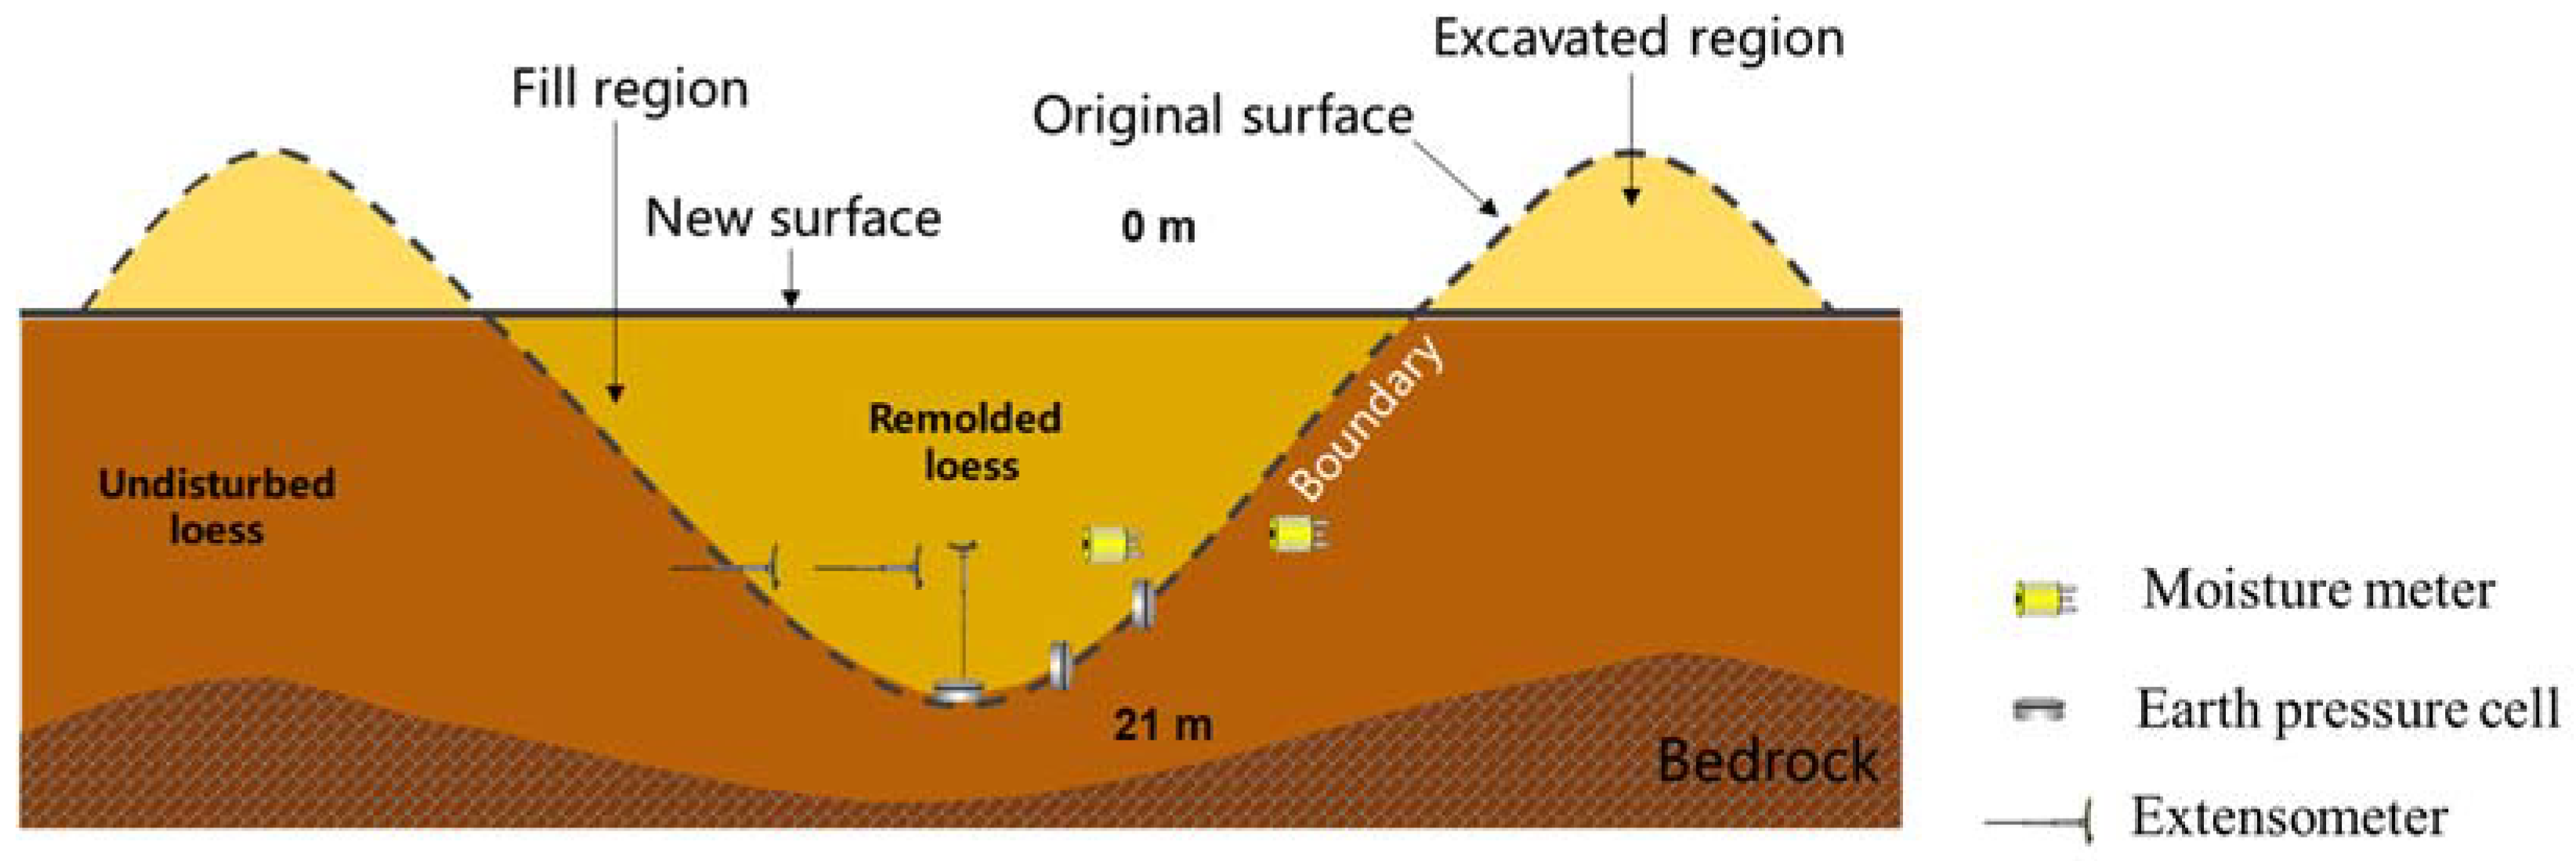
3.3. Field Monitoring
4. Results
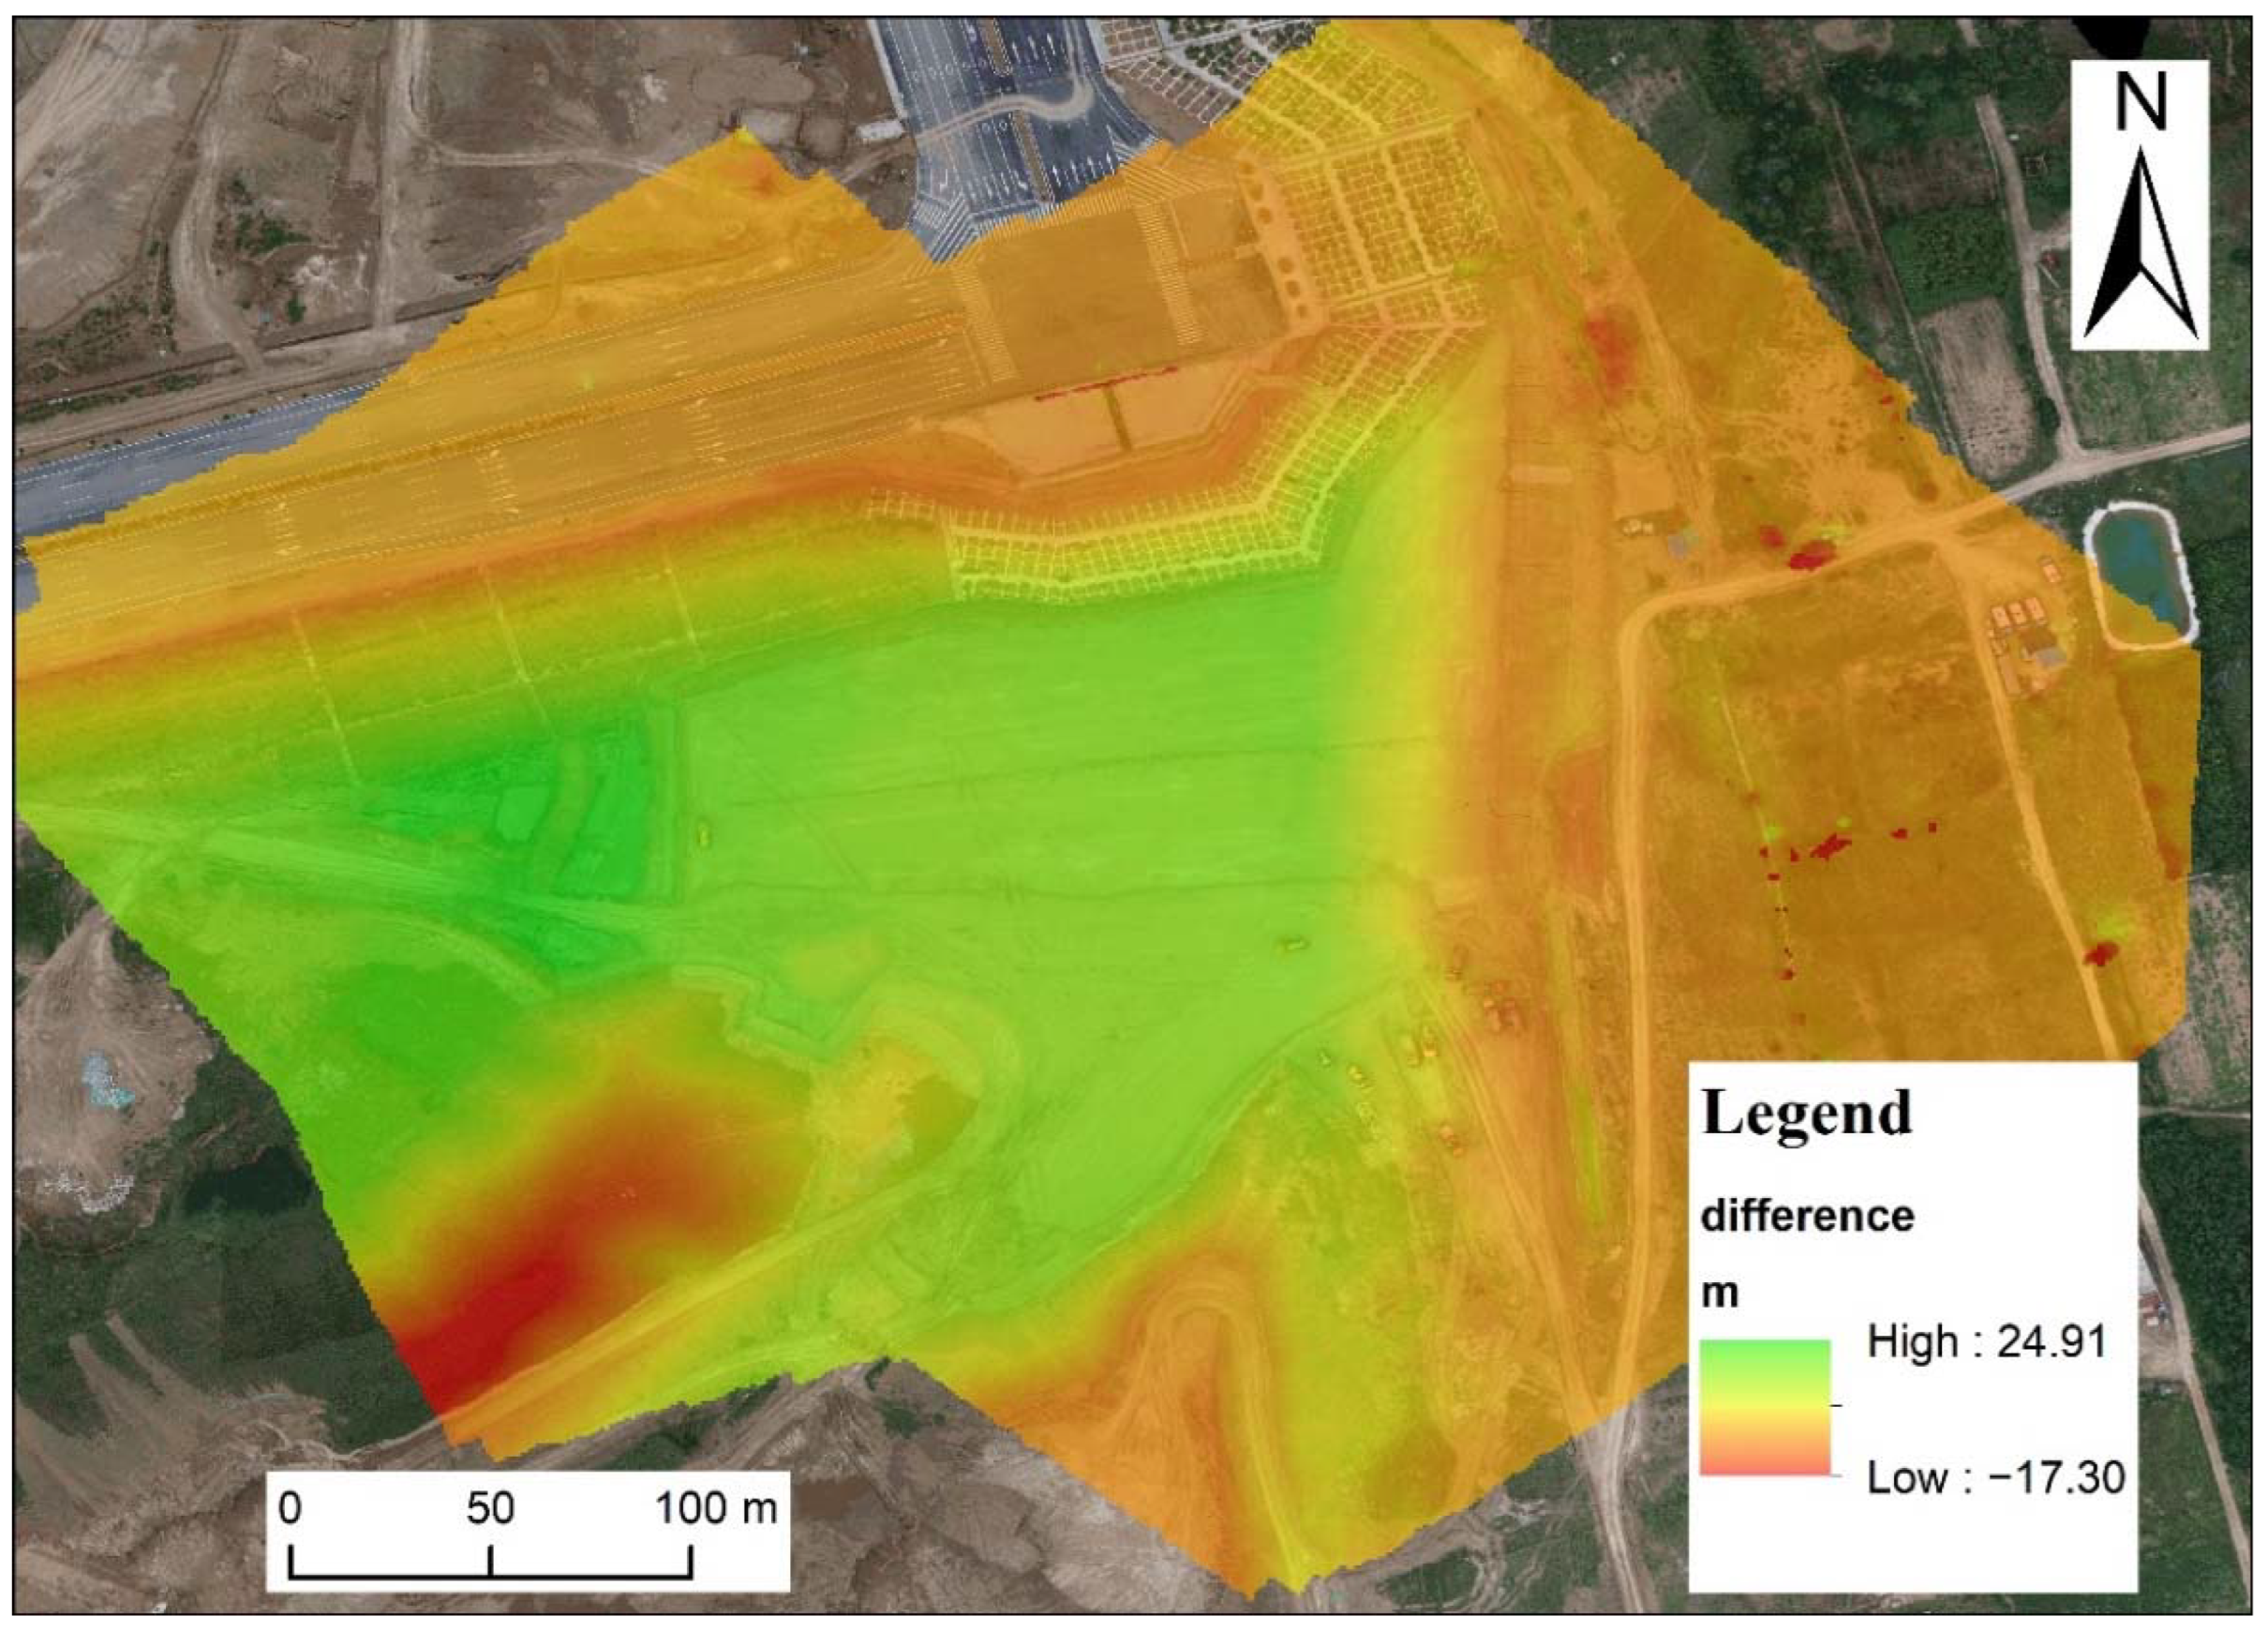
4.1. Surface Monitoring
4.2. Internal Monitoring
5. Discussion
5.1. Effects of Different Compressibilities
5.2. Effects of Different Permeabilities
5.3. Lessons from Monitoring
6. Conclusions
- (1)
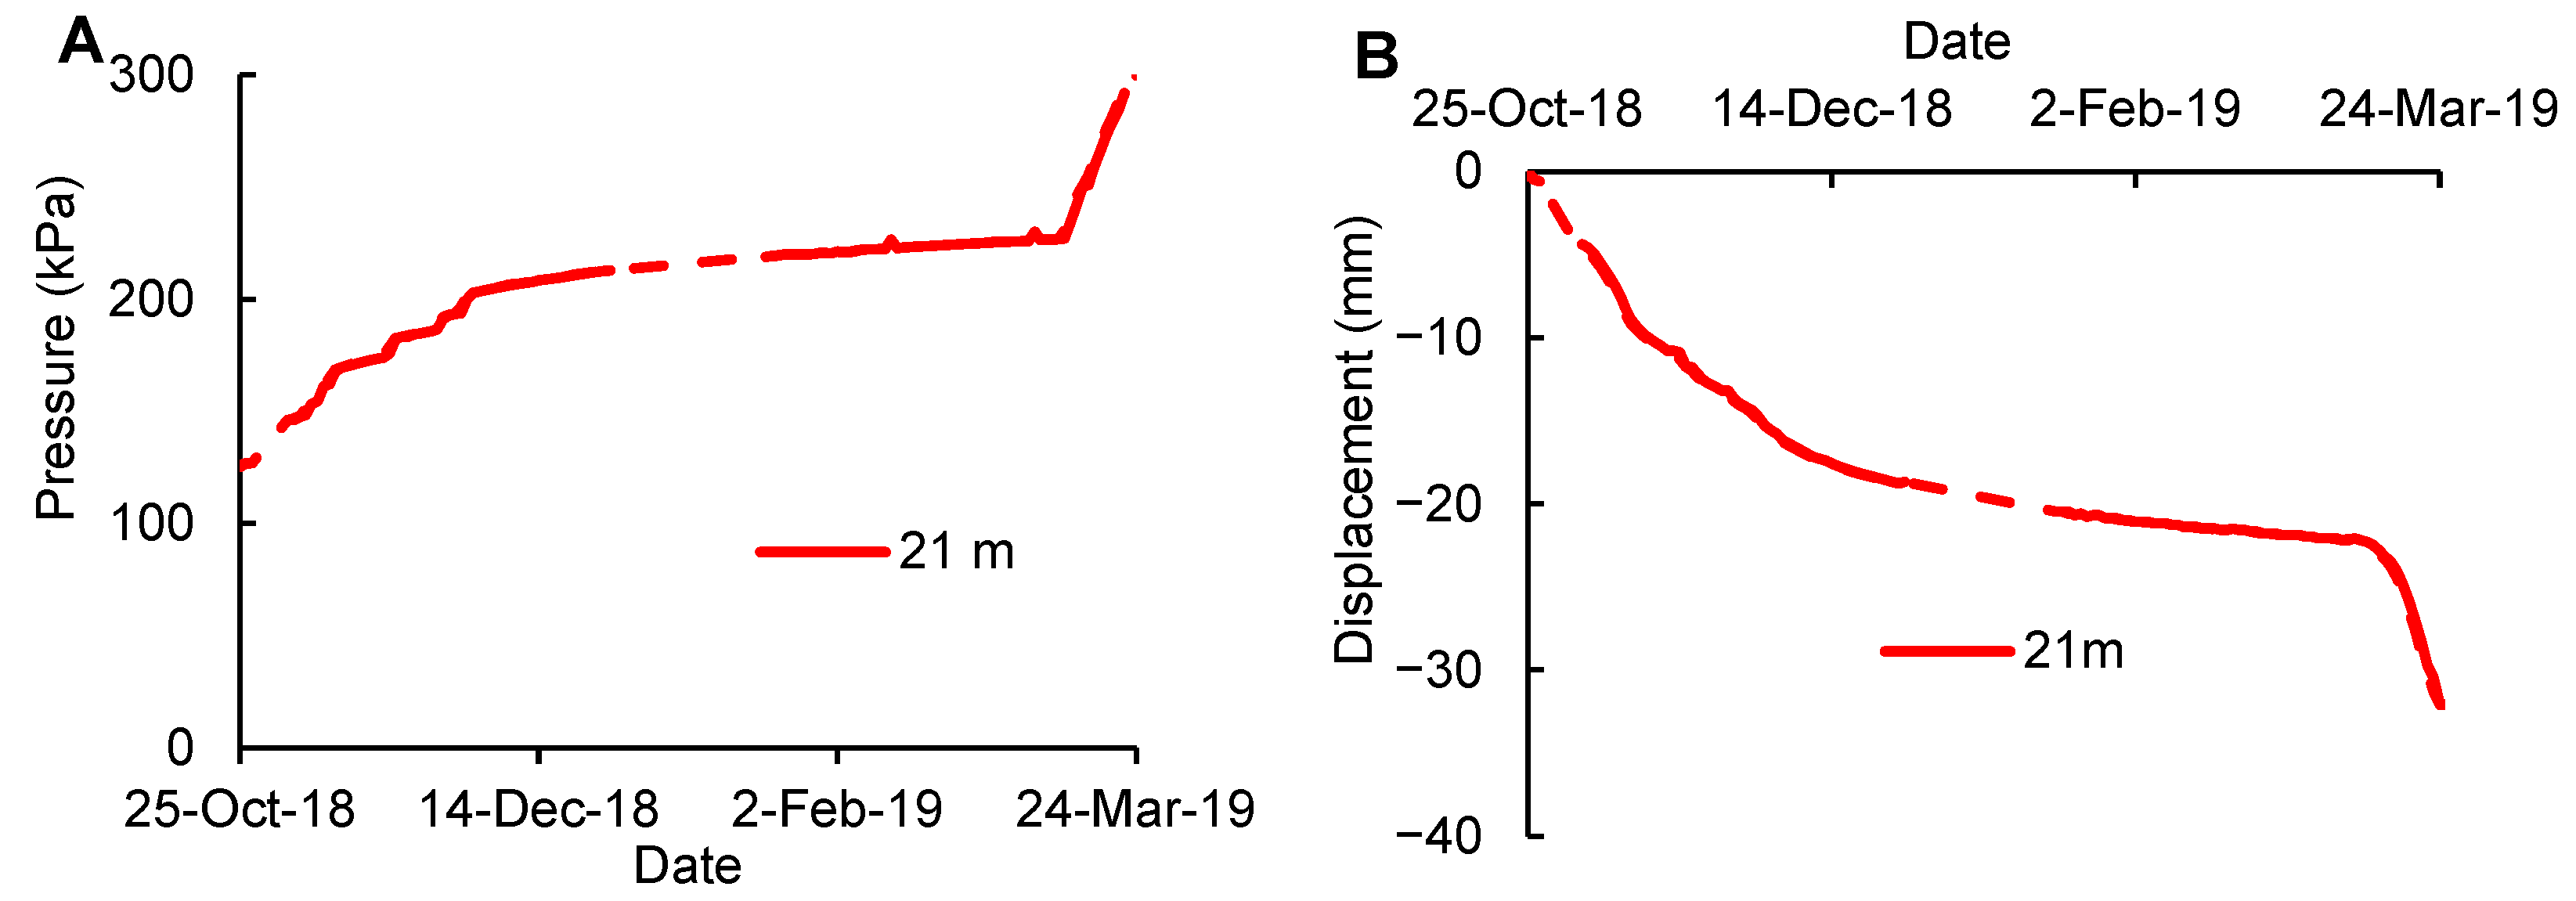
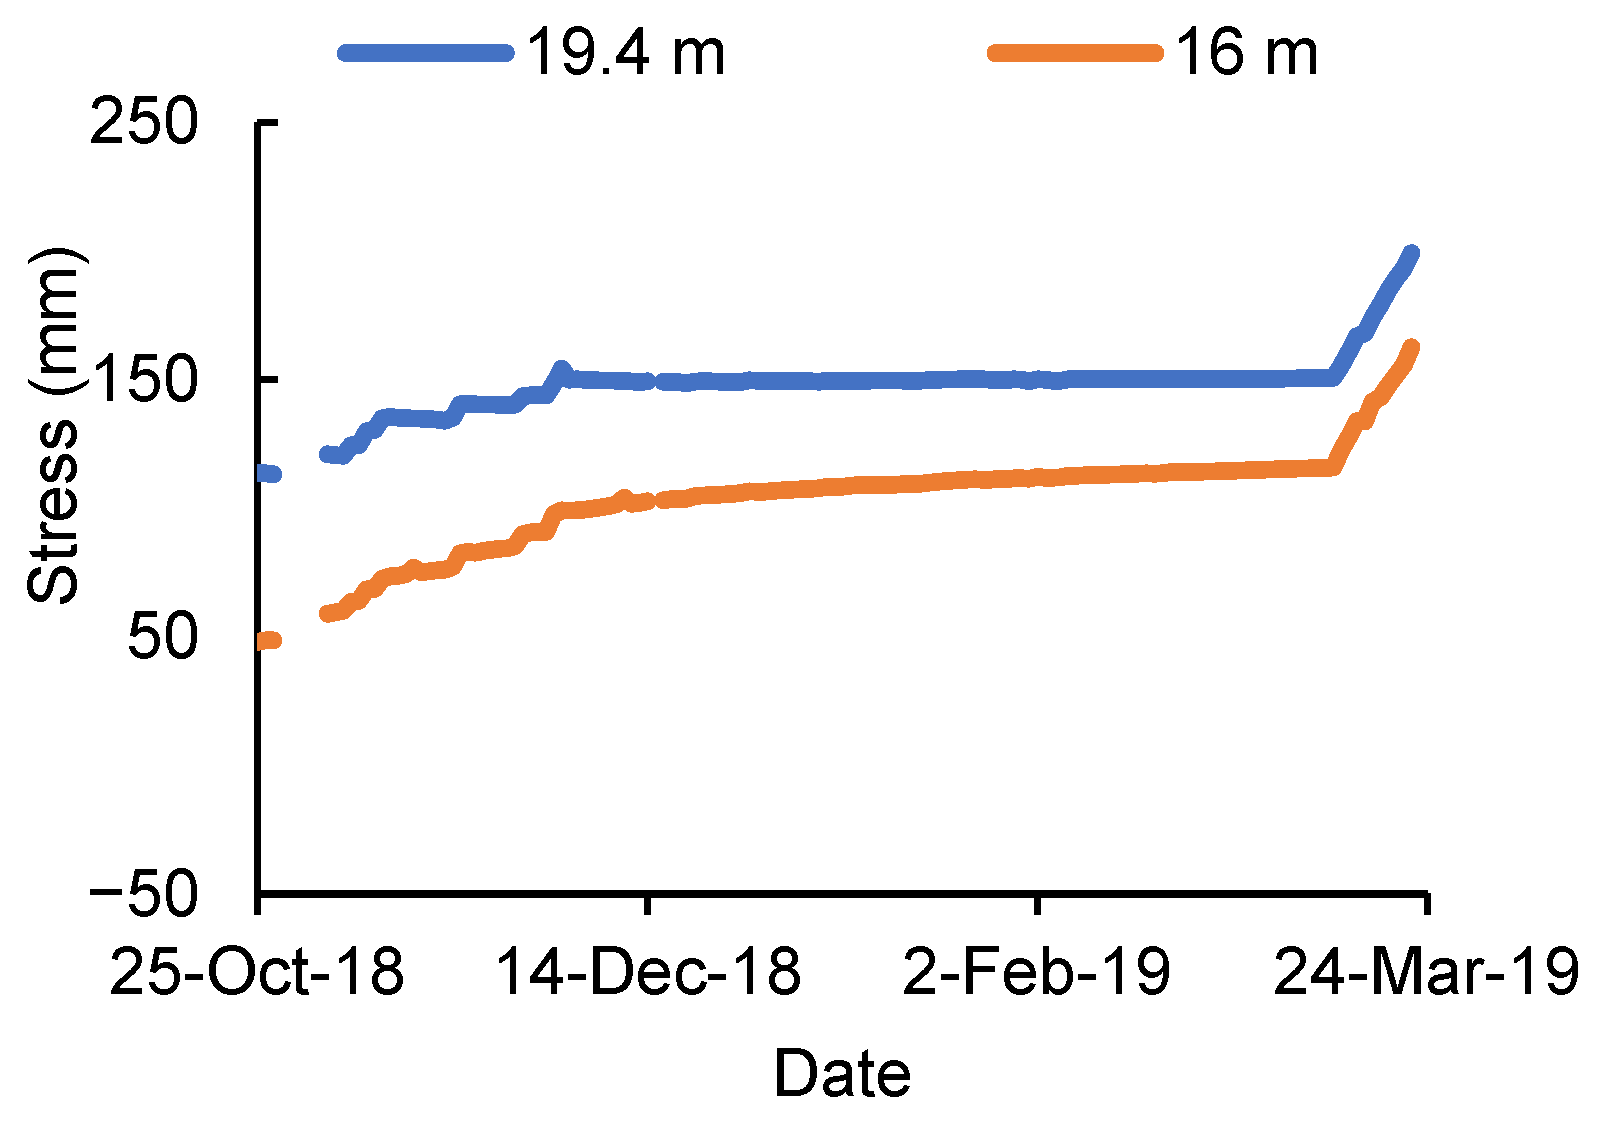
- During the construction, stress and deformation increase rapidly (2.14 kPa/day for vertical stress at 21 m relative to the designed elevation and 0.47 mm/day from 16 m to 21 m relative to the designed elevation). The loess in the filling area is the state of expansion while the state of compression is at the boundary. The deformation and stress have some hysteresis;
- (2)
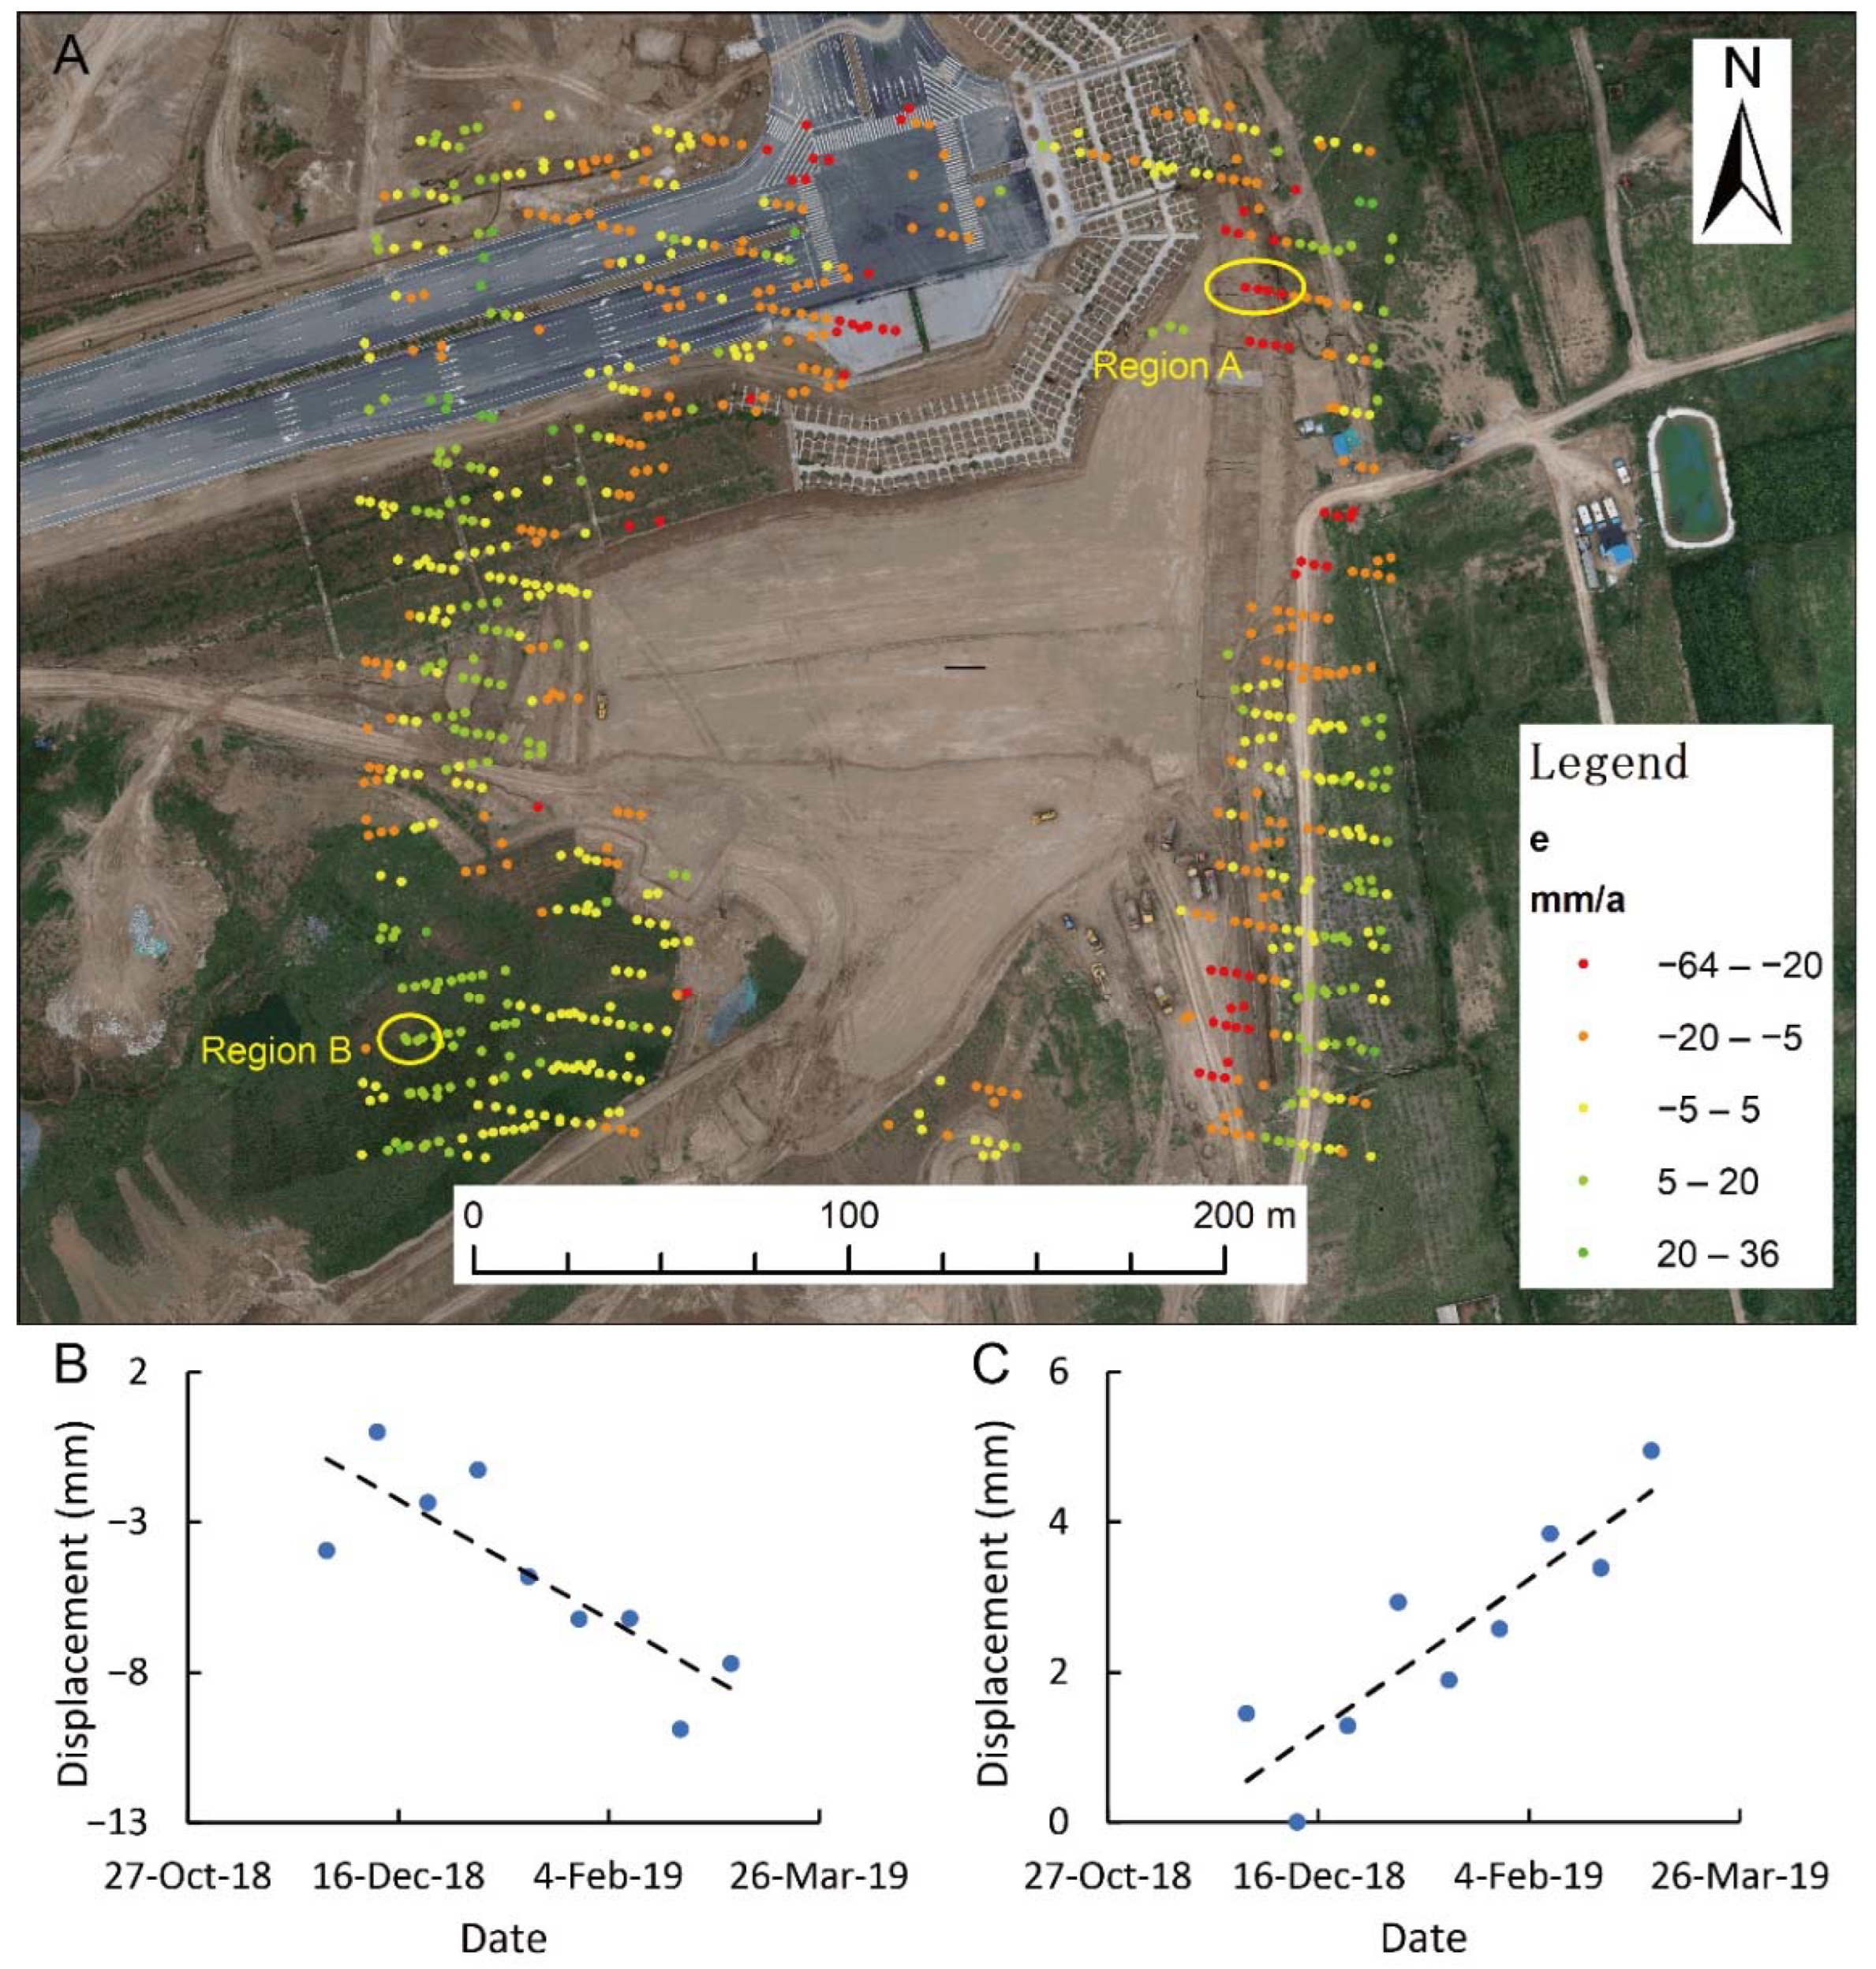
- During winter, the deformations in different regions varied. In the horizontal direction, the excavation area exhibits horizontal movement. Some boundaries appear to cause extrusion deformation in adjacent regions. The high filling boundary moves outward under the force of gravity (the deformation velocity in some areas exceeds 20 mm/a). In the vertical direction, there is an uplift in excavated areas and subsidence in the fill region;
- (3)
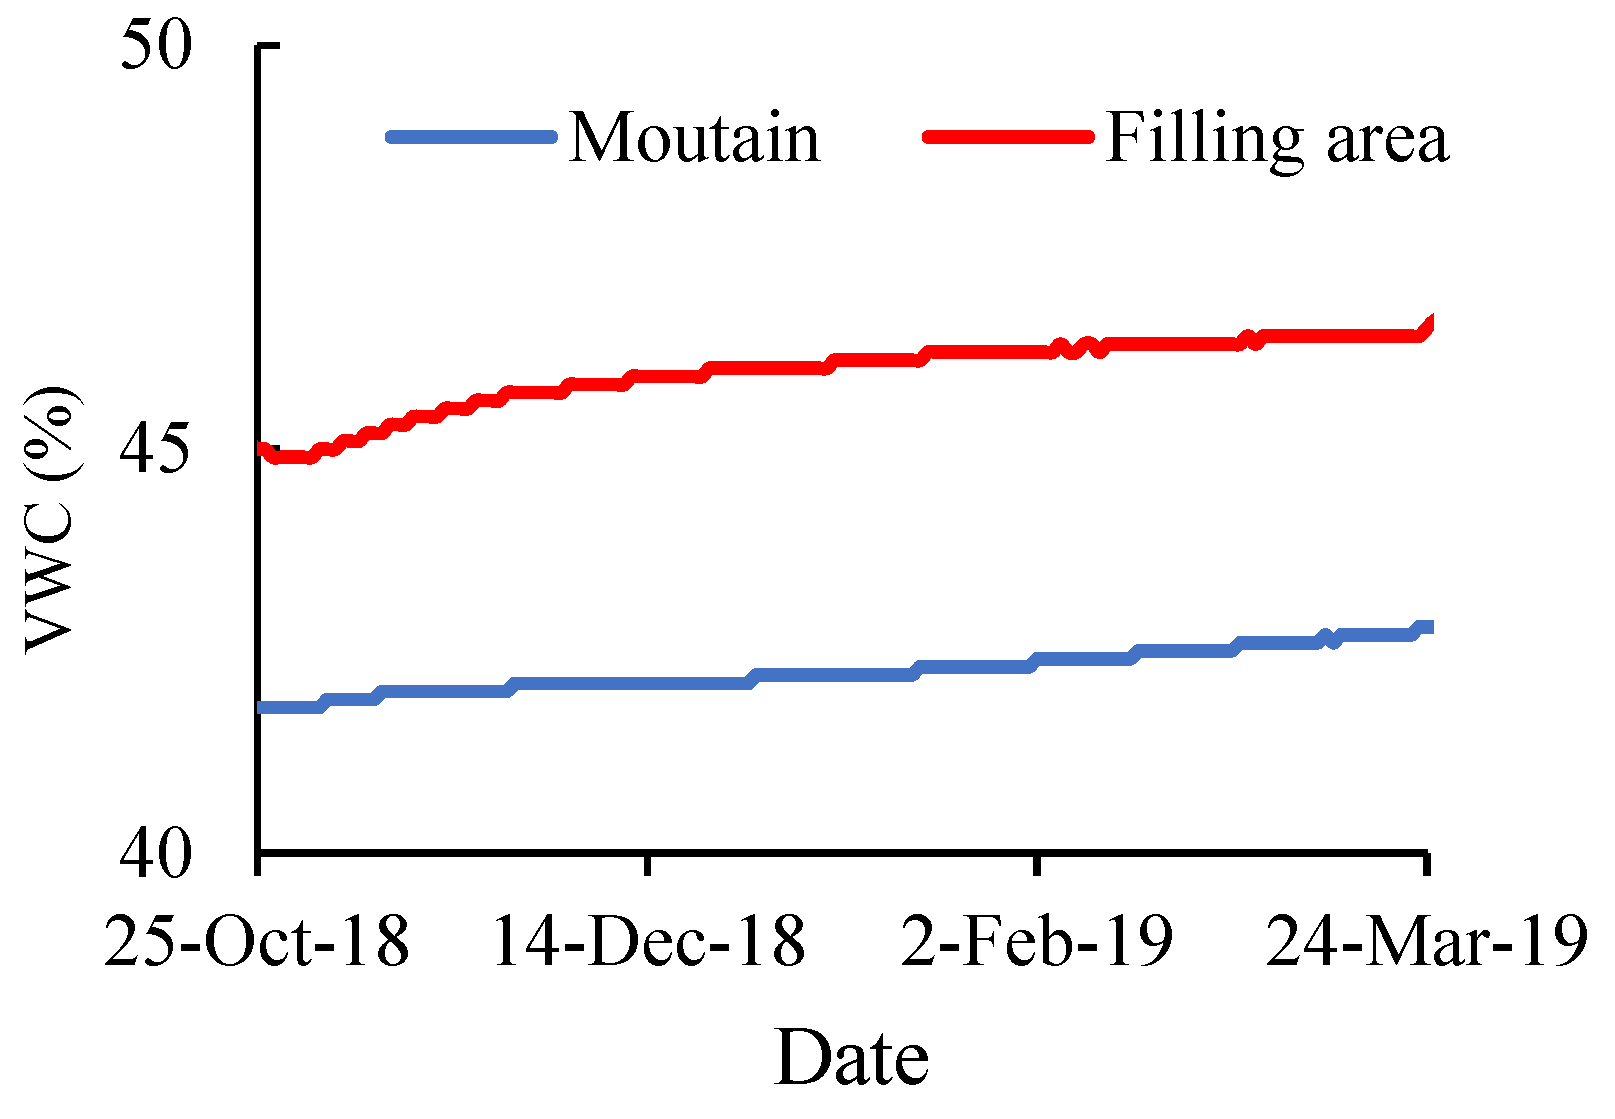
- The water content on both sides of the boundary gradually increases due to the influence of the filling project. Different permeability properties indicate that the boundary area is critical. The filling and excavation processes have impacted the surrounding area;
- (4)
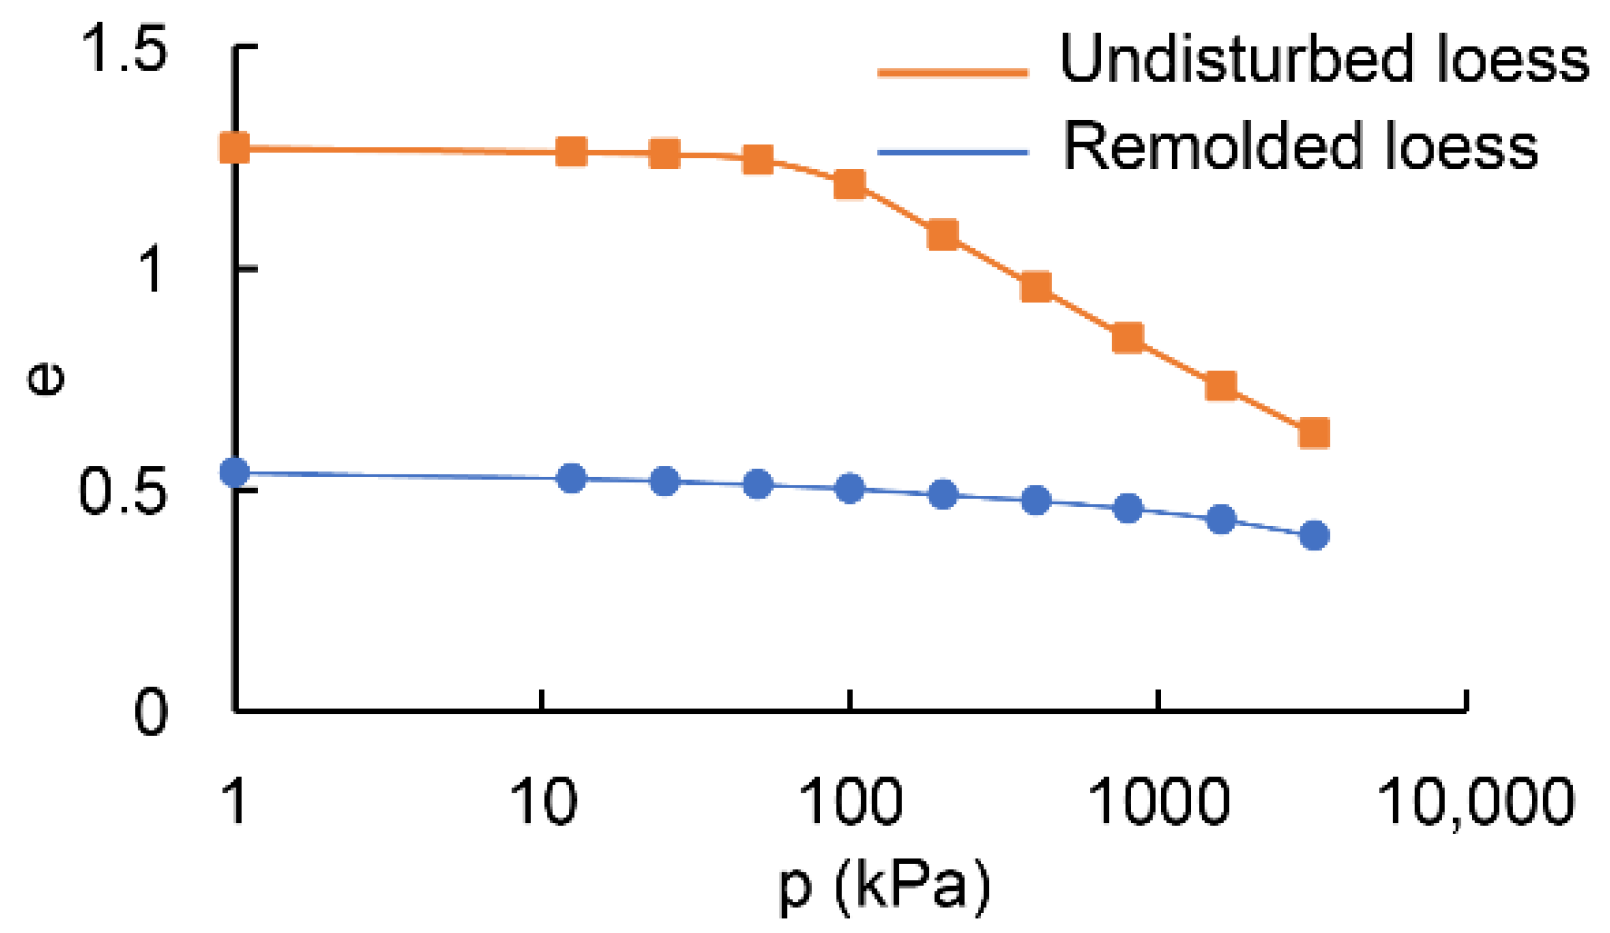
- The compression characteristics of undisturbed loess and remolded loess are different, which is one of the reasons for their different deformation characteristics. At low pressure, the compressibility coefficient of undisturbed loess (0.78 MPa−1) is lower than that of remolded loess (1.13 MPa−1), but at high pressure, the compressibility coefficient of undisturbed loess (0.07 MPa−1) is higher than that of remolded loess (0.02 MPa−1). Different mechanical properties and hydraulic conductivities may trigger differential soil transfer and cause geohazards. It is also necessary to install monitoring equipment to monitor deformation. When abnormal deformations appear, measures should be taken to control them.
Author Contributions
Funding
Institutional Review Board Statement
Informed Consent Statement
Data Availability Statement
Acknowledgments
Conflicts of Interest
References
- Li, Y.; Yang, J.; Hu, X. Origin of ground fissures in the Shanxi Graben System, Northern China. Eng. Geol. 2000, 55, 267–275. [Google Scholar] [CrossRef]
- Juang, C.H.; Dijkstra, T.; Wasowski, J.; Meng, X. Loess geohazards research in China: Advances and challenges for mega engineering projects. Eng. Geol. 2019, 251, 1–10. [Google Scholar] [CrossRef]
- Peng, J.; Qi, S.; Williams, A.; Dijkstra, T.A. Preface to the special issue on “Loess engineering properties and loess geohazards”. Eng. Geol. 2018, 236, 1–3. [Google Scholar] [CrossRef] [Green Version]
- Li, Y.; Li, Y.; Fang, B.; Qu, L.; Wang, C.; Li, W. Land use change and farmers’ sense of place in typical catchment of the Loess hilly and gully region of China. Land 2021, 10, 810. [Google Scholar] [CrossRef]
- Chen, G.; Zhang, Y.; Zeng, R.; Yang, Z.; Chen, X.; Zhao, F.; Meng, X. Detection of Land Subsidence Associated with Land Creation and Rapid Urbanization in the Chinese Loess Plateau Using Time Series InSAR: A Case Study of Lanzhou New District. Remote Sens. 2018, 10, 270. [Google Scholar] [CrossRef] [Green Version]
- Li, P.; Qian, H.; Wu, J. Environment: Accelerate research on land creation. Nature 2014, 510, 29–31. [Google Scholar] [CrossRef]
- Niu, Q.; Bai, J.; Cheng, W.; Dang, X.; Wang, G.; Gao, X.; Wang, Y. Mapping the dynamics of urban land creation from hilltop removing and gully filling Projects in the river-valley city of Lanzhou, China. J. Indian Soc. Remote Sens. 2022, 1–14. [Google Scholar] [CrossRef]
- Liu, Y.; Li, Y. China’s land creation project stands firm. Nature 2014, 511, 410. [Google Scholar] [CrossRef]
- Jin, Z. The creation of farmland by gully filling on the Loess Plateau: A double-edged sword. Environ. Sci. Technol. 2014, 48, 883–884. [Google Scholar] [CrossRef]
- Assallay, A.M.; Rogers, C.D.F.; Smalley, I.J. Formation and collapse of metastable particle packings and open structures in loess deposits. Eng. Geol. 1997, 48, 101–115. [Google Scholar] [CrossRef]
- Barden, L.; McGown, A.; Collins, K. The collapse mechanism in partly saturated soil. Eng. Geol. 1973, 7, 49–60. [Google Scholar] [CrossRef]
- Dijkstra, T.A.; Smalley, I.J.; Rogers, C.D.F. Particle packing in loess deposits and the problem of structure collapse and hydroconsolidation. Eng. Geol. 1995, 40, 49–64. [Google Scholar] [CrossRef]
- Li, P.; Qian, H. Water in loess. In Encyclopedia of Sustainability Science and Technology; Springer: New York, NY, USA, 2018; pp. 1–17. [Google Scholar]
- Wen, B.-P.; Yan, Y.-J. Influence of structure on shear characteristics of the unsaturated loess in Lanzhou, China. Eng. Geol. 2014, 168, 46–58. [Google Scholar] [CrossRef]
- Derbyshire, E.; Dijkstra, T.A.; Smalley, I.J.; Li, Y. Failure mechanisms in loess and the effects of moisture content changes on remoulded strength. Quat. Int. 1994, 24, 5–15. [Google Scholar] [CrossRef]
- Lutenegger, A.J.; Hallberg, G.R. Stability of loess. Eng. Geol. 1988, 25, 247–261. [Google Scholar] [CrossRef]
- Yao, Y.; Wang, R.; Yang, J.; Yue, P.; Lu, D.; Xiao, G.; Wang, Y.; Liu, L. Changes in terrestrial surface dry and wet conditions on the Loess Plateau (China) during the last half century. J. Arid Land 2013, 5, 15–24. [Google Scholar] [CrossRef] [Green Version]
- Meng, X.; Liao, H.; Zhang, J. Infiltration law of water in undisturbed loess and backfill. Water 2020, 12, 2388. [Google Scholar] [CrossRef]
- Fredlund, D.; Gan, J. The collapse mechanism of a soil subjected to one-dimensional loading and wetting. In Genesis and Properties of Collapsible Soils; Springer: Dordrecht, The Netherlands, 1995; pp. 173–205. [Google Scholar]
- Dexter, A.R.; Tanner, D.W. Time Dependence of Compressibility for Remoulded and Undisturbed Soils. J. Soil Sci. 1974, 25, 153–164. [Google Scholar] [CrossRef]
- Shao, S.J.; She, F.T.; Fang, J. Mechanical Behavior of Segmented Lining Structure of Tunnel under Acting Ground Fractures in Xi’an Zone. Adv. Mater. Res. 2011, 261–263, 1778–1783. [Google Scholar] [CrossRef]
- Jiang, M.; Zhang, F.; Hu, H.; Cui, Y.; Peng, J. Structural characterization of natural loess and remolded loess under triaxial tests. Eng. Geol. 2014, 181, 249–260. [Google Scholar] [CrossRef]
- Miao, F.; Wu, Y.; Török, Á.; Li, L.; Xue, Y. Centrifugal model test on a riverine landslide in the Three Gorges Reservoir induced by rainfall and water level fluctuation. Geosci. Front. 2022, 13, 101378. [Google Scholar] [CrossRef]
- Miao, F.; Wu, Y.; Xie, Y.; Li, Y. Prediction of landslide displacement with step-like behavior based on multialgorithm optimization and a support vector regression model. Landslides 2018, 15, 475–488. [Google Scholar] [CrossRef]
- Liu, X.; Zhao, C.; Zhang, Q.; Peng, J.; Zhu, W.; Lu, Z. Multi-Temporal Loess Landslide Inventory Mapping with C-, X- and L-Band SAR Datasets—A Case Study of Heifangtai Loess Landslides, China. Remote Sens. 2018, 10, 1756. [Google Scholar] [CrossRef] [Green Version]
- Shi, X.; Yang, C.; Zhang, L.; Jiang, H.; Liao, M.; Zhang, L.; Liu, X. Mapping and characterizing displacements of active loess slopes along the upstream Yellow River with multi-temporal InSAR datasets. Sci. Total Environ. 2019, 674, 200–210. [Google Scholar] [CrossRef]
- Gray, L. Using multiple RADARSAT InSAR pairs to estimate a full three-dimensional solution for glacial ice movement. Geophys. Res. Lett. 2011, 38, L05502. [Google Scholar] [CrossRef]
- Chen, B.; Gong, H.; Li, X.; Lei, K.; Zhu, L.; Gao, M.; Zhou, C. Characterization and causes of land subsidence in Beijing, China. Int. J. Remote Sens. 2017, 38, 808–826. [Google Scholar] [CrossRef]
- Schlögel, R.; Doubre, C.; Malet, J.-P.; Masson, F. Landslide deformation monitoring with ALOS/PALSAR imagery: A D-InSAR geomorphological interpretation method. Geomorphology 2015, 231, 314–330. [Google Scholar] [CrossRef]
- Zhao, C.; Zhang, Q.; He, Y.; Peng, J.; Yang, C.; Kang, Y. Small-scale loess landslide monitoring with small baseline subsets interferometric synthetic aperture radar technique—Case study of Xingyuan landslide, Shaanxi, China. J. Appl. Remote Sens. 2016, 10, 026030. [Google Scholar] [CrossRef] [Green Version]
- Xue, Y.T.; Meng, X.M.; Li, K.; Chen, G. Loess Slope Instability Assessment Based on PS-InSAR Detected and Spatial Analysis in Lanzhou Region, China. Adv. Mater. Res. 2014, 1065–1069, 2342–2352. [Google Scholar] [CrossRef]
- Zeng, R.Q.; Meng, X.M.; Wasowski, J.; Dijkstra, T.; Bovenga, F.; Xue, Y.T.; Wang, S.Y. Ground instability detection using PS-InSAR in Lanzhou, China. Q. J. Eng. Geol. Hydrogeol. 2014, 47, 307–321. [Google Scholar] [CrossRef] [Green Version]
- Hu, X.; Xue, L.; Yu, Y.; Guo, S.; Cui, Y.; Li, Y.; Qi, S. Remote Sensing Characterization of Mountain Excavation and City Construction in Loess Plateau. Geophys. Res. Lett. 2021, 48, e2021GL095230. [Google Scholar] [CrossRef]
- He, Y.; Chen, Y.; Wang, W.; Yan, H.; Zhang, L.; Liu, T. TS-InSAR analysis for monitoring ground deformation in Lanzhou New District, the loess Plateau of China, from 2017 to 2019. Adv. Space Res. 2021, 67, 1267–1283. [Google Scholar] [CrossRef]
- Wei, Y.; Liu, X.; Zhao, C.; Tomás, R.; Jiang, Z. Observation of Surface Displacement Associated with Rapid Urbanization and Land Creation in Lanzhou, Loess Plateau of China with Sentinel-1 SAR Imagery. Remote Sens. 2021, 13, 3472. [Google Scholar] [CrossRef]
- Wu, Q.; Jia, C.; Chen, S.; Li, H. SBAS-InSAR based deformation detection of urban land, created from mega-scale mountain excavating and valley filling in the Loess Plateau: The case study of Yan’an City. Remote Sens. 2019, 11, 1673. [Google Scholar] [CrossRef] [Green Version]
- Agisoft, L. PhotoScan Python Reference. Release 2016, 1, 63. [Google Scholar]
- Luo, H.; Wu, F.; Chang, J.; Xu, J. Microstructural constraints on geotechnical properties of Malan Loess: A case study from Zhaojiaan landslide in Shaanxi province, China. Eng. Geol. 2018, 236, 60–69. [Google Scholar] [CrossRef]
- Li, Y.; He, S.; Deng, X.; Xu, Y. Characterization of macropore structure of Malan loess in NW China based on 3D pipe models constructed by using computed tomography technology. J. Asian Earth Sci. 2018, 154, 271–279. [Google Scholar] [CrossRef]
- Wei, Y.-N.; Fan, W.; Yu, B.; Deng, L.-S.; Wei, T. Characterization and evolution of three-dimensional microstructure of Malan loess. Catena 2020, 192, 104585. [Google Scholar] [CrossRef]
- Li, Y. A review of shear and tensile strengths of the Malan Loess in China. Eng. Geol. 2018, 236, 4–10. [Google Scholar] [CrossRef]
- Standard, B. Methods of Test for Soils for Civil Engineering Purposes; British Standards Institution: London, UK, 1990; BS1377. [Google Scholar]
- Botey i Bassols, J.; Vàzquez-Suñé, E.; Crosetto, M.; Barra, A.; Gerard, P. D-InSAR monitoring of ground deformation related to the dewatering of construction sites. A case study of Glòries Square, Barcelona. Eng. Geol. 2021, 286, 106041. [Google Scholar] [CrossRef]
- Sousa, J.J.; Ruiz, A.M.; Hanssen, R.F.; Bastos, L.; Gil, A.J.; Galindo-Zaldívar, J.; de Galdeano, C.S. PS-InSAR processing methodologies in the detection of field surface deformation—Study of the Granada basin (Central Betic Cordilleras, southern Spain). J. Geodyn. 2010, 49, 181–189. [Google Scholar] [CrossRef]
- Ferretti, A.; Prati, C.; Rocca, F. Permanent scatterers in SAR interferometry. IEEE Trans. Geosci. Remote Sens. 2001, 39, 8–20. [Google Scholar] [CrossRef]
- Werner, C.; Wegmüller, U.; Strozzi, T.; Wiesmann, A. Gamma SAR and interferometric processing software. In Proceedings of the Ers-Envisat Symposium, Gothenburg, Sweden, 15–20 October 2000; p. 1620. [Google Scholar]
- Perissin, D. SARPROZ Software Manual. 2016. Available online: https://www.sarproz.com (accessed on 12 May 2022).
- Hooper, A.; Spaans, K.; Bekaert, D.; Cuenca, M.C.; Arıkan, M.; Oyen, A. StaMPS/MTI Manual; Delft Institute of Earth Observation and Space Systems Delft University of Technology: Kluyverweg, The Netherlands, 2010; Volume 1, p. 2629. [Google Scholar]
- Hooper, A. A multi-temporal InSAR method incorporating both persistent scatterer and small baseline approaches. Geophys. Res. Lett. 2008, 35, L16302–L16309. [Google Scholar] [CrossRef] [Green Version]
- Hooper, A.; Segall, P.; Zebker, H. Persistent scatterer interferometric synthetic aperture radar for crustal deformation analysis, with application to Volcán Alcedo, Galápagos. J. Geophys. Res. Solid Earth 2007, 112, B07407. [Google Scholar] [CrossRef] [Green Version]
- Zhou, S.; Ouyang, C.; Huang, Y. An InSAR and depth-integrated coupled model for potential landslide hazard assessment. Acta Geotech. 2022, 17, 3613–3632. [Google Scholar] [CrossRef]
- Foumelis, M.; Blasco, J.M.D.; Desnos, Y.-L.; Engdahl, M.; Fernández, D.; Veci, L.; Lu, J.; Wong, C. ESA SNAP-StaMPS integrated processing for Sentinel-1 persistent scatterer interferometry. In Proceedings of the IGARSS 2018—2018 IEEE International Geoscience and Remote Sensing Symposium, Valencia, Spain, 4 November 2018; pp. 1364–1367. [Google Scholar]
- Bayramov, E.; Buchroithner, M.; Kada, M.; Zhuniskenov, Y. Quantitative Assessment of Vertical and Horizontal Deformations Derived by 3D and 2D Decompositions of InSAR Line-of-Sight Measurements to Supplement Industry Surveillance Programs in the Tengiz Oilfield (Kazakhstan). Remote Sens. 2021, 13, 2579. [Google Scholar] [CrossRef]
- Fuhrmann, T.; Garthwaite, M.C. Resolving three-dimensional surface motion with InSAR: Constraints from multi-geometry data fusion. Remote Sens. 2019, 11, 241. [Google Scholar] [CrossRef] [Green Version]
- Aslan, G.; Cakir, Z.; Lasserre, C.; Renard, F. Investigating subsidence in the Bursa Plain, Turkey, using ascending and descending Sentinel-1 satellite data. Remote Sens. 2019, 11, 85. [Google Scholar] [CrossRef] [Green Version]
- Fialko, Y. Interseismic strain accumulation and the earthquake potential on the southern San Andreas fault system. Nature 2006, 441, 968–971. [Google Scholar] [CrossRef]
- Motagh, M.; Shamshiri, R.; Haghighi, M.H.; Wetzel, H.-U.; Akbari, B.; Nahavandchi, H.; Roessner, S.; Arabi, S. Quantifying groundwater exploitation induced subsidence in the Rafsanjan plain, southeastern Iran, using InSAR time-series and in situ measurements. Eng. Geol. 2017, 218, 134–151. [Google Scholar] [CrossRef]
- Pawluszek-Filipiak, K.; Borkowski, A. Integration of DInSAR and SBAS Techniques to determine mining-related deformations using sentinel-1 data: The case study of Rydułtowy mine in Poland. Remote Sens. 2020, 12, 242. [Google Scholar] [CrossRef] [Green Version]
- Yao, Y.; Zhang, Y.; Ma, C.; Zhao, Y.; Lv, G. Study on deformation of filling composite geological body in loess mountainous area. Nat. Hazards 2022, 110, 1469–1493. [Google Scholar] [CrossRef]
- Sowers, G. Compressibility of broken rock and the settlement of rockfills. In Proceedings of the 6th International Conference on Soil Mechanics and Foundation Engineering, Montreal, QC, Canada, 8–15 September 1965; pp. 561–565. [Google Scholar]
- Charles, J. Laboratory compression tests and the deformation of rockfill structures. In Advances in Rockfill Structures; Springer: Dordrecht, The Netherlands, 1990; pp. 73–95. [Google Scholar]
- Charles, J.; Skinner, H. Compressibility of foundation fills. Proc. Inst. Civ. Eng. Geotech. Eng. 2001, 149, 145–157. [Google Scholar] [CrossRef]
- Wu, Y.; Lan, H.; Huang, W. Relationship between wave velocities and water content of unsaturated loess. Chin. J. Geophys. 2021, 64, 3766–3773. [Google Scholar]
- Mei, Y.; Zhou, D.-B.; Hu, C.-M.; Wang, X.-Y.; Zhang, Y.; Xiao, N.; Shi, W. Study on Deformation Characteristics of Loess Ultrahigh-Fill Slope Based on Large-Scale Undisturbed Soil Centrifugal Model Tests. Front. Earth Sci. 2022, 10, 848542. [Google Scholar] [CrossRef]
- Mesri, G.; Funk, J. Settlement of the Kansai international airport islands. J. Geotech. Geoenviron. Eng. 2015, 141, 04014102. [Google Scholar] [CrossRef]
- Carter, M. Methods used to reduce settlements and shorten construction time at Macau international airport. HKIE Trans. 1996, 3, 1–8. [Google Scholar] [CrossRef]
- Bennett, M.J. Subsurface Investigation for Liquefaction Analysis and Piezometer Calibration at Treasure Island Naval Station, California; US Geological Survey: Arcata, CA, USA, 1994; ISSN 2331-1258.


| Quartz | Feldspar | Plagioclase | Calcite | Dolomite | Total Clay |
|---|---|---|---|---|---|
| 35.2 | 10.9 | 24.0 | 11.9 | 7.6 | 10.4 |
| Illite/Smectite | Illite | Kaolinite | Chlorites |
|---|---|---|---|
| 41.0 | 35.0 | 10.0 | 14.0 |
| Type | Remolded Loess | Undisturbed Loess |
|---|---|---|
| Specific gravity | 2.73 | 2.73 |
| Bulk density (g/cm3) | 2.03 | 1.31 |
| Water content (%) | 14.50 | 8.90 |
| Dry density (g/cm3) | 1.80 | 1.20 |
| Void ratio | 0.54 | 1.27 |
| Ascending | Descending | ||
|---|---|---|---|
| No. | Acquisition Date | No. | Acquisition Date |
| 1 | 29 November 2018 | 1 | 29 November 2018 |
| 2 | 11 December 2018 | 2 | 11 December 2018 |
| 3 | 23 December 2018 | 3 | 23 December 2018 |
| 4 | 4 January 2019 | 4 | 4 January 2019 |
| 5 | 16 January 2019 | 5 | 16 January 2019 |
| 6 | 28 January 2019 | 6 | 28 January 2019 |
| 7 | 9 February 2019 | 7 | 9 February 2019 |
| 8 | 21 February 2019 | 8 | 21 February 2019 |
| 9 | 5 March 2019 | 9 | 5 March 2019 |
| Type of Loess | Sample | Permeability Coefficient | Average Permeability Coefficient |
|---|---|---|---|
| Remolded loess | F01 | 2.6 × 10⁻⁵ m/s | 2.3 × 10⁻⁵ m/s |
| F02 | 2.2 × 10⁻⁵ m/s | ||
| F03 | 2.1 × 10⁻⁵ m/s | ||
| Undisturbed loess | W01 | 1.5 × 10⁻⁴ m/s | 1.4 × 10⁻⁴ m/s |
| W02 | 1.4 × 10⁻⁴ m/s | ||
| W03 | 1.3 × 10⁻⁴ m/s |
Publisher’s Note: MDPI stays neutral with regard to jurisdictional claims in published maps and institutional affiliations. |
© 2022 by the authors. Licensee MDPI, Basel, Switzerland. This article is an open access article distributed under the terms and conditions of the Creative Commons Attribution (CC BY) license (https://creativecommons.org/licenses/by/4.0/).
Share and Cite
Wu, Y.; Lan, H. Study on the Deformation of Filling Bodies in a Loess Mountainous Area Based on InSAR and Monitoring Equipment. Land 2022, 11, 1263. https://doi.org/10.3390/land11081263
Wu Y, Lan H. Study on the Deformation of Filling Bodies in a Loess Mountainous Area Based on InSAR and Monitoring Equipment. Land. 2022; 11(8):1263. https://doi.org/10.3390/land11081263
Chicago/Turabian StyleWu, Yuming, and Hengxing Lan. 2022. "Study on the Deformation of Filling Bodies in a Loess Mountainous Area Based on InSAR and Monitoring Equipment" Land 11, no. 8: 1263. https://doi.org/10.3390/land11081263