
Construction and Optimization of Wetland Landscape Ecological Network in Dongying City, China


1
Beijing Key Laboratory of Precision Forestry, Beijing Forestry University, Beijing 100083, China
2
Energy Saving & Environmental Protection & Occupational Safety and Health Research Institute, China Academy of Railway Sciences Corporation Limited, Beijing 100081, China
*
Author to whom correspondence should be addressed.
Land 2022, 11(8), 1226; https://doi.org/10.3390/land11081226
Submission received: 29 June 2022
/
Revised: 28 July 2022
/
Accepted: 31 July 2022
/
Published: 3 August 2022
(This article belongs to the Special Issue Landscape Connectivity: A Comprehensive View from Different Perspectives)
Abstract
:Rapid urbanization has led to deteriorated wetland water quality, reduced biodiversity, and fragmented wetland landscapes, which seriously threaten the sustainable development of regional ecology. Based on land use data of Dongying City, Shandong Province, in 2020, this study selected the landscape disturbance degree and landscape fragility index to construct a landscape ecological risk evaluation model and to analyze the spatial distribution characteristics of landscape ecological risk in Dongying City in 2020. The MSPA-Conefor-MCR model was used to extract the ecological network of wetlands in Dongying City, and the topological structure indices were quantitatively analyzed. Combined with the actual situation within the study area, the source sites to be optimized were identified by risk zoning and source importance; the ecological resistance surface was modified using landscape ecological risk, and the ecological network was optimized by simulating edge increase in order to evaluate the robustness of the ecological network before and after optimization and to verify the edge increase effect. The results show that the ecological risk in Dongying is high, mainly distributed in the central region and extending to the northeast, southeast, southwest, and northwest. A total of 131 ecological source sites (6 core and 125 resting-stone source sites) and 180 ecological corridors were extracted, and the whole ecological network was found to be less stable and to have stronger network heterogeneity using a topological analysis. By simulating 11 additional edges, the robustness of the optimized ecological network was significantly improved. Optimizing the simulated-edge increase can enhance the smoothness of ecological energy flow, which can provide a scientific basis for the construction of the ecological security pattern of wetlands in Dongying City.
1. Introduction
Wetlands are transitional zones between terrestrial and aquatic ecosystems, with unique hydrological, soil, and biological characteristics, and are known as the “kidneys of the earth”. They play important roles in maintaining biodiversity, controlling soil erosion, degrading environmental pollution, and ensuring flood storage and regional ecological security [1]. However, with the rapid development of cities, the excessive pursuit of economic interests by humans has led to the unreasonable use and management of wetland resources, resulting in serious fragmentation of wetland landscapes, large reductions in wetland resources, and significant reductions in wetland functions, which seriously threaten the sustainable development of wetland areas.
Ecological risk assessment is a tool for evaluating the negative effects of the interactions of landscape patterns and ecological processes under the influence of one or more stressors [2,3,4]. The study of landscape ecological risk assessment originated in the 1980s, and it has gradually become an important research area in ecology and environmental science after decades of development research [5,6]. Through the in-depth study of evaluation theories and methods, the research objects, landscape ecological risks follow the hotspots of regional ecological risks, mainly concentrated in watersheds [7], cities [8], mining areas [9], nature reserves [10], etc. However, with an emphasis on the synergistic development of ecological environment and social economy, areas with fragile habitats that are extremely responsive to global climate change, such as wetlands, agro-pastoral interlacing zones, and desert oasis areas, are gradually becoming a focus of landscape ecological risk research [11,12,13]. In terms of research methods, most studies are based on two approaches: risk source-sink theory or landscape pattern indices [14]. Early studies evaluating ecological risk mostly adopted methods based on risk source and sink, following the basic paradigm of risk source identification-receptor analysis-exposure and hazard evaluation [15,16]. However, with the complexity and diversity of risk sources and receptors, such an evaluation system has the problem of multiple risk superposition. Some scholars approach landscape ecological risk evaluation in terms of the vulnerability of landscape patterns and resistance to external disturbances [17], focusing on the number of landscape elements, landscape combinations, and landscape functions. This paper selects landscape patterns to identify the spatial distribution of ecological risk areas in Dongying City, dividing the evaluation units and constructing a landscape ecological risk index to provide a theoretical basis for formulating risk mitigation policies and optimizing resource allocation.
Ecological networks are based on the theoretical foundation of landscape ecology, integrating island biogeography and infiltration theory to organize scattered landscape patches into a network form in order to maximize the maintenance of ecological processes such as material, energy, and information flow of species between patches [18]. In addition, invasive species can also spread rapidly in ecological networks and disrupt the balance of regional ecosystems, so ecological networks are gradually becoming a research topic for domestic and foreign scholars. Ecological networks were first proposed in the 1980s, and after decades of research, they have been developed into the ecological source site identification-ecological corridor extraction model. In terms of identification, ecological source sites have mostly been identified by the comprehensive factor evaluation method [19,20], or areas with high ecosystem service value have been selected as ecological source sites, which is more subjective and ignores the connectivity among source sites. In recent years, morphological spatial pattern analysis (MSPA) has provided new ideas for the identification of ecological source sites, solving the problems of subjective selection of sites and unrealistic evaluation results [21]. In the extraction of ecological corridors, most studies have used the minimum cumulative resistance model, current theory, and graph theory to simulate ecological corridors, among which the minimum cumulative resistance (MCR) surface model is the most widely used; it can extract the lowest-cost path between source sites by integrating various factors such as landscape type, vegetation index, and topographic slope [22]. In this paper, based on the MSPA and Conefor models with GIS geographic analysis, we screened core and resting-stone ecological source sites; constructed ecological resistance surfaces based on landscape type, vegetation index, and terrain slope; and simulated ecological corridors for species migration and dispersal by the MCR model.
Most of the research is aimed at constructing regional ecological networks, but neglects to optimize them, which makes it difficult to maintain the long-term stability of their structures under the influence of various factors. Therefore, how to construct and optimize ecological networks scientifically has become a topic of concern for scholars at home and abroad. Models such as landscape pattern index, gravity model, and landscape graph theory-connectivity index can quantitatively evaluate the network structure according to the strength of patch interactions and propose corresponding optimization strategies [23,24]. Although these methods can perform simple optimization of ecological networks, they do not take into account how ecological processes accompanying ecological flows between landscapes occur and ignore the functional characteristics of ecological networks. Based on this, scholars have introduced the idea of complex systems science and applied complex network models to reveal the ecological processes of material, energy, and information flows in ecological networks [25], systematically evaluate the structure and function of networks, and propose corresponding optimization strategies based on them. However, most of the optimization strategies are only theoretical and do not consider the spatial distribution and vulnerability of specific landscape components. In this study, the spatial distribution of ecological risks in the landscape and the topological nature of ecological networks are taken into account, specific and effective ecological network optimization strategies are proposed, and the stability of ecological networks before and after optimization is evaluated based on these complex system ideas.
The objectives of this research paper were as follows: (i) to assess and analyze the spatial distribution of landscape ecological risks in Dongying City; (ii) to construct a wetland ecological network using the MSPA-Conefor-MCR model and analyze the spatial topological characteristics of the wetland ecological network; (iii) to identify source sites to be optimized based on a comprehensive evaluation of identified risk zoning and topological indicators, and carry out simulated edge-increasing optimization of the ecological network using the landscape ecological risk optimization MCR model; and (iv) to compare the robustness of the connectivity and restoration of the wetland ecological network before and after optimization and validate the optimization results.
2. Materials and Methods
2.1. Study Area
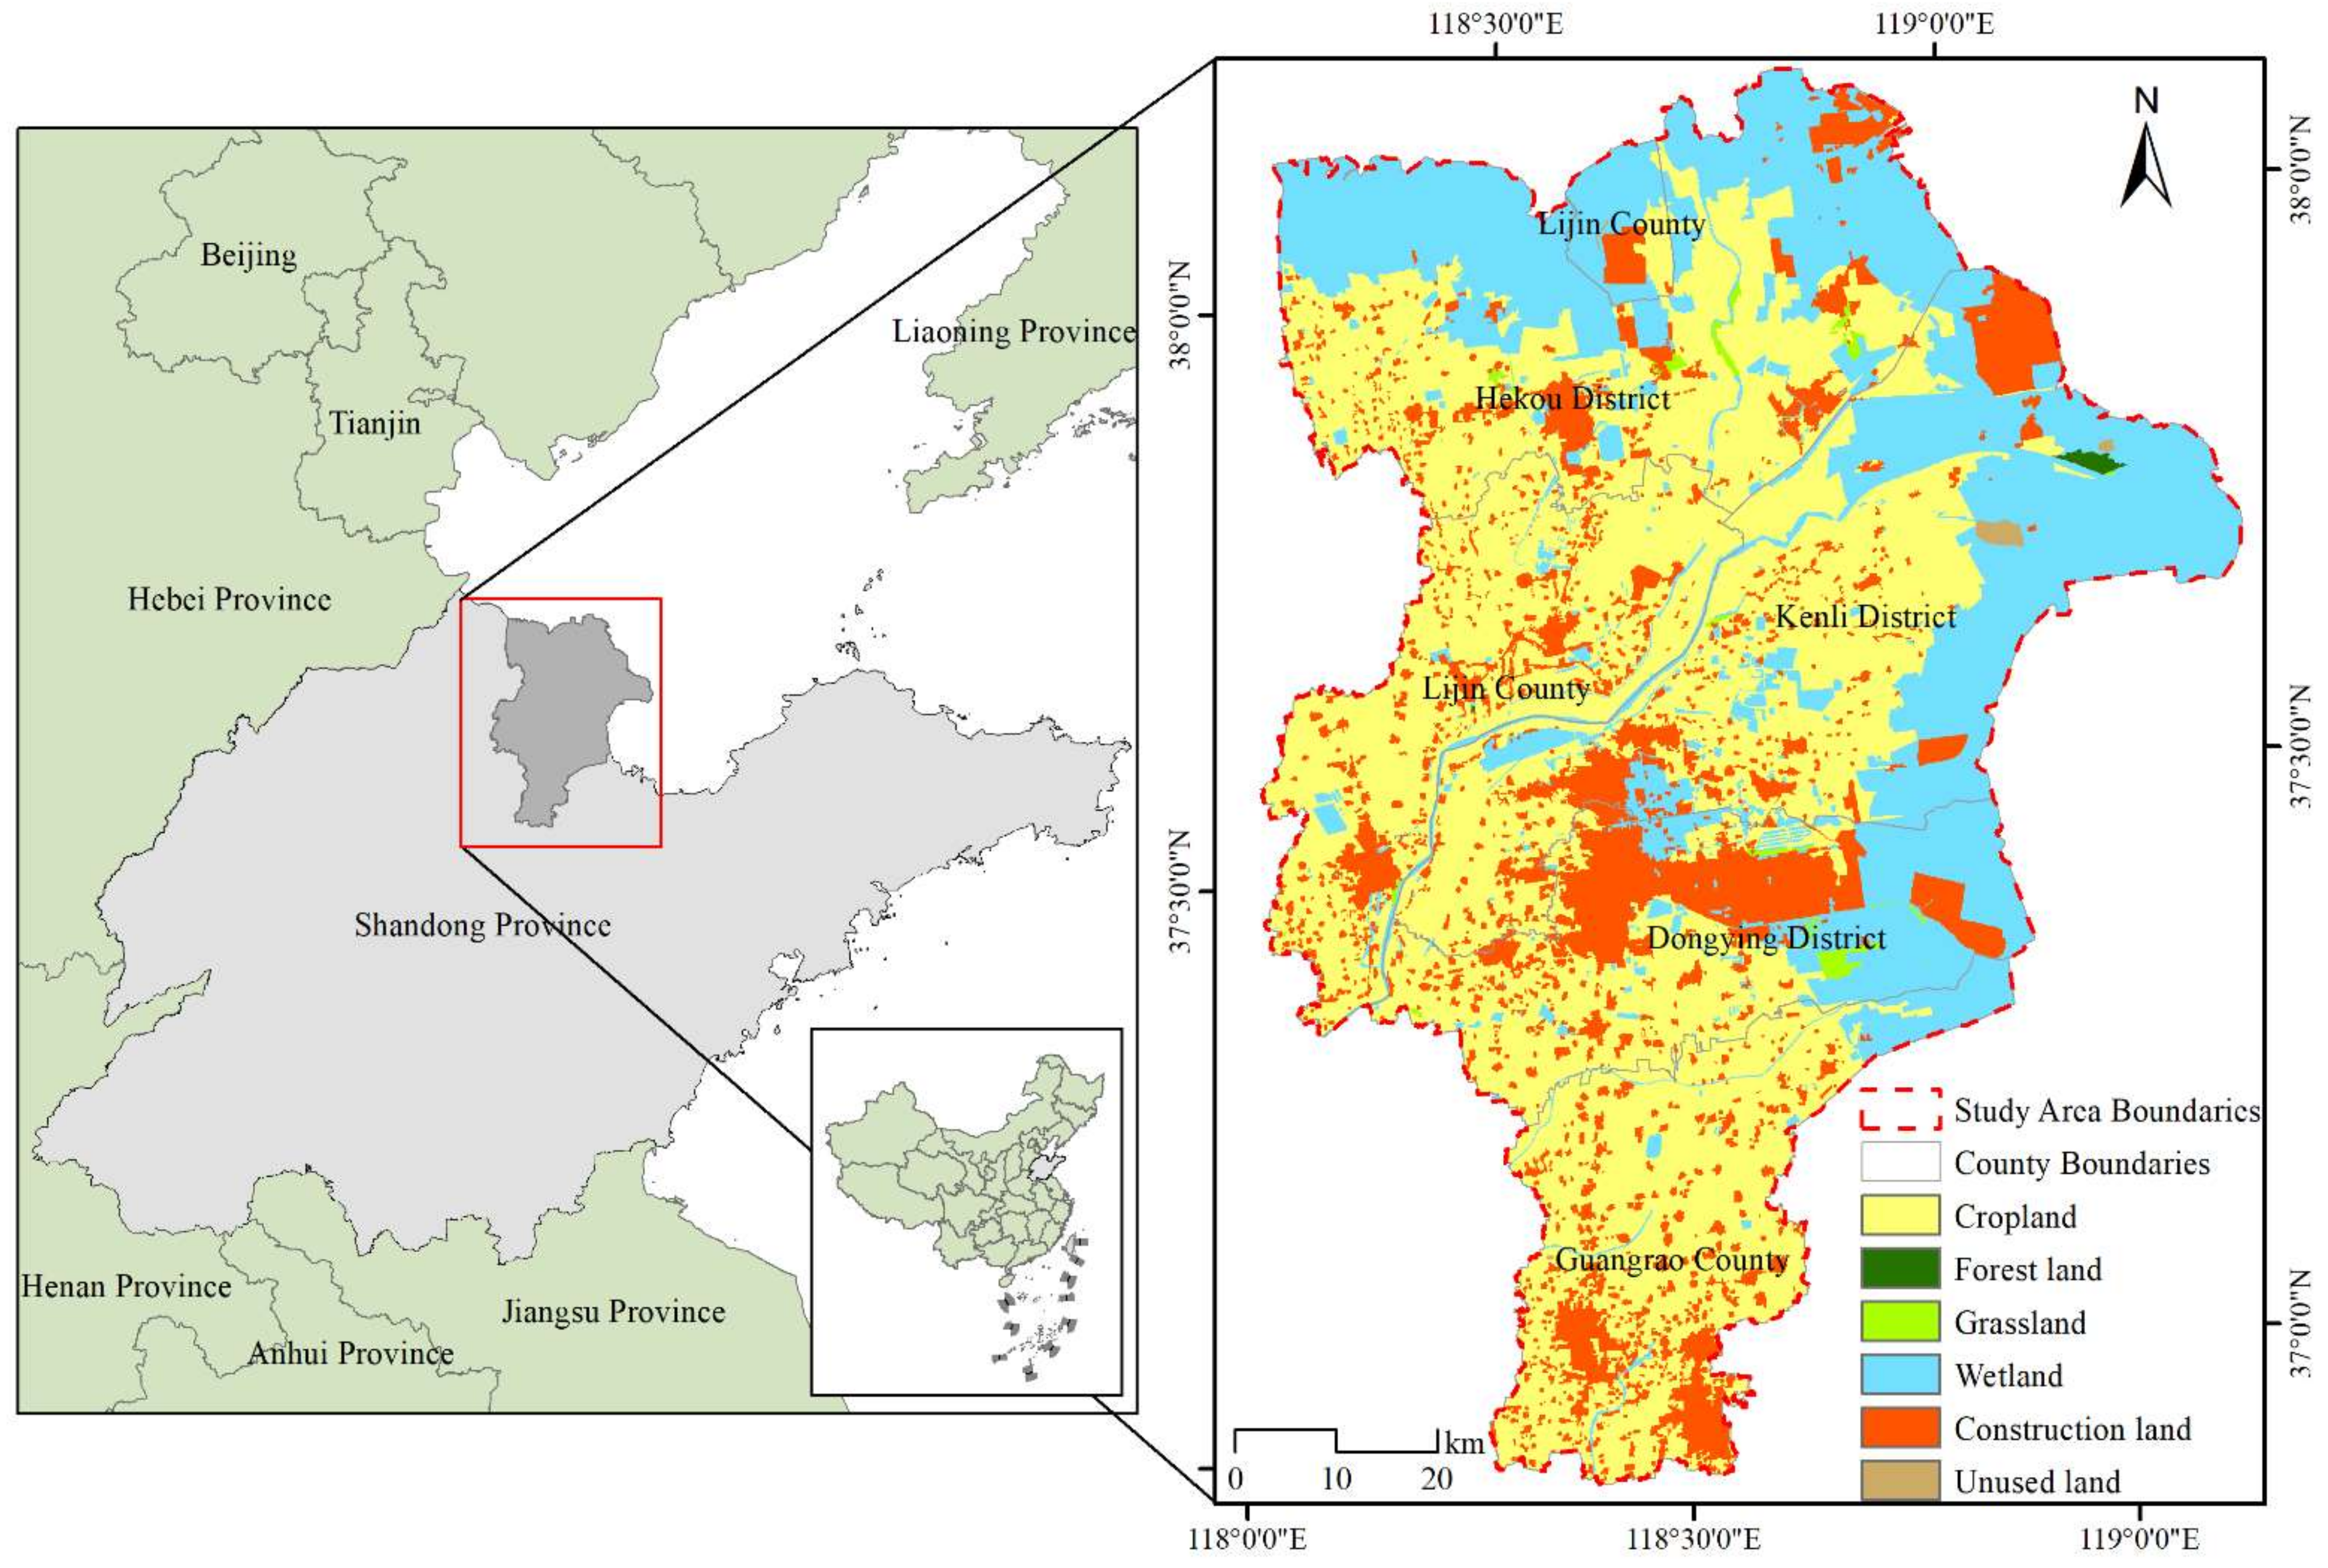
Dongying City is located in the delta area of the Yellow River estuary in the north of Shandong Province, eastern China (36°55′–38°10′ N, 118°07′–119°10′ E), and is the only city in the province to be included in the two national “yellow and blue” strategies (Figure 1). The city has 5 districts (Dongying, Hekou, Guangrao, Lijin, and Kenli) with a total area of 8243 km2. The city has four distinct seasons, with cold winters and hot summers, an average annual temperature of 12.8 °C, and a frost-free period of about 200 days, allowing crops to mature in 2 years. The average annual precipitation is 555.9 mm, mostly concentrated in summer, and the region belongs to the temperate continental monsoon climate. The topography is high in the southwest and low in the northeast. The surface water system in the area consists of a dozen large rivers, including the Yellow, Zhimai, Guangli, and Overflow Rivers; most of them discharge into the sea and are used with low efficiency. There are no zonal vegetation types in the area that are affected by moisture, soil salinity, or human activities, and there are few vegetation types and a simple structure. As the central city of the Yellow River Delta, Dongying is one of the richest cities in Shandong Province in terms of wetland resources, with offshore, coastal, river, lake, marsh, and artificial wetlands. The wetland areas account for a quarter of the wetland resources in the province and are among the major wetland resource gathering areas in China.
2.2. Data Sources
The data used for the study include the following: 30 m resolution land-use data of Dongying City from 2020, provided by the Resource and Environment Science and Data Center of the Chinese Academy of Sciences (https://www.resdc.cn/ accessed on 20 April 2022), covering 6 primary types—cropland, forest land, grassland, water, construction land (including urban and rural, industrial and mining, and residential), and unused land—and 25 secondary types, among which (taking into account the purpose of the study and the actual situation of the study area) are paddy fields, canals, reservoirs, lakes, rivers, and swamps classified as wetland, reclassified as cropland, forest land, grassland, wetland, construction land, and unused land; slope data obtained from DEM data provided by the geospatial data cloud platform (http://www.gsclod.cn/ accessed on 20 April 2022) and processed by ArcGIS, with a spatial resolution of 30 m; and Normalized Difference Vegetation Index (NDVI) data obtained by Google Earth Engine after pre-processing the USGS Landsat 8 surface reflectance tier 1 dataset between June and September 2020, with a spatial resolution of 30 m.
2.3. Methods
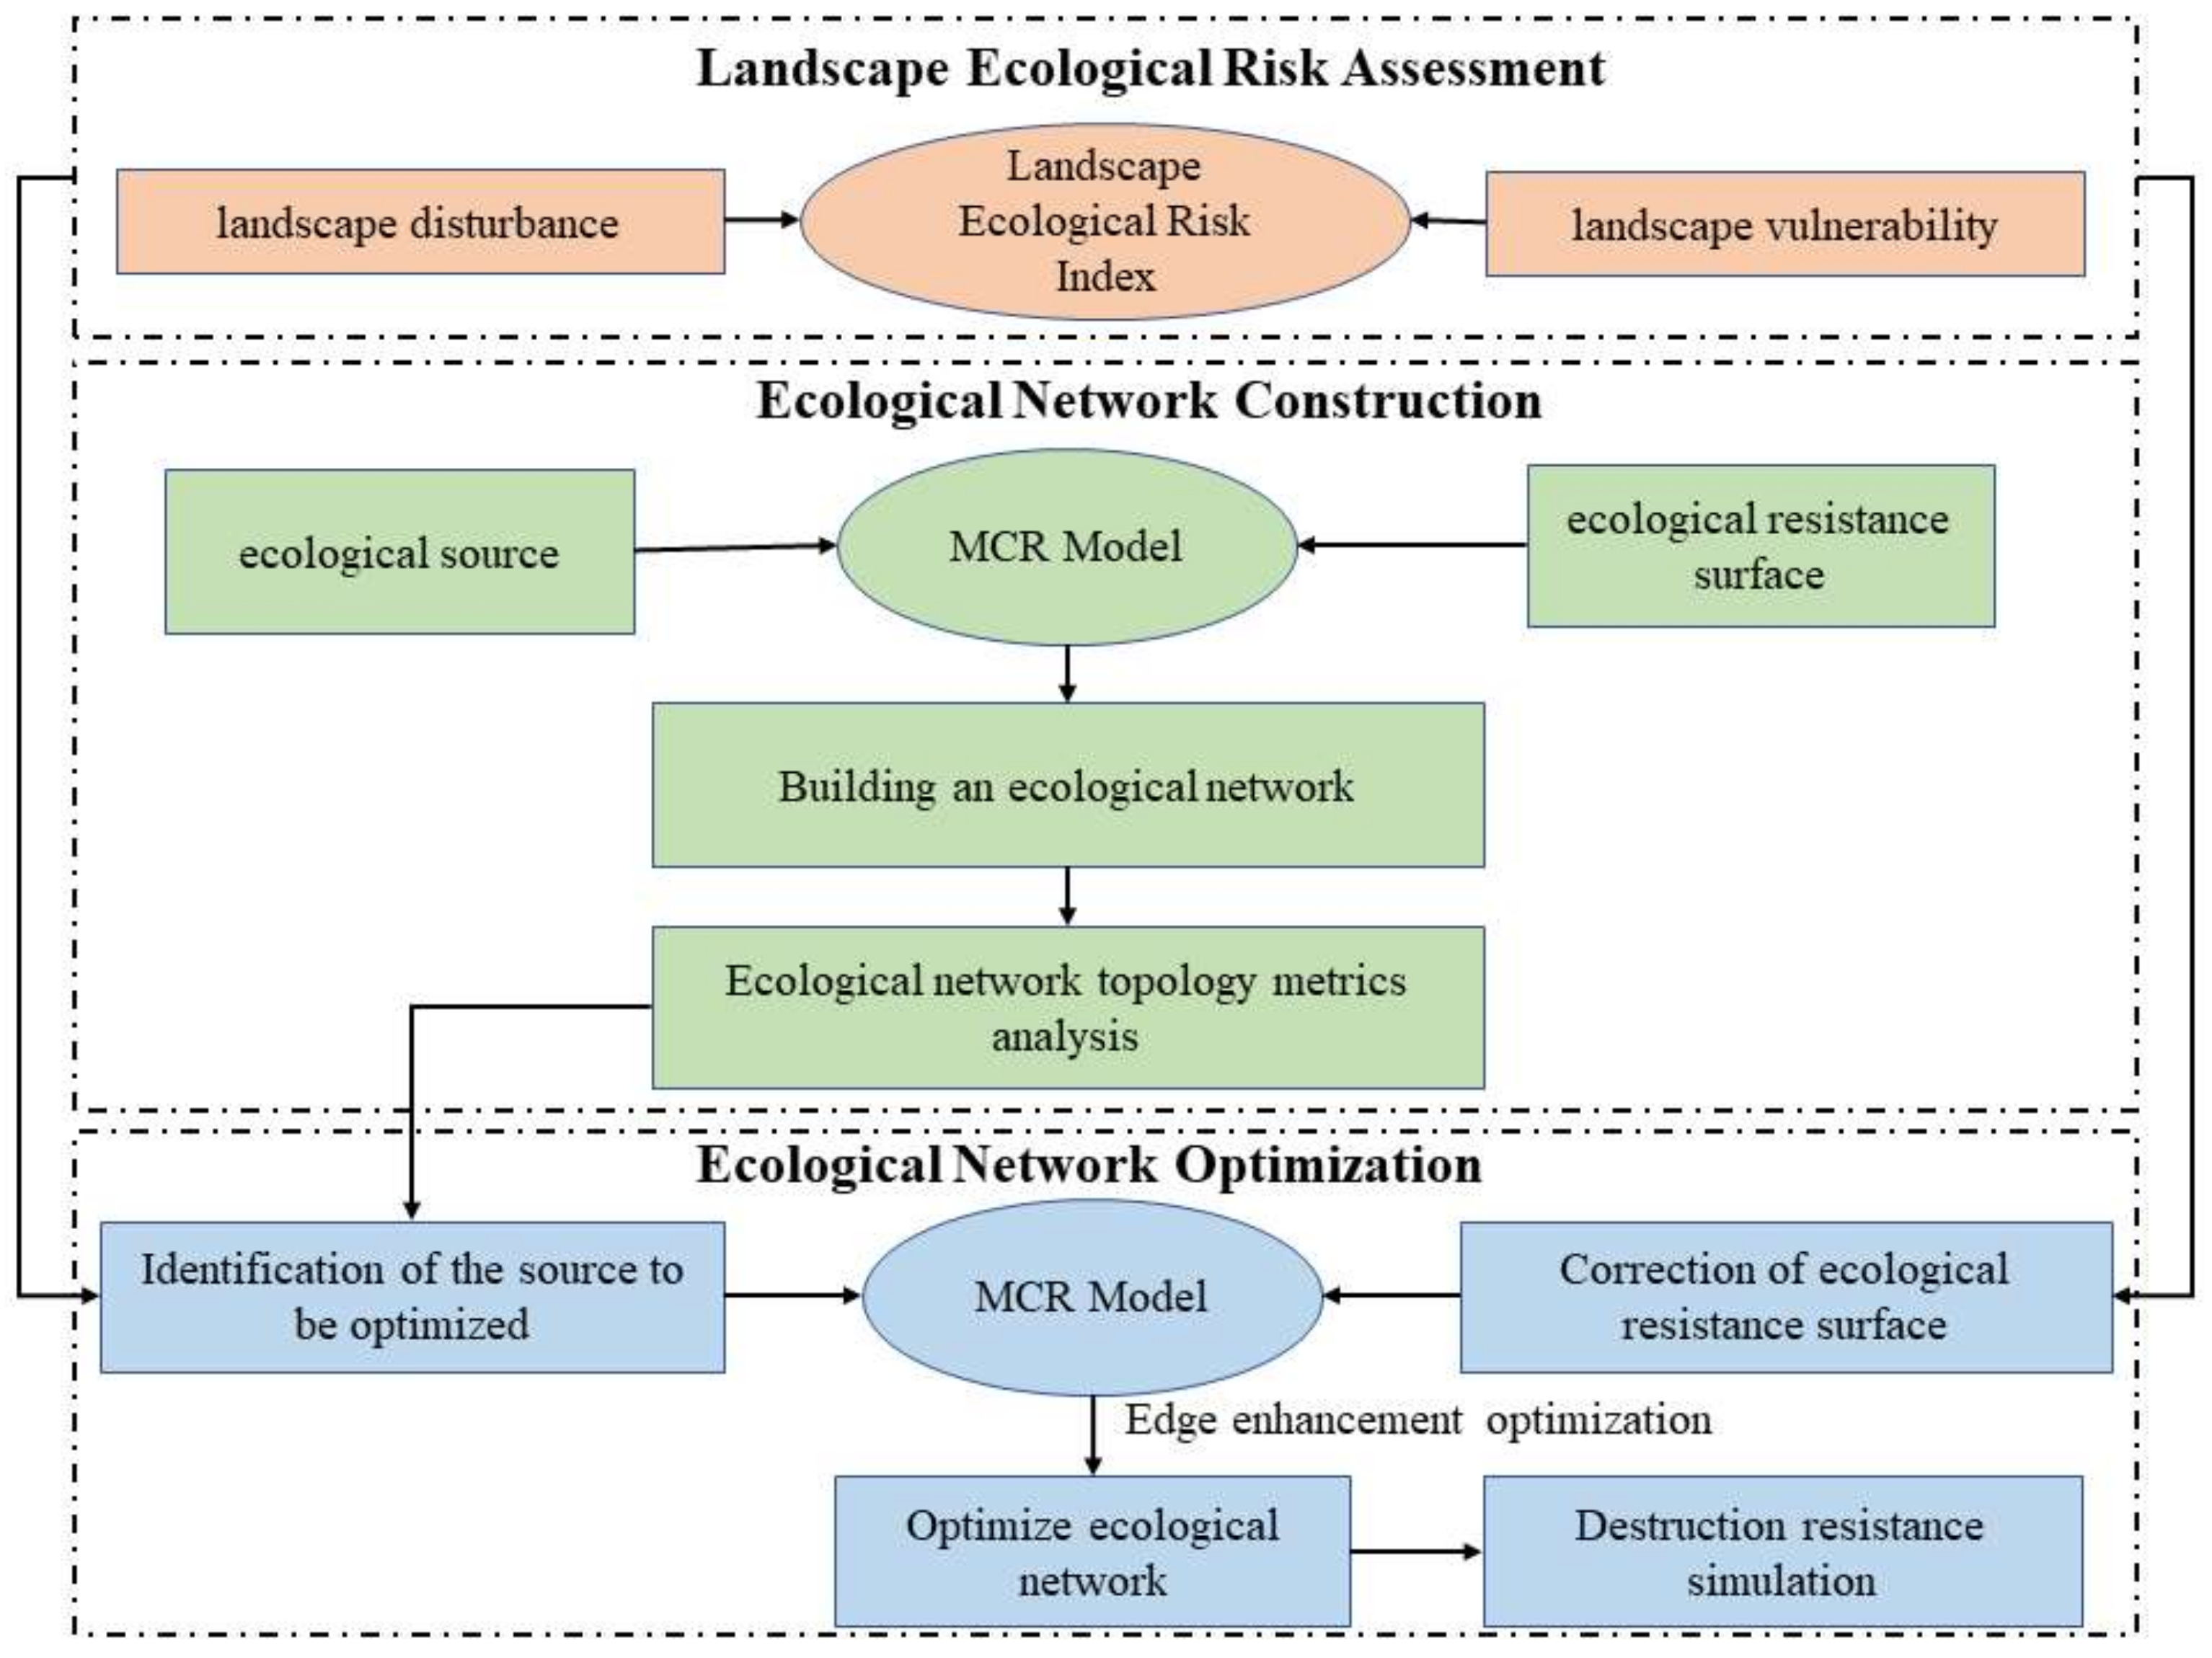
The methodological framework of this paper, shown in Figure 2, was divided into 3 main parts. The first part, landscapeecological risk analysis, involved calculating the degrees of landscape disturbance and vulnerability. In the second part, ecological network construction, ecological source sites and resistance surfaces were identified and calculated, then used as input data for the MCR model to extract ecological corridors and construct the ecological network of wetlands in Dongying, then complete the analysis of network topology. In the third part, key source sites were identified based on the landscape ecological risk results and network topology indicators; in addition, the ecological resistance surface was revised using the landscape ecological risk results, the network edge augmentation was completed based on the MCR model, and the damage resistance simulation test was performed. The detailed process of each part is presented in the following sections.
2.3.1. Constructing a Landscape Ecological Risk Model
Different landscape patterns have different levels of resilience to ecological risks. In order to investigate the relationship between landscape ecological risk and landscape patterns and present risk in a quantitative manner in space, a landscape ecological risk model [4] was constructed using the cumulative multiplication of landscape loss and probability paradigm, with the following methodological framework.
- 1.
- Dividing ecological assessment units
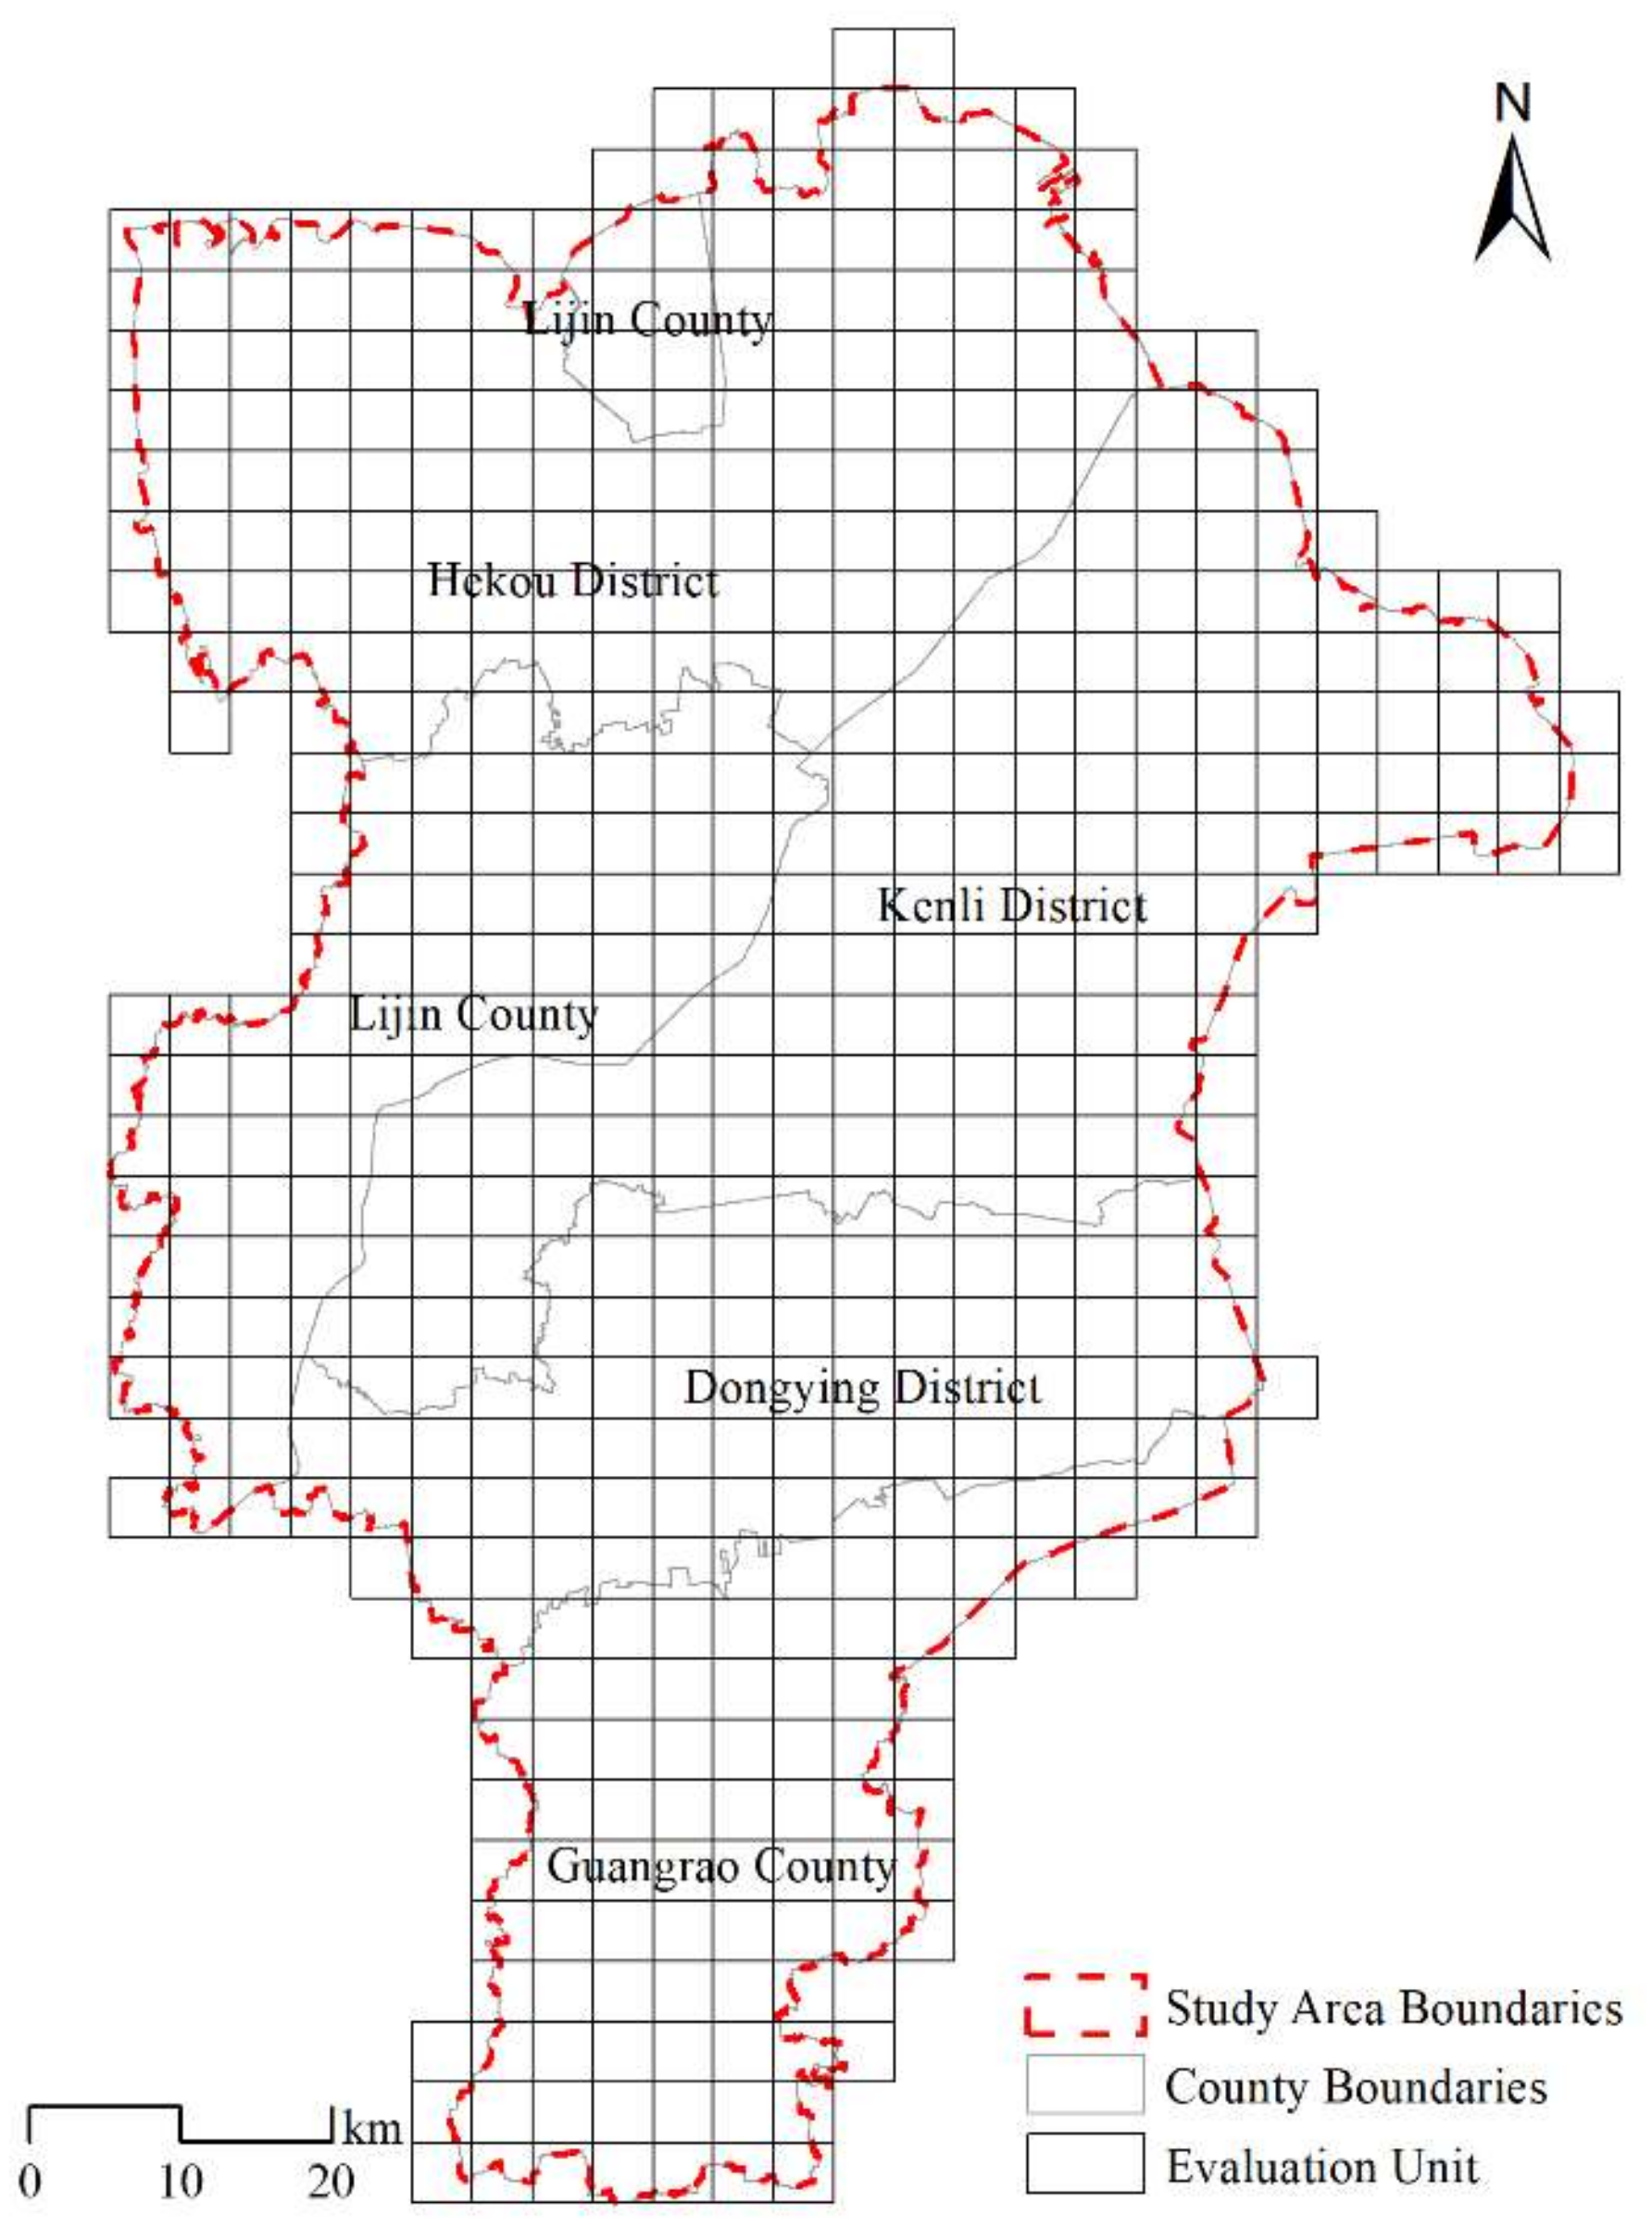
In order to spatialize the landscape ecological risk index, we combined the studies of Xie and Li et al., and set the ecological evaluation cells at 2–5 times the average area of the patches [26,27]. We used ArcGIS to create a fishing net tool to divide Dongying City into a 4 × 4 km grid with a total of 542 evaluation cells (Figure 3).
- 2.
- Constructing a landscape ecological risk model
Landscape ecological risk refers to the cumulative consequences of the interaction of landscape patterns and ecological processes when the ecosystem is disturbed by natural and human factors. Taking the Dongying City area as the landscape as a whole, 6 types of land use were considered at the regional scale: cropland, forest land, grassland, wetland, construction land, and unused land. Based on a previous study [28], the landscape disturbance and fragility indices were calculated using Fragstats 4.2 software (Amherst, USA) to construct a landscape ecological risk model.
where denotes the landscape type, denotes the area of landscape type in the th evaluation unit, denotes the area of the th evaluation unit, denotes the landscape disturbance index, and denotes the landscape fragility index. The formulae and parameters of the landscape disturbance and fragility indices are shown in Table 1.
The landscape ecological risk index of each evaluation unit was calculated by kriging interpolation, and the risk values were classified into 5 classes according to the natural breakpoint method: low ecological risk area (0.31–0.38], sub-low ecological risk area (0.38–0.42], medium ecological risk area (0.412–0.45], sub-high ecological risk area (0.45–0.49], and high ecological risk area (0.49–0.56].
2.3.2. Wetland Ecological Network Extraction
- 1.
- Wetland ecological source site identification
MSPA is a method of analyzing raster image elements based on mathematical morphology, emphasizing structural connectivity [32], and the studied landscape types can be classified into 7 mutually exclusive geometric types at the image element level: core, bridge, edge, perforation, islet, loop, or branch. Taking the core area as the study object, overall connectivity (IIC) and possible connectivity (PC) were used to indicate the landscape connectivity level of regional patches, and the ecological source sites in the study area were identified by calculating the patch importance index (dPC) [33]; Conefor software was used to conduct connectivity analysis of the landscape to identify ecological source sites. Ecological source sites with dPC ≥ 1 were selected as core source sites according to the actual situation in the study area, and those within 10 km and 1 ≤ dPC ≤ 0.01 were used as resting-stone source sites.
where denotes the number of core patches, and denote the area of patches and , denotes the number of connections between patches and , denotes the total landscape area of the study area, denotes the maximum product of the probabilities of all paths between patches and , and indicates the possible connectivity index of the remaining patches after removing a certain patch.
- 2.
- Wetland ecological network extraction based on MCR model
The minimum cumulative resistance (MCR) surface model is commonly used for simulating ecological corridors; it can simulate the best path for species to reach the target source site from the outgoing source site through landscapes with different resistance levels. The integrated resistance-factor evaluation method was used to construct resistance surfaces (Table 2) [34,35]. Using hierarchical analysis, weights of 0.59, 0.24, and 0.15 were calculated for landscape type, vegetation index, and topographic slope, respectively, to obtain the ecological resistance surface. Ecological source sites and resistance surfaces were used as input data for the MCR model, and ecological corridors from each source site to other source sites were constructed using the cost-path module in ArcGIS to construct an ecological network of wetlands in Dongying City.
where denotes the minimum cumulative resistance value, denotes the minimum cumulative resistance positively correlated with ecological processes, is the spatial distance from source site to spatial cell , and denotes the resistance coefficient of spatial cell to ecological processes. is the number of source sites, and denotes the number of resistance surface grids.
2.3.3. Wetland Ecological Network Topology Index Analysis
Determining the topology of complex networks is an important way to understand the nature and function of complex systems, and an ecological network, as a typical complex network [36], can express specific functions without relying on nodes or edges at specific spatial locations. The ecological network is abstracted as a kind of undirected and unweighted complex network, and the topological structure features, such as degree and degree-degree correlation, mediator, eigenvector centrality, kernel number, and connectivity, are selected for evaluation.
- 1.
- Ecological network node topology
- (1)
- Degree and degree-degree correlation
In a complex network, degree is defined as the number of edges directly connected to node ; the larger the value, the more important the node. Complex networks can be classified according to the distribution of degrees as scale-free, completely random, or completely regular [37]. The degree-degree correlation is based on the degree of the network nodes, and the possibility of connecting the nodes is considered from the network structure. The congruence coefficient is a degree-based Pearson correlation coefficient. When > 0, it indicates that nodes with large degree tend to connect to nodes with large degree, and when < 0, it indicates that nodes with large degree tend to connect to nodes with small degree [38].
- (2)
- Point-betweenness
Point-betweenness is a global variable that can reflect the role and influence of a corresponding node in the whole network, and it has strong practical significance [39]. In an ecological network; larger point-betweenness means there are more short est paths and more ecological energy flowing through the point.
where is the number of shortest paths between nodes and (), and is the number of shortest paths between nodes and that pass through node .
- (3)
- Eigenvector centrality
Eigenvector centrality considers the importance of neighboring nodes along with the importance of the node itself. It is suitable for describing the long-term influence of nodes over time [40]. Commonly used methods for calculating eigenvector centrality include the HITS and PageRank algorithms. Both algorithms use the idea of random wandering, but compared to HITS, PageRank has the advantages of a more stable structure and higher efficiency. This paper calculates the feature vector centrality of each node in the ecological network based on the PageRank algorithm.
- 2.
- Ecological network linkage topology
- (1)
- Number of cores
The number of cores of a graph make up a subgraph after repeatedly removing nodes with degree less than k and their connectivity, and the number of nodes in that subgraph indicates the size of the kernel. The number of kernels can indicate the depth of nodes in the kernel. The maximum number of kernels corresponds to the most central position of the network structure, and the strong connectivity between its nodes and the number of kernels can reveal the hierarchical characteristics of the network.
- (2)
- Connectivity
In a complex network, connectivity refers to the possibility of connecting any two nodes in the network and can describe the efficiency of information transfer in the network as a whole. The higher the connectivity between ecological source sites, the higher the energy flux in the ecological network and the more stable the structure. The principle of network connectivity is as follows:
where: denotes the set of corridors of ecological network , denotes the true subset of , and denotes the number of connected branches of the subgraph obtained by deleting set of ecological source sites in ecological network .
- (3)
- Edge-betweenness
Edge-betweenness is similar to point-betweenness; it is the proportion of all shortest paths in a network that pass through an edge, describing the importance of the edge in the overall network. In an ecological network, edge-betweenness can accurately reflect the importance of an ecological corridor.
where denotes the number of shortest paths between nodes and , and denotes the number of shortest paths between nodes and that pass through edge .
2.3.4. Ecological Network Resilience Simulation
Removing or attacking certain nodes or edges in a complex network can cause some degree of disruption to the network connectivity, and robustness is a measure of the ability of the attacked network to maintain its functionality [41]. In general, attacks are classified as random or malicious; the former refers to the random removal of nodes and the latter to the priority removal of nodes with large degree. Robustness can be classified as connectivity or recovery robustness; the former refers to the connective ability of the ecological network to maintain normal structure and function, and the latter to the ability of the network structure to recover after being damaged.
where denotes node connectivity robustness, denotes the number of nodes in the maximum connected subgraph of the network after node removal, denotes the total number of nodes, denotes the number of nodes removed, denotes the recovery robustness of the node, denotes the number of nodes recovered under a particular strategy, denotes the recovery robustness of an edge, denotes the number of edges removed, denotes the number of edges recovered under a particular strategy, and expresses the number of edges in the initial network.
2.3.5. Ecological Network Optimization
Ecological network optimization needs to follow scientific theories and methods, and optimization based on structural and functional coupling needs to follow the principles of ecology, landscape continuity, and key source sites focused on protection. The MCR model, with its simple operation and wide application, is an important tool for the identification of ecological networks, and the scientific construction of an ecological resistance surface is the key to extracting ecological networks [42]. The ecological resistance surface is often affected by the combination of its own vulnerability and external disturbance, and at its essence is a resilient resistance surface. In addition to considering landscape type, vegetation index, and topographic slope, introducing landscape ecological risk into the MCR model can increase the rigid constraints on the spatial distribution of ecological resistance and provide disciplinary guidance for the optimal construction of regional ecological networks. In addition, the importance of ecological source sites is evaluated by using the entropy power method; the sites to be optimized in higher-risk areas are screened out, and the source sites to be optimized and the modified resistance surface are used as the input data of the MCR model to optimize the ecological network with communities as constraints.
where MCRF indicates the optimized resistance surface, F indicates the inverted function, LT indicates the landscape type resistance value, NDVI indicates the normalized vegetation index resistance value, Slope indicates the slope resistance value, and a, b, and c are the weighting factors for constructing the ecological resistance surface, with values of 0.59, 0.25, and 0.16, respectively.
3. Results and Analysis
3.1. Spatial Distribution Characteristics of Landscape Ecological Risks
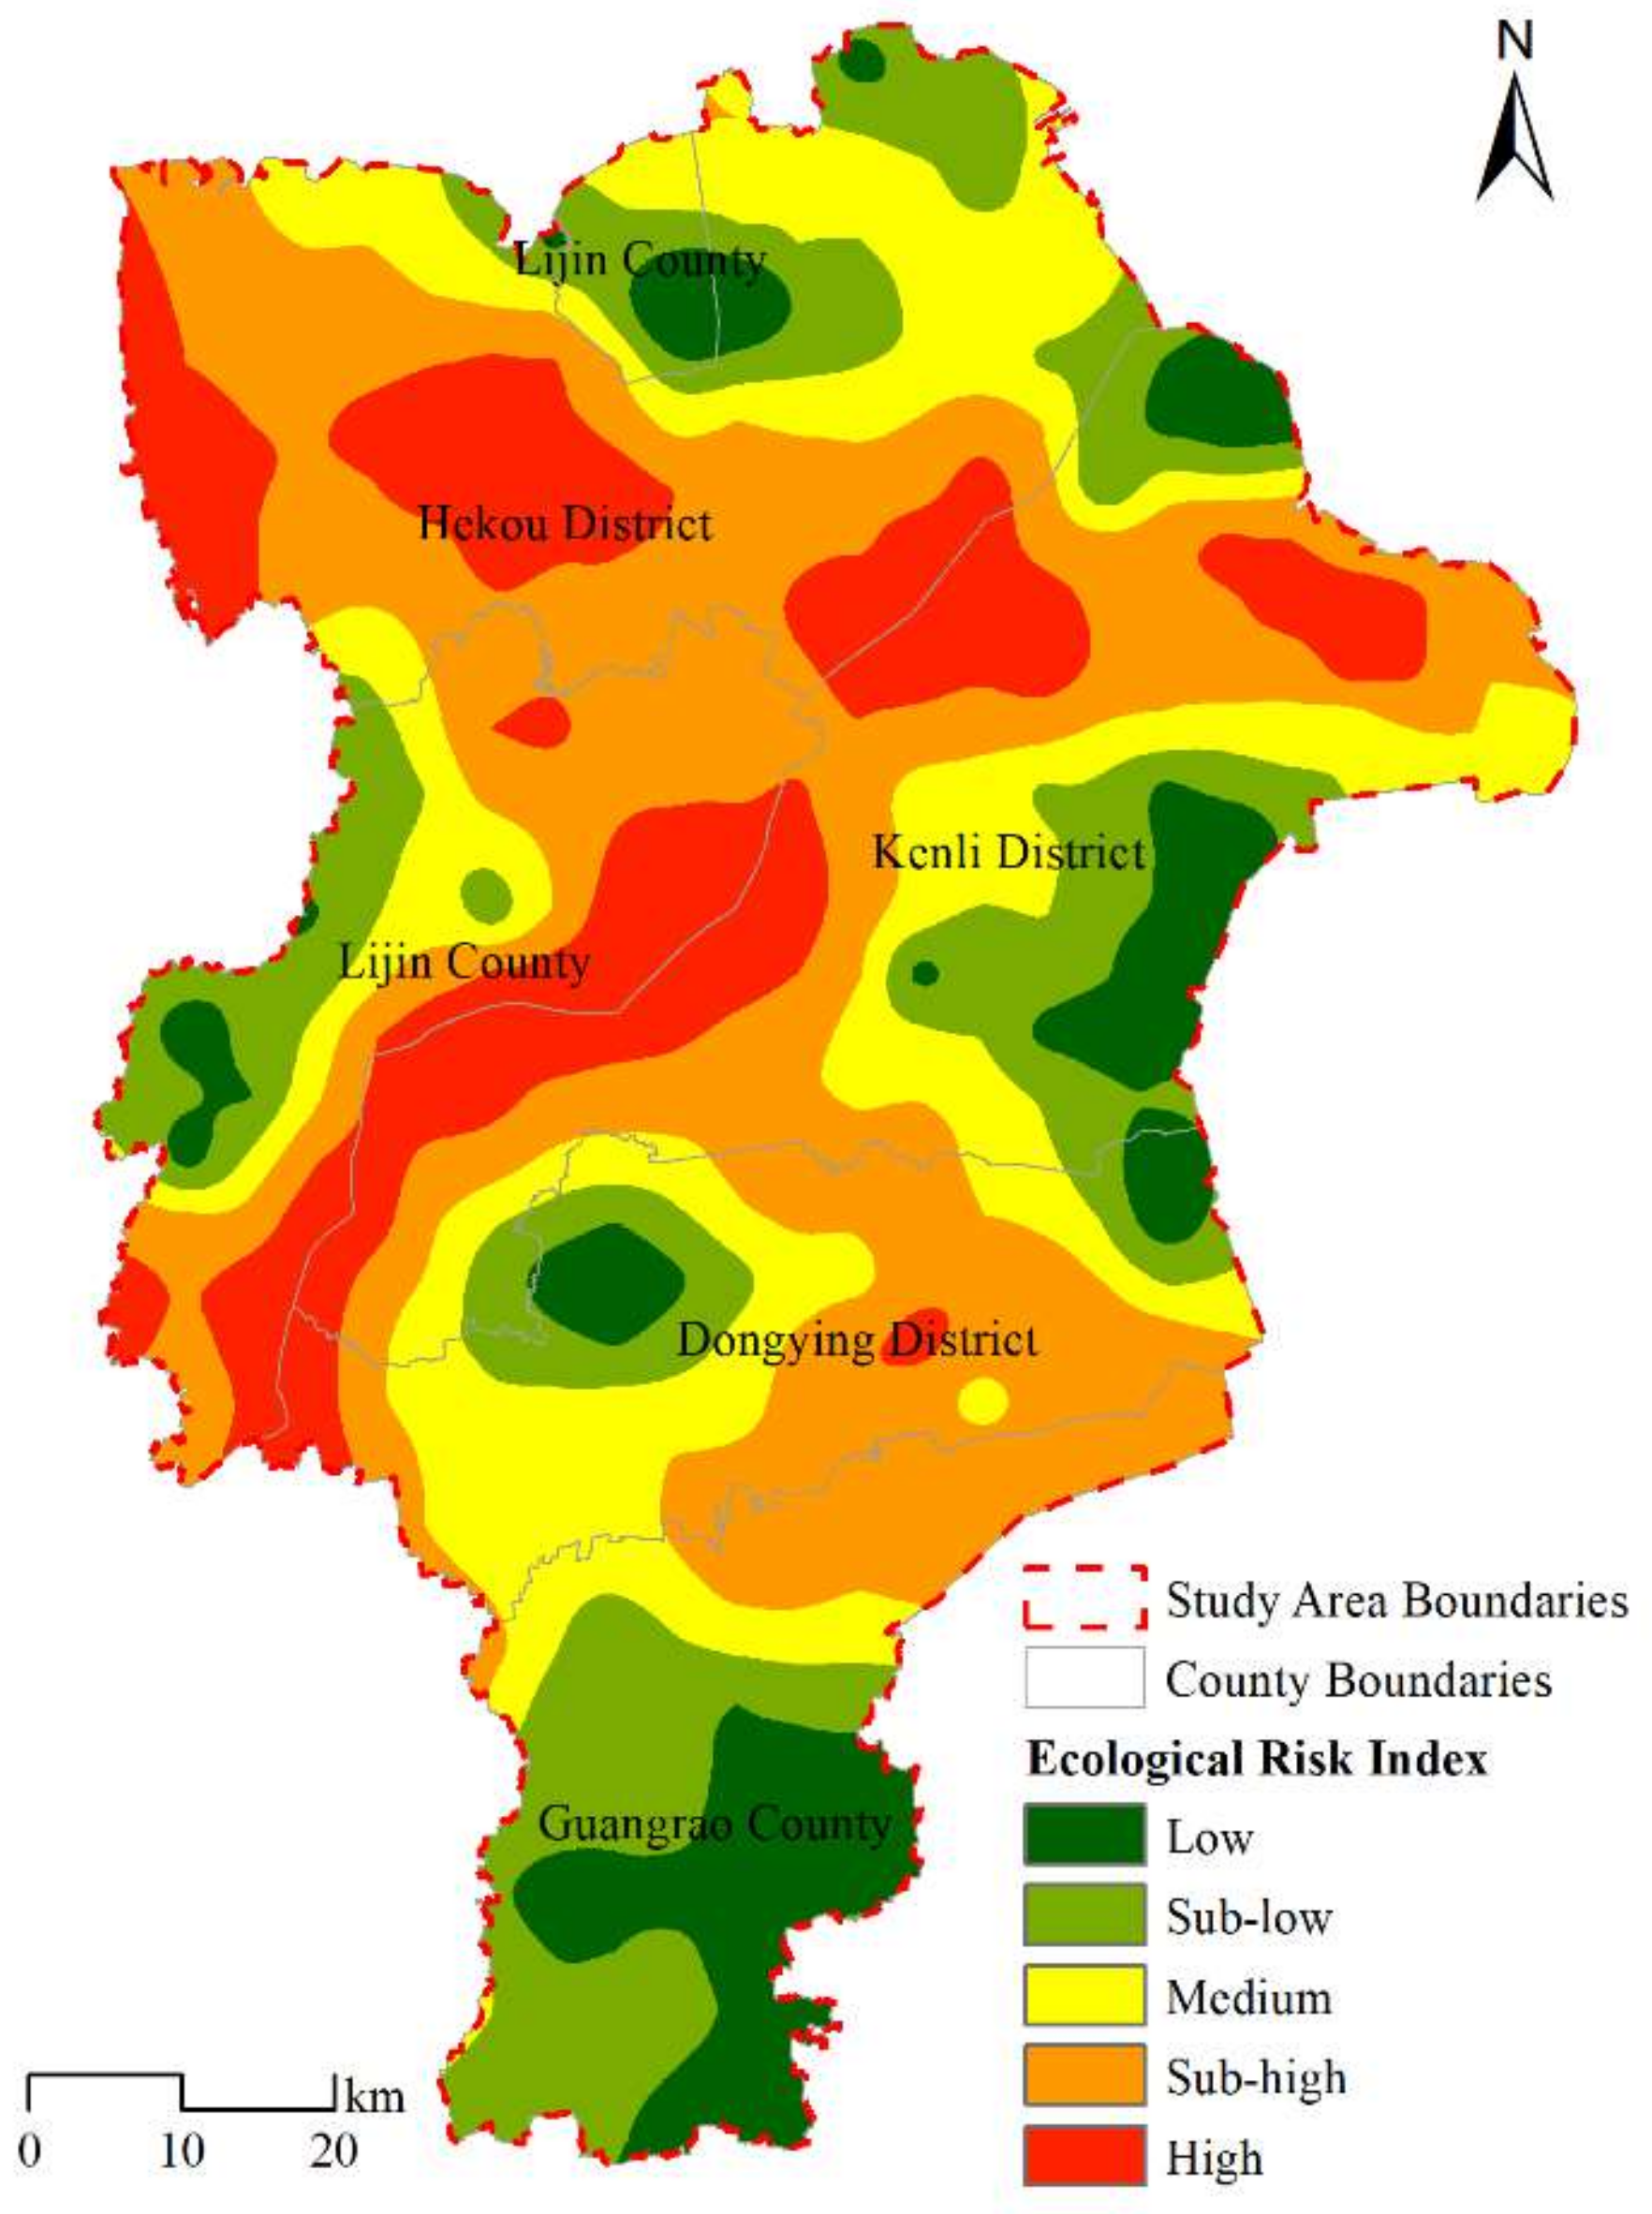
As shown in Figure 4 and Table 3, the spatial distribution of ecological risk in the Dongying landscape varies significantly, with high-value areas concentrated in the middle of the study area bifurcating in four directions: northeast, southeast, southwest, and northwest; and low-value areas in the northern, eastern, southern, and western edges. Among them, the low ecological risk area is 746.99 km2, accounting for 10.01%, mainly distributed in Guangrao County Dawang Weaver River Forest Park, the Yellow River Delta Nature Reserve in Kenli District, Lijin Taiping River Wetland Park to the west, and the eastern and northern coastal mudflats, where the intensity of natural and man-made interference is weak and the quality of the ecological environment is high. In addition, the concentrated building clusters in Dongying District are very resistant to disturbance, so the ecological risk of the landscape in the above-mentioned areas is low. The sub-low ecological risk area is 1418.84 km2, accounting for 19.00%, which is mainly distributed around the low-risk area in a ring or belt shape, in forest parks, wetland parks, and edge areas of coastal mudflats within the low-risk area, largely because edge areas are most vulnerable to external disturbance and often have higher landscape heterogeneity. The medium ecological risk area is 1645.31 km2, accounting for 22.04%, mainly distributed in Dongying, Hekou, and Kenli Districts and the surrounding townships of Lijin County. The surrounding townships of Hekou District are mostly dominated by reservoir ponds, mudflats, and swamps, and the remaining areas are dominated by arable land and rural settlements and other landscapes; the overall terrain is flat and the landscape is mostly distributed in a line. The sub-high ecological risk area is 2459.75 km2, accounting for 32.94%, which is widely distributed in the high aggregation area of construction land in Dongying. These areas tend to have frequent landscape changes and strong human intervention. The high ecological risk area is 1194.91 km2, accounting for 16.01%, mainly along the Yellow River in Dongying City in a strip, and the rest is distributed in the area around the wetland. Most of the high-risk area consists of wetland parks, forest reserves, marshes, reservoirs and lakes, mud puddles, arable land, and construction land, with complex and diverse landscape types and intermingled distribution, resulting in high landscape fragmentation and a large range of high-risk areas.
3.2. Ecological Network Construction
3.2.1. Source Extraction
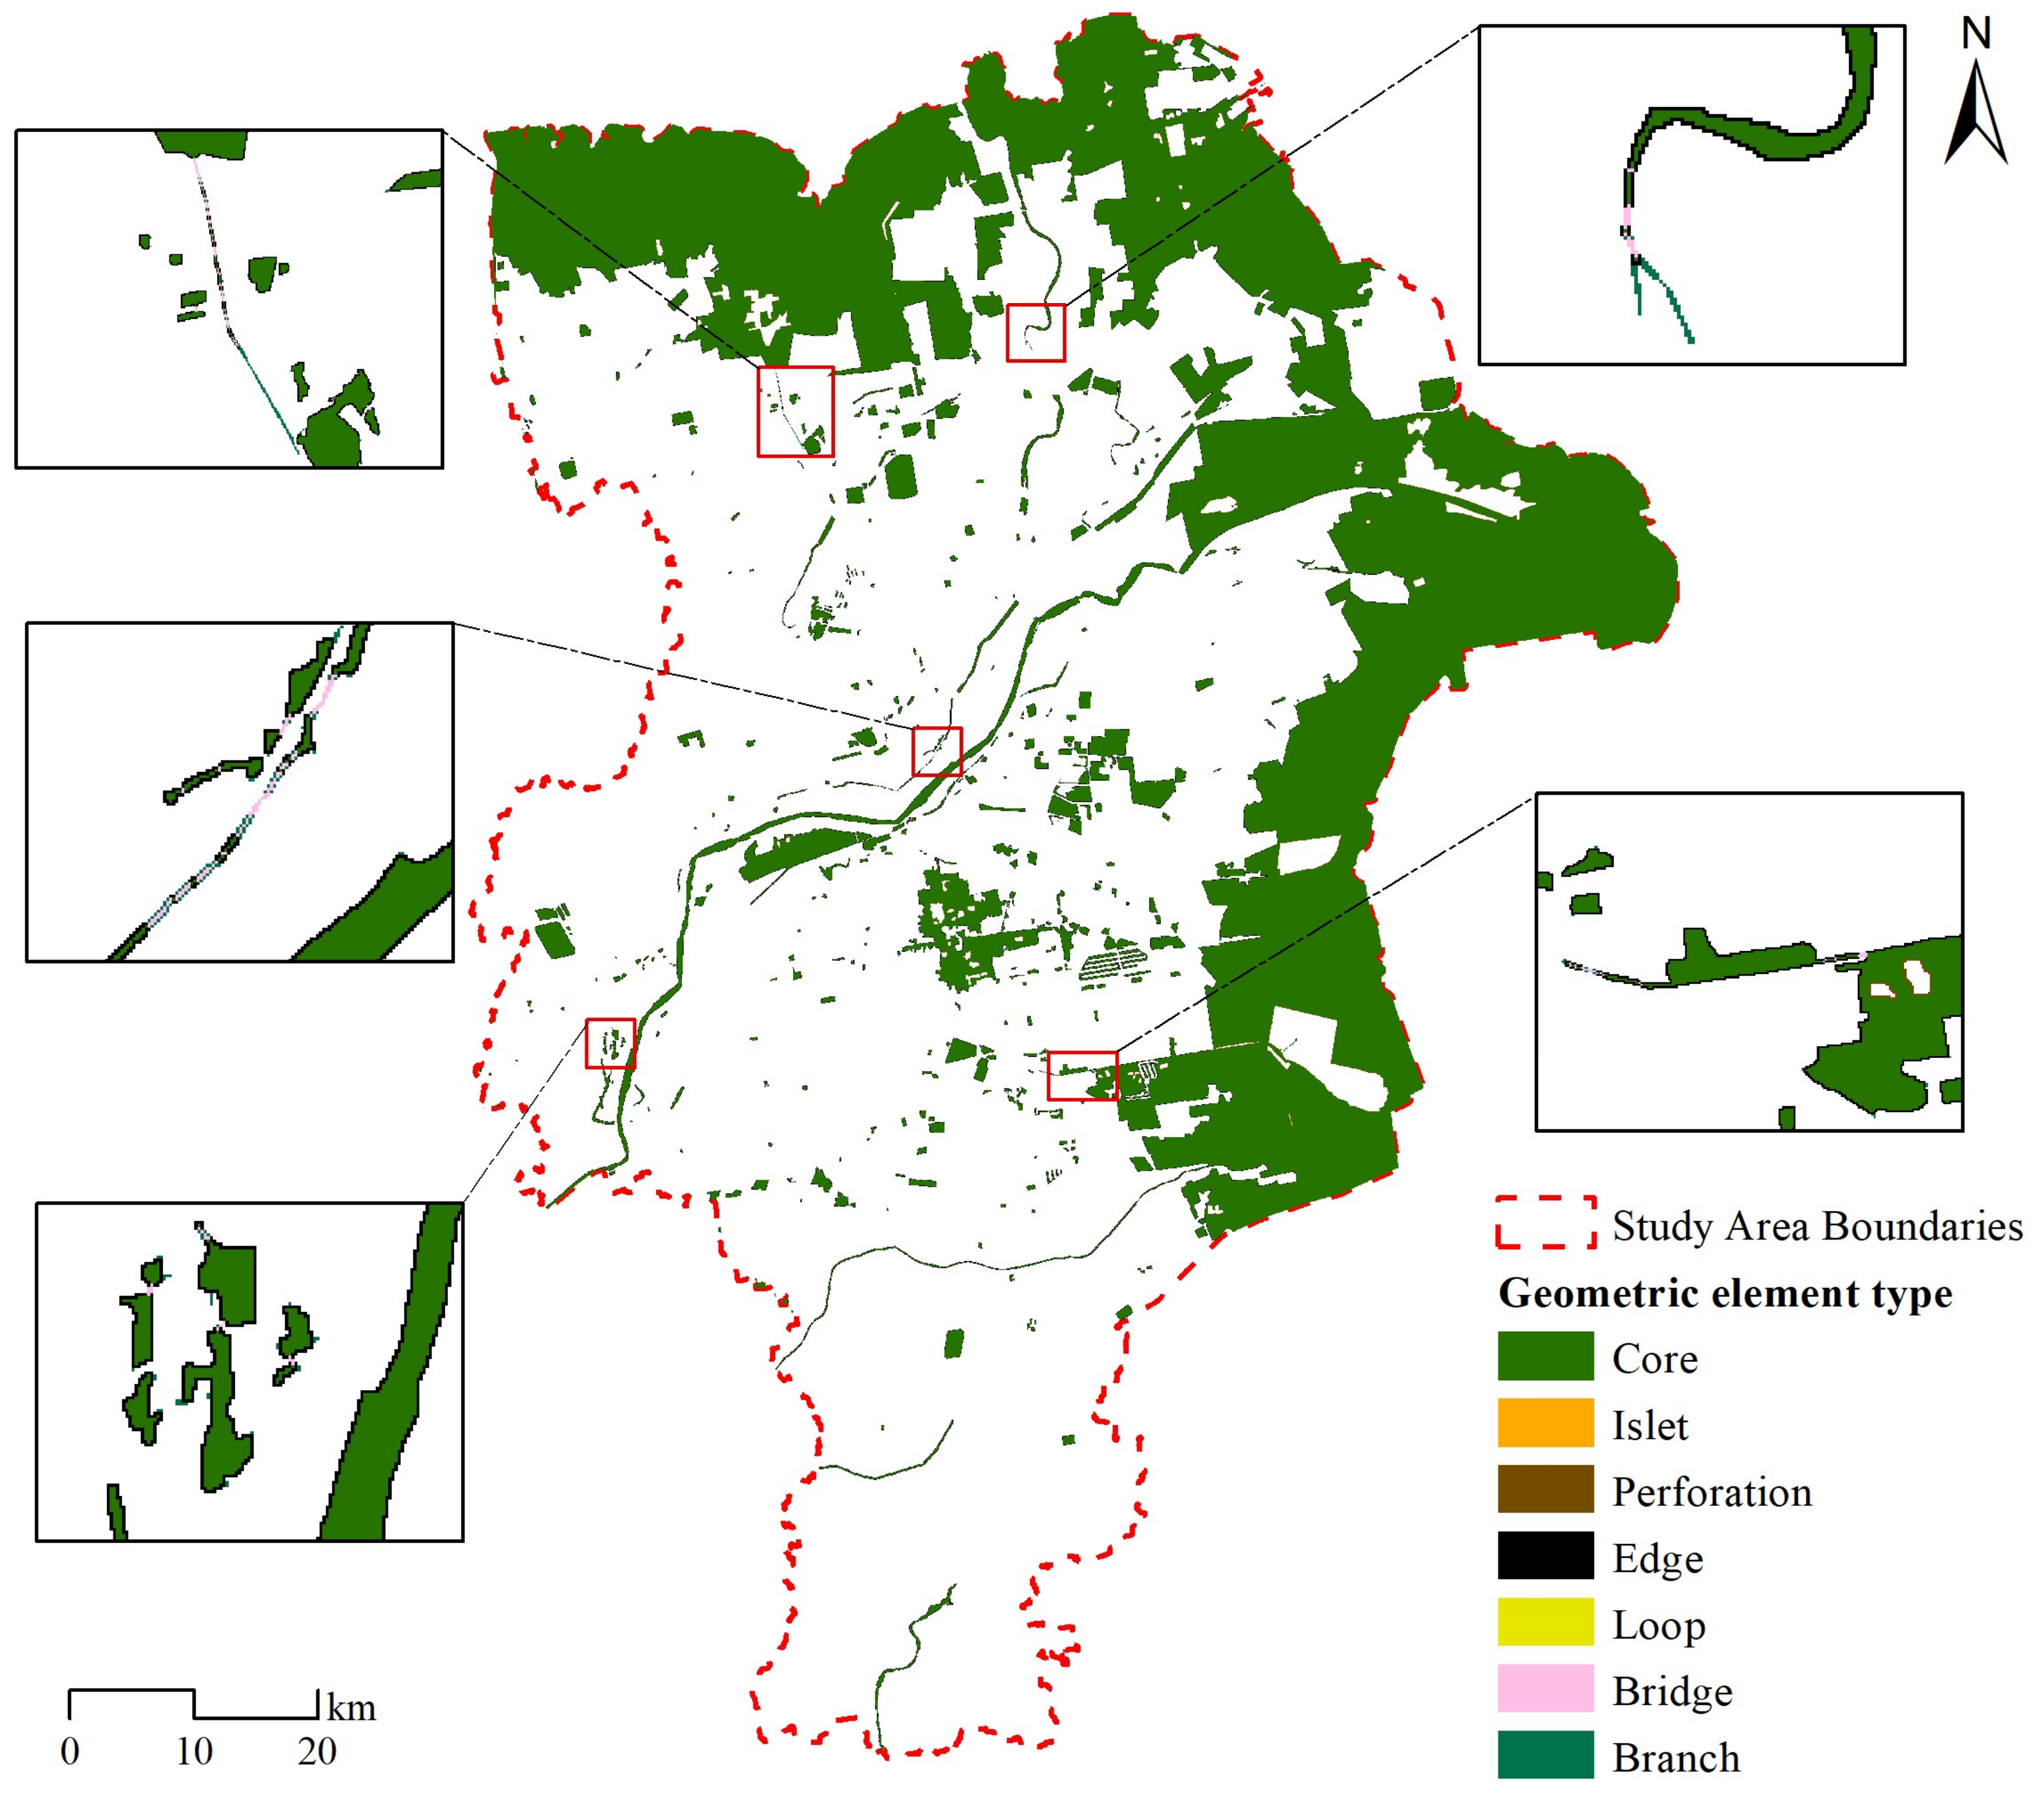
As shown in Figure 5 and Table 4, the overall scale of the wetland landscape in Dongying is huge, and it is widely distributed in the northern, southern, and central areas of the city, with scattered distribution in the west and south. The largest geometric type is the core, accounting for 95.86% of the area, followed by edges and perforation, then branch and bridge areas, and finally islets and loops. This indicates that the wetland landscape in Dongying is mainly dominated by large patches with an edge effect around them, and the connections between patches are weak, causing limitations in material, energy, and information exchange and species dispersal between patches.
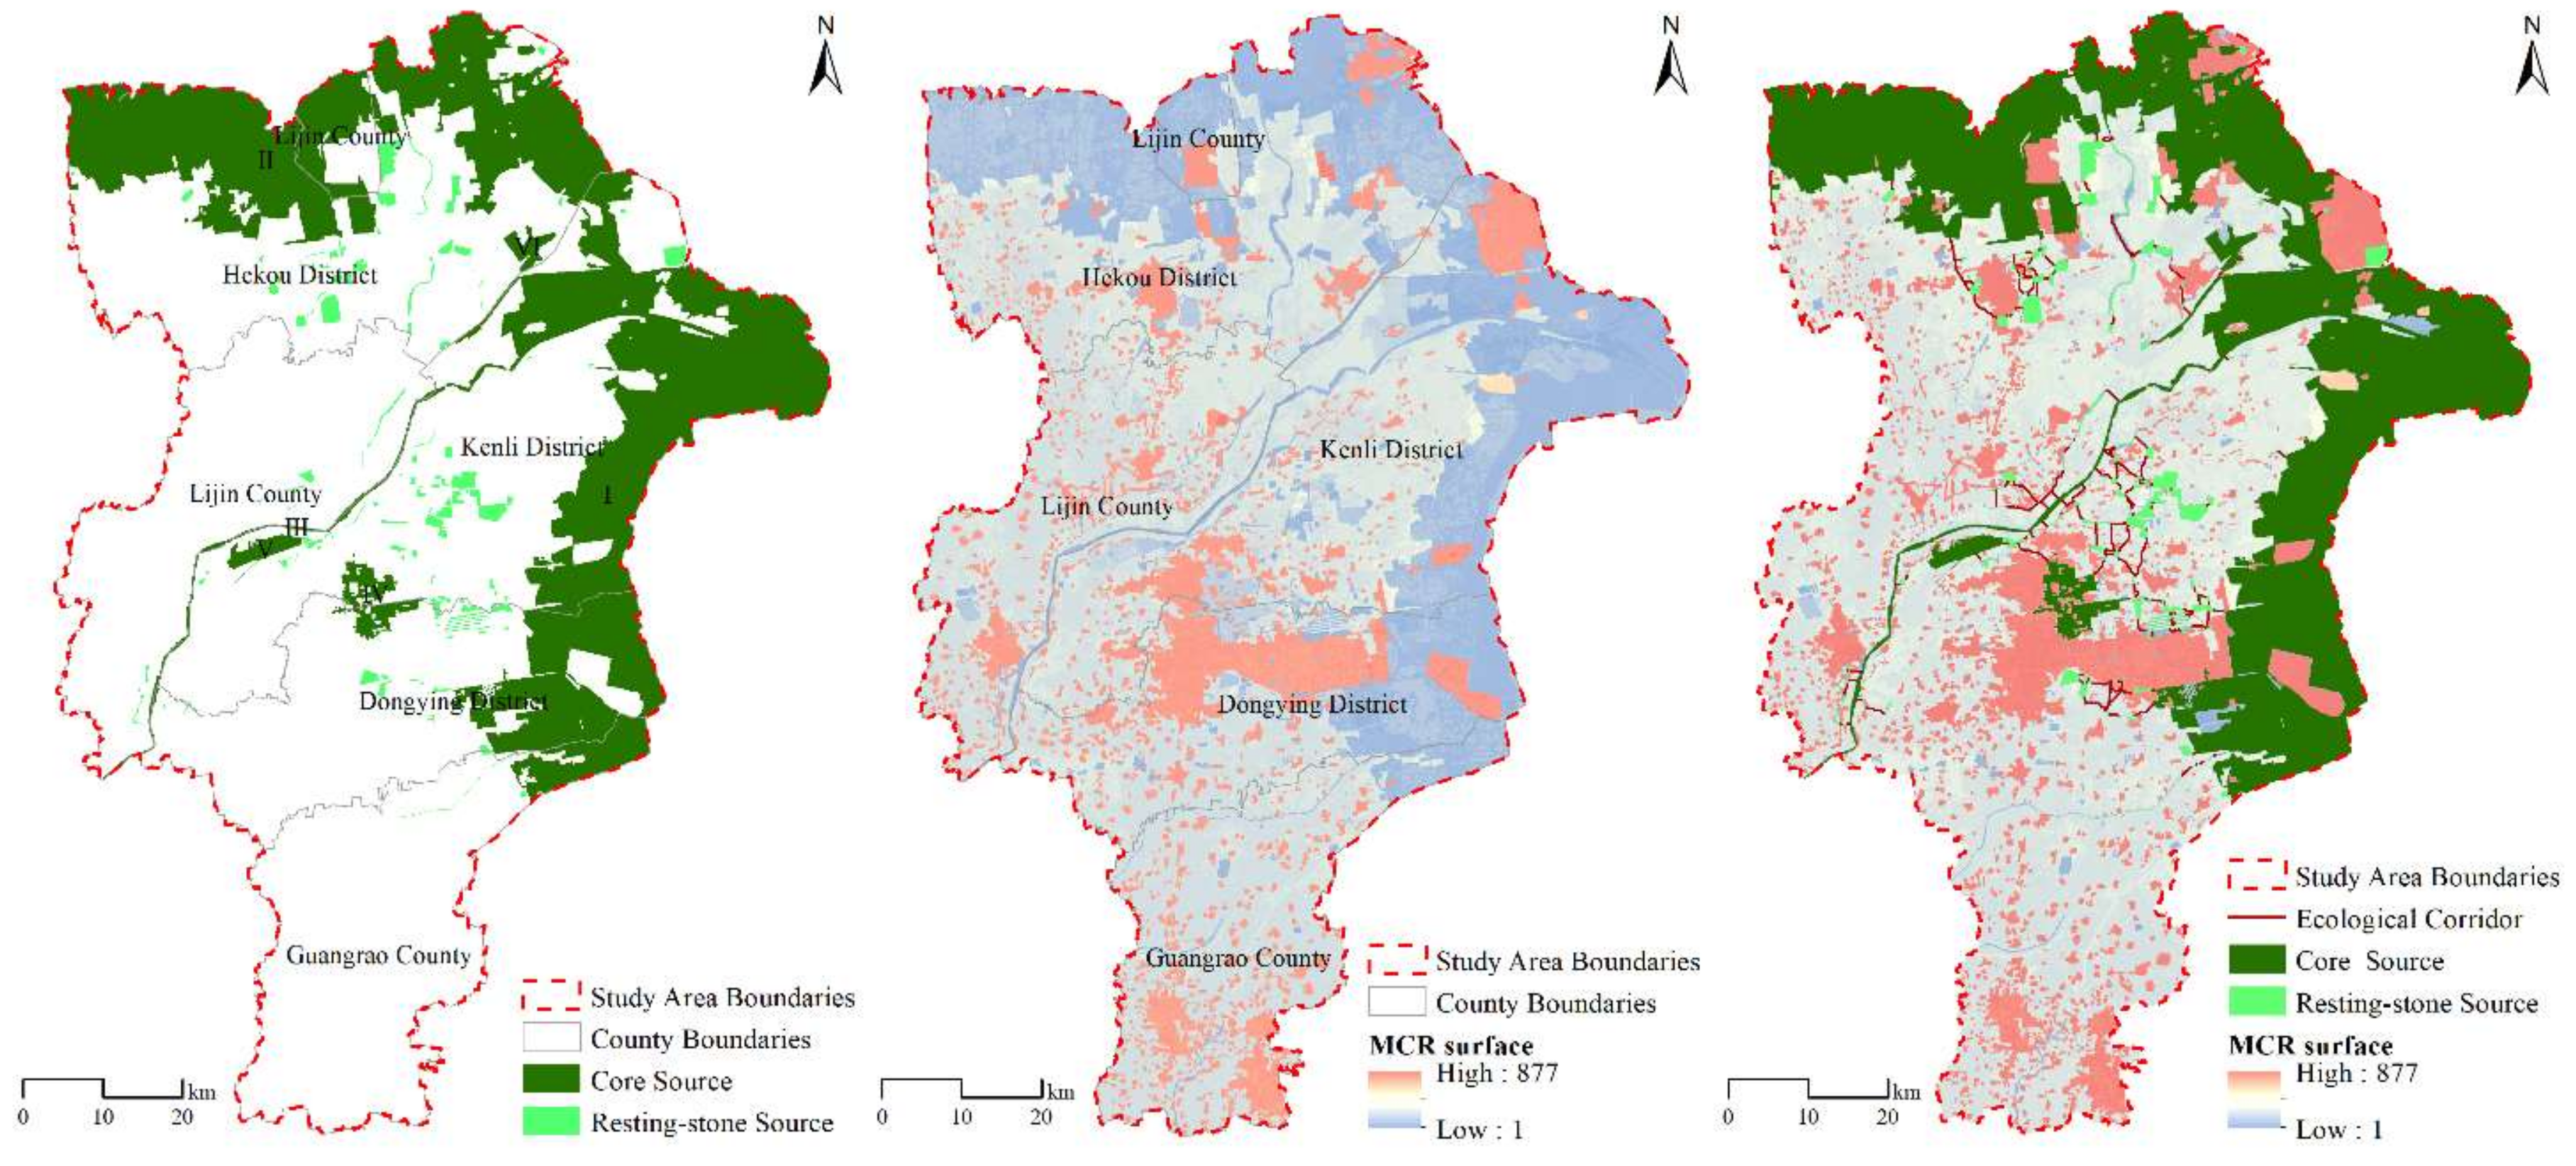
As shown in Figure 6, the core source sites (6) are mainly distributed in the northern and eastern fringes of Dongying City, with a striped distribution in the middle along the Yellow River. They are in the vicinity of protected areas such as Shandong Yellow River Delta Nature Reserve, Dongying Kenli Yellow River Wetland Park, Dongying Lone Island Acacia Provincial Forest Park, Dongying Longju Yellow River Forest Park, Dongying Longqi Lake Wetland Park, Lijin County Li River Wetland Park, and Kenli Tianning Lake Wetland Park, as well as coastal beach mudflat areas. These areas have good habitat quality and can provide habitat for most species, but the core source areas of IV, V, and VI are small and surrounded by high ecological resistance, so it is difficult for their ecological energy to spread to other source areas, and “energy channels” need to be established artificially. Most of the resting-stone source sites (125) are scattered near the core source sites, mostly small-scale wetland parks, inland lakes, paddy fields, etc. These small source sites are usually used as nodes to connect the core source sites, providing temporary recharge and refuge for species dispersal. Some of the resting-stone source sites are of high importance and should be given attention to enhance their protection.
3.2.2. Ecological Network Extraction
As shown in Figure 6, the spatial distribution of the difference between high and low values of ecological resistance is significant. The high-resistance area is concentrated in the central part of Dongying City, showing a trend of outward expansion, mainly in the central part of Dongying District and the south of Guangrao County. These areas are in a state of continuous development and expansion, with dense construction land, low vegetation coverage, and serious fragmentation of patches. The low-resistance areas are concentrated in the eastern and northern edges of the city, mainly in the northern part of Hekou District and the eastern part of Kenli and Dongying District, mainly in wetland parks, forest parks, and coastal beach mudflats. These areas tend to have good habitat quality and less external disturbance, which facilitates inter-patch energy flow. The MCR model extracted 180 ecological corridors, as shown in Figure 6, and the overall distribution shows that they are concentrated in the central and northern areas of Dongying, and scattered in the western and southern areas. Taking the Yellow River as the boundary, large empty areas exist on both sides, and most of these areas are dominated by arable land and cities with high resistance, making it difficult to establish effective connections between ecological patches. This indicates that the ecological network of wetlands in Dongying City has uneven distribution of patch nodes and edges in its structure, and the smoothness of the network is low.
3.3. Ecological Network Topology Analysis
Topological structure metrics analysis is an important tool for studying complex networks. The connection relationship of ecological source points is abstracted as an adjacency matrix, and important metrics such as degree, mediator, eigenvector importance, and connectivity of ecological networks are analyzed based on the network package of Python. The structure and function of the ecological network are evaluated in terms of both nodes and edges. The results are as follows (Figure 7).
3.3.1. Ecological Network Node Topology Analysis
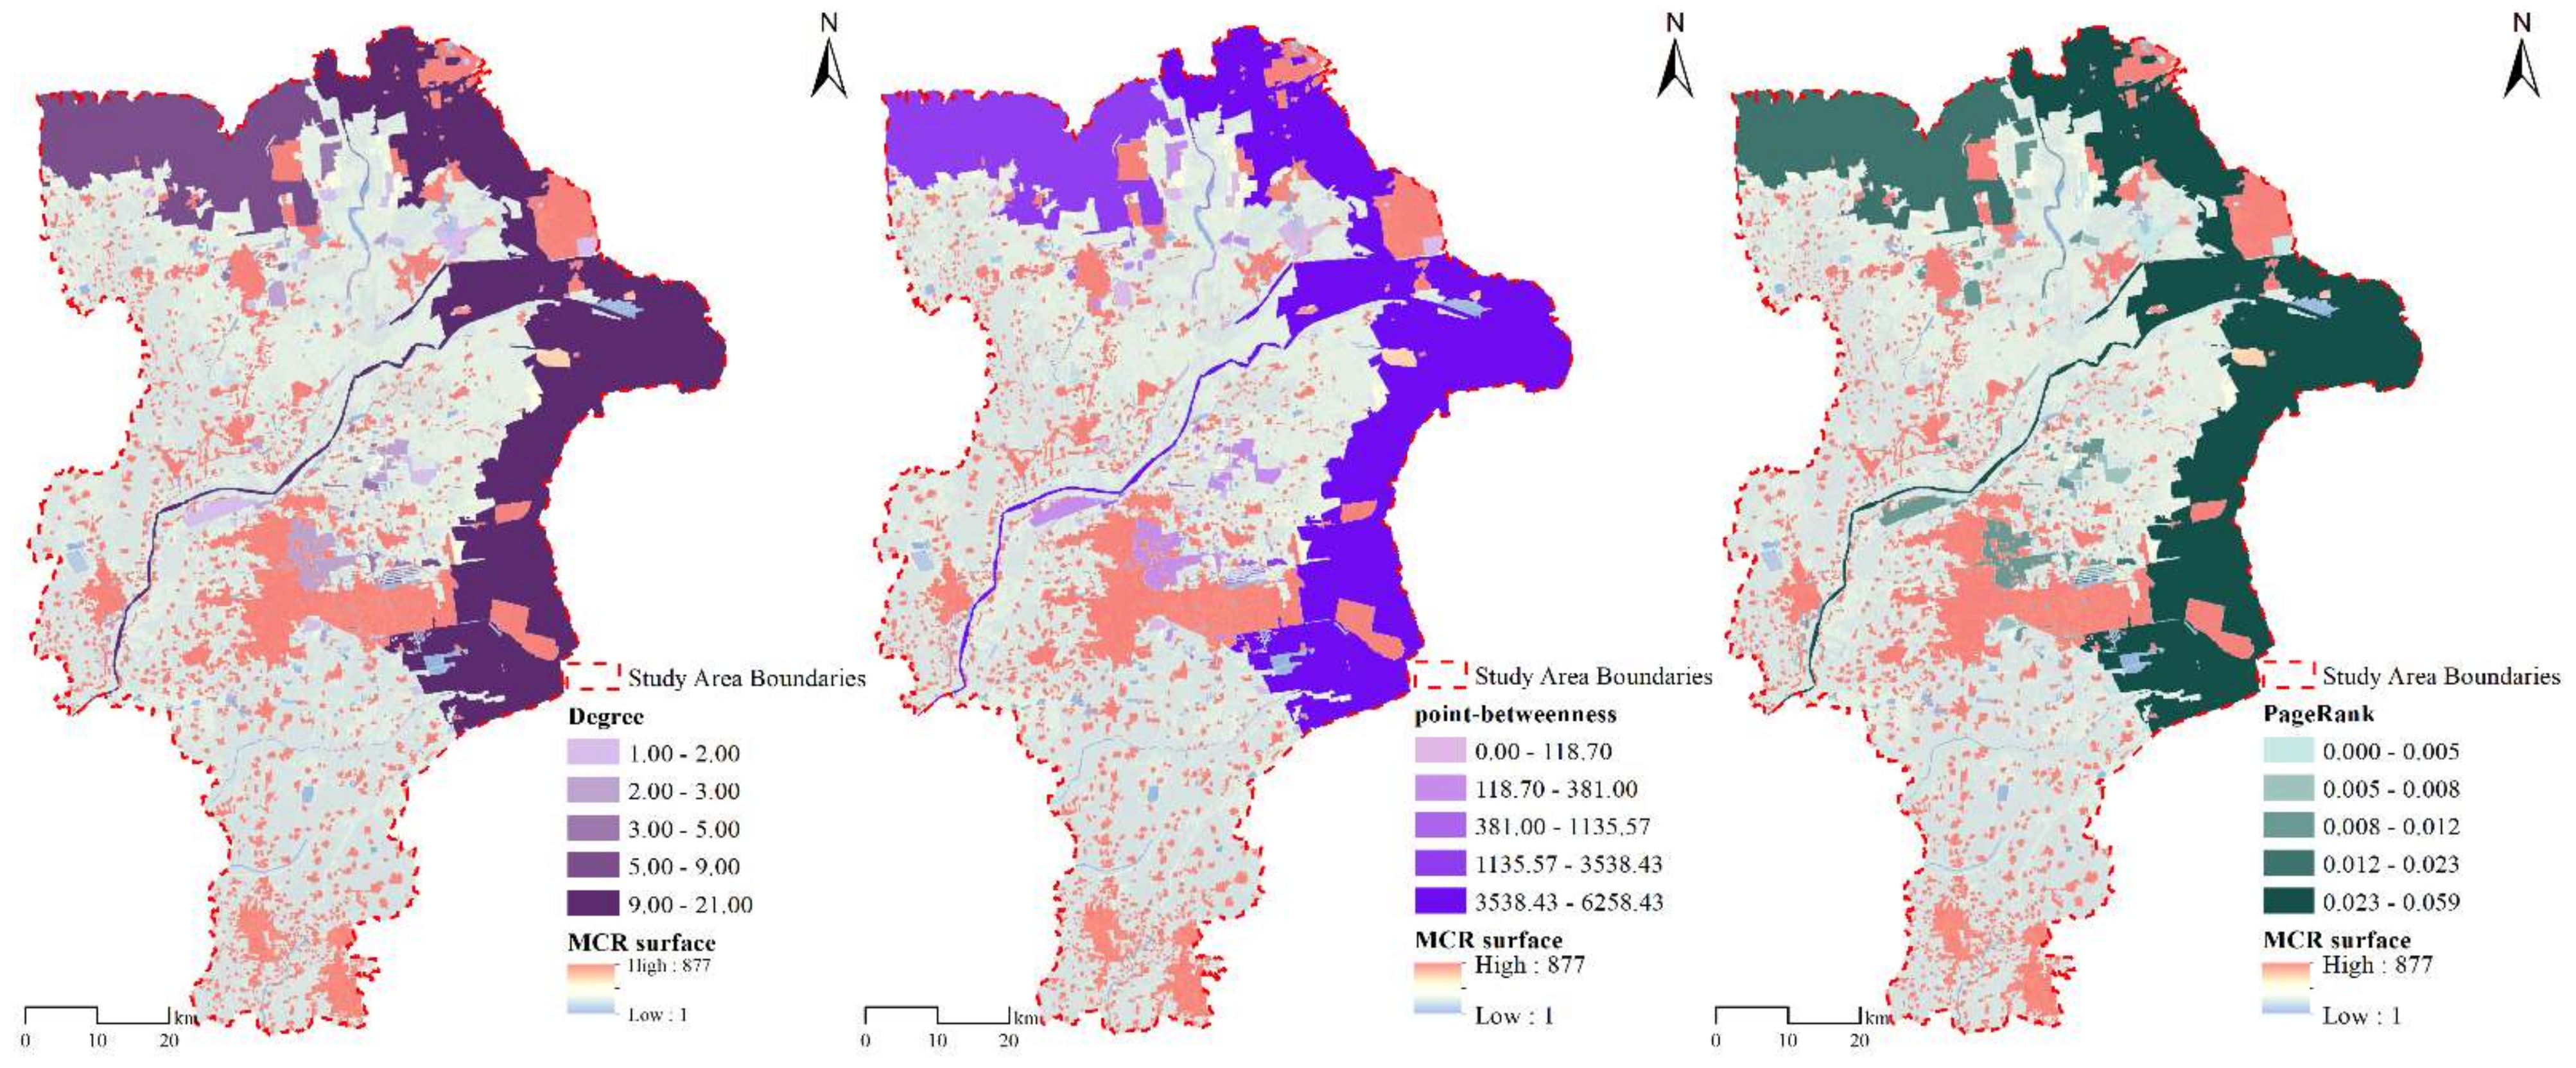
The wetland ecological network in Dongying City takes degree values in the range of 1–21. The average value is 2.748, and the distribution of degree has power-law characteristics, indicating that the network is scale-free with strong heterogeneity in the connection status of nodes and heterogeneous with a coefficient of −0.21, indicating that nodes with high degrees tend to be connected to nodes with low degrees. Core source sites I, II, and III have degree values of 21, 9, and 17, respectively, mainly due to the large area and wide spatial distribution of these source patches, which have higher connectivity and higher probability of species dispersal on the ecological resistance surface. Core source sites IV, V, and VI have slightly lower degree values, mainly due to the concentration of construction land around these three sites and the high ecological resistance, which leads to weak connections between these and other core source sites and resting-stone source sites and makes it difficult to form reliable ecological corridors. Resting-stone source sites have a low overall degree, but there are also high-value patches, mainly distributed in areas with little human interference and weak resistance to the surrounding landscape. Resting-stone patches are often used as key restoration objects in practice, and they are integrated into core patches, so as to optimize the overall network structure and strengthen regional network connections.
The point-betweenness of the ecological network of wetlands in Dongying City has values in the range of 0–6258.43, and core source sites I, II, and III have the largest values of 6258.43, 2339.48, and 4322.50, respectively, indicating that these patches play an important role in the whole ecological network. The number of points in the other three core source sites is smaller, and as core sites, their key role in the ecological network is not fully realized, mainly due to the large ecological resistance around them, which makes it difficult to establish connections with other ecological source sites. The distribution of point-betweenness of resting-stone source sites was extremely uneven, with only three sites larger than 1000, and those with high point-betweenness were located near core sources I and II, where ecological resistance is low and habitat conditions are good.
The eigenvector centrality of the wetland ecological network in Dongying City is in the range of 0–0.059, and the distribution pattern is similar to that of degree and point mediator. The PageRank values of core source sites I, II, and II are the largest at 0.059, 0.024, and 0.041, respectively. The existence of five surrounding resting-stone source sites with PageRank value greater than 0.012 indicates that the ecological energy of core source sites tends to flow to resting-stone source sites with high PageRank values, and the management of these source sites should be strengthened so that they can develop into new core source sites. The remaining core sources and most of the resting-stone sources have low PageRank values, and these are affected by ecological resistance and can only interact inefficiently with proximate sources, making the ecological network as a whole highly heterogeneous.
3.3.2. Ecological Network Edge Topology Analysis
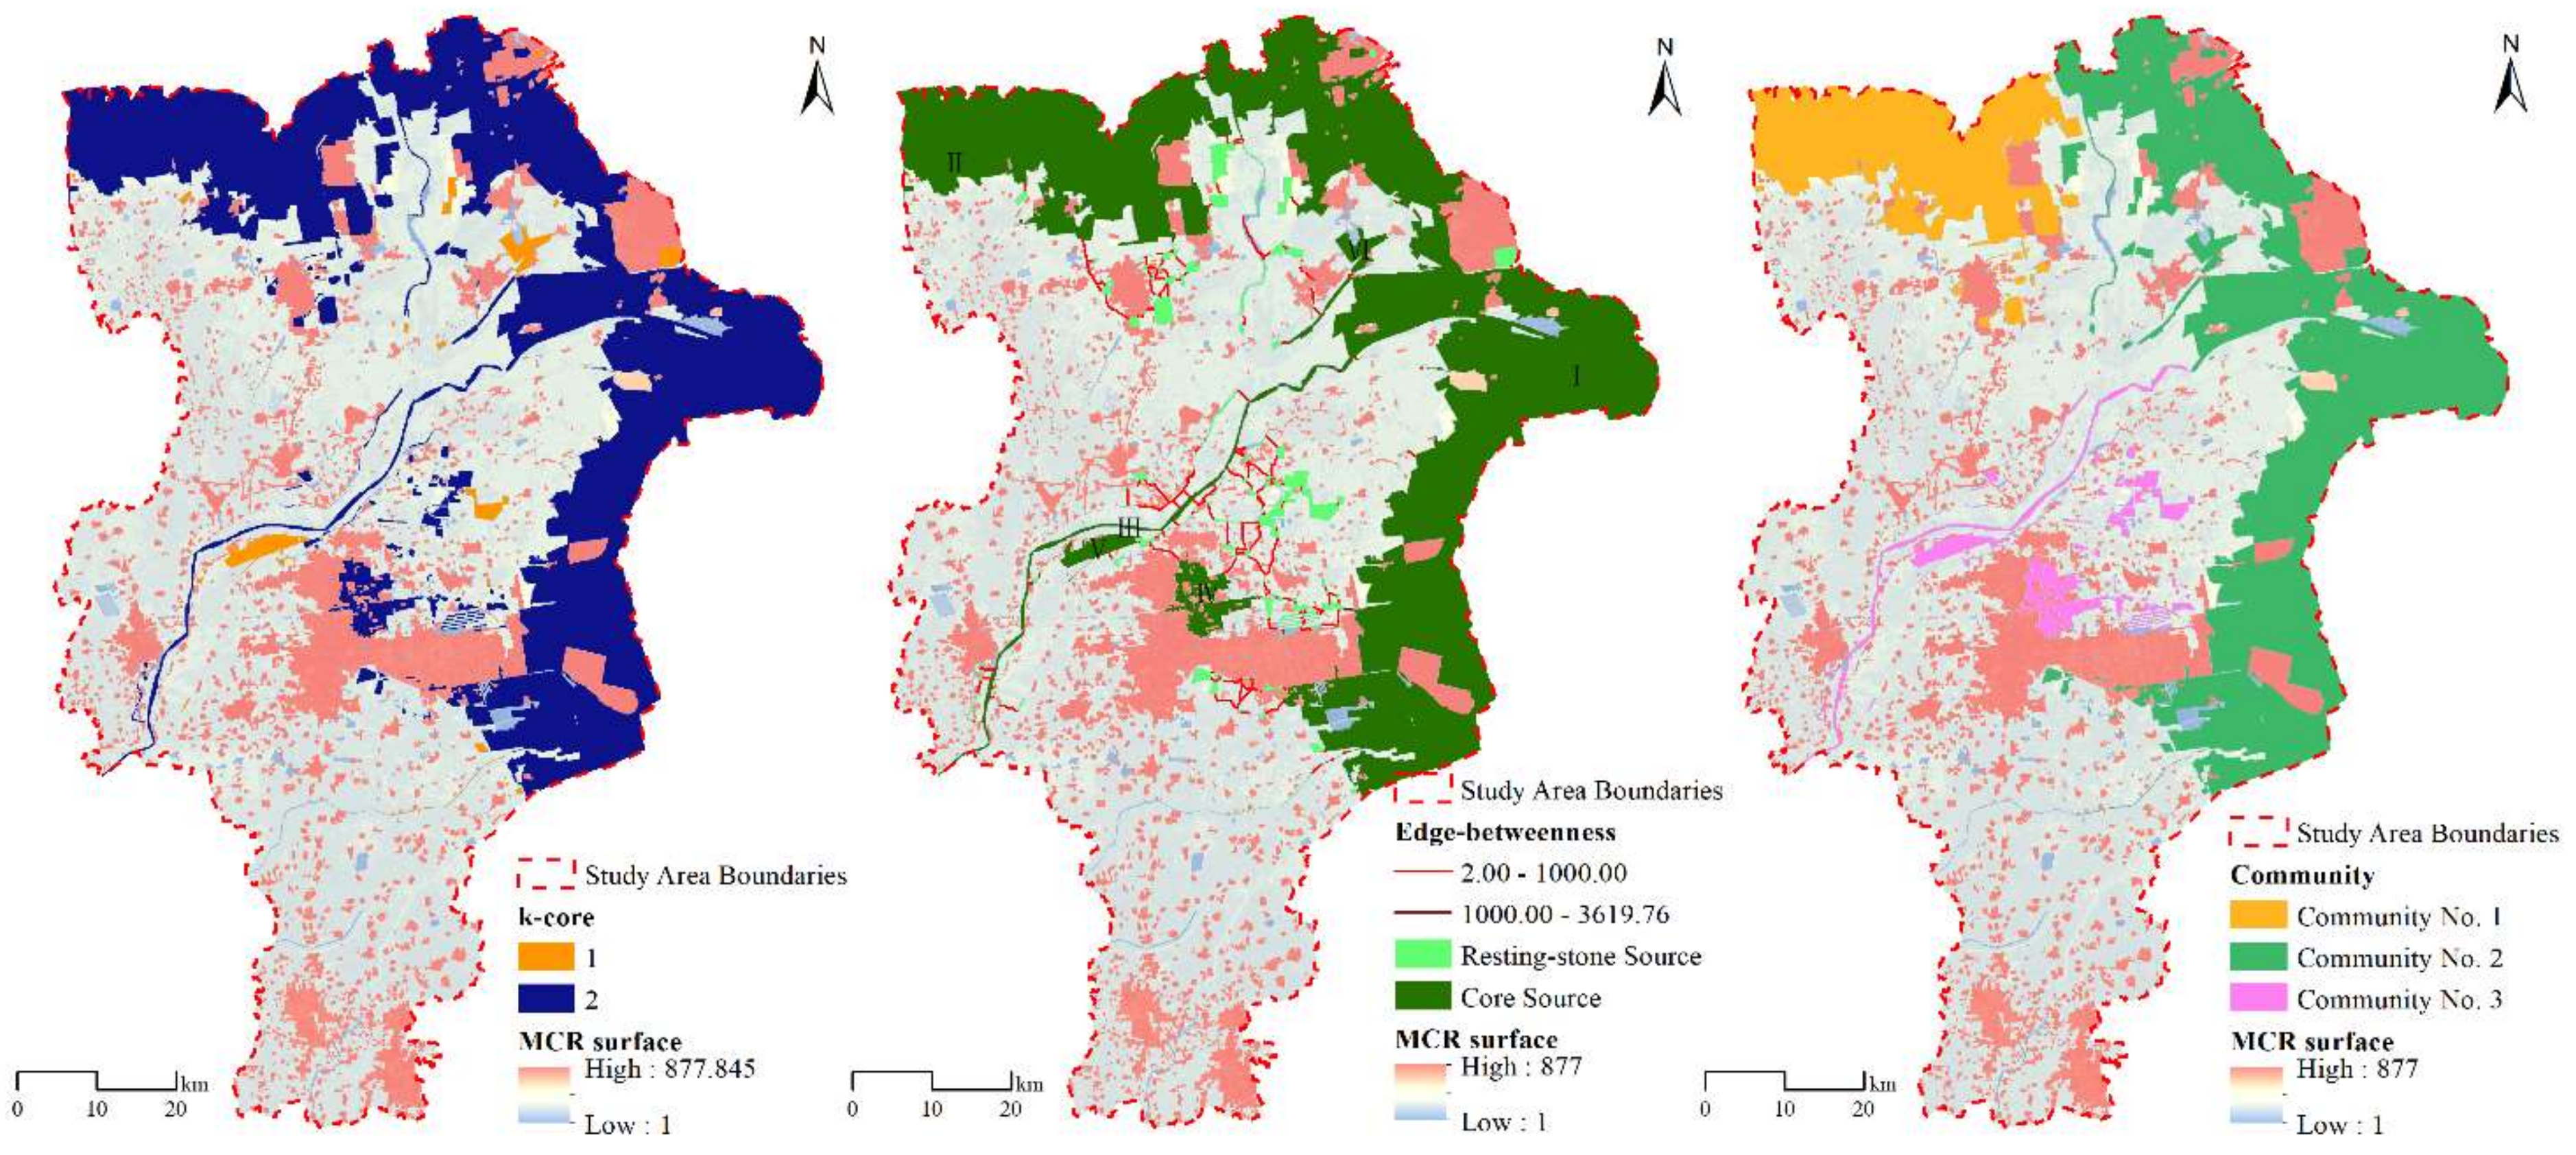
The analysis in Figure 8 shows that, overall, the ecological network of Dongying wetlands is well connected; the connected fraction of the ecological network is 104, accounting for 79.4% of all ecological source sites, i.e., nearly 80% of the ecological source sites would have to be removed to turn the ecological network into a plain map before its ecological function is completely lost. The ecological network has 1 and 2 nuclei; 33 ecological source sites have 1 nucleus and 98 have 2 nuclei, which have obvious hierarchical characteristics. The inner-layer network is nested in the outer-layer network, and the overall characteristics are that the former is weakly connected and the latter is strongly connected, and the two layers are not closely connected. The outer network is mainly distributed in the northern and eastern fringe areas of Dongying City and the central part along the flow direction of the Yellow River, and the inner network is distributed on both sides of the river, with wider distribution around the southern part. This indicates that the center of the wetland ecological network in Dongying City is distributed in the outer-layer area, the level of the network is shallow, and the nodes are easily and quickly disconnected from the network by damage.
The edge-betweenness values of the wetland ecological network in Dongying City range from 2 to 3619.76, with an average value of 269.428. Only four areas have edge-betweenness values greater than 1000: connecting core source I and core source II, core sources I and II, core source I and resting-stone source 118, and core source II and resting-stone source 5. These four ecological corridors are responsible for most of the material, energy, and information flows of the whole network and constitute the backbone corridors in Dongying; the short length of this backbone is consistent with the feature that ecological flows can be transported efficiently over short distances. Corridors with median values below 1000 have a larger proportion in the whole network and play a role in diverting ecological flows to other sources in the network.
The GN algorithm was used to divide the wetland ecological network into three communities, and the ecological network was divided into three communities in the northern, eastern, and central areas of Dongying. The spatial distribution of the communities satisfies the first law of geology, and the nodes within the communities are very closely connected to each other, although the connections between the communities are sparse. On the whole, community 2 is connected to communities 1 and 3; there is one corridor connecting community 2 to community 1 and two corridors connecting community 2 to community 3, both of which are high-value edge median corridors, which also indicates that they play a pivotal role in the ecological network. From the internal analysis of the communities, each community shows distribution characteristics indicating that the core source is the main source and the other resting-stone sources are closely connected with it.
3.4. Wetland Ecological Network Optimization
Based on the results of the spatial distribution of ecological risk in the Dongying landscape, the ecological source sites in higher-risk areas were screened. Based on this, the weights of degree, point-betweenness, and eigenvector centrality of ecological source sites were determined by the entropy weight method, and the importance of the sites was comprehensively evaluated; screening them with an overall score greater than 5 and combined with the actual situation in Dongying, 3 core source sites and 31 resting-stone source sites were identified for optimization, as shown in Figure 9.
The source sites to be optimized are mainly scattered in the central part of Dongying. Based on the restoration and protection of ecological source sites, corridor landscape facilities such as artificial water channels and forest and grass strips can be constructed to enhance material, energy, and information exchange between them. Based on the MCR model for optimizing landscape ecological risk, the scope of the community is used as a constraint, and based on the ArcGIS cost path module, corridors are simulated to be added to the source sites, so that the structure and function of the ecological network can be optimized. The results (Figure 9) show that the optimized ecological network has 191 ecological corridors, an increase of 11 corridors compared to pre-optimization. In terms of global characteristics, the network connectivity component is 105, which is increased by 1 compared to pre-optimization. Locally, the new corridors are mainly located in the central and northern parts of the study area, with 1 new corridor in the core source site and 10 in the resting-stone source sites. Most of the new corridors directly radiate from the core source site or indirectly radiate from the resting-stone source site to other source sites. Therefore, in protecting the core source site, it is necessary to strengthen the protection of the resting-stone source site, so as to enhance the connectivity of the whole network.
3.5. Ecological Network Robustness Check
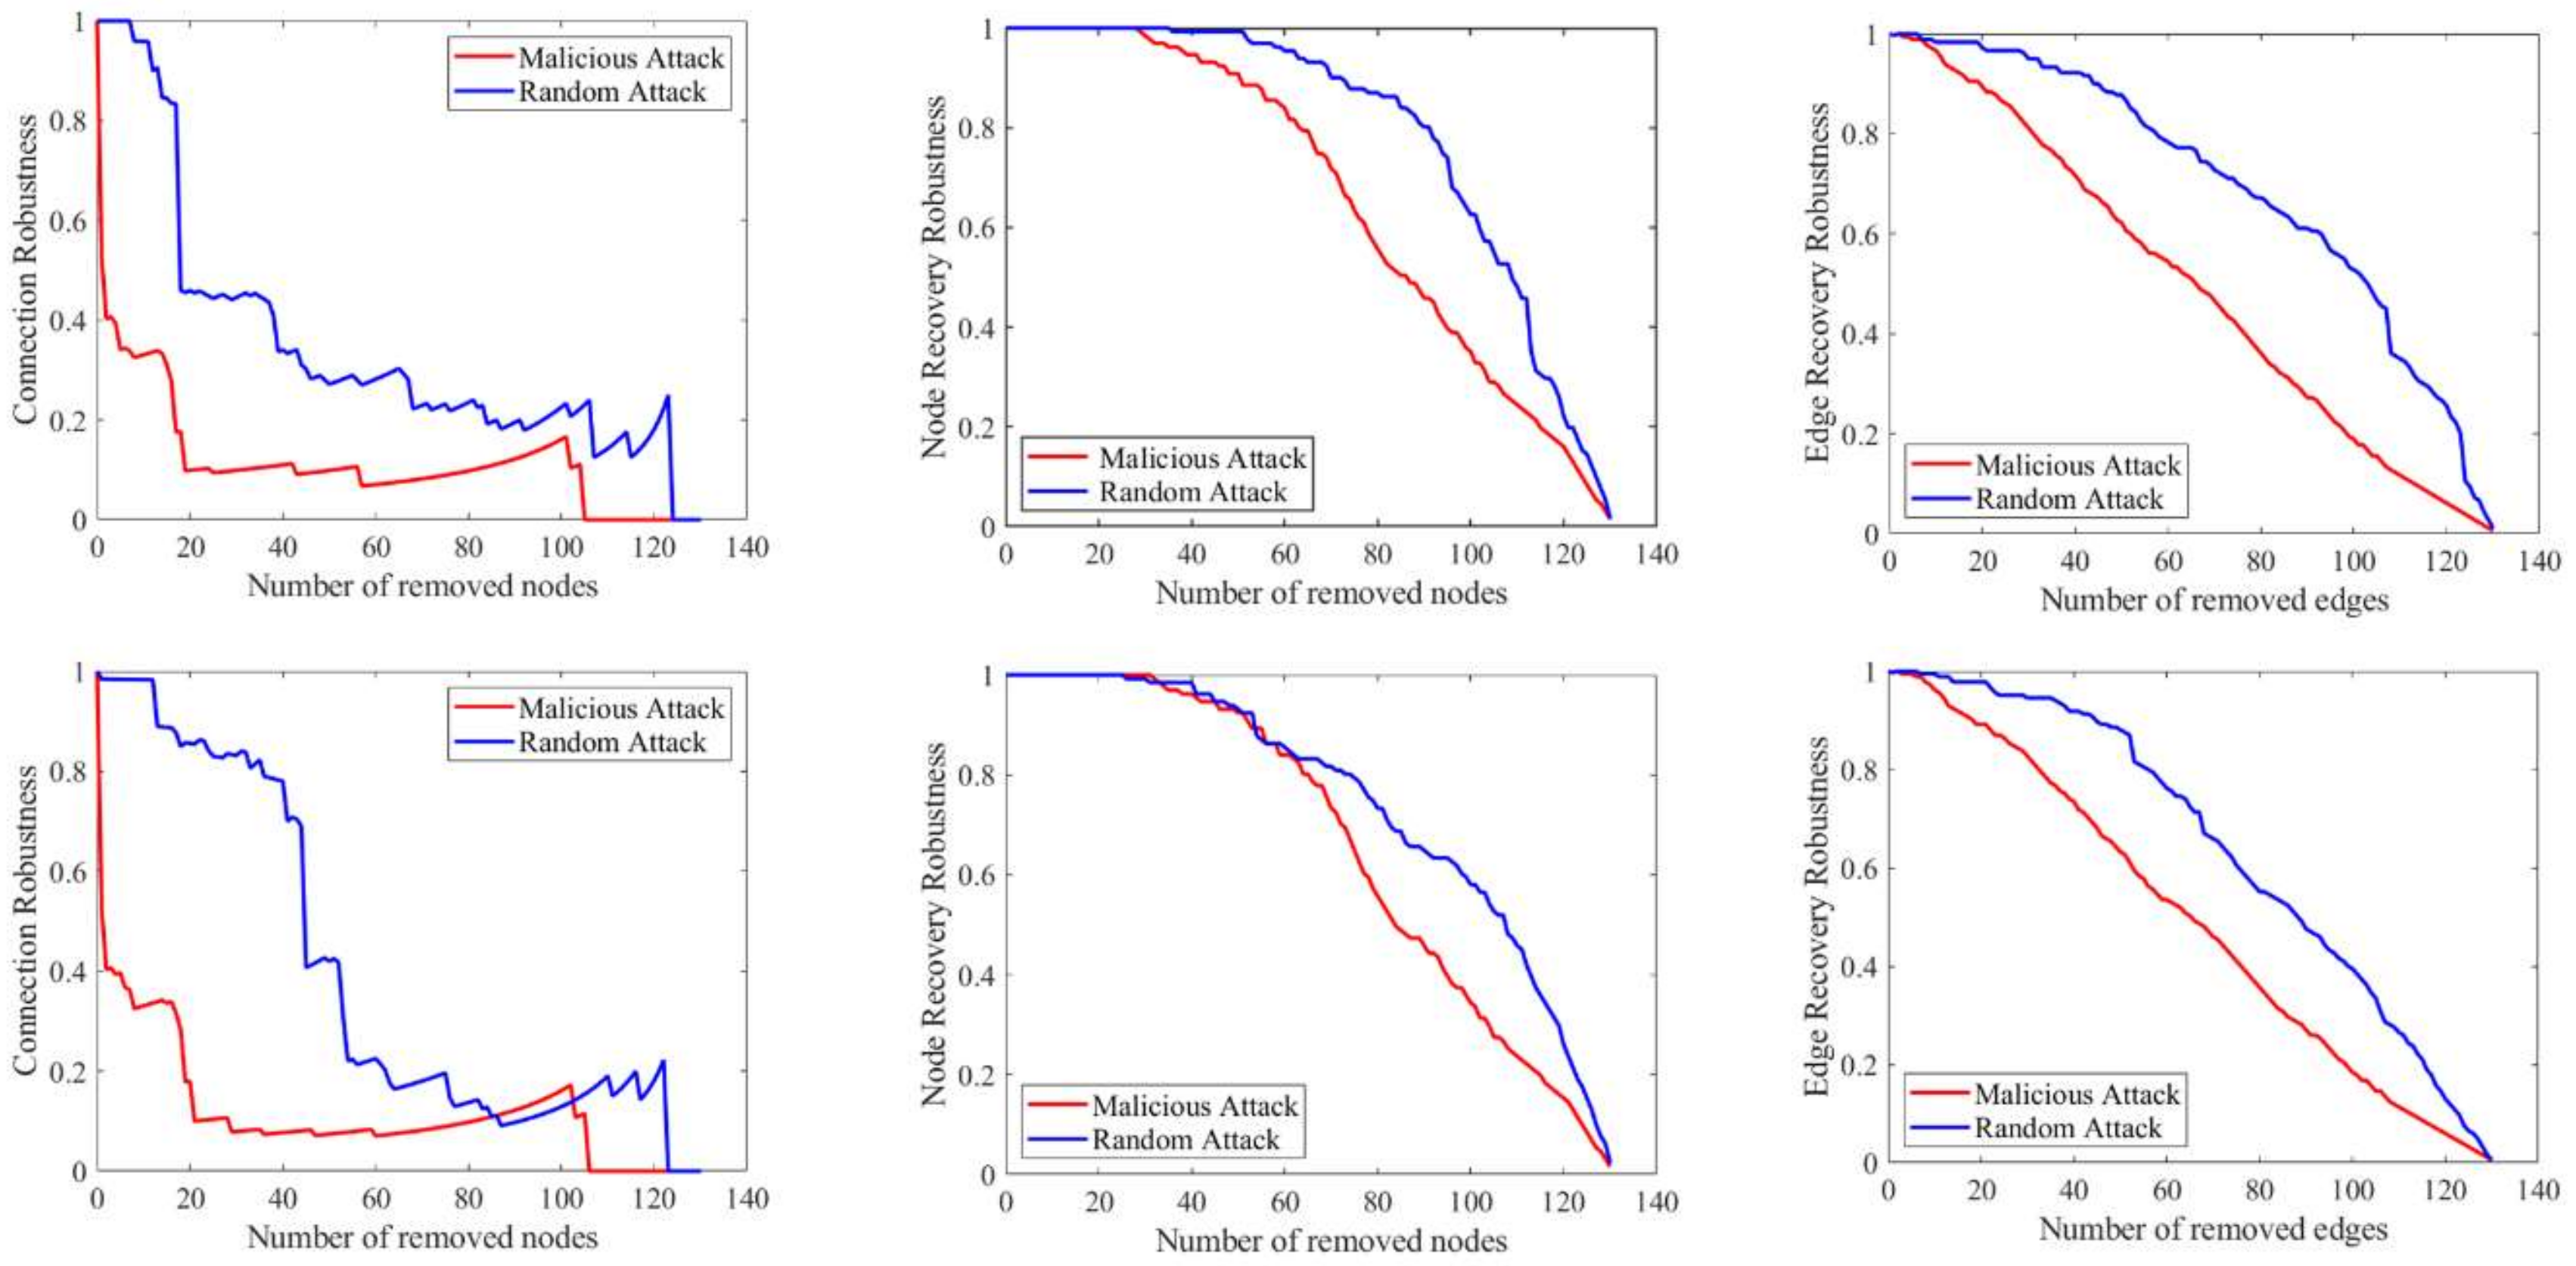
To verify the stability of the optimized network structure, the robustness of connectivity and recovery of the network before and after optimization were compared using the MATLAB platform, and two strategies of malicious and random attacks were used to attack the network structure, as shown in Figure 10.
Under malicious attacks, there is little difference in the robustness of connectivity in the network pre-optimization and post-optimization, and the robustness is always higher post-optimization than pre-optimization until the number of removed nodes reaches 28. In addition, the connectivity robustness of the network pre-optimization shows undulating growth when the number of removed nodes increases to 19, and this occurs post-optimization when the number of removed nodes increases to 21. This is mainly due to the fact that malicious attacks prioritize the removal of highly valued nodes; when these nodes are removed, the ecological network before and after optimization is more similar, thus showing roughly the same trend of a collapsing network structure as the nodes continue to be removed. Under random attacks, the overall change trend of the network before and after optimization is obviously different. When the network before optimization removes 18 nodes, the connection robustness shows a cliff-like decline, and after optimization the network removes 44 nodes. When the number of nodes is 1, the connection robustness shows a cliff-like decline, which drops to 0.46 and 0.41, respectively. As the nodes continue to be removed, the network pre- and post-optimization also starts to show undulating growth, and finally the network structure collapses.
The node recovery robustness curves for the network pre-optimization and post-optimization remain basically the same under the two different attacks. Under a malicious attack, the node recovery robustness of the pre-optimized network starts to decrease when 28 nodes are removed, and that for the post-optimized network starts to decrease when 31 nodes are removed. The node recovery robustness of pre- and post-optimized networks is basically similar as the nodes continue to be removed, indicating to some extent that the optimized ecological network is more resistant to malicious attacks. Under random attacks, the node recovery curve of the optimized network is significantly lower than that of the pre-optimized network.
The edge-recovery robustness curves of the network pre-optimization and post-optimization also remain basically the same under the two different attacks. Under malicious attacks, the edge-recovery robustness curve of the post-optimized network is slightly higher than that of the pre-optimized network. Under random attacks, the pre-optimized network starts to degrade significantly when 20 nodes are removed, and the post-optimized network starts to degrade significantly when 23 nodes are removed, indicating that the optimized network has better resistance to destruction from the beginning phase of the random attack. However, the decreasing trend in subsequent random attacks is significantly larger for the optimized network than the pre-optimized network.
4. Discussion
According to the statistics of landscape ecological risk zoning, the area of sub-high ecological risk within Dongying is the largest, accounting for 32.94%, followed by medium, sub-low, and high ecological risk, and the smallest is low ecological risk. In terms of spatial distribution, the high-value areas of landscape ecological risk are relatively flat, with more wetlands, cropland, forest, and grassland and rural settlements, making the landscape in the region more fragile, and there is a higher degree of human interference near rural settlements. The low-value areas of landscape ecological risk are distributed around urban sites, and although these areas have a strong degree of human disturbance, their landscape fragility is extremely low, and basically no landscape change will occur. Landscape ecological risk, as a means of evaluating landscape sustainability, helps in constructing a regional ecological security pattern [43,44]. The higher the landscape ecological risk, the greater the degree of landscape loss in the region, i.e., the greater the degree of landscape disturbance and vulnerability, thus posing a threat to the sustainability of the landscape [45,46]. Dividing the types of landscape ecological risk zoning based on the results of risk evaluation can achieve effective management of medium- and high-risk areas and prevent transfer to high-risk areas, which helps in mitigating risk and planning the landscape.
The traditional method of ecological source site extraction involves large subjectivity and ignores the significance of source sites to maintain landscape connectivity, so the morphological spatial analysis (MSPA) model, Conefor model, and GIS geographic analysis were selected to screen the core and resting-stone source sites, and the wetland ecological network was extracted based on the MCR model. Ecological source sites and corridors are important structures of ecological networks and play important roles in the migration and dispersal of species. Core source sites are usually large in area and have good habitat quality, and can provide habitats and reproduction sites for species, and resting-stone source sites are usually small in area and widely distributed, and can provide temporary rest and food resupply sites for species. In ecological network planning and construction, core source sites should be implemented as a key protection policy; meanwhile, the cost of protecting and restoring resting-stone source sites is much lower than that of core source sites, so the connectivity of the network can be effectively enhanced by restoring important resting-stone source sites [47,48]. There are many rivers in Dongying, which can be used as both ecological sources and natural corridors, and there are also large and small source sites widely distributed on both sides of the rivers. Therefore, greenway facilities such as artificial water channels, forest, and grass strips can be constructed to connect source sites and enhance the integrity and connectivity of the landscape in the region. In addition, most studies on ecological networks analyze the structure of ecological networks through simple point and line indicators, and there is little evaluation of the network functions. In this paper, by introducing the idea of complex systems, we analyze the topological structure of ecological networks, evaluate the structure and functions of networks from the perspective of systems, and characterize the flow of materials, energy, and information between sources and places through these indicators.
By analyzing its topology, we determined that the ecological network of wetlands in Dongying City plays a key role in the ecological sources: only three core sources and a small number of resting-stone sources, followed by a few key ecological corridors. If the ecological corridors are damaged, the stability of the whole network will be seriously damaged, and the network will be easily degraded if it is not improved. Therefore, the aim of our research is to restore core source sites and add new corridors. The current optimization of ecological networks is mostly based on the connectivity index to evaluate the importance of corridors, mainly by setting the optimal distance threshold of the resistance surface [49,50]. However, in practice, the process of ecological energy flowing between corridors is subject to various specific resistance factors, so this approach is not desirable. With the rise of complex network research, the optimization of complex network structures has become an important element. Common algorithms for such optimization include random addition (RA), low degree first (LDF), low betweenness first (LBF), and shortcut maximum betweenness (SMB) [51,52]. These methods are mostly based on theory and have very few applications in ecological networks. Therefore, this paper proposes a new edge-increasing strategy to modify the resistance surface in the MCR model based on the landscape loss degree to make it more resilient and better able to simulate ecological corridors more realistically so as to achieve increased edges. Although the number of optimized corridors generated by the simulation is small, most of them are directly or indirectly connected to the source sites to be optimized, which should be protected in ecological construction to improve the ecological environment around the source sites and enable them to meet the conditions for forming ecological corridors, so as to strengthen the connection between source sites.
By comparing the connection and recovery robustness of the network before and after optimization, we conclude that the optimized ecological network performs better in the anti-destruction simulation, significantly for connection robustness and insignificantly for point recovery robustness. The edge-increasing strategy proposed in this paper can effectively improve the circulation efficiency of ecological energy in the network, but it does not improve node recovery robustness; probably, due to the strict observance of energy conservation in the ecological network system [53], the edge-increasing will redistribute the energy in the system, so that the energy in the source is reduced, and the reduced energy is circulated in the corridor. In reality, malicious attacks mostly consist of human interference with the natural environment. The optimized network considered from this perspective has better stability.
In general, there are limitations in our study. First, the optimization process only involves side optimization, and the optimization form is relatively single; second, there is no quantitative evaluation of the energy of ecological source points, which makes the mechanism of ecological network energy circulation unclear. Despite the limitations, this study has important implications for the optimization of wetland landscape patterns. By constructing a wetland ecological network in Dongying, we can understand the current status of the local ecological network and scientifically optimize the structure of the wetland network, which is important for protecting and restoring key wetlands, strengthening the connection between wetlands, and promoting the normal function of ecosystem services. The shortcomings of this study will be addressed in future studies.
5. Conclusions
In this paper, we constructed a landscape-ecological risk assessment model by landscape disturbance and fragility degree, explored the spatial distribution of landscape-ecological risk, and constructed a wetland ecological network in Dongying City by using an MSPA-Conefor-MCR model based on complex system theory, and we analyzed topological indicators to determine the integrity of the network structure and function. The structure of the network was optimized through specific strategies to achieve a smoother internal ecological circulation. From this study, we conclude the following:
- The overall ecological risk of wetland landscape in Dongying is high, and the sub-high risk area is the largest. In order to prevent conversion to a high-risk area, protection should be strengthened. In addition, high-value areas are mainly present in areas with complex landscape composition, and there is more human interference in these areas.
- Based on an ecological network constructed using the MSPA and MCR models, the MSPA model identified 6 key ecological source sites and 125 resting-stone source sites, and simulated 180 ecological corridors. Most of the source sites in Dongying have weak ecological function and most of the corridors are poorly connected. The center of gravity of the network is located in communities 1 and 2, and community 3 is mainly distributed in areas with strong human activities, and further conservation work should be prioritized.
- By introducing landscape-ecological risk into the traditional MCR model to optimize the ecological network of wetlands in Dongying City, the recovery and connectivity robustness of the network improved after optimization, but the recovery robustness was not obvious, indicating that the overall connectivity of the network could be improved using some strategy, and the recovery capacity of the source sites could not be significantly improved in a short period of time.
Author Contributions
Conceptualization, J.M.; methodology, J.M.; software, J.M. and L.Y.; validation, J.M. and Q.Y.; formal analysis, J.M.; investigation, Q.Y.; resources, J.M.; data curation, J.M. and H.W.; writing—original draft preparation, J.M.; writing—review and editing, Q.Y., R.W. and M.F.; visualization, J.M.; supervision, Q.Y.; project administration, Q.Y. and M.F.; funding acquisition, Q.Y. and M.F. All authors have read and agreed to the published version of the manuscript.
Funding
This research was funded by Youth Science Foundation of National Natural Science Foundation of China grant number 42001211 and China Academy of Railway Sciences Youth Project Fund grant number 2020YJ131.
Institutional Review Board Statement
Not applicable.
Informed Consent Statement
Not applicable.
Data Availability Statement
Not applicable.
Conflicts of Interest
The authors declare no conflict of interest.
References
- De Groot, D.; Brander, L.; Finlayson, C.M. Wetland ecosystem services. In The Wetland Book I: Structure and Function, Management and Methods; Springer: Berlin/Heidelberg, Germany, 2018; pp. 323–333. [Google Scholar]
- Smeraldo, S.; Bosso, L.; Fraissinet, M.; Bordignon, L.; Brunelli, M.; Ancillotto, L.; Russo, D. Modelling risks posed by wind turbines and power lines to soaring birds: The black stork (Ciconia nigra) in Italy as a case study. Biodivers. Conserv. 2020, 29, 1959–1976. [Google Scholar] [CrossRef]
- Rullens, V.; Stephenson, F.; Hewitt, J.E.; Clark, D.E.; Pilditch, C.A.; Thrush, S.F.; Ellis, J.I. The impact of cumulative stressor effects on uncertainty and ecological risk. Sci. Total Environ. 2022, 842, 156877. [Google Scholar] [CrossRef] [PubMed]
- Wang, H. Regional assessment of ecological risk caused by human activities on wetlands in the Muleng-Xingkai Plain of China using a pressure-capital-vulnerability-response model. Wetl. Ecol. Manag. 2022, 30, 111–126. [Google Scholar] [CrossRef]
- Peng, J.; Dang, W.; Liu, Y.; Zong, M.; Hu, X. Review on Landscape Ecological Risk Assessment. Acta Geogr. Sin. 2015, 70, 664–677. [Google Scholar] [CrossRef]
- Chen, F.; Liu, J.S.; Cao, Y.; Li, S.C.; Ouyang, H. Advances in ecological risk assessment. J. Ecol. 2006, 26, 1558–1566. [Google Scholar]
- Zhang, X.; Du, H.; Wang, Y.; Chen, Y.; Ma, L.; Dong, T. Watershed Landscape Ecological Risk Assessment and Landscape Pattern Optimization: Take Fujiang River Basin as an Example. Hum. Ecol. Risk Assess. Int. J. 2021, 27, 2254–2276. [Google Scholar] [CrossRef]
- Xie, H.; Wang, P.; Huang, H. Ecological Risk Assessment of Land Use Change in the Poyang Lake Eco-Economic Zone, China. Int. J. Environ. Res. Public Health 2013, 10, 328–346. [Google Scholar] [CrossRef] [Green Version]
- Wu, J.; Zhu, Q.; Qiao, N.; Wang, Z.; Sha, W.; Luo, K.; Wang, H.; Feng, Z. Ecological Risk Assessment of Coal Mine Area Based on “Source-Sink” Landscape Theory—A Case Study of Pingshuo Mining Area. J. Clean. Prod. 2021, 295, 126371. [Google Scholar] [CrossRef]
- Gao, B.-P.; Li, C.; Wu, Y.-M.; Zheng, K.-J.; Wu, Y. Landscape ecological risk assessment and influencing factors in ecological conservation area in Sichuan-Yunnan provinces, China. Ying Yong Sheng Tai Xue Bao J. Appl. Ecol. 2021, 32, 1603–1613. [Google Scholar] [CrossRef]
- Xu, X.; Lin, H.; Fu, Z. Probe into the Method of Regional Ecological Risk Assessment—A Case Study of Wetland in the Yellow River Delta in China. J. Environ. Manag. 2004, 70, 253–262. [Google Scholar] [CrossRef]
- Yan, J.; Li, G.; Qi, G.; Qiao, H.; Nie, Z.; Huang, C.; Kang, Y.; Sun, D.; Zhang, M.; Kang, X.; et al. Landscape Ecological Risk Assessment of Farming-Pastoral Ecotone in China Based on Terrain Gradients. Hum. Ecol. Risk Assess. Int. J. 2021, 27, 2124–2141. [Google Scholar] [CrossRef]
- Amuti, T.; Luo, G. Analysis of Land Cover Change and Its Driving Forces in a Desert Oasis Landscape of Southern Xinjiang, China. Soil Syst. Sci. 2014, 5, 1071–1085. [Google Scholar]
- Du, S. Study on the Ecological Risk Evaluation of Xi’an City Landscape Based on Land Use Change. Master’s Thesis, Xi’an University of Science and Technology, Xi’an, China, 2021. [Google Scholar]
- Cui, L.; Zhao, Y.; Liu, J.; Han, L.; Ao, Y.; Yin, S. Landscape Ecological Risk Assessment in Qinling Mountain. Geol. J. 2018, 53, 342–351. [Google Scholar] [CrossRef]
- Jia, X.; Fu, T.; Hu, B.; Shi, Z.; Zhou, L.; Zhu, Y. Identification of the Potential Risk Areas for Soil Heavy Metal Pollution Based on the Source-Sink Theory. J. Hazard. Mater. 2020, 393, 122424. [Google Scholar] [CrossRef]
- Wang, D.; Ji, X.; Li, C.; Gong, Y. Spatiotemporal Variations of Landscape Ecological Risks in a Resource-Based City under Transformation. Sustainability 2021, 13, 5297. [Google Scholar] [CrossRef]
- Farina, A. Principles and Methods in Landscape Ecology: Towards a Science of the Landscape; Springer Science & Business Media: Berlin/Heidelberg, Germany, 2008; ISBN 978-1-4020-5535-5. [Google Scholar]
- Cong, P.; Chen, K.; Qu, L.; Han, J.; Yang, Z. Determination of Landscape Ecological Network of Wetlands in the Yellow River Delta. Wetlands 2020, 40, 2729–2739. [Google Scholar] [CrossRef]
- An, Y.; Liu, S.; Sun, Y.; Shi, F.; Beazley, R. Construction and Optimization of an Ecological Network Based on Morphological Spatial Pattern Analysis and Circuit Theory. Landsc. Ecol. 2021, 36, 2059–2076. [Google Scholar] [CrossRef]
- Chen, Z.A.; Kuang, D.; Gui, X.J.; Zhang, L.T. Construction of ecological network in Yujiang County based on MSPA and MCR models. Yangtze River Basin Resour. Environ. 2017, 26, 1199–1207. [Google Scholar]
- Liu, S.L.; Hou, X.Y.; Yin, Y.J.; Cheng, F.Y.; Zhang, Y.Q.; Dong, S.K. Advances in landscape ecological network research. J. Ecol. 2017, 37, 3947–3956. [Google Scholar]
- Liu, J.J.; Chen, J.R.; Lai, Y.N.; Luo, B.Y.; Zhao, F.; DU, Q. Improvement and application for ecological networks using landscape pattern and connectivity methods. Ying Yong Sheng Tai Xue Bao J. Appl. Ecol. 2019, 30, 3108–3118. [Google Scholar] [CrossRef]
- Kong, F.; Yin, H.; Nakagoshi, N.; Zong, Y. Urban Green Space Network Development for Biodiversity Conservation: Identification Based on Graph Theory and Gravity Modeling. Landsc. Urban Plan. 2010, 95, 16–27. [Google Scholar] [CrossRef]
- Domínguez-García, V.; Dakos, V.; Kéfi, S. Unveiling Dimensions of Stability in Complex Ecological Networks. Proc. Natl. Acad. Sci. USA 2019, 116, 25714–25720. [Google Scholar] [CrossRef]
- Xie, H.; Wen, J.; Chen, Q.; Wu, Q. Evaluating the Landscape Ecological Risk Based on GIS: A Case-study in the Poyang Lake Region of China. Land Degrad. Dev. 2021, 32, 2762–2774. [Google Scholar] [CrossRef]
- Li, J.; Pu, R.; Gong, H.; Luo, X.; Ye, M.; Feng, B. Evolution Characteristics of Landscape Ecological Risk Patterns in Coastal Zones in Zhejiang Province, China. Sustainability 2017, 9, 584. [Google Scholar] [CrossRef] [Green Version]
- Ran, P.; Hu, S.; Frazier, A.E.; Qu, S.; Yu, D.; Tong, L. Exploring Changes in Landscape Ecological Risk in the Yangtze River Economic Belt from a Spatiotemporal Perspective. Ecol. Indic. 2022, 137, 108744. [Google Scholar] [CrossRef]
- Tian, P.; Li, J.; Gong, H.; Pu, R.; Cao, L.; Shao, S.; Shi, Z.; Feng, X.; Wang, L.; Liu, R. Research on Land Use Changes and Ecological Risk Assessment in Yongjiang River Basin in Zhejiang Province, China. Sustainability 2019, 11, 2817. [Google Scholar] [CrossRef] [Green Version]
- Zhang, Y.; Li, Y.; Lv, J.; Wang, J.; Wu, Y. Scenario Simulation of Ecological Risk Based on Land Use/Cover Change—A Case Study of the Jinghe County, China. Ecol. Indic. 2021, 131, 108176. [Google Scholar] [CrossRef]
- Zhong, L.Z.; Ma, J.J.; Zhang, H.Q.; Lv, F.; Zhang, C.X.; Ding, J.; Yang, X.B. Landscape ecological risk assessment in Chongli District, Zhangjiakou City. J. Hebei Agric. Univ. 2019, 42, 30–37. [Google Scholar] [CrossRef]
- Ye, H.; Yang, Z.; Xu, X. Ecological Corridors Analysis Based on MSPA and MCR Model—A Case Study of the Tomur World Natural Heritage Region. Sustainability 2020, 12, 959. [Google Scholar] [CrossRef] [Green Version]
- Zhu, J.; Su, J.; Yin, H.W.; Kong, F.H. Construction of Xuzhou ecological network based on comprehensive sources identification and multi-scale nesting. J. Nat. Resour. 2020, 35, 1986. [Google Scholar] [CrossRef]
- Hu, C.; Wang, Z.; Wang, Y.; Sun, D.; Zhang, J. Combining MSPA-MCR Model to Evaluate the Ecological Network in Wuhan, China. Land 2022, 11, 213. [Google Scholar] [CrossRef]
- Dai, L.; Liu, Y.; Luo, X. Integrating the MCR and DOI Models to Construct an Ecological Security Network for the Urban Agglomeration around Poyang Lake, China. Sci. Total Environ. 2021, 754, 141868. [Google Scholar] [CrossRef] [PubMed]
- García Callejas, D. Structure and Dynamics of Ecological Networks with Multiple Interaction Types. Ph.D. Thesis, Universitat Autònoma de Barcelona, Barcelona, Spain, 2018. [Google Scholar]
- Wu, T. Complex network research and its implications. Philos. Stud. 2004, 8, 58–63. [Google Scholar]
- Mondragón, R.J. Estimating Degree-Degree Correlation and Network Cores from the Connectivity of High-Degree Nodes in Complex Networks. Sci. Rep. 2020, 10, 5668. [Google Scholar] [CrossRef] [PubMed]
- Wang, W.; Tang, C.Y. Distributed Computation of Node and Edge Betweenness on Tree Graphs. In Proceedings of the 52nd IEEE Conference on Decision and Control, Firenze, Italy, 10–13 December 2013; pp. 43–48. [Google Scholar]
- Costa, L.D.F.; Rodrigues, F.A.; Travieso, G.; Villas Boas, P.R. Characterization of Complex Networks: A Survey of Measurements. Adv. Phys. 2007, 56, 167–242. [Google Scholar] [CrossRef] [Green Version]
- Pocock, M.J.; Evans, D.M.; Memmott, J. The Robustness and Restoration of a Network of Ecological Networks. Science 2012, 335, 973–977. [Google Scholar] [CrossRef] [Green Version]
- Wan, H.L.; Wang, S.G.; Chen, B.; Xia, C.Y.; Su, R. Ecological risk assessment and spatial threshold analysis of wetlands in the Sanjiang Plain. J. Ecol. 2022, 16, 1–12. [Google Scholar]
- Pan, F.; Song, M.; Wan, Q.; Yuan, L. A Conservation Planning Framework for China’s National Key Ecological Function Area Based on Ecological Risk Assessment. Environ. Monit. Assess. 2022, 194, 74. [Google Scholar] [CrossRef]
- Li, S.; Xiao, W.; Zhao, Y.; Lv, X. Incorporating ecological risk index in the multi-process MCRE model to optimize the ecological security pattern in a semi-arid area with intensive coal mining: A case study in northern China. J. Clean. Prod. 2020, 247, 119143. [Google Scholar] [CrossRef]
- Zhang, S.; Zhong, Q.; Cheng, D.; Xu, C.; Chang, Y.; Lin, Y.; Li, B. Coupling Coordination Analysis and Prediction of Landscape Ecological Risks and Ecosystem Services in the Min River Basin. Land 2022, 11, 222. [Google Scholar] [CrossRef]
- Tischendorf, L.; Fahrig, L. On the Usage and Measurement of Landscape Connectivity. Oikos 2000, 90, 7–19. [Google Scholar] [CrossRef] [Green Version]
- Fan, J.; Wang, Y.; Zhou, Z.; You, N.; Meng, J. Dynamic ecological risk assessment and management of land use in the middle reaches of the Heihe River based on landscape patterns and spatial statistics. Sustainability 2016, 8, 536. [Google Scholar] [CrossRef] [Green Version]
- Moilanen, A.; Hanski, I. On the Use of Connectivity Measures in Spatial Ecology. Oikos 2001, 95, 147–151. [Google Scholar] [CrossRef]
- Li, Y.-Y.; Zhang, Y.-Z.; Jiang, Z.-Y.; Guo, C.-X.; Zhao, M.-Y.; Yang, Z.-G.; Guo, M.-Y.; Wu, B.-Y.; Chen, Q.-L. Integrating Morphological Spatial Pattern Analysis and the Minimal Cumulative Resistance Model to Optimize Urban Ecological Networks: A Case Study in Shenzhen City, China. Ecol. Process. 2021, 10, 63. [Google Scholar] [CrossRef]
- Kabir, M.; Hameed, S.; Ali, H.; Bosso, L.; Din, U.L.; Bischof, R.; Redpath, S.; Nawaz, M.A. Habitat suitability and movement corridors of grey wolf (Canis lupus) in Northern Pakistan. PLoS ONE 2017, 12, e0187027. [Google Scholar] [CrossRef] [Green Version]
- Jiang, Z.; Liang, M.; Guo, D. Enhancing Network Performance by Edge Addition. Int. J. Mod. Phys. C 2011, 22, 1211–1226. [Google Scholar] [CrossRef]
- Song, S.; Xu, D.; Hu, S.; Shi, M. Ecological network optimization in urban central district based on complex network theory: A case study with the urban central District of Harbin. Int. J. Environ. Res. Public Health 2021, 18, 1427. [Google Scholar] [CrossRef]
- Lovett, G.M.; Jones, C.G.; Turner, M.G.; Weathers, K.C. Ecosystem Function in Heterogeneous Landscapes. In Ecosystem Function in Heterogeneous Landscapes; Lovett, G.M., Turner, M.G., Jones, C.G., Weathers, K.C., Eds.; Springer: New York, NY, USA, 2005; pp. 1–4. ISBN 978-0-387-24091-6. [Google Scholar]
Figure 1.
Geographical location and land cover of study area.

Figure 2.
Schematic diagram of study framework.

Figure 3.
Spatial distribution of landscape ecological risk assessment units.

Figure 4.
Spatial distribution of landscape ecological risks in Dongying City.

Figure 5.
Wetland landscape based on MSPA.

Figure 6.
Distribution of ecological sources (left), ecological resistance surfaces (middle), and ecological corridors (right) in Dongying City.
Figure 6.
Distribution of ecological sources (left), ecological resistance surfaces (middle), and ecological corridors (right) in Dongying City.

Figure 7.
Distribution of degree (left), point-betweenness (middle), and PageRank (right) in Dongying City.
Figure 7.
Distribution of degree (left), point-betweenness (middle), and PageRank (right) in Dongying City.

Figure 8.
Distribution of k-core (left), edge-betweenness (middle), and community (right) in Dongying City.
Figure 8.
Distribution of k-core (left), edge-betweenness (middle), and community (right) in Dongying City.

Figure 9.
Spatial distribution of edge extension in resting-stone source of Dongying City.

Figure 10.
Robustness check of network before and after optimization: network connectivity robustness before optimization (upper left) and after optimization (lower left); node recovery robustness before optimization (upper middle) and after optimization (lower middle); edge-recovery robustness before optimization (upper right) and after optimization (lower right).


Table 1.
Calculation formulas and parameters of landscape indices.
| Landscape Index | Calculation Formula | Parameters and Meaning |
|---|---|---|
| Landscape fragmentation index () | is number of patches and is area of landscape . Index refers to degree of fragmentation of patches in a given landscape type at a given time; larger value indicates lower stability within landscape unit and higher heterogeneity and discontinuity between patches [28]. | |
| Landscape separation index () | A is total landscape area. Index refers to degree of dispersion of particular landscape type. | |
| Landscape dominance index () | is Shannon’s evenness index, calculated by Fragstats 4.2. Index refers to importance of certain landscape types in sample area and their role in forming landscape pattern and maintaining pattern stability. | |
| ) | , , and represent corresponding weights , , , respectively. Index refers to degree of disturbance of ecosystem with different landscape types by human activities. According to previous studies [29,30,31], set a = 0.5, b = 0.3, c = 0.2. | |
| Landscape fragility index () | Unused land = 6, wetland = 5, cropland = 4, grassland = 3, forest land = 2, construction land = 1 | Expert scoring method was used to assign values to landscape. Index indicates sensitivity and vulnerability of landscape types to external disturbances [28]. |
Table 2.
Ecological resistance factor evaluation system.
| Evaluation Factors | Grading Standards | Resistance Value |
|---|---|---|
| Landscape type | Cropland | 500 |
| Woodland | 30 | |
| Sparse woodland | 70 | |
| Other woodland | 100 | |
| High-coverage grass | 10 | |
| Medium-coverage grass | 40 | |
| Low-coverage grass | 80 | |
| Lake | 1 | |
| Reservoir pond | 1 | |
| Tidal flat | 1 | |
| Beach | 1 | |
| Paddy field | 1 | |
| Swamp | 1 | |
| Urban land | 1000 | |
| Rural settlement | 1000 | |
| Other construction land | 1000 | |
| Sand | 700 | |
| Saline-alkali land | 700 | |
| Bare ground | 700 | |
| Bare rock texture | 700 | |
| Other | 700 | |
| NDVI | 0–0.19 | 1000 |
| 0.19–0.42 | 500 | |
| 0.42–0.66 | 200 | |
| 0.66–0.85 | 50 | |
| 0.85 | 1 | |
| Slope (°) | >25 | 1000 |
| 15–25 | 500 | |
| 6–15 | 200 | |
| 2–6 | 50 | |
| ≤2 | 1 |
Table 3.
Landscape ecological risk level area and proportion.
| Ecological Risk Level | Area (km2) | Area Ratio |
|---|---|---|
| Low ecological risk | 746.99 | 10.01% |
| Sub-low ecological risk | 1418.84 | 19.00% |
| Medium ecological risk | 1645.31 | 22.04% |
| Sub-high ecological risk | 2459.59 | 32.94% |
| High ecological risk | 1195.08 | 16.01% |
Table 4.
Statistics of wetland landscape types based on MSPA.
| Landscape Type | Area | Proportion of Wetland Landscape |
|---|---|---|
| Core | 2186.10 | 95.86% |
| Islet | 0.02 | 0.00% |
| Perforation | 9.14 | 0.40% |
| Edge | 81.69 | 3.58% |
| Loop | 0.09 | 0.00% |
| Bridge | 0.98 | 0.04% |
| Branch | 2.54 | 0.11% |
Publisher’s Note: MDPI stays neutral with regard to jurisdictional claims in published maps and institutional affiliations. |
© 2022 by the authors. Licensee MDPI, Basel, Switzerland. This article is an open access article distributed under the terms and conditions of the Creative Commons Attribution (CC BY) license (https://creativecommons.org/licenses/by/4.0/).
Share and Cite
MDPI and ACS Style
Ma, J.; Yu, Q.; Wang, H.; Yang, L.; Wang, R.; Fang, M. Construction and Optimization of Wetland Landscape Ecological Network in Dongying City, China. Land 2022, 11, 1226. https://doi.org/10.3390/land11081226
AMA Style
Ma J, Yu Q, Wang H, Yang L, Wang R, Fang M. Construction and Optimization of Wetland Landscape Ecological Network in Dongying City, China. Land. 2022; 11(8):1226. https://doi.org/10.3390/land11081226
Chicago/Turabian StyleMa, Jun, Qiang Yu, Huiyuan Wang, Linzhe Yang, Ruirui Wang, and Minzhe Fang. 2022. "Construction and Optimization of Wetland Landscape Ecological Network in Dongying City, China" Land 11, no. 8: 1226. https://doi.org/10.3390/land11081226
Note that from the first issue of 2016, this journal uses article numbers instead of page numbers. See further details here.