Article

Preferred Attributes for Sustainable Wetland Management in Mpologoma Catchment, Uganda: A Discrete Choice Experiment

by
Jackson Bunyangha
1,2,*,
Agnes. W. N. Muthumbi
2,
Anthony Egeru
3,
Robert Asiimwe
4,
Dunston W. Ulwodi
5,
Nathan. N. Gichuki
2 and
Mwanjalolo. J. G. Majaliwa
6
1
Department of Science, Technical and Vocational Education, Makerere University, Kampala P.O. Box 7062, Uganda
2
Department of Biology, Faculty of Science and Technology, University of Nairobi, Nairobi P.O. Box 30197, Kenya
3
Department of Environmental Management, Makerere University, Kampala P.O. Box 7062, Uganda
4
Department of Agribusiness and Natural Resource Economics, Makerere University, Kampala P.O. Box 7062, Uganda
5
The National Treasury and Planning, Nairobi P.O. Box 30007-00100, Kenya
6
The Regional Universities Forum for Capacity Building in Agriculture, Makerere University Main Campus, 151/155 Garden Hill Rd., Wandegeya P.O. Box 16811, Uganda
*
Author to whom correspondence should be addressed.
Land 2022, 11(7), 962; https://doi.org/10.3390/land11070962
Submission received: 21 May 2022 / Revised: 16 June 2022 / Accepted: 17 June 2022 / Published: 23 June 2022

Abstract

:
Sustainable wetland management is a focus of many countries worldwide. These mainly use protection as a key policy directive for conservation. However, avoidance directives tend to disenfranchise local populations. Thus, such management is often resisted and rarely effective. Tailoring management strategies to user preferences allows conservation to support community livelihoods for sustainable development. This study employed a discrete choice experiment to determine the wetland management attributes preferred by residents of Mpologoma catchment as a prelude to developing a co-management system. Listed in descending order, attribute preferences were paddy farmers’ schemes, fish farming, education and research, protected wetland area, and recreation and tourism. Respondents’ characteristics influenced their choices. Older adults were more likely to support fish farming. In contrast, existing paddy farmers tended to resist such focuses and an increase in protected wetland area. Additionally, respondents with higher education were opposed to paddy farmers’ schemes, and the preference for education and research was positively influenced by respondents’ income. Respondents were willing to pay between $0.64 and $1.76 per household for each unit improvement in the preferred attribute. Our results underscore the role of DCEs in unlocking individuals’ attribute preferences, whose integration into co-management systems can be important for sustainable wetland conservation.

1. Introduction

Wetlands, the intermediate zones between terrestrial and aquatic habitats [1], perform diverse functions ranging from the ecological to the socio-economic, which are of relevance to a thriving global community [2,3,4]. In addition to water purification, climate regulation, food security, flood control, recreation, and nutrient cycling, among others [2,5,6], wetlands are renowned bird havens and migratory bird stopovers [7,8,9]. The provision of such diverse ecosystem services strategically anchors wetlands to contribute to the achievement of sustainable development goals (SDGs) [4,10,11]. However, wetland encroachment is rising and these ecosystems continue to be lost and degraded worldwide [12,13]. It is estimated that over two-thirds of global wetlands declined between the 20th century and the first decade of the 21st century [12,14]. Significant threats have been mainly anthropogenic: pollution, fragmentation and transformation [15,16,17,18,19]. Amid the ever-growing human population and changing climate, encroachment on wetlands is projected to exponentially increase in the near future [20,21,22]. This will further reduce the range of ecosystem services that society derives from these areas. Therefore, wetland conservation and restoration have become key priorities for countries worldwide [23,24,25].
Globally, one major milestone in wetland protection has been the establishment of an intergovernmental environmental treaty, the Ramsar Convention on Wetlands of International Importance in Iran, 1971. The treaty provides for national action and international cooperation, and Contracting Parties are required to select suitable wetlands in their territories for inclusion in the list of Ramsar sites. To plan and promote wise use of wetlands following the realization that wetlands are indeed not wastelands [26,27,28], treaty-acceding governments formulated national laws and policies on wetlands. The importance of laws and policies in promoting natural resource conservation cannot be underestimated [29,30]. Nevertheless, “avoidance” as a prime directive in these laws and policies is deterrent and rarely effective [26,31]. Property owners and local communities often resist avoidance because it tends to disenfranchise local populations of the right to use the resources to meet their needs. This can result in a vicious cycle of human-ecosystem conflicts [32,33]. To be effective and sustainable, wetland conservation should not only empower local communities to esteem wetlands but also involve them in the management programs, projects, and actions [34,35]. Community involvement helps integrate government policies and decisions with socio-cultural, economic, and other needs of the communities [34] and is particularly important in anthropized landscapes [36]. A key catalyst in this direction is ecosystem valuation [1,37,38]. Economic valuation of ecosystems increases awareness, appreciation, and support from the public for nature conservation and justifies environmental investment [27,39]. In doing so, ecosystem valuation can be a means of making environmental policies effective in communities, especially those in developing countries [39].
Several valuation techniques have been used in the existing literature to estimate the economic value of wetlands and other ecosystems [27,40]. These techniques aim to aid the wise use and management of natural resources [41]. The first category includes revealed preference methods—such as market price and production function techniques; surrogate market techniques such as travel cost and hedonic pricing; and cost-based techniques such as replacement costs—that involve observing individual behavior in real markets to measure ecosystem value [42,43]. It must be noted that the absence of market price for ecosystem goods and services, of close replacements or substitutes, or of links to other production or consumption processes, should not be used to indicate that the ecosystem has no value to the community [40]. Therefore, the second category comprises stated preference methods such as contingent valuation, conjoint analysis, and discrete choice experiments (DCEs), where individuals are asked to directly state their preference for ecosystem services in a survey context [43]. In contingent valuation, value is inferred by directly asking individuals to note how much they would be willing to pay (WTP)/accept (WTA) for a specific environmental service or alternative in a hypothetical purchase situation [37,40,44]. The focus is on valuing the nonmarket good as a whole (i.e., multiple ecosystem services), although it can also be applied to a single ecosystem service [44], such as drought mitigation [45]. Conjoint analysis and DCEs also elicit preferences and have much in common; however, the former lacks a sound theoretical relationship with real market choice behavior that is consistent with economic demand theory [43]. The traditional conjoint analysis evolved from a purely mathematical theory of Conjoint Measurement. Consequently, it is not concerned with human behavior or human preferences but number systems; as such, its application to human behavior is inappropriate [43]. DCEs, on the other hand, have a well-tested theoretical grounding in random utility theory (RUT) that is consistent with economic demand theory [43]. Considering this, the authors, used DCE for the study since interest was in understanding which wetland management attributes motivate respondents’ wetland-use choices in the catchment.
DCEs are rooted in the random utility theory works of Luce [46] and McFadden [47], and Lancaster’s model of consumer choices [48]. According to Lancaster, consumer utility is derived from the attributes of the good and not the good itself per se. This model assumes that consumers are rational beings and will choose those attributes of the good that give them maximum satisfaction [49]. Luce [46] posits that there is independence of irrelevant alternatives (IIAs) when individuals make choices about goods. In essence, this means that, if an individual attaches more value to a particular wetland attribute than they do to other attributes from the same set of wetland attributes, even in the presence of other attributes, the individual’s choice will not be altered. DCEs consist of several choice sets, each having mutually exclusive hypothetical alternatives, where the respondent is asked to choose the one preferred [50]. DCEs usually have a status quo option to reflect a real market situation where a consumer can decide not to buy if none of the presented attribute combinations satisfies their utility [43,51,52]. The respondent’s choice indicates how important the selected attribute levels of the good in one choice set are relative to other alternatives with different attribute levels in the same choice set [53]. In so-doing, the choices imply tradeoffs among attribute levels in the alternatives of a choice set [50,51,54,55]. Including the cost attribute enables estimation of the marginal utility which can be converted to WTP estimates for changes in attribute levels [50,52,56,57].
DCEs have been used in many places around the world to model preferences for ecosystem services. Among these are studies on water bodies such as lakes, rivers and the sea [58], groundwater remediation [59], and sustainable urban drainage systems [60]. Their use in wetland valuation is also increasing [54,56,61,62,63]. In Uganda, there has not been any use of DCEs to elicit preferences for sustainable wetland use in the country. The wetland valuation studies in Uganda have primarily focused on the importance and value of goods and services provided by wetlands using such methods as market price, productivity, and contingent valuation [64,65]. The information from the previous studies was not robust enough to guide policy or influence management or user decisions. Consequently, wetland encroachment is still high [20] mainly due to the conflict between resource users and conservation policies, which has fueled increased reduction in wetland area and quality. In 1994, Uganda’s wetlands covered approximately 15.5% of the country’s total land surface [66]. However, this reduced to just 8.9% in 2016 [66] and is projected to further decrease by 2040 [20]. Uncontrolled expansion of subsistence agriculture, settlement, and industrial development have been the major drivers [20,66,67]. Making wetland policies more flexible and relevant to the needs of the local populations would reduce wetland encroachment since the community would become more responsible for the resource so that they continue to obtain benefits from it. Therefore, the objectives of the study were (i) to identify the attributes that are preferred by the local community of Mpologoma catchment for sustainable management of the wetlands in the catchment, (ii) determine the influence of socio-economic and demographic characteristics of respondents on the choices, and (iii) estimate the individuals’ willingness to pay for each of the attributes. The authors hypothesized that there would be an attribute gradient where attributes that are most preferred would generate more utility for respondents than those that are less preferred. Accordingly, respondents would be willing to pay more for the high valued attributes than the less valued attributes. The authors hope that tailoring management options to wetland attributes that are preferred by communities and involving the local populations in conservation programs and projects could prove useful in achieving sustainable management of wetlands and contribute to sustainable development.

2. Materials and Methods
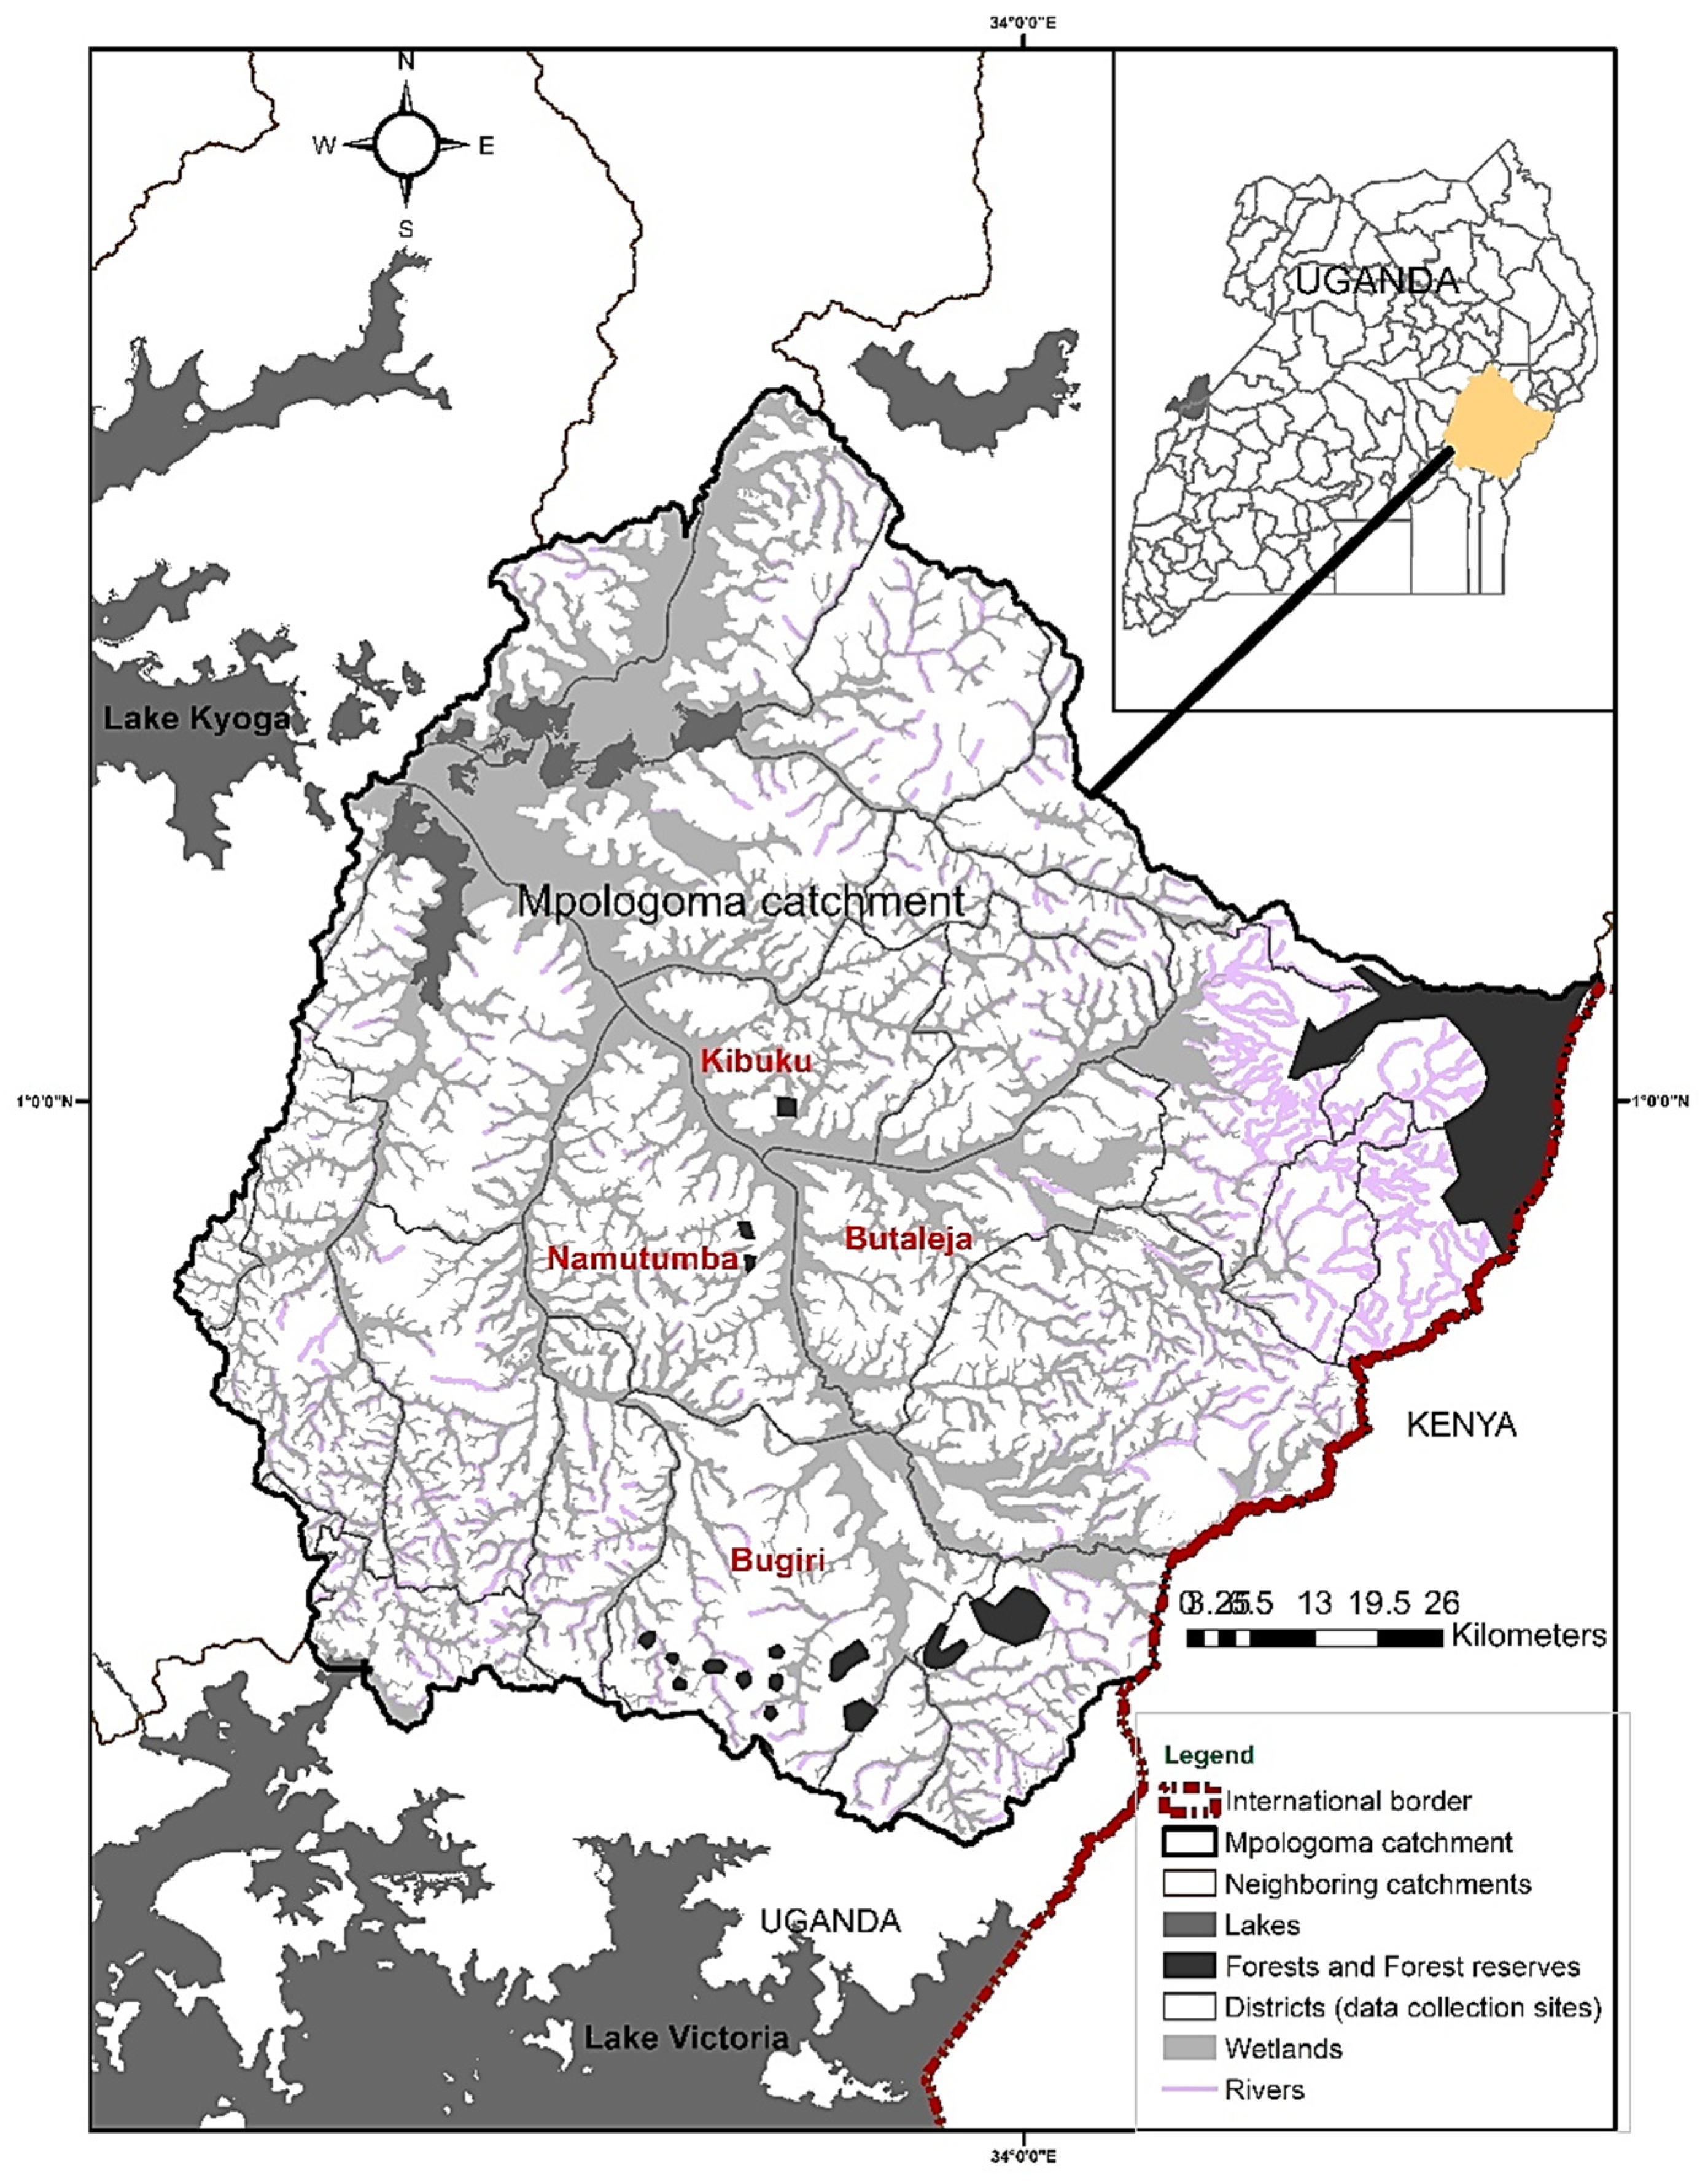
2.1. Study Site

The study was carried out in Mpologoma catchment, eastern Uganda (Figure 1). Mpologoma catchment is located within the Kyoga water management zone and covers approximately 12,915 Km2 [20]. Mpologoma catchment derives its name from Mpologoma River which forms the region’s main drainage network and empties its water into Lake Kyoga [68]. The catchment has numerous wetlands covering roughly 20% of the total area [20] and in some districts, close to 75% of the area is comprised of wetlands [69]. Mpologoma catchment is a major food basket for Uganda, largely through paddy rice production [70]. Lately, agricultural encroachment on the catchment’s wetlands has increased [20], affecting soil biodiversity [71] and bird and reptile species [72]. Increased uncontrolled conversion of wetlands into farmlands deprives the community of other ecosystem services that wetlands provide such as flood protection. Flood incidences are not uncommon in the catchment and have claimed lives and property in Kibuku district (Nandere village) and Butaleja district [73,74]. The need to conserve the region’s wetlands has become a glaring national concern prompting evictions [75]. Despite such actions being taken, farmers have continued to creep back onto the wetlands for paddy rice farming, signifying a high and intricate human dependence on these resources for livelihood [15].

2.2. Design

The survey used a stated preference DCE approach where respondents were presented with sets of hypothetical alternatives and asked to choose their most preferred wetland management scenario. The alternatives in each choice set presented improvements in the existing wetland condition using varying attribute levels. Attributes are the components of the good that needs to be managed and have two or more levels. Levels are the alternative manifestations of each of the attributes [53,76,77].
Identification of attributes and attribute levels is the first step of a DCE [54,78]. Attribute selection passed through several screens: literature review, consultations with specialist wetland researchers from Makerere University and the University of Nairobi, and key informant interviews with District Wetland Officers. Additionally, focus group discussions were held with the local communities. The objective of the FGDs was to understand what the communities knew about the wetlands in their vicinity regarding the benefits and pressures or threats. Participants were encouraged to freely interact with each other and use their local language. Several benefits were stated including fish, papyrus, pasture, and paddy farmland, among others. Prolonged drought emerged as a major threat. Participants were asked to identify any five key attributes from the generated list. Participants were also asked to come up with the local terms for the wetland management attributes. Therefore, FGDs enhanced conceptualization and contextualization of attributes in the language and vocabulary of the local population. The selected ecological and socio-economic wetland management attributes and their levels pertaining to Mpologoma wetlands are described in Table 1. They included wetland area protected for biodiversity, education and research, recreation and tourism, fish farming, and paddy farmers’ schemes. The cost attribute was included to enable conversion of marginal utility estimates to WTP estimates for changes in attribute levels [51]. Residents were asked how much one-time-off payment they were willing to donate to an independent environmental management fund (non-governmental organization) to manage the wetlands on their behalf so that they could maximize utility from their preferred attributes. The suggested amount ranged between UGX 0 and 10,000 (mean ± SD, UGX. 4060 ± 3699; Exchange rate (2 September 2019) $1 = USh3683.3055 [79]. We used this to generate price levels of UGX. 0, 2500, 5000 and 7500 within 1 standard deviation of the mean.
The attributes were subsequently used to construct choice sets in a blocked D-efficient design in Stata 14 [78,80,81]. This generated 36 alternatives grouped into twelve choice sets. The choice sets were blocked into three random blocks each of four sets. An example of the choice cards is shown in Figure 2. Each choice set had three alternatives: the status quo and two other options that bore improvements in attribute levels. The payment for the base alternative (status quo) was zero since it involved no change in existing conditions. The questionnaire was piloted with 50 randomly selected residents at Hijiji village, Butaleja District and Lyama village, Kibuku district.
The survey was carried out after approval by the ethics committee of the University of Nairobi. At the time of fieldwork, the authors first introduced themselves to the district and local leaders to seek their clearance before proceeding to the communities. Gender-balanced research assistants were picked from the very communities from which information was collected. This helped to penetrate the communities with ease and minimized gender-related biases. The research assistants were first trained in every detail about the survey including the introduction, respondents’ socio-economic and demographic characteristics, DCE attributes and their levels, and generally how to administer the questionnaires. Attributes could be translated to the local language and thus, knowledge of the local language was paramount to enhance respondents’ comprehension. The importance of respondents considering all attributes prior to making a decision was emphasized. Each research assistant was then guided to test out the DCE on a colleague under the supervision of the researchers. This warm-up and the feedback thereof aimed to bring all research assistants to a common understanding of the task at hand and of the experiment so that the requisite information could be collected.
Questionnaires were administered face-to-face to 400 individuals that were randomly selected from the target population. According to Pearmain et al. [82], sample sizes over 100 are able to provide a basis for modeling preference data, in DCE designs [83]. Previous studies [54,56,63,84] have used random sampling techniques to determine sample sizes that have ranged between 300 and 1200 respondents. The research team considered 400 individuals as sufficient given the budget constraints. Multistage sampling techniques were used to identify the respondents to be interviewed. Four districts (Butaleja, Bugiri, Kibuku and Namutumba), located within the River Mpologoma catchment area, were purposively selected due to their high involvement in paddy farming. Within each district, one subcounty was randomly selected from a list of sub-counties obtained from the district headquarters. The research team worked with the respective District Environmental Officers to obtain a list of villages in each subcounty selected for the study and five villages were randomly selected. In the last stage, working with the village chairpersons, a list of households in each village was constructed to form the sampling frame at village level. Twenty households were randomly selected from each village using random numbers generated by the Excel random numbers’ generator and the respective village chairpersons led the research team to the selected households. Selection of households was synonymous with selection of respondents. Individuals from the selected villages were assumed to be abreast with the wetlands of concern on issues such as the benefits and threats, and thus most suitable for the study. In cases where individuals were missing in the selected households or were unwilling to participate in the study, replacements were made by randomly drawing from the sampling frame.
Each respondent answered four choice sets from the same randomly assigned block. The research team clearly explained to the respondents the aim of the study, and the attributes and their levels in the language that the respondents could best understand, that is, English or the local language. Respondents were reminded that there were no right or wrong answers, but instead that it was their opinions on the different wetland management scenarios that were being sought. Supplemental information on the socio-economic and demographic characteristics of the respondents was also captured from the respondents. This included sex, age, highest education level, household size, proximity to the wetland, monthly income, presence of income alternatives, and whether the respondent was actively using the wetland for paddy farming. The questionnaire took on average 50 min to complete. Respondents’ attitudes and perceptions towards government interventions could potentially bias survey responses. This source of bias was minimized by constantly reminding and assuring the respondents that the data collected would be used only for academic purposes.

2.3. Model Specification

In a choice situation, choosing a specific alternative among several options implies that the selected alternative gives the individual maximum utility [85,86]. Employing the random utility theory (RUT), it is assumed that the utility (Urj) that an individual r derives from wetland management alternative j (j ϵ J, J = 1,2,3,…12) is a function of the observed component (Vrj) known by the researcher up to some parameters and the unobserved component (εrj) that the researcher treats as random (often referred to as disturbance):
U r j = V r j + ε r j   j
Since the deterministic component, Vrj, is defined by the attributes for the j alternative, Equation (1) could be written as:
U r j = β A r j + δ C r j + γ S r + ε r j
where Arj is a vector of the wetland attributes presented to respondent r; Crj is the cost associated with a given wetland management alternative presented to respondent r; Sr is a vector of respondent’s socio-economic characteristics; and β, δ, and γ are the respective estimated coefficients (marginal utilities) [54,57]. A rational respondent r chooses alternative j over k if and only if Urj > Urk, k ϵ J and kj, with a probability:
p r o b   ( U r j > U r k ) = p r o b   [ ( β A rj + δ C rj + γ S r + ε rj ) > ( β A rk + δ C rk +   γ S r + ε rk ) ] = p r o b [ ( ε rj ε rk ) > ( β A rk + δ C rk )   ( β A rj + δ C rj ) ]
If utility linearly relates with attributes in the parameters and variables function and εrj is an independently, identically distributed (IID) extreme value, then (εrjεrk) is assumed to follow a logistic distribution [57,87,88]. The probability of choosing option j among J alternatives would, thus, be expressed in terms of a logistic distribution (conditional logit model) [47,89] as:
p r o b   ( U r j > U r k ) = exp ( β A r j + δ C r j ) Σ k ϵ J exp ( β A r k + δ C r k )
From the above function, it is observed that the conditional logit estimation aims to use the attributes of the wetland management scenarios to explain the probability of a respondent choosing a particular alternative [89]. It is also clear that the respondent’s characteristics (Sr) are not directly identifiable in the above estimation. However, these only enter as interaction terms with the wetland management scenario attributes since they are constant across choice situations [54].

2.4. Estimation of the Marginal Willingness to Pay (WTP)

The marginal WTP for a one-unit improvement in each specific attribute t, t ϵ A was calculated as follows:
m W T P t , r = β ^ t δ ^
where β ^ t is the estimated marginal utility coefficient for the terms related to the attribute t and δ ^ is the estimated marginal utility for the cost coefficient [62].

3. Results

3.1. Sample Characteristics

Of the 400 individuals who received the questionnaires, 360 responded to the tasks including the 14 who gave protest answers for their choice of status quo. Protest respondents explained that they were unwilling to pay because: it was not their responsibility but that of the government to manage the resource, wetland management was not a priority to them, they did not trust the NGOs to manage the funds, and/or the proposed management scenarios (projects) were not making sense to them. Table 2 shows the descriptive statistics of respondents’ characteristics for all those who completed the questionnaires in total (including those who were willing to pay and those who were not) and those who were willing to pay (non-protest responses). A majority of the respondents had small households (with not more than 5 members) located within a 5-km radius from the wetland. About two-thirds of the respondents were male. Most respondents were below 40 years of age and had attained secondary education as their highest level of education. A substantial number (81%) of respondents was actively involved in paddy farming at the time of the study. About two-fifths of the participants had more than one source of income; however, majority (nearly 75%) of them earned not more than $40 per month.

3.2. Respondents’ Preference for Wetland Management Attributes

Protest responses were excluded from the analysis of attribute preferences because they would bias WTP estimates. The authors are optimistic that the selectivity bias is not large because the protest responses were only a small share (3.5%) of the overall sample. Consequently, further analysis considered responses from the 346 non-protest individuals. The socio-economic characteristics for the individuals who were willing to pay (Table 2) were regrouped into two classes per characteristic. Age was categorized as follows: 40 years and above, to represent the elderly population who are less engaged in active working in agricultural farms and those below 40 years (18–39), who are the most actively working age group in Uganda [90,91]. Concerning income, the catchment lies in the poorest Eastern (Bukedi) region of Uganda with an average monthly income of about $40 [92]. In addition, during the informal interviews, respondents reported that they would on average spend approximately 40 USD to meet their basic monthly needs. Therefore, $40 was taken as a yardstick for this study population. Regarding the household size, on average, every household in Uganda has 4.6 persons [93]. The authors approximated this to 5 persons per household and created two categories: households with five and less individuals and those with more than five individuals. The 5 km distance was deduced during the study (Table 2) since it was the average walking distance for the majority of the respondents from their households to their paddies. Table 3 shows the descriptive statistics of the 346 respondents and the attributes used for the analysis of attributes preference.
The marginal coefficients for the different sustainable wetland management attributes are shown in Table 4. All the coefficients for the attributes as well as the cost and ASC were significant. This implies that respondents highly valued the improvements in the current condition of the wetlands in the catchment. The preference was paddy farmers’ schemes, fish farming, education and research, protected wetland area for biodiversity, and recreation and tourism, in decreasing order. The cost attribute had a negative sign indicating that respondents were less likely to choose improved but expensive wetland management alternatives. This is consistent with economic theory [94]. Attribute coefficients in the two models were very close to each other. However, the standard errors in the mixed logit were greater than those in the conditional logit model. Consequently, the authors chose to use the conditional logit over the mixed logit for further analyses.

3.3. Influence of Respondents’ Characteristics on Attribute Preference

Table 5 shows the results of the interaction of respondents’ socio-economic and demographic characteristics with the different wetland management attributes. Generally, respondents’ socio-economic factors influenced their choices differently. Preference for protected wetland area for biodiversity (WAB) and education and research (ER) was positively influenced by respondents’ income. Individuals who earned at least $40 per month had positive log odds of supporting ER and WAB than those whose monthly income was less than $40. However, respondents who at the time of the study were using the wetland to grow rice were more likely to resist the increase in protected wetland area. For recreation and tourism, respondents’ preference was positively influenced by household size and negatively influenced by gender. Large households with five or more members had more log odds of supporting recreation and tourism programs than smaller families with less than five members. In addition, male respondents were less likely to support the recreation and tourism programs than females. Preference for fish farming was positively influenced by respondents’ age and income alternatives and negatively influenced by household size and current use of the wetland for paddy farming. Respondents aged 40 years and above, and who had income alternatives were likely to support fish farming. However, those with large households, and who at the time of the study were using the wetlands for paddy farming were more likely to resist fish farming initiatives. Finally, preference for paddy farmers’ schemes was negatively influenced by respondents’ education level and positively influenced by presence of income alternatives. Having more than one source of income increased the respondents’ chances of choosing paddy farmers’ schemes while attaining secondary and tertiary education reduced those chances.

3.4. Respondents’ Willingness to Pay for Wetland Management Attributes

By estimating the changes in wetland ecosystem that would be caused by implementing the various wetland management scenarios, the marginal value of each wetland attribute was calculated. From the marginal utility coefficients for the attributes in the model with interactions (Table 4), willingness to pay was derived using the delta method [95]. Table 6 reports estimates of the respondents’ marginal willingness to pay per household for a one unit increase in attribute level from the status quo. All the WTP values are positive, implying that the attributes increase the average utility from the wetland. Therefore, respondents were willing to pay, on average, $0.9 for a 10% increase in protected wetland area for biodiversity, $1.3 for every education and research activity introduced, and $0.6 for each recreation and tourism facility created. With respect to fish farming and paddy farmers’ schemes, respondents were willing to pay on average $1.8 for a doubling of the current number of fish ponds and $1.54 for each farmers’ scheme created, respectively.

4. Discussion

The main objective of this study was to assess attribute preference for sustainable management of wetlands in Mpologoma catchment. Using a DCE to survey the population and analyzing the results with a conditional logit model, it was found out that the most preferred wetland management attribute was paddy farmers’ schemes followed by fish farming, education and research, protected wetland area for biodiversity, and recreation and tourism. All the coefficients for the wetland management attributes were significant and positive, implying that respondents highly valued the attributes. There has not been a local study on wetlands in Uganda that uses DCE to assess attribute preferences for sustainable wetland management, making national comparisons difficult. Moreover, no study elsewhere has evaluated exactly the same attributes as we did in the current study. However, the results from this study converge with estimates from similar studies on wetlands and aquatic ecosystems elsewhere [54,56,62,96]. This convergence is attributed to the central role that ecosystems play in human well-being [15].
Estimates of the willingness to pay (WTP) were positive, implying that, generally, improvements in attributes increased the average utility that respondents could obtain from the wetlands in Mpologoma catchment. However, the values were not the same for all the attributes perhaps due to the attitudes of the respondents towards particular comforts derived from the attributes [97]. Attitude is crucial in making decisions about environmental attributes because it affects individuals’ WTP for the chosen ecological attributes [97]. Consequently, attitude largely contributes to the dissimilarities in corresponding WTP quantities [62,97].
The WTP values in this study are comparatively lower than those reported elsewhere [54,56,96]. To a large extent, the divergence from other studies could be attributed to the low-income status of the rural respondent community in this study which could have affected the amount of money that respondents were willing to pay for changes in the particular attributes [96]. In addition, the disparity could be owed to the method used in the analysis, although this may not be significant. This study used the conditional logit model to estimate the attribute coefficients and the most accurate delta method for WTP estimation [95]. However, similar studies [54,56,62,96] that used a variety of methods did not find any significant difference in the WTP across the methods. Therefore, our WTP estimates could be relied upon for policy as a true reflection of the situation in the catchment.
Preference for the various attributes was influenced by the socio-economic factors of the respondents which could also influence their WTP. This is because these factors affect the level of awareness that a person has about the value of a particular attribute and the comfort they obtain from it [57,97]. For this study, the influencing factors were age of the respondent, gender, income, education level, availability of income alternatives, size of the household, and existing wetland use status. Similar studies have identified age, gender, education status, and income as major factors that influence the preferences for ecosystem services [54,57].
The willingness of individuals to pay for the preferred attributes implies that communities derive positive utility from the resource, would not wish to lose it, and are willing to become involved in its conservation. This indicates an opportunity for policy makers that could be exploited to achieve successful co-management of wetlands. The benefits of community-based natural resource management (CBNRM) cannot be overemphasized. In addition to diversifying livelihoods, CBNRM strengthens local communities for common property management, since it empowers individuals to assume resource ownership [98]. Case studies where communities have been involved in co-management such as in forest [99], fisheries [100,101], and parks and protected areas [102] could spell a similar trajectory for wetlands [98]. Therefore, the CBNRM framework could be useful to governments in achieving national development goals including environmental conservation.
By using the DCE, this study has identified the specific attributes that are preferred by the community of Mpologoma catchment for sustainable management of the wetlands in the catchment. These attributes can be focused on when developing sustainable wetland management plans for the concerned landscapes. This is particularly important at this time when encroachment on wetlands has become a national and global issue [13,72]. Previous studies on ecosystem valuation in Uganda estimated the total economic value of the particular wetlands to justify economic investment in conservation [64,65]. However, the studies did not identify the specific attributes that could be targeted for sustainable wetland management. Moreover, the studies were silent on the potential of involving the community in wetland management. This study suggests that by permitting the community to utilize the wetland resource in a sustainable manner, the community will benefit from the resource while at the same time conserve it. However, this requires an innovative leadership at the community level that ensures that the resource is used to meet the basic needs of the local population, and the community has a decisive voice in resource planning [103].
Similar to other studies that have used the DCE and stated preference survey, this study had some limitations. Due to the fact that the authors were dealing with hypothetical scenarios, the generated responses could have proved different had real projects been used instead [40]. In addition, this DCE was the first of its kind in the area and could have challenged the respondents. Moreover, the government of Uganda has intentions of evicting paddy farmers from the wetlands [72,104] and this could have biased respondents’ choice of management options. Therefore, it was ensured that respondents provided as genuine responses as possible through the creation of comfortable environments within which the questionnaires were taken. The first stage of this study thoroughly explained the survey using the language that respondents could best understand, this being English or a local language. In addition, the authors applied icebreakers to ensure that respondents felt relaxed and safe. Despite this, some respondents could have provided biased responses, particularly if they failed to properly interpret the choice scenarios regardless of their clarity. Our approach may also have had some limitations especially due to the fact that a few ecosystem services were considered. We recommend the scope to be broadened to include supporting and regulatory services. In addition, further DCE studies should be carried out on other catchments.

5. Conclusions

This study sought to identify the preferred attributes for sustainable management of Mpologoma wetlands. In descending order, attribute preference was paddy farmers’ schemes, fish farming, education and research, protected wetland area, and recreation and tourism. Attributes that had more direct utility for respondents (fish farming and paddy farmers’ schemes) had higher marginal utility coefficients than those that appeared to have less direct utility (education and research, wetland area and biodiversity, and recreation and tourism). Socio-economic and demographic factors of the respondents such as sex, age, income, and education level, among others, had an influence on attribute preferences. These should be considered when designing policy interventions for sustainable management of wetlands. Individuals were willing to pay for the preferred attributes indicating that the wetlands are part and parcel of their livelihoods. Therefore, policy makers should support this cause by involving stakeholders (including local communities) in developing wetland management policies and plans. Economic empowerment of rural communities is also emphasized if wetland conservation is to be successful since it directly relates with their willingness to pay.

Author Contributions

Conceptualization, J.B., D.W.U., A.W.N.M. and N.N.G.; methodology, J.B., R.A. and D.W.U.; validation, J.B., A.W.N.M. and R.A.; formal analysis, J.B., R.A. and D.W.U.; investigation, J.B.; resources, J.B., R.A. and D.W.U.; data curation, J.B. and R.A.; writing—original draft preparation, J.B. and R.A.; writing—review and editing, J.B., A.W.N.M., R.A., D.W.U., A.E., N.N.G. and M.J.G.M.; visualization, J.B., R.A. and A.E.; supervision, A.W.N.M., N.N.G. and M.J.G.M.; project administration, J.B., A.W.N.M. and N.N.G.; funding acquisition, J.B., A.E. and M.J.G.M. All authors have read and agreed to the published version of the manuscript.

Funding

This research was funded by UK Research and Innovation (UKRI) through the Global Challenges Research Fund (GCRF) program, Grant Ref: ES/P011306/under the project Social and Environmental Trade-offs in African Agriculture (SENTINEL) led by the International Institute for Environment and Development (IIED) in part implemented by the Regional Universities Forum for Capacity Building in Agriculture (RUFORUM), and Makerere University (DELP Small Research Grant).

Institutional Review Board Statement

The study was approved by the ethics Committee of the University of Nairobi (I80/52736/2018).

Informed Consent Statement

Respondents were informed of the purpose of the study and assured of anonymity before they participated in the study.

Data Availability Statement

The data presented in this study are publicly available in FigShare at https://doi.org/10.6084/m9.figshare.19794550, accessed on 19 May 2022.

Acknowledgments

The authors are indebted to the respondents without whom the study would not have been a success. Sincere thanks go to the District Environmental Officers and the local leaders who made it easy for the researchers to access the communities. We are grateful to field assistants Bituge Samuel, Mirembe Sarah, Benjamin Simiyu and Auma Martha whose language interpretation ensured that the requisite information is collected from the respondents.

Conflicts of Interest

The authors declare no conflict of interest and the funders had no role in the design of the study; in the collection, analyses, or interpretation of data; in the writing of the manuscript, or in the decision to publish the results.

References

  1. Ramachandra, T.V.; Rajinikanth, R.; Ranjini, V.G. Economic valuation of wetlands. J. Environ. Biol. 2005, 26, 439–447. [Google Scholar] [PubMed]
  2. de Groot, R.; Brander, L.; van der Ploeg, S.; Costanza, R.; Bernard, F.; Braat, L.; Christie, M.; Crossman, N.; Ghermandi, A.; Hein, L.; et al. Global estimates of the value of ecosystems and their services in monetary units. Ecosyst. Serv. 2012, 1, 50–61. [Google Scholar] [CrossRef]
  3. Griggs, D.; Stafford-Smith, M.; Gaffney, O.; Rockström, J.; Öhman, M.C.; Shyamsundar, P.; Steffen, W.; Glaser, G.; Kanie, N.; Noble, I. Sustainable development goals for people and planet. Nature 2013, 495, 305–307. [Google Scholar] [CrossRef]
  4. Pritchard, D. Wise use of wetlands: Concepts and approaches for the wise use of wetlands. In Ramsar Handbooks for the Wise Use of Wetlands, 4th ed.; Ramsar Convention Secretariat: Gland, Switzerland, 2010; Volume 1, p. 8. [Google Scholar]
  5. Costanza, R.; de Groot, R.; Sutton, P.; van der Ploeg, S.; Anderson, S.J.; Kubiszewski, I.; Farber, S.; Turner, R.K. Changes in the global value of ecosystem services. Glob. Environ. Change 2014, 26, 152–158. [Google Scholar] [CrossRef]
  6. Maltby, E. Wetland management goals: Wise use and conservation. Landsc. Urban Plan. 1991, 20, 9–18. [Google Scholar] [CrossRef]
  7. Giosa, E.; Mammides, C.; Zotos, S. The importance of artificial wetlands for birds: A case study from Cyprus. PLoS ONE 2018, 13, e0197286. [Google Scholar] [CrossRef]
  8. Rajpar, M.N.; Zakaria, M. Assessing an artificial wetland in Putrajaya, Malaysia, as an alternate habitat for waterbirds. Waterbirds 2013, 36, 482–493. [Google Scholar] [CrossRef]
  9. Webb, E.B.; Smith, L.M.; Vrtiska, M.P.; Lagrange, T.G. Effects of Local and Landscape Variables on Wetland Bird Habitat Use During Migration Through the Rainwater Basin. J. Wildl. Manag. 2010, 74, 109–119. [Google Scholar] [CrossRef]
  10. Anon. Act Now on Wetlands for Achieving the Sustainable Development Goals (Agenda 2030). Available online: https://www.wetlands.org/publications/act-now-on-wetlands-for-agenda-2030/ (accessed on 11 November 2021).
  11. Hák, T.; Janoušková, S.; Moldan, B. Sustainable Development Goals: A need for relevant indicators. Ecol. Indic. 2016, 60, 565–573. [Google Scholar] [CrossRef]
  12. Este, P. State of the World’s Wetlands and their Services to People: A compilation of recent analyses. In Proceedings of the 12th Meeting of the Conference of the Parties to Ramsar Briefing Note 7, Gland, Switzerland, 5 April 2015. [Google Scholar]
  13. Dixon MJ, R.; Loh, J.; Davidson, N.C.; Beltrame, C.; Freeman, R.; Walpole, M. Tracking global change in ecosystem area: The Wetland Extent Trends index. Biol. Conserv. 2016, 193, 27–35. [Google Scholar] [CrossRef]
  14. Davidson, N.C. How much wetland has the world lost? Long-term and recent trends in global wetland area. Mar. Freshw. Res. 2014, 65, 934–941. [Google Scholar] [CrossRef]
  15. Assessment, M.E. Ecosystems and Human Well-Being: Wetlands and Water; World Resources Institute: Washington, DC, USA, 2005. [Google Scholar]
  16. Mitsch, W.J.; Gossilink, J.G. The value of wetlands: Importance of scale and landscape setting. Ecol. Econ. 2000, 35, 25–33. [Google Scholar] [CrossRef]
  17. Van Asselen, S.; Verburg, P.H.; Vermaat, J.E.; Janse, J.H. Drivers of wetland conversion: A global meta-analysis. PLoS ONE 2013, 8, e81292. [Google Scholar] [CrossRef] [PubMed] [Green Version]
  18. Verhoeven JT, A.; Beltman, B.; Whigham, D.F.; Bobbink, R. Wetland Functioning in a Changing World: Implications for Natural Resources Management. Wetl. Nat. Resour. Manag. 2006, 190, 1–12. [Google Scholar]
  19. Vörösmarty, C.J.; McIntyre, P.B.; Gessner, M.O.; Dudgeon, D.; Prusevich, A.; Green, P.; Glidden, S.; Bunn, S.E.; Sullivan, C.A.; Liermann, C.R.; et al. Global threats to human water security and river biodiversity. Nature 2010, 467, 555–561. [Google Scholar] [CrossRef]
  20. Bunyangha, J.; Majaliwa Mwanjalolo, J.G.; Muthumbi Agnes, W.; Gichuki Nathan, N.; Egeru, A. Past and future land use/land cover changes from multi-temporal Landsat imagery in Mpologoma catchment, eastern Uganda. Egypt. J. Remote Sens. Space Sci. 2021, 24, 675–685. [Google Scholar] [CrossRef]
  21. Hu, T.; Liu, J.; Zheng, G.; Zhang, D.; Huang, K. Evaluation of historical and future wetland degradation using remote sensing imagery and land use modeling. Land Degrad. Dev. 2020, 31, 65–80. [Google Scholar] [CrossRef]
  22. Sibanda, S.; Ahmed, F. Modelling historic and future land use/land cover changes and their impact on wetland area in Shashe sub-catchment, Zimbabwe. Model. Earth Syst. Environ. 2021, 7, 57–70. [Google Scholar] [CrossRef]
  23. Defries, R.S.; Foley, J.A.; Asner, G.P. Balancing human needs and ecosystem function. Front. Ecol. Environ. 2009, 2, 249–257. [Google Scholar] [CrossRef]
  24. Foley, J.A.; Asner, G.P.; Barford, C.; Bonan, G.; Carpenter, S.R.; Chapin, F.S.; Coe, M.T.; Daily, G.C.; Gibbs, H.K.; Helkowski, J.H.; et al. Global consequences of land use. Science 2005, 309, 570–574. [Google Scholar] [CrossRef] [Green Version]
  25. Tiéga, A. Ramsar convention on wetlands: 40 years of biodiversity conservation and wise use. J. Int. Wildl. Law Policy 2011, 14, 173–175. [Google Scholar] [CrossRef]
  26. Gardner, R.C. Lawyers, Swamps, and Money: U.S. Wetland Law, Policy, and Politics; Island Press: Washington, DC, USA, 2012; Volume 2, pp. 103–105. [Google Scholar]
  27. Barbier, E.B.; Acreman, M.; Knowler, D. Economic Valuation of Wetlands: A Guide for Policy Makers and Planners; Ramsar Convention Bureau: Gland, Spain, 1997. [Google Scholar]
  28. Scodari, P.F. Measuring the Benefits of Federal Wetland Programs; Environmental Law Institute: Washington, DC, USA, 1997. [Google Scholar]
  29. Ma, Q.; Cui, L.; Song, H.; Zhang, M.; Li, S.; Huang, S. Wetland protection in Beijing, China; the importance of legislation. Wetl. Ecol. Manag. 2015, 23, 1005–1013. [Google Scholar] [CrossRef]
  30. Richardson, B.J. Environmental Management in Uganda: The Importance of Property Law and Local Government in Wetlands Conservation. J. Afr. Law 1993, 37, 109–143. [Google Scholar] [CrossRef] [Green Version]
  31. Clare, S.; Krogman, N.; Foote, L.; Lemphers, N. Where is the avoidance in the implementation of wetland law and policy? Wetl. Ecol. Manag. 2011, 19, 165–182. [Google Scholar] [CrossRef] [Green Version]
  32. Maseko ZT, M.; Moyo, I. Conflicts between conservation and community livelihoods: Lessons from KwaNibela and iSimangaliso Wetland Park, KwaZulu-Natal, South Africa. In Conservation, Land Conflicts, and Sustainable Tourism in Southern Africa; Routledge: London, UK, 2022. [Google Scholar]
  33. Sletto, B. Producing space(s), representing landscapes: Maps and resource conflicts in Trinidad. Cult. Geogr. 2002, 9, 389–420. [Google Scholar] [CrossRef]
  34. Carbonell, M.; Nathai-Gyan, N.; Finlayson, C.M. Science and Local Communities: Strengthening Partnerships for Effective Wetland Management; Ducks Unlimited, Incorporated: Memphis, TN, USA, 2001. [Google Scholar]
  35. Zebardast, L.; Akbarpour, S.; Jafari, H.R.; Bagherzadeh Karimi, M. Sustainable wetland management through bridging the communication gap between conservation projects and local communities. Environ. Dev. Sustain. 2020, 23, 11098–11119. [Google Scholar] [CrossRef]
  36. Perni, Á.; Martínez-Paz, J.M. Measuring conflicts in the management of anthropized ecosystems: Evidence from a choice experiment in a human-created Mediterranean wetland. J. Environ. Manag. 2017, 203, 40–50. [Google Scholar] [CrossRef]
  37. Lambert, A. Economic valuation of wetlands: An important component of wetland management strategies at the river basin scale. In Conservation Finance Guide, Washington; Ramsar Convention Bureau: Gland, Spain, 2003. [Google Scholar]
  38. Li, Y.; Deng, H.; Dong, R. Prioritizing protection measures through ecosystem services valuation for the Napahai Wetland, Shangri-La County, Yunnan Province, China. Int. J. Sustain. Dev. World Ecol. 2015, 22, 142–150. [Google Scholar] [CrossRef]
  39. Brink, P.; Berghöfer, A.; Schröter-Schlaack, C.; Sukhdev, P.; Vakrou, A.; White, S.; Wittmer, H. TEEB—The Economics of Ecosystems and Biodiversity for National and International Policy Makers; United Nations Environment Programme (UNEP): Chatelaine, Switzerland, 2009. [Google Scholar]
  40. Emerton, L.; Bos, E. Value. In Counting Ecosystems as an Economic Part of Water; IUCN: Gland, Switzerland, 2004. [Google Scholar]
  41. Van der Ploeg, S.; De Groot, R.S.; Wang, Y. The TEEB Valuation Database: Overview of Structure, Data and Results; Foundation for Sustainable Development: Wageningen, The Netherlands, 2010. [Google Scholar]
  42. Emerton, L. Economic valuation of wetlands: Total economic value. In The Wetland Book; Springer: Berlin/Heidelberg, Germany, 2016; pp. 1–6. [Google Scholar]
  43. Louviere, J.J.; Flynn, T.N.; Carson, R.T. Discrete Choice Experiments Are Not Conjoint Analysis. J. Choice Model. 2010, 3, 57–72. [Google Scholar] [CrossRef] [Green Version]
  44. Butterfield, B.J.; Camhi, A.L.; Rubin, R.L.; Schwalm, C.R. Chapter Five-Tradeoffs and Compatibilities Among Ecosystem Services: Biological, Physical and Economic Drivers of Multifunctionality. In Advances in Ecological Research Ecosystem Services: From Biodiversity to Society, Part 2; Woodward, G., Bohan, D.A., Eds.; Academic Press: Cambridge, MA, USA, 2016; Volume 54, pp. 207–243. [Google Scholar]
  45. Pattanayak, S.K.; Kramer, R.A. Pricing ecological services: Willingness to pay for drought mitigation from watershed protection in eastern Indonesia. Water Resour. Res. 2001, 37, 771–778. [Google Scholar] [CrossRef] [Green Version]
  46. Luce, R.D. A Theory of Individual Choice Behavior; Columbia University New York Bureau of Applied Social Research: New York, NY, USA, 1957. [Google Scholar]
  47. McFadden, D. Conditional logit analysis of qualitative choice behavior. Front. Econom. 1974, 105–142. [Google Scholar]
  48. Lancaster, K.J. A New Approach to Consumer Theory. J. Political Econ. 1966, 74, 132–157. [Google Scholar] [CrossRef]
  49. Hall, J.; Viney, R.; Haas, M.; Louviere, J. Using stated preference discrete choice modeling to evaluate health care programs. J. Bus. Res. 2004, 57, 1026–1032. [Google Scholar] [CrossRef]
  50. Hoyos, D. The state of the art of environmental valuation with discrete choice experiments. Ecol. Econ. 2010, 69, 1595–1603. [Google Scholar] [CrossRef]
  51. Powe, N.A.; Garrod, G.D.; McMahon, P.L. Mixing methods within stated preference environmental valuation: Choice experiments and post-questionnaire qualitative analysis. Ecol. Econ. 2005, 52, 513–526. [Google Scholar] [CrossRef]
  52. van den Belt, M.; Forgie, V.; Farley, J. Valuation of Coastal Ecosystem Services. In Treatise on Estuarine and Coastal Science; Wolanski, E., McLusky, D., Eds.; Academic Press: Waltham, MA, USA, 2011; pp. 35–54. [Google Scholar]
  53. Mangham, L.J.; Hanson, K.; McPake, B. How to do (or not to do)...Designing a discrete choice experiment for application in a low-income country. Health Policy Plan. 2009, 24, 151–158. [Google Scholar] [CrossRef] [Green Version]
  54. Birol, E.; Karousakis, K.; Koundouri, P. Using A Choice Experiment To Value Economic Benefits Of Wetlands: The Case Of Cheimaditida Wetland In Greece. Ecol. Econ. 2006, 60, 145–156. [Google Scholar] [CrossRef]
  55. García-Llorente, M.; Martín-López, B.; Nunes PA, L.D.; Castro, A.J.; Montes, C. A choice experiment study for land-use scenarios in semi-arid watershed environments. J. Arid. Environ. 2012, 87, 219–230. [Google Scholar] [CrossRef]
  56. Carlsson, F.; Frykblom, P.; Liljenstolpe, C. Valuing wetland attributes: An application of choice experiments. Ecol. Econ. 2003, 47, 95–103. [Google Scholar] [CrossRef]
  57. Poder, T.G.; Dupras, J.; Ndefo, F.F.; He, J. The economic value of the greater Montreal blue network (Quebec, Canada): A contingent choice study using real projects to estimate non-market aquatic ecosystem services benefits. PLoS ONE 2016, 11, e0158901. [Google Scholar] [CrossRef]
  58. Doherty, E.; Murphy, G.; Hynes, S.; Buckley, C. Valuing ecosystem services across water bodies: Results from a discrete choice experiment. Ecosyst. Serv. 2014, 7, 89–97. [Google Scholar] [CrossRef]
  59. Tentes, G.; Damigos, D. Discrete choice experiment for groundwater valuation: Case of the Asopos River Basin, Greece. J. Water Resour. Plan. Manag. 2015, 141, 04014089. [Google Scholar] [CrossRef]
  60. Johnson, D.; Geisendorf, S. Valuing ecosystem services of sustainable urban drainage systems: A discrete choice experiment to elicit preferences and willingness to pay. J. Environ. Manag. 2022, 307, 114508. [Google Scholar] [CrossRef] [PubMed]
  61. He, J.; Dupras, J.; GPoder, T. The value of wetlands in Quebec: A comparison between contingent valuation and choice experiment. J. Environ. Econ. Policy 2017, 6, 51–78. [Google Scholar] [CrossRef]
  62. Khan, S.U.; Khan, I.; Zhao, M.; Khan, A.A.; Ali, M.A.S. Valuation of ecosystem services using choice experiment with preference heterogeneity: A benefit transfer analysis across inland river basin. Sci. Total Environ. 2019, 679, 126–135. [Google Scholar] [CrossRef] [PubMed]
  63. Morrison, M.; Bennett, J.; Blamey, R. Valuing improved wetland quality using choice modeling. Water Resour. Res. 1999, 35, 2805–2814. [Google Scholar] [CrossRef] [Green Version]
  64. Kakuru, W.; Turyahabwe, N.; Mugisha, J. Total economic value of wetlands products and services in Uganda. Sci. World J. 2013, 2013. [Google Scholar] [CrossRef]
  65. Emerton, L.; Iyango, L.; Luwum, P.; Malinga, A. The Present Economic Value of Nakivubo Urban Wetland, Uganda; IUCN: Nairobi, Kenya, 1999; pp. 1–30. [Google Scholar]
  66. Anon Report: Uganda’s Wetlands Face Depletion by 2040. The Kampala Post. Available online: https://kampalapost.com/content/report-ugandas-wetlands-face-depletion-2040 (accessed on 10 December 2021).
  67. Mafabi, P. National Wetland Policy: Uganda. In The Wetland Book; Finlayson, C.M., Everard, M., Irvine, K., McInnes, R.J., Middleton, B.A., van Dam, A.A., Davidson, N.C., Eds.; Springer: Dordrecht, The Netherlands, 2018; pp. 807–812. [Google Scholar]
  68. Muli C SIO-MALABA-MALAKISI RIVER BASIN, KENYA/UGANDA 15. Available online: https://www.iucn.org/sites/dev/files/smm_river_basin_-_characteristics_and_key_issues.pdf (accessed on 6 December 2019).
  69. Anon 2020 We Won’t Leave Wetlands, Kibuku Farmers Dare Government. Available online: https://www.monitor.co.ug/uganda/news/national/we-won-t-leave-wetlands-kibuku-farmers-dare-government-1832732 (accessed on 3 February 2020).
  70. Anon UGANDA NATIONAL RICE DEVELOPMENT STRATEGY (UNRDS) 36. Available online: https://www.jica.go.jp/english/our_work/thematic_issues/agricultural/pdf/uganda_en.pdf (accessed on 14 May 2020).
  71. Bunyangha, J.; Muthumbi, A.W.; Gichuki, N.N.; Majaliwa, M.J.; Egeru, A. Soil Macroinvertebrate Response to Paddy Rice Farming Pathways in Mpologoma Catchment, Uganda. Agronomy 2022, 12, 312. [Google Scholar] [CrossRef]
  72. Anonymous. President Museveni Opens War on Environmental Degradation; State House Uganda: Entebbe, Uganda, 2016. [Google Scholar]
  73. Anonymous. Hundreds Stranded in Butaleja as Floods Cut Off Road. Available online: https://www.monitor.co.ug/News/National/Hundreds-stranded-Butaleja-floods-road-River-Manafwa/688334-4487448-40tac1/index.html (accessed on 23 May 2019).
  74. Anonymous. Poor Human Activities Aiding Butaleja Floods. Available online: https://www.monitor.co.ug/uganda/news/national/poor-human-activities-aiding-butaleja-floods-3394406?view=htmlamp (accessed on 5 May 2022).
  75. Joshua, W. Kibuku Area Police Swings to Protect Mpologoma Wetland. mulengeranews.com. Available online: https://mulengeranews.com/kibuku-area-police-swings-to-protect-mpologoma-wetland/ (accessed on 23 May 2020).
  76. Dawoud, D.M. Discrete choice experiment. In Encyclopedia of Pharmacy Practice and Clinical Pharmacy; Elsevier: Amsterdam, The Netherlands, 2019; pp. 62–71. [Google Scholar]
  77. Coast, J.; Horrocks, S. Developing attributes and levels for discrete choice experiments using qualitative methods. J. Health Serv. Res. Policy 2007, 12, 25–30. [Google Scholar] [CrossRef]
  78. Hensher, D.A.; Rose, J.M.; Rose, J.M.; Greene, W.H. Applied Choice Analysis: A Primer; Cambridge University Press: Cambridge, UK, 2005. [Google Scholar]
  79. Anon Currency Exchange Rates—International Money Transfer | Xe. Available online: https://www.xe.com/ (accessed on 2 September 2019).
  80. Street, D.J.; Burgess, L.; Louviere, J.J. Quick and easy choice sets: Constructing optimal and nearly optimal stated choice experiments. Int. J. Res. Mark. 2005, 22, 459–470. [Google Scholar] [CrossRef]
  81. Anon Dcreate: A NEW MODULE for Creating Efficient Designs for Discrete Choice Experiments—Statalist. Available online: https://www.statalist.org/forums/forum/general-stata-discussion/general/1308477-dcreate-a-new-module-for-creating-efficient-designs-for-discrete-choice-experiments (accessed on 19 August 2019).
  82. Pearmain, D.; Kroes, E.P.; Steer Davies & Gleave Ltd.; Hague Consultancy Group. Stated Preference Techniques: A Guide to Practice; Steer Davies & Gleave Ltd.: Den Haag, The Netherlands, 1990. [Google Scholar]
  83. de Bekker-Grob, E.W.; Donkers, B.; Jonker, M.F.; Stolk, E.A. Sample Size Requirements for Discrete-Choice Experiments in Healthcare: A Practical Guide. Patient 2015, 8, 373–384. [Google Scholar] [CrossRef] [PubMed] [Green Version]
  84. Nthambi, M.; Markova-Nenova, N.; Wätzold, F. Quantifying Loss of Benefits from Poor Governance of Climate Change Adaptation Projects: A Discrete Choice Experiment with Farmers in Kenya. Ecol. Econ. 2021, 179, 106831. [Google Scholar] [CrossRef]
  85. Hauber, A.B.; González, J.M.; Groothuis-Oudshoorn, C.G.; Prior, T.; Marshall, D.A.; Cunningham, C.; Ijzerman, M.J.; Bridges, J.F.P. Statistical Methods for the Analysis of Discrete Choice Experiments: A Report of the ISPOR Conjoint Analysis Good Research Practices Task Force. Value Health 2016, 19, 300–315. [Google Scholar] [CrossRef] [PubMed] [Green Version]
  86. Ryan, M.; Gerard, K.; Amaya-Amaya, M. Discrete Choice Experiments in a Nutshell. In Using Discrete Choice Experiments to Value Health and Health Care; The Economics of Non-Market Goods and Resources; Ryan, M., Gerard, K., Amaya-Amaya, M., Eds.; Springer: Dordrecht, The Netherlands, 2008; Volume 11, pp. 13–46. [Google Scholar]
  87. Gumbel, E.J. Statistics of Extremes; Columbia University Press: New York, NY, USA, 1958. [Google Scholar]
  88. Kolstad, J.R. How to make rural jobs more attractive to health workers. Findings from a discrete choice experiment in Tanzania. Health Econ. 2011, 20, 196–211. [Google Scholar] [CrossRef] [PubMed] [Green Version]
  89. Hoffman, S.D.; Duncan, G.J. Multinomial and conditional logit discrete-choice models in demography. Demography 1988, 25, 415–427. [Google Scholar] [CrossRef] [PubMed]
  90. Gemma, A.; Musa Lwanga, M.; Swaibu, M. Youth Engagement in Agriculture in Uganda: Challenges and Prospects. 2013. Available online: https://ageconsearch.umn.edu/bitstream/159673/2/series106.pdf (accessed on 11 May 2022).
  91. Anon. National Population and Housing Census 2014; UNFPA Uganda, Uganda Bureau of Statistics: Kampala, Uganda, 2016; Available online: https://uganda.unfpa.org/en/publications/national-population-and-housing-census-2014-0 (accessed on 24 October 2021).
  92. Kamoga, J. Subsistence farming tops local sources of income. The Observer-Uganda. Available online: https://observer.ug/business/55252-subsistence-farming-tops-local-sources-of-income.html (accessed on 17 January 2019).
  93. Anon Average Household Size in Uganda-Overview. Available online: https://dhsprogram.com/pubs/pdf/SR245/SR245.pdf (accessed on 14 May 2022).
  94. Buchanan, J.M. Choosing What to Choose. J. Inst. Theor. Econ. (JITE) Z. Für Die Gesamte Staatswiss. 1994, 150, 123–135. [Google Scholar]
  95. Hole, A.R. A comparison of approaches to estimating confidence intervals for willingness to pay measures. Health Econ. 2007, 16, 827–840. [Google Scholar] [CrossRef] [Green Version]
  96. Yang, J. The heterogeneous preferences for conservation and management in urban wetland parks: A case study from China. Urban For. Urban Green. 2021, 60, 127064. [Google Scholar] [CrossRef]
  97. Doran, R.; Hanss, D.; Larsen, S. Attitudes, efficacy beliefs, and willingness to pay for environmental protection when travelling. Tour. Hosp. Res. 2015, 15, 281–292. [Google Scholar] [CrossRef] [Green Version]
  98. Gosling, A.; Shackleton, C.M.; Gambiza, J. Community-based natural resource use and management of Bigodi Wetland Sanctuary, Uganda, for livelihood benefits. Wetl. Ecol. Manag. 2017, 25, 717–730. [Google Scholar] [CrossRef]
  99. Ormsby, A.A.; Bhagwat, S.A. Sacred forests of India: A strong tradition of community-based natural resource management. Environ. Conserv. 2010, 37, 320–326. [Google Scholar] [CrossRef] [Green Version]
  100. Pomeroy, R.S. Community-based and co-management institutions for sustainable coastal fisheries management in Southeast Asia. Ocean. Coast. Manag. 1995, 27, 143–162. [Google Scholar] [CrossRef]
  101. Jentoft, S. The community: A missing link of fisheries management. Mar. Policy 2000, 24, 53–60. [Google Scholar] [CrossRef]
  102. Lane, M.B. Affirming New Directions in Planning Theory: Comanagement of Protected Areas. Soc. Nat. Resour. 2001, 14, 657–671. [Google Scholar] [CrossRef]
  103. Colchester, M. Sustaining the Forests: The Community-based Approach in South and South-East Asia. Dev. Change 1994, 25, 69–100. [Google Scholar] [CrossRef]
  104. Eumu, E. Uganda: Rice Farmers Given 90 Days to Vacate Wetlands. Available online: https://allafrica.com/stories/202109080072.html#:~:text=Kalaki%20District%20leaders%20have%20given,the%20expense%20of%20the%20ecosystem (accessed on 20 April 2022).
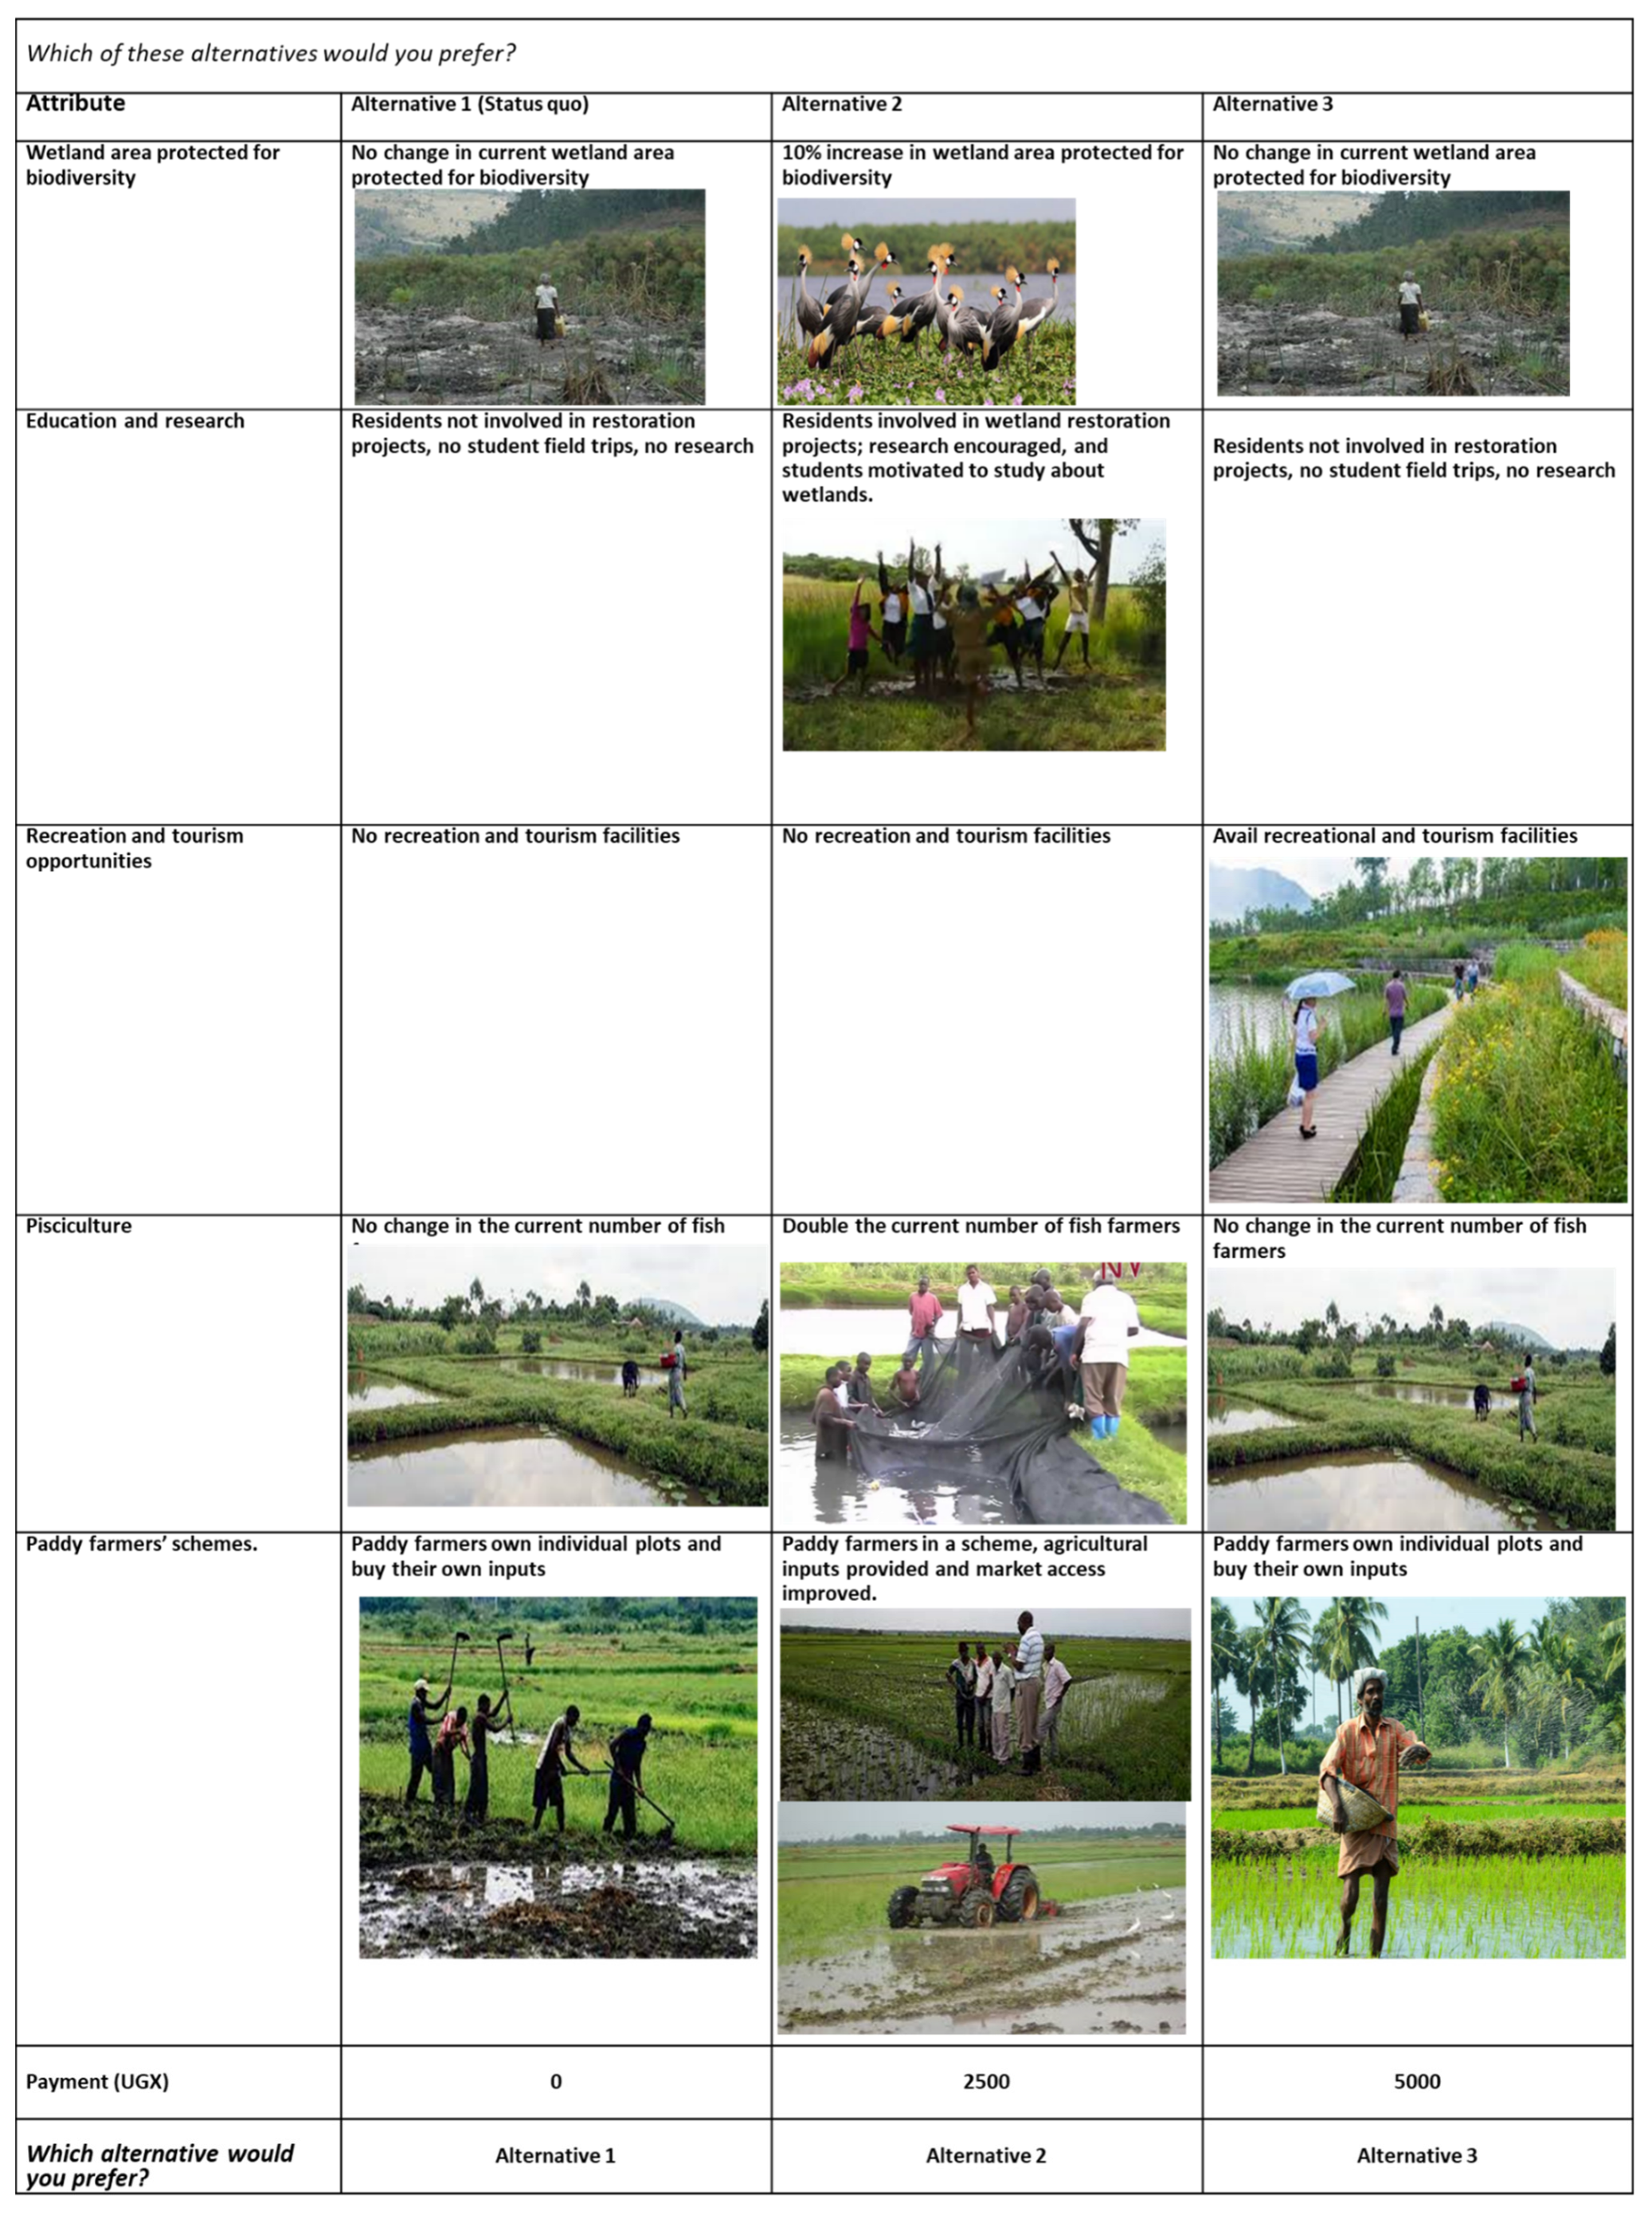
Figure 1. Location of the data collection sites (districts) in Mpologoma catchment, Eastern Uganda.
Land 11 00962 g001
Figure 2. Sample choice card that was presented to respondents indicating the attribute and the three possible alternatives.
Land 11 00962 g002
Table 1. Attributes and levels used in the DCE survey.
AttributeDescriptionLevels
Wetland area protected for biodiversityArea of wetland from the river prohibited from human activity such as farming (protected area)0-No change in current wetland area protected for biodiversity
1–10% increase in wetland area protected for biodiversity.
Education and researchActivities that involve citizens participating in restoration projects in order to increase public awareness of wetland benefits and encourage researchers and students to learn about wetlands.0-Residents not involved, no study trips, no research.
1-Involve residents in wetland restoration projects; encourage research and motivate students to study about wetlands.
Recreation and tourismFacilities and activities such as angling, boating, bird watching, nature trails, and swings to promote eco-tourism and recreation.0-No recreation and tourism facilities.
1-Avail recreation and tourism facilities.
PiscicultureNumber of farmers involved in pisciculture.0-No change in the current number of fish farmers.
1-Double the current number of fish farmers.
Paddy farmers’ schemes.Earmarking land for irrigated paddy farming schemes and providing agricultural inputs and market access among other services to the farmers.0-Paddy farms/plots individually owned.
1-Introduce paddy farmers’ schemes.
Payment/donationA one-time off payment/donation by the respondent if the alternative was chosen.UGX. 0, 2500, 5000,7500.
Table 2. Descriptive statistics of the respondents with and without protest responses.
Respondents’ CharacteristicsNo of Respondents Selected (Returned Questionnaires)No of Respondents Willing to Pay
GenderFrequency (%)Frequency (%)
Female128 (35.6)122 (35.3)
Male232 (64.4)224 (64.7)
Age (years)
18–205 (1.4)5 (1.5)
21–39219 (60.8)209 (60.4)
40–60119 (33.1)117 (33.8)
60+17 (4.7)15 (4.3)
Monthly income (000 UGX)
Less or equal to 10016 (4.4)16 (4.6)
101–150253 (70.3)242 (69.9)
151–25074 (20.6)71 (20.5)
251–35016 (4.4)16 (4.6)
351+1 (0.3)1 (0.3)
Availability of income alternatives
No205 (56.9)195 (56.4)
Yes155 (43.1)151 (43.6)
Respondent currently uses the wetland for paddy farming
Yes 292 (81.1)281 (81.2)
No 68 (18.9)65 (18.8)
Household size (Number of members)
Less or equal to 5214 (59.4)204 (59.0)
5 to 10113 (31.4)109 (31.5)
11+33 (9.2)33 (9.5)
Education of respondent
No formal education53 (14.7)48 (13.9)
Primary education100 (27.8)99 (28.6)
Secondary education 135 (37.5)128 (37.0)
Tertiary education72 (20.0)71 (20.5)
Proximity to the wetlands
Within 3 km157 (43.6)149 (43.1)
4–5 km147 (40.8)144 (41.6)
5–10 km54 (15.0)51 (14.7)
10 km+2 (0.6)2 (0.6)
Total number of respondents360 (100)346 (100)
Table 3. Descriptive statistics of the variables used for analysis of attribute preferences.
Respondent CharacteristicsPercent
Respondent is male64.74
Respondent is aged 40 years and above38.15
a Participant’s monthly income is 150,000 UGX (approx. 40 USD) and above25.43
Availability of income alternatives43.64
Respondent is currently using the wetland for paddy farming81.21
Household size is large (5 or more individuals)41.04
Highest education attained by respondent is secondary level57.51
Proximity to the wetland is over 5 km15.32
AttributesMean (SD)
Wetland area protected for biodiversity0.52 (0.50)
Education and research0.61 (0.49)
Recreation and tourism0.53 (0.50)
Fish farming0.60 (0.49)
Paddy farmers schemes0.62 (0.49)
a Cost0.69(0.73)
SD means standard deviation. a Exchange rate (2 September 2019) $1 = UGX 3683.3055 [79].
Table 4. Marginal coefficient estimates for sustainable wetland management attributes.
AttributesConditional LogitMixed Logit
CoefficientStandard ErrorCoefficientStandard Error
Mean
Wetland area protected for biodiversity0.748 ***0.0940.774 ***0.148
Education and research0.965 ***0.0880.909 ***0.158
Recreation and tourism0.671 ***0.0900.723 ***0.142
Fish farming1.193 ***0.0931.172 ***0.193
Paddy farmers’ schemes1.379 ***0.0931.430 ***0.199
Cost−1.009 ***0.064−1.515 ***0.205
Alternative specific constant (ASC)−1.490 ***0.196−2.332 ***0.421
SD
Wetland area protected for biodiversity 0.584 *0.297
Education and research −0.584 *0.310
Recreation and tourism 0.915 ***0.261
Fish farming 1.522 ***0.296
Paddy farmers’ schemes 0.7510.291
Cost 0.652 ***0.201
ASC 1.194 ***0.445
Number of observations41524152
Log likelihood−1247.16−818.467
Prob > chi20.0000.000
LR chi2(7)1799.2336.93
Significance codes: * p < 0.1, *** p < 0.01
Table 5. Interaction of wetland management attributes with respondents’ characteristics.
Attributes and InteractionsCoefficientStandard Error95% Confidence Interval
Wetland area protected for biodiversity x Income0.504 **0.2090.0940.914
Wetland area protected for biodiversity x Farming−0.480 *0.248−0.9660.005
Education and research x Income0.334 *0.198−0.0540.722
Recreation and tourism x Gender−0.321 *0.19−0.6940.052
Recreation and tourism x Household size0.428 **0.2160.0050.851
Fish farming x Age0.429 **0.2140.0100.848
Fish farming x Income alternatives0.355 **0.1780.0060.704
Fish farming x Farming−0.492 **0.242−0.966−0.017
Fish farming x Household size−0.706 ***0.21−1.116−0.295
Paddy farmers’ schemes x Income alternatives0.508 ***0.1740.1680.848
Paddy farmers’ schemes x Education level−0.317 **0.182−0.6730.039
Cost−1.026 ***0.07−1.163−0.889
Number of observations4152
LR chi21802.14
Prob > chi20.000
Pseudo R20.4197
Log likelihood−1245.71
Key to significance levels: * significant at 10% level, ** significant at 5% level, *** significant at 1% level.
Table 6. Marginal willingness to pay for wetland management attributes per household.
Attributea Marginal WTP/Household ($)95 % Confidence Interval
Wetland area and biodiversity0.910.311.51
Education and research1.290.691.88
Recreation and tourism0.640.051.24
Fish farming1.761.152.38
Paddy farmers’ schemes1.540.942.14
a Exchange rate (2 September 2019) $1 = UGX 3683.3055 [79].
Publisher’s Note: MDPI stays neutral with regard to jurisdictional claims in published maps and institutional affiliations.

