
Linking Pattern to Process: Intensity Analysis of Land-Change Dynamics in Ghana as Correlated to Past Socioeconomic and Policy Contexts

 , , ,
, , ,  and
and
Abstract
:1. Introduction
2. Methodology
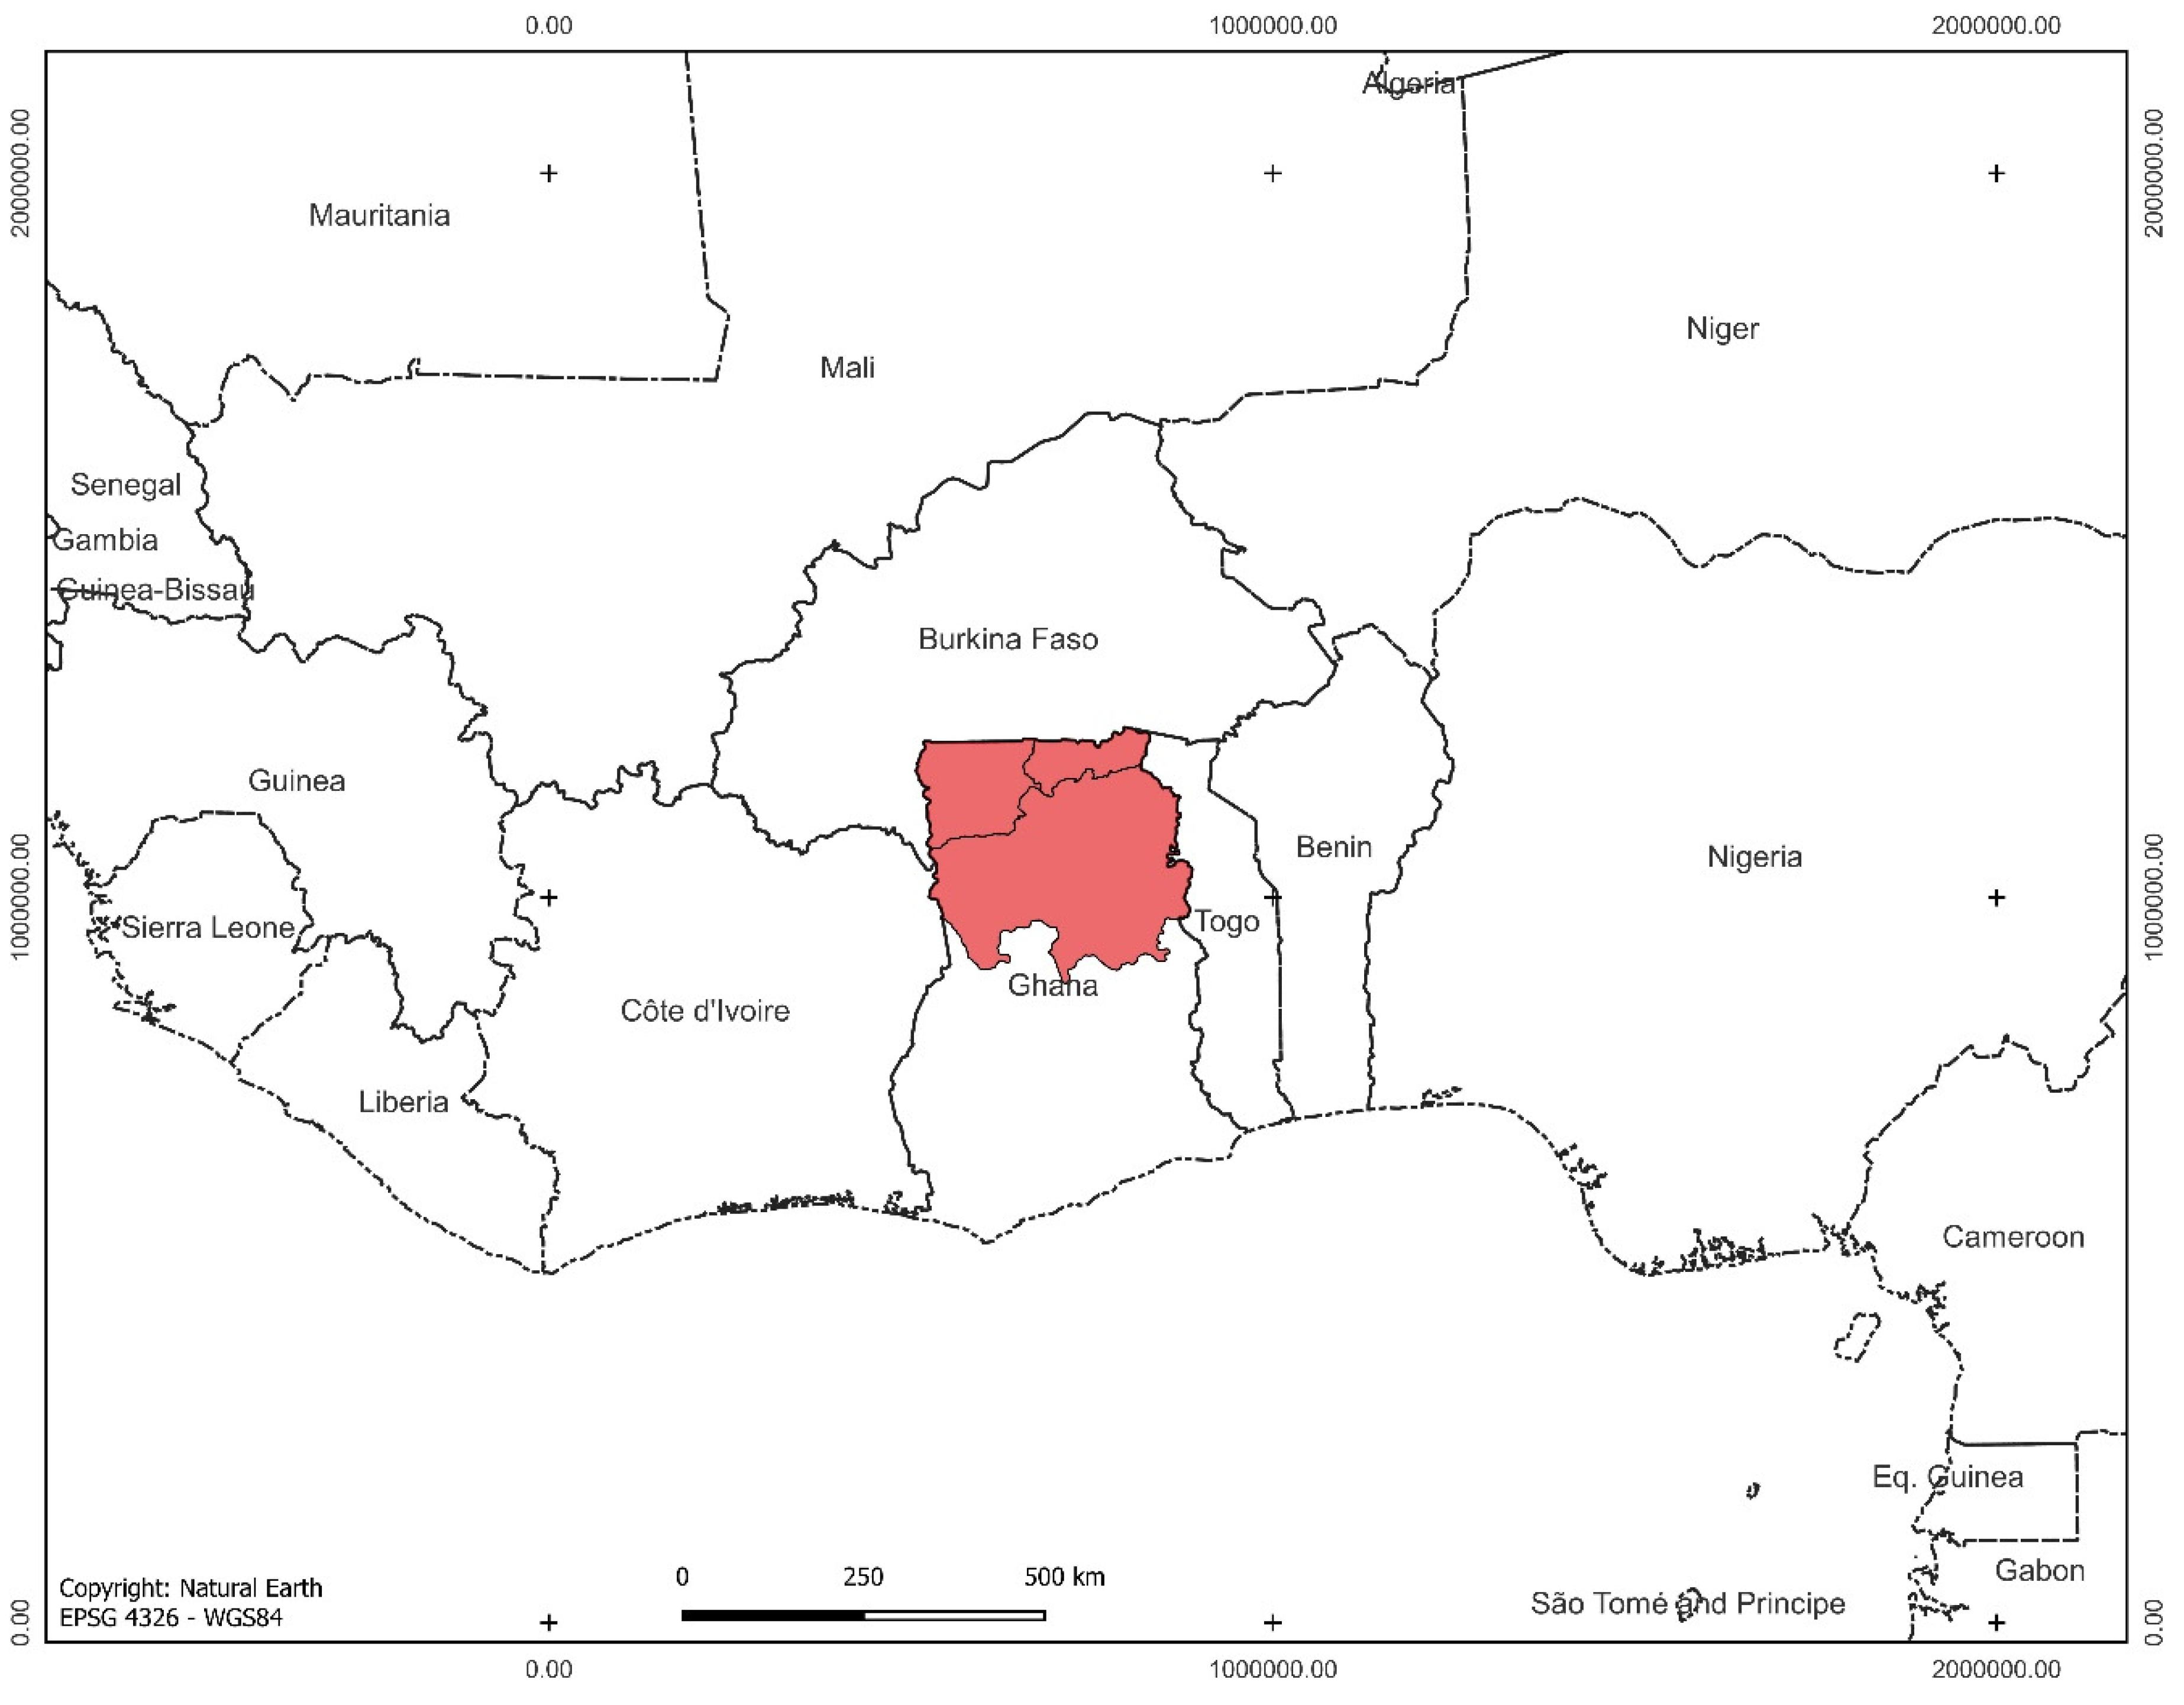
2.1. Study Area
2.2. Analysis of the Spatial Trend of Change
2.3. Land-Change Analysis
2.3.1. Data Sources
2.3.2. Land-Cover Transition Matrix
2.3.3. Intensity Analysis
2.3.4. Interval-Level Analysis
2.3.5. Category-Level Analysis
2.3.6. Transition-Level Analysis
2.3.7. Hypothetical Error in the Intensity Analysis
3. Results
3.1. Land-Cover Transitions
3.2. Intensity Analysis
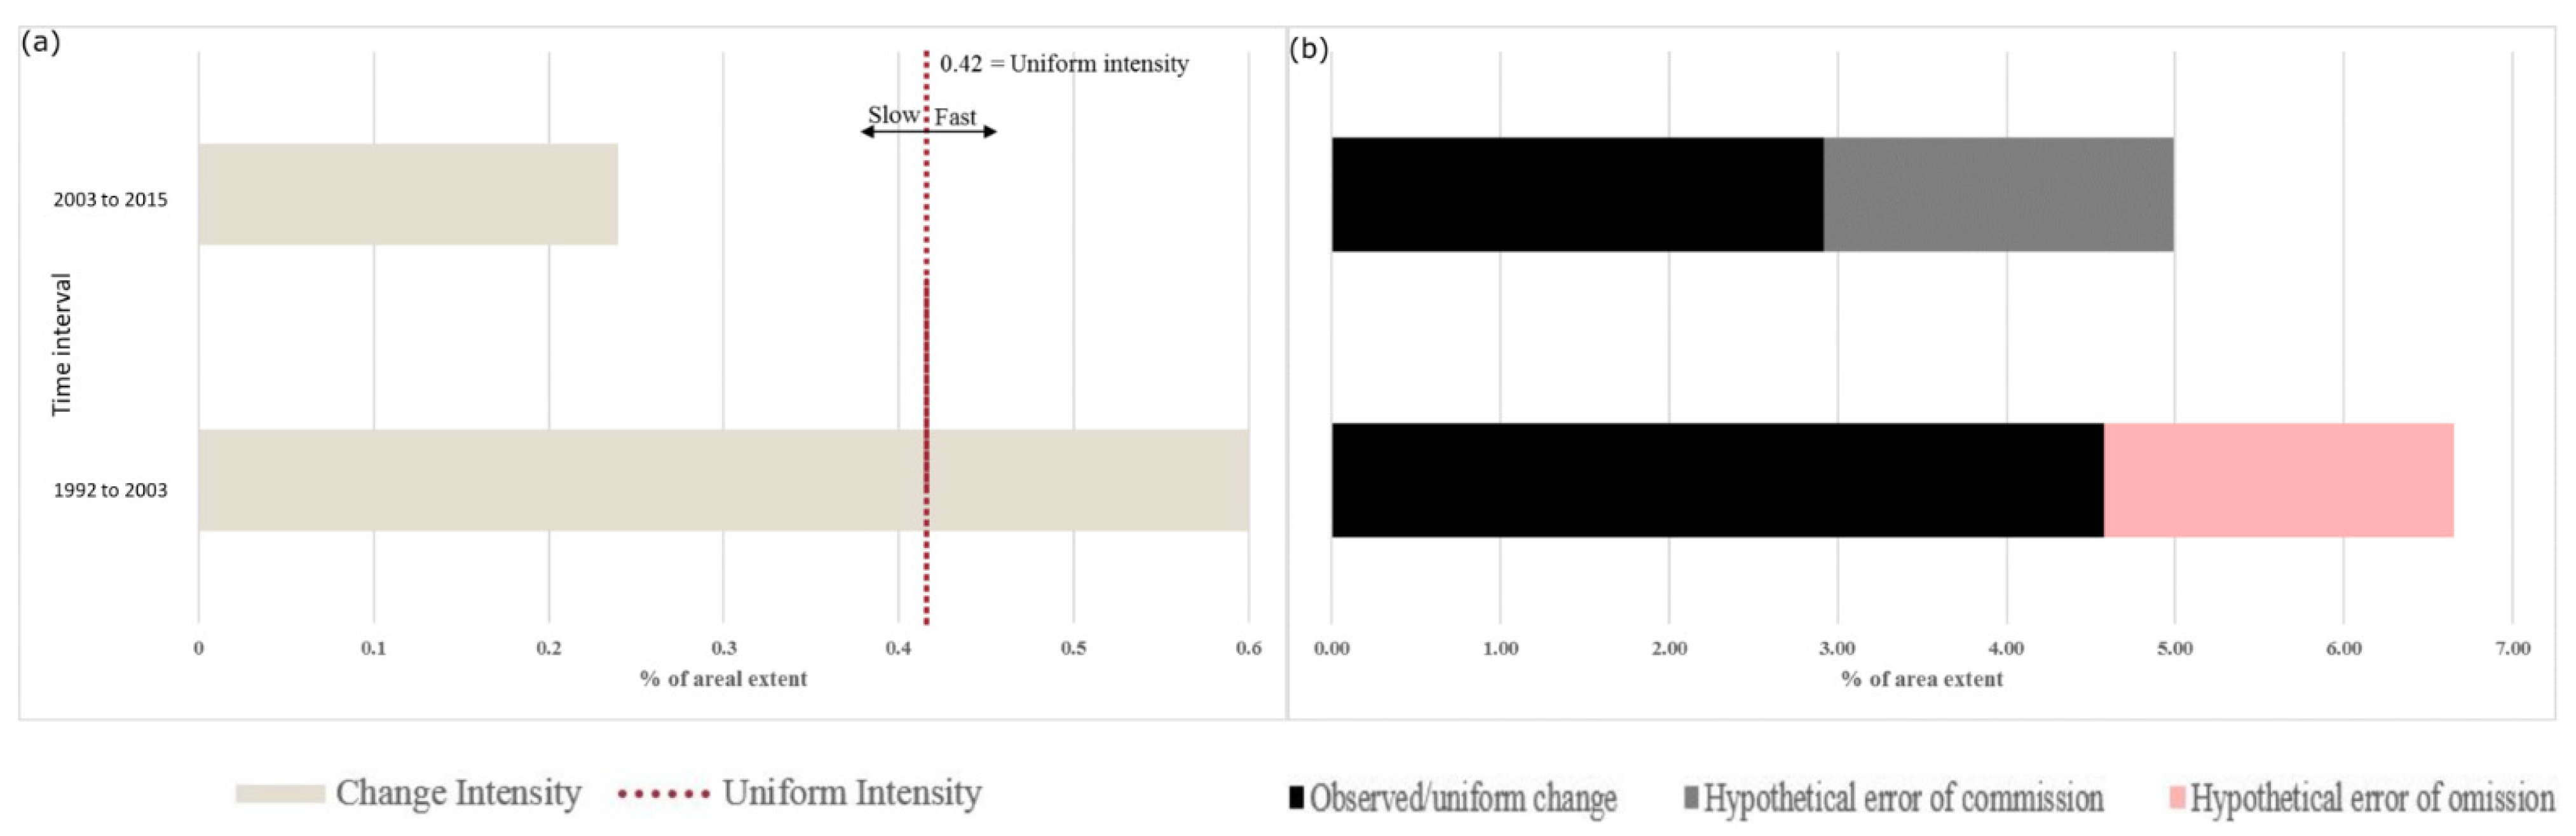
3.2.1. Interval Level
3.2.2. Category Level
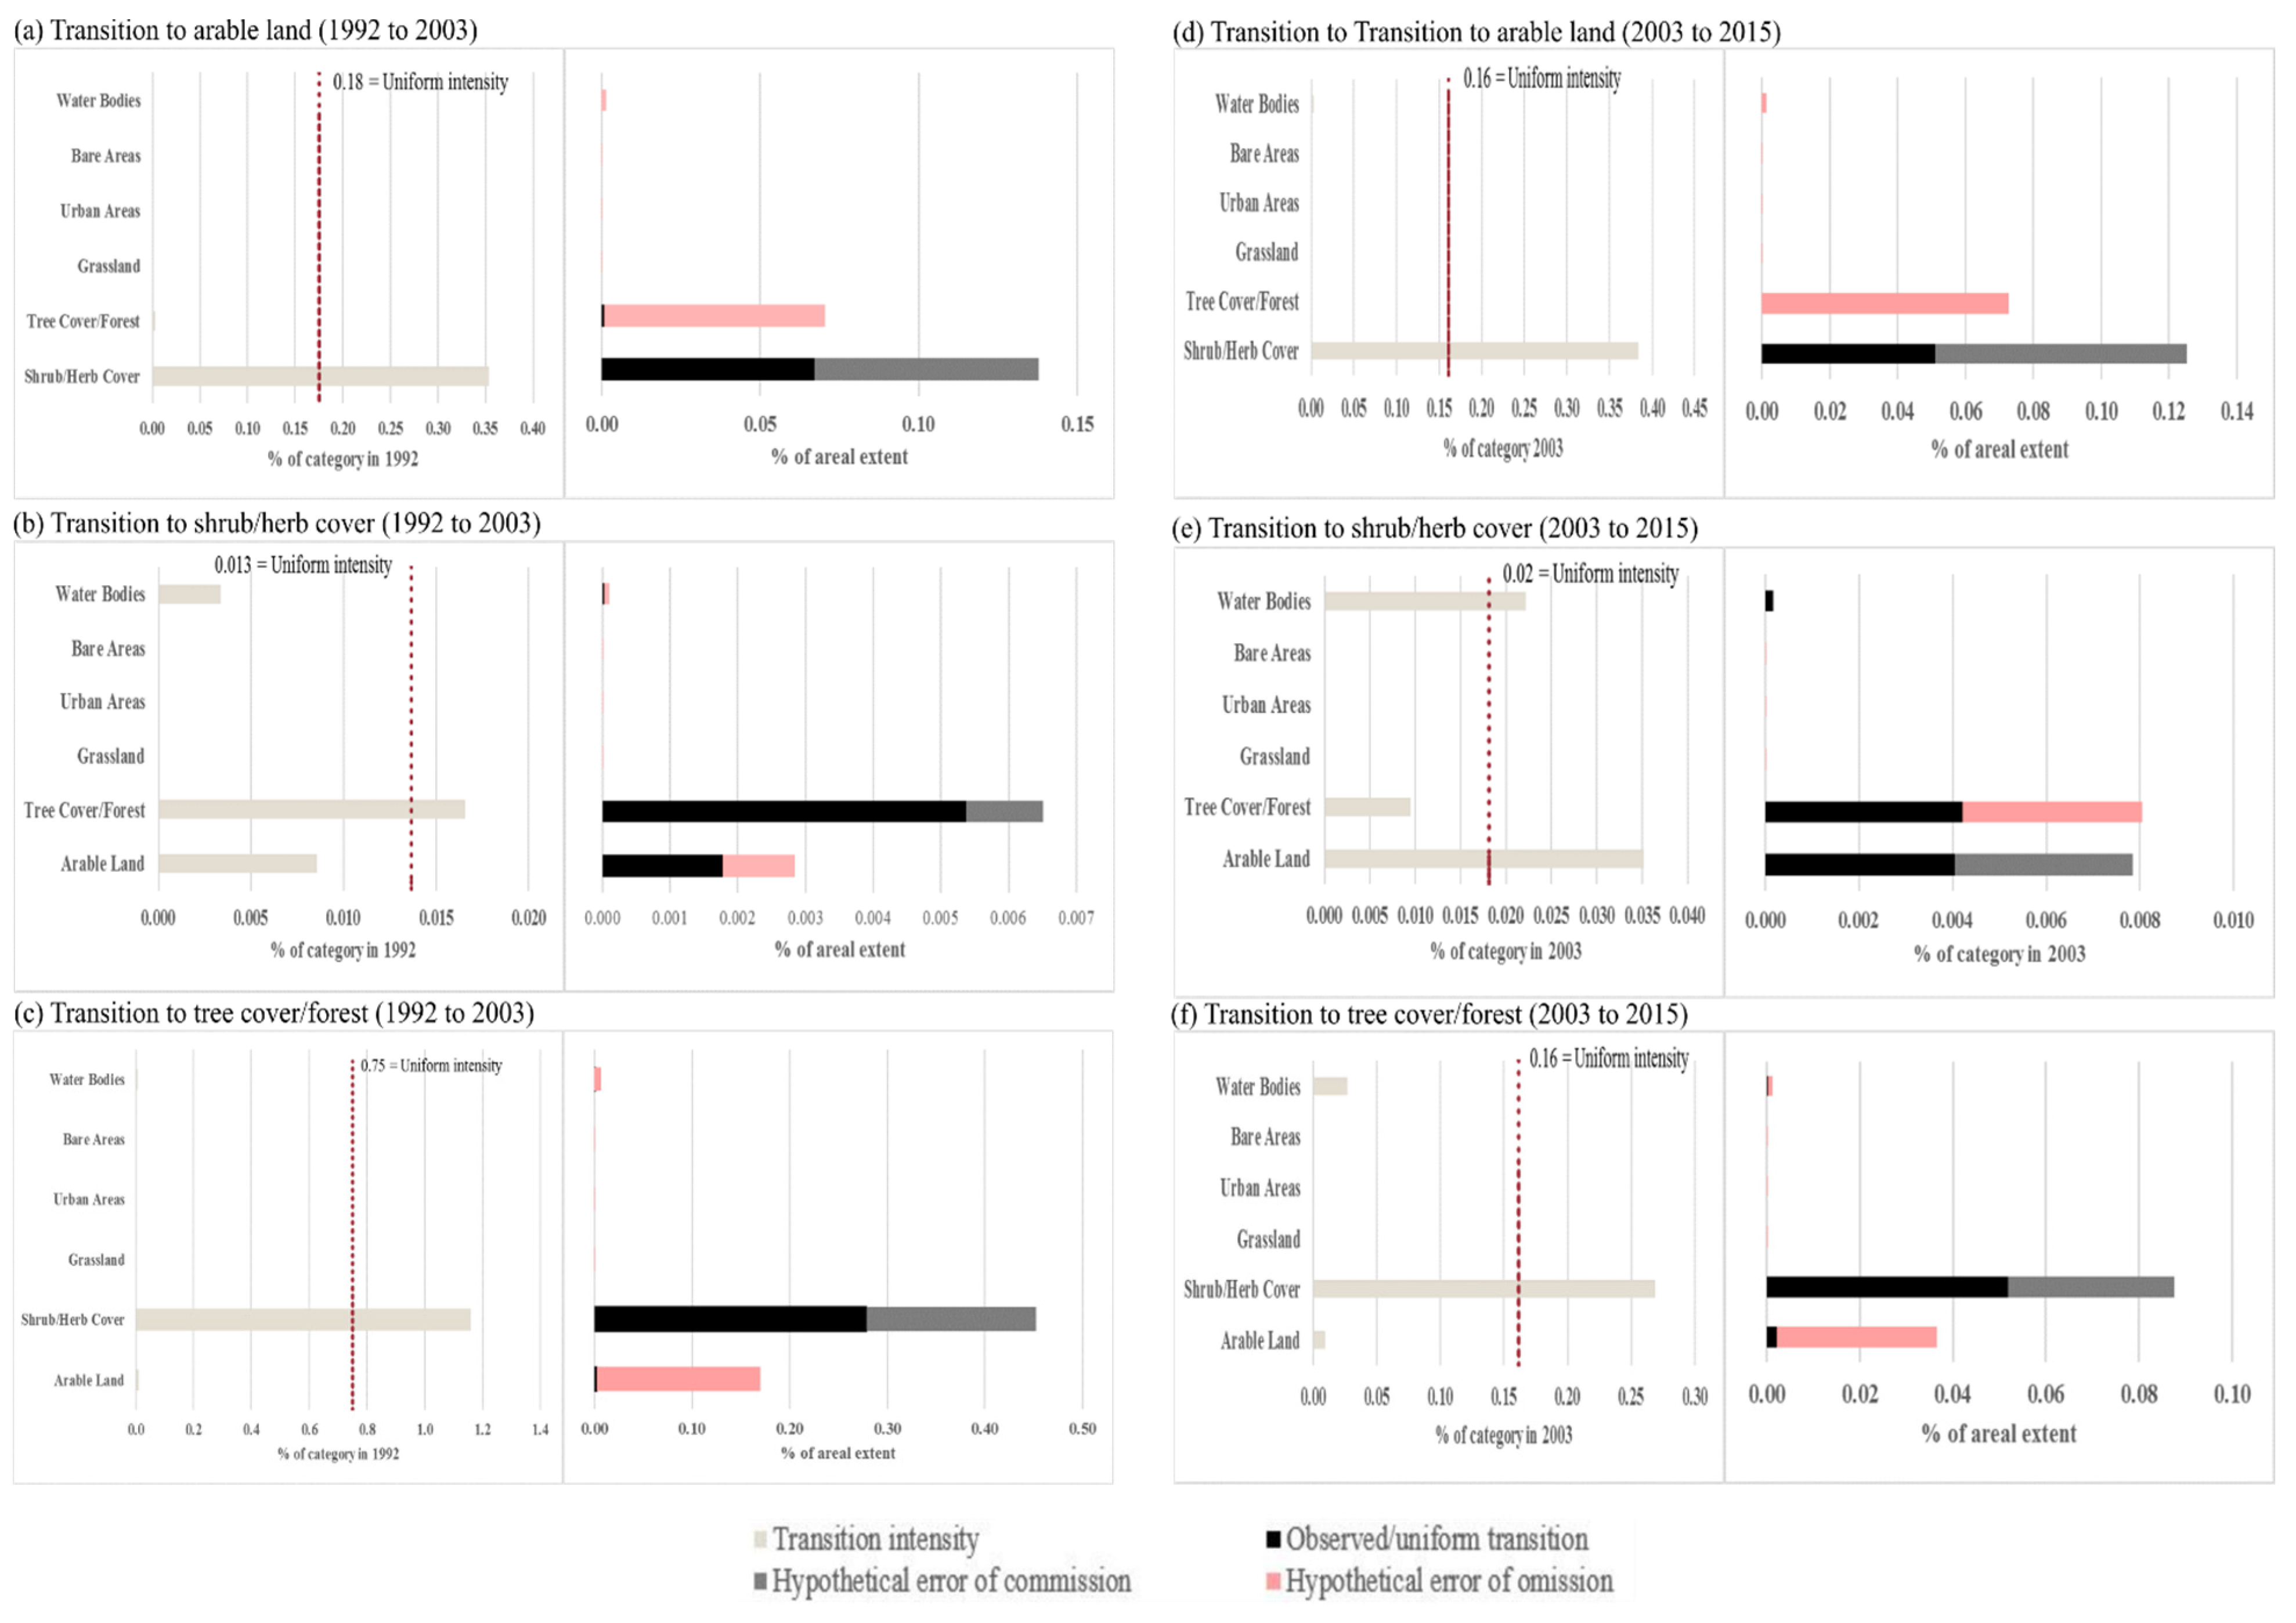
3.2.3. Transition Level
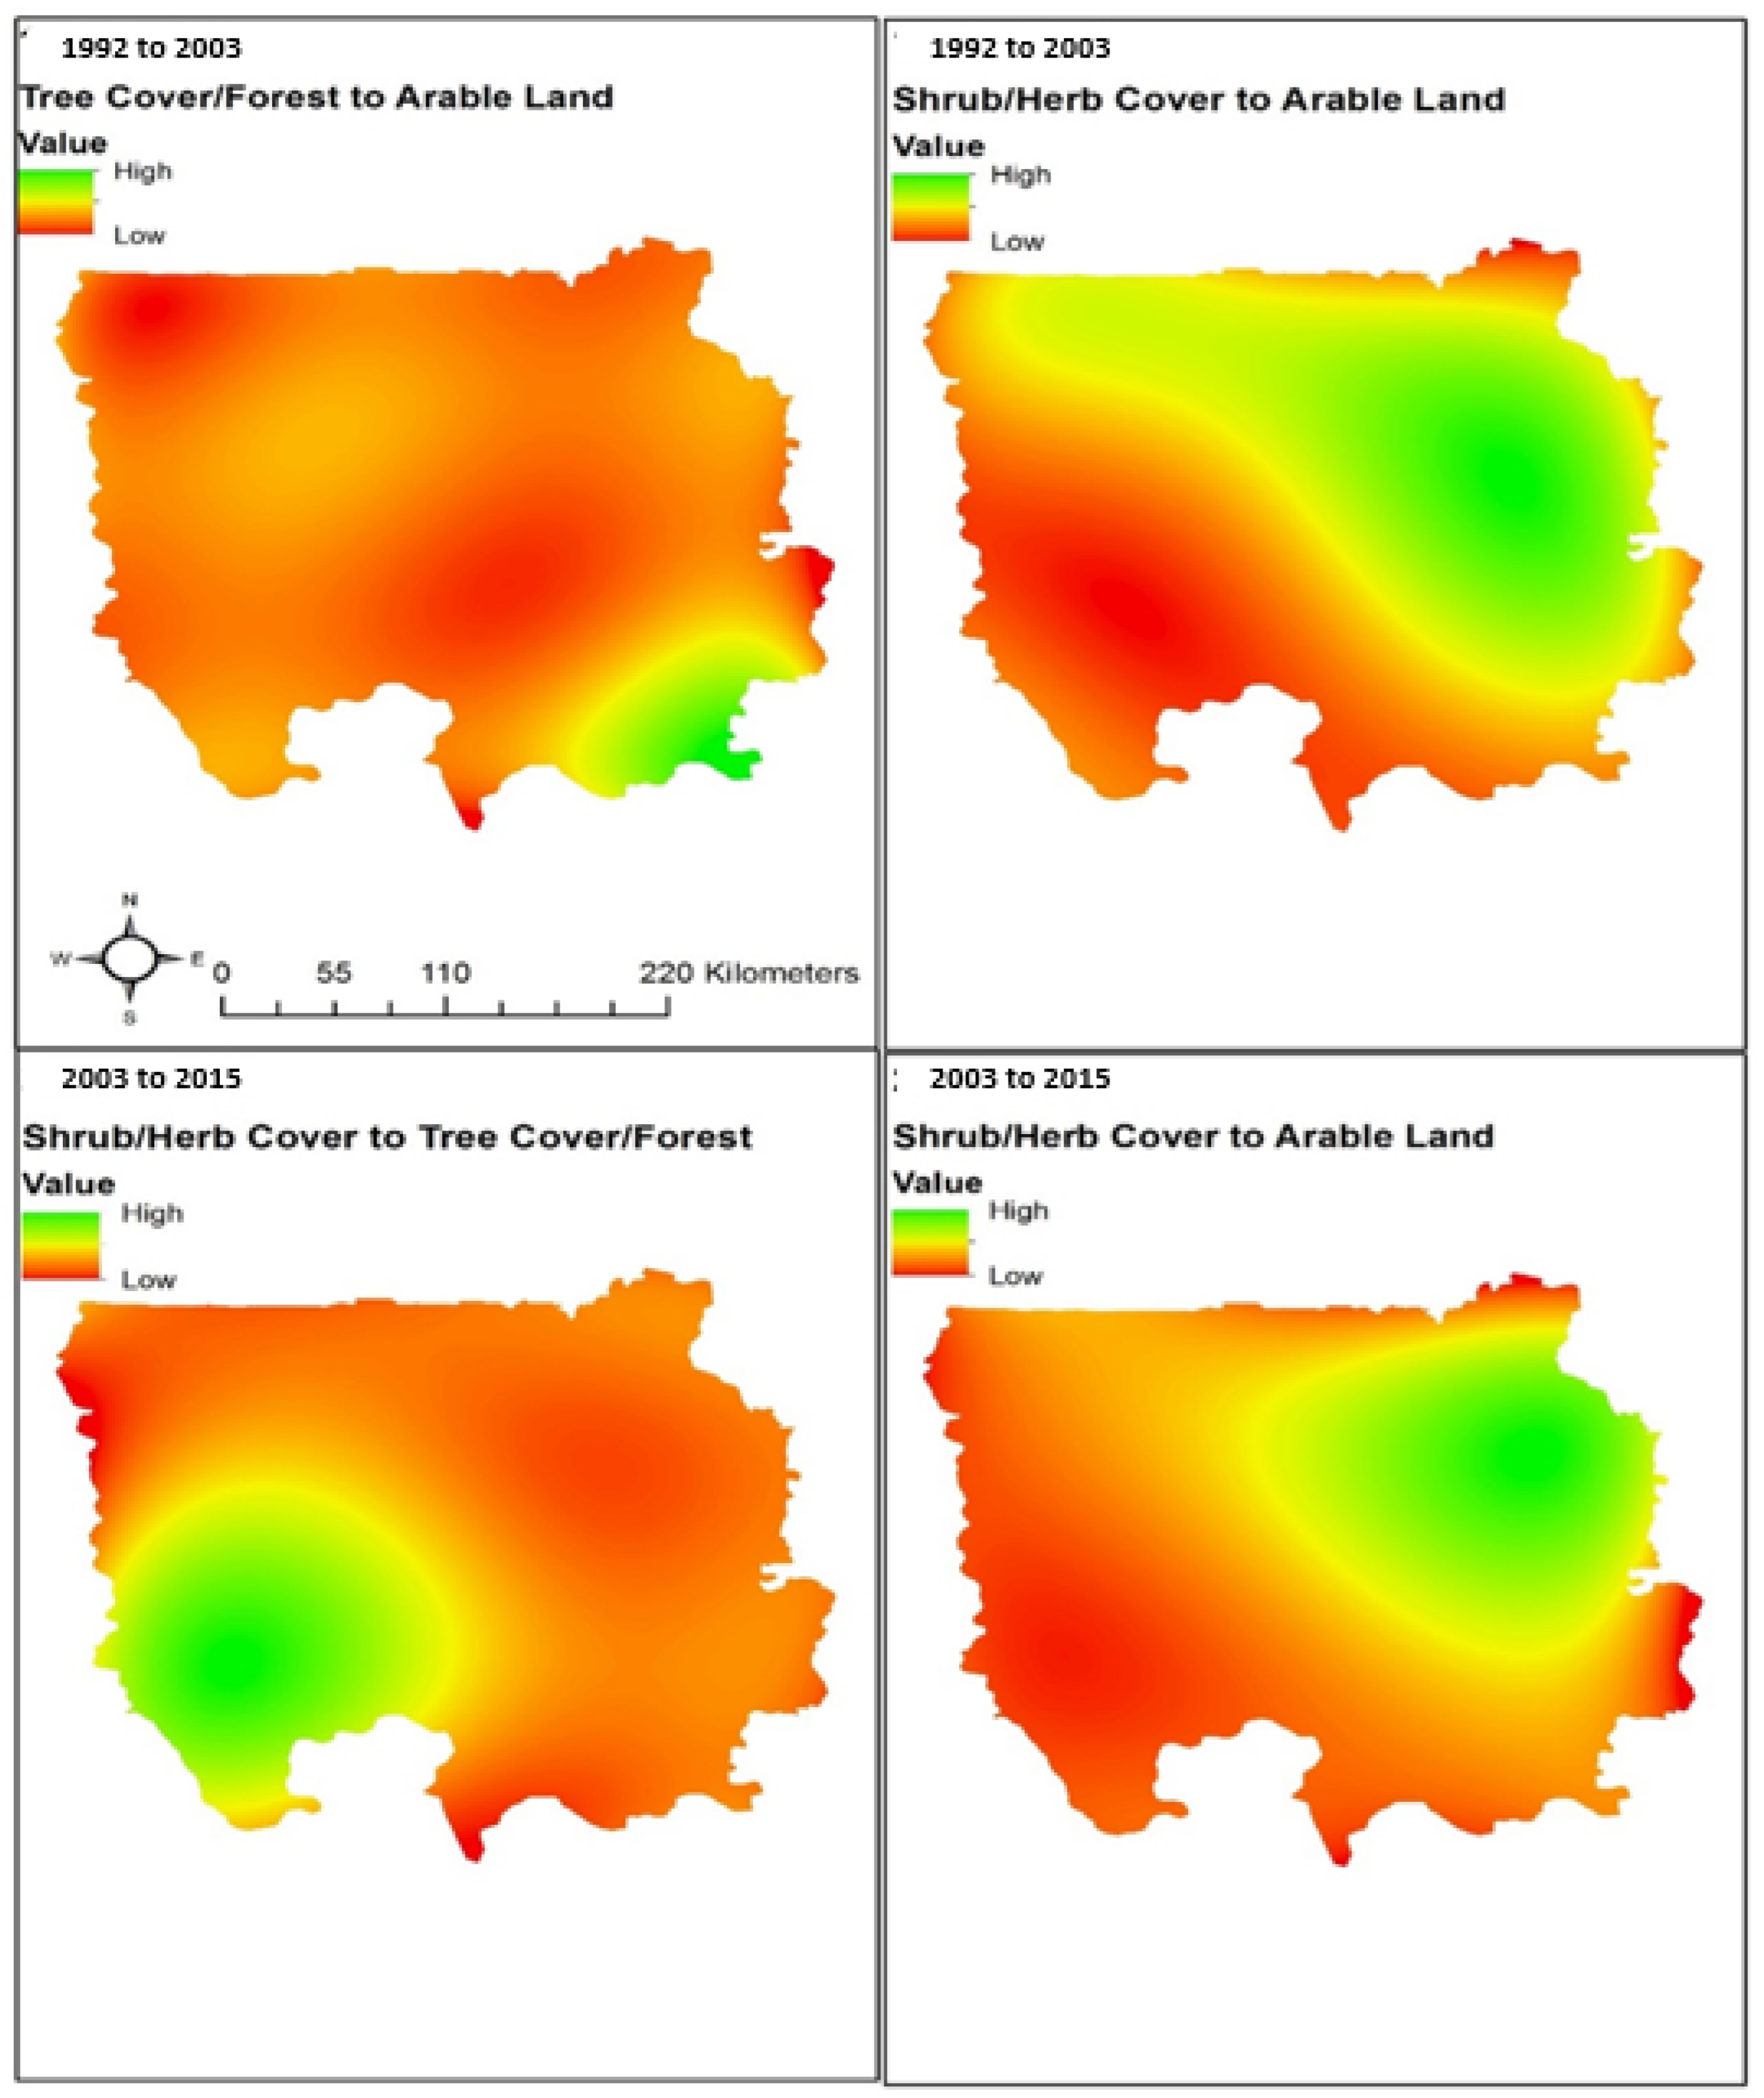
3.3. Spatial Trends of Change
4. Discussion
4.1. Interpretation of Change Intensities
4.2. Linking Pattern to Process: Local Drivers of Land Change and Implications on Land Management
- The “modified Taungya” system, introduced in 2002, encourages tree planting in degraded forests. Much of this planting occurs in the transitional zone, which is a degraded and environmentally vulnerable area in Northern Ghana that is experiencing a shift from forest to savanna vegetation [37]. While the trees are growing, farmers are allowed to intercrop food crops [38].
- Mining companies have engaged in reforestation to restore mined lands, as evidenced in southern Ghana [35]. However, although tree cover may increase, the original natural ecosystems and biodiversity have been lost.
- Ghana has embarked on a number of reforestation schemes. The 1994 Forest and Wildlife Policy included a reforestation program that encouraged individuals, communities, and organisations to set up plantation forests [39]. Efforts have also been made to encourage private investment in plantations, with varying degrees of success [38]. More recently, there has been a move to "regreen" northern Ghana [40].
- The global focus on mitigating climate change through afforestation and reduced forest loss may also be contributing to localised increases in tree-cover. At the individual or household level, the decision to plant trees is influenced by the duration of land tenure and land- and tree-ownership rights [38]. For example, the Forest Plantation Development Fund Act 2000, for the first time, gave farmers the rights to trees and timber on their land, which has also encouraged on-farm tree planting [38].
- Our recorded change in tree-cover may also reflect the increased planting of tree crops, including mango and cashew, which in Ghana can bestow semi-permanent land rights to the farmer, in addition to providing a source of income [41]. The ESA mapping does not discriminate between natural forest, forest tree plantations, and fruit tree orchards.
4.3. Effects of Map Classification Errors
5. Limitations of the Study
6. Conclusion
Supplementary Materials
Author Contributions
Funding
Institutional Review Board Statement
Informed Consent Statement
Data Availability Statement
Acknowledgments
Conflicts of Interest
References
- Turner, B.L.; Lambin, E.F.; Reenberg, A. The emergence of land change science for global environmental change and sustainability. Proc. Natl. Acad. Sci. USA 2008, 105, 20690–20695. [Google Scholar] [CrossRef] [PubMed] [Green Version]
- Díaz, S.; Demissew, S.; Carabias, J.; Joly, C.; Lonsdale, M.; Ash, N.; Larigauderie, A.; Adhikari, J.R.; Arico, S.; Báldi, A.; et al. The IPBES Conceptual Framework—Connecting nature and people. Curr. Opin. Environ. Sustain. 2015, 14, 1–16. [Google Scholar] [CrossRef] [Green Version]
- Nagendra, H.; Munroe, D.K.; Southworth, J. From pattern to process: Landscape fragmentation and the analysis of land use/land cover change. Agric. Ecosyst. Environ. 2004, 101, 111–115. [Google Scholar] [CrossRef]
- Phalan, B.; Green, R. Reconciling food production and biodiversity conservation: Land sharing and land sparing compared. Science 2011, 333, 1289–1292. [Google Scholar] [CrossRef]
- Laurance, W.F.; Sayer, J.; Cassman, K.G. Agricultural expansion and its impacts on tropical nature. Trends Ecol. Evol. 2014, 29, 107–116. [Google Scholar] [CrossRef]
- Deininge, K.; Byerlee, D.; Lindsay, J.; Norton, A.; Selod, H.; Stickler, M. Rising Global Interest in Farmland—Can It Yield Sustainable and Equitable Benefits? The World Bank: Washington, DC, USA, 2011. [Google Scholar]
- Faurès, J.-M.; Hoogeveen, J.; Bruinsma, J. The FAO Irrigated Area Forecast for 2030; FAO: Rome, Italy, 2002; pp. 1–14. [Google Scholar]
- Bai, Y.; Ochuodho, T.O.; Yang, J. Impact of land use and climate change on water-related ecosystem services in Kentucky, USA. Ecol. Indic. 2019, 102, 51–64. [Google Scholar]
- Lang, Y.; Song, W. Quantifying and mapping the responses of selected ecosystem services to projected land use changes. Ecol. Indic. 2019, 102, 186–198. [Google Scholar] [CrossRef]
- Sánchez, A.; Namhata, C. What feeds protest participation in sub-Saharan Africa? An empirical analysis. Glob. Food Secur. 2019, 23, 74–84. [Google Scholar] [CrossRef]
- Shoyama, K.; Braimoh, A.K.; Avtar, R.; Saito, O. Land Transition and Intensity Analysis of Cropland Expansion in Northern Ghana. Environ. Manag. 2018, 62, 892–905. [Google Scholar] [CrossRef]
- Shoyama, K.; Braimoh, A.K. Analyzing about sixty years of land-cover change and associated landscape fragmentation in Shiretoko Peninsula, Northern Japan. Landsc. Urban Plan. 2011, 101, 22–29. [Google Scholar] [CrossRef]
- Aldwaik, S.Z.; Pontius, R.G. Intensity analysis to unify measurements of size and stationarity of land changes by interval, category, and transition. Landsc. Urban Plan. 2012, 106, 103–114. [Google Scholar] [CrossRef]
- Romero-Ruiz, M.H.; Flantua, S.G.A.; Tansey, K.; Berrio, J.C. Landscape transformations in savannas of northern South America: Land use/cover changes since 1987 in the Llanos Orientales of Colombia. Appl. Geogr. 2012, 32, 766–776. [Google Scholar] [CrossRef]
- Pontius, R.; Gao, Y.; Giner, N.; Kohyama, T.; Osaki, M.; Hirose, K. Design and Interpretation of Intensity Analysis Illustrated by Land Change in Central Kalimantan, Indonesia. Land 2013, 2, 351–369. [Google Scholar] [CrossRef]
- Alo, C.A.; Pontius, R.G. Identifying systematic land-cover transitions using remote sensing and GIS: The fate of forests inside and outside protected areas of Southwestern Ghana. Environ. Plan. B Plan. Des. 2008, 35, 280–295. [Google Scholar] [CrossRef]
- Ekumah, B.; Armah, F.A.; Afrifa, E.K.A.; Aheto, D.W.; Odoi, J.O.; Afitiri, A.-R. Assessing land use and land cover change in coastal urban wetlands of international importance in Ghana using Intensity Analysis. Wetl. Ecol. Manag. 2020, 28, 271–284. [Google Scholar] [CrossRef]
- Tankpa, V.; Wang, L.; Atanga, R.A.; Awotwi, A.; Guo, X. Evidence and impact of map error on land use and land cover dynamics in Ashi River watershed using intensity analysis. PLoS ONE 2020, 15, e0229298. [Google Scholar] [CrossRef] [PubMed] [Green Version]
- Villamor, G.B.; Pontius, R.G.; van Noordwijk, M. Agroforest’s growing role in reducing carbon losses from Jambi (Sumatra), Indonesia. Reg. Environ. Chang. 2014, 14, 825–834. [Google Scholar] [CrossRef]
- Akinyemi, F.O.; Pontius, R.G.; Braimoh, A.K. Land change dynamics: Insights from Intensity Analysis applied to an African emerging city. J. Spat. Sci. 2017, 62, 69–83. [Google Scholar]
- Zhou, P.; Huang, J.; Pontius, R.G.; Hong, H. Land classification and change intensity analysis in a coastal watershed of Southeast China. Sensors 2014, 14, 11640–11658. [Google Scholar] [CrossRef] [Green Version]
- Braimoh, A.K. Agricultural land-use change during economic reforms in Ghana. Land Use Policy 2009, 26, 763–771. [Google Scholar] [CrossRef]
- Braimoh, A.K. Random and systematic land-cover transitions in northern Ghana. Agric. Ecosyst. Environ. 2006, 113, 254–263. [Google Scholar] [CrossRef]
- Clark Labs TerrSet Tutorial; Clark Labs, Clark University: Worcester, MA, USA, 2015.
- Mousivand, A.; Arsanjani, J.J. Insights on the historical and emerging global land cover changes: The case of ESA-CCI-LC datasets. Appl. Geogr. 2019, 106, 82–92. [Google Scholar] [CrossRef]
- Li, W.; Ciais, P.; MacBean, N.; Peng, S.; Defourny, P.; Bontemps, S. Major forest changes and land cover transitions based on plant functional types derived from the ESA CCI Land Cover product. Int. J. Appl. Earth Obs. Geoinf. 2016, 47, 30–39. [Google Scholar] [CrossRef]
- Pontius, R.G.; Shusas, E.; McEachern, M. Detecting important categorical land changes while accounting for persistence. Agric. Ecosyst. Environ. 2004, 101, 251–268. [Google Scholar] [CrossRef]
- Enaruvbe, G.O.; Pontius, R.G. Influence of classification errors on Intensity Analysis of land changes in southern Nigeria. Int. J. Remote Sens. 2015, 36, 244–261. [Google Scholar] [CrossRef]
- Aldwaik, S.Z.; Pontius, R.G. Map errors that could account for deviations from a uniform intensity of land change. Int. J. Geogr. Inf. Sci. 2013, 27, 1717–1739. [Google Scholar] [CrossRef]
- Jasaw, G.S.; Saito, O.; Takeuchi, K. Shea (Vitellaria paradoxa) butter production and resource use by urban and rural processors in northern Ghana. Sustainability 2015, 7, 3592–3614. [Google Scholar] [CrossRef] [Green Version]
- Antwi, E.K.; Boakye-Danquah, J.; Asabere, S.B.; Yiran, G.A.B.; Loh, S.K.; Awere, K.G.; Abagale, F.K.; Asubonteng, K.O.; Attua, E.M.; Owusu, A.B. Land Use and Landscape Structural Changes in the Ecoregions of Ghana. J. Disaster Res. 2016, 9, 452–467. [Google Scholar] [CrossRef] [Green Version]
- Udondian, N.S. Exploring Agricultural Intensification: A Case Study of Nigerian Government Rice and Cassava Initiatives. Int. J. Agric. Econ. 2018, 3, 118. [Google Scholar]
- Kleemann, J.; Baysal, G.; Bulley, H.N.N.; Fürst, C. Assessing driving forces of land use and land cover change by a mixed-method approach in north-eastern Ghana, West Africa. J. Environ. Manag. 2017, 196, 411–442. [Google Scholar] [CrossRef]
- Boafo, Y.A.; Saito, O.; Takeuchi, K. Provisioning ecosystem services in rural savanna landscapes of Northern Ghana: An assessment of supply, utilization, and drivers of change. J. Disaster Res. 2014, 9, 501–515. [Google Scholar] [CrossRef]
- Blench, R.; Dendo, M. Cultural and biological interactions in the savanna woodlands of Northern Ghana: Sacred forests and management of trees. In Proceedings of the Conference Trees, Rain and Politics in Africa, Oxford, UK, 29 September–1 October 2004. [Google Scholar]
- Obiri, B.D.; Kyereh, B.; Obeng, E.A.; Acquah, S.B. Perception and participation of local communities in tree planting initiatives. Ghana J. For. 2011, 27, 80–93. [Google Scholar]
- Kalame, F.B.; Aidoo, R.; Nkem, J.; Ajayie, O.C.; Kanninen, M.; Luukkanen, O.; Idinoba, M. Modified taungya system in Ghana: A win-win practice for forestry and adaptation to climate change? Environ. Sci. Policy 2011, 14, 519–530. [Google Scholar] [CrossRef]
- Insaidoo, T.F.G.; Ros-tonen, M.A.F.; Hoogenbosch, L.; Acheampong, E. Addressing forest degradation and timber deficits in Ghana. ETFRN News 2012, 53, 230–239. [Google Scholar]
- Zhang, D.; Aboagye Owiredu, E. Land tenure, market, and the establishment of forest plantations in Ghana. For. Policy Econ. 2007, 9, 602–610. [Google Scholar] [CrossRef]
- Baxter, J. The Tamale Declaration: A Regreening Plan for Northern Ghana. Available online: http://blog.worldagroforestry.org/index.php/2018/12/18/the-tamale-declaration-a-regreening-plan-for-northern-ghana/ (accessed on 10 December 2020).
- Vehnamaki, M. Economic policy and regional economic development in Ghana [Talouspolitiikka ja alueellinen taloudellinen kehitys Ghanassa]. Terra 1997, 109, 129–137. [Google Scholar]
- Teixeira, Z.; Marques, J.C.; Pontius, R.G. Evidence for deviations from uniform changes in a Portuguese watershed illustrated by CORINE maps: An Intensity Analysis approach. Ecol. Indic. 2016, 66, 282–290. [Google Scholar] [CrossRef] [Green Version]


| Category | 1992 (%) | 2003 (%) | 1st Time Interval | 2015 (%) | 2nd Time Interval |
|---|---|---|---|---|---|
| Arable Land | 20.79 | 22.27 | 1.48 | 23.62 | 1.35 |
| Shrub/Herb-Cover | 39.03 | 32.61 | −6.42 | 30.12 | −2.49 |
| Tree/Forest-Cover | 39.36 | 44.28 | 4.92 | 45.24 | 0.96 |
| Grassland | 0.01 | 0.00 | 0.00 | 0.01 | 0.00 |
| Urban Areas | 0.02 | 0.02 | 0.01 | 0.08 | 0.05 |
| Bare Areas | 0.00 | 0.00 | 0.00 | 0.00 | 0.00 |
| Water Bodies | 0.79 | 0.81 | 0.02 | 0.94 | 0.13 |
| Total | 100 | 100 | 100 |
| 1992–2003 | Arable Land | Shrub/ Herb-Cover | Tree/Forest-Cover | Grassland | Urban Areas | Bare Areas | Water Bodies | Total | Gross Loss |
|---|---|---|---|---|---|---|---|---|---|
| Arable Land | 20.741 | 0.020 | 0.026 | 0.000 | 0.003 | 0.000 | 0.002 | 20.791 | 0.050 |
| Shrub/Herb-Cover | 1.517 | 32.520 | 4.978 | 0.000 | 0.000 | 0.000 | 0.016 | 39.032 | 6.512 |
| Tree/Forest-Cover | 0.011 | 0.072 | 39.274 | 0.000 | 0.001 | 0.000 | 0.004 | 39.361 | 0.087 |
| Grassland | 0.000 | 0.000 | 0.000 | 0.003 | 0.002 | 0.000 | 0.000 | 0.005 | 0.002 |
| Urban Areas | 0.000 | 0.000 | 0.000 | 0.000 | 0.019 | 0.000 | 0.000 | 0.019 | 0.000 |
| Bare Areas | 0.000 | 0.000 | 0.000 | 0.000 | 0.000 | 0.001 | 0.000 | 0.001 | 0.000 |
| Water Bodies | 0.000 | 0.000 | 0.001 | 0.000 | 0.000 | 0.000 | 0.788 | 0.790 | 0.001 |
| Total | 22.269 | 32.611 | 44.279 | 0.004 | 0.025 | 0.001 | 0.810 | 99.998 | |
| Gross Gain | 1.528 | 0.092 | 5.005 | 0.000 | 0.005 | 0.000 | 0.022 | 6.652 | 6.652 |
| 2003–2015 | |||||||||
| Arable Land | 22.114 | 0.094 | 0.025 | 0.000 | 0.034 | 0.000 | 0.001 | 22.269 | 0.155 |
| Shrub/Herb-Cover | 1.503 | 29.976 | 1.052 | 0.003 | 0.003 | 0.000 | 0.075 | 32.611 | 2.635 |
| Tree/Forest-Cover | 0.001 | 0.051 | 44.158 | 0.000 | 0.014 | 0.000 | 0.057 | 44.279 | 0.122 |
| Grassland | 0.000 | 0.000 | 0.000 | 0.002 | 0.001 | 0.000 | 0.000 | 0.004 | 0.001 |
| Urban Areas | 0.000 | 0.000 | 0.000 | 0.000 | 0.025 | 0.000 | 0.000 | 0.025 | 0.000 |
| Bare Areas | 0.000 | 0.000 | 0.000 | 0.000 | 0.000 | 0.001 | 0.000 | 0.001 | 0.000 |
| Water Bodies | 0.000 | 0.002 | 0.003 | 0.000 | 0.000 | 0.001 | 0.806 | 0.812 | 0.006 |
| Total | 23.618 | 30.123 | 45.237 | 0.006 | 0.077 | 0.001 | 0.939 | 100.000 | |
| Gross Gain | 1.504 | 0.147 | 1.080 | 0.003 | 0.052 | 0.001 | 0.133 | 2.919 | 2.919 |
Publisher’s Note: MDPI stays neutral with regard to jurisdictional claims in published maps and institutional affiliations. |
© 2022 by the authors. Licensee MDPI, Basel, Switzerland. This article is an open access article distributed under the terms and conditions of the Creative Commons Attribution (CC BY) license (https://creativecommons.org/licenses/by/4.0/).
Share and Cite
Manzoor, S.A.; Griffiths, G.H.; Robinson, E.; Shoyama, K.; Lukac, M. Linking Pattern to Process: Intensity Analysis of Land-Change Dynamics in Ghana as Correlated to Past Socioeconomic and Policy Contexts. Land 2022, 11, 1070. https://doi.org/10.3390/land11071070
Manzoor SA, Griffiths GH, Robinson E, Shoyama K, Lukac M. Linking Pattern to Process: Intensity Analysis of Land-Change Dynamics in Ghana as Correlated to Past Socioeconomic and Policy Contexts. Land. 2022; 11(7):1070. https://doi.org/10.3390/land11071070
Chicago/Turabian StyleManzoor, Syed Amir, Geoffrey Hugh Griffiths, Elizabeth Robinson, Kikuko Shoyama, and Martin Lukac. 2022. "Linking Pattern to Process: Intensity Analysis of Land-Change Dynamics in Ghana as Correlated to Past Socioeconomic and Policy Contexts" Land 11, no. 7: 1070. https://doi.org/10.3390/land11071070