Article

Assessment of the Efficiency of Cultivated Land Occupied by Urban and Rural Construction Land in China from 1990 to 2020

1
Key Laboratory of Land Surface Pattern and Simulation, Institute of Geographic Sciences and Natural Resources Research, CAS, Beijing 100101, China
2
College of Resources and Environment, University of Chinese Academy of Sciences, Beijing 100049, China
*
Author to whom correspondence should be addressed.
Land 2022, 11(6), 941; https://doi.org/10.3390/land11060941
Submission received: 16 May 2022 / Revised: 9 June 2022 / Accepted: 16 June 2022 / Published: 18 June 2022
(This article belongs to the Special Issue Agricultural Land Use and Food Security)

Abstract

:
The rapid urbanization and economic growth experienced by China in recent years has led to the expansion of construction land. This has resulted in the substantial transformation of cultivated land to construction land. However, the efficiency of cultivated land occupation by construction land, its regional differences, and the urban-rural disparity in China remain unclear. Therefore, using population and land use data, we measured the efficiency of cultivated land occupied by urban and rural construction land in China during 1990–2020 by proposing absolute, differential, and relative efficiency evaluation methods. Our study revealed that the cultivated land area occupied by rural construction land is 22.4% higher than that of urban construction land. The efficiency of cultivated land occupied by construction land in urban areas was higher than that in rural areas. Spatially, the population in the urban and rural construction land-occupied cultivated land area shows a pattern of high in the southeast and low in the northwest. The efficiency of urban and rural construction land-occupied cultivated land increases with increasing urban size. Thus, to improve the efficiency of cultivated land occupied by construction land, the strict control on the urban construction occupation of cultivated land should be loosened, particularly for larger cities, and the control on inefficient construction in rural areas should be tightened.

1. Introduction

China has experienced rapid urbanization since the 1990s, with the degree of population urbanization increasing rapidly from 26.4% in 1990 to 63.9% in 2020. Over the past 30 years, the urban population has increased by about 200%, whereas the rural population has decreased by 40% [1]. Approximately 14 million people migrate from rural to urban areas each year [2]. Rapid urbanization has been accompanied by dramatic changes in land use in China. The area of construction land, which is an important carrier of economy, industry, and population, has increased at an annual rate of 1.44%, and the trend will continue owing to the increase in its demand [3,4].
The occupation of cultivated land by urban construction land has been extensively studied by scholars [5,6]. The importance of cultivated land in China is incomparable to that of other countries because of its huge population. The Chinese government has implemented several policies to strictly control cultivated land occupation, such as the “Cultivated land red line” and “Cultivated land balance”. From 1990 to 2015, the urban construction land in China occupied 2.12 × 10⁶ ha of cultivated land, which contributed 70% to the total expansion of construction land. Moreover, the occupation of construction land is spatially heterogeneous, and it is particularly severe in eastern China. [7]. Although cultivated land accounts for a large proportion of the urban construction land expansion, it accounts for less than 20% of the total cultivated land area that was lost [8]. Moreover, rural construction land would also occupy a sizable portion of cultivated land loss. Rural areas are the source of population exodus in the urbanization process. However, the expansion of rural construction land has not yet received considerable attention, although its area is larger than that of urban construction land [9]. In recent decades, the occupation area of the cultivated land has continued to increase [10,11]. The area of rural construction land for each rural population in China was 218.32 m2, which is about twice the per capita area of urban construction land, in 2015 [12,13]. The extensive expansion of rural construction land and its inefficient occupation of cultivated land pose a great threat to food security and the ecological environment. Moreover, managing the irrational expansion of rural construction land would be more crucial than the necessary urban growth for cultivated land protection. However, the efficiency of the occupation of cultivated land by construction land (urban and rural) during the rapid development in China in the recent decades and their spatial pattern remain unexplored.
Currently, several studies have focused on the efficiency of construction land use. Some scholars used a single indicator (e.g., economic output, population) to measure construction land-use efficiency. Others adopted comprehensive evaluation methods, such as integrating economic, social, and environmental factors of construction land efficiency by constructing an evaluation index system, combining hierarchical, principal component, and data envelopment analyses [14,15,16]. However, studies on the efficiency of cultivated land occupied by construction land are still lacking. Few studies used input-output analysis to assess the economic efficiency of cultivated land occupied by construction land [7] while encountering difficulties in comparing the efficiency of the occupation of cultivated land by urban and rural construction land due to the huge gap in economic yield between urban and rural areas.
The present study aimed to: (1) spatialize population data in 1990 and 2020 and combine it with nighttime light data and land use data, (2) calculate the efficiency indices in China from 1990 to 2020 with the perspective of the population carrying capacity, and (3) analyze the spatial pattern of efficiency indices in China.

2. Materials and Methods

2.1. Data Sources and Preprocessing

2.1.1. Land Use Data

The land use data of China in 1990 and 2018 with a 100-m spatial resolution (Figure 1) were obtained from the Resource and Environment Science and Data Center (http://www.resdc.cn, accessed on 15 May 2022). The data were generated by manual visual interpretation based on Landsat TM and OLI imagery from the U.S. Landsat and included nine primary and 26 secondary classes. The overall accuracy of the land use data was >85%, and the accuracies of cultivated land, urban construction land, and rural construction land were >95%. Data for cultivated land, urban construction land, rural construction land, other construction land, water bodies, and unused land were used in the present study.
“Urban construction land” refers to the built-up areas in cities and towns, whereas “rural construction land” refers to the built-up areas in rural settlements. “Other construction land” refers to factories and mine areas, large industrial areas, oil fields, salt fields, quarries, as well as traffic roads, and airports. “Unused land” refers to the areas that are not being used currently. As we did not obtain the land use data for 2020, the land use data for 2018 were used to represent the land-use status of China in 2020.
The occupation of cultivated land by urban and rural construction land during 1990–2020 was obtained using overlay analysis. The proportion of the area under cultivated, urban construction, rural construction, and other construction lands within a 1 km × 1 km raster were calculated during the resampling process to provide subsequent population spatialization.

2.1.2. Population Data

The county-level population data in 1990 and 2020 used in this study were obtained from the fourth and seventh censuses of China. The statistical caliber included the permanent resident population, which means one person living in one place for over six months in the survey year. The population data for 1990 were obtained from the China Population and Employment Statistics Yearbook (1991) and that of 2020 were obtained from the seventh census bulletins published by the regions under study.
We matched the population data at the county level in 1990 and 2020 to their respective administrative boundaries for population spatialization. Additionally, the urban resident population in 2020 was further used for the classification of cities. Five classes of cities, namely super megacities (>10 million inhabitants), megacities (5 million–10 million), big cities (1 million–5 million), medium-sized cities (0.5 million–1 million), and small cities (<0.5 million), were identified based on the “Circular on Adjusting the Criteria for the Classification of City Size (State Council [2014] No. 51)” [17].

2.1.3. Nighttime Light Data

The nighttime light data were used for simulating the spatial distribution of the population. The DMSP/OLS Nighttime Light data in 1992 and the VIIRS Nighttime Light data in 2020 were employed. Annual mean values of the nighttime light data were calculated to represent the values for the two years. The nighttime light data have been available since 1992, and hence, the nighttime light data of 1992 were used for the population spatialization simulation of 1990. The data of 1990 and 2020 were resampled onto a 1 km grid for population spatialization as the two data had different spatial resolutions. Although the nighttime light data for 1992 and 2020 are from different sensors, data calibration for the two periods was not required because we spatialized the population in the two years separately.

2.2. Methods

2.2.1. Population Spatialization

The county population was allocated to grid cells to obtain the population on each cultivated land occupied by urban and rural construction land. Related studies indicated that the nighttime light data showed a high correlation with human activities, which could be combined with land use data to achieve high accuracy of simulation [18,19,20]. The three main categories of population spatialization methods include area weighting [21], spatial covariate weighting [18,19,22], and artificial intelligence simulation methods [23,24,25]. Among them, the multiple linear regression method in the spatial covariate weighting methods is widely used for long-term and large-scale population spatialization because of its simplicity, low requirement for the amount of data, and high accuracy. For these reasons, the multiple linear regression method, which was previously described by Tan [19], was used in the present study to spatialize the population into pixel scale. Specifically, water bodies and unused land were excluded first. The multiple linear regression models were constructed at county-scale using census data, mean values of the nighttime light data, and the area proportions of cultivated land, urban construction land, rural construction land, and other construction land. The fitted equations for the spatialization of the population in 1990 and 2020 are listed as follows:
P o p 1990 , i = 15.298 × C u l 1990 , i + 104.636 × U r b a n 1990 , i + 18.667 × R u r a l 1990 , i + 8.671 × O t h e r 1990 , i + 0.774 × N T L 1990 , i + 6.711
P o p 2020 , i = 10.438 × C u l 2020 , i + 82.191 × U r b a n 2020 , i + 23.986 × R u r a l 2020 , i + 50.950 × O t h e r 2020 , i + 1.332 × N T L 2020 , i + 7.676
where P o p 1990 , i and P o p 2020 , i represent the population density of county i in 1990 and 2020, respectively; C u l i , U r b a n i , R u r a l i , and O t h e r i represent the area proportions of cultivated land, urban construction land, rural construction land, and other construction land in county i , respectively; and N T L i represents the mean value of the nighttime light data in county i .
The simulation results of the spatial population density for 1990 and 2020 were corrected using Equation (3). The simulation results were validated with towns/sub-districts-level data (Figures S1 and S2 in Supplementary Materials).
P i , j = P o p i × P i , j j = 1 n P i , j
where P i , j represents the corrected population density of grid j in county i ; P i , j represents the simulated population density of grid j in county i .

2.2.2. Cultivated Land Occupancy Efficiency

To evaluate cultivated land use efficiencies before and after the occupation by urban or rural construction land, the following efficiency evaluation methods were proposed: the absolute efficiency of cultivated land occupied by construction land (Ea), the differential efficiency of cultivated land occupied by construction land (Ed), and the relative efficiency of cultivated land occupied by urban and rural construction land (Er). The efficiency indices were calculated based on the administrative units of China in 2020, including four municipalities directly under the central government, 30 autonomous prefectures, three league cities, seven regions, 30 county-level administrative units under provincial administration, and 293 prefecture-level cities. Hong Kong, Macau, and Taiwan in China were not included in this study due to data access limitations.
The absolute efficiency of cultivated land occupied by construction land reflects the population per unit area of cultivated land occupied by urban or rural construction land (Equation (4)).
E a i = P o i S i
where E a i represents the absolute efficiency of cultivated land occupied by construction land in administrative unit i (person/ha); P o i represents the total population carried by the cultivated land in administrative unit i after being occupied by urban or rural construction land; S i represents the area of cultivated land occupied by construction land in urban or rural areas in administrative unit i . The larger the E a i , the greater the population carried by urban or rural construction land per unit of cultivated land area occupied, and the higher the efficiency of the construction land.
The differential efficiency of cultivated land occupied by construction land reflects the difference in population per unit area of cultivated land before and after being occupied by urban or rural construction land. It compares longitudinal changes in efficiency caused by the occupation of cultivated land by construction land in conjunction with population movement (Equation (5)).
E d i = P o i P u i S i
where E d i represents the differential efficiency of cultivated land occupied by construction land in administrative unit i (person/ha); P o i represents the total population on the cultivated land in administrative unit i after being occupied by urban or rural construction land.
P u i represents the total population carried on the cultivated land in administrative unit i before it was occupied by urban or rural construction land. E d i > 0 indicates that the population carried per unit area of construction land changed from cultivated land increases. The larger the E d i , the higher the efficiency, and vice versa.
Relative efficiency of cultivated land occupied by urban and rural construction land compares the differences in the population per unit area of urban and rural construction lands within an administrative unit (Equation (6)).
E r i = E a i , u r b a n E a i , r u r a l
where E r i represents the relative efficiency of cultivated land occupied by urban and rural construction lands in administrative unit i ; E a i , u r b a n and E a i , r u r a l represent the absolute efficiency of cultivated land occupied by urban construction and rural construction lands, respectively. E r i > 1 indicates that the efficiency of cultivated land occupied by urban construction land is higher than that of rural construction land in administrative unit i . The larger the E r i , the larger the gap between the efficiency of urban and rural construction land, and vice versa.

3. Results

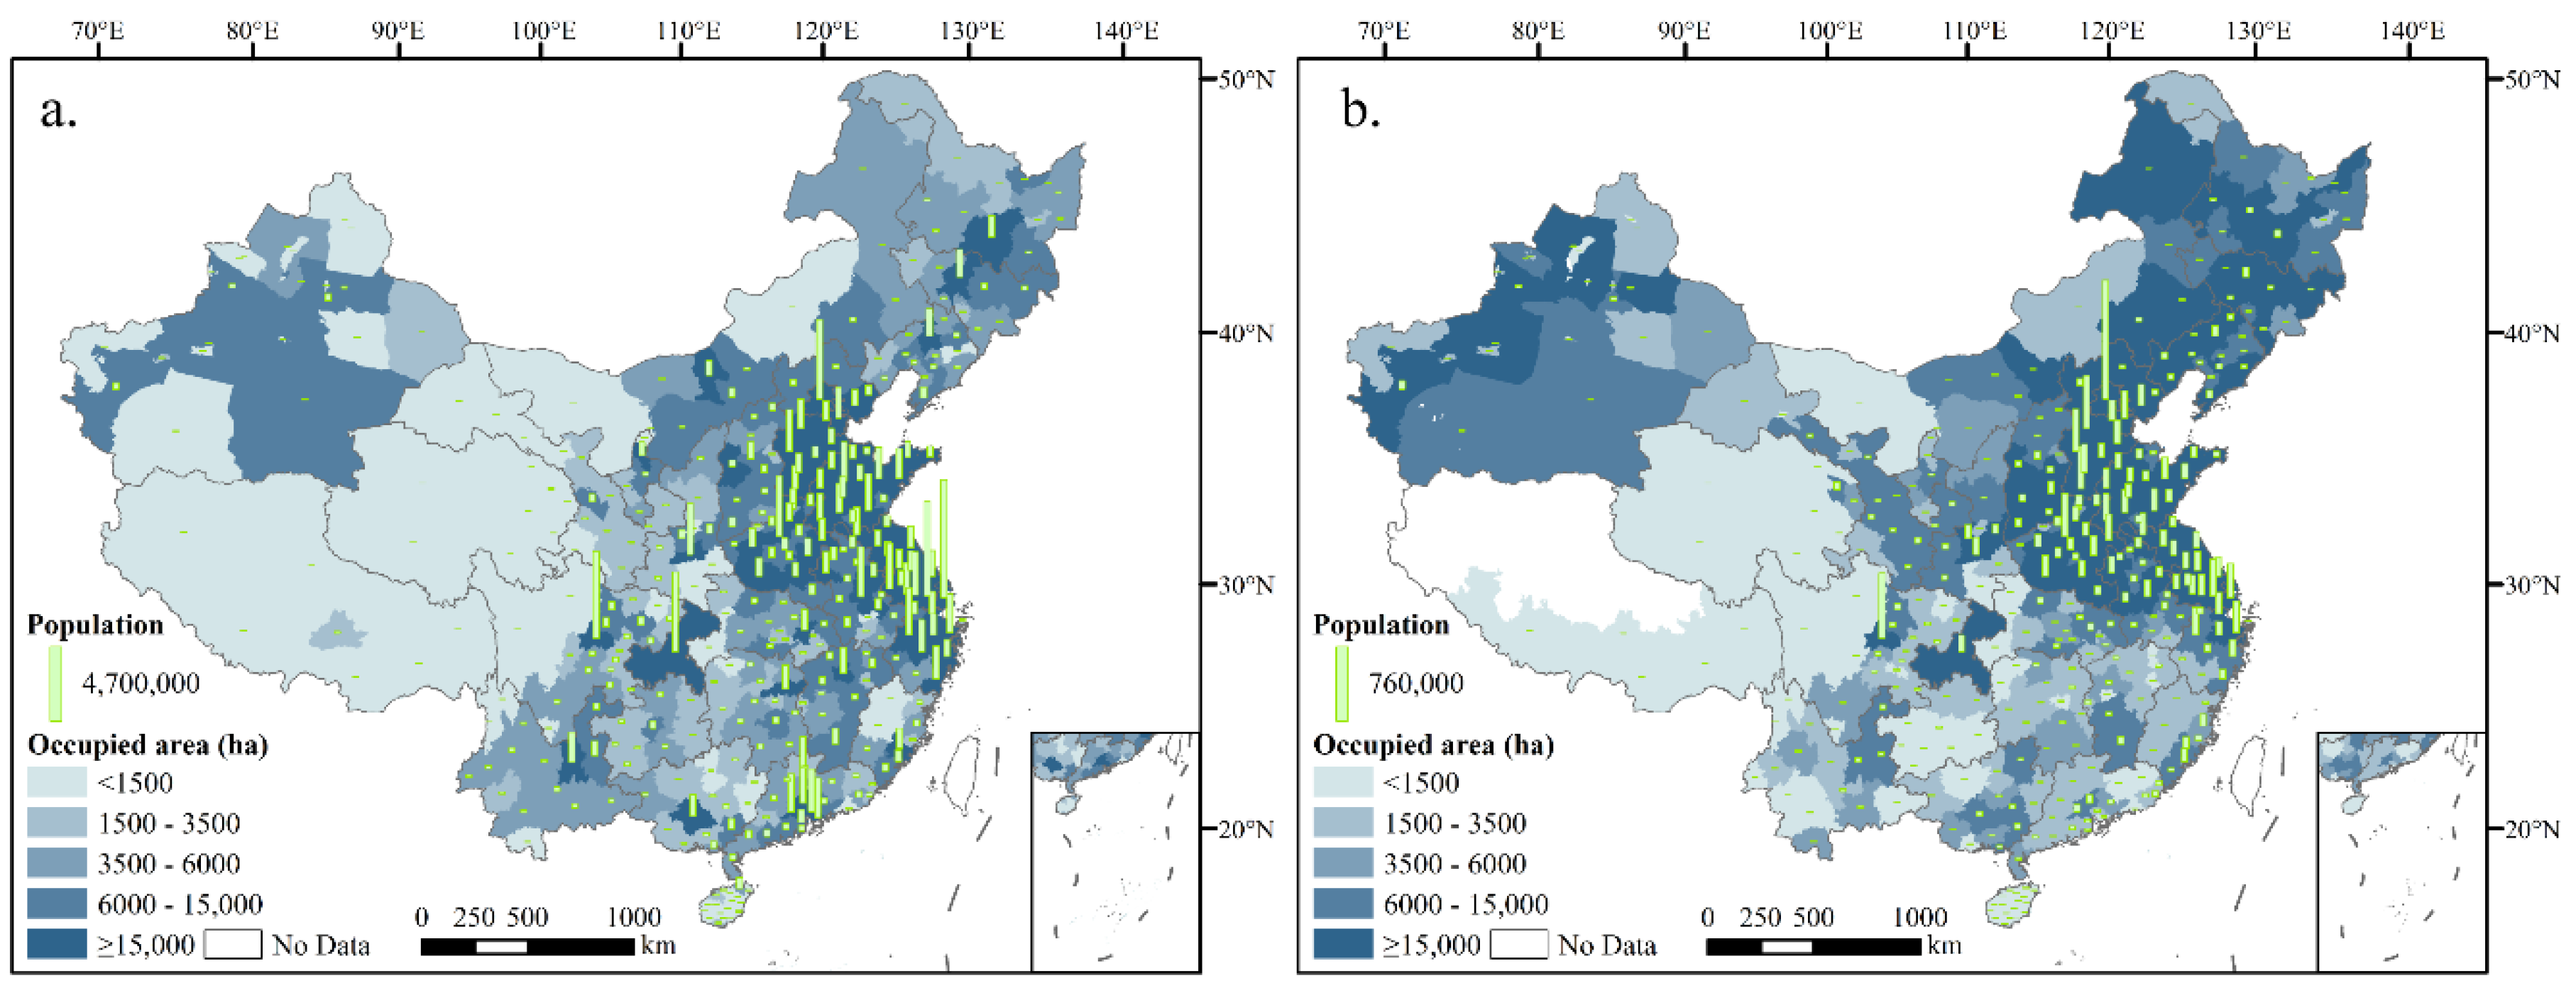
3.1. Cultivated Land Occupied by Urban and Rural Construction Land and the Population Carried by It in China from 1990 to 2020

From 1990 to 2020, the total area of cultivated land occupied by urban and rural construction lands in China reached 8.43 × 10⁶ ha, of which 3.79 × 10⁶ ha was occupied by urban construction land and 4.64 × 10⁶ ha was occupied by rural construction land, accounting for 45% and 55% of the total area, respectively. Cultivated land is the most important land-use type for the expansion of construction land. Between 1990 and 2020, 71.16% of urban construction land expansion was attributed to the transformation of cultivated land. In contrast, the cultivated land area occupied by rural construction land accounted for two times the expansion area of rural construction land. The fact that the cultivated land area occupied by rural construction land was larger than that of rural construction land expansion indicates the dramatic change from rural construction land to other land types, such as those from rural construction land to urban construction land.
Spatially (Figure 2), regions where urban construction land-occupied, large cultivated land areas were mainly concentrated in the North China Plain and relatively higher areas of the Northeast and Southern regions, and some cities in Xinjiang Province. In comparison, the area of the cultivated land occupied by rural construction land showed an overall spatial pattern of high in the north and low in the south. In addition, the cultivated land areas occupied by construction land in northern, northeastern, and northwestern China were considerably larger than those in the south.
The total population carried on urban and rural construction land, which used to be cultivated land in 1990, was 2.79 × 10⁸ in 2020. Among them, the population carried by urban construction land was much higher than that carried by rural construction land, with 90.47% and 9.53% of the population carried by the two, respectively. During 1990–2020, the increase in the population carried before and after the occupation of the cultivated land by urban and rural construction land was 1.90 × 10⁸, which was almost entirely distributed throughout urban construction land. The increase in the population carried before and after the occupation of the cultivated land by urban and rural construction land accounted for 97.96% and 2.04% of the total increase, respectively. The spatial distribution of the population carried on the cultivated land occupied by urban and rural construction land varied significantly. The cities that carry more people on cultivated land occupied by urban construction land were mainly distributed in the North China Plain and Southeast Coastal Region, and in some central cities to a lesser extent. However, cities with a high population in the cultivated land occupied by rural construction land were significantly concentrated in the North China Plain.

3.2. Efficiency of Cultivated Land Occupied by Urban and Rural Construction Land in China

3.2.1. Absolute Efficiency of Cultivated Land Occupied by Construction Land in China

From 1990 to 2020, the E a in China was 33.15, suggesting that cultivated land occupied by construction land carried an average population of 33.15 people per ha. The average E a u r b a n and E a r u r a l were 57.16 and 6.08, respectively. The larger the urban size, the higher the E a in its urban or rural area. This indicates that the higher population per unit area of its cultivated land occupied by construction land to carry (Figure 3f). As for the city size, the super megacity had the highest E a u r b a n of 100.26, and the E a u r b a n of mega-, big, medium-sized, and small cities in descending order. The E a u r b a n of super megacities exceeded that of small cities by a factor of three. Similarly, super megacities had the highest rural E a at 14.84, and this value decreased in the same order for mega-, big, medium-sized, and small cities. The E a r u r a l in super megacities is about seven times higher than that in small cities. The gap between the E a of super megacities and megacities was the largest, whereas the gap between that of medium-sized and small cities was smaller. However, the E a of urban areas was higher than that of rural areas, regardless of the population size of the city. Further, the E a u r b a n of Haikou was the largest among all administrative units with 154.84, followed by Xiamen (144.67), Shenzhen (138.06), Maoming (134.19), and Zhanjiang (129.16). Ali region had the smallest E a u r b a n at 0.17. Shantou had the largest E a r u r a l of 43.93, followed by Xiamen (34.54), Shenzhen (30.82), Pingxiang (28.95), and Chaozhou (26.25). Aksu had the smallest E a r u r a l of 0.09.
Spatially (Figure 3a,b), there were evident differences in the E a among regions. The spatial distribution characteristics of the E a in urban and rural areas are similar, showing a pattern of high in the southeast and low in the northwest. The high values were mainly concentrated in the Sichuan basin and southeast coastal region, whereas the low values were mainly distributed in the northeast and northwest regions.

3.2.2. Differential Efficiency of Cultivated Land Occupied by Construction Land

From 1990 to 2020, the E d in China was 22.59, indicating that the population per ha carried after construction land occupation increased by 22.59 relative to the number before the cultivated land was occupied. The average E d u r b a n and E d r u r a l were 39.97 and 1.45, respectively, suggesting that the E d was 27 times higher in urban areas than in rural areas. This phenomenon indicates that the cultivated land occupation by urban construction land has an absolute advantage over the increase in the population carried on rural construction land occupation of cultivated land. The E d also conformed to the rule that the larger the urban size, the higher the E d in its urban or rural area. It showed that the larger the population size of the city, the greater the enhancement of its urban and rural construction land occupation of cultivated land to carry the population size. The E d in urban and rural areas of super megacities were 79.11 and 8.22, respectively, whereas the values of small cities were only 19.72 and 0.07, respectively. The E d in urban and rural areas of super megacities was about four times and 117 times the values of small cities, respectively, indicating that urban size had a higher effect on E d r u r a l than E d u r b a n . Furthermore, Shenzhen had the highest E d u r b a n of 124.48, followed by Haikou (118.50), Xi’an (102.84), Chengdu (102.06), and Neijiang (105.04). The E d u r b a n of four cities (Guoluo Tibetan Autonomous Prefecture, Haixi Mongolian Tibetan Autonomous Prefecture, Aksu Region, and Jinchang) was less than 0, indicating that the population carried on urban construction land in 2020 in these cities had instead declined compared to 1990. In terms of E d r u r a l , Shantou was the largest (28.84), followed by Shenzhen (27.83), Xiamen (26.29), Pingxiang (18.73), and Guiyang (18.20). There were 139 cities with E d r u r a l less than 0, accounting for nearly 40% of the total.
Spatially (Figure 3c,d), high values of E d in urban and rural areas were mainly found in the southeast coastal region and the Sichuan basin. Cities with E d u r b a n less than 0 were mainly distributed in the west. In contrast, cities with E d r u r a l less than 0 were distributed in the northwest as well as the northeast and central regions. Collectively, the inefficient occupation of cultivated land by rural construction land was widespread in China.

3.2.3. Relative Efficiency of Cultivated Land Occupied by Urban and Rural Construction Land

The E r of China was 12.13, indicating that urban construction land occupied cultivated land carried 12.13 times more people on average than that of rural construction land. The overall pattern for different city population sizes demonstrated that the smaller the city size, the larger the E r . The E r of super megacities was the smallest (7.30), and that of the remaining four city classes was close (in ascending order: megacities [11.04], big cities [12.00], small cities [12.75], and medium-sized cities [13.38]). Therefore, the increase in urban size can reduce the differences between the efficiency of the urban and rural construction land occupation of cultivated land. Furthermore, the E r was greater than 1 for all cities, indicating that the E a was higher in urban than that in rural areas in China. Baotou had the largest E r of 32.67, followed by Daqing (32.39), Qiqihar (32.09), Songyuan (31.16), and Hohhot (29.64).
The E r showed a spatial pattern with high values of E r mainly distributed in the northwestern part of China and the southwestern region (Figure 3e). The E r was generally lower in the central and southeastern regions, indicating that the differences of E in urban and rural areas between cities in these regions are relatively small.

4. Discussion

4.1. Extensive Occupation of Cultivated Land by Rural Construction Land in China

The E a in rural areas in all Chinese cities was approximately one-tenth of that in urban areas, reflecting the highly inefficient expansion of the rural construction land on cultivated land. However, such an inefficient occupation accounts for most areas where the cultivated land was occupied by construction land. Our results demonstrate that during 1990–2020, China’s rural construction land occupied more cultivated land than urban construction land. This deserves special attention and focus because owing to the rapid urbanization of the past 30 years, the urban population continued to rise rapidly and the rural population decreased dramatically [26,27]. The government and scholars have generally focused on the occupation of cultivated land by urban expansion [28,29,30] under the assumption that the expansion of urban construction land has occupied a large portion of cultivated land. In contrast, attention to the cultivated land occupation by the rural construction land expansion remains lacking.
The extensive occupation of cultivated land by rural construction land partly results from the disproportionate expansion of rural construction land, and rural low-rise buildings [9]. In recent years, China’s rural resident population has decreased by an average of 14.75 million people per year, with an increase in rural construction land of an average of 90,300 ha per year, with the phenomenon of separation of people and lands occurring in most areas [31]. Rural housing construction is an essential form of rural construction land expansion and occupation of cultivated land. Building or purchasing housing for their children before marriage, improving living conditions, and real estate investment drive the continuous expansion of rural construction land [32]. Additionally, the expansion of a large amount of rural land per capita is also influenced by the general behavior and ideology of building new but not tearing down othe ld and willingness to have more residential land [33]. However, most residents with new rural houses usually live in cities, leading to the inefficient occupation of cultivated land used for rural construction land. The poor management of rural construction land expansion and the imperfect land system have also contributed to this extensive behavior [34,35].
Notably, an E d r u r a l of nearly half of the cities less than 0 are found throughout China, indicating that rural exodus has occurred after the occupation of cultivated land for rural construction land in these regions. This kind of non-direct demand-oriented occupation of cultivated land prevents the productive and ecological functions of cultivated land, which has implications for food security and the ecological environment and should be taken under consideration by the government.

4.2. Spatial Pattern of the Efficiency of Construction Land Occupation of Cultivated Land

The North China Plain, Northeast China, and Northwest China are the hardest-hit areas in terms of cultivated land occupied by urban and rural construction land, and similar results are observed in the relevant literature [7,36,37]. The notable occupation of cultivated land for urban and rural construction land in the North China Plain and the eastern coastal region is mainly guided by the demand for economic development and the close distribution of cultivated land in these areas around urban and rural areas, which makes the expansion of cultivated land inevitable [36]. The expansion of construction land in Northeast and Northwest China may be affected by the strategies of China Western Development and Northeast China Revitalization [7].
Our results show that the high and low E values are mainly distributed on both sides of the “Aihui-Tengchong Line”, primarily due to the demographic differences between the east and west of China. The Sichuan basin and southeast coastal region are the main distribution areas of high E a and E d values, which can be explained by two situations: (1) Chongqing, Zhejiang, Beijing, and other places with high efficiencies belong to the type with a high proportion of cultivated land occupied by construction land and high population increase; (2) cities in Guangdong and Sichuan are primarily of the type where the proportion of cultivated land occupied by urban and rural construction land is relatively small although the population increase is high.
The western and northern regions of China exhibit a more inefficient occupation of cultivated land. However, the northeastern region of China and some cities in Xinjiang have a larger area of cultivated land occupied for urban and rural development and construction, which should be a priority area for developing intensive and economic land use. In addition, the efficiency of the urban and rural construction land occupation of cultivated land varies widely in northern China. Although the E a u r b a n of these cities is also not high, their E a in rural areas is often extremely low. Therefore, strictly controlling the occupation of cultivated land by construction land, especially rural construction land, in northeast and northwest China and appropriately loosening the occupation of cultivated land in urban areas in southeast cities would help guarantee the amount of cultivated land and improve the overall efficiency of the occupation of the cultivated land by construction land.

4.3. Impact of Urban Size on the Efficiency of Cultivated Land Occupied by Construction Land in China

Urban construction land expansion is considered the leading cause of the loss of cultivated land. However, although approximately 70% of urban construction land is situated on cultivated land, the amount of this occupied cultivated land is still less than 20% of the total cultivated land loss [8]. In a sense, promoting the development of large cities is more intensive. We revealed that the larger the city, the more efficiently it occupies cultivated land for construction in urban and rural areas. This suggests that although the expansion of large cities is encroaching on the cultivated land, the actual population carried by large cities is much higher than that of small and medium-sized cities for the same amount of cultivated land. The larger the city size, the higher the Ed, and the greater the expansion of the construction land in large cities to occupy cultivated land for population carrying capacity, which can effectively share the population carrying pressure within large cities.

5. Conclusions

This study quantitatively assessed the efficiency of cultivated land occupied by urban and rural construction land in China from 1990 to 2020 by proposing an absolute efficiency index of the cultivated land occupied by construction land, differential efficiency evaluation methods of the cultivated land occupied by construction land, and relative efficiency of the cultivated land occupied by urban and rural construction land, using a combination of population and land use data. The occupation area of cultivated land by rural construction land in China is higher than that by urban construction land. The occupation of cultivated land by urban and rural construction land was severe in the north China plain, the eastern coast, the northeast, and some cities in Xinjiang. In China, urban construction land occupies cultivated land much more efficiently than rural construction land, which is particularly prominent in northern areas of the country. In urban and rural areas, the efficient urban and rural construction land areas in China were concentrated on the southeast coast and some cities in the Sichuan basin. With the increase in urban size, the efficiency of cultivated land occupied by urban and rural construction land increases, and the relative gap between the efficiency of cultivated land occupied by urban and rural construction land is narrowing. This suggests that urban expansion saves cultivated land resources in terms of carrying population. Compared to urban construction land, rural construction land occupies cultivated land in a cruder manner. Therefore, urban development should be encouraged while strictly controlling the occupation of cultivated land by rural construction land to improve the efficiency of construction land occupation of cultivated land. The rural construction land stock should be optimally utilized, and control must be strengthened over the disorderly rural construction land expansion and crude behavior of occupying cultivated land.

Supplementary Materials

The following supporting information can be downloaded at: https://www.mdpi.com/article/10.3390/land11060941/s1, Figure S1: Population spatialization results in 1990 and 2020 (in 1-km spatial resolution); Figure S2: Accuracy assessment of the population spatialization in 2020.

Author Contributions

Conceptualization, X.L.; methodology, X.L.; software, X.L.; validation, X.L.; formal analysis, X.L.; writing—original draft preparation, X.L.; writing—review and editing, L.X.; visualization, X.L.; supervision, L.X.; funding acquisition, L.X. All authors have read and agreed to the published version of the manuscript.

Funding

This research was funded by the National Natural Science Foundation of China (grant number: 42171259), Second Tibetan Plateau Scientific Expedition and Research (grant number: 2019QZKK0603), and Strategic Priority Research Program of Chinese Academy of Sciences (grant number: XDA20040000, XDA20090000).

Data Availability Statement

The land use data of China presented in this study are openly available in the Resource and Environment Science and Data Center (http://www.resdc.cn, accessed on 15 May 2022).

Acknowledgments

The authors are also grateful to Xu Xiaofan for his help in obtaining census data and accuracy validation of population spatialization results.

Conflicts of Interest

The authors declare no conflict of interest.

References

  1. National Bureau of Statistics of China. China Statistical Yearbook 2021; China Statistics Press: Beijing, China, 2022.
  2. Yang, Y.; Feng, Z.; Zhao, Y.; You, Z. Coordination between urban land expansion and population growth in China. Geogr. Res. 2013, 32, 1668–1678. [Google Scholar]
  3. Xu, Y.; Zhao, S.; Fan, J. Urban planning construction land standard and its revision of climate and topography in China. Acta Geogr. Sin. 2020, 72, 194–208. [Google Scholar] [CrossRef]
  4. Zhou, L.; Dang, X.; Zhou, C.; Wang, B.; Wei, W. Evolution characteristics of slope spectrum and slope-climbing effects of built-up land in China. Acta Geogr. Sin. 2021, 76, 1747–1762. [Google Scholar]
  5. Azadi, H.; Ho, P.; Hasfiati, L. Agricultural land conversion drivers: A comparison between less developed, developing and developed countries. Land Degrad. Dev. 2011, 22, 596–604. [Google Scholar] [CrossRef]
  6. Theobald, D.M. Placing exurban land—Use change in a human modification framework. Front. Ecol. Environ. 2004, 2, 139–144. [Google Scholar] [CrossRef]
  7. Fan, Z.; Li, S. Spatio-temporal analysis of the economic benefit and driving mechanism of urban built-up land occupying the cultivated land in China since 1990. Acta Ecol. Sin. 2021, 41, 374–387. [Google Scholar]
  8. Liu, T.; Liu, H.; Qi, Y. Construction land expansion and cultivated land protection in urbanizing China: Insights from national land surveys, 1996–2006. Habitat Int. 2015, 46, 13–22. [Google Scholar] [CrossRef]
  9. Xi, F.; He, H.; Clarke, K.C.; Hu, Y.; Wu, X.; Liu, M.; Shi, T.; Geng, Y.; Gao, C. The potential impacts of sprawl on farmland in Northeast China—Evaluating a new strategy for rural development. Landsc. Urban Plan. 2012, 104, 34–46. [Google Scholar] [CrossRef]
  10. Long, H.; Heilig, G.K.; Li, X.; Zhang, M. Socio-economic development and land-use change: Analysis of rural housing land transition in the Transect of the Yangtse River, China. Land Use Policy 2007, 24, 141–153. [Google Scholar] [CrossRef]
  11. Liu, Y.; Luo, T.; Liu, Z.; Kong, X.; Li, J.; Tan, R. Comparative analysis of urban and rural construction land use change and driving forces: Implications for urban–rural coordination development in Wuhan, Central China. Habitat Int. 2015, 47, 113–125. [Google Scholar] [CrossRef]
  12. Qu, S.; Hu, S.; Li, Q. Stages and spatial patterns of urban built-up land transition in China. Acta Geogr. Sin. 2020, 75, 1539–1553. [Google Scholar]
  13. Liu, J.; Liu, Y.; Li, Y.; Hu, Y. Coupling Analysis of Rural Residential Land and Rural Population in China during 2007–2015. J. Nat. Resour. 2018, 33, 1861–1871. [Google Scholar]
  14. Knaap, G.; Talen, E. New urbanism and smart growth: A few words from the academy. Int. Reg. Sci. Rev. 2005, 28, 107–118. [Google Scholar] [CrossRef]
  15. Li, X.; Zhang, Q. AHP-based resources and environment efficiency evaluation index system construction about the west side of Taiwan Straits. Ann. Oper. Res. 2015, 228, 97–111. [Google Scholar] [CrossRef]
  16. Li, X.; Xu, X.; Chen, H. Temporal and spatial changes of urban efficiency in the 1990s. Acta Geogr. Sin. 2005, 60, 615–625. [Google Scholar]
  17. State Council of China. Circular on Adjusting the Criteria for the Classification of City Sizes; State Council [2014] No.51; State Council of China: Beijing, China, 2014.
  18. Wang, L.; Wang, S.; Zhou, Y.; Liu, W.; Hou, Y.; Zhu, J.; Wang, F. Mapping population density in China between 1990 and 2010 using remote sensing. Remote Sens. Environ. 2018, 210, 269–281. [Google Scholar] [CrossRef]
  19. Tan, M.; Li, X.; Li, S.; Xin, L.; Wang, X.; Li, Q.; Li, W.; Li, Y.; Xiang, W. Modeling population density based on nighttime light images and land use data in China. Appl. Geogr. 2018, 90, 239–247. [Google Scholar] [CrossRef]
  20. Sun, W.; Zhang, X.; Wang, N.; Cen, Y. Estimating population density using DMSP-OLS night-time imagery and land cover data. IEEE J. Sel. Top. Appl. Earth Obs. Remote Sens. 2017, 10, 2674–2684. [Google Scholar] [CrossRef]
  21. Holt, J.B.; Lo, C.; Hodler, T.W. Dasymetric estimation of population density and areal interpolation of census data. Cartogr. Geogr. Inf. Sci. 2004, 31, 103–121. [Google Scholar] [CrossRef]
  22. Bielecka, E. A dasymetric population density map of Poland. In Proceedings of the 22nd International Cartographic Conference, La Coruña, Spain, 9–16 July 2005. [Google Scholar]
  23. Fang, Y.; Jawitz, J.W. High-resolution reconstruction of the United States human population distribution, 1790 to 2010. Sci. Data 2018, 5, 180067. [Google Scholar] [CrossRef] [Green Version]
  24. Robinson, C.; Hohman, F.; Dilkina, B. A deep learning approach for population estimation from satellite imagery. In Proceedings of the 1st ACM SIGSPATIAL Workshop on Geospatial Humanities, Redondo Beach, CA, USA, 7–10 November 2017. [Google Scholar]
  25. Stevens, F.R.; Gaughan, A.E.; Linard, C.; Tatem, A.J. Disaggregating census data for population mapping using random forests with remotely-sensed and ancillary data. PLoS ONE 2015, 10, e0107042. [Google Scholar] [CrossRef] [Green Version]
  26. Lin, L.; Zhu, Y. Types and determinants of migrants’ settlement intention in China’s new phase of urbanization: A multi-dimensional perspective. Cities 2022, 124, 103622. [Google Scholar] [CrossRef]
  27. Zhang, R.; Jiang, G.; Zhang, Q. Does urbanization always lead to rural hollowing? Assessing the spatio-temporal variations in this relationship at the county level in China 2000–2015. J. Clean. Prod. 2019, 220, 9–22. [Google Scholar] [CrossRef]
  28. Guan, X.; Wei, H.; Lu, S.; Dai, Q.; Su, H. Assessment on the urbanization strategy in China: Achievements, challenges and reflections. Habitat Int. 2018, 71, 97–109. [Google Scholar] [CrossRef]
  29. Song, W. Decoupling cultivated land loss by construction occupation from economic growth in Beijing. Habitat Int. 2014, 43, 198–205. [Google Scholar] [CrossRef]
  30. Yin, J.; Yin, Z.; Zhong, H.; Xu, S.; Hu, X.; Wang, J.; Wu, J. Monitoring urban expansion and land use/land cover changes of Shanghai metropolitan area during the transitional economy (1979–2009) in China. Environ. Monit. Assess. 2011, 177, 609–621. [Google Scholar] [CrossRef]
  31. Zhang, X.; Wang, J.; Song, W.; Wang, F.; Gao, X.; Liu, L.; Dong, K.; Yang, D. Decoupling analysis between rural population change and rural construction land changes in China. Land 2022, 11, 231. [Google Scholar] [CrossRef]
  32. Yu, Z.; Wu, C.; Tan, Y.; Zhang, X. The dilemma of land expansion and governance in rural China: A comparative study based on three townships in Zhejiang Province. Land Use Policy 2018, 71, 602–611. [Google Scholar] [CrossRef]
  33. Liu, Y.; Liu, Y. Progress and prospect on the study of rural hollowing in China. Geogr. Res. 2010, 29, 35–42. [Google Scholar]
  34. Zeng, Y.; Liao, H.; Sun, Z. Spatial-Temporal Variation of Urban-Rural Construction Land and the Mechanism of Its Formation—A Case Study of Nan’an District of Chongqing. J. Southwest Univ. (Nat. Sci. Ed.) 2019, 41, 100–108. [Google Scholar]
  35. Zhong, T.; Mitchell, B.; Huang, X. Success or failure: Evaluating the implementation of China’s national general land use plan (1997–2010). Habitat Int. 2014, 44, 93–101. [Google Scholar] [CrossRef]
  36. Liu, T.; Shi, Q.; Wang, Y.; Yang, Y. Urban-rural development and occupation of cultivated land in China: Trends, geography, and drivers. Geogr. Res. 2018, 37, 1609–1623. [Google Scholar]
  37. Miao, Y.; Liu, J.; Wang, R.Y. Occupation of Cultivated Land for Urban–Rural Expansion in China: Evidence from National Land Survey 1996–2006. Land 2021, 10, 1378. [Google Scholar] [CrossRef]
Figure 1. Land use data of China in 1990 and 2018.
Land 11 00941 g001
Figure 2. Cultivated land area occupied by urban (a) and rural (b) construction land and the population it carries in China from 1990 to 2020.
Land 11 00941 g002
Figure 3. E a , E d , and E r in urban and rural areas of China. ((a)- E a in urban areas; (b)- E a in rural areas; (c)- E d in urban areas; (d)- E d in rural areas; (e)- E r ; (f)- E a , E d , and E r in urban and rural areas of cities for different sizes).
Land 11 00941 g003
Publisher’s Note: MDPI stays neutral with regard to jurisdictional claims in published maps and institutional affiliations.

