Article

Spatiotemporal Variation in Land Use Land Cover in the Response to Local Climate Change Using Multispectral Remote Sensing Data

1
Department of Environmental Sciences, COMSATS University Islamabad, Vehari Campus, Islamabad 61100, Pakistan
2
Key Laboratory of Digital Earth Science, Aerospace Information Research Institute, Chinese Academy of Sciences, Beijing 100094, China
3
Department of Agronomy, University College of Agriculture and Environmental Sciences, The Islamia University of Bahawalpur (IUB), Bahawalpur 63100, Pakistan
4
Department of Applied Geology, School of Applied Natural Science, Adama Science & Technology University, Adama P.O. Box 1888, Ethiopia
5
Department of Agronomy, The University of Haripur, Haripur 22620, Pakistan
6
State Key Laboratory of Information Engineering in Surveying, Mapping and Remote Sensing, Wuhan University, Wuhan 430079, China
7
Mining and Petroleum Engineering Department, Faculty of Engineering, Al-Azhar University, Cairo 11884, Egypt
8
State Key Laboratory of Remote Sensing Sciences, Aerospace Information Research Institute, Chinese Academy of Sciences, Beijing 100101, China
9
University of Chinese Academy of Sciences (UCAS), Beijing 101408, China
10
School of Computing Engineering and Physical Sciences, University of West of Scotland, Paisley G72 0LH, UK
*
Author to whom correspondence should be addressed.
These authors contributed equally to this work.
Land 2022, 11(5), 595; https://doi.org/10.3390/land11050595
Submission received: 25 March 2022 / Revised: 15 April 2022 / Accepted: 17 April 2022 / Published: 19 April 2022
(This article belongs to the Topic Climate Change and Environmental Sustainability)

Abstract

:
Climate change is likely to have serious social, economic, and environmental impacts on farmers whose subsistence depends on nature. Land Use Land Cover (LULC) changes were examined as a significant tool for assessing changes at diverse temporal and spatial scales. Normalized Difference Vegetation Index (NDVI) has the potential ability to signify the vegetation structures of various eco-regions and provide valuable information as a remote sensing tool in studying vegetation phenology cycles. In this study, we used remote sensing and Geographical Information System (GIS) techniques with Maximum Likelihood Classification (MLC) to identify the LULC changes for 40 years in the Sahiwal District. Later, we conducted 120 questionnaires administered to local farmers which were used to correlate climate changes with NDVI. The LULC maps were prepared using MLC and training sites for the years 1981, 2001, and 2021. Regression analysis (R2) was performed to identify the relationship between temperature and vegetation cover (NDVI) in the study area. Results indicate that the build-up area was increased from 7203.76 ha (2.25%) to 31,081.3 ha (9.70%), while the vegetation area decreased by 14,427.1 ha (4.5%) from 1981 to 2021 in Sahiwal District. The mean NDVI values showed that overall NDVI values decreased from 0.24 to 0.20 from 1981 to 2021. Almost 78% of farmers stated that the climate has been changing during the last few years, 72% of farmers stated that climate change had affected agriculture, and 53% of farmers thought that rainfall intensity had also decreased. The R2 tendency showed that temperature and NDVI were negatively connected to each other. This study will integrate and apply the best and most suitable methods, tools, and approaches for equitable local adaptation and governance of agricultural systems in changing climate conditions. Therefore, this research outcome will also meaningfully help policymakers and urban planners for sustainable LULC management and strategies at the local level.

1. Introduction

Climate change, with changing temperature and precipitation levels, has mostly affected Land Use Land Cover (LULC) throughout the whole world [1,2,3]. The LULC changes are useful for visualizing and analyzing the effect of various development pathways and helping decision-makers formulate scientific strategies [4,5] and implement plausible policies that conserve natural resources and provide ecosystem services [6,7,8]. The LULC impacts sustainable ecosystem services, which are becoming increasingly significant problems in the world [9,10]. The LULC direct relationship with the Earth’s primary features and procedures, for example, land degradation and productivity, water cycle, and ecological environments, are the foremost concern [11]. The LULC changes were examined as a significant tool for assessing changes in the world at various temporal and spatial scales [5]. It is an extensive, quick, and symbolic process directed by anthropogenic activities, and in several cases, humans are affected by these changes [12]. The anthropogenic activity also seems to conduct extreme changes in the existing state of the Earth’s surface [13]. The LULC changes increased the interaction of resources, governmental doubts, and societies to global warming and socioeconomic disasters via decreasing ecology facilities [14,15,16].
With the Normalized Difference Vegetation Index (NDVI), the possibility of understanding the crop phenology escalates as it explains the crop chronology and its relationship with weather and climate [17,18]. The NDVI was measured using a mathematical calculation of spectral bands within the satellite image, which measures the healthiness of vegetation, as it has a robust correlation with green biomass, indicating healthy vegetation or crop [14,19]. The NDVI relates spectral information of the red color and near-infrared, generating a variable to estimate vegetation’s quantity, quality, and development [20]. The NDVI is highly used in environmental and vegetation studies; now, high-resolution satellites are available to derive the NDVI at regional [21] and global scales such as Landsat series, Sentinel series, and multiple on-board sensors [22,23]. The climate is an important factor that negatively influences vegetation dynamics recently, and many research publications have described the relationship between Land Surface Temperature (LST) and NDVI [17,18,24].
Remote Sensing and GIS combined location data with both quantitative and qualitative information about the location, allowing you to visualize, analyze, and report information through maps and charts [12,13,25,26]. Using this technology, we can answer questions, conduct what-if scenarios, and visualize results. The remote sensing and GIS were identified as systems used to manage infrastructure assets, natural resources, and any objects as per requirement [25,27,28,29]. Remote sensing has been used to categorize and map LULC changes with various data sets and techniques [30]. Landsat images have assisted a huge arrangement in image classification of various land elements at a higher scale [31,32,33]. Landsat images by the use of sensors including a Thematic Mapper (TM), Enhanced TM Plus (ETM+), and Operational Land Imager (OLI) were used to assess the LULC changes as well as NDVI [34,35,36]. Remote sensing has become essential for changes in vegetation monitoring, as it delivers efficient satellite information about vegetation cover and LST changes [37]. Between the various remote sensing sensors, Landsat offers related resources for calculating vegetation degradation (e.g., modifications and conversions of natural vegetation). It is easier to analyze and manage facility and asset data stored in GIS, making design, construction, and maintenance more efficient and profitable [32].
Climate change is also the main challenge for rural livelihoods, agriculture, and food security for millions of people in Pakistan [38,39,40]. Disappointingly, the deterioration of ecosystems due to climate change in Punjab is deliberated as a serious problem and has a significant negative impact on the economy [33,41]. In Sahiwal District, agriculture is very significant to the local economy. However, during the last few years, main crops have decreased due to urbanization in Punjab, including Sahiwal District. Intense agricultural activities are engaging industries that increase migrations of people towards the Sahiwal District. The increasing population is now putting drastic effects on agriculture as build-up area is increasing for meeting the necessities of human livelihood [
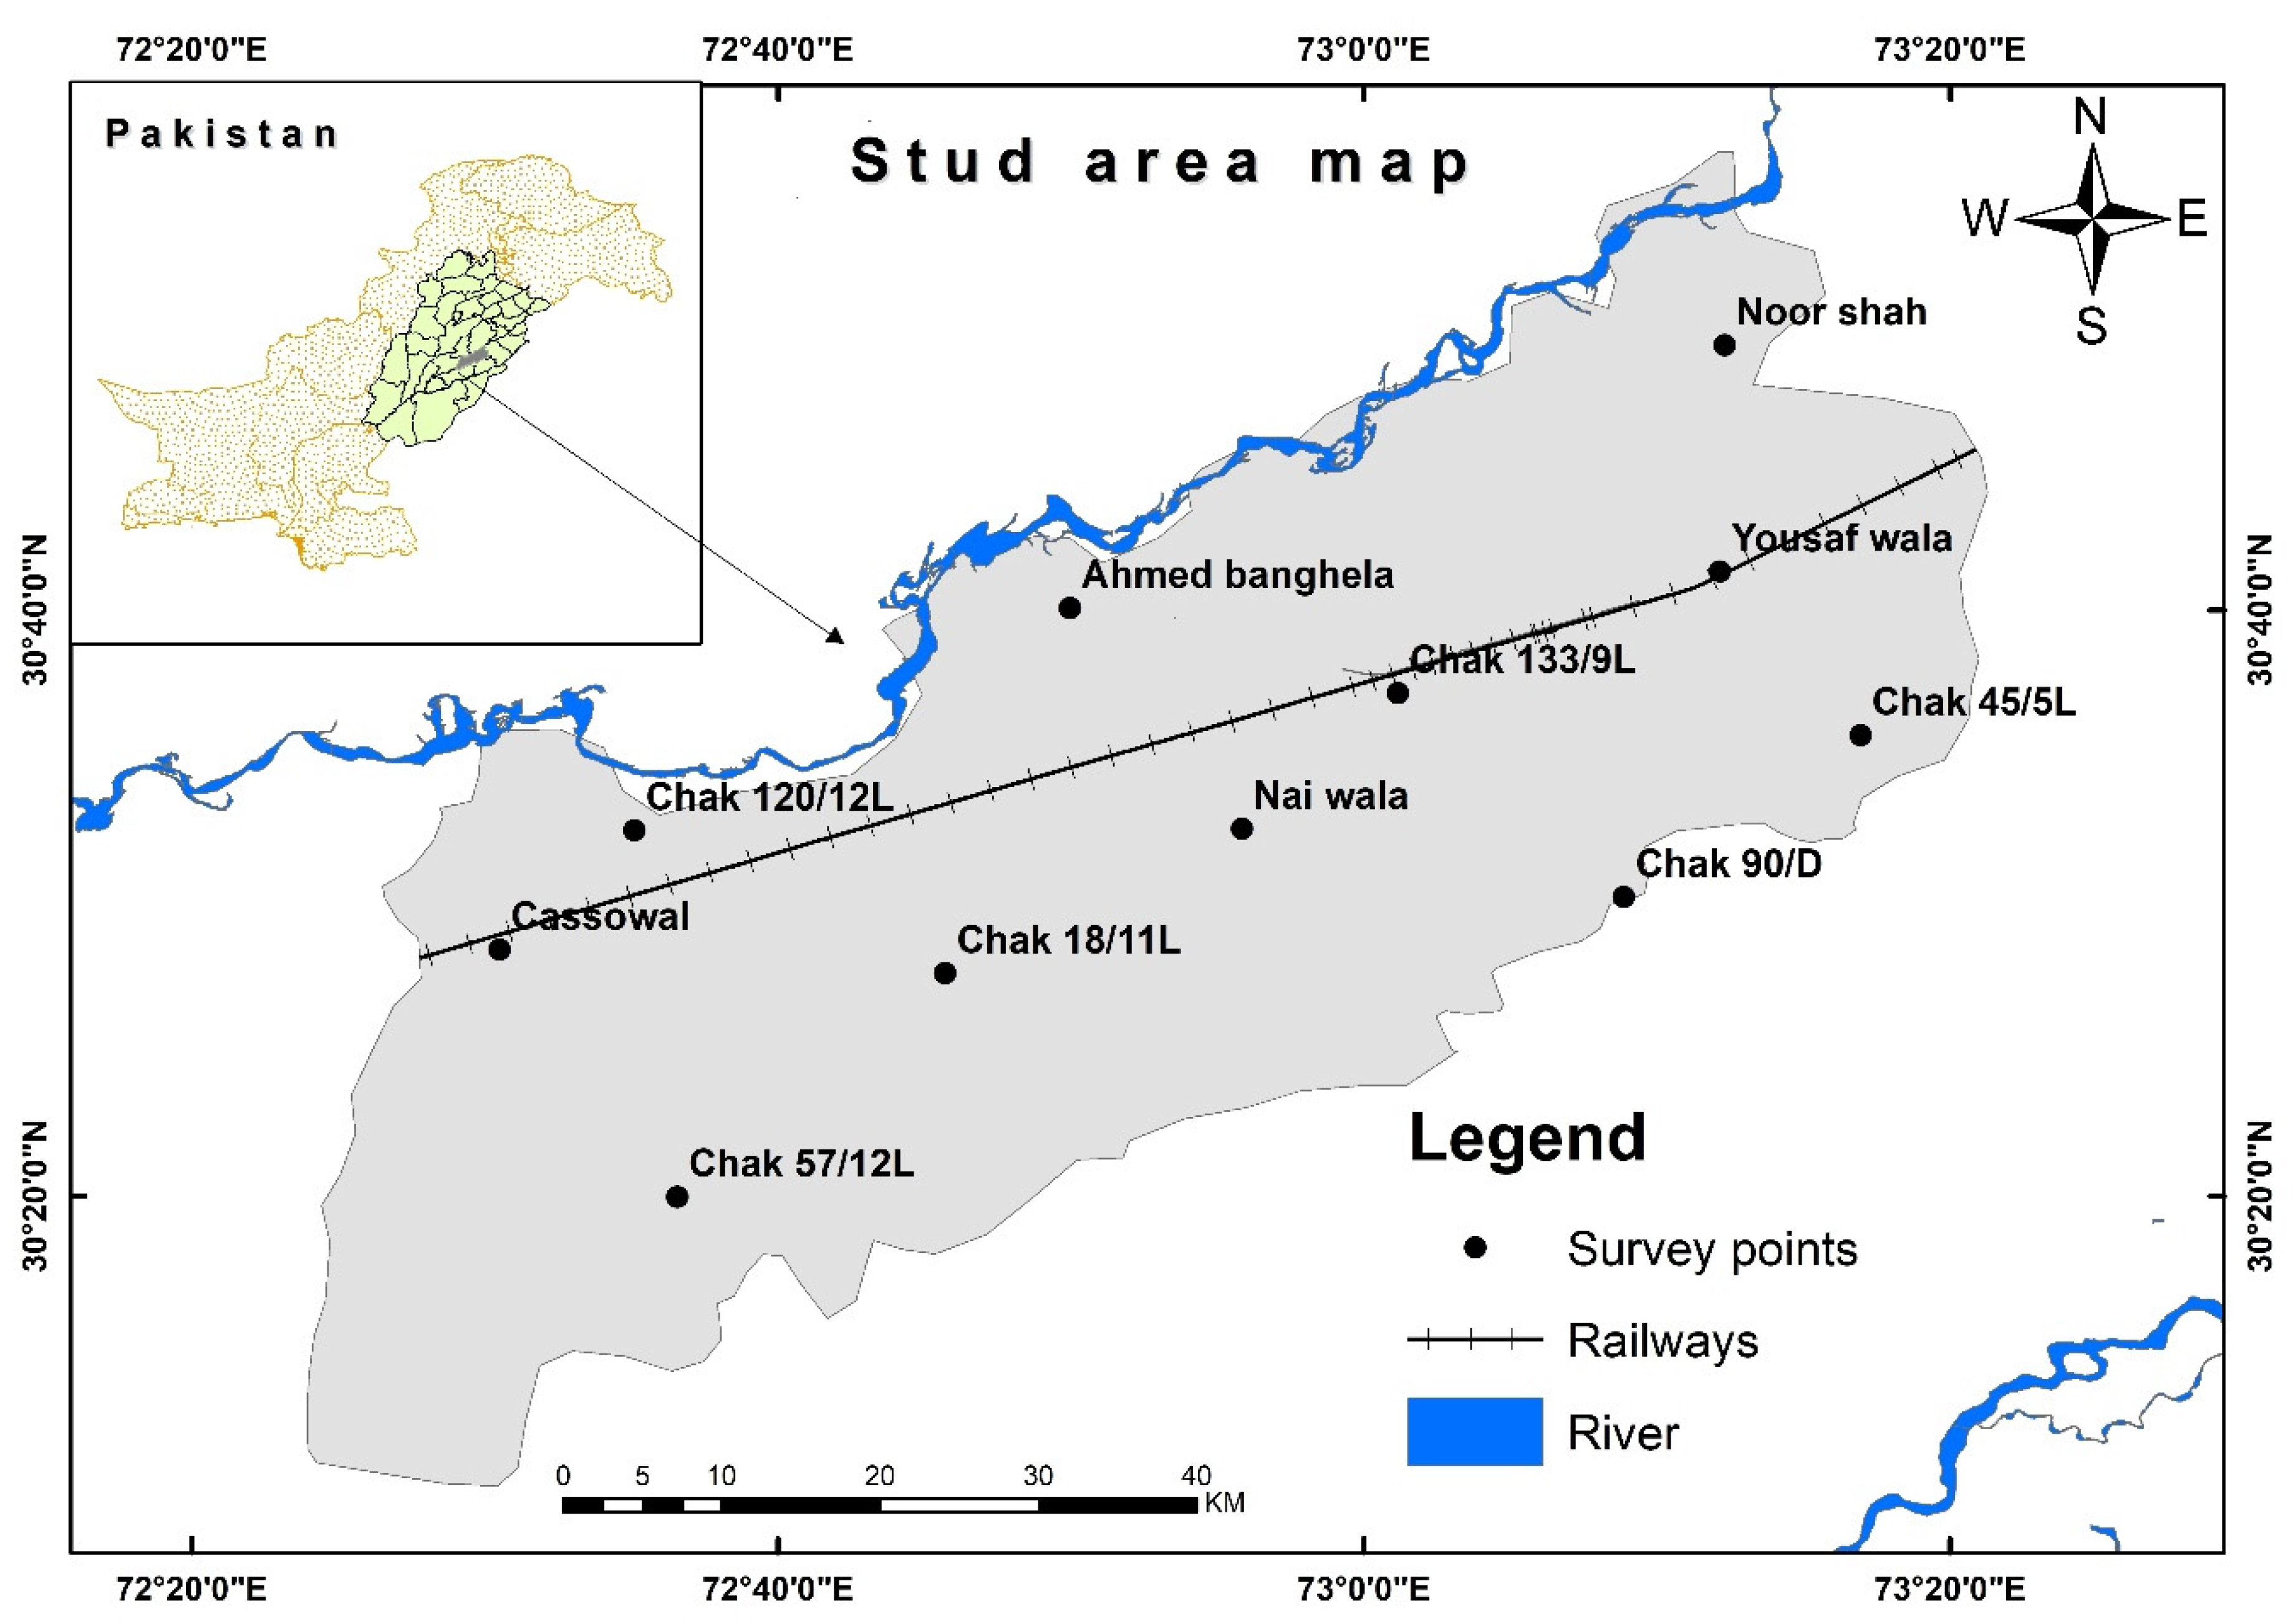
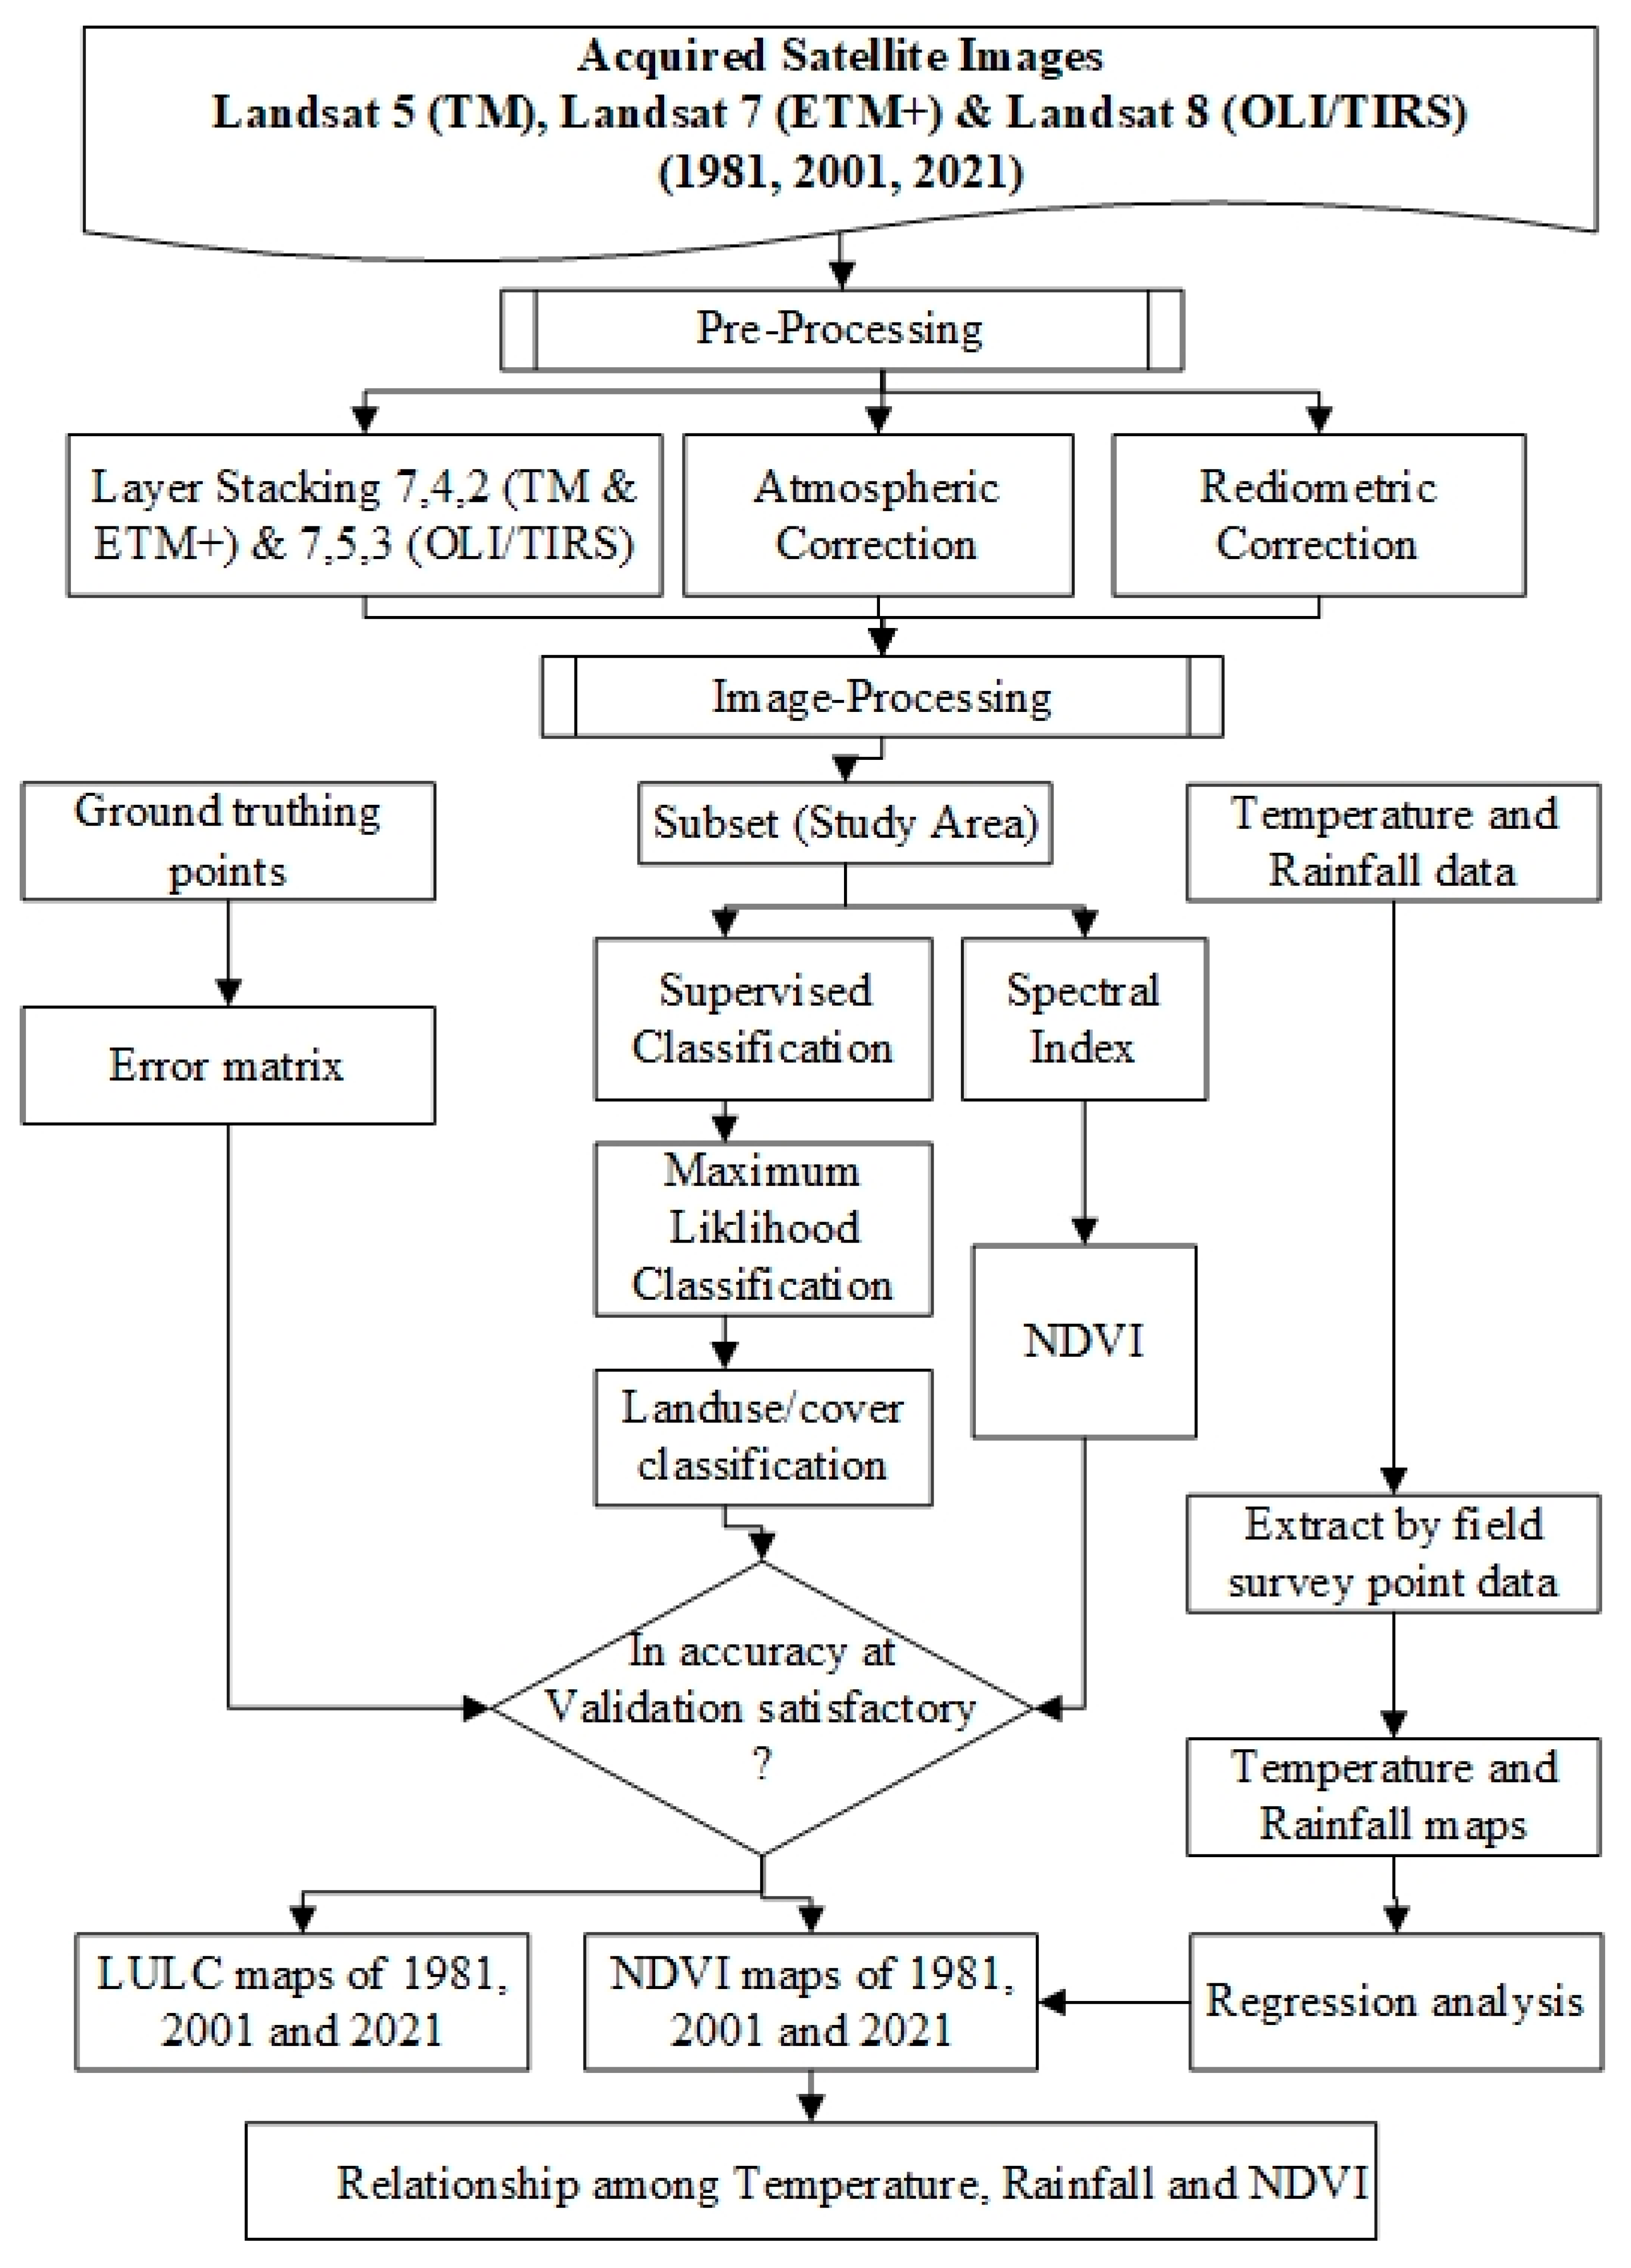
42]. Sahiwal District is the 21st largest city of Pakistan by population and has faced environmental and climate change during the last few years. Therefore, it is necessary to study the impact of climate change on agriculture and various land cover in the Sahiwal District. This research mainly examined spatial pattern analysis of LULC changes, which refers to the process of increasing focus on population and some drastic effects of climate variability on the socioeconomic conditions of rural and local community in the Sahiwal District. So, the important objectives of this research were:
(1)
To study the farmers’ perception of climate change and LULC in the study area.
(2)
To analyze the LULC and NDVI changes in Sahiwal District, Punjab, Pakistan, using remote sensing techniques.
(3)
To analyze the relationship between NDVI and climate change (temperature and rainfall) in Sahiwal District.

2. Material and Method

2.1. Study Area

The study area was conducted in the Sahiwal District of Punjab, Pakistan, showed in Figure 1. It lies approximately between 30.0442° to 30.6682° N and 72.3441° to 73.1114° E [43,44]. The Sahiwal District comprises two subdistricts, namely Chichawatni and Sahiwal City. The Sahiwal District is also famous for its breed and cattle of buffaloes. This area is irrigated by the water from the rivers Ravi and Sutlej. The major crops of this area are wheat, rice, cotton, sugarcane, and fodder. Geologically, it is composed of fertile land with semiarid conditions where May, June, and July are the hottest months, with average temperatures ranging from 38 °C to 48 °C with occasional extreme temperatures of 55 °C. The coldest months are December and January, with an average lowest temperature ranging from 5 °C to 22 °C. It has intense agriculture and some natural forest reserves with (150 to 300 mm) of annual rainfall [43,45].

2.2. Field Survey

The survey was conducted in 120 locations within the whole study area. Moreover, a questionnaire was designed to collect information from the study area using a survey method. A questionnaire-based field survey technique was adopted, along with discussions with farmers and the collection of local information. The Global Positioning System (GPS) co-ordinates show the positioning of each village, and data related to LULC and climate change were recorded [46,47]. The GPS map camera software was used to collect and save the latitude and longitude points as well as other information from the survey. To select the survey locations, stratified random sampling was used during the survey. A total of 120 educated and experienced farmers were interviewed, which included 60 farmers from each of the sub-districts of Sahiwal. The main parameters that were addressed in the questionnaire were the adoption and application of LULC technologies at their farms. The information related to the change in vegetation cover area was recorded with the help of a preplanned questionnaire introduced to farmers’ discussion during a face-to-face meeting with them. Microsoft Excel was used to analyze the survey data and make more graphs [48].

2.3. Landsat Data

Landsat-based images of 30 m × 30 m spatial resolution covering the study area were collected for the years 1981, 2001, and 2021 and downloaded from the United States Geological Survey (USGS) website (https://earthexplorer.usgs.gov/ (Last accessed on 15 February 2022) with mixed vegetation, build-up area, an agricultural area, water area, and bare surface as mapped LULC types [20,49]. For this study, images of Landsat 5, Landsat 7 (TM), and Landsat 8 (OLI) were used (Table 1).

2.4. Temperature and Rainfall Data

The previous data of minimum and maximum temperature and rainfall of 40 survey points of Sahiwal District was attained from the website of National Aeronautics and Space Administration (NASA) (http://power.larc.nasa.gov) (Last accessed on 21 December 2021). Maximum and minimum temperature and precipitation data of 40 years (1981 to 2021) for all survey points were taken in the study area. The 40-year data sequence for all the survey points was analyzed by running a test at a 95% significance level to check the homogeneity of the data [44,50].

2.5. Land Use Land Cover (LULC) and Accuracy Assessment

Landsat 5 and 7 images contain eight spectral bands. In this study, bands one to five and seven were used to assess the LULC. Band six is a thermal band used for LST change analysis [51,52]. In Landsat 8, we used band two to band nine for LULC and LST changes [53]. Satellite images were imported using ArcGIS software (version 10.8) for processing and analysis from various years. First, image analysis and processing, image clipping and composite, and atmospheric correction and rectification of the image were carried out with ERDAS imagine software. Second, Landsat images were preprocessed in ERDAS imagine 2015 for layer stacking (stacking is the method used to produce a multiband image from discrete bands.), mosaicking (to combine the two stacked images), and subsetting (after stacking, the study area was extracted) of the image based on Area of Interest (AOI) [51,54]. All satellite data were studied by assigning per-pixel signatures [32]. The LULC maps were prepared using the supervised classification Maximum Likelihood Classification (MLC) and training site selections for the years 1981, 2001, and 2021. Training sites were determined, and spectral signature files of selected LULC classes such as vegetation, build-up area, bare soil, and bodies of waterbodies of water (Table 2) were created for uses in the classifications using ERDAS imagine software. The classified images were compared with ground truthing (field visit) of the study area. For each of the predetermined LULC types, training samples were selected by delimiting polygons around representative sites [54,55]. Spectral signatures for the respective land cover types derived from the satellite imagery were recorded by using the pixels enclosed by these polygons [8,9,33].
For accuracy assessment, ERDAS imagine software was used to compare the pixels of the supervised image with reference pixels for the given classes. Accuracy assessment was completed using satellite imageries with a Stratified Randomization Technique (SRT) to show several LULC classes in the study area [56,57]. It was performed by using 120 points for each class, constructed from visual interpretation and data based on ground-truthing. Error matrices accomplished statistical evaluations of classification results and reference data. Error matrix is the general and common tool to present accuracy assessment. Finally, the usual statistical accuracy comparison was made with general accuracy [57].

2.6. Estimation of NDVI

The NDVI data were used to assist in identifying various vegetation stages’ dates during seasons. Software ERDAS Imagine 2015 was applied to identify NDVI and their change analyses based on vegetation. Software Arc GIS 10.8 was used for preparing NDVI maps [18].
NDVI = N I R R E D N I R + R E D
RED is the reflectance in the red band of the spectrum and NIR is the reflectance in the near-infrared band in a spectrum [58,59]. Detailed description of methodology is presented in Figure 2.

3. Results

3.1. Perceptions of Farmers about Climate Change and LULC

A questionnaire was designed to find out the awareness level of farmers about climate change, the farmers’ responses regarding the effect of climate change on agricultural practices, and which mitigation strategies are followed by farmers [6,60]. For this purpose, the questionnaire was divided into a number of sections, and the results of each section are described one by one in the study area. According to farmer response regarding climate change variables, the majority of respondents’ report that the climate is changing and that it also influences agriculture. According to Table 3, most respondents, 78%, considered the climate is changing, 72% farmers observed climate change effecting the agricultural practices, and 53% of farmers thought that rainfall intensity had also decreased (Figure 3). Approximate 48% of respondents reported that the cutting of the trees is the main reason behind the increase in temperature and climate change. Additionally, 69% of farmers predicted that in the future, climate change will be a great risk for the agricultural sector in Sahiwal District.
The vast majority of farmers, 64%, stated that crop production is decreasing due to an increase in temperature. About 78% of respondents reported that the demand for irrigation increased due to climate change (Table 4). Regarding the irrigation method, most farmers used tube-well and canal-system irrigation (78%), with the remaining few farmers depending on rainfall for irrigation in Sahiwal District. More than half of the interviewees stated that they changed the crop sowing dates due to climatic variations, and 52% of respondents stated that the demand for fertilizer increased. Most of the farmers (54%), perceive that water availability for irrigation decreased with the passage of time due to climate change (Figure 3). About 62% of respondents mentioned that climatic variations, especially variations in rainfall and temperature, are the major reason behind the increase in insect and pest attack. Food prices have increased overall the world, and 86% of respondents agree food prices increased due to climate change. Figure 4 shows that more than half of farmers (50–60%) used the canal water for irrigation, and about 20–30% of farmers are dependent on the tub-well water in the study area.

3.2. LULC Changes

The analysis of LULC classification of the Sahiwal District was performed in 1981, 2001, and 2021, and the area was enclosed with different land features (vegetation area, build-up area, water bodies, and bare soil). The LULC classification was engaged along with a reconnaissance survey and GIS in addition to additional data for the study area of Sahiwal District. The ‘‘build-up area’’ was increased 7203.76 ha (2.25%) to 16,653.81 ha (5.20%) from 1981 to 2001 respectively. Moreover, in 2021, the build-up area was increased 31,081.3 ha (9.70%) in the study area (Table 5). However, there was a large increase in the “build-up area” from 1981 to 2021, raising by 23,877.54 ha (7.45%). In 1981, the overall population of Sahiwal was 1.28 million, which has increased to 2.51 million in 2017, which is showing the increase of more than 1.23 million residents in the Sahiwal District, which has caused the expansion of the urban areas (Table 6).
Vegetation area covered 91.57%, 90.58%, and 87.07% of total land area during the years 1981, 2001, and 2021, respectively, in Sahiwal District. Although ‘vegetation area’ had decreased between 1981 to 2021, there appears to be a negative change in “vegetation” (a decrease of 4.50%) in the study area. The next class of water bodies has consisted of 4118.12 ha 1.29% in 1981, but water bodies decreased by 2643.01 ha (0.83%) between 1981 to 2021 (Figure 5). It was observed that during 40 years, vegetation area and bare soil have changed to roads and build-up areas. In 1981, a 15,676.85 ha (4.893%) area was covered by bare soil, which was reduced to 7701.5 ha (2.40%) in 2021. It has been found that ‘bare soil’ decreased during the last few years. Sahiwal District is growing day by day not only for vegetation growth but also for a large number of people from the rural areas and further small urban areas.

3.3. Accuracy Assessment

Detail of producers’ accuracy and users’ accuracy as well as KHAT (k) values for different LULC classes for the years 1981, 2001, and 2021, are shown in Table 7. Average producers and users accuracies were 86.15% and 85.45% for 1981, 88.12%, and 87.37% for 2001, and 86.32% and 86.07% for 2021, respectively. The highest and lowest producers’ and users’ accuracy values observed for the ‘build-up area’ were in the range of 85.3% to 84.4% and 90.8% to 83.7%, respectively. Similarly, the highest and lowest producers’ accuracy as well as users’ accuracy values observed for ‘vegetation area’ were 87.1% to 83.3% and 91.3% to 84.3% for the study duration. Overall classification accuracy for the studied years was also reasonable (85.45% to 87.0%) (Table 7). Overall accuracy was observed at 85.45%, 86.5%, and 87% for the years 1981, 2001, and 2021, respectively, in the study area. Similarly, K values were observed at 80.7%, 82%, and 85.3% for the years 1981, 2001, and 2021, respectively, in Sahiwal District. In our results, the two accuracies were in a fairly good range, which showed less error in classification.

3.4. Normalized Difference Vegetation Index

The analysis of vegetation parameters such as NDVI using satellite images is based on the spectral properties of vegetation [61,62]. Vegetation absorbs visible light, uses energy for photosynthesis, and strongly reflects NIR. Different Landsat bands were calculated to estimate the amount of vegetation in LULC based on the vegetative index. ERDAS Imagine 2015 is used to identify vegetation cover (NDVI) in the study area for the years 1981, 2001, and 2021. Arc GIS 10.8 was used for mapping identification of NDVI values as well as the area of LULC classes. On average, from 1981 to 2021, the NDVI max values decreased from 0.77 to 0.57, and NDVI min values also decreased from −0.28 to −0.17, and the mean values show that overall NDVI values from 1981 to 2021 decreased from 0.24 to 0.20 (Figure 6). The overall study area has faced a decrease in vegetation cover (NDVI) in the study area. In 1981, the maximum NDVI value was 0.77, which shows that vegetation cover (crops, grassland, shrubs, and forests) was maximum and that this area has forests, and the minimum NDVI value is −0.28, which shows that Sahiwal District has a sufficient amount of water bodies. In 2001, the maximum NDVI value was 0.69, which shows that vegetation cover is maximum, and the least NDVI value is −0.23, which shows enough water bodies and bare soil (Table 8).
In 2021, the maximum NDVI value was 0.57, which is the same as the previous year and has a sufficient amount of vegetation cover, and the minimum NDVI value was −0.17, which shows the bare soil in this area, as vegetation is much less in this year, and it receives less rainfall, which means it has less water. In 2021, NDVI values decreased more than in last 40 years, and now its value is 0.05, which demonstrates a large decrease from 1981 to 2021 in the study area. Overall, the average NDVI value of the study area showed that it has heavy vegetation cover and enough bodies of water with a much lower amount of bare soil and water bodies. Higher NDVI values showed the productive and most productive areas, such as vegetation and forest, in the study area. Similarly, lower values of NDVI showed that there are less and least productive areas, such as build-up areas, water, and bare soil. So, the model indicated a major decrease in production areas in the study area. Overall, the NDVI value is higher in croplands than in bare soil, and therefore, the enlarged cropland and forest reserves may have contributed to the satellite-observed greenness of vegetation in the study area. It was noted that there was a large NDVI-value change in 2021 compared to 1981.

3.5. Climate Factor of the Study Area

The temperature and rainfall data were collected from National Aeronautics and Space Administration (NASA) and corelate with field survey according to coordinates field surveys and transferred in the software Arc GIS 10.8. Next, an IDW tool was used for interpolation of the spatial map of rainfall and temperature. Figure 7 represents the average temperature maps of the Sahiwal District. The low temperature was noted at 27 °C, as was the high-temperature rise to 27.89 °C (Figure 7). It is clearly understood that three survey points such as Yousaf Wala, Chak 133/9 L, and Nai Wala were calculated as minimum temperatures in Sahiwal District. Similarly, Chak 45/% L, Chak 18/11 L, and Chak 120/12 L were noted as maximum temperatures in the study area. The average temperature was noted as 27.38 °C to 27.51 °C at Ahmed Banghela during 1981 to 2021 in Sahiwal District. We observed that average temperature values increased from 27.6 to 28.5 °C during the last few years due to an increasing build-up area. Our study observed that maximum temperature was observed in the build-up-area, and minimum temperature was noted in vegetation areas and water bodies (Figure 7a). The rainfall trend showed the average minimum and maximum rainfall in Sahiwal District from 1981 to 2021 (Figure 7b). The minimum rainfall value was observed at 39.57 mm, and the maximum rainfall rises to 87.32 mm. It is clearly observed that Chak 45/5 L, Chak 133/9 L, and Noor Shah noted minimum rainfall in the study area. Similarly, Yousaf Wala and Chak 18/11 L were calculated to have maximum rainfall in Sahiwal District. Average rainfall was observed from 59.04 mm to 65.22 mm at Chak 57/12 L from 1981 to 2021 in the study area.

3.6. Relationship between NDVI and Climate Factors

In the past, worldwide change in the atmosphere has affected vegetation cover [8]. Between different climatic components, rainfall and temperature were increasingly connected with LULC. To identify the relationship between temperature and vegetation cover (NDVI) in the study area, regression analysis (R2) was performed. The regression R2 tendency showed that temperature and NDVI were negatively connected. In the present study, regression coefficients (R2) 0.21, 0.06 and 0.05 were noted in 1981, 2001, and 2021, respectively, while rainfall showed postive corelation with NDVI 0.84, 0.80 and 0.77 from 1981 to 2021 (Figure 8). Regression analysis showed that NDVI must decrease in the study area in such areas where temperature increases. The analysis showed that the temperature in the built-up area was higher than the temperature covered by vegetation and other land than the temperature covered by vegetation and other land features. Assessment and evaluation of the urban environment require information and knowledge about surface temperature. Increased comfort adversely affects the rapid increase in surface temperature in the study area. Our outcome also suggested that the cumulative temperature in the growing season had a dominant effect on the vegetation dynamics. These changes resulted in an increase in the LULC changes and temperature values.

4. Discussion

This study explored the influence of climate change on the natural resources of the Sahiwal District during the period of 1981 to 2021. We used multitemporal remote sensing data to classify the LULC classes which are most vulnerable to environmental changes in the study area. This method plays an important role in better understanding the dynamics of LULC and environmental changes. According to Fazal et al. [63], urban areas have increased in previous years; however, the increase in a population was a bit less. This pattern suggests that fast expansion in an urban area in future years is projected, which would finally cause a loss in vegetation cover in Sahiwal District [64]. There is no doubt that the fast population growth in the study area had a maximum effect on LULC. The decrease in some of LULC underlines the unsafe trend that the pressure that financial globalization will have on LULC, signified by changing functionality of the study area and her importance in the biosphere. For the current administration and control of LULC, it is essential for federal and state governments to work together to train and strengthen proposers as well as associated professionals with the latest methods of remote sensing.
The finding by Mumtaz et al. [29] identified that there was a net increase in NDVI values in the Lahore City. One of the most successful methods is tracking the historical change of a vegetation index such as NDVI [4]. The development of NDVI reveals a robust relationship with the typical growth stages in natural vegetation. Jensen et al. [65] said that most respondents (85%) observed that climate change, characterized by changeability in precipitation patterns and increasing temperatures, has been happening during the last 30 years. As a response, respondents have changed farming practices, such as methods and timing of planting [
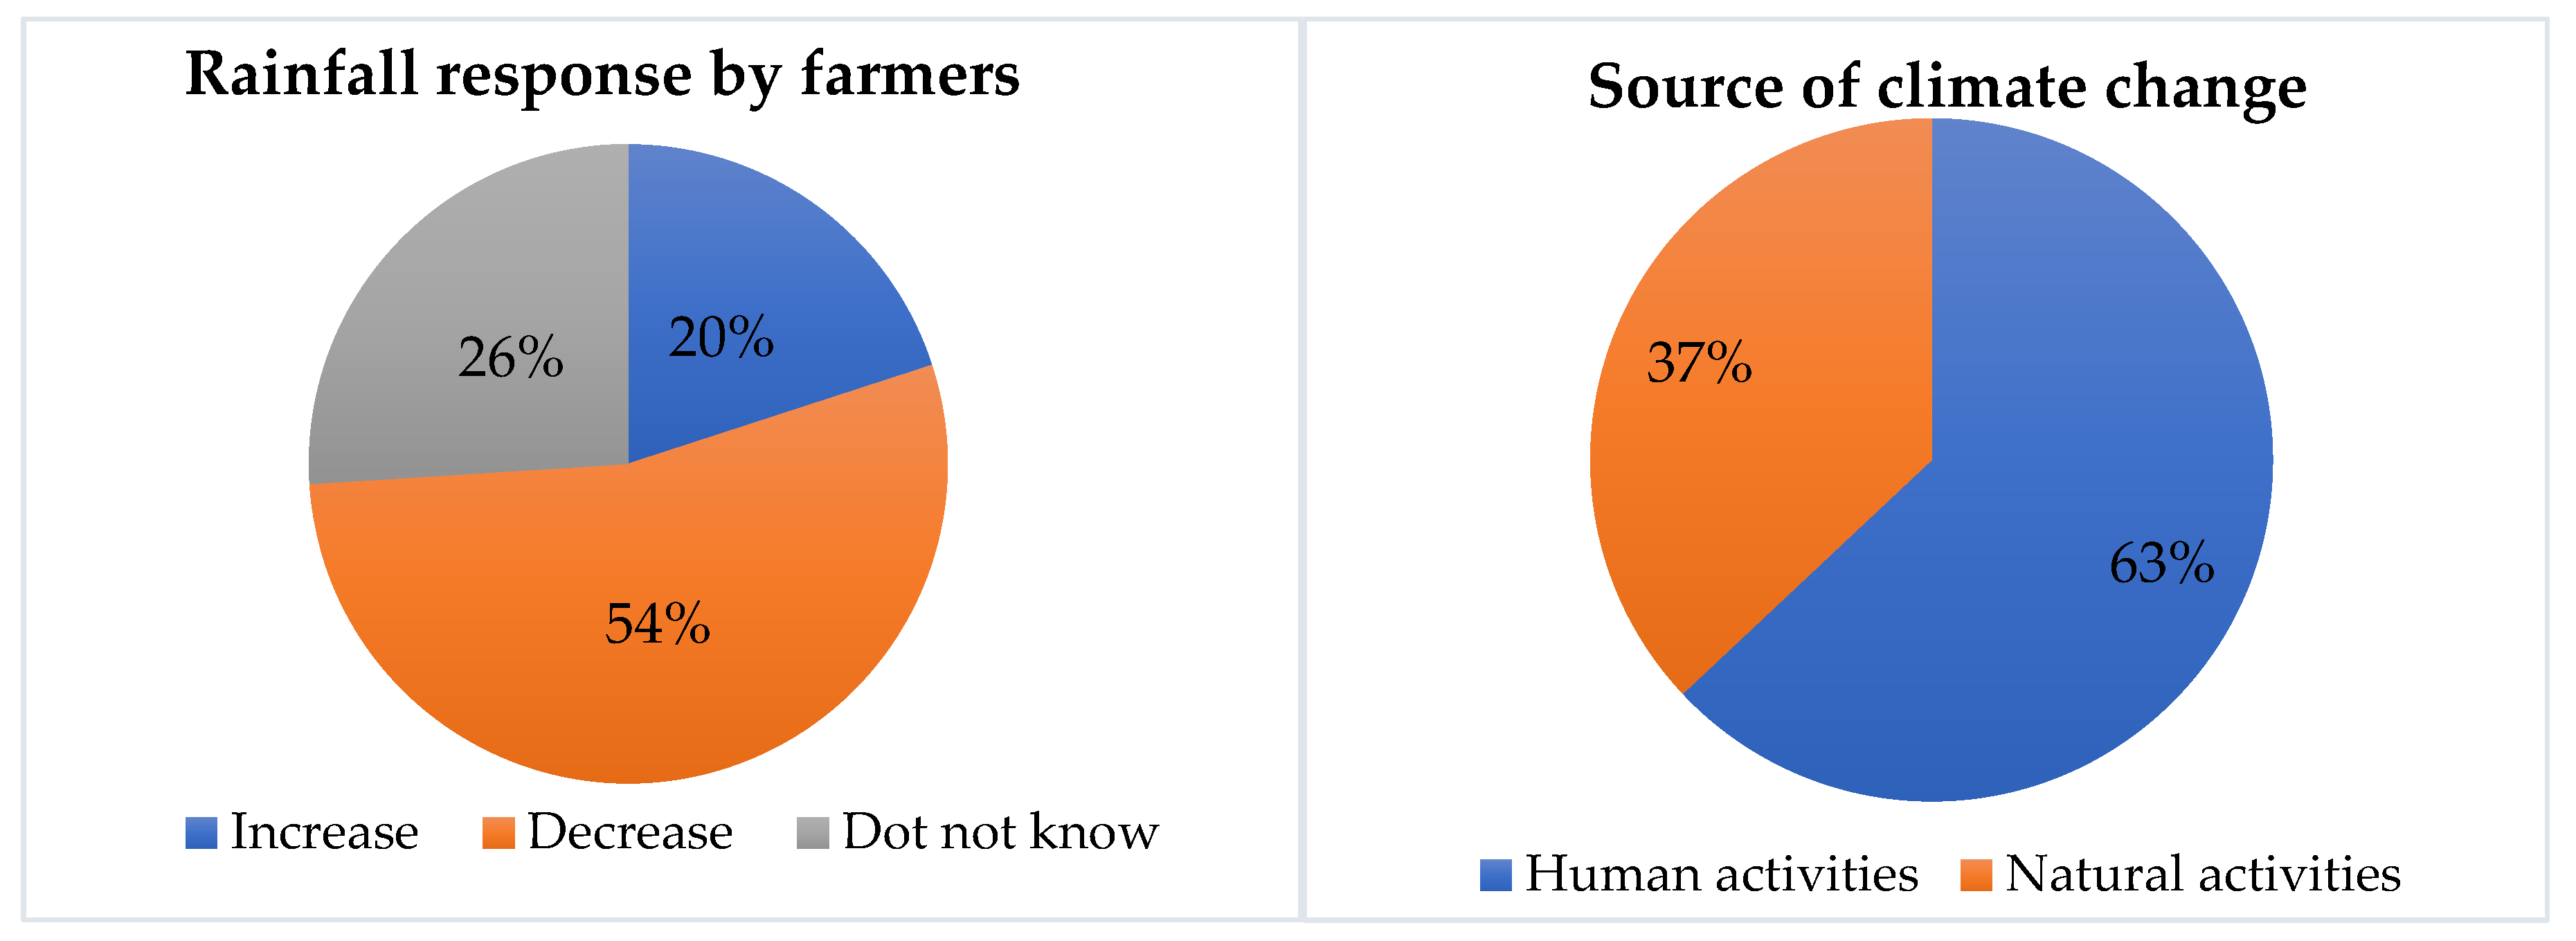
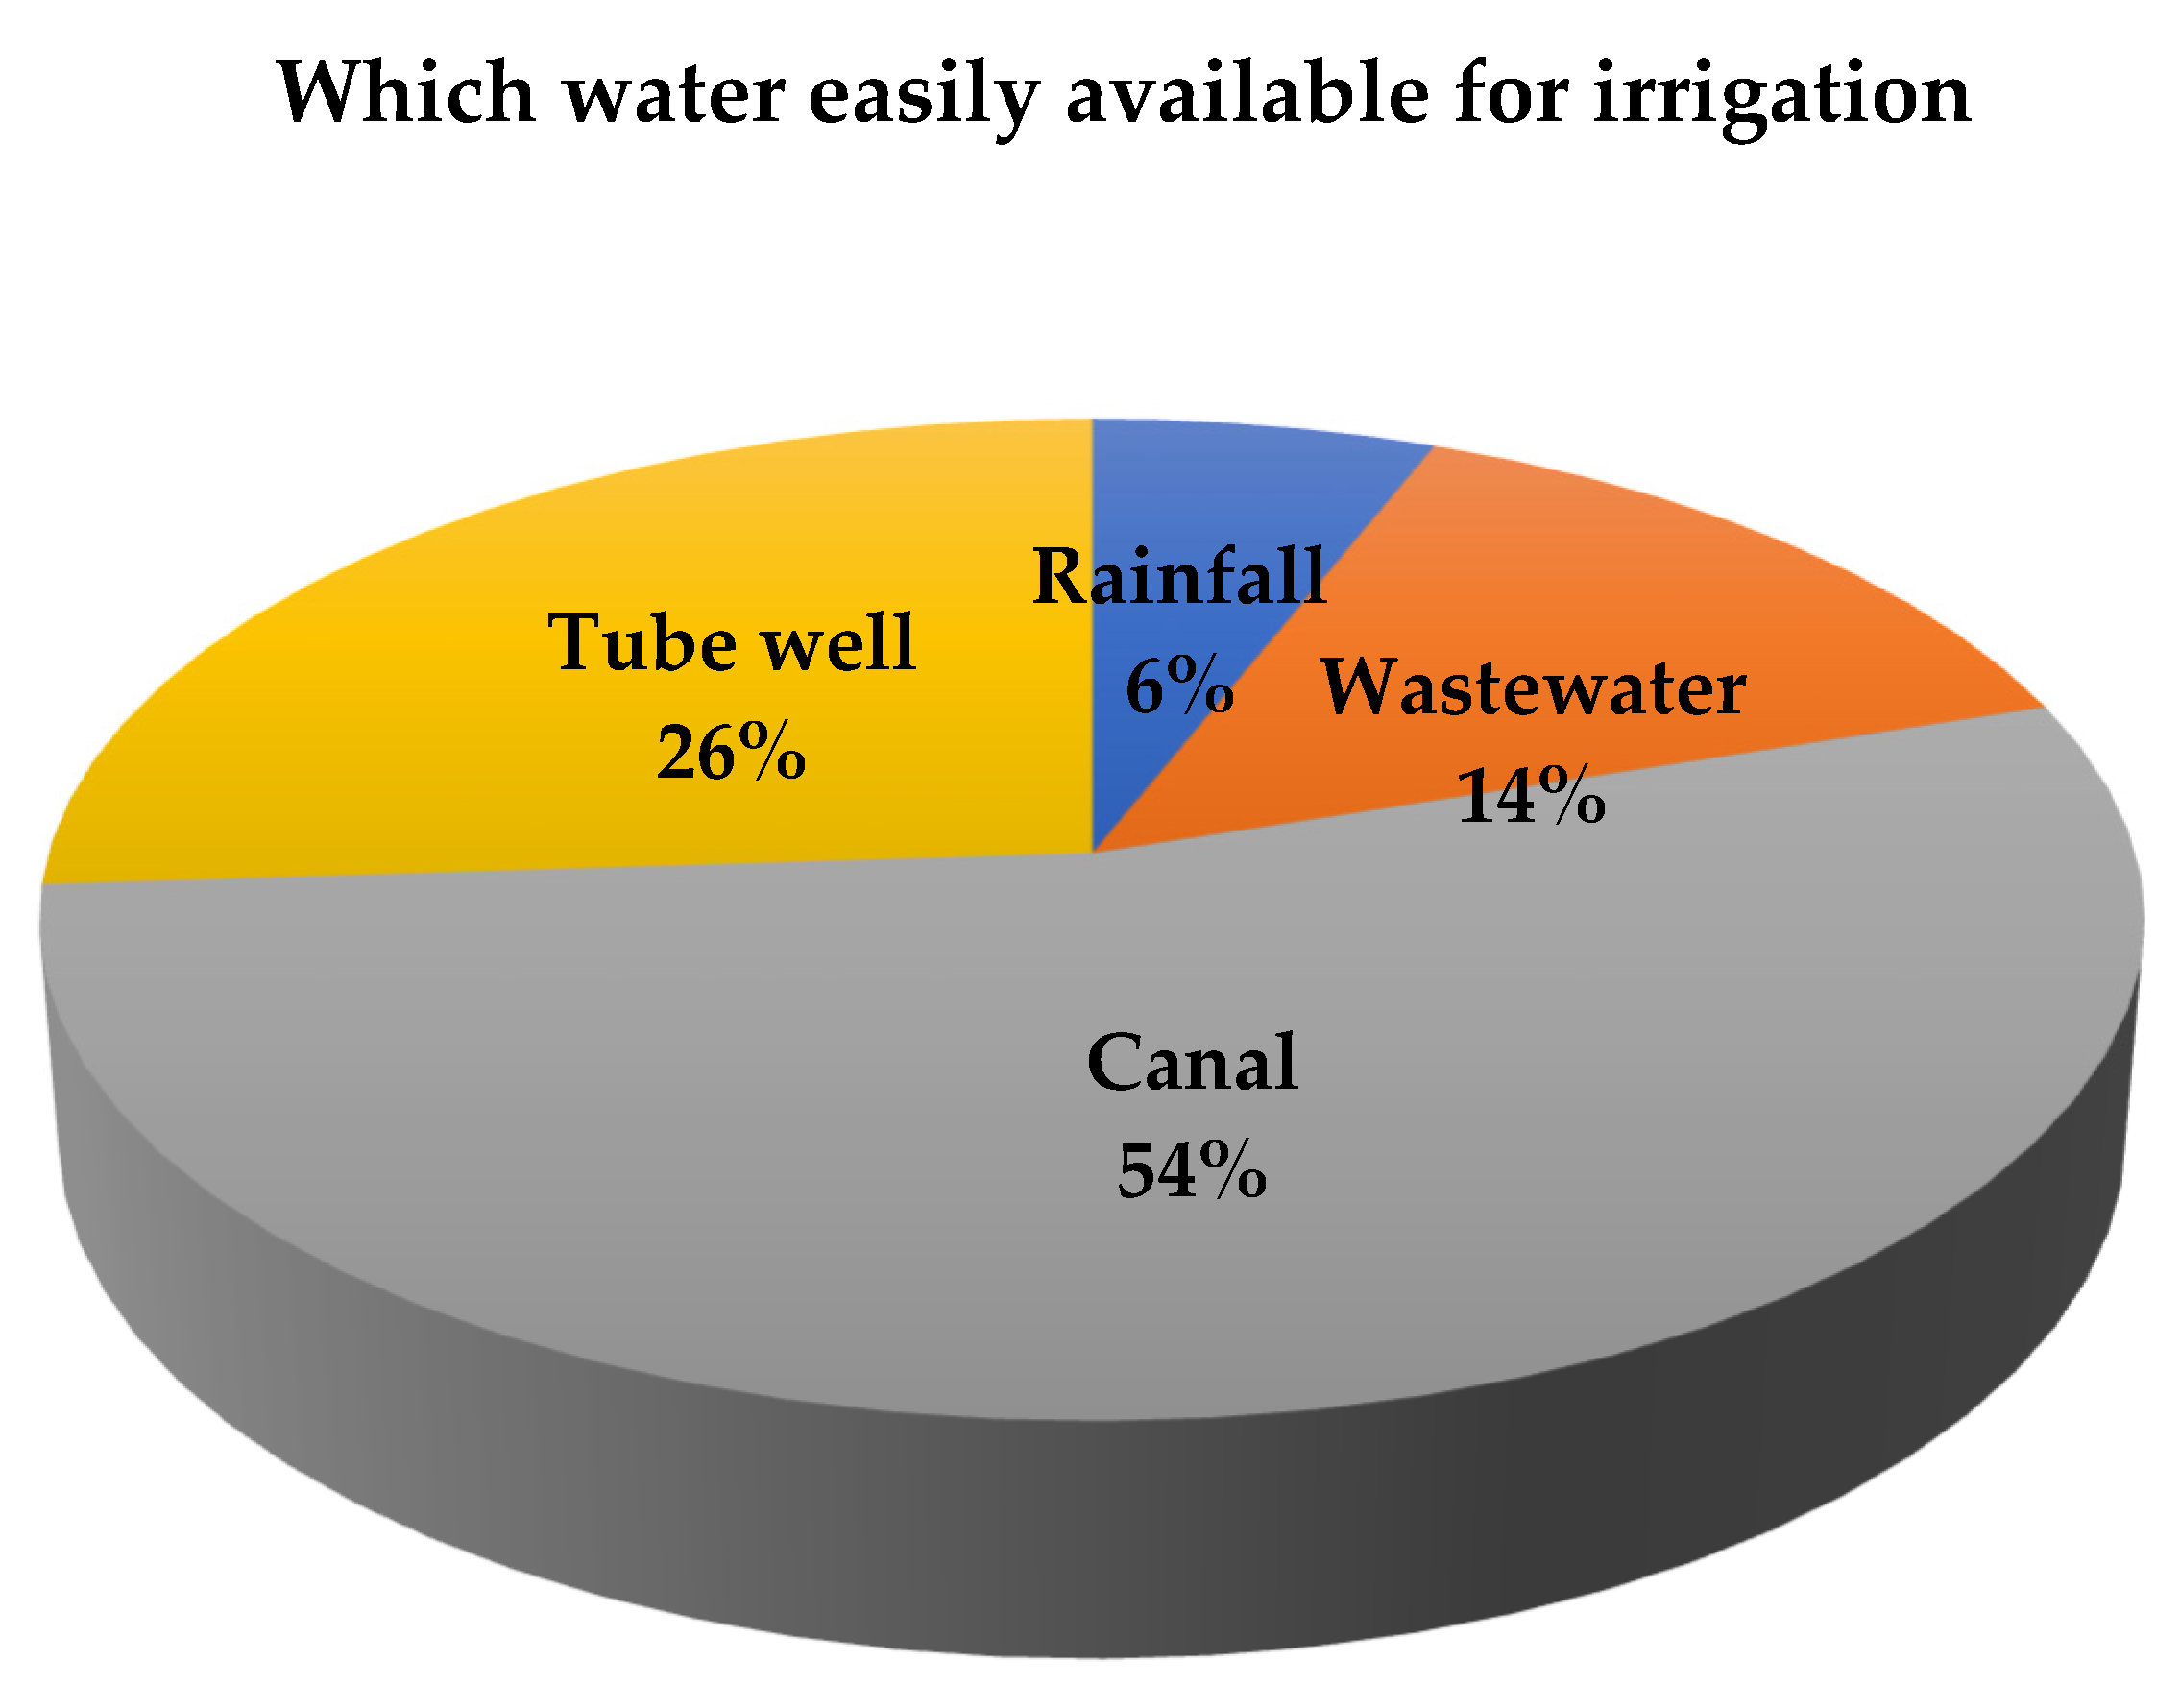
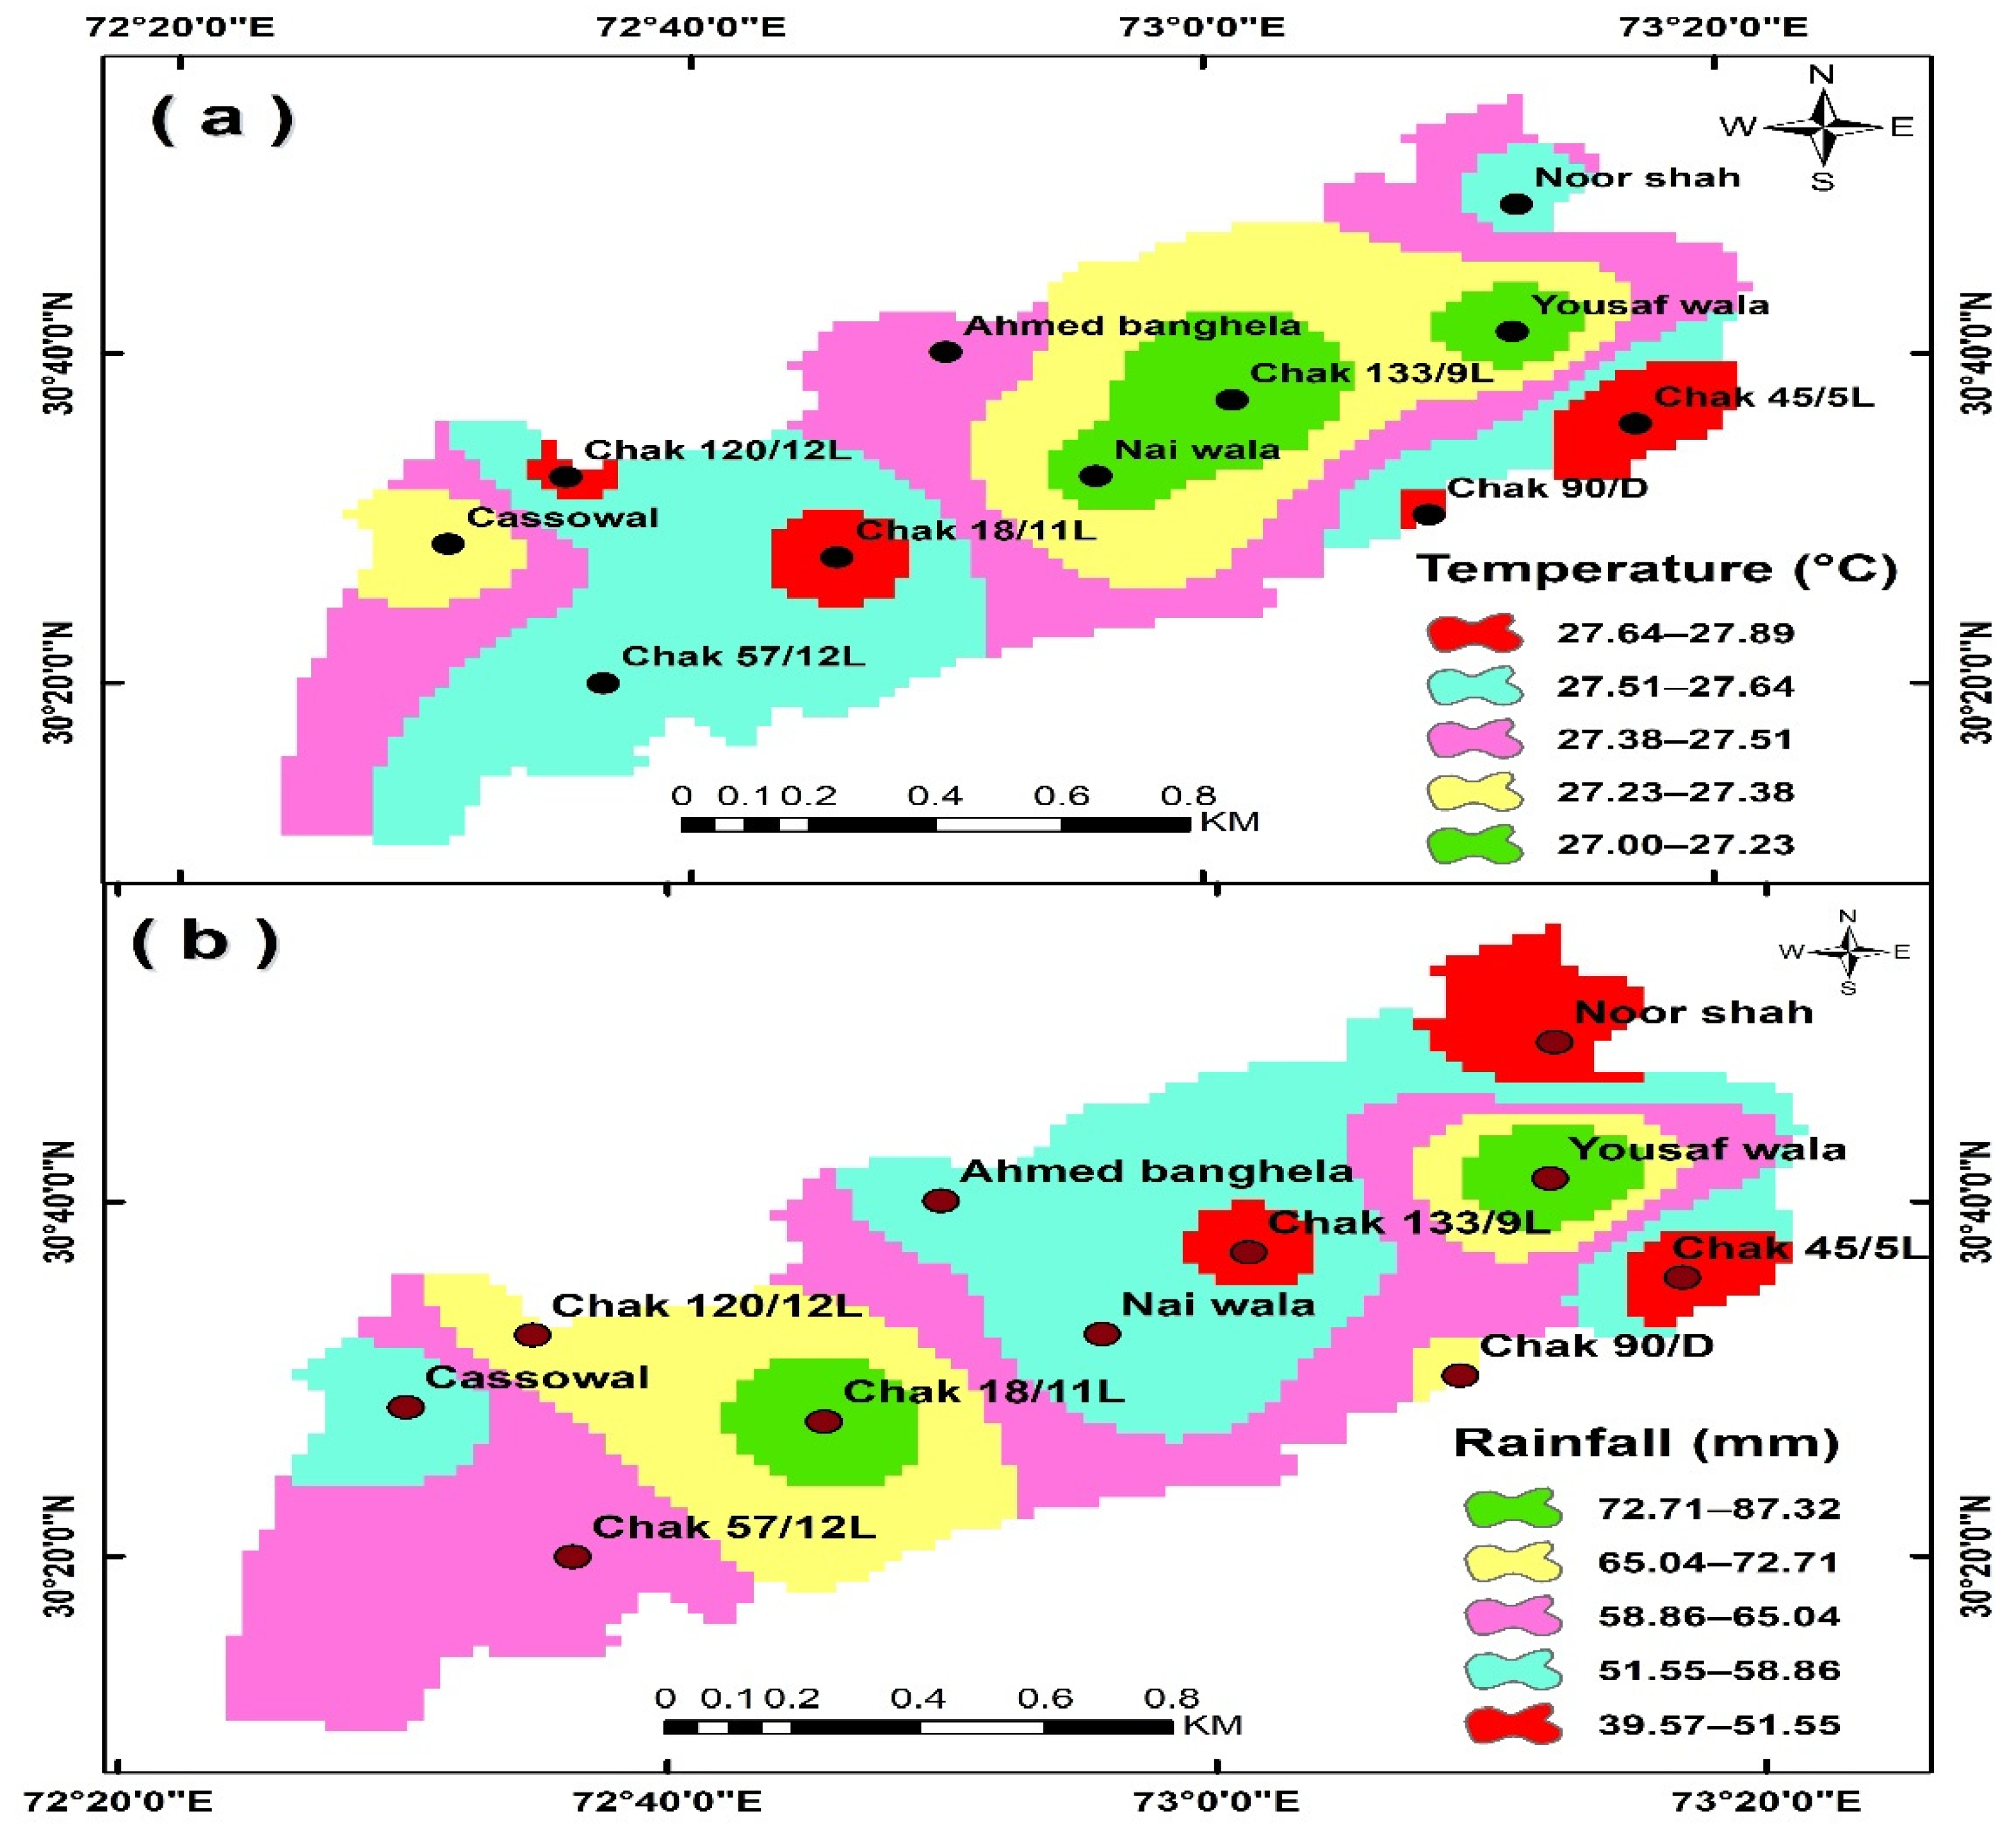
27]. Our study also revealed that about 59% of respondents think rainfall is good, but 76% of respondents reported that an irrigation system is much better to fulfill the water demand for crops. Our results are also compatible with the already conducted various studies during the last few years, and it shows the reliability of our results.
According to the applicable field and sensors, carrying platform imaging spectroscopy is divided in two categories: one category is based on the aircraft and satellites platform; the other category is based on the ground platform applications such as ground remote sensing system [66]. The remote sensing techniques compact the mobility, size, and flexibility, which is used to estimate biochemical parameters, crop disease, and pest monitoring in weed and crop-weed discrimination. Both imaging spectrometers and sensor spectrometers give detailed information about plant leaves. For example, discolored spots on leaves demonstrates their nutritional stress and health condition. [30]. These spatial differences are retrieved from image spectroscopy, and spatial differences occur when chlorophyll content has various health statuses. Now, in ground-based studies, data are generated from the spectral analytical devices to retrieve information about plant leaf chlorophyll [67].
According to Zhang et al. [68], studying the relationship between LULC and the local climate is necessary to improve agricultural production. The LULC change is a significant driver of local climate change, and a changing climate can lead to changes in LULC and vegetation cover [69,70,71]. For example, farmers might shift from their normal crops to other crops that will have higher economic returns due to changing local climatic situations. Greater LST values had an effect on vegetation cover and water needed for irrigation [72,73,74,75]. The understanding of the relationship between LULC and the local climate is improving, but sustained scientific study is required. Our results also indicated that farmers observed temperature increase and rainfall decrease in the study area. These results showed that local farmer observations about climate change and satellite data results match each other in the Sahiwal District. The environmental authorities and government can use the results as a scientific tool to guide decision making on deforestation control and land management. From an economic standpoint, these steps can benefit the country by allowing us to develop plans and improve the quality and quantity of our agricultural production at the village level by selecting crops that will yield the highest yield within the found soil and temperature range of that village. Therefore, increases in agricultural production would improve the economy of the people, and there will be social welfare, and the country will progress by leaps and bounds [76,77,78,79,80]. Likewise, the sustainable management of land showed the implementation of sustainable, productive restoration practices in transformed lands and the protection of vegetation cover. The assessment of the LULC and climate-changing effects discussed in this research would support managers and policymakers through the given spatiotemporal analysis that helps incorporate basin management and development. This research will help enhance the local government’s capacity to implement sound plans at the local level for the betterment of agriculture. The LULC management creates secondary fragmented forests and increases the cover of these forests, which are important for biodiversity recovery and ecosystem services.

5. Conclusions

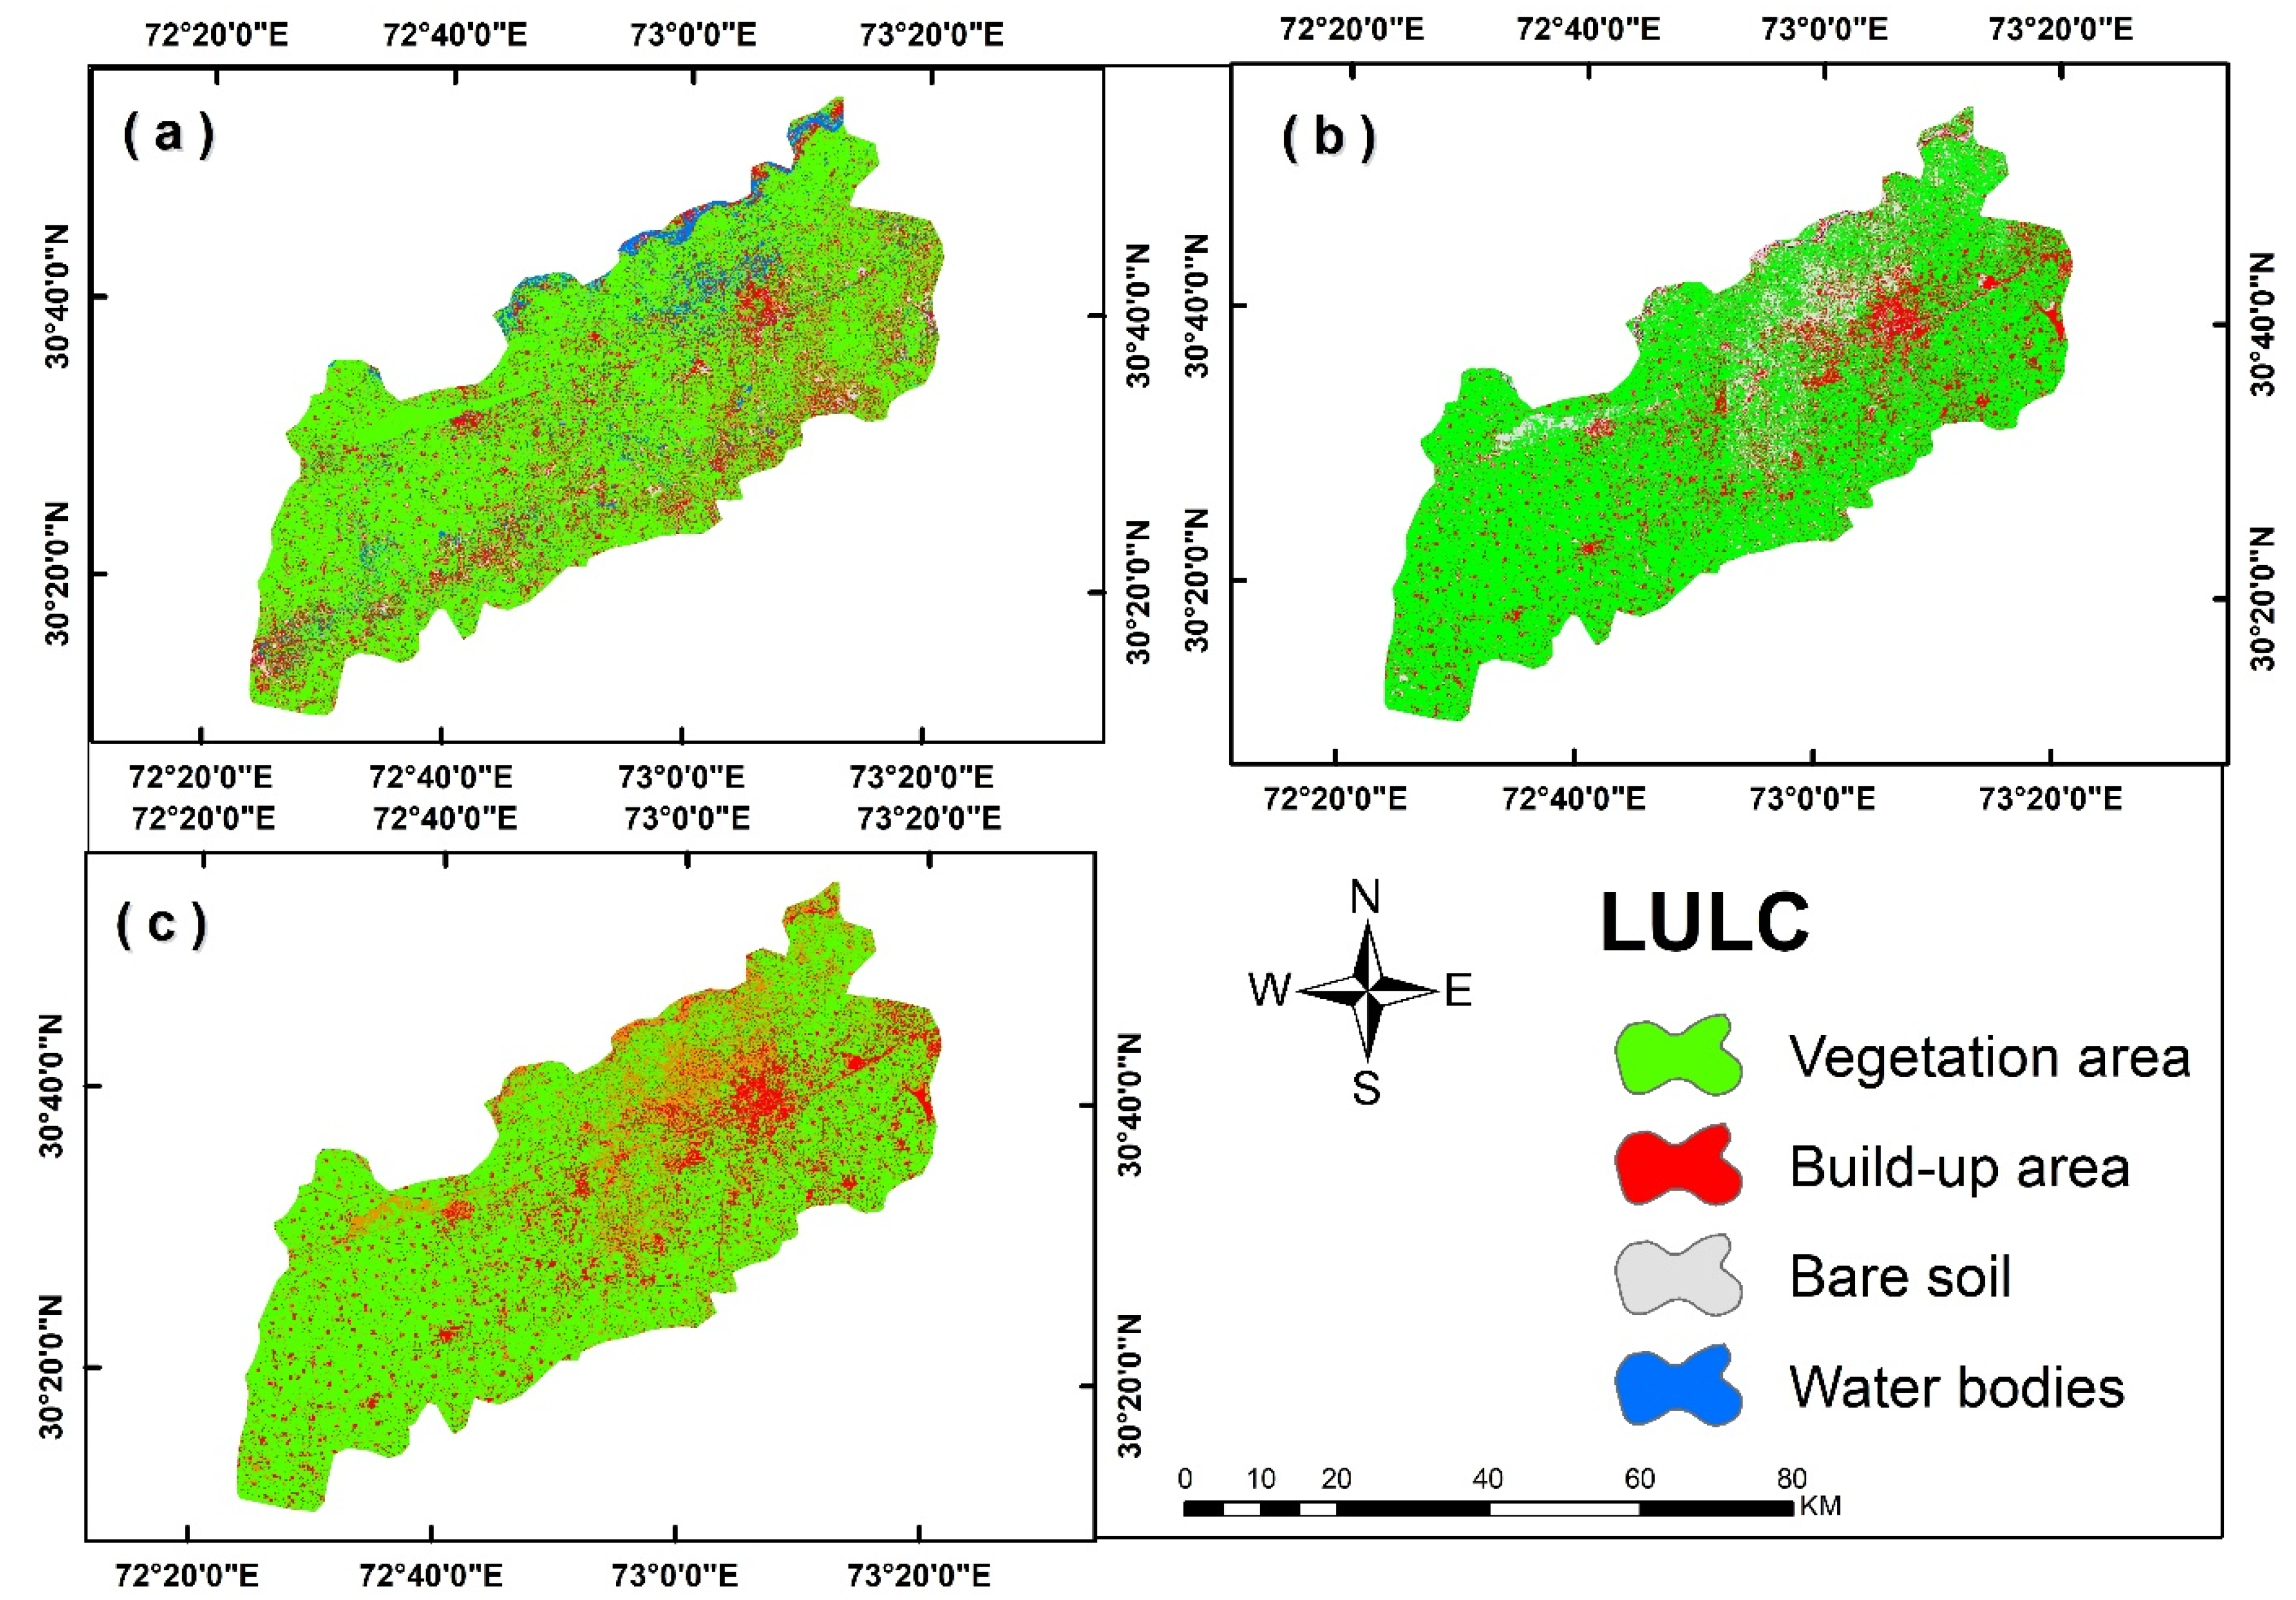
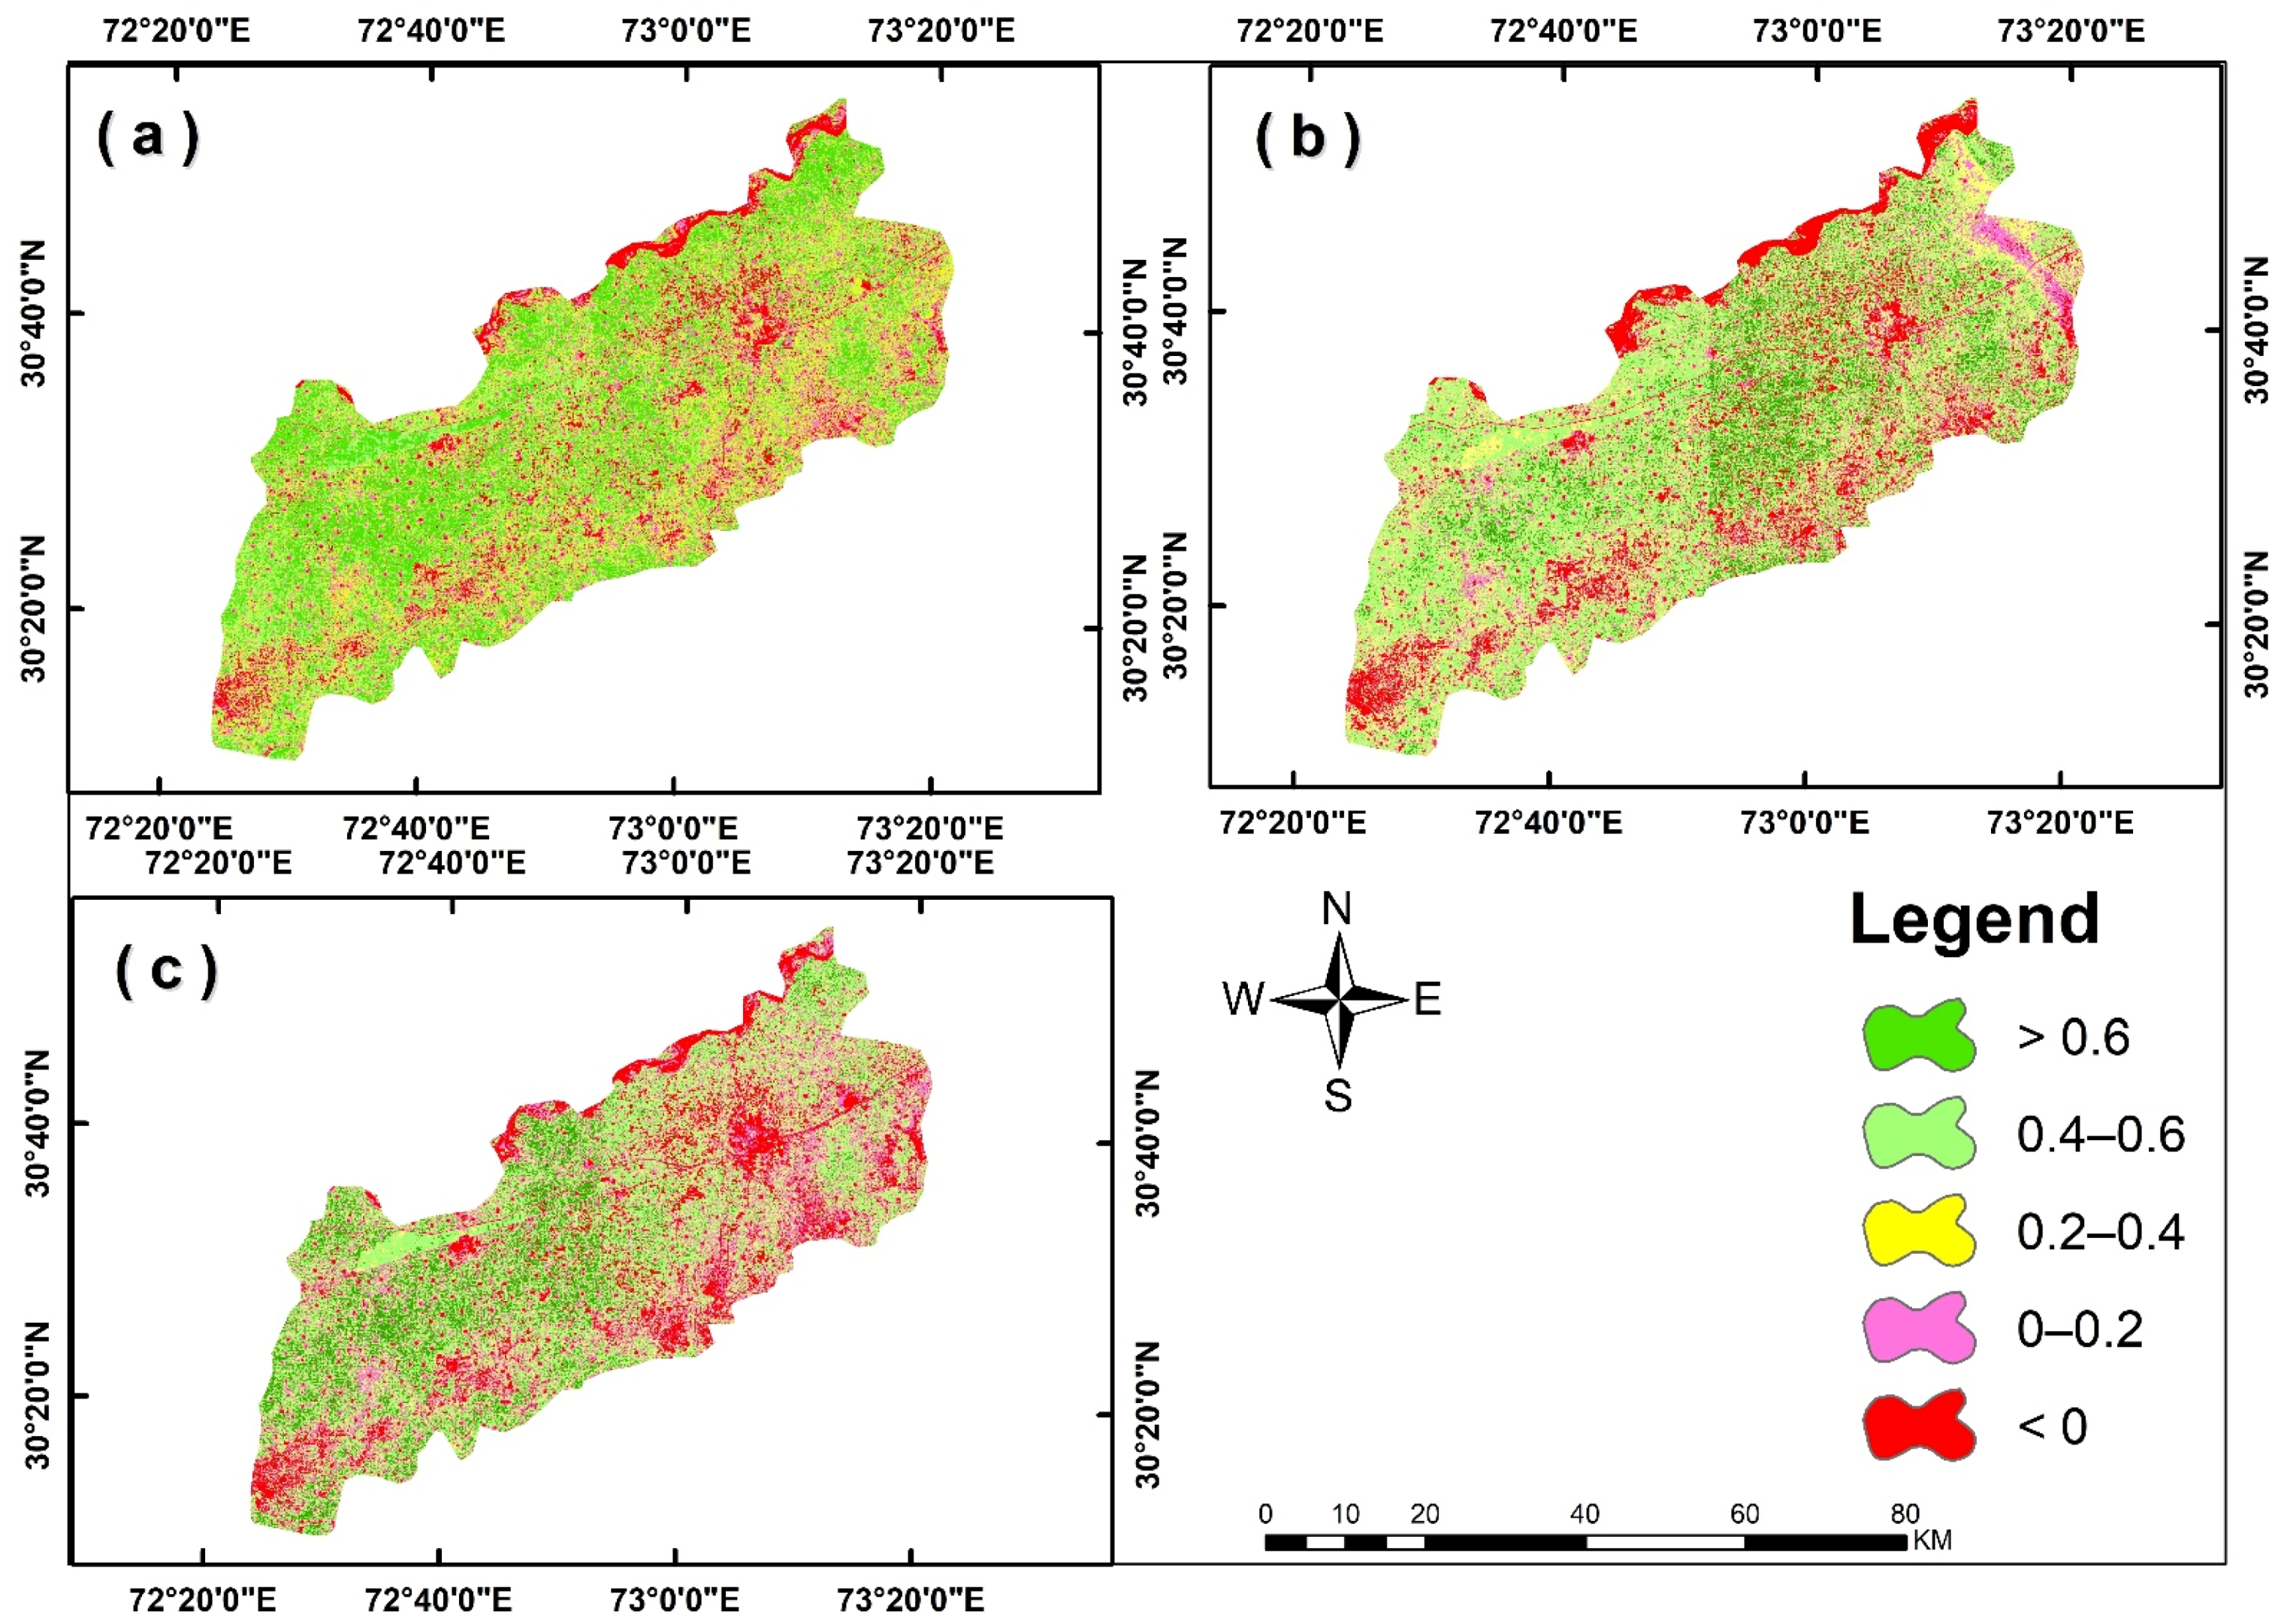
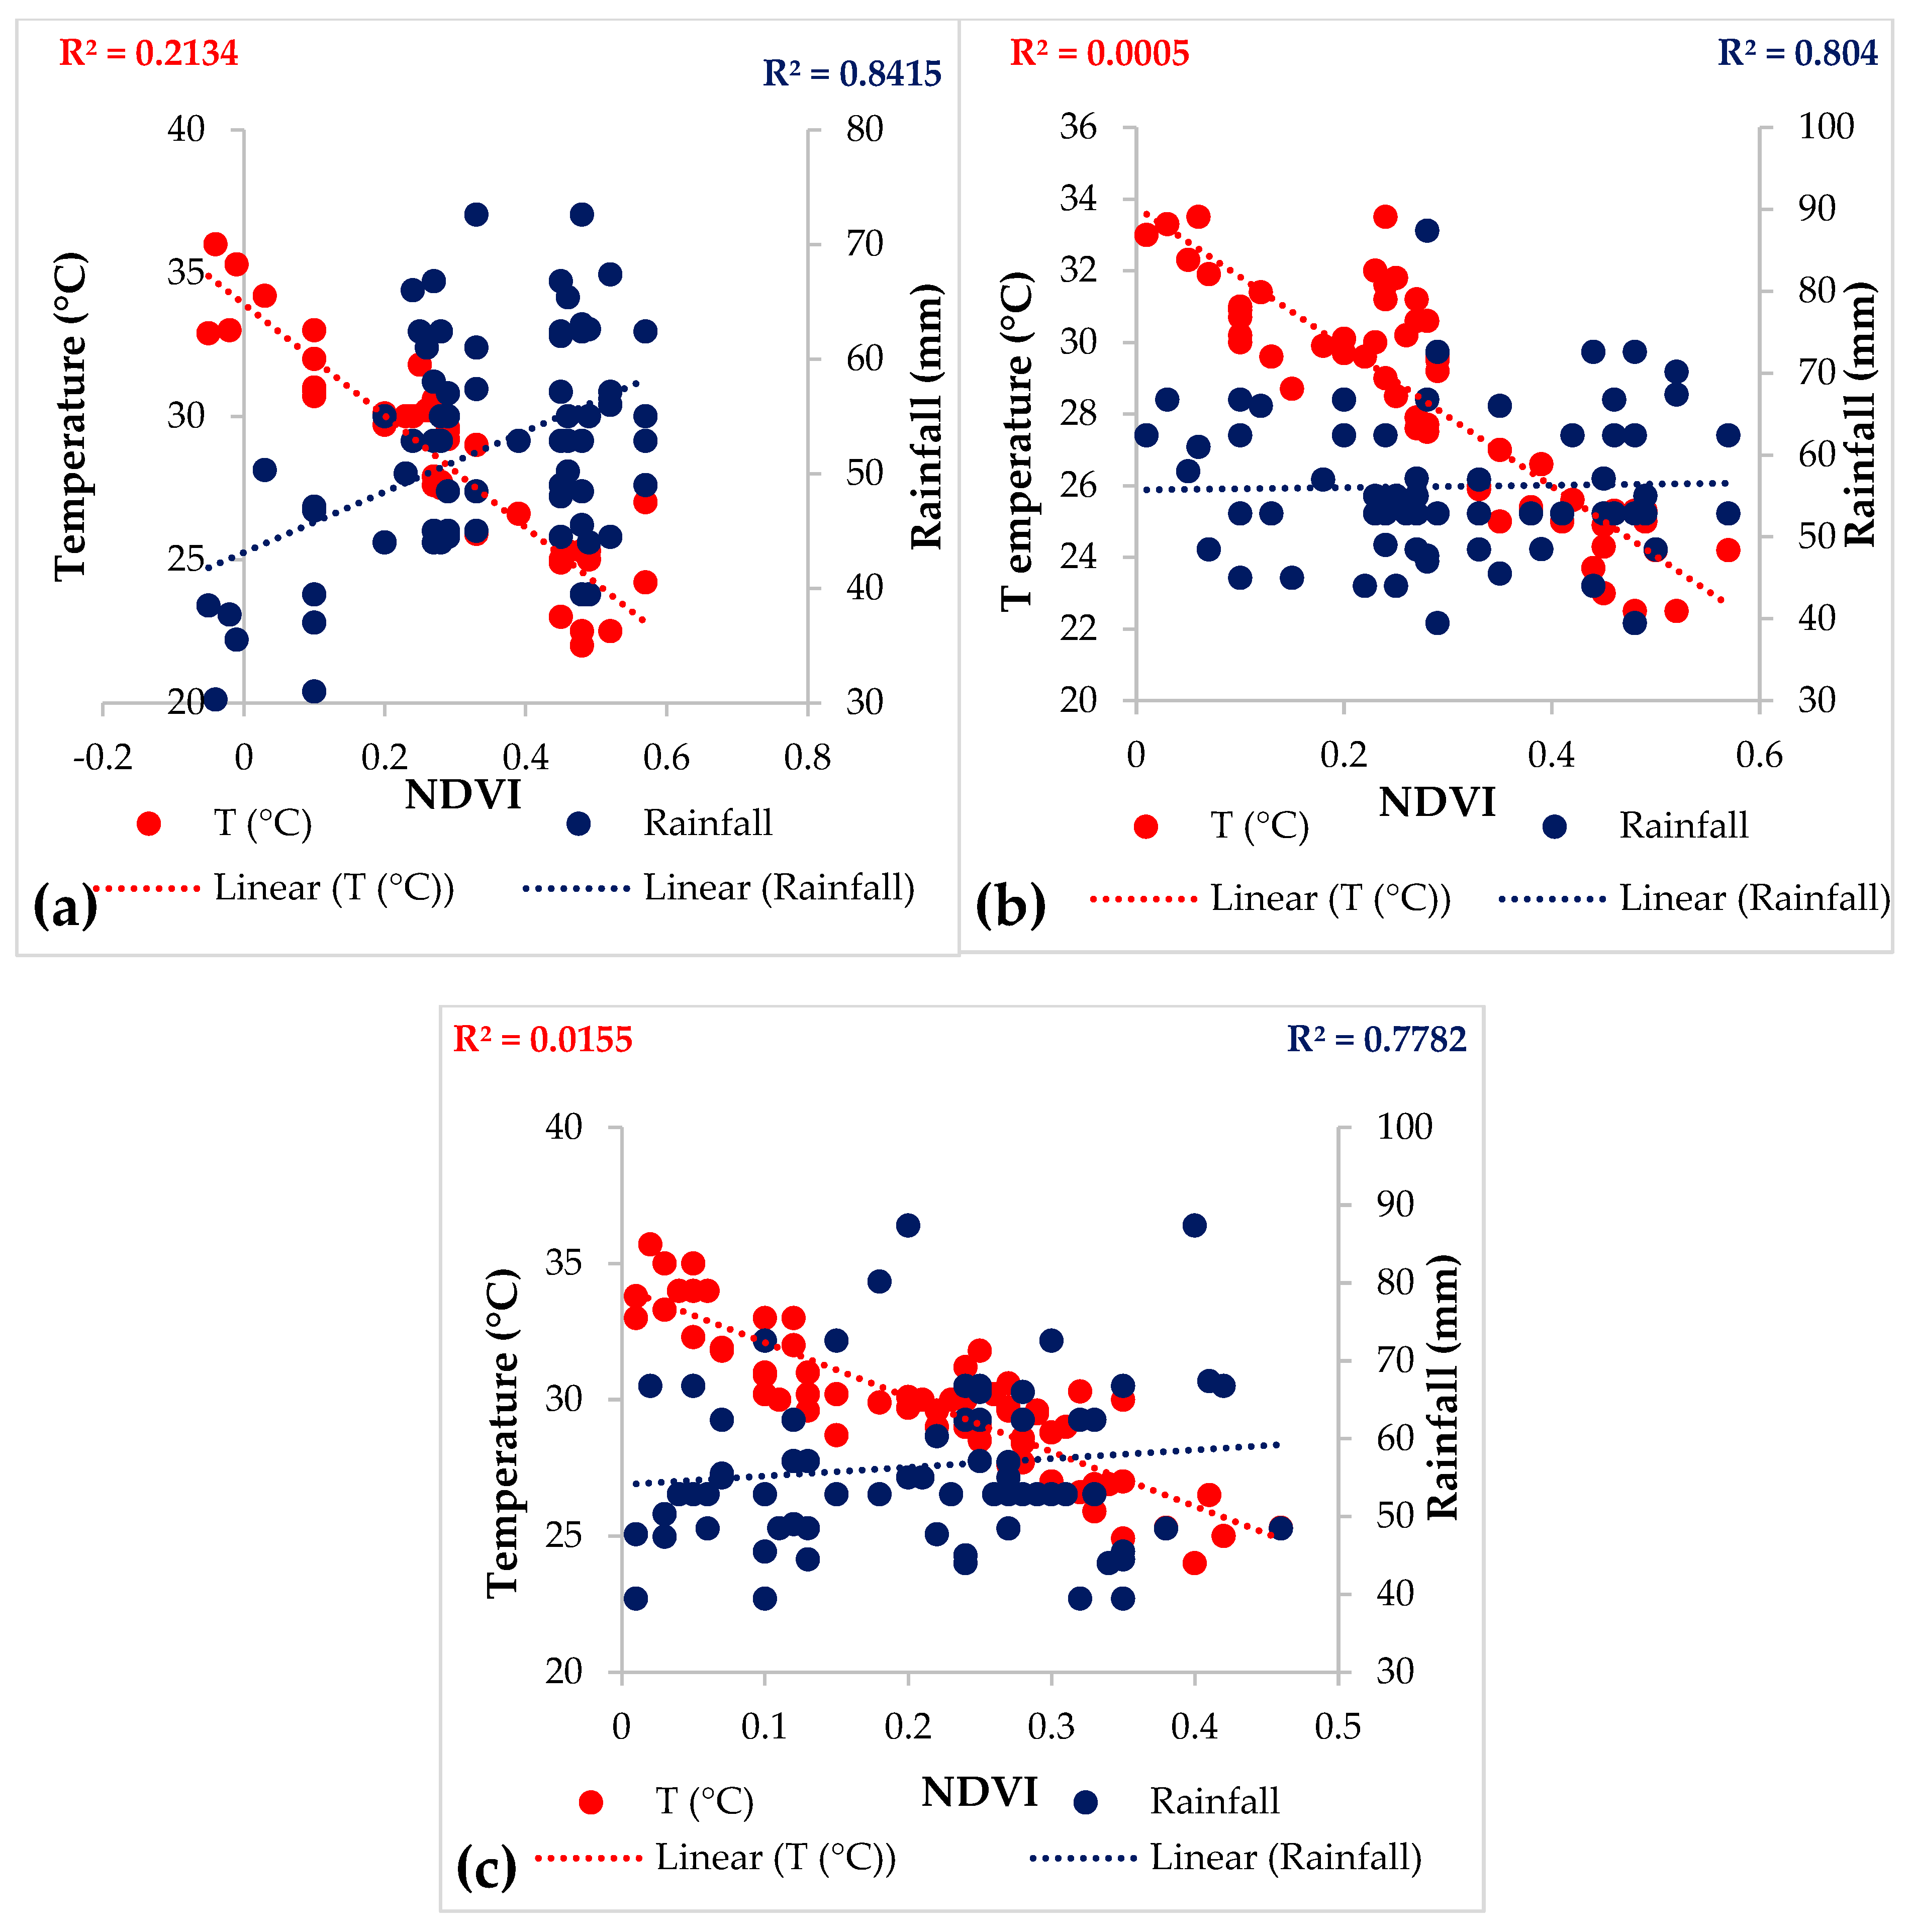
In this research, we studied climate change’s impact on LULC changes as investigated using remote sensing and GIS techniques combined with a field survey at the local level in the Sahiwal District from 1981 to 2021. Build-up area increased from 7203.76 ha (2.25%) to 31,081.3 ha (9.70%), while vegetation area decreased by 14,427.1 ha (4.5%) from 1981 to 2021. The mean values of NDVI showed that overall NDVI values from 1981 to 2021 decreased from 0.24 to 0.20. The spatial distribution of the NDVI resulted mostly in the variations of the meteorological variables such as the occurrence and intensity of the temperature. There were massive changes in the NDVI from 1981 to 2021 owing to the impact of both climate and anthropogenic influences.
As a result of these changes, we have lost biodiversity and our natural ecology. The unwanted impact of difficult ecological dynamics would be compacted by giving particular attention to recovering the affected area to protect the natural resources in the study area. Increasing the build-up area can lead to many environmental problems. An increase in agricultural production would improve the economy of the people, as well as our country, and will progress quite rapidly. Therefore, the government should make policies to provide enough land management at the district level by managing land resources and some other suitable measures. This study will also help improve the ability of the government in the study area to implement local strategies for improving agricultural production, water management, and planned urbanization at a local scale. Proper LULC policy is necessary; otherwise, we may lose our ecological resources. This study should also be used to investigate different LULC classes using other satellites, such as Sentinel and the platform of Google Earth Engine (GEE) in the future. In the future, we can also study the impact of climate change on LULC changes in the whole of Pakistan, which can be easily implemented using the proposed methodology.

Author Contributions

Conceptualization, S.H. and W.N.; methodology, S.H., A.T. and W.N. software, M.M. and S.H.; validation, S.H., A.T., B.G.M., F.M. and L.L.; formal analysis, S.H., W.N., A.T., B.G.M. and M.A.; investigation, S.H., W.N., L.L., A.T., S.K., S.F., B.G.M. and M.A.; resources, S.H., W.N., B.G.M. and A.T.; data curation, S.H., W.N., A.T. and S.K.; writing—original draft preparation, S.H., W.N., A.T. and M.M.; writing—review and editing, S.H., W.N., L.L., A.T., S.K., S.F., B.G.M. and M.A.; visualization, S.H., W.N., L.L., A.T., S.K., S.F. and M.A.; supervision, L.L. and A.T.; project administration, L.L.; funding acquisition, L.L. All authors have read and agreed to the published version of the manuscript.

Funding

This work was supported by the Strategic Priority Research Program of the Chinese Academy of Sciences (grant numbers XDA19090130) and the National Natural Science Foundation of China (grant number 42071321).

Institutional Review Board Statement

Not applicable.

Informed Consent Statement

Not applicable.

Data Availability Statement

The datasets used and/or analyzed during the current study are available in the article/from the corresponding author on request.

Conflicts of Interest

The authors declare no competing interest.

References

  1. Al-Najjar, H.A.H.; Kalantar, B.; Pradhan, B.; Saeidi, V.; Halin, A.A.; Ueda, N.; Mansor, S. Land cover classification from fused DSM and UAV images using convolutional neural networks. Remote Sens. 2019, 11, 1461. [Google Scholar] [CrossRef] [Green Version]
  2. Abdullahi, S.; Pradhan, B. Land use change modeling and the effect of compact city paradigms: Integration of GIS-based cellular automata and weights-of-evidence techniques. Environ. Earth Sci. 2018, 77, 251. [Google Scholar] [CrossRef]
  3. Pradhan, B.; Al-Najjar, H.A.H.; Sameen, M.I.; Tsang, I.; Alamri, A.M. Unseen land cover classification fromhigh-resolution orthophotos using integration of zero-shot learning and convolutional neural networks. Remote Sens. 2020, 12, 1676. [Google Scholar] [CrossRef]
  4. Li, W. Mapping urban impervious surfaces by using spectral mixture analysis and spectral indices. Remote Sens. 2020, 12, 94. [Google Scholar] [CrossRef] [Green Version]
  5. Hoffmann, P.; Krueger, O.; Schlünzen, K.H. A statistical model for the urban heat island and its application to a climate change scenario. Int. J. Climatol. 2012, 32, 1238–1248. [Google Scholar] [CrossRef]
  6. Siddiqui, S.; Ali Safi, M.W.; Rehman, N.U.; Tariq, A. Impact of Climate Change on Land use/Land cover of Chakwal District. Int. J. Econ. Environ. Geol. 2020, 11, 65–68. [Google Scholar] [CrossRef]
  7. Shah, S.H.I.A.; Yan, J.; Ullah, I.; Aslam, B.; Tariq, A.; Zhang, L.; Mumtaz, F. Classification of aquifer vulnerability by using the drastic index and geo-electrical techniques. Water 2021, 13, 2144. [Google Scholar] [CrossRef]
  8. Tariq, A.; Shu, H. CA-Markov chain analysis of seasonal land surface temperature and land use landcover change using optical multi-temporal satellite data of Faisalabad, Pakistan. Remote Sens. 2020, 12, 3402. [Google Scholar] [CrossRef]
  9. Tariq, A.; Shu, H.; Siddiqui, S.; Imran, M.; Farhan, M. Monitoring land use and land cover changes using geospatial techniques, a case study of Fateh Jang, Attock, Pakistan. Geogr. Environ. Sustain. 2021, 14, 41–52. [Google Scholar] [CrossRef]
  10. Akram, R.; Turan, V.; Hammad, H.M.; Ahmad, S.; Hussain, S.; Hasnain, A.; Maqbool, M.M.; Rehmani, M.I.A.; Rasool, A.; Masood, N.; et al. Fate of organic and inorganic pollutants in paddy soils. In Environmental Pollution of Paddy Soils; Springer: Cham, Switzerland, 2018; pp. 197–214. [Google Scholar] [CrossRef]
  11. Wang, B.; Liu, D.; Liu, S.; Zhang, Y.; Lu, D.; Wang, L. Impacts of urbanization on stream habitats and macroinvertebrate communities in the tributaries of Qiangtang River, China. Hydrobiologia 2012, 680, 39–51. [Google Scholar] [CrossRef]
  12. Zahoor, S.A.; Ahmad, S.; Ahmad, A.; Wajid, A.; Khaliq, T.; Mubeen, M.; Hussain, S.; Din, M.S.U.; Amin, A.; Awais, M.; et al. Improving Water Use Efficiency in Agronomic Crop Production. In Agronomic Crops; Springer: Singapore, 2019; pp. 13–29. [Google Scholar] [CrossRef]
  13. Ahmed, B.; Kamruzzaman, M.D.; Zhu, X.; Shahinoor Rahman, M.D.; Choi, K. Simulating land cover changes and their impacts on land surface temperature in dhaka, bangladesh. Remote Sens. 2013, 5, 5969–5998. [Google Scholar] [CrossRef] [Green Version]
  14. Weng, Q.; Lu, D.; Schubring, J. Estimation of land surface temperature-vegetation abundance relationship for urban heat island studies. Remote Sens. Environ. 2004, 89, 467–483. [Google Scholar] [CrossRef]
  15. Omran, E.-S.E. Detection of Land-Use and Surface Temperature Change at Different Resolutions. J. Geogr. Inf. Syst. 2012, 4, 189–203. [Google Scholar] [CrossRef] [Green Version]
  16. Yu, X.; Guo, X.; Wu, Z. Land surface temperature retrieval from landsat 8 TIRS-comparison between radiative transfer equation-based method, split window algorithm and single channel method. Remote Sens. 2014, 6, 9829–9852. [Google Scholar] [CrossRef] [Green Version]
  17. Mubeen, M.; Bano, A.; Ali, B.; Islam, Z.U.; Ahmad, A.; Hussain, S.; Fahad, S.; Nasim, W. Effect of plant growth promoting bacteria and drought on spring maize (Zea mays L.). Pak. J. Bot. 2021, 53, 1–10. [Google Scholar] [CrossRef]
  18. Hussain, S.; Ahmad, A.; Wajid, A.; Khaliq, T.; Hussain, N.; Mubeen, M.; Farid, H.U.; Imran, M.; Hammad, H.M.; Awais, M.; et al. Irrigation Scheduling for Cotton Cultivation. In Cotton Production Uses; Springer: Singapore, 2020; pp. 59–80. [Google Scholar] [CrossRef]
  19. Hussain, S. Land Use/Land Cover Classification by Using Satellite NDVI Tool for Sustainable Water and Climate Change in Southern Punjab. Master’s Thesis, COMSATS University Islamabad, Islamabad, Pakistan, 2018. [Google Scholar] [CrossRef]
  20. Sabagh, A.E.; Hossain, A.; Islam, M.S.; Iqbal, M.A.; Fahad, S.; Ratnasekera, D.; Llanes, A. Consequences and Mitigation Strategies of Heat Stress for Sustainability of Soybean (Glycine max L. Merr.) Production under the Changing Climate. In Plant Stress Physiology; IntechOpen: London, UK, 2020. [Google Scholar] [CrossRef]
  21. Hussain, S.; Mubeen, M.M.; Sultana, S.R.; Ahmad, A.; Fahad, S.; Nasim, W.; Ali, M. Managing Greenhouse Gas Emission. In Modern Techniques of Rice Crop Production; Sarwar, N., Atique-ur-Rehman, Ahmad, S., Hasanuzzaman, M., Eds.; Springer: Singapore, 2022; pp. 547–564. [Google Scholar] [CrossRef]
  22. Hussain, S.; Mubeen, M.; Ahmad, A.; Fahad, S.; Nasim, W.; Hammad, H.M.; Parveen, S. Using space–time scan statistic for studying the effects of COVID-19 in Punjab, Pakistan: A guideline for policy measures in regional agriculture. Environ. Sci. Pollut. Res. 2021, 1–14. [Google Scholar] [CrossRef]
  23. Yuan, F.; Bauer, M.E. Comparison of impervious surface area and normalized difference vegetation index as indicators of surface urban heat island effects in Landsat imagery. Remote Sens. Environ. 2007, 106, 375–386. [Google Scholar] [CrossRef]
  24. Xiao, R.B.; Ouyang, Z.Y.; Zheng, H.; Li, W.F.; Schienke, E.W.; Wang, X.K. Spatial pattern of impervious surfaces and their impacts on land surface temperature in Beijing, China. J. Environ. Sci. 2007, 19, 250–256. [Google Scholar] [CrossRef]
  25. Baqa, M.F.; Chen, F.; Lu, L.; Qureshi, S.; Tariq, A.; Wang, S.; Jing, L.; Hamza, S.; Li, Q. Monitoring and modeling the patterns and trends of urban growth using urban sprawl matrix and CA-Markov model: A case study of Karachi, Pakistan. Land 2021, 10, 700. [Google Scholar] [CrossRef]
  26. Hu, P.; Sharifi, A.; Tahir, M.N.; Tariq, A.; Zhang, L.; Mumtaz, F.; Shah, S.H.I.A. Evaluation of Vegetation Indices and Phenological Metrics Using Time-Series MODIS Data for Monitoring Vegetation Change in Punjab, Pakistan. Water 2021, 13, 2550. [Google Scholar] [CrossRef]
  27. Tariq, A.; Riaz, I.; Ahmad, Z.; Amin, M.; Kausar, R.; Andleeb, S.; Farooqi, M.A.; Rafiq, M. Land surface temperature relation with normalized satellite indices for the estimation of spatio-temporal trends in temperature among various land use land cover classes of an arid Potohar region using Landsat data. Environ. Earth Sci. 2020, 79, 40. [Google Scholar] [CrossRef]
  28. Sharifi, A.; Mahdipour, H.; Moradi, E.; Tariq, A. Agricultural Field Extraction with Deep Learning Algorithm and Satellite Imagery. J. Indian Soc. Remote Sens. 2022, 50, 417–423. [Google Scholar] [CrossRef]
  29. Mumtaz, F.; Tao, Y.; De Leeuw, G.; Zhao, L.; Fan, C.; Elnashar, A.; Bashir, B.; Wang, G.; Li, L.L.; Naeem, S.; et al. Modeling spatio-temporal land transformation and its associated impacts on land surface temperature (LST). Remote Sens. 2020, 12, 2987. [Google Scholar] [CrossRef]
  30. Din, M.S.U.; Mubeen, M.; Hussain, S.; Ahmad, A.; Hussain, N.; Ali, M.A.; Nasim, W. World Nations Priorities on Climate Change and Food Security. In Building Climate Resilience in Agriculture; Springer: Cham, Switzerland, 2022; pp. 365–384. [Google Scholar] [CrossRef]
  31. Attari, S.Z.; Krantz, D.H.; Weber, E.U. Climate change communicators’ carbon footprints affect their audience’s policy support. Clim. Chang. 2019, 154, 529–545. [Google Scholar] [CrossRef]
  32. Pal, S.; Ziaul, S. Detection of land use and land cover change and land surface temperature in English Bazar urban centre. Egypt. J. Remote Sens. Space Sci. 2017, 20, 125–145. [Google Scholar] [CrossRef] [Green Version]
  33. Ding, H.; Shi, W. Land-use/land-cover change and its influence on surface temperature: A case study in Beijing City. Int. J. Remote Sens. 2013, 34, 5503–5517. [Google Scholar] [CrossRef]
  34. Fu, P.; Weng, Q. A time series analysis of urbanization induced land use and land cover change and its impact on land surface temperature with Landsat imagery. Remote Sens. Environ. 2016, 175, 205–214. [Google Scholar] [CrossRef]
  35. Tarawally, M.; Xu, W.; Hou, W.; Mushore, T.D. Comparative analysis of responses of land surface temperature to long-term land use/cover changes between a coastal and Inland City: A case of Freetown and Bo Town in Sierra Leone. Remote Sens. 2018, 10, 112. [Google Scholar] [CrossRef] [Green Version]
  36. Wang, S.; Ma, Q.; Ding, H.; Liang, H. Detection of urban expansion and land surface temperature change using multi-temporal landsat images. Resour. Conserv. Recycl. 2018, 128, 526–534. [Google Scholar] [CrossRef]
  37. Zhang, X.; Wang, D.; Hao, H.; Zhang, F.; Hu, Y. Effects of Land Use/Cover Changes and Urban Forest Configuration on Urban Heat Islands in a Loess Hilly Region: Case Study Based on Yan’an City, China. Int. J. Environ. Res. Public Health 2017, 14, 840. [Google Scholar] [CrossRef] [Green Version]
  38. Tran, D.X.; Pla, F.; Latorre-Carmona, P.; Myint, S.W.; Caetano, M.; Kieu, H.V. Characterizing the relationship between land use land cover change and land surface temperature. ISPRS J. Photogramm. Remote Sens. 2017, 124, 119–132. [Google Scholar] [CrossRef] [Green Version]
  39. Butt, A.; Shabbir, R.; Ahmad, S.S.; Aziz, N. Land use change mapping and analysis using Remote Sensing and GIS: A case study of Simly watershed, Islamabad, Pakistan. Egypt. J. Remote Sens. Space Sci. 2015, 18, 251–259. [Google Scholar] [CrossRef] [Green Version]
  40. Mathew, A.; Khandelwal, S.; Kaul, N. Spatial and temporal variations of urban heat island effect and the effect of percentage impervious surface area and elevation on land surface temperature: Study of Chandigarh city, India. Sustain. Cities Soc. 2016, 26, 264–277. [Google Scholar] [CrossRef]
  41. Mishra, V.N.; Rai, P.K.; Kumar, P.; Prasad, R. Evaluation of land use/land cover classification accuracy using multi-resolution remote sensing images. Forum Geogr. 2016, XV, 45–53. [Google Scholar] [CrossRef]
  42. Singh, S.K.; Laari, P.B.; Mustak, S.; Srivastava, P.K.; Szabó, S. Modelling of land use land cover change using earth observation data-sets of Tons River Basin, Madhya Pradesh, India. Geocarto Int. 2018, 33, 1202–1222. [Google Scholar] [CrossRef]
  43. Jahangir, M.; Maria Ali, S.; Khalid, B. Annual minimum temperature variations in early 21st century in Punjab, Pakistan. J. Atmos. Sol.-Terr. Phys. 2016, 137, 1–9. [Google Scholar] [CrossRef]
  44. Zereen, A.; Khan, Z. A survey of ethnobotanically important trees of Central Punjab, Pakistan. Biologia 2012, 58, 21–30. [Google Scholar]
  45. Waseem, M.; Khurshid, T.; Abbas, A.; Ahmad, I.; Javed, Z. Impact of meteorological drought on agriculture production at different scales in Punjab, Pakistan. J. Water Clim. Chang. 2022, 13, 113–124. [Google Scholar] [CrossRef]
  46. Naz, S.; Fatima, Z.; Iqbal, P.; Khan, A.; Zakir, I.; Ullah, H.; Ahmad, S. An Introduction to Climate Change Phenomenon. In Building Climate Resilience in Agriculture; Springer: Cham, Switzerland, 2022; pp. 3–16. [Google Scholar] [CrossRef]
  47. Masood, N.; Akram, R.; Fatima, M.; Mubeen, M.; Hussain, S.; Shakeel, M.; Nasim, W. Insect Pest Management Under Climate Change. In Building Climate Resilience in Agriculture; Springer: Cham, Switzerland, 2022; pp. 225–237. [Google Scholar] [CrossRef]
  48. Hussain, S.; Amin, A.; Mubeen, M.; Khaliq, T.; Shahid, M.; Hammad, H.M.; Nasim, W. Climate Smart Agriculture (CSA) Technologies. In Building Climate Resilience in Agriculture; Springer: Cham, Switzerland, 2022; pp. 319–338. [Google Scholar] [CrossRef]
  49. Bhalli, M.N.; Ghaffar, A.; Shirazi, S.A.; Parveen, N. Use of Multi-Temporal Digital Data to Monitor Lulc Changes in Faisalabad-Pakistan. Pak. J. Sci. 2013, 65, 58–62. [Google Scholar]
  50. Farhan, M.; Moazzam, U.; Rahman, G.; Munawar, S.; Tariq, A.; Safdar, Q.; Lee, B. Trends of Rainfall Variability and Drought Monitoring Using Standardized Precipitation Index in a Scarcely Gauged Basin of. Water 2022, 14, 1132. [Google Scholar] [CrossRef]
  51. Hassan, Z.; Shabbir, R.; Ahmad, S.S.; Malik, A.H.; Aziz, N.; Butt, A.; Erum, S. Dynamics of land use and land cover change (LULCC) using geospatial techniques: A case study of Islamabad Pakistan. Springerplus 2016, 5, 812. [Google Scholar] [CrossRef] [PubMed] [Green Version]
  52. Islam, M.S.; Fahad, S.; Hossain, A.; Chowdhury, M.K.; Iqbal, M.A.; Dubey, A.; Sabagh, A.E. Legumes under Drought Stress: Plant Responses, Adaptive Mechanisms, and Management Strategies in Relation to Nitrogen Fixation. In Engineering Tolerance in Crop Plants Against Abiotic Stress; CRC Press: Boca Raton, FL, USA, 2021; pp. 179–207. [Google Scholar]
  53. Shao, Z.; Cai, J.; Fu, P.; Hu, L.; Liu, T. Deep learning-based fusion of Landsat-8 and Sentinel-2 images for a harmonized surface reflectance product. Remote Sens. Environ. 2019, 235, 111425. [Google Scholar] [CrossRef]
  54. Ur Rehman, Z.; Kazmi, S.J.H. Land use/land cover changes through satellite remote sensing approach: A case study of Indus delta, Pakistan. Pak. J. Sci. Ind. Res. Ser. A Phys. Sci. 2018, 61, 156–162. [Google Scholar] [CrossRef]
  55. Nath, B.; Niu, Z.; Singh, R.P. Land Use and Land Cover changes, and environment and risk evaluation of Dujiangyan city (SW China) using remote sensing and GIS techniques. Sustainability 2018, 10, 4631. [Google Scholar] [CrossRef] [Green Version]
  56. Firdaus, R. Assessing Land Use and Land Cover Change toward Sustainability in Humid Tropical Watersheds, Indonesia Assessing Land Use and Land Cover Change toward Sustainability in Humid Tropical Watersheds, Indonesia. Ph.D. Thesis, Hiroshima University, Hiroshima, Japan, 2014. [Google Scholar]
  57. Mohammady, M.; Moradi, H.R.; Zeinivand, H.; Temme, A.J.A.M. A comparison of supervised, unsupervised and synthetic land use classification methods in the north of Iran. Int. J. Environ. Sci. Technol. 2015, 12, 1515–1526. [Google Scholar] [CrossRef] [Green Version]
  58. Shao, Z.; Ding, L.; Li, D.; Altan, O.; Huq, M.E.; Li, C. Exploring the relationship between urbanization and ecological environment using remote sensing images and statistical data: A case study in the Yangtze River Delta, China. Sustainability 2020, 12, 5620. [Google Scholar] [CrossRef]
  59. Hentze, K.; Thonfeld, F.; Menz, G. Evaluating crop area mapping from modis time-series as an assessment tool for Zimbabwe’s “fast track land reform programme”. PLoS ONE 2016, 11, 1–22. [Google Scholar] [CrossRef] [Green Version]
  60. Weng, Q. Thermal infrared remote sensing for urban climate and environmental studies: Methods, applications, and trends. ISPRS J. Photogramm. Remote Sens. 2009, 64, 335–344. [Google Scholar] [CrossRef]
  61. Usman, U.; Yelwa, S.A.; Gulumbe, S.U.; Danbaba, A.; Nir, R. Modelling Relationship between NDVI and Climatic Variables Using Geographically Weighted Regression. J. Math. Sci. Appl. 2013, 1, 24–28. [Google Scholar] [CrossRef]
  62. Campo-Bescós, M.A.; Muñoz-Carpena, R.; Southworth, J.; Zhu, L.; Waylen, P.R.; Bunting, E. Combined spatial and temporal effects of environmental controls on long-term monthly NDVI in the Southern Africa Savanna. Remote Sens. 2013, 5, 6513–6538. [Google Scholar] [CrossRef] [Green Version]
  63. Fazal, S. Urban expansion and loss of agricultural land—A GIS based study of Saharanpur City, India. Environ. Urban. 2000, 12, 133–149. [Google Scholar] [CrossRef]
  64. Aguilár, A.G.; Ward, P.M. Globalization, regional development, and mega-city expansion in Latin America: Analyzing Mexico City’s peri-urban hinterland. Cities 2003, 20, 3–21. [Google Scholar] [CrossRef]
  65. Athick, A.A.S.M.; Shankar, K. Data on Land Use and Land Cover Changes in Adama Wereda, Ethiopia, on ETM+, TM and OLI- TIRS landsat sensor using PCC and CDM techniques. Data in Brief 2019, 24, 103880. [Google Scholar] [CrossRef]
  66. Imran, M.; Ahmad, S.; Sattar, A.; Tariq, A. Mapping sequences and mineral deposits in poorly exposed lithologies of inaccessible regions in Azad Jammu and Kashmir using SVM with ASTER satellite data. Arab. J. Geosci. 2022, 15, 538. [Google Scholar] [CrossRef]
  67. Sayemuzzaman, M.; Jha, M.K. Modeling of Future Land Cover Land Use Change in North Carolina Using Markov Chain and Cellular Automata Model. Am. J. Eng. Appl. Sci. 2014, 7, 295–306. [Google Scholar] [CrossRef]
  68. Zhang, Q.; Wang, J.; Peng, X.; Gong, P.; Shi, P. Urban built-up land change detection with road density and spectral information from multi-temporal Landsat TM data. Int. J. Remote Sens. 2002, 23, 3057–3078. [Google Scholar] [CrossRef]
  69. Cohen, B. Urban growth in developing countries: A review of current trends and a caution regarding existing forecasts. World Dev. 2004, 32, 23–51. [Google Scholar] [CrossRef]
  70. Chen, W.; Liu, L.; Zhang, C.; Wang, J.; Wang, J.; Pan, Y. Monitoring the seasonal bare soil areas in Beijing using multitemporal TM images. In Proceedings of the IGARSS 2004. 2004 IEEE International Geoscience and Remote Sensing Symposium, Anchorage, AK, USA, 20–24 September 2004; IEEE: New York, NY, USA, 2004; Volume 5, pp. 3379–3382. [Google Scholar]
  71. Ahmed, B.; Ahmed, R. Modeling urban land cover growth dynamics using multioral satellite images: A case study of Dhaka, Bangladesh. ISPRS Int. J. Geo-Inf. 2012, 1, 3–31. [Google Scholar] [CrossRef] [Green Version]
  72. Zhao, Z.; Sharifi, A.; Dong, X.; Shen, L.; He, B.J. Spatial Variability and Temporal Heterogeneity of Surface Urban Heat Island Patterns and the Suitability of Local Climate Zones for Land Surface Temperature Characterization. Remote Sens. 2021, 13, 4338. [Google Scholar] [CrossRef]
  73. Talukdar, S.; Rihan, M.; Hang, H.T.; Bhaskaran, S.; Rahman, A. Modelling urban heat island (UHI) and thermal field variation and their relationship with land use indices over Delhi and Mumbai metro cities. Environ. Dev. Sustain. 2021, 24, 3762–3790. [Google Scholar]
  74. Sharma, R.; Pradhan, L.; Kumari, M.; Bhattacharya, P. Assessing urban heat islands and thermal comfort in Noida City using geospatial technology. Urban Clim. 2021, 35, 100751. [Google Scholar] [CrossRef]
  75. Hussain, S.; Mubeen, M.; Akram, W.; Ahmad, A.; Habib-ur-Rahman, M.; Ghaffar, A.; Amin, A.; Awais, M.; Farid, H.U.; Farooq, A.; et al. Study of land cover/land use changes using RS and GIS: A case study of Multan district, Pakistan. Environ. Monit. Assess. 2020, 192, 2. [Google Scholar] [CrossRef] [PubMed]
  76. Hussain, S.; Mubeen, M.; Ahmad, A.; Akram, W.; Hammad, H.M.; Ali, M.; Masood, N.; Amin, A.; Farid, H.U.; Sultana, S.R.; et al. Using GIS tools to detect the land use/land cover changes during forty years in Lodhran District of Pakistan. Environ. Sci. Pollut. Res. 2020, 27, 39676–39692. [Google Scholar] [CrossRef]
  77. Hussain, S.; Karuppannan, S. Land use/land cover changes and their impact on land surface temperature using remote sensing technique in district Khanewal, Punjab Pakistan. Geol. Eco. Landsc. 2021, 1–13. [Google Scholar] [CrossRef]
  78. Hussain, S.; Mubeen, M.; Karuppannan, S. Land use and land cover (LULC) change analysis using TM, ETM+ and OLI Landsat images in district of Okara, Punjab, Pakistan. Phy. Chem. Earth 2022, 126, 103117. [Google Scholar] [CrossRef]
  79. Hussain, S.; Mubeen, M.; Ahmad, A.; Masood, N.; Hammad, H.M.; Amjad, M.; Waleed, M. Satellite-based evaluation of temporal change in cultivated land in Southern Punjab (Multan region) through dynamics of vegetation and land surface temperature. Open Geosci. 2021, 13, 1561–1577. [Google Scholar] [CrossRef]
  80. Majeed, M.; Tariq, A.; Anwar, M.M.; Khan, A.M.; Arshad, F.; Shaukat, S. Monitoring of Land Use–Land Cover Change and Potential Causal Factors of Climate Change in Jhelum District, Punjab, Pakistan, through GIS and Multi-Temporal Satellite Data. Land 2021, 10, 1026. [Google Scholar] [CrossRef]
Figure 1. Study area map of the Sahiwal District.
Land 11 00595 g001
Figure 2. Flow chart for methodology.
Land 11 00595 g002
Figure 3. Perceptions of farmers about the reason for climate change and rainfall.
Land 11 00595 g003
Figure 4. Availability of water for irrigation.
Land 11 00595 g004
Figure 5. LULC maps for the years (a) 1981, (b) 2001, and (c) 2021 of the Sahiwal District.
Land 11 00595 g005
Figure 6. NDVI maps for the years (a) 1981, (b) 2001, and (c) 2021 of the Sahiwal District.
Land 11 00595 g006
Figure 7. (a)Average temperature and (b) rainfall maps of the Sahiwal district from 1981 to 2021 by survey points.
Land 11 00595 g007
Figure 8. Relationship of temperature rainfall and NDVI of the Sahiwal District, (a) 1981, (b) 2001, and (c) 2021.
Land 11 00595 g008
Table 1. Specification of Landsat satellite data was used in this study.
S.No.Satellite/SensorDatePath/RowSpatial ResolutionSpectral ResolutionBand Used
1Landsat 4-5 (TM)12 March 1981149/03930 mMultispectral (8 bands)1,2,3,4,5,7
150/039
2Landsat 7 (ETM+)25 March 2001149/03930 mMultispectral (8 bands)1,2,3,4,5,7
150/039
3Landsat 8 (OLI/TIRS)17 March 2021149/03930 mMultispectral (11 bands)1,2,3,4,5,6,7,9
150/039
Table 2. Detail description of Land Use Land Cover (LULC) classes.
LULC TypesLULC Description
Vegetation areaAgricultural lands, forest, Crop fields, vegetated lands, parks, etc.
Build-up areaCommercial, and residential buildings, and road systems.
Water bodiesRiver, lakes, low lying lands, canals, marshy lands, ponds, swamps, etc.
Bare soilOpen land, unused and empty areas, fallow areas, bare soil, and others.
Table 3. Perceptions of farmers about climate change information and awareness.
StatementAgreeDisagreeNot SureDo Not Know
Climate is changing78%7%6%9%
Climate change is effecting the agriculture72%2%12%6%
Deforestation is the main reason for climate change53%23%12%12%
Climate change will be a big challenge in future69%6%15%10%
Table 4. Perceptions of farmers about risk due to climate change.
StatementAgreeDisagreeNot SureDo Not Know
Increase in temperature reduced crop production64%12%16%8%
Demand of water increased for irrigation 78%6%12%4%
You are dependent on rainfall water for irrigation 8%84%8%0%
Water availability for irrigation decreased due to climate change72%14%10%4%
Time of crop sowing is changed due to climate change52%18%14%16%
Food prices increased due to climate change86%6%8%0%
Table 5. Area of LULC classes for the years 1981, 2001, and 2021.
LULC Classes198120012021Change 1981 to 2021
Ha%Ha%Ha%Ha%
Vegetation area293,282.1891.57290,096.4490.58278,855.187.07−14,427.1−4.50
Build-up-area7203.762.2516,653.815.2031,081.39.7023,877.547.45
Bare soil15,676.854.8910,286.343.217701.52.40−7975.35−2.49
Water bodies4118.121.293244.321.0132643.010.83−1475.11−0.46
Total320,280.91100320,280.91100320,280.9110000
Table 6. Census of Sahiwal District from 1981 to 2017.
CensusUrbanRuralTotalUrban RatioRural Ratio
1981201,1951,080,3311,281,52615.70%84.30%
1998301,9901,541,2041,843,19416.38%83.62%
2017517,1202,000,4402,517,56020.54%79.46%
Change
1981–2017
315,925920,1091,236,0344.84–4.84
Table 7. Summary of producers’ and users’ accuracy and kappa (K) coefficients in Sahiwal District.
LULC Types198120012021
PAUAOAKPAUAOAKPAUAOAK
Vegetation area87.186.585.380.786.791.386.582.083.384.387.085.3
Build-up area84.483.785.088.185.390.8
Bare soil86.786.587.588.784.784.8
Water bodies86.485.193.381.492.084.4
Note; PA = Producers’ Accuracy; UA = Users’ Accuracy; OA = Overall Accuracy; K = Kappa Coefficient.
Table 8. Maximum and minimum temperature and NDVI values for the year from 1981 to 2021.
YearsNDVI Temperature
MinMaxAverageSDMinMaxAverageSD
1981–0.280.770.2458.79.244.8275.2
2001–0.230.690.238.049.745.127.45.56
2021–0.170.570.27.810.345.527.96.05
Publisher’s Note: MDPI stays neutral with regard to jurisdictional claims in published maps and institutional affiliations.

