
An Ecosystem Service Approach to Assessing Agro-Ecosystems in Urban Landscapes


Abstract
:1. Introduction
2. Methods
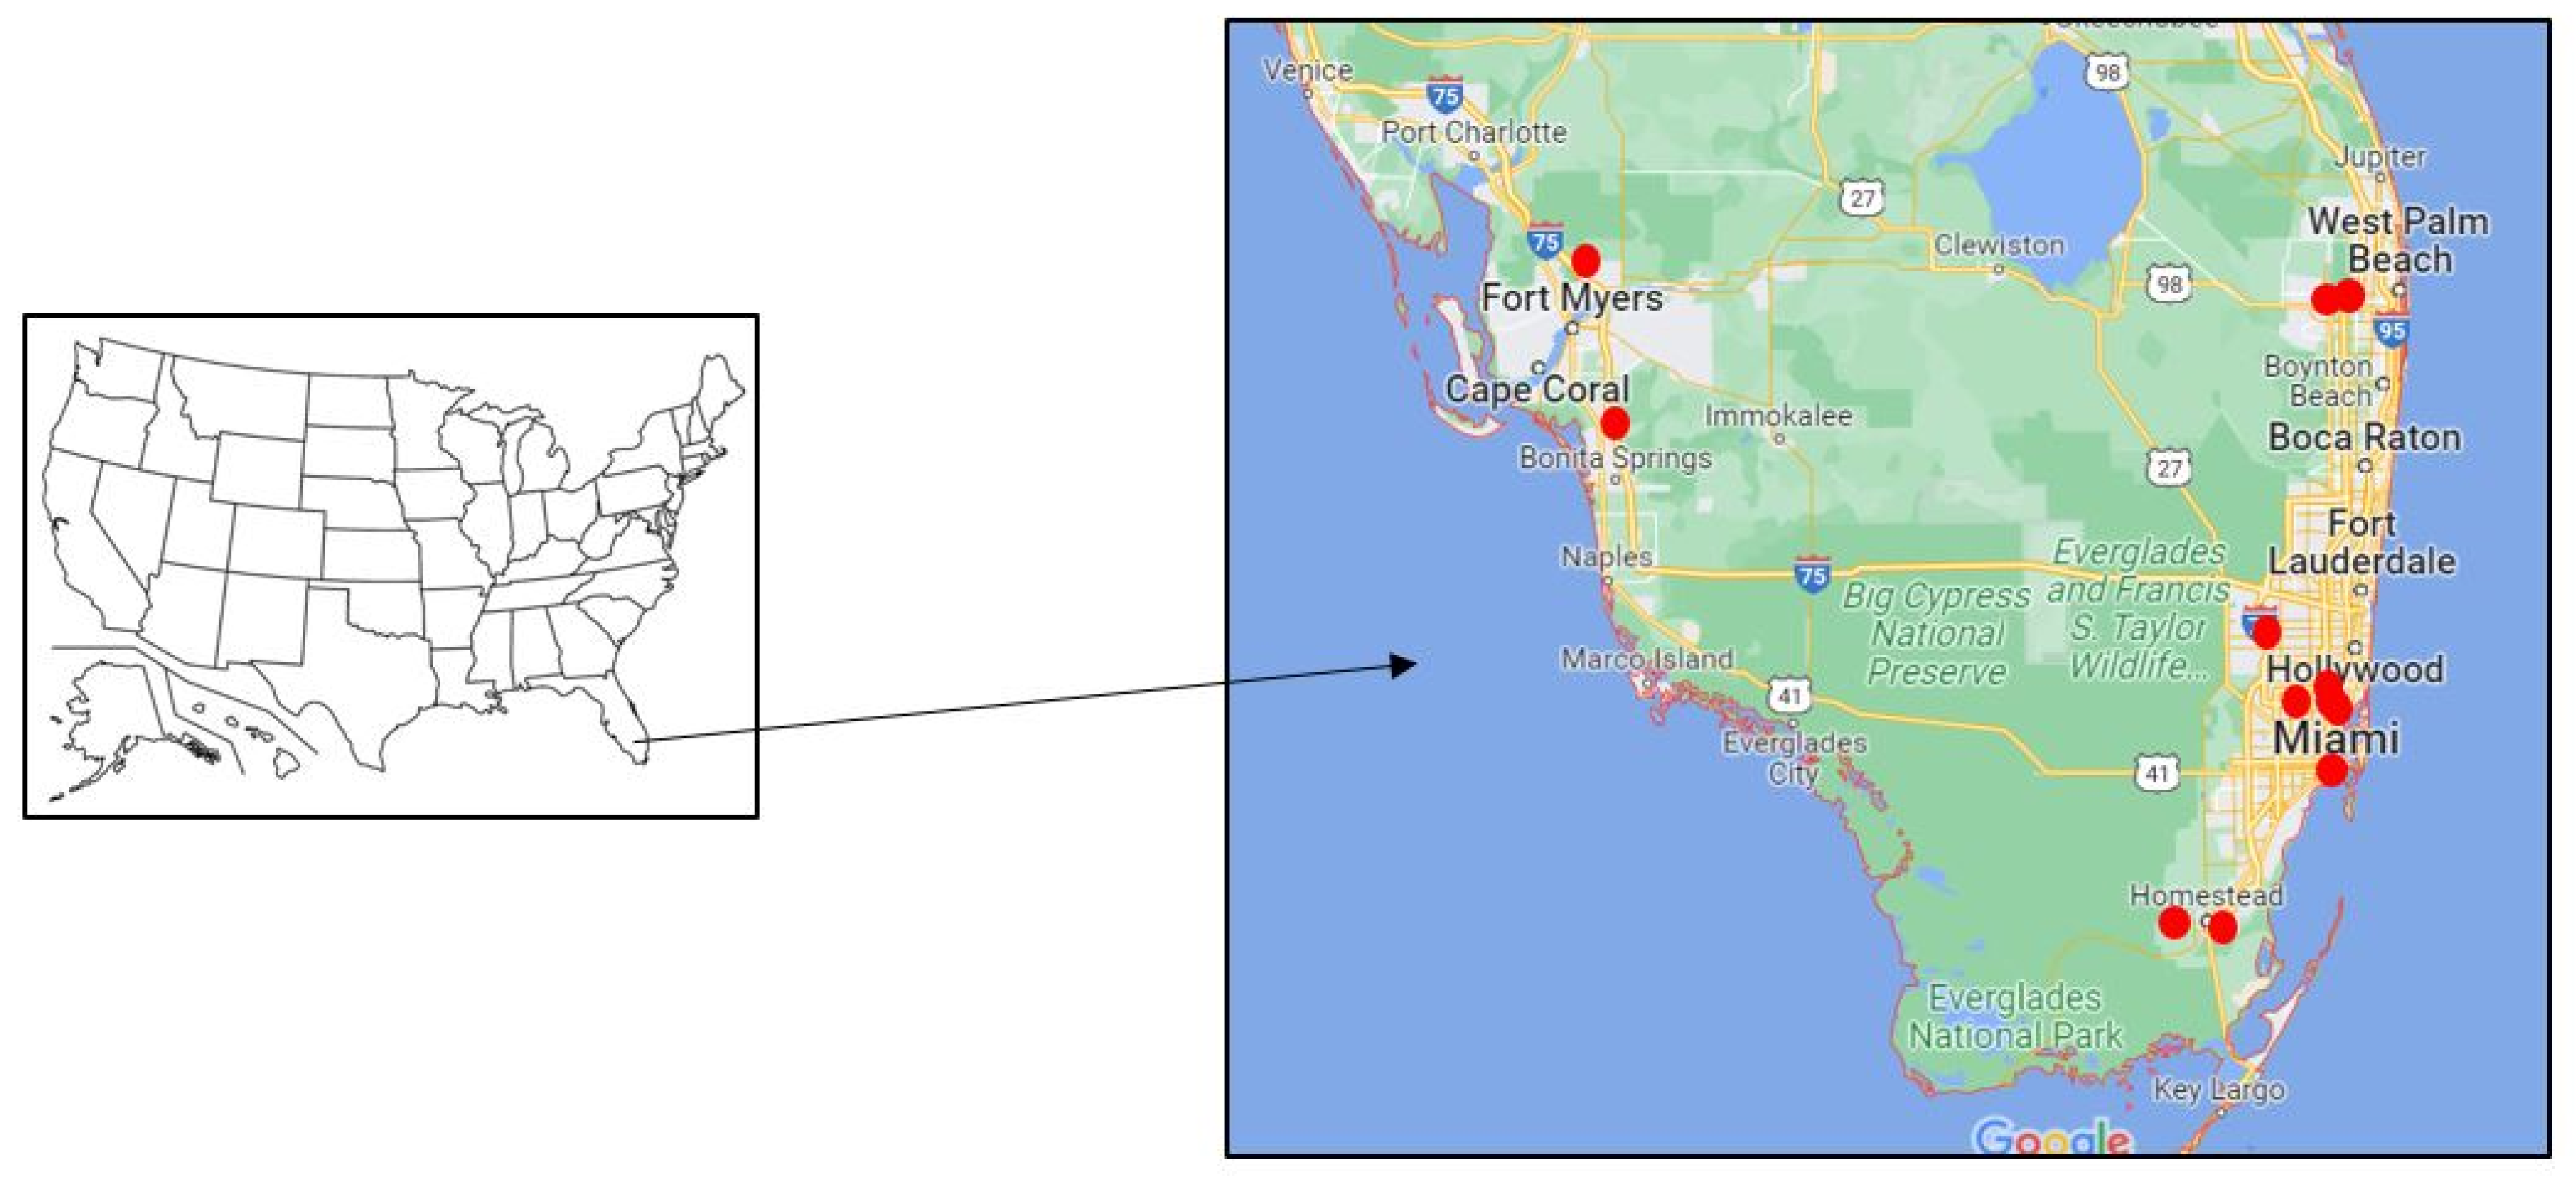
2.1. Study Area
2.2. Identification of PASS Framework Indicators
2.3. Measurement of Indicator Values
2.4. Weights of Indicators
2.5. Data Collection
3. Results
3.1. Ecosystem Indicator Weights
3.2. Ranking According to PASS
3.2.1. Urban Farms
3.2.2. Residential Category
3.2.3. Public Land Area Category
4. Discussion
4.1. Funding
4.2. Complexity and Lack of Measurable Data
4.3. Policy
4.4. Best Practices
4.5. Scaling Up
5. Conclusions
Author Contributions
Funding
Institutional Review Board Statement
Informed Consent Statement
Data Availability Statement
Conflicts of Interest
References
- Millennium Ecosystem Assessment (MA). Ecosystems and Human Well-Being: Synthesis; Island Press: Washington, DC, USA, 2005. [Google Scholar]
- Dale, V.H.; Polasky, S. Measures of the effects of agricultural practices on ecosystem services. Ecol. Econ. 2007, 64, 286–296. [Google Scholar] [CrossRef]
- United Nations. The Millennium Development Goals Report; United Nations: New York, NY, USA, 2014. [Google Scholar]
- Grimm, N.B.; Faeth, S.H.; Golubiewski, N.E.; Redman, C.L.; Wu, J.; Bai, X.; Briggs, J.M. Global change and the Ecology of Cities. Science 2008, 8, 756–760. [Google Scholar] [CrossRef] [PubMed] [Green Version]
- Scialabba, N.; Pacini, C.; Moller, S. Smallholder Ecologies; UN Food and Agriculture Organization: Rome, Italy, 2014. [Google Scholar]
- Altieri, M.A. Agroecology: The science of natural resource management for poor farmers in marginal environments. Agric. Ecosyst. Environ. 2002, 93, 1–24. [Google Scholar] [CrossRef]
- McLain, R.; Poe, M.; Hurley, P.T.; Lecompte-Mastenbrook, J.; Emery, M. Producing edible landscapes in Seattle’s urban forest. Urban For. Urban Green. 2012, 11, 187–194. [Google Scholar] [CrossRef] [Green Version]
- Säumel, I.; Reddy, S.E.; Wachtel, T. Edible City Solutions—One Step Further to Foster Social Resilience through Enhanced Socio-Cultural Ecosystem Services in Cities. Sustainability 2019, 11, 972. [Google Scholar] [CrossRef] [Green Version]
- Caldwell, R.; Hansen, J. Simulation of multiple cropping systems with CropSys. In Systems Approaches for Agricultural Development; Springer: Dordrecht, The Netherlands, 1993; pp. 397–412. [Google Scholar]
- Sarah, T.L. Multifunctional urban agriculture for sustainable land use planning in the united states. Sustainability 2010, 2, 2499. [Google Scholar]
- Fricano, R.; Davis, C. How well is urban agriculture growing in the Southern United States? Trends and issues from the perspective of urban planners regulating urban agriculture. J. Agric. Food Syst. Community Dev. 2020, 9, 31–53. [Google Scholar] [CrossRef] [Green Version]
- Algert, S.; Diekmann, L.; Renvall, M.; Gray, L. Community and home gardens increase vegetable intake and food security of residents in San Jose, California. Calif. Agric. 2016, 70, 77–82. [Google Scholar] [CrossRef] [Green Version]
- Pearson, L.J. Sustainable urban agriculture: Stocktake and opportunities. Int. J. Agric. Sustain. 2010, 8, 7–19. [Google Scholar] [CrossRef]
- Lin, B.B.; Philpott, S.M.; Jha, S. The future of urban agriculture and biodiversity-ecosystem services: Challenges and next steps. Basic Appl. Ecol. 2015, 16, 189. [Google Scholar] [CrossRef]
- Holmgren, D. Permaculture: Principles & Pathways beyond Sustainability; Holmgren Design Services: Hepburn Springs, Australia, 2002. [Google Scholar]
- Ahern, J. Urban landscape sustainability and resilience: The promise and challenges of integrating ecology with urban planning and design. Landsc. Ecol. 2013, 28, 1203. [Google Scholar] [CrossRef]
- Aubry, C. Urban agriculture and land use in cities: An approach with the multi-functionality and sustainability concepts in the case of Antananarivo (Madagascar). Land Use Policy 2012, 29, 429–439. [Google Scholar] [CrossRef]
- Steiner, F. Landscape ecological urbanism: Origins and trajectories. Landsc. Urban Plan. 2011, 100, 333–337. [Google Scholar] [CrossRef]
- Mononen, L.; Auvinen, A.-P.; Ahokumpu, A.-L.; Rönkä, M.; Aarras, N.; Tolvanen, H.; Kamppinen, M.; Viirret, E.; Kumpula, T.; Vihervaara, P. National ecosystem service indicators: Measures of social–ecological sustainability. Ecol. Indic. 2016, 61, 27–37. [Google Scholar] [CrossRef]
- Gliessman, S. Agroecology: The Ecology of Sustainable Food Systems; CRC Press: Boca Raton, FL, USA, 2007. [Google Scholar]
- Lewandowski, I.; Hardtlein, M.; Kaltschmitt, M. Sustainable Crop Production: Definition and Methodological Approach for Assessing and Implementing Sustainability. Crop. Sci. 1999, 39, 184. [Google Scholar] [CrossRef]
- de Olde, E.M.; Oudshoorna, F.W.; Sørensena, C.A.G.; Bokkers, E.A.M.; de Boer, I.J.M. Assessing sustainability at farm-level: Lessons learned from a comparison of tools in practice. Ecol. Indic. 2016, 66, 391–404. [Google Scholar] [CrossRef]
- Van Cauwenbergh, N. SAFE—A hierarchical framework for assessing the sustainability of agricultural systems. Agric. Ecosyst. Environ. 2007, 120, 229–242. [Google Scholar] [CrossRef]
- Sustainable SITES Initiative. In SITES v2 Rating System + Reference Guide; Green Business Certification Inc.: Washington, DC, USA, 2014; Available online: http://www.sustainablesites.org/ (accessed on 1 October 2016).
- Morrow, R. Earth User’s Guide to Permaculture; White River Junction; Chelsea Green Publishing: Hartford, VT, USA, 2006. [Google Scholar]
- Veteto, J.R.; Lockyer, J. Environmental anthropology engaging permaculture: Moving theory and practice toward sustainability. Cult. Agric. 2008, 30, 47–58. [Google Scholar] [CrossRef]
- Gliessman, S. Transforming food systems to sustainability with agroecology. J. Sustain. Agric. 2011, 35, 823–825. [Google Scholar] [CrossRef]
- Wezel, A.; Bellon, S.; Dore, T.; Francis, C.; Vallod, D.; David, C. Agroecology as a science, a movement and a practice. Agron. Sustain. Dev. 2009, 29, 503–515. [Google Scholar] [CrossRef] [Green Version]
- Francis, C.; LIeblein, G.; Gliessman, S.; Breland, T.A.; Creamer, N.; Harwood, L.; Wiedenhoeft, M. Agroecology: The ecology of food systems. J. Sustain. Agric. 2003, 22, 99–118. [Google Scholar] [CrossRef]
- Hodgson, K.; Campbell, M.; Bailkey, M. Urban Agriculture: Growing Healthy, Sustainable Communities (Planning Advisory Service Report No. 563); Routledge: Chicago, IL, USA, 2011; Available online: https://planning-org-uploaded-media.s3.amazonaws.com/publication/book_paperback/PAS-Report-563.pdf (accessed on 15 September 2016).
- Tixier, P.; Bonn, H. Urban horticulture. In Cities Farming for the Future: Urban Agriculture for Green and Productive Cities; Veenhuizeen, R., Ed.; International Institute of Rural Reconstruction & FTC Urban Agriculture: Silang, Philippines, 2006; pp. 315–347. [Google Scholar]
- Scavia, D.; Field, J.C.; Boesch, D.F.; Buddemeier, R.W.; Burkett, V.; Cayan, D.R.; Titus, J.G. Climate change impacts on US coastal and marine ecosystems. Estuaries 2002, 25, 149–164. [Google Scholar] [CrossRef]
- Dolan, A.H.; Walker, I.J. Understanding vulnerability of coastal communities to climate change related risks. J. Coast. Res. 2006, 3, 1316–1323. [Google Scholar] [CrossRef]
- Brown, C.; Bhat, M.G.; Rehage, J.S. Valuing Ecosystem Services under Climate Risk: A Case of Recreation in the Florida Everglades. J. Water Resour. Plan. Manag. 2020, 146, 04020089. [Google Scholar] [CrossRef]
- Raimi, D.; Keyes, A.; Kingdon, K. Florida Climate Outlook Assessing Physical and Economic Impacts through 2040; Report 20-01; Resources for the Future: Washington, DC, USA, 2019; p. 70. Available online: https://media.rff.org/documents/Florida_Climate_Outlook.pdf (accessed on 1 June 2021).
- Gundersen, C.; Dewey, A.; Engelhard, E.; Strayer, M.; Lapinski, L.; Odeen, B.; Krish, M.; Ratulangi, P.; Bertels, A.; Hartman, C. Map the Meal Gap 2020: A Report on County and Congressional District Food Insecurity and County Food Cost in the United States in 2018; Feeding America: Chicago, IL, USA, 2020. [Google Scholar]
- Miami-Dade County. GreenPrint: Our Design for Sustainable Future; Miami Dade County Office: Miami, FL, USA, 2010. Available online: https://www.miamidade.gov/greenprint/pdf/plan (accessed on 15 May 2016).
- Google. Map of the Study Area in South Florida. Available online: https://www.google.com/maps/@25.9275172,-80.5256073,8z (accessed on 1 August 2016).
- Kremen, C.; Iles, A.; Bacon, C.M. Diversified Farming Systems: An agroecological, systems-based alternative to modern industrial agriculture. Ecol. Soc. 2012, 17, 44. [Google Scholar] [CrossRef]
- Malézieux, E. Designing Cropping Systems from Nature. Agron. Sustain. Dev. 2012, 32, 15–29. [Google Scholar] [CrossRef] [Green Version]
- Scholte, S.; van Teeffelen, A.; Verburg, P.H. Integrating socio-cultural perspectives into ecosystem service valuation: A review of concepts and methods. Ecol. Econ. 2015, 114, 67–78. [Google Scholar] [CrossRef]
- Beck, T.; Quigley, M.; Martin, J. Emergy evaluation of food production in urban residential landscapes. Urban Ecosyst. 2001, 5, 187. [Google Scholar] [CrossRef]
- Egoh, B.; Drakou, E.; Dunbar, M.; Maes, J.; Willemen, L. Indicators for Mapping Ecosystem Services: A Review; EUR 25456 EN; JRC73016; Publications Office of the European Union: Luxembourg City, Luxembourg, 2012; p. 113. [Google Scholar]
- Saaty, T.L. The Analytic Hierarchy Process; McGraw Hill International: New York, NY, USA, 1980. [Google Scholar]
- Seleman, A.; Bhat, M.G. Multi-criteria assessment of sanitation technologies in rural Tanzania: Implications for program implementation, health and socio-economic improvements. Technol. Soc. 2016, 46, 70–79. [Google Scholar] [CrossRef]
- Krajnc, D.; Glavic, P. A model for integrated assessment of sustainable development. Resour. Conserv. Recycl. 2005, 43, 189–208. [Google Scholar] [CrossRef]
- Maes, J.; Liquete, C.; Teller, A.; Erhard, M.; Paracchini, M.L.; Barredo JI’ Lavalle, C. An indicator framework for assessing ecosystem services in support of the EU biodiversity strategy to 2020. Ecosyst. Serv. 2016, 17, 14–23. [Google Scholar] [CrossRef] [Green Version]
- Gomez-Baggethun, E.; Ruiz-Perez, M. Economic valuation and the commodification of ecosystem services. Prog. Phys. Geogr. 2011, 35, 613–628. [Google Scholar] [CrossRef] [Green Version]
- Muradian, R.; Rival, L. Between markets and hierarchies: The challenge of governing ecosystem services. Ecosyst. Serv. 2012, 1, 93–100. [Google Scholar] [CrossRef] [Green Version]
- Johnson, R. The Role of Local and Regional Food Systems in U.S. Farm Policy; Congressional Research Service: Washington, DC, USA, 2016; p. 45.
- National Conference of State Legislatures. Urban Agriculture State Legislation. National Conference of State Legislatures. 2019. Available online: https://www.ncsl.org/research/agriculture-and-rural-development/urban-agriculture-state-legislation.aspx (accessed on 24 April 2021).
- Nair, P.K.R.; Nair, V.D.; Kumar, B.M.; Haile, S.G. Soil carbon sequestration in tropical agroforestry systems: A feasibility appraisal. Environ. Sci. Policy 2009, 12, 1099–1111. [Google Scholar] [CrossRef]
- Tang, K.; Kragt, M.E.; Hailu, A.; Ma, C. Carbon farming economics: What have we learned? J. Environ. Manag. 2016, 172, 49–57. [Google Scholar] [CrossRef]
- Bhat, M.G.; McClain, M.; Ombara, D.; Kasanga, W.; Atisa, G. Payment for Watershed Services in the Mara River Basin: Part I—Institutions and Stakeholder Engagement. In Nile River Basin: Ecohydrological Challenges, Climate Change and Hydropolitics; Melesse, A.M., Abtew, W., Setegn, S.G., Eds.; Springer: New York, NY, USA, 2014; pp. 639–665. [Google Scholar]
- Toensmeier, E. The Carbon Farming Solution: A Global Toolkit of Perennial Crops and Regenerative Agriculture Practices for Climate Change Mitigation and Food Security; Chelsea Green Publishing: White River Junction, VT, USA, 2016. [Google Scholar]
- Dorning, M.; Nicholson, M.; Almeida, I. Agriculture Accounts for 10% of U.S. Greenhouse Gas Emissions. Industry Giants and Startups Are Setting up Carbon Credits as Biden’s Green Plan Gains Momentum. Bloomberg Green. 2021. Available online: https://www.bloomberg.com/news/articles/2021-04-20/the-carbon-market-gold-rush-in-american-agriculture (accessed on 25 April 2021).
- López-ridaura, S.; Keulen, H.V.; Ittersum, M.K.; Leffelaar, P.A. Multiscale methodological framework to derive criteria and indicators for sustainability evaluation of peasant natural resource management systems. Environ. Dev. Sustain. 2005, 7, 51–69. [Google Scholar] [CrossRef]
- Amjath-Babu, T.S.; Kaechele, H. Agricultural system transitions in selected Indian states: What do the related indicators say about the underlying biodiversity changes and economic trade-offs? Ecol. Indic. 2015, 57, 171–181. [Google Scholar] [CrossRef]


| Sites | Category | Area | Main Crops | Ownership | Year Established | Location | Primary Goal |
|---|---|---|---|---|---|---|---|
| Muni Farms | Farm | 4.05 ha | Nursery Plants | private | 2012 | Redlands | Nursery Production |
| Guara Ki Eco | Farm | 1.21 ha | Lychees/ Mamey/ Greens | private | 1996 | Homestead | Education |
| Echo Global Farm | Farm | 4.05 ha | Moringa/ Rice/ Sorghum/ Vegetable | ngo | 1981 | Ft. Myers | Education |
| Little Haiti Garden | Farm | 0.20 ha | Arugula/ Kale/ | private | 2008 | Little Haiti | Food Production |
| Treehuggers Farm | Farm | 1.86 ha | Annual Vegetable | private | 2012 | Davie | Food Production |
| Florida Gulf Coast Food Forest | Public | 0.40 ha | Fruits | public | 2011 | Fort Myers | Education |
| Booker T. Washington Food Forest | Public | 743 m2 | Fruits | public | 2015 | Overtown | Education |
| Mounts Botanical | Public | 743 m2 | Annual Vegetable | public | 2004 | West Palm | Education |
| Twin Lakes Food Forest | Public | 1208 m2 | Perennial greens | public | 2011 | Hialeah | Education |
| Earth n Us Farms | Residential | 1.21 ha | Annual Vegetable | private | 1977 | Little Haiti | Residence/ Education |
| Gaia Ma | Residential | 743 m2 | Fruit/Greens | private | 2014 | North Miami | Residence |
| Unbelievable Acres | Residential | 0.81 ha | Fruits | private | 1970 | West Palm | Residence/Education |
| Ecosystem Services Indicators | Sub-Indicators | Unit for Rating | Ideological Bases of Sub-Indicators: 1 SAFE SITES Permaculture (PERM) and/or Agroecology (AGRO) |
|---|---|---|---|
| Provisioning Services | |||
| Food Provision: Cultivation of edible plants harvested and used for human nutrition | diversity of food: maximize use of space and diversity of productive species | 5 species (1 low)—40+ species (5 high) | AGRO |
| quantity of food: (1) internal, (2)market, and (3) restaurant | marginal (1)—maximized (5) | SAFE, SITES | |
| food produced year-round | no (0)—maximized all year (5) | SAFE | |
| local food security needs | all exported (0)—all locally distributed (5) | AGRO | |
| use of available space | 10%–25% (1)—90%–100% (5) | PERM, SITES | |
| Production layers | 1–2 layers (1)—6–7 layers (5) | PERM | |
| Fresh Water Provision: Freshwater available for drinking, irrigation, and other uses | rainwater harvested on site | no methods used (0)—significant portion of water used (5) | AGRO |
| water is recycled on-site | no system in place (0)—all (5) | PERM | |
| aquatic systems are enhanced or restored | none used (0)—methods used to enhance and restore (5) | PERM | |
| micro-irrigation is used to reduce water needs | none (0)—all (5) | SITES | |
| Raw Materials: Other products such as wood for fuel or construction, medicinal plants, forage plants such as mushrooms, oils, and ornamentals | biomass is optimized | minimal (1)—maximized (5) | SITES |
| canopy structure is managed for optimal rates of light transmission | minimal (1)—maximized (5) | AGRO | |
| building energy use is minimized | minimal (1)—maximized (5) | SAFE; SITES | |
| Supporting Services | |||
| Soil Formation: The facilitation of soil formation processes which include chemical weathering of rocks and the transportation and accumulation of inorganic and organic material | soil loss is prevented | no methods used (0)—3–4 methods used (5) | SAFE; PERM; AGRO |
| soil chemical and physical quality is enhanced | no methods used (0)—3–4 methods used (5) | SAFE; AGRO | |
| all organic matter is recycled on-site | none (0)—all (5) | SITES; AGRO | |
| disturbed soils are restored and enhanced | none (0)—all (5) | SITES | |
| Biodiversity: The presence of selected species, groups of species, habitat components, and species composition | Increased biodiversity at the site | low (1)—very high (5) | SAFE; PERM; AGRO |
| diverse habitat in wild places or non-production areas | low (1)—very high (5) | PERM | |
| spatial and temporal diversity | low (1)—very high (5) | AGRO | |
| functional diversity | low (1)—very high (5) | AGRO | |
| genetic diversity | low (1)—very high (5) | SITES; PERM | |
| Nutrient Cycling: The capacity of an ecosystem to prevent the irreversible outputs of elements from the system, and the ability for nutrient and matter cycling | organic matter is utilized on-site | none (0)—all (5) | SITES; AGRO |
| nitrogen fixers | none (0)—maximized (5) | PERM; AGRO | |
| composting | none (0)—maximized (5) | PERM; AGRO | |
| Regulating Services | |||
| Climate Regulation: Long-term carbon storage in aboveground biomass and soil organic matter. Moderation of local climate components such as wind, temperature, and radiation | use of long-lived perennials | 10%–25% (1)—90%–100% (5) | PERM |
| windbreaks are used | none (0)—maximized (5) | SAFE; PERM | |
| microclimates are created | none (0)—maximized (5) | SITES | |
| Air/soil Quality: Capturing and filtering of dust, chemicals, and gases | use of synthetic fertilizers | all nutrient needs (0)—none (5) | PERM; AGRO |
| use of pesticides | all pest control (0)—none (5) | PERM; AGRO | |
| surplus waste is managed on-site | none (0)—all (5) | AGRO | |
| Biological Control/Pollination: Animals and insects that contribute to pollination of plants. The capacity of the ecosystem to control pests and diseases due to genetic variations and the action of predators and parasites | use of crop diversity | 5–10 species (1)—over 50 species (5) | AGRO |
| pest problems are managed | many pest related problems found (1)—little to no pest problems found (5) | SITES | |
| plants present that attract pollinators | 2–3 species (1)—over 10 species (5) | PERM | |
| Water Use/filtration: Maintaining of water cycle features and the capacity of an ecosystem to purify water from sediments, pesticides, microbes, and pathogens | water is preserved through a water management scheme | none (0)—all (5) | AGRO |
| precipitation is managed on site | none (0)—most (5) | SAFE; SITES | |
| water is recycled on site | none (0)—all (5) | PERM | |
| drip irrigation is used | none (0)—all (5) | AGRO | |
| Erosion/Flood Control: Soil retention and the capacity to prevent and mitigate soil erosion and to maintain water cycles features such as natural drainage | soil mass flux is controlled and buffered | some (1)—very prevalent (5) | SAFE |
| vegetation is always present to hold soil in place | in some areas (1)—always (5) | SITES; AGRO | |
| Economic Services | |||
| Economic: Project is economically sustainable overtime and only minimally dependent on subsidies, supporting and contributing to the local economy | dependency on external finances and subsidies | all (1)—none (5) | SAFE; PERM; AGRO |
| project supports local economy | 1–2 ways (1)—5–6 ways (5) | PERM; AGRO | |
| cost of establishment | very high (1)—low (5) | SAFE | |
| cost of maintenance | very high (1)—low (5) | SAFE | |
| Cultural Services | |||
| Recreation and tourism: All forms of leisure and tourism related to the system including tours, volunteer activities, and leisure | number of visitors per year | 0–25 (1)—over 200 (5) | PERM; AGRO |
| number of special events and activities | 1–2 events (1)—6 or more (5) | SITES; PERM | |
| community service/volunteer programs | none (0)—year-round (5) | PERM | |
| Educational activities: The education derived from the system in terms of traditional knowledge and specialist expertise | learning activities and events | 0–5 (1)—over 25 (5) | SITES; PERM |
| site is used as a case study | none (0)—most of the time (5) | SITES | |
| site is monitored for performance | none (0)—most of the time (5) | SITES | |
| Natural and cultural heritage: The maintenance of historically important landscapes and types of land use | cultural and historic value features are enhanced or maintained | none (0)—maximized (5) | PERM |
| natural value features are enhanced or maintained | none (0)—in-depth (5) | PERM | |
| local crop varieties are incorporated | none (0)—all (5) | AGRO | |
| local knowledge and culture is incorporated | none (0)—in-depth (5) | SAFE; STIES; PERM; AGRO | |
| Design aesthetics: The visual and functional quality of the system arrived at by the strategic process of design which influences human well being | pre-design site analysis was conducted | none (0)—in-depth (5) | SITES |
| stakeholders are engaged in design process | primary only (1)—all (5) | SITES | |
| aesthetic considerations | none (0)—in-depth (5) | SITES; PERM | |
| functional considerations | none (0)—in-depth (5) | AGRO | |
| design elements are placed relative to one another with multiple uses in mind | none (0)—all (5) | PERM | |
| Category | Category Weights | ES Indicators | Indicator Weights |
|---|---|---|---|
| Provisioning | 0.25 | Food Provision | 0.50 |
| Fresh Water Provision | 0.30 | ||
| Raw Materials | 0.20 | ||
| Supporting | 0.20 | Soil Formation | 0.25 |
| Biodiversity | 0.50 | ||
| Nutrient Cycling | 0.25 | ||
| Regulating | 0.12 | Climate Regulation | 0.40 |
| Air/Soil Quality | 0.10 | ||
| Biological Control | 0.10 | ||
| Water Regulation | 0.30 | ||
| Erosion/Flood Control | 0.10 | ||
| Economic | 0.13 | Economic | 1.00 |
| Cultural | 0.30 | Physical/Social Activity | 0.20 |
| Educational Activities | 0.40 | ||
| Cultural/Historic Value | 0.20 | ||
| Design | 0.20 |
| ES Category | Urban Farms | Residential Food Gardens | Public Space Farms/Gardens | |||||||||
|---|---|---|---|---|---|---|---|---|---|---|---|---|
| Muni Farms | ECHO | Guara Ki | Tree-Huggers | Little Haiti | Gaia Ma | Earth n Us | U Acres | FGCU | Mounts | Twin Lakes | Booker T. | |
| Provisioning | 2.98 | 3.88 | 3.96 | 4.14 | 3.43 | 3.91 | 2.40 | 2.73 | 3.50 | 2.29 | 3.45 | 3.36 |
| Supporting | 4.11 | 4.55 | 4.34 | 4.56 | 3.67 | 4.60 | 4.12 | 3.88 | 4.49 | 2.41 | 4.55 | 4.01 |
| Regulating | 3.94 | 4.36 | 3.77 | 4.45 | 3.04 | 4.72 | 3.13 | 3.27 | 4.46 | 2.76 | 4.02 | 3.56 |
| Economic | 2.00 | 2.50 | 3.75 | 3.50 | 4.50 | 2.00 | 3.50 | 3.00 | 3.50 | 2.25 | 3.25 | 3.25 |
| Cultural | 3.19 | 4.76 | 3.38 | 4.06 | 3.82 | 3.74 | 3.66 | 3.30 | 4.30 | 2.93 | 4.52 | 3.78 |
| Composite score | 3.30 | 4.23 | 3.84 | 4.20 | 3.72 | 3.78 | 3.09 | 3.02 | 4.11 | 2.32 | 3.70 | 3.67 |
Publisher’s Note: MDPI stays neutral with regard to jurisdictional claims in published maps and institutional affiliations. |
© 2022 by the authors. Licensee MDPI, Basel, Switzerland. This article is an open access article distributed under the terms and conditions of the Creative Commons Attribution (CC BY) license (https://creativecommons.org/licenses/by/4.0/).
Share and Cite
Thiesen, T.; Bhat, M.G.; Liu, H.; Rovira, R. An Ecosystem Service Approach to Assessing Agro-Ecosystems in Urban Landscapes. Land 2022, 11, 469. https://doi.org/10.3390/land11040469
Thiesen T, Bhat MG, Liu H, Rovira R. An Ecosystem Service Approach to Assessing Agro-Ecosystems in Urban Landscapes. Land. 2022; 11(4):469. https://doi.org/10.3390/land11040469
Chicago/Turabian StyleThiesen, Thais, Mahadev G. Bhat, Hong Liu, and Roberto Rovira. 2022. "An Ecosystem Service Approach to Assessing Agro-Ecosystems in Urban Landscapes" Land 11, no. 4: 469. https://doi.org/10.3390/land11040469