
Who Owns the City, and Why Should We Care?


Department of Real Estate and Construction Management, Division of Real Estate Economics and Finance, Royal Institute of Technology (KTH), SE-100 44 Stockholm, Sweden
*
Author to whom correspondence should be addressed.
Land 2022, 11(4), 459; https://doi.org/10.3390/land11040459
Submission received: 1 March 2022
/
Revised: 21 March 2022
/
Accepted: 22 March 2022
/
Published: 24 March 2022
(This article belongs to the Special Issue Cadastre and Land Management in Support of Sustainable Real Estate Markets)
Abstract
:Who owns the city, and why is it important to know? The city constantly makes decisions that affect municipal residents regarding municipal services, land use, and financing. The cost is often linked directly to the municipal residents, but the benefits of some decisions directly affect the property owners and only indirectly affect the municipal residents. On the other hand, the property owners can be residents in the city or the country, but they can also be foreign property owners. Therefore, the distribution of costs will differ from the distribution of benefits. The study aims to investigate and analyse real estate owners in some focus areas in the Stockholm municipality in terms of nationality, patterns of real estate usage, area of properties, and the nature of ownership.
1. Introduction
A municipality makes many decisions each year that affect the municipal residents. Many decisions concern major investments and planning issues, which are often based on maximising the possible benefit for the inhabitants at the lowest cost [1]. The costs must, in most cases, be covered by the municipality’s income from income taxes from the municipal residents, and the benefits often derive from the value of different types of public goods or internalise positive and negative externalities. It can often also be essential to analyse who should bear the costs and who receives the benefits.
Many of the benefits that arise from municipal investment decisions or plan changes will be capitalised in property values. For example, a municipal decision to invest in the city’s parks will create significant benefits for municipal residents in that they can use the parks for rest and recreation, but the benefit will also result in higher property values for nearby properties [2]. Households are affected by the fact that the value of their condominiums will rise as the area develops, or the value of the rental property will increase rents and thus the value of the properties. Many of the properties affected are residential properties, but many are also commercial properties such as those used for offices and retail, as well as municipal properties such as schools.
From a municipal perspective, it is of the utmost importance that the municipality’s decisions and the municipal residents’ finance through income tax are allowed to share in the benefits. This is where the ownership perspective becomes interesting. Increased property values for tenant-owners or increased wellbeing for municipal residents are, of course, a distributional effect that is desirable. On the other hand, increased property values that primarily accrue to property owners who do not live in the municipality may not be the desired effect. The ownership of the properties in a city can be categorised based on whether they are residents in the city or not. Much of the property ownership consists of single-family houses and condominiums, but rental housing and commercial properties have ownership which is sometimes within the municipality but often outside the municipality or even the country. Of course, there may be indirect benefits that make the city attractive to companies wanting to locate their operations there, thus making it attractive for municipal residents to stay in the city and new citizens to move to the city. Regardless, it can be interesting to know who owns the city and thus think about the distributional effects that certain municipal investments bring.
The primary research questions we seek to answer are:
- Who are the real estate owners in terms of nationality in the eight studied focus areas in the Stockholm municipality, including patterns of real estate usage, area, and the nature of ownership?
- Where can we find concentrations in terms of real estate owners by nationality?
- What are the differences between the eight studied regions regarding the owner’s nationality, the usage of the property, the parent company, ownership by type, and area of real estate?
Research on land ownership and real estate are extremely rare in Sweden. Our main contribution is to analyse and study the characteristics of real estate ownership in specific areas with distinct economic, social, and urban characteristics. This research represents a critical step in studying and analysing ownership in the whole city of Stockholm. Based on ownership, we are able to classify property owners by industry, domestic, and foreign ownership, respectively, and whether the companies are public or private. Rather than only examining who owns the properties, we also looked at who owns the companies that own the properties. Some of these companies are large domestic real estate companies found on the stock exchange, while others are family-owned real estate companies with relatively large holdings of properties. The third category of property owners is foreign property owners. Our contribution to studying the distribution of ownership in Stockholm city could aid decision-makers in considering plans and alternatives and understanding the implications of decisions.
The study aims to answer why it is important to analyse who owns the city and how this research can be conducted. A case study in a Western European city, namely Stockholm in Sweden, investigates who owns the properties in order to answer the question, who owns the city? Eight focus areas are identified to investigate differences in ownership structure in central and suburban areas of Stockholm. The selected areas are characterised by distinct structural economic, social, and demographic conditions, in addition to differentiated urban structures.
The article is arranged as follows; Section 2 will present reasons why it is important to analyse who owns the city; Section 3 will present the case study and the areas under investigation. Section 4 will present descriptive statistics regarding ownership in the city and analyse clusters of domestic and foreign ownership in the city. The article concludes with Section 5, which concludes and discusses some relevant policy implications.
2. Theoretical Framework: Why Is It Important to Know Who Owns the City?
Numerous studies and reports sought to answer this question about ‘Who owns the city’ from different perspectives. An early paper is from Monsen (1961), analysing the San Francisco housing market in the 1960s. One of his conclusions is that different types of property owners have a significant effect on the mobility of resources in the property market, which may affect the ability of local authorities to enforce various plans to develop the city [3]. Seyfried and Appelo (1966) found in a later study that properties in the most central parts of the city are primarily owned by large companies and estates. They not only own the most properties but also own those with the highest value. Seyfried and Appelo (1966) believe that this creates a monopoly situation which, at least in the cities they were analysed, keeps rent at a high level. They further believe that there is the least market activity among these owners, but it is primarily the small owners who contribute to the activity in the real estate market. It creates a stagnant market, which can be unfortunate when there is a need for change [4].
As Dixon (2009) states, today’s property stock will be the property stock that we will also have in 50 years, given that perhaps only 1–2 percent of the stock is built each year. He also believes that with globaliation and financial crises, who owns what in the city will be affected. The business cycles will have implications for ownership, even if they are sluggish markets. Dixon further believes that the lack of good and reliable data is crucial if we are to be able to develop policy instruments that are effective and suitable for tackling issues related to the ownership of land and properties [5].
The exception is research that analyses London’s real estate market. The conducted research mainly focuses on who owns the city of London from an office ownership perspective. A high level of foreign ownership and space occupied by non-UK firms raised concerns associated with international financial markets as an indicator of market confidence in the city’s future [6,7,8].
On the other hand, coordination and overall city planning could be complex with no identifiable, beneficial owners or stakeholders due to highly fragmented ownership [8]. Eidelman (2016) argues that much of our knowledge and understanding of how the market for urban development behaves is based on private landowners and property owners. However, much of the land in the urban area is in public ownership, and it is important to analyse the relationship between public land ownership and urban development. In order for this to be possible, “there is no use studying a city unless you first understand who owns the land” [9].
Other studies illustrated the importance of ascertaining who owns the city in order to address the housing shortage and affordability issues. After studying a rental strike in the working-class Toronto neighbourhood of Parkdale, Shilton (2021) concluded that public pension funds are interested in promoting a more positive image than hedge funds and private equity firms because of their institutional link with unions in the public sector [10]. Freemark et al. (2021) examined the ownership patterns of the Minnesota Twin Cities. They found a shift of wealth out of the neighbourhood due to an increase in rental housing ownership from outside investors and a subsequent decrease in single-family homes owned by locals. In other words, billions of dollars of local property value in single-family homes that are now rented and leaked out of the area while costs associated with infrastructure and social impact remain in the same community [11].
Local governance may become more effective if policymakers can draw on the local knowledge necessary for creating customised solutions such as area-based initiatives to a specific area of the city [12]. The identification of city ownership and the composition of different properties associated with it could also provide relevant information to the policymakers and city planners to achieve government objectives for spatial rebalancing.
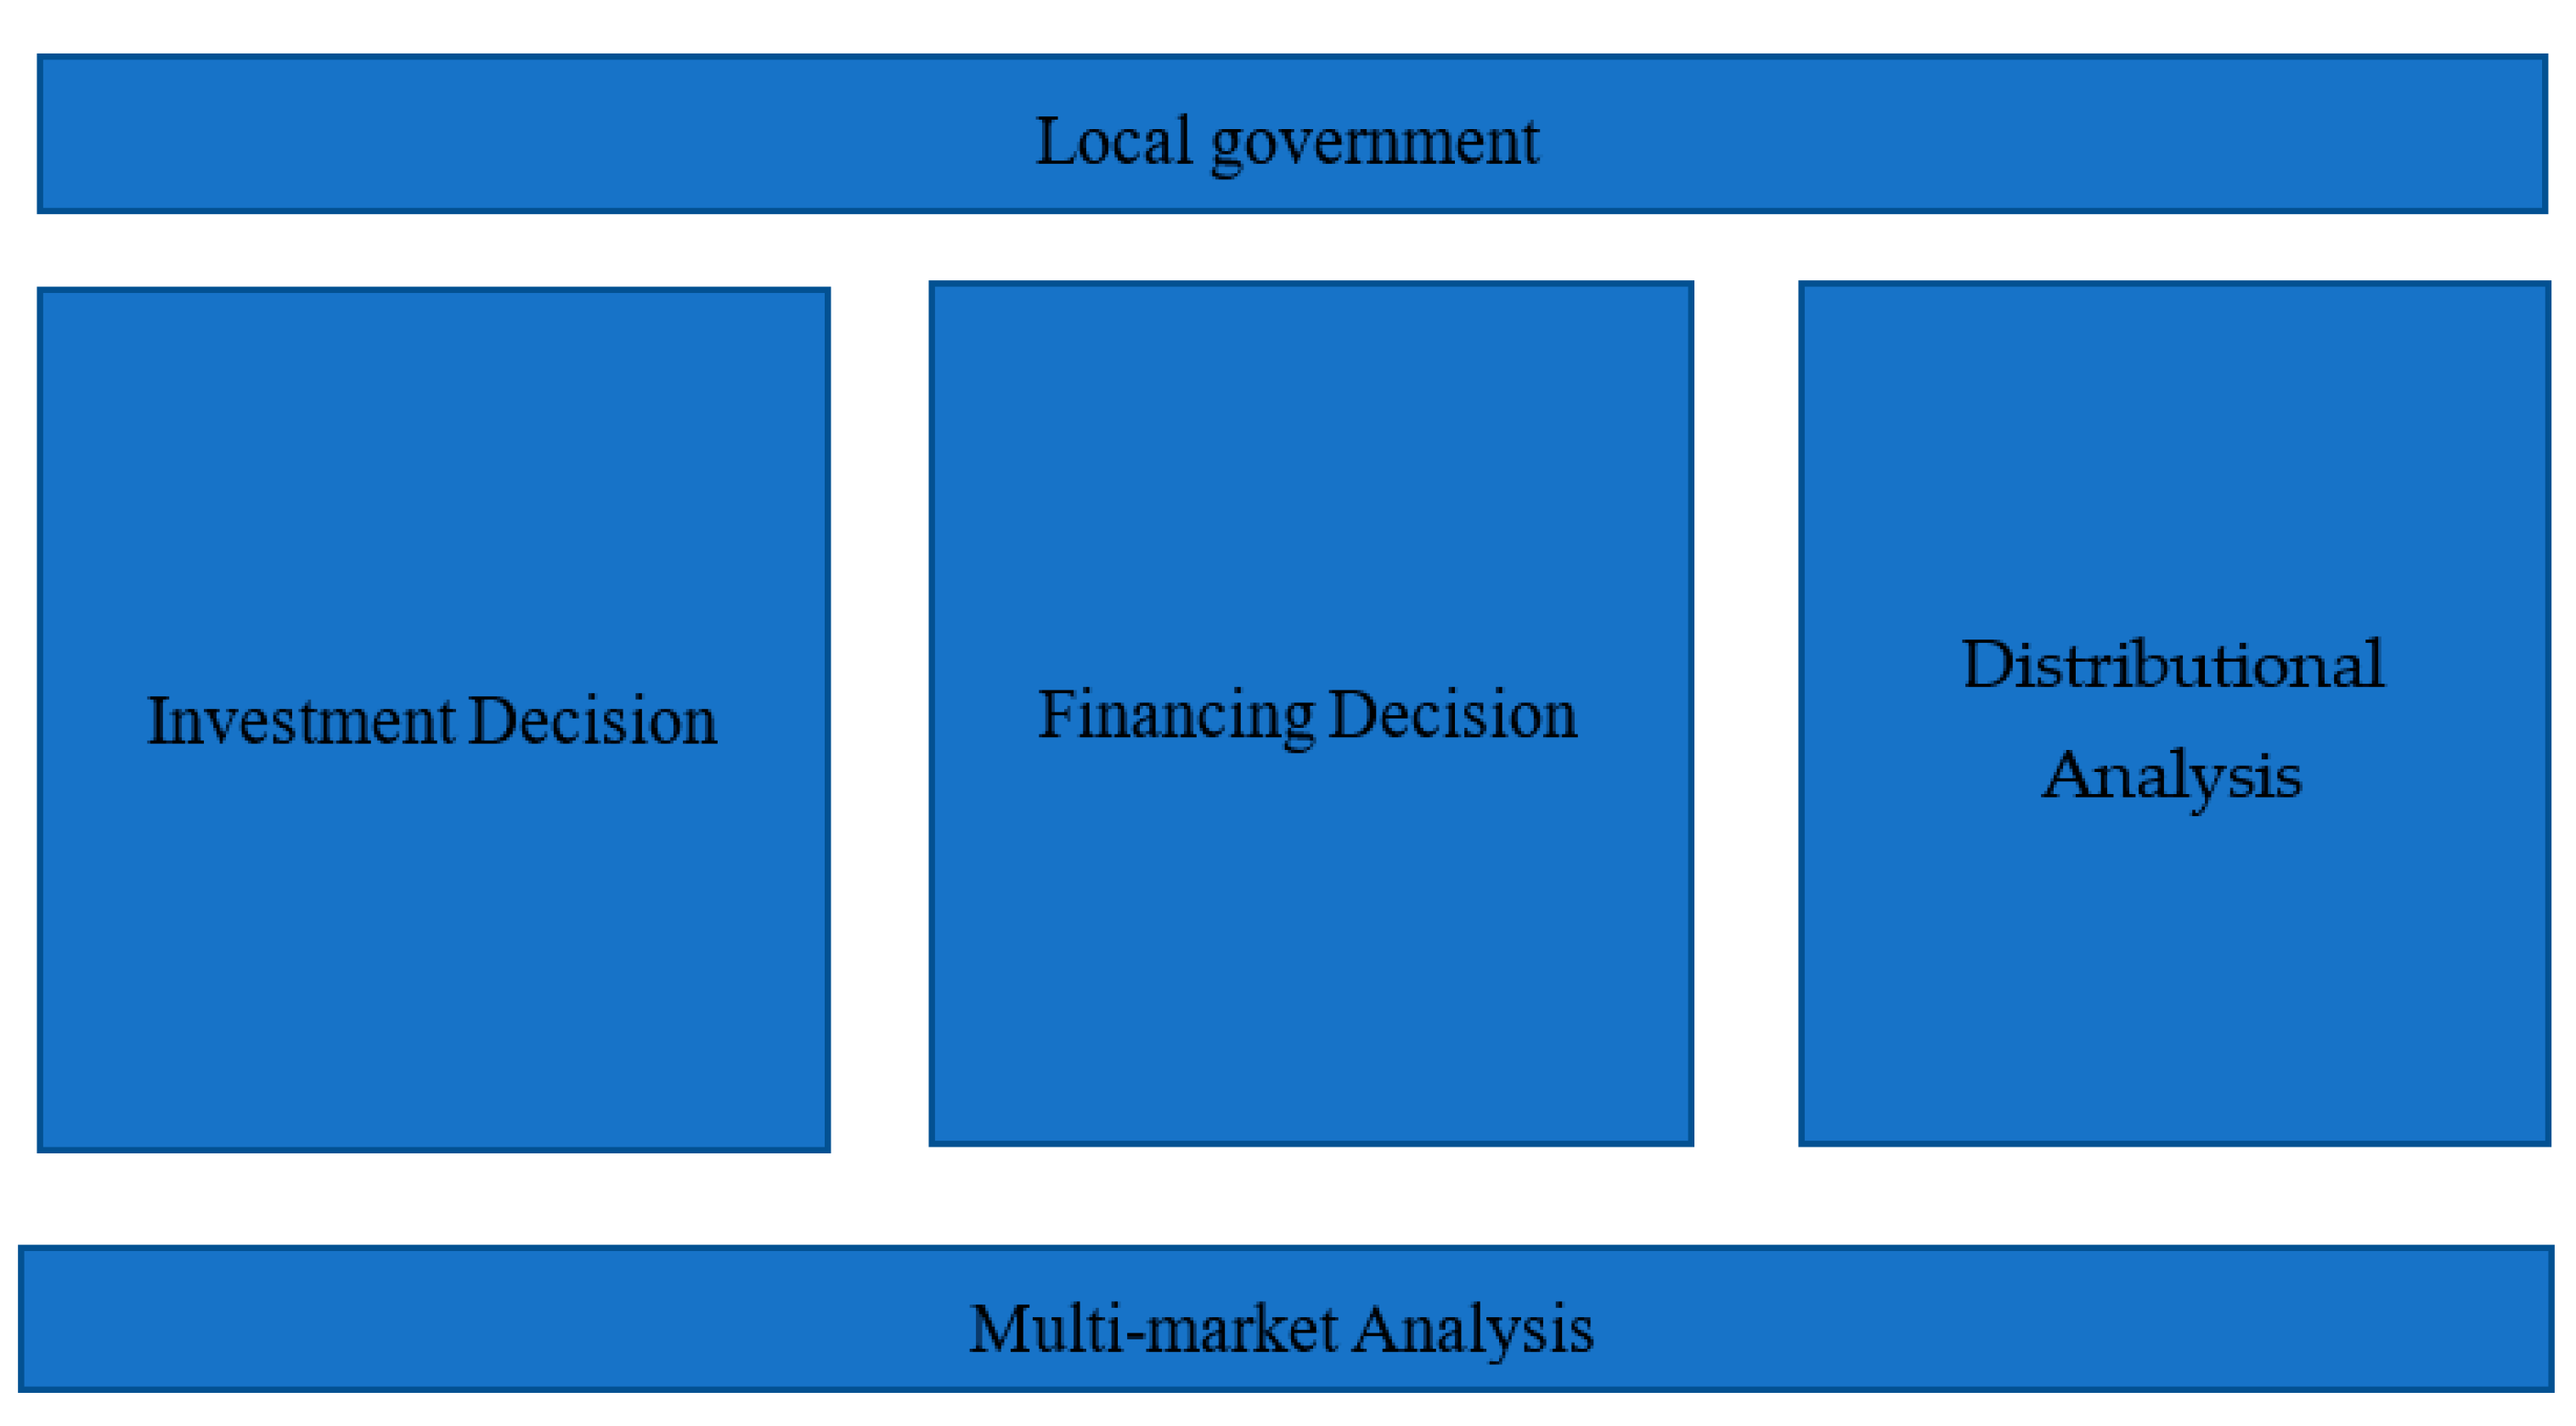
City planning aims to increase the community’s welfare in the development of cities, enabling the local authorities to achieve the largest attainable combination of net benefits compared with the costs of attaining them. The cost–benefit analysis (CBA) method is used to compare and decide which alternative plans or projects will bring the highest welfare returns in relation to the costs attached to each. Costs are the value of goods and services used to produce and operate a project, while the benefits are the value of the services provided. The costs and benefits could be direct and indirect, economic and non-economic, measurable, and non-measurable [13]. CBA was raised after World War II from the research programmes of the RAND Corporation and similar organisations in the field of defence research. CBA is used to conduct main decisions affecting the public interest to aid decision-makers in making the best decisions for the public good [14,15]. There are many reasons to consider and incorporate distributional issues into a cost–benefit analysis. Loomis (2011) classifies these causes partly based on economic theory and partly on a justice or fairness perspective. Figure 1 depict a local government’s conceptual cost and benefits analysis (CBA) [16].
Conceptually, the evaluation of investments by the local authority can be divided into three parts, all of which have effects on each other via direct and indirect effects on the evaluation. Firstly, the local authority has an investment decision where they value benefits against costs; further, they need to evaluate how the investment is to be financed. The third part consists of distributional analysis, where they evaluate who bears costs and benefits in the investment. The choice of financing naturally directly affects the distributional distribution between different stakeholders in the project, which also has benefits. The choice of financing can reinforce a specific distribution of costs and benefits that are either desirable or undesirable based on the social utility function [16,17]. Hettich (1976) analyses the distributional effects when utility functions are independent and promotes a more thorough cost–benefit analysis of distributional effects [18].
2.1. Investment Decision
Societal needs are numerous, whilst the resources necessary to tackle them are limited. One of the primary tasks of local government is to make investment decisions concerning both short and long-term projects that are directly or indirectly beneficial to residents and property owners of the specific municipality. Decision-makers are delegated to determine the most economically feasible project to implement and ascertain who will benefit the most and who will bear the cost of such projects. Municipal investment decisions in most cases concern investments in collective goods or goods with economies of scale, known as “natural monopolies”. It can also refer to reducing negative externalities or creating positive externalities. Without the municipality’s intervention in the market, we will not achieve socio-economic efficiency, i.e., society will not stay at the maximum welfare level. Socio-economic efficiency presupposes three conditions to be met, namely, the efficient production of goods and services, the efficient consumption of goods and services, and an efficient product mix. If these conditions are not met, which they are not, and if, for example, the municipality does not meet local demand for the public good, there is an opportunity for the municipality to make decisions that make the benefits outweigh the socio-economic costs.
An essential part for the municipality in the investment decision is to place socio-economic benefits in relation to the socio-economic costs, which can be carried out with the well-established methodology of cost–benefit analysis. Cost–benefit ratio and net present value calculations are tools often used in establishing the economic ranking of competing projects. Thus, knowledge of property ownership provides extra information that could facilitate the investment decision process since it will be easier to ascertain who will bear the costs and who will benefit from the invested project.
2.2. Financing Decision
Investment and financial decisions go hand in hand since feasible projects cannot succeed without proper allocation of financial resources through tax collection, user fees, the use of financial markets such as bank lending, municipal bonds, or specific public-private partnership arrangements (PPP). Levying taxes, which is a constitutionally protected right, not only provides local governments with financing options but also strengthens their credit rating, subsequently securing lower financing costs [19]. Most Swedish municipalities and regions entered a partnership and created Kommuninvest, which the government owns. In 2013, Gothenburg was the first municipality in the world that issued a green bond. The year after, the Stockholm region was the first region to issue a green bond to finance significant investments in green development projects. At the start of 2020, over 300 projects in more than half of the municipalities and regions were financed with green loans [19]. Projects financed by the local government include, for example, housing, education, public transport, and energy supply, which are mainly public goods associated with positive externalities and benefits beyond the specific municipality that invested. Ascertaining information on the ownership of different properties can facilitate sorting out who bears the costs and who benefits from these public projects financed by the local governments. In other words, it is valuable to carry out a meaningful distributional analysis.
2.3. Distributional Analysis
Scarborough and Bennett (2012) believe that there is an increased need for equity consideration and provided more information on distributional preferences in decision-making. Knowledge of who owns the city is an important piece of information to be able to discuss and analyse the issue in an urban development context [20]. Carrying out municipal inventories requires not only an investment decision but also a decision on financing and possible distributional considerations. Much of the literature discussing distributional analysis and distributional weights are based on which households are affected. It is possible, for example, for the political majority in the municipality to have distributive wishes regarding the city’s decisions.
Distributional consideration means considering who receives the benefits and who pays the cost [21,22]. It can be argued whether it should be conducted at all in a cost–benefit analysis, but the proponents claim that it is an issue that is highly relevant to the authorities. Distributional consequences are in principle taken into account in three different ways, namely, (1) in the cost–benefit analysis, a separate distribution policy analysis is made of costs and benefits that are left to decision-makers to take into account, (2) based on the desired distribution of benefits and costs “social distributional weight” is included, which reflects the policy’s desired distribution, and (3) a post-analysis is made of, for example, how the income distribution looks with the help of, for example, the Gini coefficient.
One trend that continues for many years is homeownership. Goodman and Mayer (2018) believe that homeownership is an important public policy instrument in many countries, but especially in the United States. Of course, there are risks with homeownership, but there are also many financial and economic benefits. Based on who owns the city’s perspective, this means that the more people who own their own housing, the more and different benefits that public interventions generate are also distributed among the tax-paying citizens. From a Swedish perspective, this means that any foreign ownership of rental housing is converted into homeowner apartments [23].
2.4. Multi-Market Analysis
Many different sectors and industries separately and collectively operate in cities and across municipalities. They provide business and services directly or indirectly linked to the projects financed by the local government. A single-market analysis such as property markets might only provide partial insight into cost–benefit analysis, but multi-market analysis that considers labour, consumption, and service sectors could yield more information on income distribution.
3. Data and Methods
Stockholm is the capital and largest city of Sweden, as well as the largest urban area in Scandinavia. Stockholm is Sweden’s leading industrial area, the political, cultural, and economic centre. Stockholm represents the capital of Scandinavia, positioned at the heart of the region, the main centre for multi-national corporate headquarters, and the largest stock market [24]. Stockholm is Sweden’s job and growth engine with the highest region contribution to Sweden’s gross domestic product (GDP) in relation to its population size, with one-third of Sweden’s GDP coming from Stockholm. Approximately 40% of Sweden’s total growth and half of all new jobs are created by the region. Stockholm City is the largest municipality in the region, with more than 700,000 people working in the city [25]. Stockholm has become the first Scandinavian city to enter the top 30 of the Schroders Global Cities Index, ranking as one of the economically strongest cities for global real asset investment. This is due to its strong economy and commitment to reducing its environmental impact [26].
The City of Stockholm is divided into 13 district areas. The district areas are, in turn, divided into 132 areas [27]. The data contain relevant information for the focus areas in the Stockholm municipality. Stockholm City Centre includes Norrmalm, Karlavägen, and Odengatan. The Central Stockholm areas are Hornsgatan and Västra liljeholmen. The North of Stockholm area encompasses Rinkeby and Tensta, while the South of Stockholm studied area is Bagarmossen. The areas in the south and north of Stockholm are primarily residential; these areas in the suburbs of Stockholm were mainly developed in the 1950s and 1960s and are characterised by structural economic, social, and demographic conditions. These areas have the lowest annual income and highest foreign-born population shares, while the central parts are mixed-use areas focusing on the business use of real estate, especially in Stockholm City Centre. The socio-economic and demographic conditions in these areas are different from the suburbs. These areas have the highest annual income and the lowest proportion of people born abroad in Stockholm. These districts represent the main businesses areas of Stockholm. The oldest, most famous, and most expensive areas are located in this region which represents the political, economic, and financial heart of the city of Stockholm.
Dixon (2009) raises the question of why there are relatively few studies regarding the property ownership pattern and addressing the difficulty of obtaining relevant data that is reliable. This question also applies to this project, which is why we attempted to collect data from different parts of the city with slightly different profiles [5].
Data collection includes information on the real estate in the studied areas in 2018, in terms of real estate ownership, such as ownership, owner type (e.g., banks and insurance companies, real estate companies, retail, and private owners), the parent company (name), and nationality (Swedish, International), in addition to the relevant physical data, such as plot size and built area (sqm), primary functions, property designation (name), district (name), and area division (sqm and percentage for residential, office, and industry). The business branch for the main and subsidiary companies are also included to give a better overview of the type of companies investing in the real estate of Stockholm city.
The software used for data handling and analysis is ArcGIS (Geographic Information System) for handling, organising, and analysing the data to generate maps and tables/graphs. We used STATA (statistical software package) for data manipulation and statistics. The selected areas in Stockholm municipality are presented in Figure 2.
3.1. Stockholm City Centre (Norrmalm, Karlavägen, and Odengatan)
The former districts are in the Stockholm City Centre and represent the major business areas of Stockholm. The area has the highest income level and the lowest proportion of people born abroad in Stockholm.
Norrmalm is part of the larger borough of Norrmalm and represents the heart of the region and Sweden’s economic, political, and cultural hub. Norrmalm offers a mixed-use city centre environment, encompassing some of the oldest areas from the 17th century and the “stone city” of the 19th century, in addition to the youngest urban setting and a large amount of space taken up by railway lines. Karlavägen is an esplanade in Stockholm’s inner city; there are some famous buildings along Karlavägen. Odengatan is a major street in Vasastan and Östermalm in central Stockholm [28].
3.2. Central Stockholm (Hornsgatan and Västra Liljeholmen)
Liljeholmen is a district located right on the border of Stockholm’s inner city and includes several of Stockholm’s earliest suburbs, which started to be built in the late 19th century. Hornsgatan is a major street in Södermalm in Stockholm and represents one of the leading business areas in Stockholm [28].
3.3. North of Stockholm (Rinkeby and Tensta)
Rinkeby is a district in the Rinkeby-Kista borough, Stockholm, where the Stockholm municipality is divided into 13 boroughs. The boroughs are subdivided into districts. Tensta is a district in the Spånga-Tensta borough, Stockholm. Both Rinkeby and Tensta were part of the “Million Dwellings Programme”. The programme aimed to build one million new homes in 10 years, between 1965 and 1974, ensuring that everyone could have a home at a reasonable price [29], and is characterised by high-density housing.
Rinkeby-Kista and Spånga-Tensta are areas with the lowest annual income and the highest proportion of foreign-born inhabitants. The percentage of individuals who are foreign-born or have foreign-born parents is considerably higher in Rinkeby-Kista (83%) (the average in Rinkeby sub-district is 91.3% and Spånga-Tensta 60%) than in Stockholm County as a whole (30%) [30,31].
3.4. South of Stockholm (Bagarmossen)
Bagarmossen is located southeast of central Stockholm. Bagarmossen is a district within the Skarpnäck borough of Stockholm. Skarpnäck’s district includes Hammarbyhöjden, Björkhagen, Kärrtorp, Enskededalen, Bagarmossen, and Skarpnäcks gård. Approximately 46,500 inhabitants live in the district. The district’s population is not growing at the same rate as large parts of Stockholm, and the number of inhabitants is estimated to increase by over 1600 people by 2023, corresponding to 3.5%. In terms of socio-economic conditions, Skarpnäck is in many ways similar to the city as a whole. The average income in the area is slightly lower than in the city, as is the percentage of those born abroad, while the percentage of paid workers is slightly higher than in the city. There are considerable differences in living conditions between areas and even greater between different sub-areas within areas. Especially in the Bagarmossen and Skarpnäcks gård area, socio-economic differences between the different areas are evident. The most socially vulnerable areas are located within the district area in these localities.
The number of condominiums of the housing stock is slightly more than the number of rental apartments. Bagarmossen was developed mainly in the 1950s and mainly featured apartment blocks with some point blocks dotted throughout the landscape. In recent years, Bagarmossen saw several new developments. The city is taking a holistic approach to developments in the area through new housing, businesses, services, schools, and sports facilities, maintaining and developing its natural and cultural values [28,30,32].
4. Descriptive Analysis: Who Owns the City?
We argue that it is also important to analyse who can reap the benefits of the investment decision in the form of who owns the city. Many investment decisions capitalise on higher rents and prices in the real estate market. Some of these affected properties are owned by citizens of the city, while other properties are owned by non-regional companies, which can be seen as a leak in the distribution of who can use the benefits and who bears the costs. The importance of analysing who owns the city can thus not be underestimated. The following sections are intended to provide a picture of the ownership of the city within some areas in the city.
4.1. The Real Estate Owners in All Areas
This section examines and studies the owner type (usage of real estate) and area of properties according to the owner nationality, where we categorise owner nationality into Swedish owners and non-Swedish owners.
4.1.1. Swedish Owners
Table 1 describe the owner types for Swedish owners for the studied areas in the Stockholm municipality. As shown in Table 1, 875 properties represent 31.4% of tenant-owner associations (bostadsrättsförening), often abbreviated to BRF, an economic association of the cooperative type; the associations’ purpose is to lease apartments in the association’s apartment buildings, or entire single-family houses, with tenant-ownership. Its task is to safeguard the members’ financial interests by providing apartments for a fee without time restrictions. In total, 650 properties (or 23%) are primarily single-family homes owned by private individuals. Around 14% are owned by real estate companies, numbering 379 properties. Some of them are residential rental multi-family houses, and some of them are commercial real estate used for offices, retail, and hotels. The real estate usage in the financial and industry sectors is 181 and 107, respectively, representing around 10%. The last three categories of residential make up around 70% of the real estate owned by the Swedish in the studied areas in Stockholm. While the rest of the property’s usage, as illustrated in Table 1, represents approximately 30%.
Table 2 present the descriptive statistics for the area measured in square meters (sqm) owned by Swedish households or companies. The land area owned by Swedish interests in the focus areas in Stockholm is 5.2 million sqm, with an average of 1868 sqm. The sum of the area allocated for offices is 4.2 million sqm, with an average of 1502 sqm, and the sum of the residential area is around 4.1 million sqm, with an average of 1483 sqm. The lowest area allocated for industry activities is around 51 thousand sqm, with an average of 18 sqm.
Who owns the city’s property is critical for the analysis of whether the intention is to make a social cost–benefit analysis or to analyse the distributional effects of public investment in a municipality. Table 3 demonstrate the 15 biggest Swedish companies that own real estate in Stockholm, where the total number of properties owned by these companies is 288. The land area is around 880 thousand sqm. Unsurprisingly the total square meters of residential and office space is much more than the land area. The focus and interest of these companies are commercial activities, where the sum of the area allocated for offices is more than 2 million sqm. The sum of the residential area is around 300 thousand sqm, while the area allocated for industry activities is only 117 sqm. So, the question is, who are these owners of commercial space? Some of the companies are based in Stockholm and are owned by a large number of owners, while other companies are private and owned by a small group of owners.
Olov Lindgren AB owns the most properties in the focus areas. Although they own many properties, their ownership is relatively limited in size, concentrating on residential properties and a relatively high proportion of office space. Olov Lindgren AB is a family-owned real estate company founded in 1938 that today owns 113 properties in Stockholm. Another privately owned real estate company that owns many properties in the survey area is Einar Mattson AB, with a total area corresponding to Olov Lindgren AB, but they have a more apparent concentration on residential properties. Compactor AB is an owner company that invests in real estate through its subsidiaries. One of its subsidiaries is Fastpartner AB, which Compactor AB owns 70 percent of, listed on the Nasdaq Stockholm stock exchange. Compactor Fastigheter AB is family-owned, and most of the ownership consists of office properties. Albert Bonnier AB is a family-owned company that does not have properties as its primary focus but is a media company that primarily owns properties with office space, i.e., they manage properties for their operations. Hence, municipal investments that affect the property values of these property owners will partly be enjoyed by private owners, even if the investments also benefit their tenants. HSB, on the other hand, is a non-profit economic association that mainly owns residential properties. They are owned by their members, who currently number more than 600,000. Hence, most of the benefit from a municipal investment will benefit the residents in the municipality.
L E Lundbergsföretagen AB is a previously family-owned private company that is now part of the investment company Industrivärlden and listed on the Nasdaq Stockholm stock exchange. In the focus area, Lundbergsföretagen AB is significantly larger than the previously mentioned companies, but their niche is entirely office properties. Fabege AB and Humlegården AB are two real estate companies listed on the Nasdaq Stockholm stock exchange, and both companies focus on office properties.
There are also some banks (Skandinaviska Enskilda Banken) and insurance companies (Folksam, AFA and AMF) with relatively large holdings in areas close to the city. These companies mainly own office properties, owning both the buildings and the land. For example, AMF is the third-largest owner of office space in Stockholm’s inner city.
The largest real estate company in the survey area and the largest real estate company in Sweden is Vasakronan AB. The company is a public limited company owned by the Swedish pension system, which means that municipal investments that increase property values go back to the public via the pension system. The Swedish Property Agency and the Government Offices are two exceptions in the list of largest owners.
4.1.2. Non-Swedish Owners
Table 4 demonstrate the nationality of Non-Swedish owners for real estate in the studied areas in Stockholm municipality.
The biggest owner group is companies located in Luxembourg/Cayman Islands, with 21 pieces of real estate representing around 28% of foreign-own properties. The type of ownership for all 21 properties is a land lease. Regarding the other nationalities, the most are ownership, representing 71%, while around 29% is a land lease. The focus is housing activities, where the total residential area is around 420,000 sqm. The joint secondbiggest groups are companies from Luxembourg and The Netherlands, with 13 properties each. The focus of these companies is commercial activities, where the total area allocated to offices is 176,000 sqm and 89,000 sqm, respectively. The third biggest group is Norwegian companies, with nine properties representing around 12%. The total land area is around 34,000 sqm, and the highest proportion is allocated to commercial activities, where the total area allocated to offices is 173,000 sqm. The last big group of non-Swedish owners is Germany, with four properties representing around 5%. The rest of the non-Swedish companies own one to two properties, as demonstrated in Table 4.
Five properties are used as Embassies, and international organisations represent around 7%. Property usage for real estate activities is five properties representing around 7%. Banking, finance, and insurance comprise three properties with 4%, and the two properties used for law, finance, and consultancy services represent around 3%.
Table 5 present the descriptive statistics for the area of sqm owned by non-Swedes. The total land under foreign/non-Swedish ownership is approximately 288,000 sqm. Most of the uses of real estate under non-Swedish ownership are for commercial activities, where the total office space is 586,000 sqm, averaging around 8000 sqm. At the same time, the sum of residential properties is 430,000 sqm, with an average of around 6000 sqm. The lowest area of properties is allocated to industry activities: around 15,000 sqm, with an average of 200 sqm.
4.2. Ownership in the Different Focus Areas
This section will examine ownership in the studied focus areas in the Stockholm municipality in terms of ownership by type, owner nationality, parent companies, and real estate area.
4.2.1. Swedish Owners
Table 6 describe the owner type for Swedish owners for the studied areas in the Stockholm municipality, where we categorise the studied areas into four regions: Stockholm City Centre-North (Norrmalm, Karlavägen, and Odengatan), Stockholm City Centre-South (Hornsgatan, and Västra Liljeholmen), North of Stockholm (Rinkeby and Tensta), and South of Stockholm (Bagarmossen). Given the overlap of these areas, we analyse these areas together as having similar economic, social, demographic, and urban characteristics.
Table 6 show that 495 properties under Swedish ownership in Stockholm City Centre-North are tenant-owner associations (BRF), representing 40%. Real estate used in banking, finance, and insurance activities number 151, representing 12% of properties under Swedish ownership. Industry and professional organisation properties number 84, representing around 7%; this region is considered the main financial and economic centre of the Stockholm region and Sweden. Around 7% of properties are education institutes, where the owner is the Stockholm municipality, consisting of 82 properties. Regarding the ownership by type, approximately 90% of the real estate in this central area is owned, while around 10% is land leases.
Stockholm City Centre-South (Hornsgatan, and Västra Liljeholmen) includes 331 properties, representing around 48%, which are tenant-owner associations (BRF); 146 properties are education institutes, where the owner is Stockholm municipality, and represents 21%; 48 of real estate is owned by Swedish private persons, representing 7%; 40 real estates used in the financial and economic sector represent 6%. Approximately 78% of the real estate in the central area of Stockholm is under ownership, while around 22% is land leases.
North of Stockholm (Rinkeby and Tensta). As Table 6 show, 134 properties under Swedish ownership are owned by private persons, representing around 41%; 109 properties are education institutes, where the owner is Stockholm municipality representing 33%; 47 properties are owned by real estate companies representing around 14%.
South of Stockholm (Bagarmossen), 410 properties under Swedish ownership in Bagarmossen are private persons, representing 77%. Around 14% of properties are education institutes, where the owner is Stockholm municipality with 72 properties. In comparison, 25 properties are tenant-owner associations (BRF), representing 5%.
Table 7 present the descriptive statistics for the area of sqm under Swedish ownership in the studied regions. The most use of real estate in Stockholm City Centre (Norrmalm, Karlavägen, and Odengatan) is for economic, finance, and commercial activities, where the sum of the area allocated for offices is more than 3.5 million sqm. This is because Stockholm City Centre is the primary business area of Stockholm. Approximately 1.5 million sqm of properties under Swedish ownership in the central part of Stockholm (Hornsgatan and Västra Liljeholmen) are allocated for residential use. The area used for commercial activities is 444,000 sqm. The total land in the North of Stockholm (Rinkeby and Tensta) is 1.26 million sqm. The most prevalent use of properties is residential, where the total area for residential use is around 1 million sqm.
In comparison, the total office area is 134,000 sqm. The total land area in the South of Stockholm (Bagarmossen) is 861,000 sqm. The total residential area is 340,000 sqm, which represents the primary use of real estate compared to commercial and industrial use of properties under Swedish ownership, 56,000 sqm and 3700 sqm, respectively.
4.2.2. Non-Swedish Owners
The highest portion of properties owned by foreigners is in Stockholm City Centre (Norrmalm, Karlavägen, and Odengatan), with 48 properties representing 63% of all foreign properties in the studied regions. Most of these properties are embassies, international organisations, and properties used in the business sector, where the sum of the area used for business activities is about half a million sqm, as demonstrated in Table 8. Regarding ownership by type, 73% of the properties are owned by foreigners in this central area, and around 27% is a land lease. In comparison, there are no properties owned by foreigners in the South of Stockholm (Bagarmossen).
As Table 8 show, there are six properties in Stockholm City Centre-South (Hornsgatan and Västra Liljeholmen). Most of these properties are used for business services. The total area used for business activities is 62 thousand sqm, and for industrial is about 14 thousand sqm. Most properties are under ownership rather than land lease.
There are 22 pieces of real estate with non-Swedish owners in the North of Stockholm (Rinkeby and Tensta). The owner’s nationality for 21 of them are Luxembourg/Cayman Islands, and the parent company is BREP INVESTMENT 8NQ LP, the owner type unspecified. While one property belongs to a Kuwaiti owner, the owner type is wholesale, and the parent company is OK-Q8 AB. The type of ownership for all properties is land lease. The focus of foreign owners in this region is residential activities, where the residential area is about 421,000 sqm. At the same time, the total office and industrial areas were 26,000 sqm and 1400 sqm, respectively.
5. Discussion and Conclusions
This essay analyses who owns the city and why it is important to know the owner. There are many reasons why it is essential to know who owns the properties in a city, and most of these are important from a local governance perspective.
In the municipality, decisions are made on everything regarding overall visions and plans on how the city should grow and develop to individual building decisions. Many of the municipality’s investment decisions are about providing public goods, strengthening positive externalities, and reducing the effect of negative externalities. Of course, much of the municipality’s investments have economies of scale, contributing to natural monopolies. Investment decisions are often made by comparing the socio-economic benefits of the investment to its costs. The municipality is also often interested in how these benefits and costs are distributed among the municipal residents. From a municipal perspective, the ownership of the properties can be regarded as a leakage; as many of the benefits fall outside the municipality’s boundaries, the ownership of the properties is outside the municipality or even outside the country.
Thus, it is essential to know who owns the properties. Investments where the municipal residents bear the costs but where the benefits primarily accrue to the property owners may be less attractive than investments where the benefits primarily accrue to local property owners. Thus, it may be of interest to the municipality to weigh the distribution of both benefits and costs to obtain a more detailed analysis of what an investment entails.
This case study in Stockholm, Sweden, shows that typical residential areas benefit many residents, while properties are significantly more varied in more central areas. The more central the area, the more mixed-use the properties. One effect of relatively dispersed ownership in the city is that it limits the mobility of resources [3] and that it can complicate and make the work with city plans more complex [8].
Two features associated with properties located in the study area are the type of ownership and the size of a specific property. Only 20 percent of properties owned by Swedish companies are lease types, while the remaining are ownership types. For non-Swedish owners, the ownership type is almost equal for both types. Olov Lindgren AB is a Swedish company that owns the most properties in the focus area, comprising residential and office spaces, but they are relatively limited in size. Luxemburg/Cayman Islands owns around 28% of the foreign-owned properties in the study area, and all their properties are land lease types. Other foreign owners with two or more properties are mainly from European countries such as The Netherlands, Luxemburg, Norway, Germany, Denmark, and Finland. The relatively limited foreign ownership may signal that Stockholm’s real estate market is weaker from an international perspective [6,8].
Properties owned by tenant-owner associations (BRF) dominate Stockholm City Centre (40% north and 48% south) whilst single-family houses are dominant in the North and South of Stockholm (41% and 77%, respectively). Most foreign-owned properties host embassies and international organisations located in Stockholm City Centre.
Areas with many rental apartments and office properties can mean that the benefits go to those outside the municipality. For instance, foreign-owned residential properties are dominant in the North of Stockholm (Rinkeby and Tensta), where a single non-Swedish company owns 21 properties. There could be a leakage of benefits to residents outside the municipality in this case. The majority of the cost of infrastructure projects in the municipality that is essential to the owners of the residential property remains within the municipality. Conversely, there are no foreign-owned properties in the South of Stockholm.
In conclusion, there are clear patterns of ownership and types of properties in the studied area that could shed light on how investment and financing decisions made by local governments are essential in achieving desirable distributional and socio-economic effects.
Real estate ownership and property usage are expected to change over time. We did not consider different periods and the possibility that specific properties could be converted to other types of usage, such as from office to apartment or from rental to tenant-owner association. Further study that considers these possible conversions and covers several years is needed.
Author Contributions
Conceptualisation, M.W.; methodology, M.I., A.W. and M.W.; formal analysis, M.I., A.W. and M.W.; writing—original draft preparation, M.I., A.W. and M.W.; writing—review and editing, A.W. and M.W. All authors have read and agreed to the published version of the manuscript.
Funding
This research was funded by the Center of Future Places and financially supported by Research Project Housing 2.0 (Bostad 2.0).
Institutional Review Board Statement
Not applicable.
Informed Consent Statement
Not applicable.
Data Availability Statement
The sources for the data used in the research are provided by the Center of Future Places.
Acknowledgments
Thanks are due to Tigran Haas and the Center of Future Places for funding and data for the project. Thanks are also extended to the research project Housing 2.0 (Bostad 2.0) for financial support.
Conflicts of Interest
The authors declare no conflict of interest.
References
- European Commission. Guide to Cost-Benefit Analysis of Investment Projects: Economic Appraisal Tool for Cohesion Policy 2014–2020; European Commission: Luxembourg, 2015; ISBN 9789279347962. [Google Scholar]
- Iqbal, A.; Wilhelmsson, M. Park proximity, crime and apartment prices. Int. J. Hous. Mark. Anal. 2018, 11, 669–686. [Google Scholar] [CrossRef] [Green Version]
- Monsen, R.J. Who Owns the City?: Data and Implications from San Francisco Experience. Land Econ. 1961, 37, 174–178. [Google Scholar] [CrossRef]
- Seyfried, W.R.; Appelo, B.A. Land Tenure in the Central Business District. Land Econ. 1966, 42, 171–178. [Google Scholar] [CrossRef]
- Dixon, T. Urban land and property ownership patterns in the UK: Trends and forces for change. Land Use Policy 2009, 26, 543–553. [Google Scholar] [CrossRef]
- Lizieri, C.; Baum, A.; Scott, P. Ownership, occupation and risk: A view of the City of London office market. Urban Stud. 2000, 37, 1109–1129. [Google Scholar] [CrossRef]
- Lizieri, C.; Oughton, M.; Baum, A. Who Owns the City 2001? An Examination of Office Ownership in the City Of London; The University of Reading: Reading, UK, 2001; pp. 1–35. [Google Scholar]
- Lizieri, C.; Reinert, J.; Baum, A. Who Owns the City 2011 Change and Global Ownership of City of London Offices; University of Cambridge: Cambridge, UK, 2011; pp. 1–35. [Google Scholar]
- Eidelman, G. Rethinking public land ownership and urban development: A Canadian perspective. Cities 2016, 55, 122–126. [Google Scholar] [CrossRef]
- Shilton, J. Who Owns the City? Pension Fund Capitalism and the Parkdale Rent Strike. J. Law Soc. Policy 2021, 35, 1–20. [Google Scholar]
- Freemark, Y.; Noble, E.; Su, Y. Who Owns the Twin Cities? An Analysis of Racialized Ownership Trends in Hennepin and Ramsey Counties; Urban Institute: Washington, DC, USA, 2021; pp. 1–42. [Google Scholar]
- Cheshire, P.C.; Nathan, M.; Overman, H.G. Urban Economics and Urban Policy: Challenging Conventional Policy Wisdom; Edward Elgar Publishing: Cheltenham, UK, 2014; pp. 1–256. [Google Scholar]
- Lichfield, N. Cost-Benefit Analysis in City Planning. J. Am. Inst. Plan. 1960, 26, 273–279. [Google Scholar] [CrossRef]
- Schofield, J. Cost-Benefit Analysis in Urban and Regional Planning; Taylor&Francis Group: Abingdon, UK, 1987; pp. 1–270. [Google Scholar] [CrossRef]
- Misuraca, P. The Effectiveness of a Costs and Benefits Analysis in Making Federal Government Decisions: A Literature Review; Defense Technical Information Center: Fort Belvoir, VA, USA, 2014; pp. 1–10.
- Loomis, J.B. Incorporating Distributional Issues into Benefit Cost Analysis: Why, How, and Two Empirical Examples Using Non-market Valuation. J. Benefit-Cost Anal. 2011, 2, 1–24. [Google Scholar] [CrossRef] [Green Version]
- Ebert, U. Equity and distribution in cost-benefit analysis. J. Econ. 1986, 46, 67–78. [Google Scholar] [CrossRef]
- Hettich, W. Distribution in benefit-cost analysis: A review of theoretical issues. Public Finan. Q. 1976, 4, 123–150. [Google Scholar] [CrossRef]
- Kommuninvest. Local Government Debt; Springer: Berlin/Heidelberg, Germany, 2020; pp. 1–22. [CrossRef]
- Scarborough, H.; Bennett, J. Cost-Benefit Analysis and Distributional Prefrences; Edward Elgar Publishing, Inc.: Cheltenham, UK, 2012; pp. 1–136. ISBN 1359-6454. [Google Scholar]
- Mishan, E.J. Cost-Benefit Analysis: An Informal Introduction; Allen & Unwin: London, UK, 1975; pp. 1–528. [Google Scholar]
- Stiglitz, J. Economics of the Public Sector; W. W. Norton & Company: New York, NY, USA, 2000; pp. 1–823. [Google Scholar]
- Goodman, L.S.; Mayer, C. Homeownership and the American dream. J. Econ. Perspect. 2018, 32, 31–58. [Google Scholar] [CrossRef] [Green Version]
- Griffiths, T. Stockholm A Cultural History; Oxford University Press, Inc.: New York, NY, USA, 2009; ISBN1 978-0-19-538637-0. ISBN2 0987-0-19-538638-7. [Google Scholar]
- Stockholm Business Region. Annual Report 2020; Stockholm Business Region: Stockholm Stad, Sweden, 2021; pp. 1–28. [Google Scholar]
- Walker, T. Stockholm Enters Global Cities Top 30 for the First Time. City A.M 2020. Available online: https://www.cityam.com/stockholm-in-global-cities-top-30-for-the-first-time/ (accessed on 17 February 2022).
- Stockholm Stad. 2022. Available online: https://start.stockholm/om-stockholms-stad/utredningar-statistik-och-fakta/statistik/omradesfakta/ (accessed on 17 February 2022).
- The City Planning Administration. Stockholm City Plan: Stockholm Stad; The City Planning Administration: Stockholm Stad, Sweden, 2018; pp. 1–86.
- Ismail, M.; Warsame, A.; Wilhelmsson, M. Do segregated housing markets have a spillover effect on housing prices in nearby residential areas? J. Eur. Real Estate Res. 2021, 14, 171–188. [Google Scholar] [CrossRef]
- Stockholm Stad. 2021. Available online: https://start.stockholm/ (accessed on 21 May 2021).
- Sigurjónsdóttir, H.R.; Sigvardsson, D.; Oliveira e Costa, S. Who Is Left Behind? The Impact of Place on the Possibility to follow COVID-19 Restrictions; Nordic Co-operation: Copenhagen, Dermark, 2021; pp. 1–59. [Google Scholar] [CrossRef]
- Skarpnäcks District Committee; Skarpnäcks Stadsdelsnämnd: Stockholm Stad, Sweden, 2021; pp. 1–60.
Figure 1.
Cost and benefit analysis (CBA) for a municipality.

Figure 2.
Focus areas in Stockholm City.


Table 1.
Owner type for Swedish owners in Stockholm.
| Owner Type | Frequency | Percent |
|---|---|---|
| Banking, Finance, and Insurance | 181 | 6.5 |
| Industry and Professional Organisation | 107 | 3.8 |
| Construction and Design activities | 14 | 0.5 |
| Data, IT, and Telecommunications | 1 | 0.0 |
| Retail | 4 | 0.1 |
| Health and Medical | 10 | 0.4 |
| Maritime and Shipping | 4 | 0.1 |
| Hotel and Restaurant | 3 | 0.1 |
| Agriculture, Forestry, and Fishing | 2 | 0.1 |
| Law, Finance, and Consulting Services | 4 | 0.1 |
| Culture, Entertainment, and Leisure | 1 | 0.0 |
| Food production | 1 | 0.0 |
| Media | 3 | 0.1 |
| Motor vehicle trade | 1 | 0.0 |
| Public Administration and Society | 14 | 0.5 |
| Education, Research, and Development | 409 | 14.7 |
| Advertising and Market Research | 1 | 0.0 |
| Transport and Warehousing | 6 | 0.2 |
| Not Available | 112 | 4 |
| Real estate Companies | 379 | 13.6 |
| Residential-BRF | 875 | 31.5 |
| Single-family houses-Private Person | 650 | 23.4 |
| Total | 2782 | 100.0 |
Table 2.
Descriptive statistics for the area sqm owned by the Swedish in Stockholm.
| Area sqm | Sum | Mean | Std. Deviation |
|---|---|---|---|
| Land sqm | 5,198,628 | 1868.7 | 4187.5 |
| Residential sqm | 4,127,757 | 1483.7 | 2872.7 |
| Office sqm | 4,180,346 | 1502.6 | 5692.0 |
| Industry sqm | 51,116 | 18.4 | 510.3 |
Note. The number of observations is 2782.
Table 3.
The biggest Swedish companies.
| Company | N. of Properties | Ownership Type | Land Sqm | Residential Sqm | Office Sqm | |
|---|---|---|---|---|---|---|
| Ownership | Land Lease | |||||
| Olov Lindgren AB | 34 | 31 | 3 | 47,043 | 72,323 | 50,443 |
| Einar Mattsson AB | 23 | 16 | 7 | 125,138 | 103,232 | 26,629 |
| Compactor Fastigheter AB | 12 | 3 | 9 | 31,617 | 0 | 42,138 |
| Albert Bonnier AB | 10 | 10 | 0 | 28,592 | 518 | 117,029 |
| HSB Stockholm EK FÖR | 11 | 3 | 8 | 47,194 | 46,506 | 1839 |
| L E Lundbergsföretagen AB | 25 | 21 | 4 | 57,074 | 1099 | 363,608 |
| Fabege AB | 14 | 9 | 5 | 26,749 | 5037 | 142,348 |
| Vasakronan Holding AB | 33 | 26 | 7 | 177,272 | 6424 | 622,761 |
| Humlegården Fastigheter AB | 11 | 10 | 1 | 18,833 | 0 | 83,352 |
| Skandinaviska Enskilda Banken | 28 | 27 | 1 | 33,153 | 23,237 | 131,083 |
| Folksam | 20 | 19 | 1 | 28,017 | 18,882 | 115,977 |
| AMF Pensionsförsäkring AB | 19 | 12 | 7 | 63,934 | 5419 | 217,817 |
| AFA Sjukförsäkringsaktiebolag | 15 | 14 | 1 | 68,878 | 12,199 | 175,901 |
| Statens Fastighetsverk | 23 | 23 | 0 | 101,391 | 3371 | 125 |
| Regeringskansilet | 10 | 8 | 2 | 24,570 | 0 | 11,837 |
| Total | 288 | 232 | 56 | 879,455 | 298,247 | 2,102,887 |
Table 4.
The nationality of non-Swedish owners.
| Nationality | No. of Properties | Ownership Type | Land Sqm | Residential Sqm | Office Sqm | Industry Sqm | |
|---|---|---|---|---|---|---|---|
| Ownership | Land Lease | ||||||
| Luxembourg/Cayman Islands | 21 | 0 | 21 | 111,153 | 420,746 | 26,154 | 0 |
| The Netherlands | 13 | 8 | 5 | 21,041 | 1149 | 89,167 | 0 |
| Luxembourg | 13 | 8 | 5 | 81,555 | 2990 | 176,216 | 11,479 |
| Norway | 9 | 7 | 2 | 33,697 | 1522 | 172,905 | 2300 |
| Germany | 4 | 3 | 1 | 8973 | 0 | 47,635 | 0 |
| Denmark | 2 | 2 | 0 | 1297 | 0 | 4713 | 0 |
| Finland | 2 | 1 | 1 | 12,811 | 0 | 60,694 | 0 |
| Bulgaria | 1 | 1 | 0 | 1588 | 0 | 0 | 0 |
| Estonia | 1 | 1 | 0 | 276 | 0 | 0 | 0 |
| France | 1 | 1 | 0 | 1329 | 702 | 1339 | 0 |
| Ireland | 1 | 1 | 0 | 913 | 0 | 5114 | 0 |
| Italy | 1 | 0 | 1 | 410 | 0 | 750 | 0 |
| Kuwait | 1 | 0 | 1 | 8294 | 0 | 0 | 1384 |
| Latvia | 1 | 1 | 0 | 299 | 0 | 0 | 0 |
| Liechtenstein | 1 | 1 | 0 | 1474 | 0 | 0 | 0 |
| Malta | 1 | 1 | 0 | 488 | 1149 | 0 | 0 |
| Great Britain | 1 | 1 | 0 | 427 | 990 | 309 | 0 |
| Sweden/Kuwait | 1 | 1 | 0 | 366 | 0 | 1237 | 0 |
| United Kingdom | 1 | 1 | 0 | 1732 | 0 | 0 | 0 |
| Total | 76 | 39 | 37 | 288,123 | 429,248 | 586,233 | 15,163 |
Table 5.
Descriptive statistics for the area sqm owned by non-Swedish in Stockholm.
| Area Sqm | Sum | Mean | Std. Deviation |
|---|---|---|---|
| Land sqm | 288,123 | 3791.09 | 5513.420 |
| Residential sqm | 429,248 | 5648.00 | 10,776.164 |
| Office sqm | 586,233 | 7713.59 | 12,850.530 |
| Industry sqm | 15,163 | 199.51 | 1346.342 |
Note. The number of observations is 76.
Table 6.
Owner type for Swedish owners in the studied areas.
| Studied Area | Stockholm City Centre-North (Norrmalm, Karlavägen, and Odengatan) | Stockholm City Centre-South (Hornsgatan, and Västra Liljeholmen) | North of Stockholm (Rinkeby and Tensta) | South of Stockholm (Bagarmossen) | ||||
|---|---|---|---|---|---|---|---|---|
| Owner Type | Freq. | % | Freq. | % | Freq. | % | Freq. | % |
| Banking, Finance, and Insurance | 151 | 12.2 | 25 | 3.6 | 5 | 0.9 | ||
| Industry and Professional Organisation | 84 | 6.8 | 15 | 2.2 | 7 | 2.1 | 1 | 0.2 |
| Construction and Design activities | 6 | 0.5 | 8 | 1.2 | ||||
| Data, IT, and Telecommunications | 1 | 0.1 | ||||||
| Retail | 4 | 0.3 | ||||||
| Health and Medical | 4 | 0.3 | 5 | 0.7 | 1 | 0.2 | ||
| Maritime and Shipping | 2 | 0.2 | 2 | 0.3 | ||||
| Hotel and Restaurant | 1 | 0.1 | 1 | 0.1 | 1 | 0.3 | ||
| Agriculture, Forestry, and Fishing | 2 | 0.2 | ||||||
| Law, Finance, and Consulting Services | 1 | 0.1 | 2 | 0.3 | 1 | 0.2 | ||
| Culture, Entertainment, and Leisure | 1 | 0.1 | ||||||
| Food production | 1 | 0.3 | ||||||
| Media | 2 | 0.2 | 1 | 0.1 | ||||
| Motor vehicle trade | 1 | 0.1 | ||||||
| Public Administration and Society | 12 | 1 | 1 | 0.1 | 1 | 0.2 | ||
| Advertising and Market Research | 1 | 0.1 | ||||||
| Transport and Warehousing | 6 | 0.5 | ||||||
| Education, Research, and Development | 82 | 6.6 | 146 | 21.3 | 109 | 33.1 | 72 | 13.6 |
| Not Available | 88 | 7.1 | 17 | 2.5 | 6 | 1.8 | 1 | 0.2 |
| Real estate Companies | 234 | 18.9 | 85 | 12.4 | 47 | 14.3 | 13 | 2.5 |
| Residential-BRF | 495 | 40 | 331 | 48.2 | 24 | 7.3 | 25 | 4.7 |
| Single-family houses-Private Person | 58 | 4.7 | 48 | 7 | 134 | 40.7 | 410 | 77.4 |
| Total | 1236 | 100 | 687 | 100 | 329 | 100 | 530 | 100 |
Table 7.
Descriptive statistics for areas owned by the Swedish in the studied areas.
| Studied Area | N. of Properties | Land Sqm | Residential Sqm | Office Sqm | Industry Sqm |
|---|---|---|---|---|---|
| Stockholm City Centre (Norrmalm, Karlavägen, and Odengatan) | 1236 | 1,913,106 | 1,348,340 | 3,545,471 | 0 |
| Central Stockholm (Hornsgatan, and Västra Liljeholmen) | 687 | 1,168,556 | 1,486,470 | 444,461 | 47,451 |
| North of Stockholm (Rinkeby and Tensta) | 329 | 1,255,867 | 952,362 | 134,364 | 0 |
| South of Stockholm (Bagarmossen) | 530 | 861,099 | 340,585 | 56,050 | 3665 |
| Total | 2782 | 5,198,628 | 4,127,757 | 418,0346 | 51,116 |
Table 8.
Descriptive statistics for areas owned by non-Swedish in the studied areas.
| Studied Area | N. of Properties | Land Sqm | Residential Sqm | Office Sqm | Industry Sqm |
|---|---|---|---|---|---|
| Stockholm City Centre-North | 48 | 107,534 | 6739 | 497,818 | 0 |
| Stockholm City Centre-South | 6 | 61,142 | 1763 | 62,261 | 13,779 |
| North of Stockholm (Rinkeby and Tensta) | 22 | 119,447 | 420,746 | 26,154 | 1384 |
| Total | 76 | 288,123 | 429,248 | 586,233 | 15,163 |
Publisher’s Note: MDPI stays neutral with regard to jurisdictional claims in published maps and institutional affiliations. |
© 2022 by the authors. Licensee MDPI, Basel, Switzerland. This article is an open access article distributed under the terms and conditions of the Creative Commons Attribution (CC BY) license (https://creativecommons.org/licenses/by/4.0/).
Share and Cite
MDPI and ACS Style
Ismail, M.; Warsame, A.; Wilhelmsson, M. Who Owns the City, and Why Should We Care? Land 2022, 11, 459. https://doi.org/10.3390/land11040459
AMA Style
Ismail M, Warsame A, Wilhelmsson M. Who Owns the City, and Why Should We Care? Land. 2022; 11(4):459. https://doi.org/10.3390/land11040459
Chicago/Turabian StyleIsmail, Mohammad, Abukar Warsame, and Mats Wilhelmsson. 2022. "Who Owns the City, and Why Should We Care?" Land 11, no. 4: 459. https://doi.org/10.3390/land11040459
Note that from the first issue of 2016, this journal uses article numbers instead of page numbers. See further details here.