
Online Environment as a Tool to Push Forward the Research: An Example for Landscape Disservices
by
 , and
, and
Ileana Pătru-Stupariu
1,2 ,
,
Andreea Ionescu
3,*,
Radu Tudor
2,
Alin-Ionuț Pleșoianu
1 and
Mioara Clius
2
1
Institute of Research of University of Bucharest, ICUB, Transdisciplinary Research Centre Landscape-Territory-Information Systems, CeLTIS, Splaiul Independenţei No. 91-95, 050095 Bucharest, Romania
2
Department of Regional Geography and Environment, Faculty of Geography, University of Bucharest, Bd. N. Bălcescu, 1, 010041 Bucharest, Romania
3
Faculty of Geography, Doctoral School Simion Mehedinti, University of Bucharest, Bd. N. Bălcescu, 1, 010041 Bucharest, Romania
*
Author to whom correspondence should be addressed.
Land 2022, 11(2), 234; https://doi.org/10.3390/land11020234
Submission received: 15 December 2021
/
Revised: 12 January 2022
/
Accepted: 28 January 2022
/
Published: 4 February 2022
(This article belongs to the Collection Land Systems in Transition: Challenges, Approaches, and Pathways for a Sustainable Development)
Abstract
:Due to the COVID-19 pandemic, researchers have had to find different resources in order to continue their research and the use of online information can represent a temporary solution. Our research is mainly focusing on a landscape which offers services and disservices. Recently, numerous studies that rely on landscape disservices have appeared. We associate wildlife-human-interactions (WHI) and human-wildlife-interactions (HWI) as part of landscape disservices. More precisely, in the first category (WHI) we have included the interaction of the wild animals with human and in the second category (HWI) we have created a database with animals attacked or/and killed by human. In order to sustain this analysis, we have selected data from local newspapers and Facebook groups, which supports our hypothesis that online resources could provide valuable data. The study area is represented by the Southern and Eastern Carpathians. The most affected mammals for this type of interactions (HWI) are bears, followed by wild boars and red deer, while WHI has intensified in the last five years. Based on the analysed data we can conclude that the animals who generate the most disservices to humans are bears and wild boars. The solutions we have identified, which also include online sources, for both HWI and WHI are relocation, rescue, capturing of the animals in reservations or, as a last resort, euthanasia. In order to reduce these types of interactions it is important to promote ecological education, development and promoting of certain attitudes and behaviour that have a visible impact upon HWI and WHI.
1. Introduction
The COVID-19 pandemic period has brought many changes in our lives. Researchers rapidly had to reinvent themselves and find new resources in order to continue their research. Our study follows the same trend, thus proposing to demonstrate that the use of information from the online environment, respectively, local newspapers (mass media) and Facebook, can represent a viable solution momentarily. Our research is mainly focusing on landscape which offers services but also disservices.
By landscape services we mean a concept that links biodiversity, social sciences and participatory approaches and sustainable landscape planning [1,2,3]. In the analysed studies [4,5], landscape services are classified according to different criteria, but the services of mountain ecosystems are globally recognized, which provide services such as wood and food, which support farming communities in mountain areas [3,6,7]. The services that benefit both the communities in the upper and lower regions are the cultural, aesthetic services, which involve leisure outdoors activities, contributing to well-being. Long-term services are carbon dioxide retention, water regulation services, and nutrient circulation [8]. Additionally, a complex classification of landscape services is presented by Bastian et al. [2] where the services are classified into several categories, as follows: supply services, regulatory services, biological services (habitat functions), socio-cultural services and information services. In antithesis, a new concept that recently emerged is landscape disservices.
In the scientific international literature, the disservices were associated with the development of the transport network between urban areas, as well as urban sprawl, the boundary between urban space and natural space is considerably reduced, and the human-animal interaction intensifies in the landscape [9]. In the urban space, aesthetic problems have been identified, security problems due to animals (bats, foxes, mice, red deer, etc.) that can cause anxiety and health, economic, mobility and transport problems [9]. Other examples refer to invasive species [10], habitat loss or organisms that provide disservices for the agriculture [11]. The most common disservices were related to human health, heat waves, floods and property damage [12].
A recent study defines ecosystem disservices as direct negative effects on human well-being in an urban environment [13]. Among the examples of disservices defined by Wu et al., there are: diseases or injuries caused by plants or animals, as well as the state of insecurity or anxiety created by plants or animals [13].
It was recently highlighted that the scientific studies focused more on the services and trade-offs, neglecting or paying less importance to the disservices that might occur in the landscape [14].
Collecting data from newspapers, magazines, and Facebook is a method that is very often used in the social sciences [15]. This type of analysis involves choosing different types of newspapers according to several criteria (for example, addressability). Landscape disservices articles are considered more common in the media because the stories and issues with the most value in the news are those that involve disrupting a community or human well-being [12]. Related to our analysis, a very recent review shows that for a period of 15 years, based on a number of 2201 newspaper study articles, the proportion was 25% in the study of services, while disservices were studied in a proportion of 75% [12].
Starting from this perspective of landscape disservices we analysed wildlife-human interactions (WHI) and human-wildlife interactions (HWI) as part of landscape disservices. More precisely, in the first category (WHI) we have included the interaction of the brown bear and wild boar with human, and in the second category (HWI) we have created a database with animals, attacked or/and killed by humans (brown bear (Ursus arctos), red deer (Cervus elaphus), wild boar (Sus scrofa), chamois (Rupicapra rupicapra)). Considering the high frequency of HWI and WHI in the mountain cities—a very topical issue in Romania—we selected all the local newspapers which reported such events.
Our hypothesis is that the newspaper magazines and Facebook could provide valuable data. Our research questions are: (i) how much data can we collect from local newspapers, magazines and Facebook regarding the HWI and WHI? (ii) Can we design and build our research based on these data? (iii) Can this type of data reveal spatial relationships for HWI and WHI phenomena?
2. Study Area Data and Methods
The database for this study was created by analysing the most popular and important online newspapers and Facebook sources (pages/groups) in the Eastern and Southern Carpathians. The study area was delineated based on most cases of HWI and WHI, as follows. The study area is represented by the Eastern and Southern Carpathians. The study was developed in three major areas: Prahova Valley, where the busiest mountain resorts are located, Brasov Metropolitan Area, the most crowded urban area in the Carpathian Mountains, and Harghita and Covasna Counties in Eastern Carpathians.
Both in the Prahova Valley and in the Eastern Carpathians, the most common mammal species found are: the brown bear (Ursus arctos), the wild boar (Sus scrofa), the red fox (Vulpes vulpes), the wolf (Canis lupus), the lynx (Lynx lynx), the red deer (Cervus elaphus) and the roe deer (Capreolus capreolus) [16,17,18]. In the Brasov-Prahova Valley region, the factors that determined the movement of these animal species are: the orientation of the slopes to the east, deciduous, mixed and coniferous forests, food sources, leisure facilities, and construction sites [18].
2.1. Data Collection Strategy
The database was created following the collection of 44 HWI online data sources and 24 WHI data sources. The selection was made using multiple keywords: “human attack by animal”, “human killed by animal”, “animal poaching”, “animal hit by the car”, “animal killed by human”. The data were collected from resources between October 2010 and March 2021. We chose the online sources that had frequently reported HWI and HWI. The selected newspapers were Brasov Observatory, Digi24, Adevarul, Ziarul Harghita, Transilvania 365, MediaFax, ProTV News. We extended our research to Facebook pages and groups which were wild animal-focused: Animal Control group-Brasov, National Directorate of Forests–Romsilva, News Brasov. The spatial location for each recorded event in the database was attributed to the specific place where it was observed in the data source. If the data source explicitly documented the location, then the geographical coordinates were recorded using manual editing in ArcGIS 10.9 software. In the case of events with uncertain spatial location, the coordinates were obtained from the centroid of the county or city where the event happened.
2.2. Methods
2.2.1. Statistical Approach
2.2.2. GIS Approach
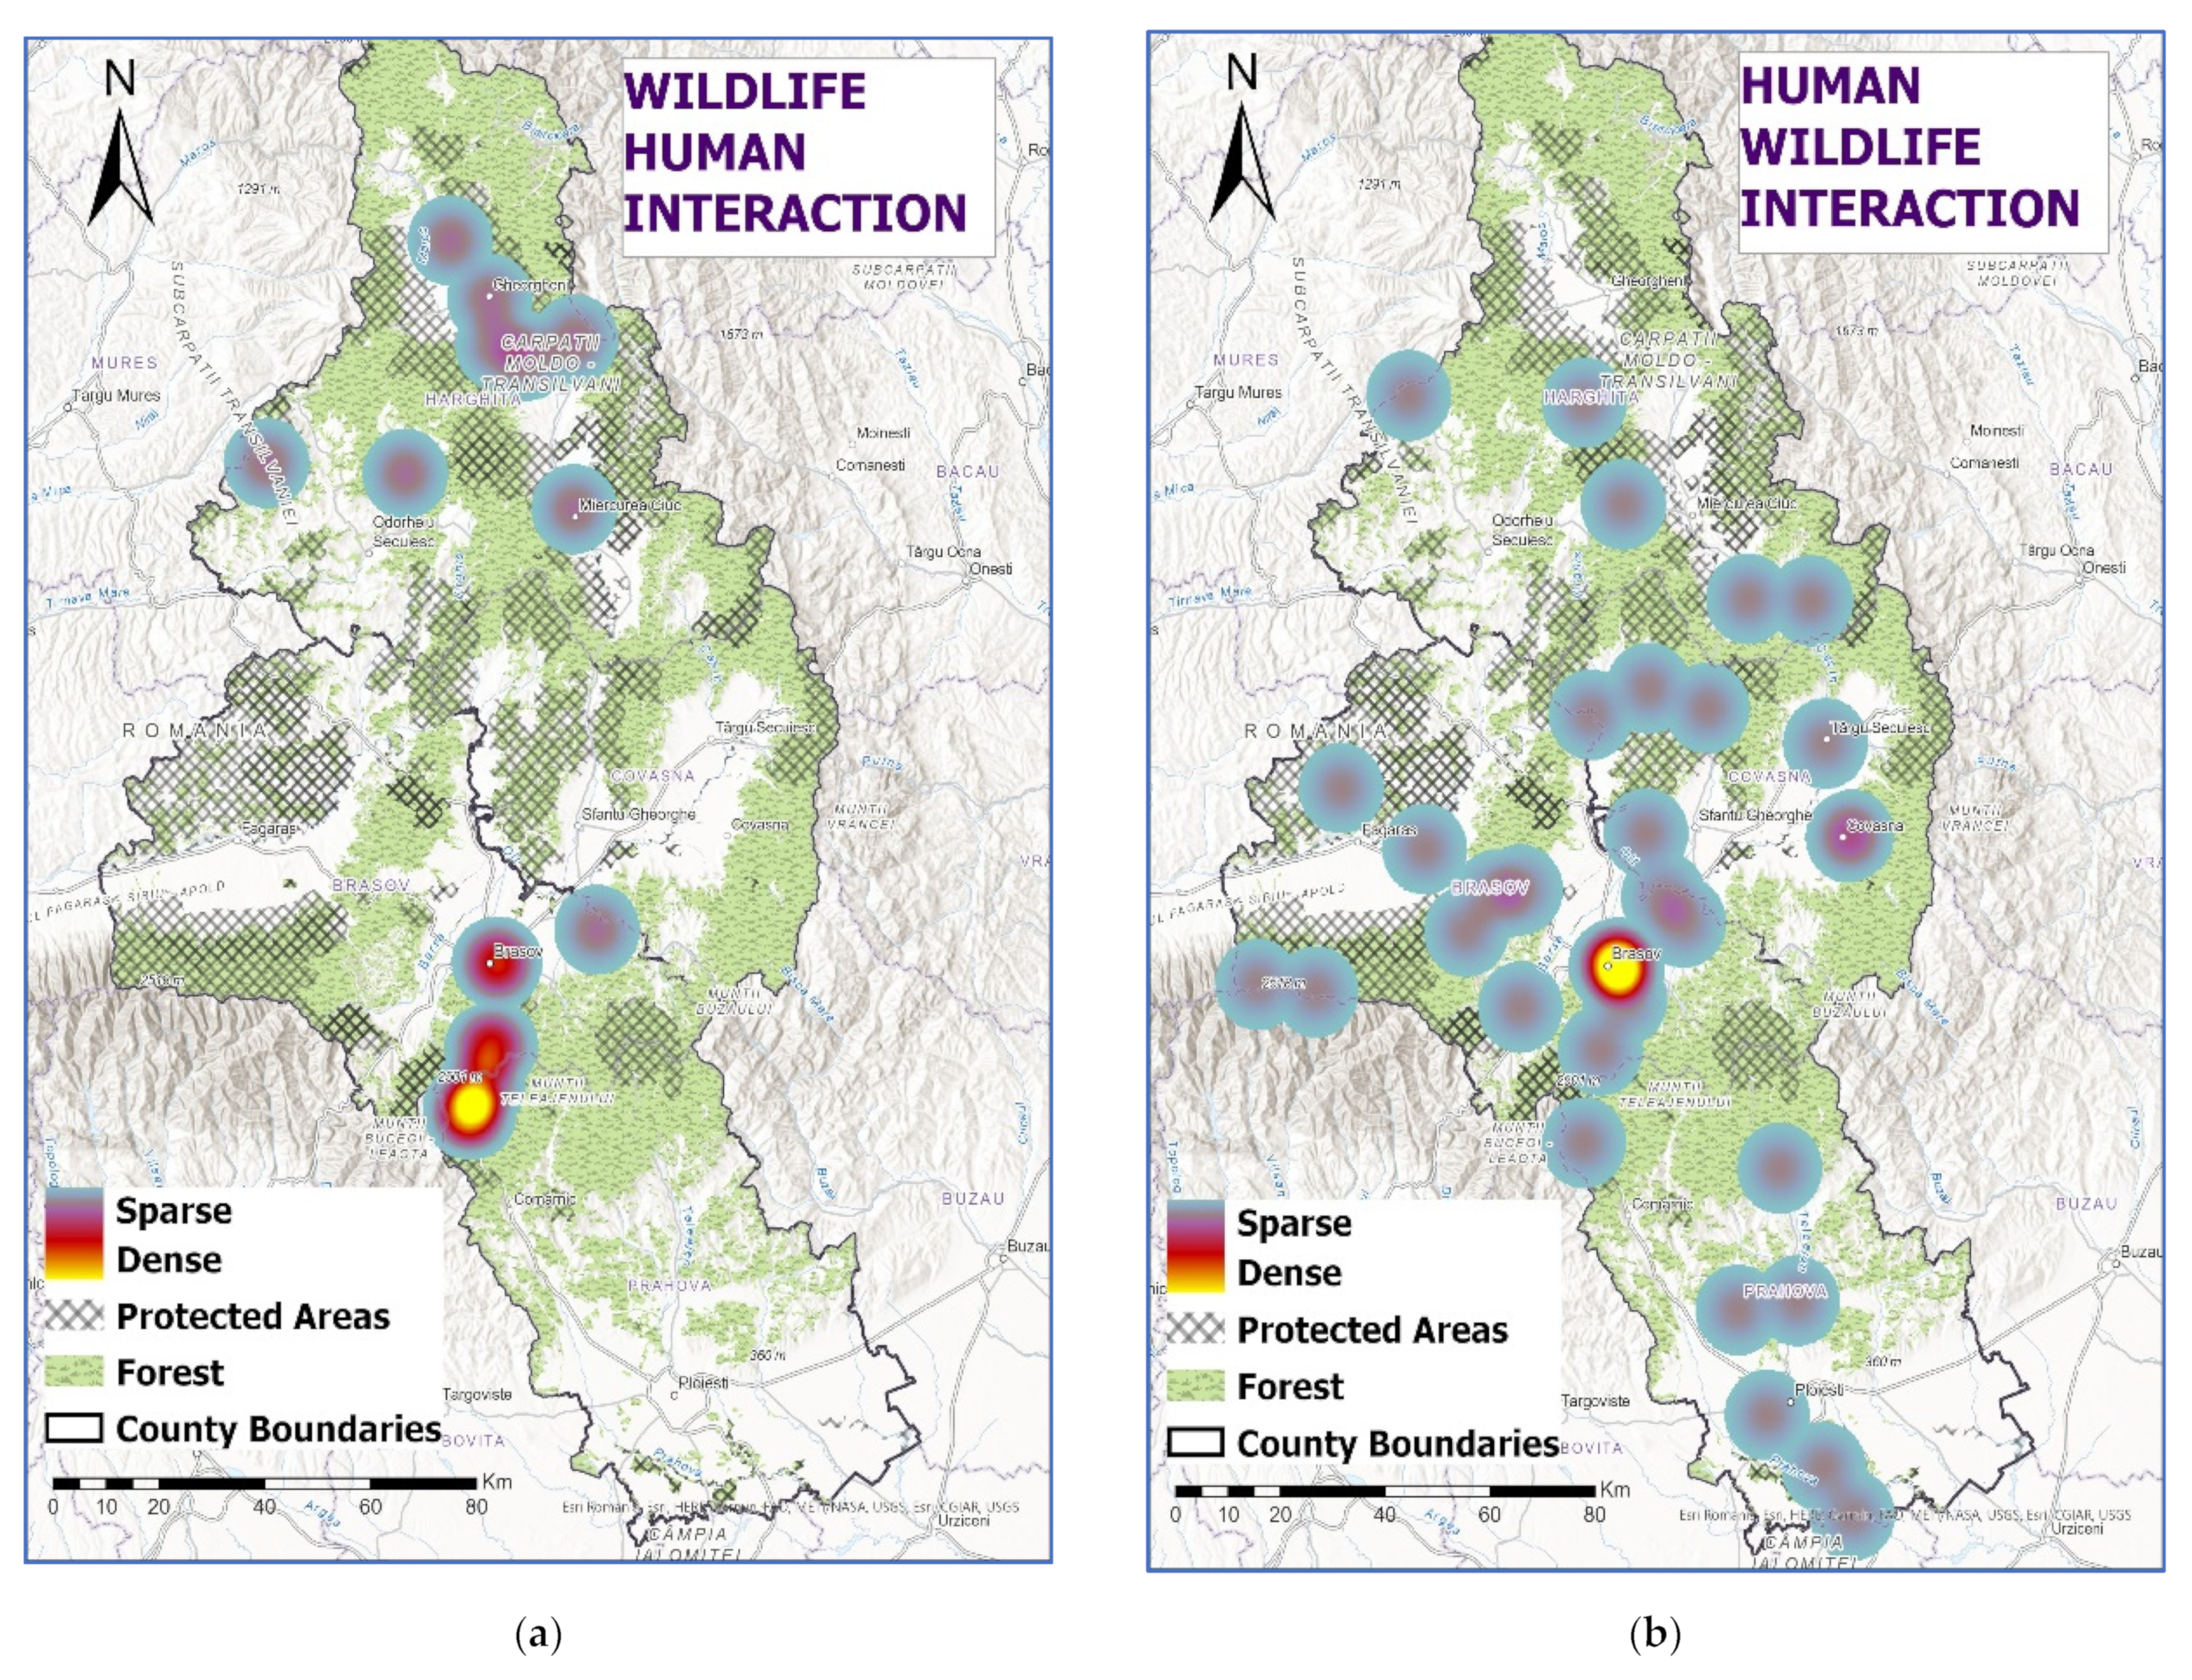
Heatmap combines the representation of an effect and its statistical significance, but it can also show data ordered by effect of two sets of variables, both types aiding in the recognition of significant models of associations [20]. Heatmaps are often used to express the intensity of phenomena in related fields such as geography, biology, economy. The heatmap was created by precisely vectorizing the locations mentioned in the database articles, showing the intensity of the phenomena locally. Thus, we can visualize the hot points of the affected county. Land utilization data and forests data from the Corine Land Cover 2018 and limits of the protected areas (official site of Ministry of the Environment, Waters, Forests) were added, in order to display related factors which directly influence the density of both interactions.
2.2.3. Colocation Analysis
The colocation analysis is a type of spatial statistical analysis which can reveal spatial associations between two or more categories of point observations. It was first introduced by Leslie and Kronenfeld [21] as a new metric, termed colocation quotient (CLQ) designed to measure the spatial associations between different populations which are spatially autocorrelated. The first colocation quotient (CLQ) was designed as a global indicator, which indicates whether points in category A are spatially collocated with points in category B. The global CLQ, described in following equation: is an asymmetric indicator due to the nearest neighbour relationships which can appear [21], where CA→B is the total count of category A points which have nearest neighbours from category B points; NA is the total count of category A points; NB is the total count of category B points and N is the total count of category A and B. The GCLQ metric indicates that category A points are collocated with category B points if its value is greater than 1.
Due to the fact that GCLQ assumes that the spatial association remains stationary over space [18], a variation of GCLQ was introduced by Cromley et al. [22] who proposed the local colocation quotient analysis (LCLQ), as a modified metric to measure the local spatial associations between points. The LCLQ captures the local variability of spatial factors which can shape the point associations by testing each point in category A with a subset of neighbour point from category B based on a distance relationship defined by the analyst. The LCLQ was further improved by Wang et al. [23] by introducing a statistical test and its equations are described below:
where the Ai→B is the local colocation quotient for point category A point i relative to category B points, NAi→B is the number of category B points that are nearest neighbours to Ai, fij is a variable which indicates whether point j is a marked category B point (1-yes or 0-no), wij is the weight of point j with regard to the importance towards ith A point and dij is the distance from the ith point.
The colocation quotient was successfully applied to various studies which imply spatial point data in order to identify relationships between different spatial phenomena, such as: ref. [24] in order to identify patterns of spatial association between categories in a population; ref. [25] to identify the high-risk intersections for pedestrians and cyclists; ref. [26] to detect the spatial patterns between types of fires and land-use facilities or ref. [27] to measure the spatial associations among car crashes. The colocation analysis was performed in ArcGIS 10.9 software using the spatial statistics toolset. The local colocation quotient analysis was performed using distance band as the neighbourhood type and 999 permutations. The size of the neighbourhood was calculated as the average distance at which each feature has at least eight neighbours and the resulting values were 32.9 km for WHI/HWI pair and 52.3 km for HWI/WHI pair.
3. Results and Discussion
3.1. Statistical Approach
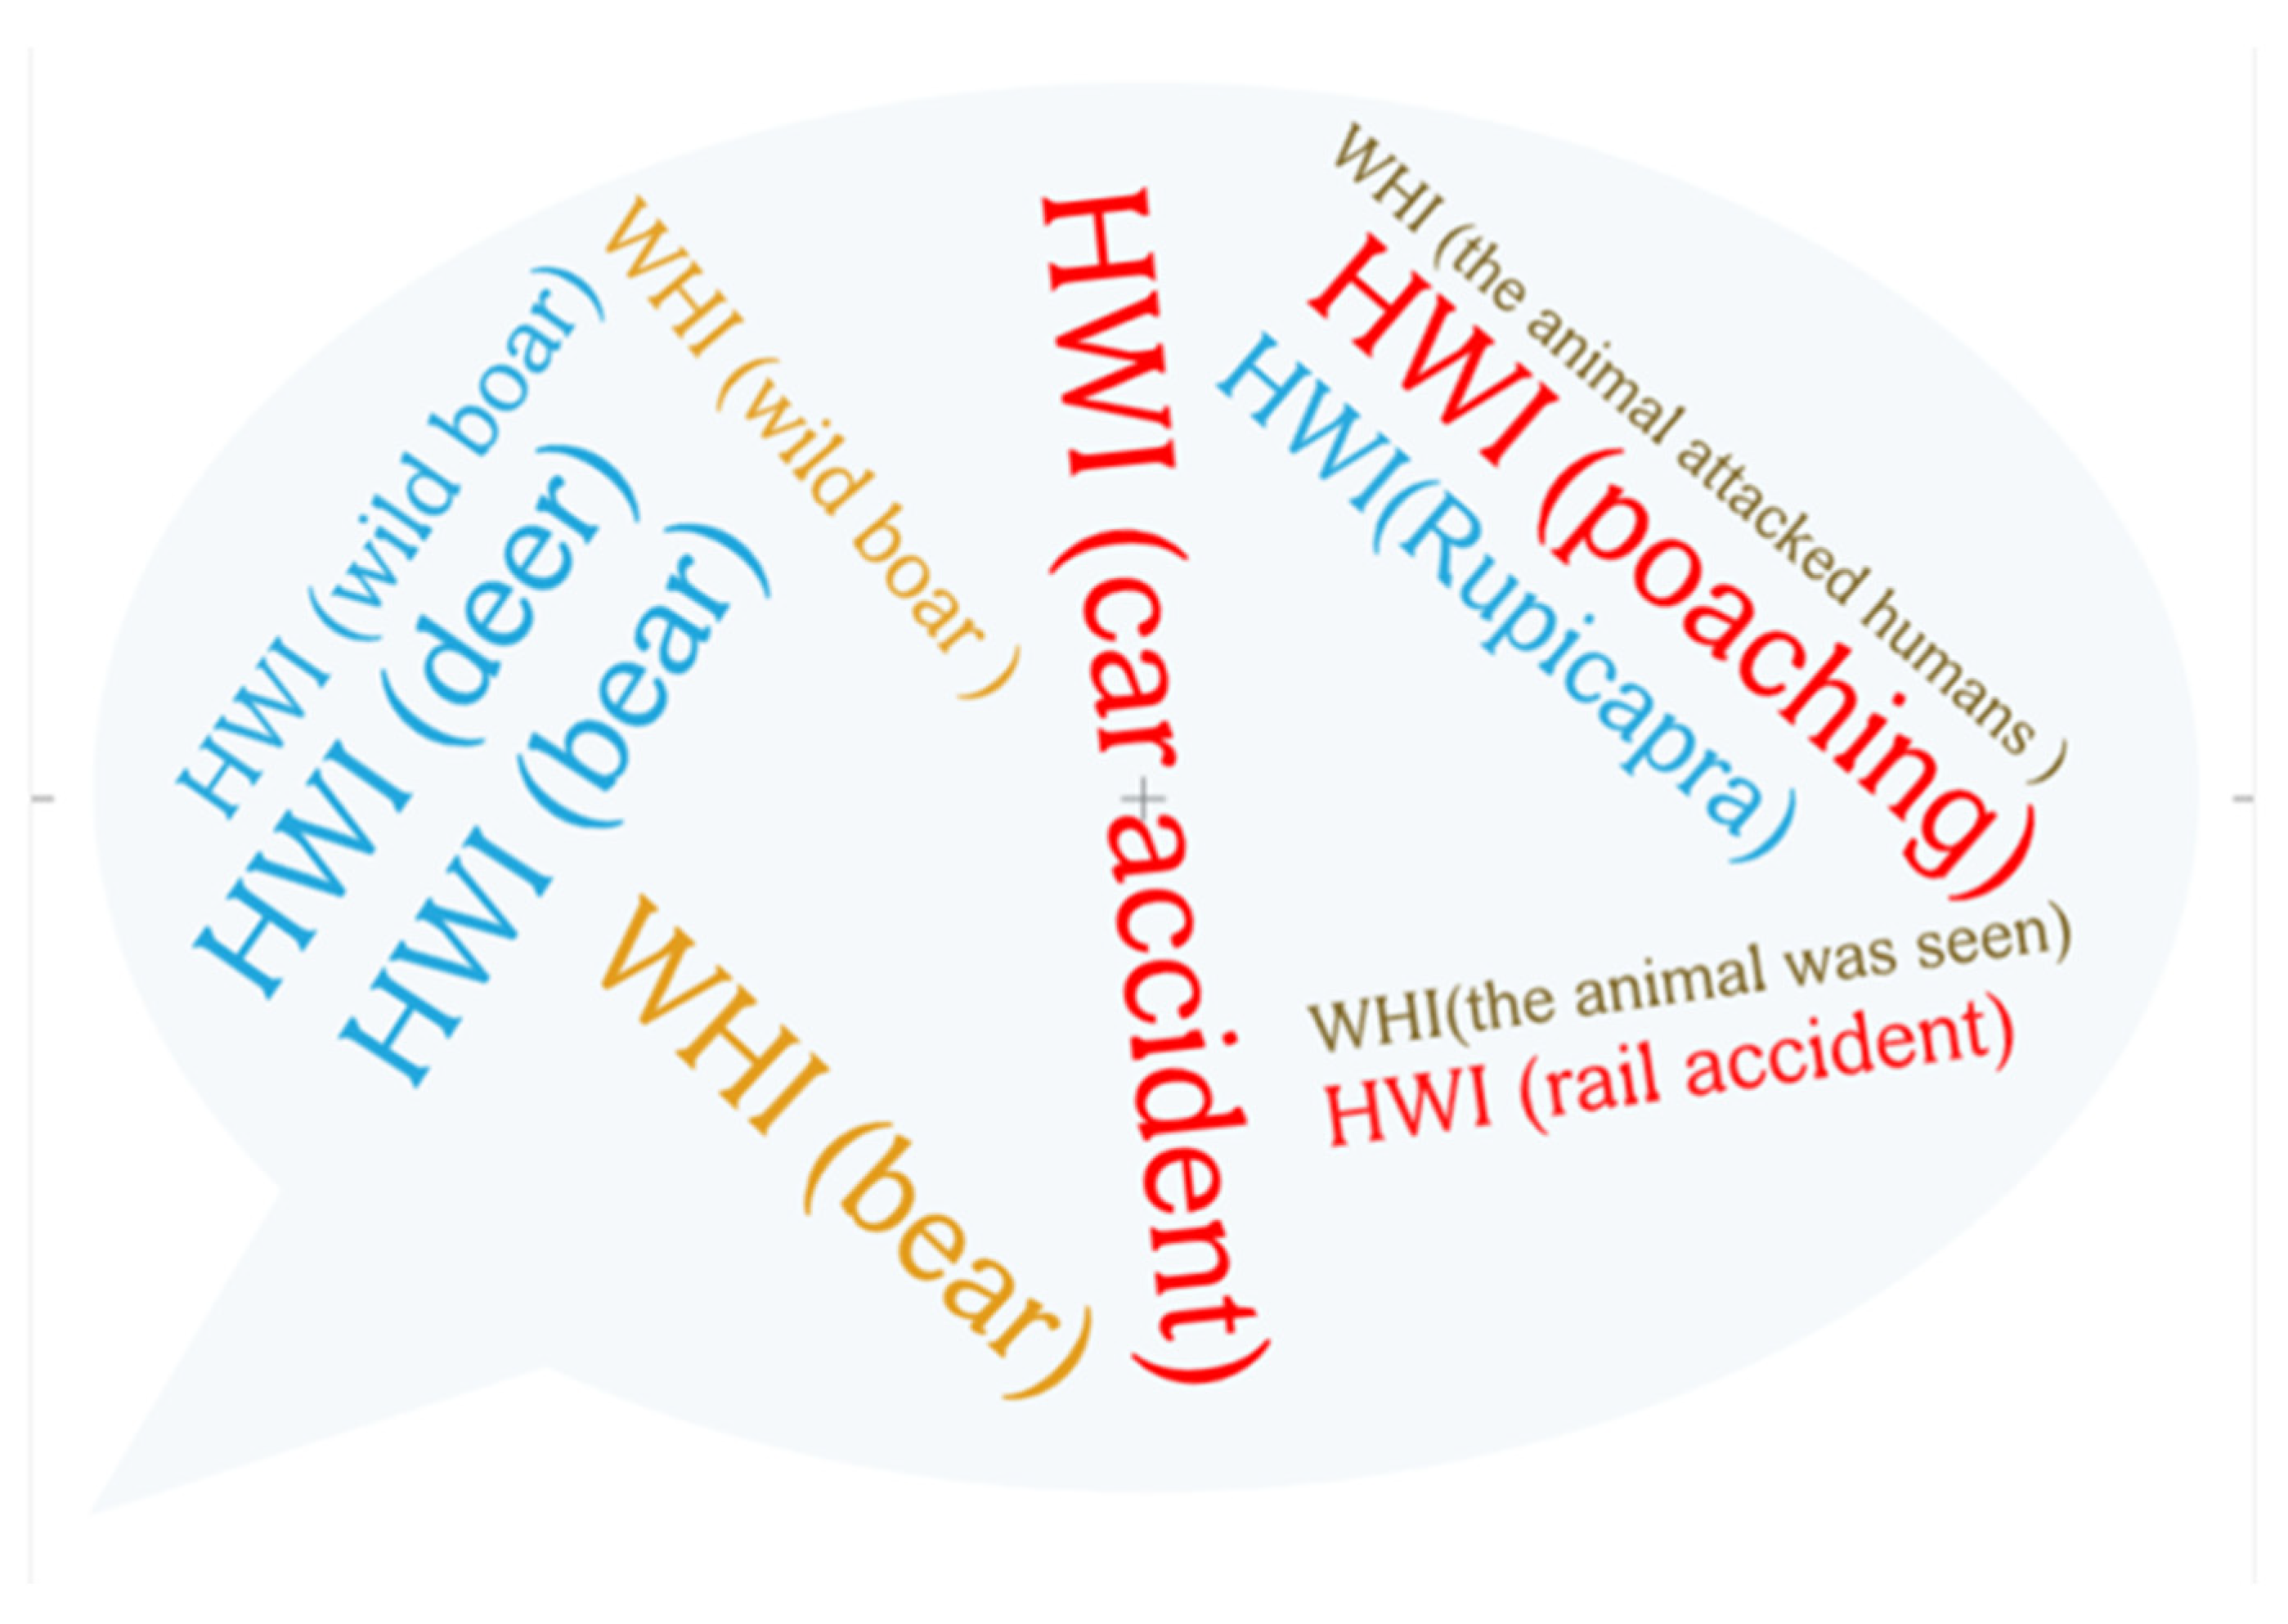
Figure 1 shows a trend chart of the two types of HWI (words in red), namely poaching and car or rail accidents. Most of the information was found from news regarding car/rail accidents, respectively, 29 and for poaching 15 (Table 1).
Associated with these HWIs we find represented the species affected by poaching and car accidents, respectively: brown bear (18), red deer (14), wild boar (4) and the chamois (2) (in the graphic they are represented in blue). In a recent paper of Fedorca et al., car accidents (wildlife-vehicle collisions) have also been problematic in Prahova Valley area [28].
For the second type of disservices, from the 24 Wildlife Human Interaction data sources, 14 cases were identified in which humans were attacked by wild animals and 10 cases in which humans only observed/filmed the wild animal (as showed in Figure 1). The most often involved animals in this type of interaction are the brown bear and the wild boar.
3.2. GIS Approach
The heatmaps (Figure 2a,b) represent the WHI and HWI and show the areas with the most cases: Prahova Valley (where the busiest mountain resorts are located) and Brasov area, which is the biggest mountain city in Romania. Additionally, a great number of cases are found within range of Harghita and Covasna counties, which own large forests and forestry facilities.
3.3. Colocation Analysis
The GCLQ results are presented in Table 2. Both the WHI/HWI and WHI/HWI pairs express GCLQ indices less than 1, with p-values equal to 0.002, which indicate that the points are not collocated at a global level.
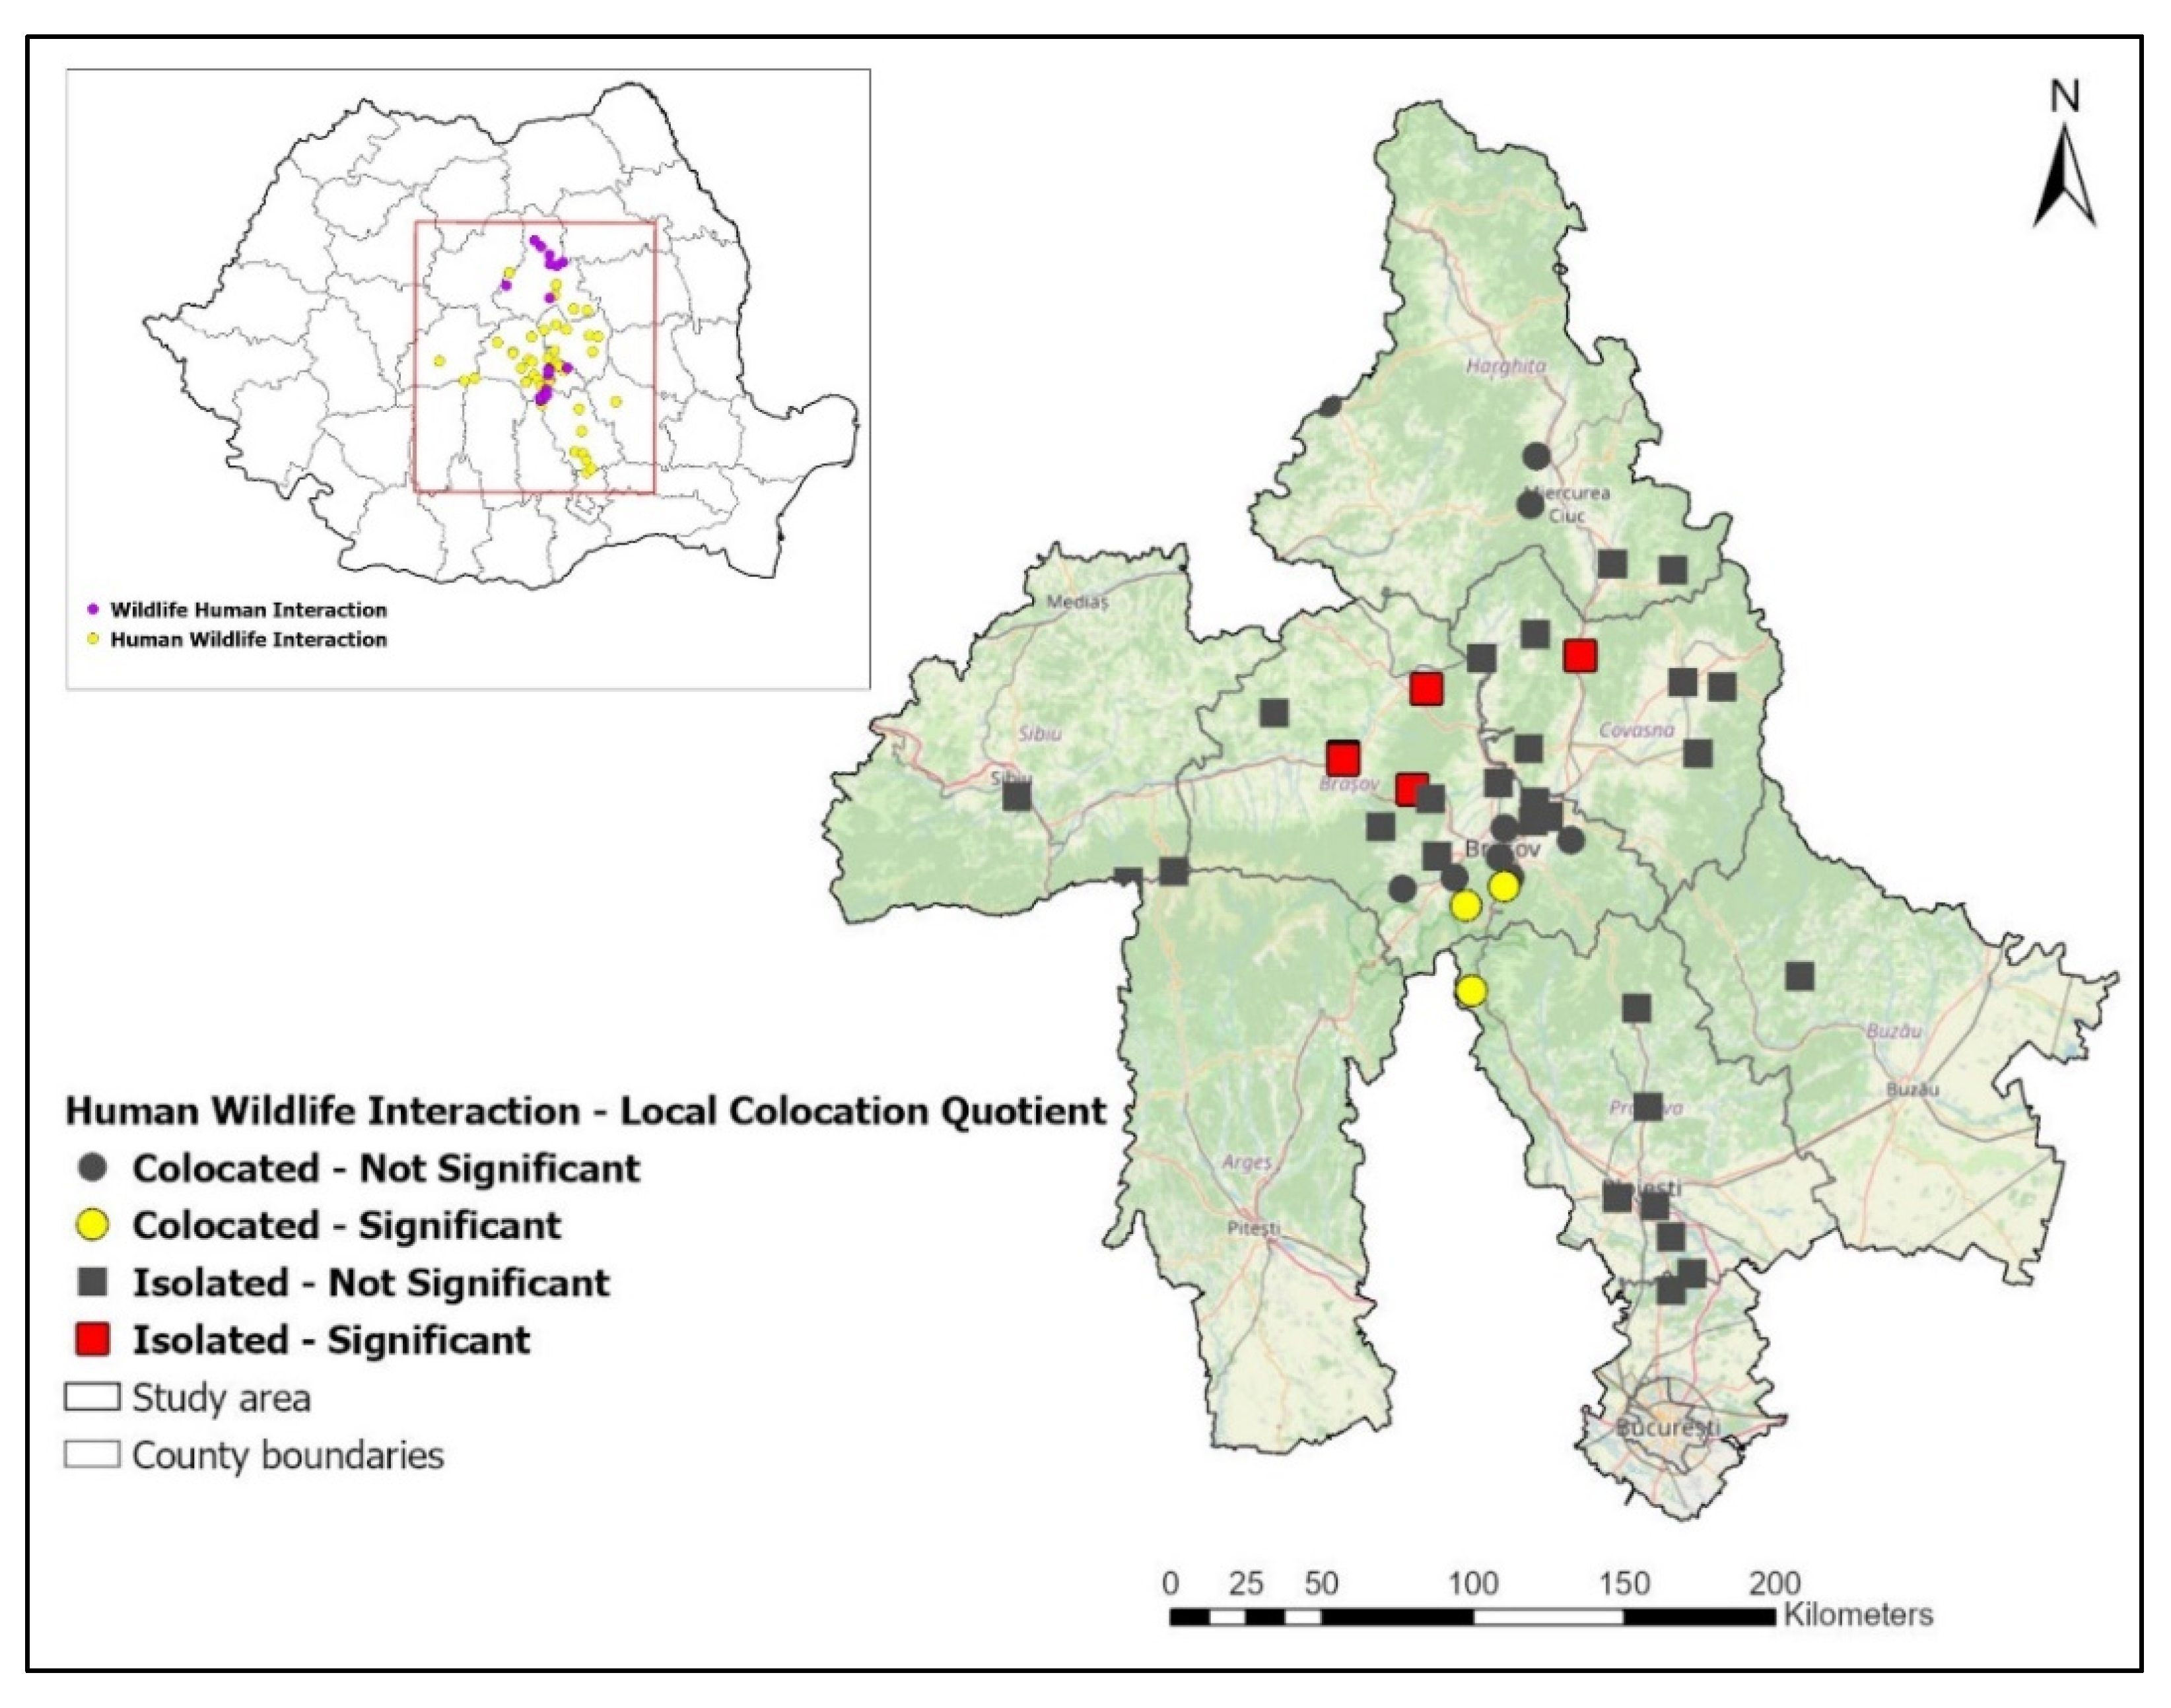
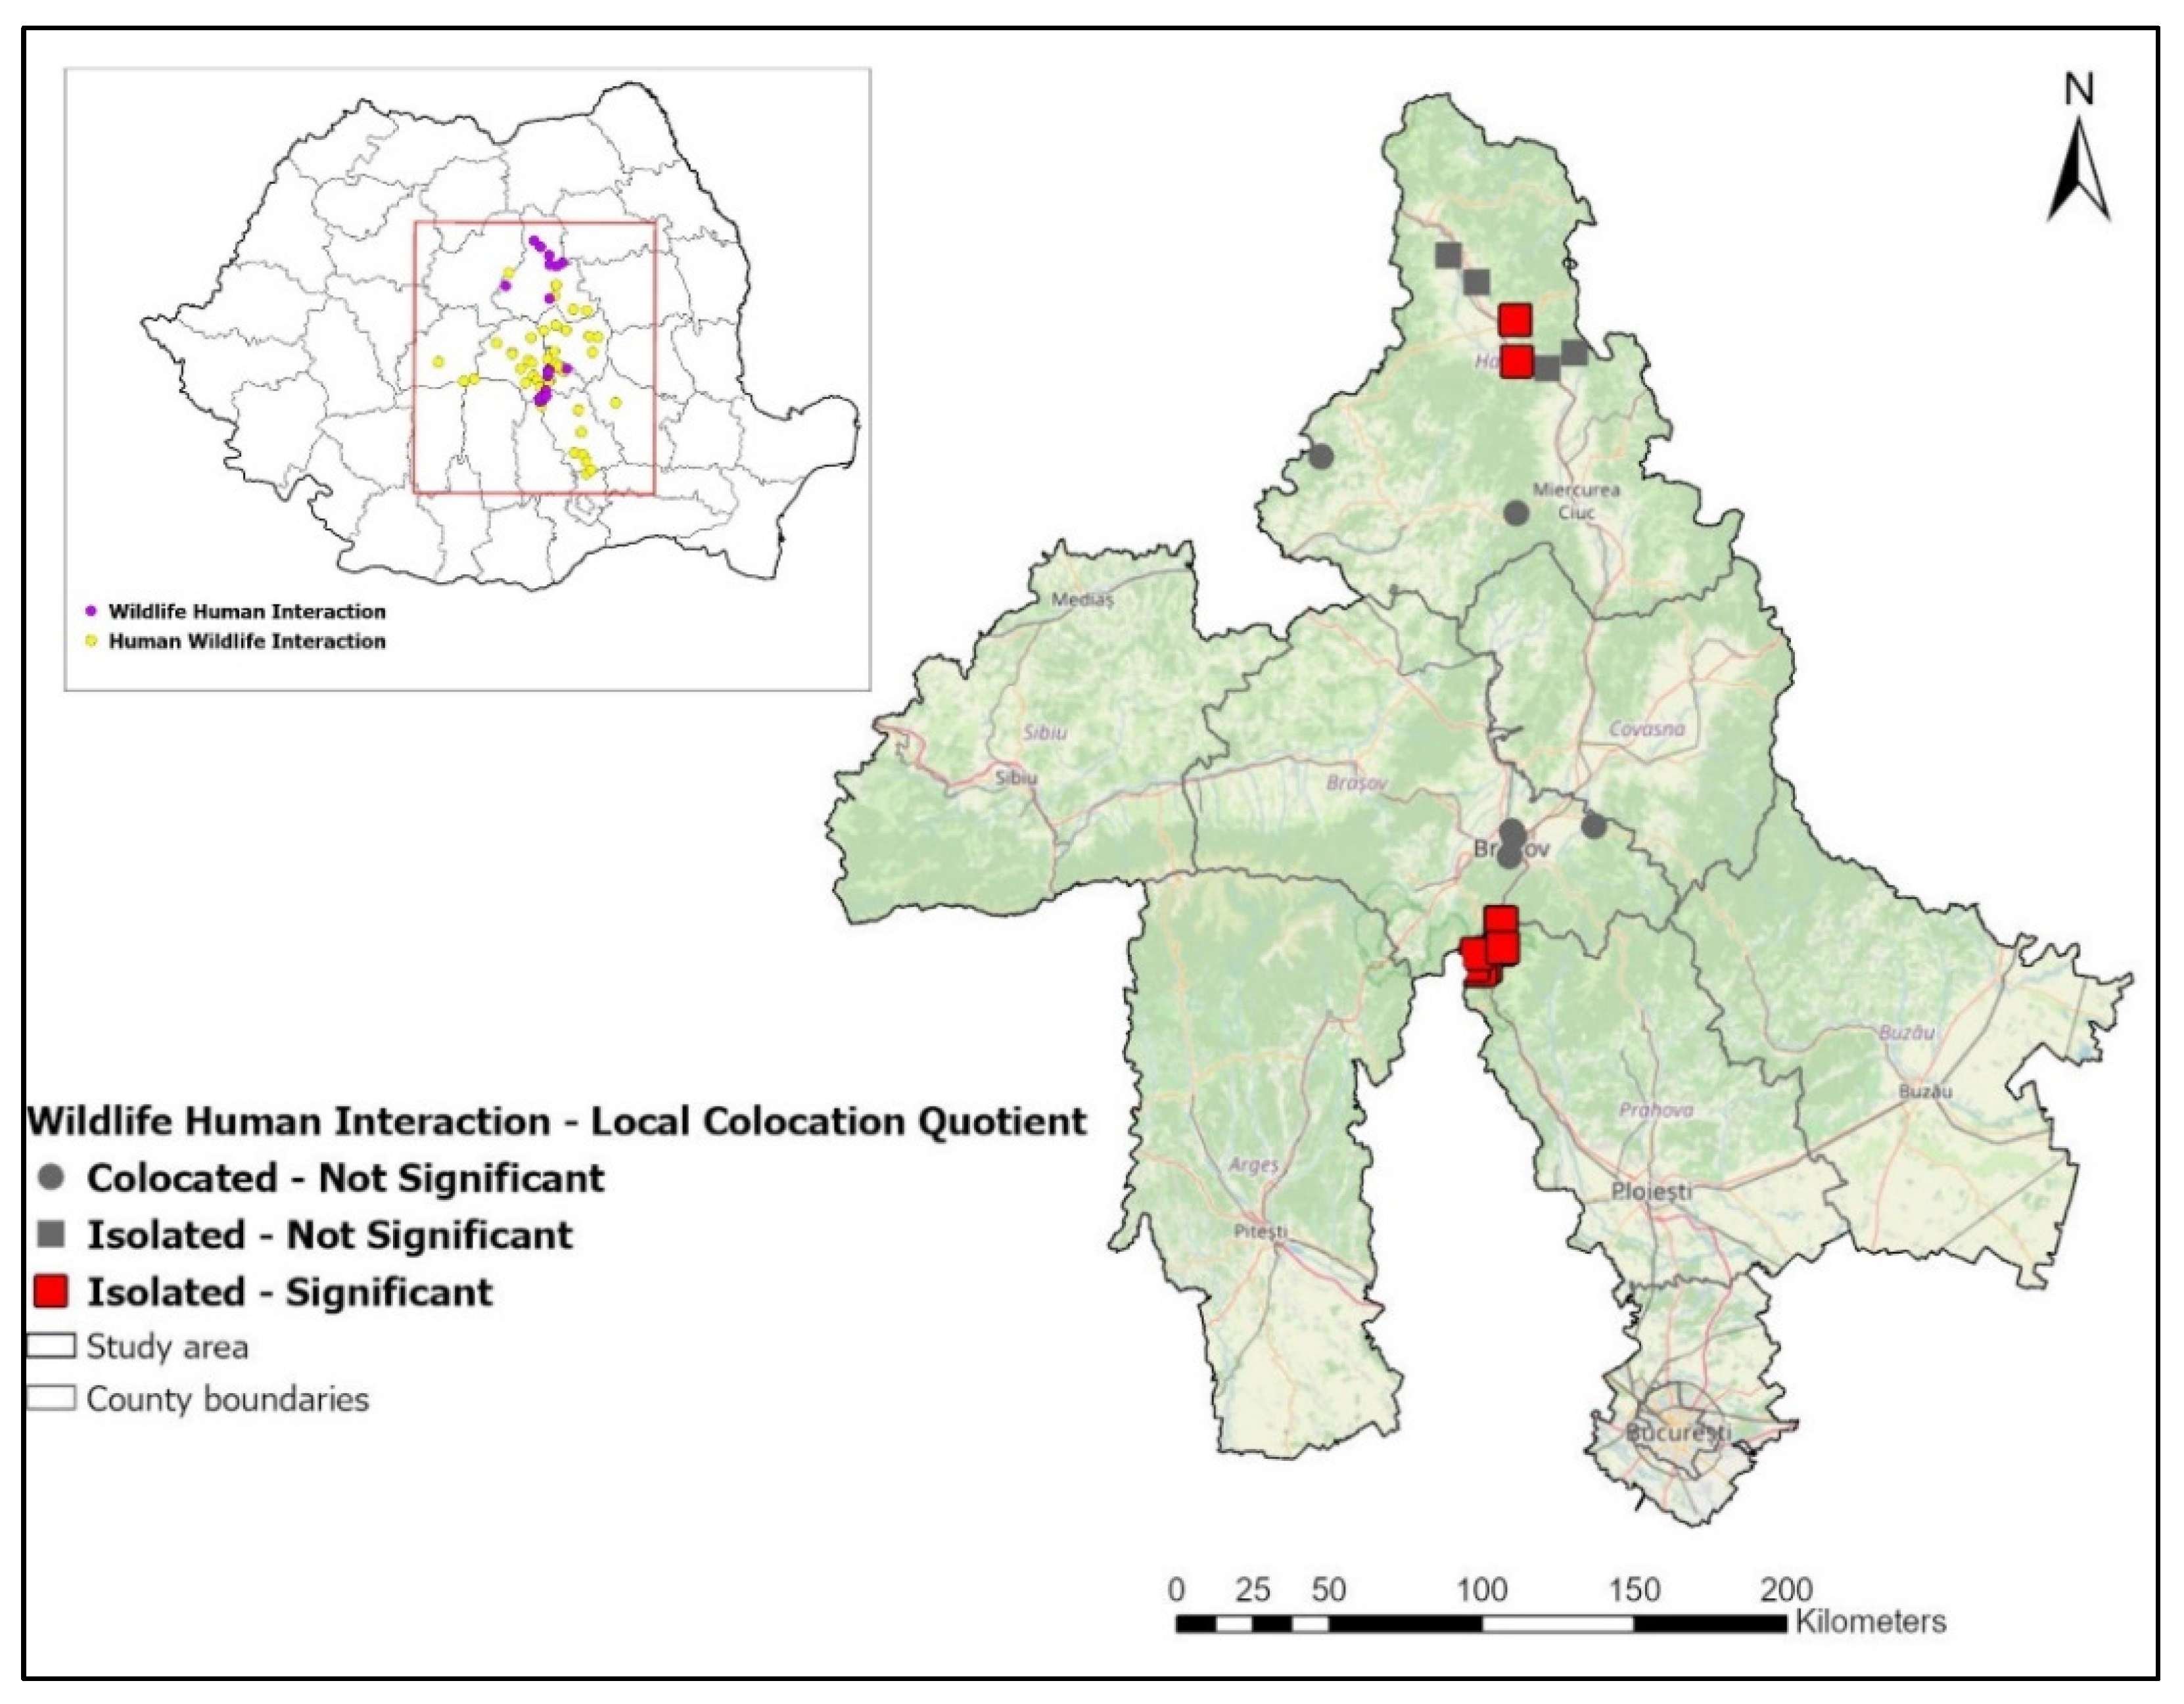
The results for LCLQ, however, express a greater variation with points that fall into the collocated and isolated classes. These results are shown in Table 3 and spatially represented in Figure 3 and Figure 4.
The HWI/WHI pair has event points which fall into all four classes. A high count of points falls into the non-significant class (~82%), while only 11.36% are in the isolated-significant class and 6.82% are collocated-significant. The isolated-significant points for this pair are located in between the main WHI point clusters (Figure 3). However, the results for WHI/HWI pair show a percentage of 54.55% of points in the isolated-significant class, while ~45.5% of the points are in the non-significant class of either collocated or isolated. No point was found in the collocated-significant class (Table 3). The isolated points of this pair are in the extreme south and north parts of the dataset, where HWI points are not present. Conversely, the collocated points are located in the centre of the dataset, where HWI points are also found (Figure 4).
4. Discussions
4.1. Does the Online Environment Provide Enough Data to Build Our Research?
We note that media sources present mainly disservice information [12], yet there are no articles about landscape services. One possible explanation would be that these disservices affect people in a direct manner (in the case of wild animal-human interaction) or from the emotional perspective, in the case of wild animals killed by humans. Information about landscape or ecosystem services fails to appear in these sources, as they are probably too theoretical or scientific. Out of the 68 online sources that were used (Facebook, local newspapers), 44 sources presented information about HWI while 24 online sources presented information about WHI. For the first category of HWI disservices, information presented specifications about the type of interception (car/rail accident or poaching), but also about the killed species (brown bear, red deer, wild boar, chamois). For the second category (WHI), there was information related to wildlife species that had a certain type of interaction with humans. The obtained information brings into view clear facts about animals (brown bear and wild boar) but also about how the interaction occurred (direct attack of those two species, observing tourists in the city on mountain trails or on the slopes). The basic statistics presented in Figure 1 clearly state that most types of interaction are suffered by animals, and not by humans. Within the attack with human death category there is only one case, while the number of animals that were killed is 16. There were also several attempts to save these animals and, fortunately, we identified four sources that depict the rescue actions for some bears and red deer. In addition to this information, based on the consulted online sources, concrete measures to reduce these disservices were identified. For example, for WHI the solution involved relocation or controlled hunting, while for HWI, sanctions were imposed especially in the case of poaching (14 sources confirm the fact). There were also rescue actions as follows: two cases of bear and two cases of red deer.
The advantages of using online sources are related to the fact that information about poaching or animal rescue in the field could be more difficult to obtain for HWI. In the case of WHI, it is also more difficult to select a specific group of local actors. In general, you can focus on collecting data on an area where this type of interaction is known to occur [16].
Another advantage of using this type of collecting data was the lack of interacting with locals in order to apply interviews or surveys, which, depending on the information needed, can take a lot of face-to-face time in order to complete and faculty staff to reach those locations [29], which was unsafe during the COVID-19 pandemic.
The disadvantage is the number of quantitative (binary) data you need to collect to perform an accurate statistical analysis. The analysis should take place over a longer period of time.
Study limitation: not all sources have keywords to help search, not all publications were found that mentioned HWI and WHI during the analyzed period, incomplete or inaccurate location of HWI and WHI sites.
4.2. Can Data Collected from Media Sources Be Used in Spatial Analysis?
The colocation analysis revealed that these phenomena (WHI and HWI) have contrasting spatial patterns. In the WHI/HWI pair, ~55% of points fall in the isolated-significant class (Table 3). The points in this class are located in Prahova valley (Figure 3), an important transport couloir and the main mountain tourist site in Romania with plenty of tourist tracks and lodges. However, the HWI/WHI pair shows the reverse, where isolated-significant points are located in populated areas in the Brasov and Covasna counties, close to major cities and roads, while the collocated-significant points are located in forested areas around Prahova Valley. This seems to reveal that human activity in these forested areas might have a link in triggering both HWI and WHI events, as they are either isolated in the WHI/HWI pair or collocated in the opposite one.
The colocation analysis applied to data collected from media sources proves the possibility to use this type of data in complex spatial analyses. The colocation analysis has the advantage of being a robust method for spatial pattern analysis because it does not model attributes of spatial phenomena other than location and thematic category [23]. These advantages are precisely useful for data collected from media sources, as oftentimes these sources cannot give accurate quantitative data on spatial phenomena. Another advantage in the case of our HWI and WHI phenomena is that a precise geographical location is not necessarily required, because the events happen in large area, thus a regional scale analysis is more suited. This type of analysis opened ground for a spatial pattern analysis of geographical data collected from media sources, and, although a more thorough conclusion on the phenomena should be stated with a larger dataset, this is not a drawback of the data collection process, as this type of information is continuously reported in the media [16].
5. Conclusions
Our analysis proved that data collected from online sources such as online newspapers and Facebook can assist the scientific research. These sources are useful and can complete certain databases, especially in the context of a pandemic. Of course, this method should not remain the only way to do research, because it could reduce the scientific quality of a study. In the case of our chosen scenario, the HWI/WHI pair, associated with the landscape disservices, information was extremely valuable. Further information about landscape disservices could not be collected directly on the field. However, mass media stands out as a very credible source. For example, details about poaching in the case of HWI are difficult to obtain straight from the actors involved. Mass media is the one providing all the information. Furthermore, the fact that we have identified mapping methods capable of spacing this type of data collected online increases the value and the credibility of the results achieved. However, it is not to be neglected that data are permanently and rapidly updating, and these analyses should keep pace with these updates.
Author Contributions
Conceptualization: I.P.-S.; Data curation: A.I. and R.T.; Methodology: A.-I.P., R.T. and I.P.-S.; Investigation: A.I. and R.T.; Formal analysis: M.C.; Writing—Original Draft: I.P.-S., A.I., A.-I.P. and R.T.; Writing—review & editing: A.I., I.P.-S. All authors have read and agreed to the published version of the manuscript.
Funding
This research was founded by grant provided by University of Bucharest.
Institutional Review Board Statement
Not applicable.
Informed Consent Statement
Not applicable.
Data Availability Statement
Not applicable.
Acknowledgments
Andreea Ionescu acknowledges the financial support received from the Doctoral School Simion Mehedinti, Faculty of Geography, University of Bucharest. The authors thank the anonymous reviewers for their constructive suggestions. UEFISCDI since it created the framework of a collaboration within the project proposal “Design of landscape networks with machine learning PN-III-P4-PCE-2021-0303”.
Conflicts of Interest
The authors declare no conflict of interest.
References
- Termorshuizen, J.W.; Opdam, P. Landscape services as a bridge between landscape ecology and sustainable development. Landsc. Ecol. 2009, 24, 1037–1052. [Google Scholar] [CrossRef]
- Bastian, O.; Grunewald, K.; Syrbe, R.U.; Walz, U.; Wende, W. Landscape services: The concept and its practical relevance. Landsc. Ecol. 2014, 29, 1463–1479. [Google Scholar] [CrossRef]
- De Groot, R.S.; Wilson, M.A.; Boumans, R.M. A typology for the classification, description and valuation of ecosystem functions, goods and services. Ecol. Econ. 2002, 41, 393–408. [Google Scholar] [CrossRef] [Green Version]
- Duarte, G.T.; Mitchell, M.; Martello, F.; Gregr, E.J.; Paglia, A.P.; Chan, K.M.; Ribeiro, M.C. A user-inspired framework and tool for restoring multifunctional landscapes: Putting into practice stakeholder and scientific knowledge of landscape services. Landsc. Ecol. 2020, 35, 2535–2548. [Google Scholar] [CrossRef]
- Duarte, G.T.; Santos, P.M.; Cornelissen, T.G.; Ribeiro, M.C.; Paglia, A.P. The effects of landscape patterns on ecosystem services: Meta-analyses of landscape services. Landsc. Ecol. 2018, 33, 1247–1257. [Google Scholar] [CrossRef] [Green Version]
- Costanza, R.; d’Arge, R.; de Groot, R.; Farber, S.; Grasso, M.; Hannon, B.; Limburg, K.; Naeem, S.; O’Neill, R.V.; Paruelo, J.; et al. The value of the world’s ecosystem services and natural capital. Nature 1997, 387, 253–260. [Google Scholar] [CrossRef]
- Pătru-Stupariu, I.; Hossu, C.A.; Grădinaru, S.R.; Nita, A.; Stupariu, M.S.; Huzui-Stoiculescu, A.; Gavrilidis, A.A. A review of changes in mountain land use and ecosystem services: From theory to practice. Land 2020, 9, 336. [Google Scholar] [CrossRef]
- CICES. Towards a Common Classification of Ecosystem Services. 2013. Available online: http://cices.eu/ (accessed on 10 August 2021).
- Lyytimäki, J.; Petersen, L.K.; Normander, B.; Bezák, P. Nature as a nuisance? Ecosystem services and disservices to urban lifestyle. Environ. Sci. 2008, 5, 161–172. [Google Scholar] [CrossRef] [Green Version]
- Mouchet, M.A.; Paracchini, M.L.; Schulp, C.J.E.; Stürck, J.; Verkerk, P.J.; Verburg, P.H.; Lavorel, S. Bundles of ecosystem (dis) services and multifunctionality across European landscapes. Ecol. Indic. 2017, 73, 23–28. [Google Scholar] [CrossRef] [Green Version]
- Zhang, W.; Ricketts, T.H.; Kremen, C.; Carney, K.; Swinton, S.M. Ecosystem services and dis-services to agriculture. Ecol. Econ. 2007, 64, 253–260. [Google Scholar] [CrossRef] [Green Version]
- McLellan, V.; Shackleton, C.M. The relative representation of ecosystem services and disservices in South African newspaper media. Ecosyst. People 2019, 15, 247–256. [Google Scholar] [CrossRef] [Green Version]
- Wu, S.; Li, B.V.; Li, S. Classifying ecosystem disservices and valuating their effects—A case study of Beijing, China. Ecol. Indic. 2021, 129, 107977. [Google Scholar] [CrossRef]
- Ceauşu, S.; Graves, R.A.; Killion, A.K.; Svenning, J.C.; Carter, N.H. Governing trade-offs in ecosystem services and disservices to achieve human-wildlife coexistence. Conserv. Biol. 2019, 33, 543–553. [Google Scholar] [CrossRef]
- Abell, J.; Gruber, H.; Mautner, G.; Myers, G. Qualitative Discourse Analysis in the Social Sciences; Palgrave Macmillian: London, UK, 2008; p. 30. [Google Scholar]
- Pătru-Stupariu, I.; Nita, A.; Mustăţea, M.; Huzui-Stoiculescu, A.; Fürst, C. Using social network methodological approach to better understand human–wildlife interactions. Land Use Policy 2020, 99, 105009. [Google Scholar] [CrossRef]
- Pop, I.M.; Bereczky, L.; Chiriac, S.; Iosif, R.; Nita, A.; Popescu, V.D.; Rozylowicz, L. Movement ecology of brown bears (ursus arctos) in the romanian eastern carpathians. Nat. Conserv. 2018, 26, 15–31. [Google Scholar] [CrossRef] [Green Version]
- Fedorca, A.; Popa, M.; Jurj, R.; Ionescu, G.; Ionescu, O.; Fedorca, M. Assessing the regional landscape connectivity for multispecies to coordinate on-the-ground needs for mitigating linear infrastructure impact in Brasov—Prahova region. J. Nat. Conserv. 2020, 58, 125903. [Google Scholar] [CrossRef]
- Cui, W.; Wu, Y.; Liu, S.; Wei, F.; Zhou, M.X.; Qu, H. Context Preserving Dynamic Word Cloud Visualization. In Proceedings of the 2010 IEEE Pacific Visualization Symposium (PacificVis), Taiwan, China, 2–5 March 2010. [Google Scholar]
- Haarman, B.C.B.; Riemersma-Van der Lek, R.F.; Nolen, W.A.; Mendes, R.; Drexhage, H.A.; Burger, H. Feature-expression heat maps—A new visual method to explore complex associations between two variable sets. J. Biomed. Inform. 2015, 53, 156–161. [Google Scholar] [CrossRef] [Green Version]
- Leslie, T.F.; Kronenfeld, B.J. The Colocation Quotient: A New Measure of Spatial Association Between Categorical Subsets of Points. Geogr. Anal. 2011, 43, 306–326. [Google Scholar] [CrossRef]
- Wang, F.; Hu, Y.; Wang, S.; Li, X. Local Indicator of Colocation Quotient with a Statistical Significance Test: Examining Spatial Association of Crime and Facilities. Prof. Geogr. 2017, 69, 22–31. [Google Scholar] [CrossRef]
- Cromley, R.G.; Hanink, D.M.; Bentley, G.C. Geographically Weighted Colocation Quotients: Specification and Application. Prof. Geogr. 2014, 66, 138–148. [Google Scholar] [CrossRef]
- Cromley, E.K.; Wilson-Genderson, M.; Christman, Z.; Pruchno, R.A. Colocation of older adults with successful aging based on objective and subjective measures. Appl. Geogr. 2015, 56, 13–20. [Google Scholar] [CrossRef]
- Hu, Y.; Zhang, Y.; Shelton, K.S. Where are the dangerous intersections for pedestrians and cyclists: A colocation-based approach. Transp. Res. Part C 2018, 95, 431–441. [Google Scholar] [CrossRef]
- Xia, Z.; Li, H.; Chen, Y.; Yu, W. Detecting urban fire high-risk regions using colocation pattern measures. Sustain. Cities Soc. 2019, 49, 101607. [Google Scholar] [CrossRef]
- Kuo, P.F.; Lord, D. Applying the colocation quotient index to crash severity analyses. Accid. Anal. Prev. 2020, 135, 105368. [Google Scholar] [CrossRef]
- Fedorca, A.; Fedorca, M.; Ionescu, O.; Jurj, R.; Ionescu, G.; Popa, M. Sustainable landscape planning to mitigate wildlife–vehicle collisions. Land 2021, 10, 737. [Google Scholar] [CrossRef]
- Echeverri, A.; Naidoo, R.; Karp, D.S.; Chan, K.M.A.; Zhao, J. Iconic manakins and despicable grackles: Comparing cultural ecosystem services and disservices across stakeholders in Costa Rica. Ecol. Indic. 2019, 106, 105454. [Google Scholar] [CrossRef]
Figure 1.
Word cloud representations for HWI (Human-Wildlife-Interactions) and WHI (Wildlife-Human-Interactions).
Figure 1.
Word cloud representations for HWI (Human-Wildlife-Interactions) and WHI (Wildlife-Human-Interactions).

Figure 2.
Heatmap of (a) WHI and (b) HWI.

Figure 3.
Map of LCLQ results for HWI/WHI pair. The p-value index was represented as significant label for p-value < 0.05 and not significant label for p-value > 0.05.
Figure 3.
Map of LCLQ results for HWI/WHI pair. The p-value index was represented as significant label for p-value < 0.05 and not significant label for p-value > 0.05.

Figure 4.
Map of LCLQ results for WHI/HWI pair. The p-value index was represented as significant label for p-value < 0.05 and not significant label for p-value > 0.05.
Figure 4.
Map of LCLQ results for WHI/HWI pair. The p-value index was represented as significant label for p-value < 0.05 and not significant label for p-value > 0.05.


Table 1.
Number of resources acquired for major types of WHI and HWI.
| WHI | HWI | ||
|---|---|---|---|
| Human killed/attack by animal | Human observed/filmed animal | Poaching | Car/rail accident |
| 14 | 10 | 15 | 29 |
Table 2.
GCLQ results for WHI and HWI point categories.
| Pair | GCLQ | p-Value |
|---|---|---|
| WHI/HWI | 0.675 | 0.002 |
| HWI/WHI | 0.696 | 0.002 |
Table 3.
Percentage values from counts of LCLQ results classes for WHI and HWI pairs. The abbreviations have the following meanings: CnS = collocated not significant; CS = collocated significant; InS = isolated not significant; IS = isolated significant.
Table 3.
Percentage values from counts of LCLQ results classes for WHI and HWI pairs. The abbreviations have the following meanings: CnS = collocated not significant; CS = collocated significant; InS = isolated not significant; IS = isolated significant.
| Pair | CnS (%) | CS (%) | InS (%) | IS (%) |
|---|---|---|---|---|
| HWI/WHI | 20.45 | 6.82 | 61.36 | 11.36 |
| WHI/HWI | 27.27 | 0.00 | 18.18 | 54.55 |
Publisher’s Note: MDPI stays neutral with regard to jurisdictional claims in published maps and institutional affiliations. |
© 2022 by the authors. Licensee MDPI, Basel, Switzerland. This article is an open access article distributed under the terms and conditions of the Creative Commons Attribution (CC BY) license (https://creativecommons.org/licenses/by/4.0/).
Share and Cite
MDPI and ACS Style
Pătru-Stupariu, I.; Ionescu, A.; Tudor, R.; Pleșoianu, A.-I.; Clius, M. Online Environment as a Tool to Push Forward the Research: An Example for Landscape Disservices. Land 2022, 11, 234. https://doi.org/10.3390/land11020234
AMA Style
Pătru-Stupariu I, Ionescu A, Tudor R, Pleșoianu A-I, Clius M. Online Environment as a Tool to Push Forward the Research: An Example for Landscape Disservices. Land. 2022; 11(2):234. https://doi.org/10.3390/land11020234
Chicago/Turabian StylePătru-Stupariu, Ileana, Andreea Ionescu, Radu Tudor, Alin-Ionuț Pleșoianu, and Mioara Clius. 2022. "Online Environment as a Tool to Push Forward the Research: An Example for Landscape Disservices" Land 11, no. 2: 234. https://doi.org/10.3390/land11020234
Note that from the first issue of 2016, this journal uses article numbers instead of page numbers. See further details here.