Article

Short-Term Effects and Vegetation Response after a Megafire in a Mediterranean Area

1
Research Centre of S. Teresa, ENEA (Italian National Agency for New Technologies, Energy and Sustainable Economic Development), 19032 Lerici, Italy
2
Department of Life and Environmental Sciences, University of Cagliari, 09123 Cagliari, Italy
*
Author to whom correspondence should be addressed.
Land 2022, 11(12), 2328; https://doi.org/10.3390/land11122328
Submission received: 16 November 2022 / Revised: 11 December 2022 / Accepted: 16 December 2022 / Published: 19 December 2022

Abstract

:
In Mediterranean-climate areas, wildfires have an important ecological role, selecting organisms, influencing species composition and structure of vegetation, and shaping landscapes. However, the increase in frequency and severity of fires can cause, among others, progressive vegetation degradation, biodiversity, and ecosystem services loss. Under the climate change scenario, the frequency and severity of wildfires are expected to increase, especially in the Mediterranean Basin, recognized as among the most affected by the intensification of droughts and heat waves in the future. Therefore, from the perspective of adaptation, it is important not only to assess the sudden effects after a fire but also to investigate the ecological changes and vegetation response over time. In this framework, this study investigates the effects and the short-term vegetation response in an area struck by a megafire. The vegetation response one year after a fire has been assessed in semi-natural grasslands, shrublands, and woodlands at the landscape scale through spectral indices, and at the field scale through floristic and vegetation surveys. Our results showed that after a severe wildfire, although some areas did not exhibit vegetation regrowth, the response of natural vegetation was notable after one year. In the study area, the most resilient vegetation type was semi-natural grasslands, suggesting that this type of vegetation can be crucial for landscape recovery. The other vegetation types showed different response patterns that also prefigure possible changes in species composition and loss of plant diversity over the medium term. This study highlights the value of combining remote sensing spectral analyses and detailed floristic and vegetation surveys for understanding the direction of the early stages of post-fire vegetation dynamics.

1. Introduction

In many areas of the world, fire is an important ecological factor that influences the structure and functions of ecosystems by selecting organisms, affecting ecological biodiversity, nutrient cycles, and the biological, chemical, and physical properties of soils [1,2,3,4]. Mediterranean-climate areas are among the most fire-prone regions in the world, and for millions of years, wildfires have represented a periodic disturbance factor that affected plant species’ traits, compositions, and structures, as well as the dynamics of natural vegetation and, consequently, shaped landscapes [1,2,5]. Among others, it is worth considering that in the Mediterranean Basin, landscapes also derive from a very long history of interactions between man and environmental conditions [6]. Periodical fires, deforestation, and grazing were largely adopted in less favored areas as strategies to maximize the production of goods and ecosystem services, generating typical agro-sylvo-pastoral landscapes currently recognized for their historical and natural values [6,7,8]. Indeed, many habitats of community importance of the Habitat Directive [9] depend on the traditional agro-sylvo-pastoral activities of Mediterranean countries [7,8,10,11,12,13,14].
The effects of fire on ecosystems and landscapes are mainly related to the sudden loss of biomass and habitats, the heat released, and the changes in physicochemical and biological soil properties [1,3,15,16]. Depending on the severity, size, and frequency of fires; the type of vegetation; and other site-specific factors, the consequences can be twofold. Sporadic and low-severity fires can contribute to renewing vegetation and promoting structural complexity and biodiversity of ecosystems, but too frequent, large, and severe fires can cause long-term consequences such as shifts in ecological succession, permanent changes in plant community composition and diversity, ecosystem services loss, changes in soil properties, soil erosion, and runoff [1,3,17,18]. Moreover, frequent and large wildfires can, directly and indirectly, threaten human lives, compromise economic activities and natural resources and contribute to carbon emissions into the atmosphere [17,19,20].
It is well known that in fire-prone regions such as the Mediterranean Basin, plant species are adapted (more resistant or resilient), and the natural vegetation is more resilient to fire [2]. Throughout a wildfire, the individuals of many Mediterranean plant species are adapted to sacrifice themselves or their above-ground portion to guarantee the persistence of plant life. Post-fire vegetation recovery mainly relies on resprouting of new shoots from survived belowground parts of plants or germination of heat tolerant seeds [21,22,23]. For example, in many species, such as those belonging to the Fabaceae and Cistaceae families, seed germination is even increased by exposure to heat, smoke, or ash generated by fire [23,24]. The cork oak (Quercus suber L.) has developed a thick cork bark that forms a fire-resistant cuirass, making it the only European tree capable of epicormic resprouting after high-intensity fires [25,26]. As a result of these strategies, generally, the post-fire vegetation recovery in Mediterranean environments follows an auto-succession model, which takes a relatively short time if compared with other ecoregions, for example only a few years for shrublands [1,2]. Nevertheless, particularly in forest ecosystems, an increasing frequency and severity of fires can induce transitions to other stable non-forest communities [1,27].
In the Mediterranean Basin, an increasing frequency and severity of wildfire events have been observed in the last few years [1,28] and 98% of them are human-induced [2]. This trend is mainly linked to the intensification of droughts and heat waves, and to the progressive land abandonment, which contributes to flammable phytomass accumulation and continuity at the landscape scale [1]. Under the climate change scenario, the frequency and severity of wildfires are expected to increase especially in the Mediterranean Basin, recognized as being among the most affected by intensification in droughts and heat waves in the future [19,22,29]. This evidence raises concern about the possible negative effects on post-fire vegetation recovery dynamics, biodiversity, traditional landscapes, ecosystem functions, and services, and, therefore, on human well-being [2,21].
Consequently, much research has been focused on the effects of fire on vegetation and soil, e.g., [3,30,31,32,33]; post-fire vegetation dynamics, e.g., [1,2,34]; the effects of fire on biodiversity, e.g., [35,36,37]; landscape recovery and fire-risk mitigation, e.g., [38,39,40]; methods based on remote sensing to quantify burned areas, severity levels, vegetation recovery rates and effects of fires on the carbon cycle, e.g., [19,41,42,43,44]. The aim of all these studies can be summarized as the need to comprehend the complex roles and effects of wildfires on ecological systems, the repercussion on human life, and to prevent or mitigate the negative consequences, particularly from the perspective of climate change.
As shown by the ever-growing literature, remote sensing has become an important tool for the analysis of burned areas. The multispectral images captured by the sensors aboard the satellites, such as those of the European Union’s Earth Observation Programme (Copernicus), offer the opportunity to easily estimate the areas affected by wildfires, the impact on vegetation, and the post-fire vegetation dynamics. With these purposes, various spectral indices have been conceived to compare pre- and post-fire spectral reflectance, or to measure changes over time. Among the spectral indices, those based on short-wave infrared (SWIR) and near-infrared (NIR) wavelengths (e.g., the differenced normalized burn ratio (dNBR)) are recognized as the most reliable for quantifying burned areas, estimating burn severity, and detecting post-fire vegetation recovery [19,20,21]. Although spectral indices provide information on spectral vegetation changes and contribute to assessing the post-fire vegetation recovery rates, they do not provide information on vegetation structural changes [1]. To assess the effective impact of fire on vegetation and soil, and to better understand the trends of vegetation dynamics in terms of structure and species composition, remote sensing spectral analyses may be combined with field surveys [45,46].
Although several studies have investigated the post-fire vegetation recovery in different terrestrial ecosystems, e.g., [42,47,48,49,50,51,52,53,54], there have not been many studies that specifically explored the response of natural vegetation in a relatively short span of time after a fire in the context of Mediterranean landscapes. Particularly, in the first years after a fire, vegetation is heavily reduced or simplified in its structure and diversity [2,51], landscapes are affected in their ecological complexity [55] and identity value [56], and soil runoff and erosion increase by several times compared to natural conditions [18]. Therefore, the first years after a fire are the most critical and deserve more attention to promptly understand the short-term effects of fire, analyze the strength of the first stages of vegetation recovery, and identify the most vulnerable areas where to concentrate possible restoration plans. This is especially important in terms of adaptation in the context of climate change.
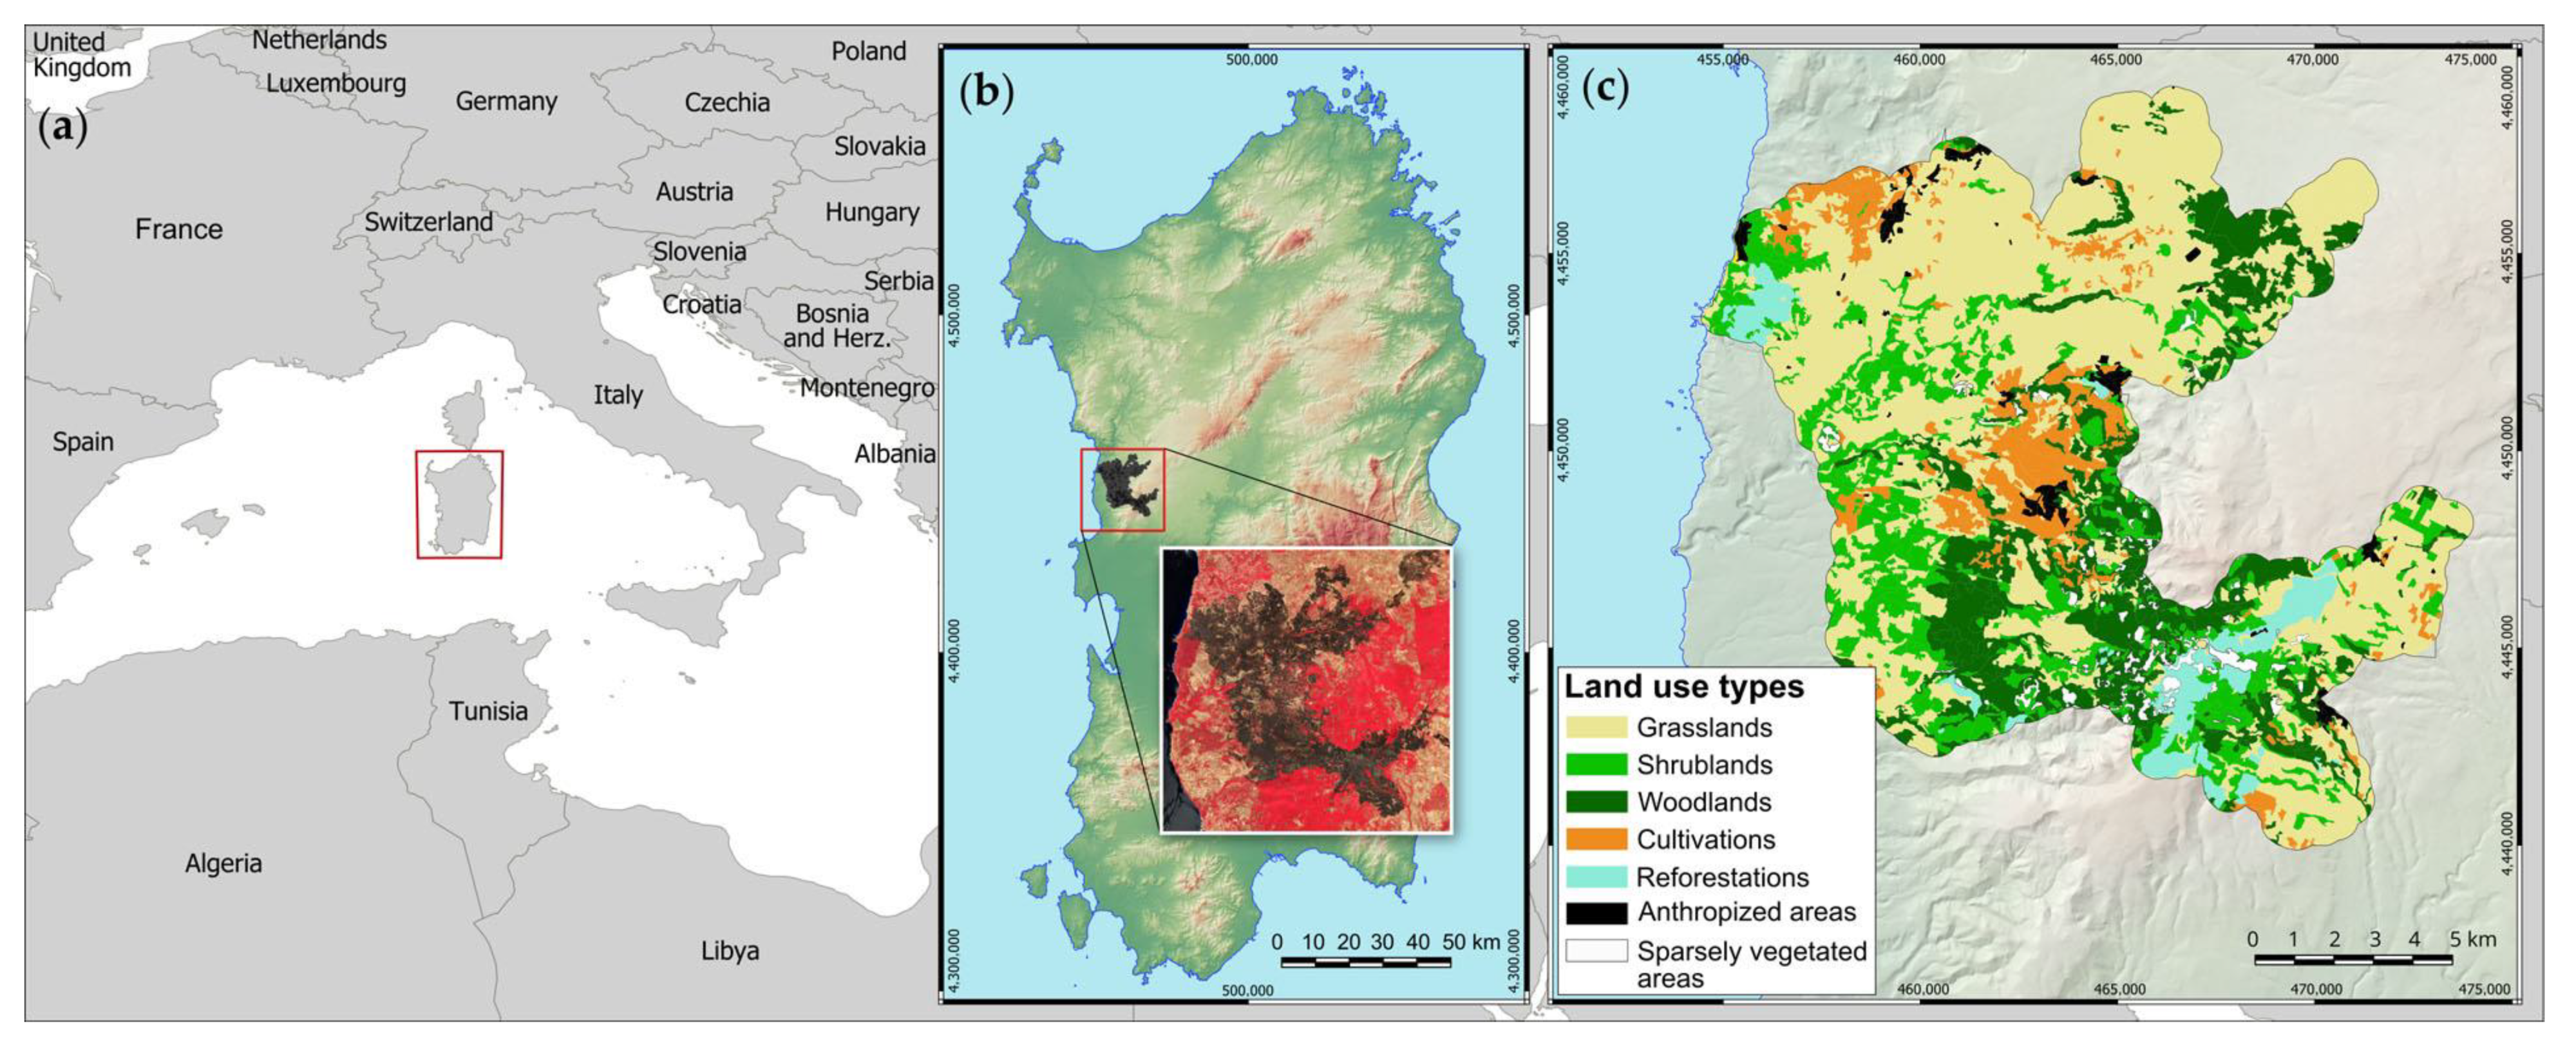
In this framework, the aim of this study was to investigate the short-term vegetation response in the context of an agro-sylvo-pastoral Mediterranean landscape struck by a “megafire”, i.e., a wildfire that exceeds 10,000 ha in area [57]. More precisely, it was the largest wildfire in Italy in 2021 [58]. Vegetation recovery one year after the fire has been studied in three main types of vegetation that represent different stages of the vegetation series: semi-natural grasslands, shrublands, and woodlands. Multispectral data from the Copernicus Sentinel-2 mission were used to estimate burn severity levels after the fire extinction and vegetation regeneration rate one year later. In addition, one year after the fire, field surveys were carried out to estimate total vegetation cover and height, plant species presence, and abundance in burned and unburned areas.

2. Materials and Methods

2.1. Study Area

The study area (40°17′/40°6′ N–8°28′/8°42′ E) is located in central-western Sardinia (Italy) (Figure 1). The topography is characterized by a massif derived from a shield volcano of Plio-Pleistocene surrounded by a large volcanic plateau. The relief of Montiferru dominates the Plio-Pleistocene volcanic landscape system which is composed of rhyolites and phonolites with trachybasalt dykes, alkaline and hawaiite basalts, and lava flows of alkaline and transitional basalts that compose the plateaus of Campeda and Abbasanta [59]. The Montiferru massif is steep and with an elevation of more than 1000 m (Mt. Urtigu, 1050 m above sea level is the highest peak). The climate is typically Mediterranean (mean annual temperatures range from 8.8 °C in January to 24.6 °C in August and mean annual rainfall is 739.3 mm).
The bioclimate is Mediterranean pluviseasonal oceanic, upper thermomediterranean to upper mesomediterranean belts, and upper dry to lower humid, according to the Rivas-Martinez classification system [60]. The natural potential vegetation is ascribable to broad-leaved woodlands mainly dominated by Quercus ilex L. and Q. suber, followed by mixed forests with deciduous oaks. The landscape is a heterogeneous mosaic of semi-natural vegetation and land use types, where semi-natural grasslands and fodder crops related to livestock farming are dominant (49%). Woodlands and Mediterranean shrublands are also abundant, with 20% and 16%, respectively. Cultivations, reforestations, urban areas, infrastructures, and other anthropized areas occupy the remaining 15% of the study area [61]. The study area was affected in 2021 by a “megafire” (sensu Linley et al. [57]) that occurred between the 23rd and 28th of July.

2.2. Estimating the Effects of the Megafire

Burned area and burn severity levels were assessed with remote sensing techniques by using pre-fire and post-fire multispectral data from level 2A of the Copernicus Sentinel-2 satellite mission. The normalized burn ratio (NBR) and differenced normalized burn ratio (dNBR) were used as indices with a methodology analogous to that described and assessed by Llorens et al. (2021) [19] for Sentinel-2 data preprocessing fire perimeter delimitation, and burn severity levels estimation. The NBR and dNBR are among the most popular and reliable indices used to detect vegetation changes after fires [19]. These indices use the reflectance in the near-infrared (NIR) and short-wave infrared (SWIR) bands. Healthy vegetation reflects more in the NIR region and less in the SWIR region [19]. Therefore, in a post-fire scenario, a decrease in the NIR region and an increase in the SWIR region are observed. By using these bands, NBR and dNBR indices were calculated as follows:
NBR = (NIR − SWIR)/(NIR + SWIR),
dNBRpre-post = NBRpre-fire − NBRpost-fire.
where dNBRpre-post has been scaled by 1000 as suggested by Key and Benson 2006 [46].
Cloudless satellite images with acquisition dates (Pre: 22 July 2021, Post: 30 July 2021) close to the fire dates were chosen to calculate the pre-fire and post-fire NBRs. Since the original NIR and SWIR Sentinel-2 bands have a spatial resolution of 10 m and 20 m respectively, the resulting spatial resolution of the dNBRpre-post raster was 10 m. The dNBRpre-post raster was classified in severity levels according to the classification proposed by the European Forest Fire Information Service (EFFIS, 2022) [62] for dNBR ranges (Table 1).
The area covered by each burn severity level was calculated and expressed as a percentage of the total burned area.
To better understand and explain the spatial distribution of the burn severity levels, the CORINE land use map (1:25,000 scale) [61] has been used. This map was updated through field inspections and photointerpretation on more recent aerial orthophotos [61]. The land cover types referable to semi-natural vegetation were reclassified into three types of vegetation that express different stages of the vegetation series: grasslands, shrublands, and woodlands. All the other land cover types (e.g., urban areas, intensive or extensive cultivations, reforestations, infrastructures, and industrial areas) were excluded from further evaluation. The percentage distribution of each burn severity level was calculated based on the partitioning among the three vegetation types.
To assess for differences in burn severity levels distribution among types of vegetation, the pixel values of dNBRpre-post were sampled at points randomly projected with a density of 1 point per ha and 50 m of minimum distance among points. A total of 10,337 points were projected inside the burned area (5946 for grasslands, 2409 for shrublands, and 1982 for woodlands) and, to compare the dNBRpre-post values with respect to unburned vegetation, 3570 outside the burned area (1966 for grasslands, 601 for shrublands, and 1003 for woodlands). The points outside the burned area were projected within a 100 to 500 m buffer zone around the burned area perimeter. The homogeneity of variance was assessed using Levene’s test, then nonparametric Kruskal–Wallis tests and Dunn’s post hoc comparison were performed to test the null hypothesis.
All cartography computations were performed in QGIS [63], version 3.10. Satellite image download and preprocessing and NBR and dNBR calculations were performed by using Semi-Automatic Classification Plugin [64]. Statistical analyses were done in JASP, version 0.16.3 [65].

2.3. Assessing the Short-Term Vegetation Response

2.3.1. Assessing the Vegetation Recovery at Landscape Scale with Multispectral Data

Vegetation recovery one year after the fire was assessed as spectral recovery by calculating the dNBR with respect to the pre-fire condition and the post-fire condition, as follows:
dNBRpre-1yr = NBRpre-fire − NBR1yr,
dNBRpost-1yr = NBRpost-fire − NBR1yr,
where NBR1yr is the NBR calculated on the images acquired 1 year after the fire extinction date. The indices calculated with Equations (3) and (4) appear to be similar, but they provide different information:
  • dNBRpre-1yr is analogous to dNBRpre-post; therefore it is an indicator of the burn severity level, but it is calculated using the NBR1yr instead of the NBRpost-fire. Therefore, it represents an estimation of the gap the vegetation still has to fill in order to regain its original condition;
  • dNBRpost-1yr, instead, is an estimation of the vegetation recovery. Since vegetation recovery leads to a stronger signal in the NIR region and weaker in the SWIR region, negative values of dNBRpost-1yr are evidence of vegetation regeneration.
To correct for variation between years due to differences in vegetation phenology, dNBRpre-1yr, and dNBRpost-1yr were normalized by subtracting or adding to the values of the burned area the average value of the unburned 100 to 500 m buffer zone. The dNBR values have been scaled by 1000. Cloudless Sentinel-2 images with an acquisition date (1 August 2022) close to the fire extinction anniversary were chosen to compute dNBRpre-1yr and dNBRpost-1yr.
The values of dNBRpre-1yr were classified following the same classes used for the burn severity levels, while dNBRpost-1yr values were classified as recovery levels as shown in Table 2. To classify the recovery levels, the same dNBR ranges used for severity levels were adopted.
The area covered by each dNBRpre-1yr and dNBRpost-1yr class was calculated and expressed as a percentage of the total burned area. The percentage distribution of each class was calculated based on the partitioning among the three vegetation types (grasslands, shrublands, and woodlands).
Differences in dNBRpre-1yr and dNBRpost-1yr values among types of vegetation were assessed in areas classified as having a very high post-fire burn severity. The pixel values were sampled at points randomly projected using a density of 1 point per hectare and 50 m of minimum distance among points. A total of 3914 points were projected inside the burned area (1027 for grasslands, 1524 for shrublands, and 1363 for woodlands). The dNBRpre-1yr and dNBRpost-1yr values were also sampled at 3570 points outside the burned area (1966 for grasslands, 601 for shrublands, and 1003 for woodlands) for comparison with unburned vegetation using the same points projected within the unburned 100 to 500 m buffer zone.
Nonparametric statistical analyses were performed as described in the previous paragraph.
Moreover, to assess if vegetation recovery was affected by post-fire burn severity, the dNBRpost-1yr values were tested for correlation with dNBRpre-post values using the nonparametric Spearman’s rank correlation coefficient (rho). The dNBR values were sampled in the same points randomly projected in the burned area as described in Section 2.2.

2.3.2. Validation of Spectral Recovery through Vegetation Data Collected in the Field

Only areas with very high post-fire burn severity levels were selected to carry out vegetation regeneration surveys in the field. By using the QGIS random points plugin, a total of 145 points were randomly identified inside the burned area (41 for grasslands, 65 for shrublands, 39 for woodlands), and 50 outside the burned area (16 for grasslands, 8 for shrublands, 26 for woodlands) to locate sampling plots 10 × 10 m2 in the field.
Inside each plot, the recovery level was assessed by visually estimating the mean vegetation cover percentage (Cover), the mean height of resprouts (Heightresprouts), and the mean height of the total vegetation (Heighttotal). For grasslands and unburned shrublands and woodlands, only the total height of vegetation was measured; therefore, Heightresprouts and Heighttotal coincide.
Vegetation cover, Heightresprouts, and Heighttotal were summarized as descriptive statistics and tested for correlation with dNBRpre-1yr and dNBRpost-1yr values sampled in correspondence of the same points used to locate the field plots. As a correlation test, Spearman’s rank correlation coefficient (rho) was used. Vegetation data were also tested for differences among vegetation types by running Kruskal–Wallis tests and Dunn’s post hoc comparison.

2.3.3. Characterization of Short-Term Vegetation Response at Field Scale

To obtain a more detailed picture of the vegetation response during the first growing season after the fire, field surveys were carried out at a smaller spatial scale in burned and unburned areas. Inside the same plots used to validate spectral recovery, more detailed vegetation data was recorded: specifically, in addition to the mean height and percentage of coverage, a detailed floristic checklist per plot was compiled and, for structural and diagnostic plant species of each vegetation type, the mean height and relative percentage of coverage were measured. Structural and diagnostic species were identified according to the Italian Interpretation Manual of EU Habitats [66]. In order to optimize the surveys considering the wide extension of the burned area, which embraced a wide altitudinal range and a wide variety of ecological conditions (therefore, various vegetation series), the woodland formations were distinguished on the basis of the dominant tree species (Q. ilex vs. Q. suber), the shrubland formations into two subcategories (thermophilus vs. mesophilus), and grassland formations were considered a single category. The differences between burned and unburned plots for each parameter and vegetation type were statistically analyzed through the Mann–Whitney U test. All the analyses were carried out using the Statistica 8.0 software (Statsoft, Tulsa, OK, USA).

3. Results

3.1. Effects of the Megafire

The total area affected by the megafire was 12,235.5 ha. Figure 2 shows the burn severity levels (i.e., dNBRpre-post) based on the dNBR ranges proposed by the EFFIS.
Very high and high severity levels were the most represented with 38.1% and 32.8% of the burned area, respectively. Moderate severity level covered 21.5% and low severity covered 7.5% of the burned area. Unburned/Very low severity level covered only 0.1% of the burned area.
A very high severity level was prevalent in the southern half of the burned area, where shrublands and woodlands were dominant. In fact, among the three types of vegetation considered in this study, 38.7% of the areas with very high severity levels were in shrublands, 34.6% in woodlands, and 26.7% in grasslands. Other severity levels were, instead, mainly represented in grasslands.
Considering the distribution of the severity levels within the vegetation types, the burned woodlands and shrublands were mainly affected by very high severity with 70.0% and 64.0% of the respective burned area, while only 17.6% of the burned grasslands were affected by the highest severity level.
The Kruskal–Wallis test as well as the Dunn’s post hoc comparison indicate highly significant differences (p < 0.001) of dNBRpre-post values among the considered types of vegetation. Figure 3 graphically shows the distribution of dNBRpre-post values among vegetation types and between burned and unburned areas. Table 3 shows the results of the post hoc analyses for the burned area.

3.2. Short-Term Vegetation Response

3.2.1. Vegetation Recovery at Landscape Scale Assessed with Multispectral Data

Figure 4 shows the burn severity levels one year after the fire and illustrates the gap still occurring between the current and the pre-fire condition of the vegetation in terms of dNBR values (i.e., dNBRpre-1yr).
Very high and high severity levels are greatly resized, covering 2.1% and 8.4% of the burned area, respectively. Moderate severity level covers 15.6% and low severity covers 21.8% of the burned area, while the unburned/very low severity level is now predominant, covering 52.0% of the burned area.
The very high severity level is still prevalent where shrublands and woodlands were dominant. Among the three types of vegetation, 75.0% of the areas with a very high severity level are woodlands, 24.7% are shrublands, and 0.3% are grasslands. Additionally, high and moderate severity levels are mainly in woodlands (55.5% and 46.8%, respectively) and shrublands (39.8% and 37.4%, respectively). Areas with low severity level are mainly shrublands (40.2%) and grasslands (38.0%), while areas with unburned/very low severity levels are almost totally grasslands (87.0%).
Considering the distribution of the severity levels within the vegetation types, the burned woodlands are mainly affected by moderate severity (37.5% of the related burned area), the burned shrublands are mainly affected by low severity (36.4% of the related burned area), and 81.6% of the burned grasslands falls into the unburned/very low severity.
Figure 5 shows, instead, the recovery of vegetation one year after the fire extinction date, in particular, it illustrates the recovery levels of the dNBR values with respect to the post-fire condition (i.e., dNBRpost-1yr).
Very high and high recovery levels affect 9.7% and 55.2% of the burned area, respectively. The moderate recovery level affects 23.7% and low recovery affects 8.2% of the burned area, while the unrecovered level covers 3.1% of the burned area.
Among the three types of vegetation considered, 54.6% of areas with a very high recovery level are grasslands, 25.8% are woodlands, and 19.6% are shrublands. Additionally, high, moderate, and low recovery levels are mainly grasslands (59.2%, 65.9%, and 47.5% respectively). Areas with an unrecovered level are mainly woodlands (67.0%).
Considering the distribution of the recovery levels within the vegetation types, the high recovery level is the most represented (64.4% of the burned area in shrublands, 59.5% in grasslands, and 47.1% in woodlands). In woodlands, 10.5% of the burned area falls in the unrecovered level (2.5% in shrublands and 0.7% in grasslands). Unrecovered woodland areas appear to be located close to the boundary of the burned area, where low and unburned/very low severity levels, based on dNBRpre-post, were detected.
The Kruskal–Wallis test as well as Dunn’s post hoc comparison were applied to dNBRpre-1yr and dNBRpost-1yr values and indicate highly significant differences (p < 0.001) among the considered types of vegetation except for the shrublands–woodlands comparison when considering dNBRpost-1yr. Figure 6 graphically shows the distribution of dNBRpre-1yr and dNBRpost-1yr values among vegetation types and between burned and unburned areas. Table 4 shows the results of the post hoc analyses for the burned area.
As shown by the Spearman’s rank correlation coefficients, the vegetation recovery rate, expressed as dNBRpost-1yr, and the burn severity index, expressed as dNBRpre-post, were strongly inversely correlated (rho values: −0.766 for grasslands, −0.579 for shrublands, −0.684 for woodlands). All Spearman’s rank correlation coefficients were highly significant (p < 0.001). These results suggest that the vegetation regeneration rate is significantly higher, whereas the vegetation damage was higher as well (Figure 7). Figure 7c also shows that, in woodlands, the lowest values of burn severity are also linked to signals of above-ground phytomass loss (i.e., positive values of dNBRpost-1yr). This is in accordance with the map of dNBRpost-1yr (Figure 5), which shows that unrecovered woodland areas appear to be located close to the boundary of the burned area, where low and unburned/very low post-fire severity levels were detected.

3.2.2. Validation of Spectral Recovery through Vegetation Data Collected in the Field

Table 5 shows the median values of cover, the height of resprouts, and the total height of vegetation measured in burned and unburned plots one year after the fire. The median cover and height in burned grasslands were higher than in the unburned condition. Shrublands and woodlands as well showed vegetation regrowth, but median values of cover and height were quite lower than in the unburned condition.
Figure 8 graphically shows the distribution of cover, Heightresprouts, and Heighttotal values among vegetation types in burned and unburned areas. The Kruskal–Wallis test indicated highly significant differences (p < 0.001) in vegetation cover among types of vegetation. Dunn’s post hoc comparison showed highly significant differences (p < 0.001) between burned and unburned conditions, between grasslands and shrublands, and between grasslands and woodlands. Differences between shrublands and woodlands were also significant (p < 0.05). No differences were found in terms of Heightresprouts among vegetation types, while highly significant differences (p < 0.001) were found in terms of Heighttotal. Table 6 shows the results of the post hoc analyses for the burned area.
The Spearman’s rank correlation coefficients (Table 7) show highly significant inverse relationships between vegetation cover and dNBRpre-1yr, and between cover and dNBRpost-1yr, with large rho values. The height of resprouts is not correlated with dNBRpre-1yr and dNBRpost-1yr, while the total height of vegetation shows highly significant relationships with dNBRpre-1yr and dNBRpost-1yr and moderate rho values.

3.2.3. Characterization of Short-Term Vegetation Response at Field Scale

The comparisons of mean height and coverage per plot in burned and unburned formations showed different patterns depending on vegetation category (Figure 9). As expected, the mean (± standard error) height showed a significant reduction in Q. ilex woodlands (from 16.37 ± 0.38 m to 0.76 ± 0.04 m) and in all shrublands (mesophilous: from 4.01 ± 0.26 to 0.85 ± 0.02 m; thermophilous: from 4.21 ± 0.25 m to 0.8 ± 0.02 m), while the reduction was lower in the Q. suber woodlands (from 7.66 ± 0.21 m to 6.02 ± 0.15 m) and an increase was observed in grasslands (from 0.48 ± 0.07 m to 0.98 ± 0.059 m). The Mann–Whitney U tests indicated that these differences were always statistically significant (p < 0.001). The mean coverage in the burned plots showed a significant reduction in Q. ilex woodlands (from 96.87 ± 0.94% to 65.71 ± 3.28%) and in mesophilous shrublands (from 88.02 ± 2.71% to 76.02 ± 1.16%), a less pronounced reduction for Q. suber woodlands (from 98.33 ± 1.05% to 95.08 ± 0.15%) and thermophilous shrublands (from 96.00 ± 1.87% to 87.94 ± 1.77%), while the mean coverage was even greater in grasslands (from 87.14 ± 2.44 to 98.81 ± 0.59%). The Mann–Whitney U tests indicated that these differences were statistically significant for Q. ilex woodlands, shrublands, and grasslands (p < 0.001), while they were not significant for Q. suber woods.
At the specific level (Figure 10), different patterns were observed between burned and unburned areas depending on vegetation category. In burned plots, as previously observed for the mean coverage, a statistically significant reduction of the number of structural/diagnostic plant species was observed in Q.ilex woodlands and in shrublands (p < 0.001 by Mann–Whitney U tests), while the reduction was minimal or absent in Q. suber woodlands and in grasslands (p > 0.05 by Mann–Whitney U tests). The same pattern was observed for a number of other species, which decrease in Q. ilex woodlands and in shrublands (p < 0.001 by Mann–Whitney U tests) and increase in Q. suber woodlands and in grasslands (p > 0.05 by Mann–Whitney U tests). Surprisingly, the coverage showed a different trend: the mean coverage of structural/diagnostic plant species significantly decreased in Q. ilex woodlands and in grasslands (p < 0.05 by Mann–Whitney U tests), while in Q. suber woodlands and in shrublands the reduction was contained (p > 0.05 by Mann–Whitney U tests). Conversely, the other plant species significantly contributed to the coverage in grasslands (from 30.71 ± 11.45% to 77.62 ± 1.91%; p < 0.05 by Mann–Whitney U tests), and Q. suber woodlands (from 22.05 ± 2.81% to 42.14 ± 0.17%; p < 0.001 by Mann–Whitney U tests); the coverage of the other plant species showed a slight reduction in the other vegetation categories, always statistically not significant.

4. Discussion

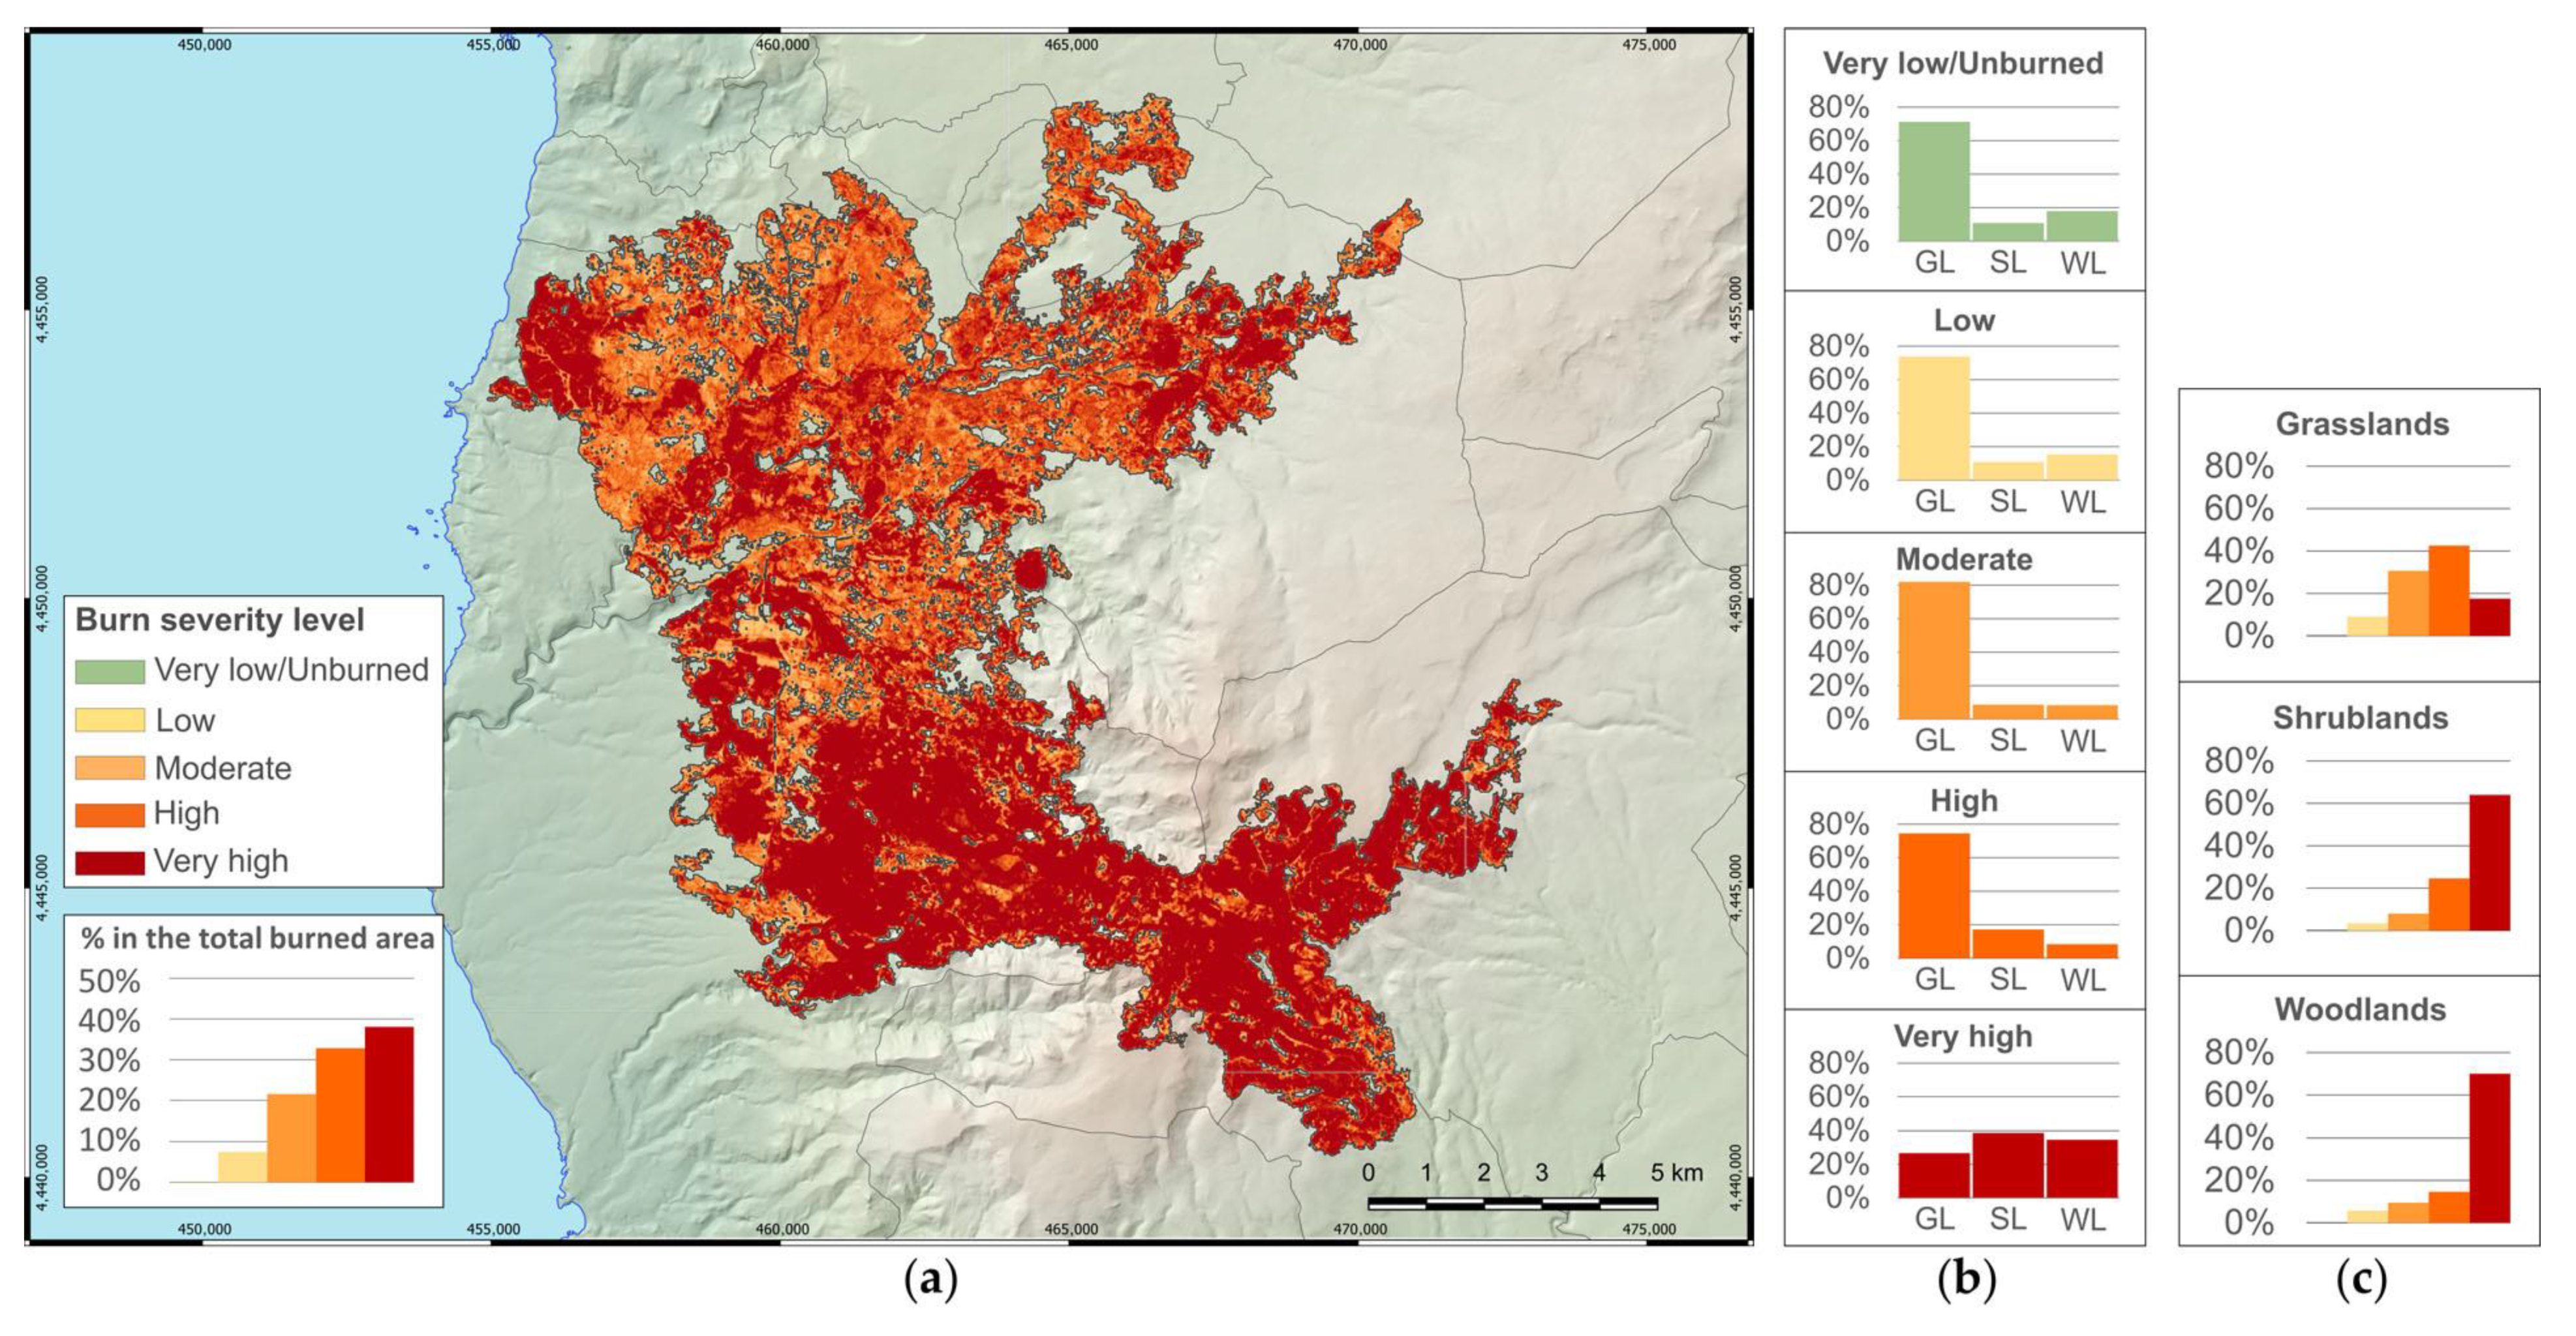
Regarding the effects of the megafire, the total burned area calculated through the dNBR index is 8.5% smaller than that estimated by EFFIS (13,278 ha), which uses MODIS images. This result confirms what has been observed by Llorens et al. 2021 [19] about the better accuracy provided by the high spatial resolution images of Sentinel-2 (resolution 10 m) with respect to MODIS (resolution 250 m) when mapping burned areas. The burned area reveals the magnitude of the megafire (0.5% of the Sardinian territory) which represents 63% of the total burned area in the region in 2021 [58].
Burn severity levels, estimated through the dNBR index, showed that the largest part of the area was affected by the highest severity levels and the very high severity level was the most represented. The relevance of the highest severity levels in the study area was probably related to the widespread presence of semi-natural vegetation at the landscape scale and, consequently, to the large availability of flammable phytomass [5,67] and the high flammability of Mediterranean plant species [68,
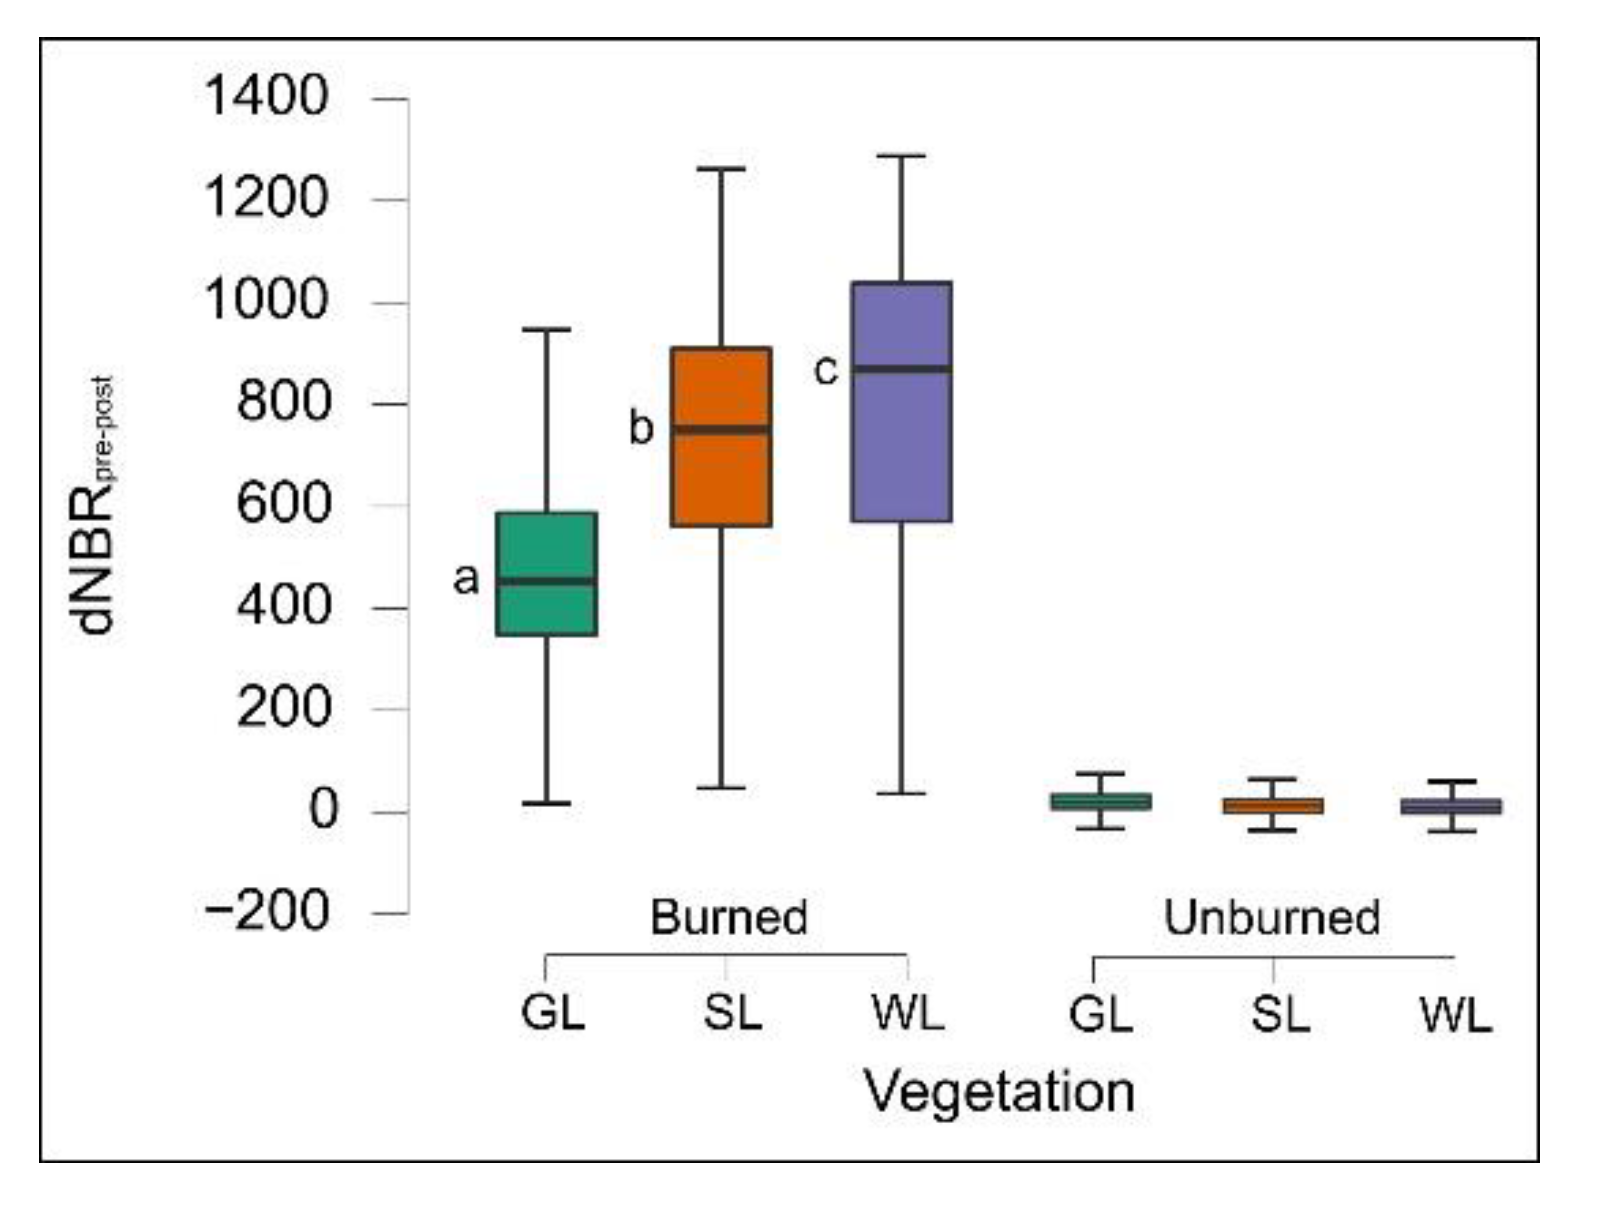
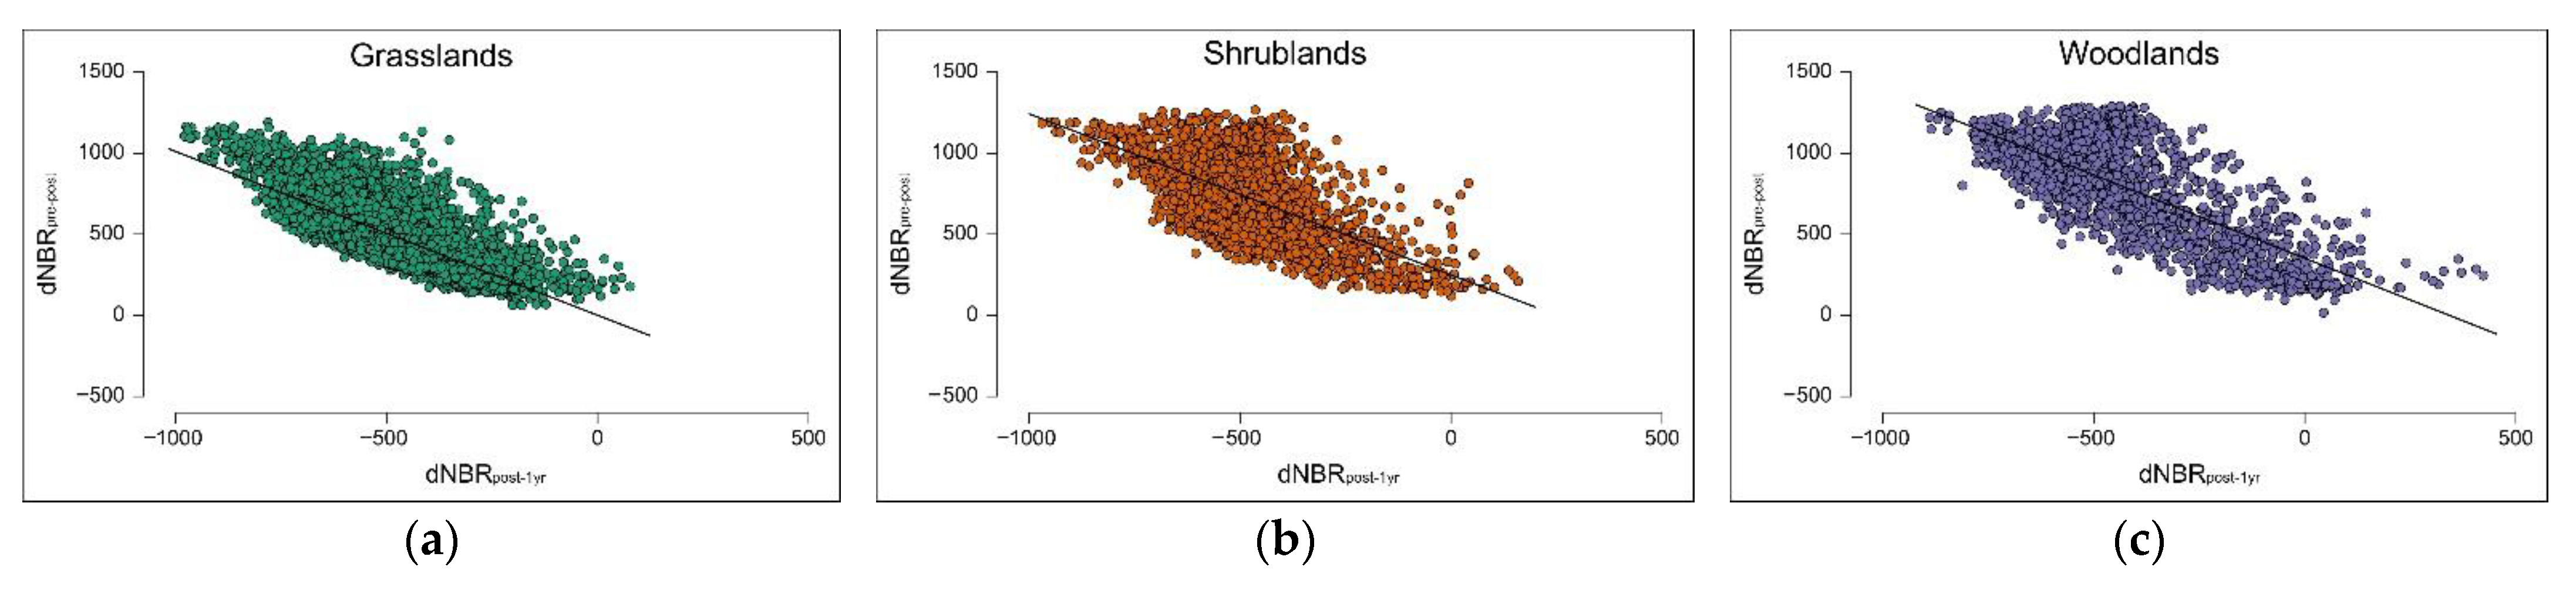
69]. In the study area, patches of woodlands and shrublands are surrounded by a landscape matrix of grasslands mainly consisting of semi-natural plant communities that often include scattered woody species. In fact, the areas classified as very high severity were mostly shrublands and woodlands due to the high presence of flammable phytomass, but an important part was grasslands as well. On the other hand, as expected, when considering the three types of vegetation separately, woodlands and shrublands were mostly affected by very high severity, while grasslands were mainly affected by high and moderate severity. The nonparametric analyses confirmed the significantly different partitioning of dNBRpre-post values among vegetation types, with higher values in woodlands, lower values in shrublands, and the lowest in grasslands, following the different amounts of live above-ground biomass and dead organic matter stocks among the vegetation types [70].
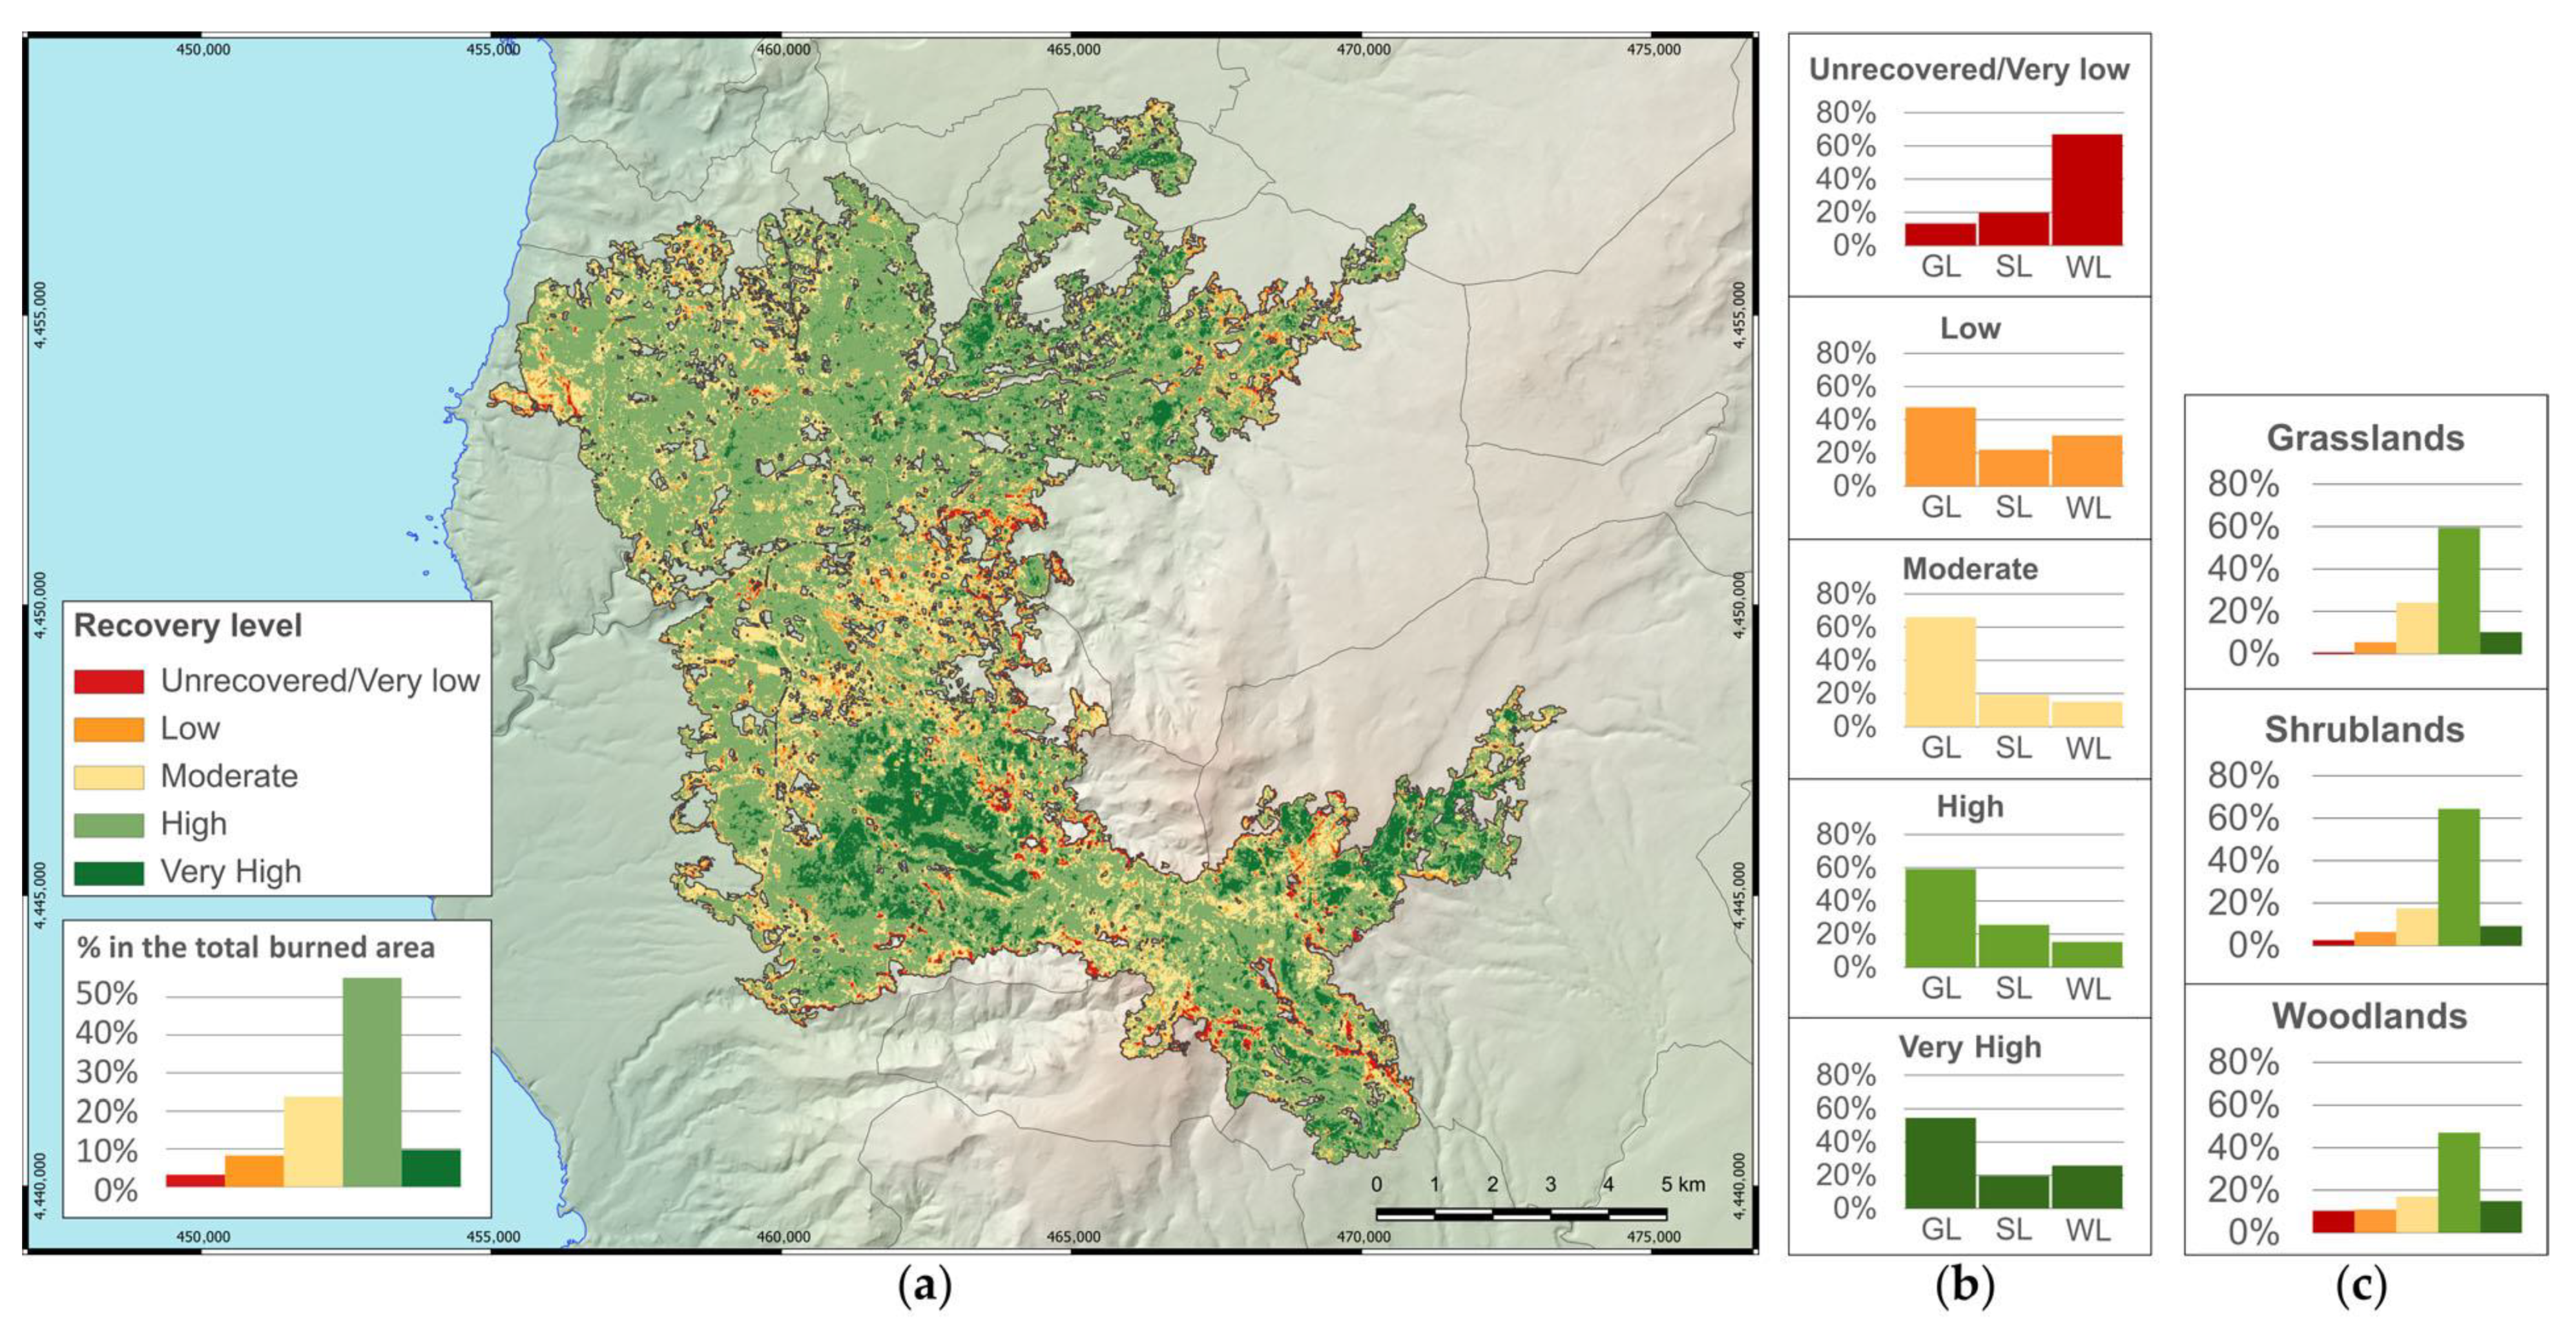
One year after the fire, a telling change in severity levels was observed. The unburned/very low severity level, which was 0.1% of the burned area after fire extinction, covered more than half of the study area one year later. Differences among vegetation types became more explicit, with the highest dNBRpre-1yr values in woodlands, intermediate values in shrublands, and the lowest in grasslands. This is also displayed in a quite clear way by the nonparametric analyses, showing the different resilience of the three vegetation types. It confirmed the high resilience of grasslands with respect to the other types of vegetation, which need more time to regain their original condition [46,71]. In fact, most of the areas classified as unburned/very low severity fell in grasslands and more than four-fifths of grasslands were classified as unburned/very low severity level. The resilience of grasslands has to be considered as a positive aspect from a landscape scale point of view, for different reasons: in the study area, semi-natural grasslands represent the main landscape matrix; therefore, they contribute to a faster recovery of landscape patterns and connectivity [72], and also of cultural ecosystem services such as aesthetic and identity values [56,72]. Herbaceous vegetation of grasslands can quickly protect soil from erosion risk [72] and grasslands are related to extensive grazing activities, which are among the main sources of income in the area. Additionally, some habitats of community interest and a relevant part of plant diversity are linked to semi-natural grasslands, e.g., [7].
In terms of spectral recovery, one year after the fire, more than half of the burned area showed high and very high recovery levels. Moderate recovery was important as well, covering almost a quarter of the total burned area. These findings confirm that all the vegetation types substantially started to recover, but most of the areas with the highest and moderate recovery levels were included in grasslands. In contrast to dNBRpre-1yr, dNBRpost-1yr values did not differ between shrublands and woodlands. This finding suggests that above-ground phytomass regrowth in shrublands and woodlands, at least during the first year after the fire, proceeds at a similar pace. Areas classified as unrecovered (3.1% of the burned area) mostly fell in woodlands and appear to be located close to the boundaries of the burned area, where low and unburned/very low post-fire severity levels were detected. This observation becomes more evident when correlating the index of spectral recovery (dNBRpost-1yr) with the index of burn severity (dNBRpre-post): all vegetation types showed a highly significant inverse relationship between the indices, suggesting that higher burn severity levels were linked to higher vegetation recovery levels.
One year after the fire, grasslands had totally recovered. In woodlands, the lowest values of burn severity were partially related to positive dNBRpost-1yr values, which indicate phytomass loss. This finding needs further investigations to be clarified, but it can be explained with delayed fire mortality, i.e., tree mortality started with fire, but occurred at a later time, mainly affecting older trees and fire-resistant species such as Quercus spp. [73]. Another explanation can be related to improper attribution of severity levels in some areas, due to commission errors in the computation of dNBRpre-post values. This can occur, for example, in the case of a sub-canopy burn, i.e., when a fire burns only phytomass underneath a dense tree canopy cover. In this case, the satellite sensor cannot detect spectral changes under the tree canopy. Sub-canopy burns are common in low-severity fires; therefore, they can occur near the fire perimeters [74]. Furthermore, post-fire phytomass loss can be attributable to forest fire cleanup operations after fire extinction, such as the removal of hazardous trees or flammable vegetation near the boundaries of the burned area to avoid reignition.
Areas with the highest burn severity and the lowest recovery levels one year after the fire deserve more attention in terms of vegetation dynamics and factors that hamper or slow down it. If any plan for vegetation restoration should be realized, it should be focused on these areas [18,75]. In particular, in burned woodlands low recovery rates were observed, suggesting that in some areas phytomass loss took place during the first year after the fire. Soil erosion risk can be higher if these areas fall in steep slopes [75,76], therefore these should be the areas where to concentrate monitoring activities and, if necessary, plans for vegetation restoration.
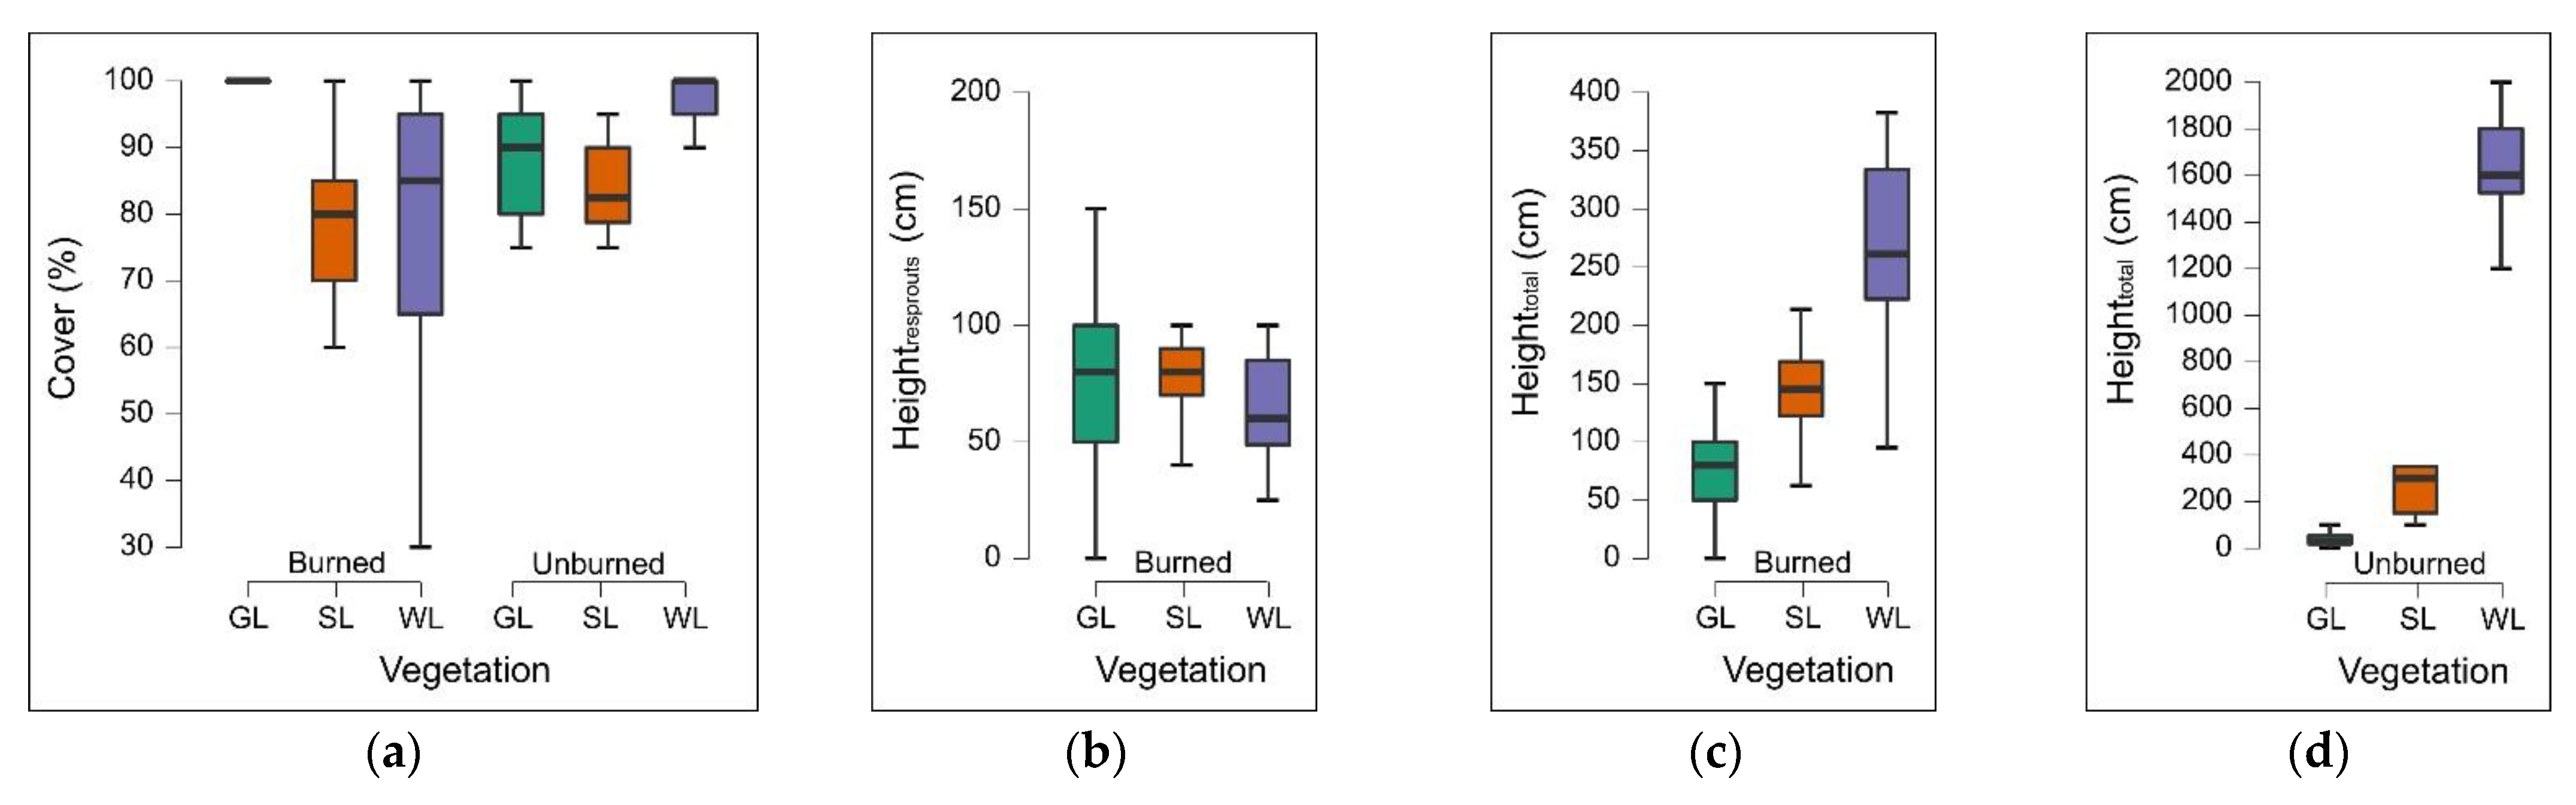
Field data confirmed the trend observed using spectral indices. Vegetation cover in burned grasslands was complete one year after the fire, slightly higher and less variable than in unburned grasslands. Even the median height in burned grasslands was higher than in unburned ones. These findings indicate that above-ground phytomass in burned grasslands is higher than in unburned ones, which could be counterintuitive, but it is possible to offer different explanations for this observation: (i) in the burned grasslands, an increasing presence of Pteridium aquilinum (L.) Kuhn. was observed. This species became dominant in coverage and height in many of the sampled grasslands; (ii) fire increases the soil nutrients which can sustain plant growth and productivity in the short-term [48,77]; (iii) in burned grasslands, the phytomass may have had the possibility to grow more as an effect of the suspension or reduction of grazing activities and other forms of land management [78,79].
Values of dNBRpre-1yr and dNBRpost-1yr showed to be mostly correlated with vegetation cover. The height of resprouts did not show any correlation with dNBR values. In fact, one year after the fire, the median height of new vegetation (Heightresprouts) was similar among vegetation types. It is probably necessary to wait at least the second year after the fire to see a significant correlation between the height of resprouts and dNBR values. Conversely, the total height of vegetation (Heighttotal) seems to be correlated with dNBR values in a reversed way with respect to vegetation cover. However, this result should be considered trivial because the total height of vegetation was the lowest in grasslands and the highest in shrublands and woodlands, while vegetation cover had the opposite trend. Snags of surviving trees and shrubs, which contributed to an increase in the total height of burned shrublands and woodlands, also did not contribute effectively to vegetation cover, as also observed by Bolton et al. (2017) [80] and White et al. (2018) [81] in boreal forests. Therefore, at least during the first year after the fire, in the study area, dNBR values prove to be more correlated with vegetation cover than with vegetation height, and it is due both to no differences in height of new regenerating vegetation and to the presence of residual structures in the canopy (snags of surviving trees and shrubs) that did not contribute to vegetation cover. It is reasonable to expect a clearer correlation between dNBR values and vegetation height with the progress of vegetation recovery.
Detailed field vegetation surveys highlighted a general recovery of all vegetation types, although they followed different patterns related to the strategies adopted by plant species to respond to fire. In particular, Q. suber-dominated communities showed a rapid recovery rate in mean height and coverage thanks to the epicormic resprouting capabilities of trees [25,26]. On the other side, a less considerable recovery has been observed in Q. ilex woodlands, where the recovery was ensured only by basal resprouting. Therefore, in these formations, a significantly lower mean height was observed. A general reduction in mean height and coverage was always observed in both mesophilous and thermophilous shrublands, while grasslands completely recovered in terms of mean height and coverage. In shrublands, vegetation cover was similar between burned and unburned ones and significantly lower than in burned grasslands. Overall, in shrublands and woodlands, vegetation recovery through resprouts was observed, but vegetation recovery was also linked to plants that survived the fire. These surviving plants contribute to the total height of burned vegetation, but one year after the fire the median total height was still quite far from the unburned condition. The general absence of an herbaceous layer in burned shrublands and woodlands one year after the fire has to be pointed out. Hence, vegetation cover in burned shrublands and woodlands was mostly linked to resprouting of survived plants and the germination of shrub and tree seeds. The absence of a herbaceous layer can be explained by the absence of a soil seed bank of herbaceous species [54]. It can be assumed that the absence of the herbaceous layer in burned shrublands and woodlands can expose these less resilient vegetation types to a higher soil erosion risk when the vegetation cover is still incomplete. Although it is not the main subject of this research, the effects of fire on soil properties deserve to be discussed. Indeed, fires not only affect flora, but also soil physical, chemical, and biological properties [3]. Fires influence soil properties in complex ways, including changes in texture and aggregate stability [82], density and porosity [83], water content and repellency [84], organic matter amount and quality [20,85], soil pH [86], soil biota composition and activity [87], nutrient recycling and availability [82], and consequently, affecting the post-fire dynamics of vegetation [3]. In the case study, the impacts of the megafire on soil properties were not addressed, but it is important to consider their possible effects on long-term vegetation dynamics. Moreover, the possible detrimental effects on soil properties and the lack of vegetation cover in the less resilient vegetation types could have an additive effect on soil erosion risk, which can be more serious, especially in steep slopes [75,76].
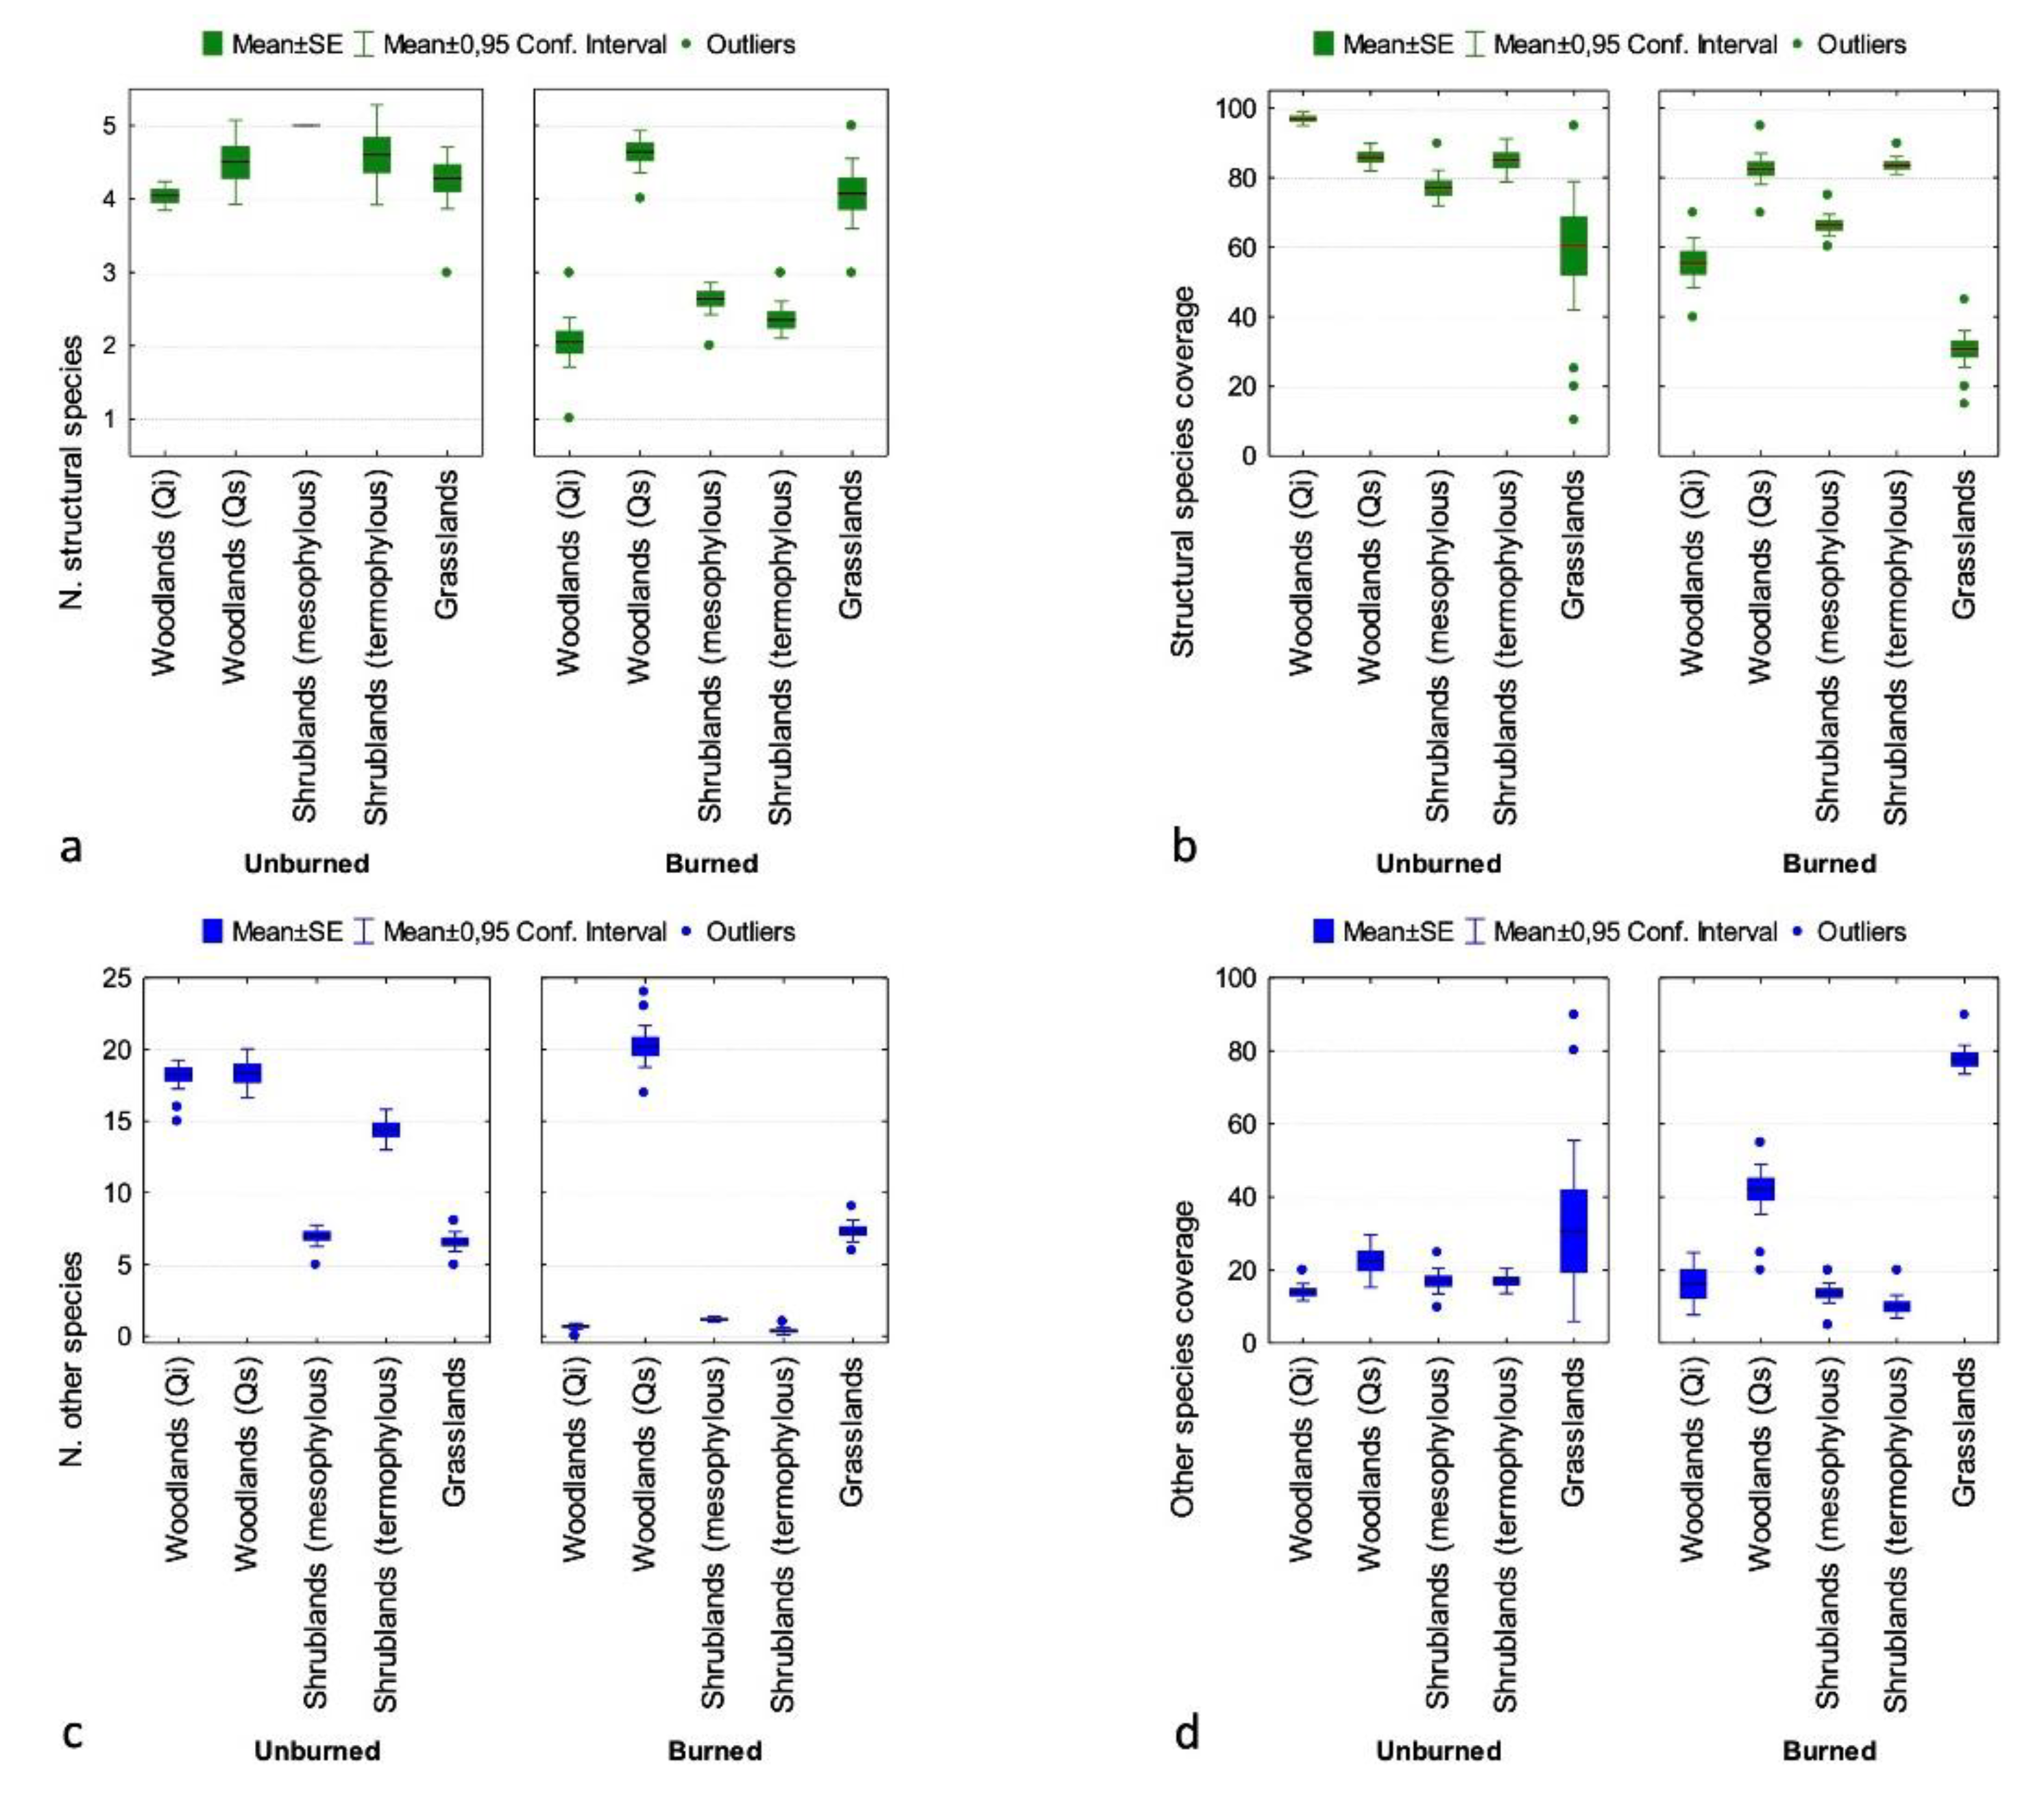
Field surveys showed a general loss of plant diversity in burned areas compared to unburned ones; this loss was probably related to the short time elapsed since the megafire and to the different capability and speed of response of each species. In fact, several plant species mainly linked to the Q. ilex formations, such as Taxus baccata L., Ilex aquifolium L., and Crataegus monogyna Jacq., have not been found. This observation confirms what has been observed in previous studies about the gradual disappearance of T. baccata as an effect of recurring fires [88,89]. Conversely, other species, such as Cytisus villosus Pourr., reached remarkable coverage values in both Q.ilex and Q. suber woodlands, but also in shrublands, where C. villosus, Teline monspessulana (L.) K.Koch., Genista desoleana Vals. subsp. desoleana, and, rarely and limited to the lowest altitudes, Myrtus communis L. reached high coverage values as well. The rapid response to fire of C. villosus, Teline monspessulana, and G. desoleana subsp. desoleana was expected since several studies demonstrated that Fabaceae species show a positive germination response of seeds to heat shock, e.g., [90,91,92], and some Cytisus species also reveal high vegetative post-fire regeneration [93]. Furthermore, the observed increase of C. villosus coverage in the study area is in accordance with what has been observed by Xofis et al. (2021) [2] in northeast Mediterranean ecosystems, where this opportunistic species can become dominant after a fire. In burned grasslands, instead, a pivotal role was played by P. aquilinum, which becomes dominant in height and coverage. It is important to consider that P. aquilinum is a toxic fern species that can be harmful to grazing animals, in particular bovines, and its toxins can probably pass into milk [94,95]. P. aquilinum is a cosmopolitan species that can become invasive in burned or deforested areas, thanks to fire-resistant spores and its long underground rhizomes that store carbohydrates (and are immune to fire) as well as a lot of dormant buds [96]. The post-fire environment is, therefore, favorable for its survival and spread [96,97]. In addition, its high productivity and the emission of allelopathic components, which can hamper the establishment of other plant species, are well documented [96]. For these reasons, the increasing presence of P. aquilinum in burned grasslands is cause for concern since livestock activities based on wild grazing are the prevailing form of land use and one of the main sources of income in the study area.
An alarming observation of this study underlines the loss of several interesting plants from a conservation point of view; in fact, in all burned areas, no signal of recovery was observed for T. baccata, I. aquifolium, and Laurus nobilis L., indicating that, although there was a general positive recovery of all vegetation types, several peculiar floristic elements could be definitively replaced by other species; this process could also imply a progressive loss of habitats, such as the “Arborescent matorral with Laurus nobilis” [98] or the “Mediterranean Taxus baccata woods” [99], which are habitats of European interest. To better investigate this critical aspect, further studies and repeated long-term monitoring activities should be planned in the Montiferru area.

5. Conclusions

This study is one of the first attempts to quantify the short-term response of natural vegetation after a megafire in a traditional agro-sylvo-pastoral Mediterranean landscape. It is mainly focused on the first stages of vegetation recovery in order to contribute to the assessment of natural vegetation resilience in the context of the Mediterranean Basin, which is among the most endangered by wildfire intensification and climate change. The study was carried out at two different spatial scales, but related to each other: the landscape scale, taking advantage of the viewpoint offered by satellites and the power of spectral indices; and the field scale, through floristic and vegetation surveys on the field, which are essential to better understand the true dynamics of plant life.
The results confirm that Mediterranean vegetation can considerably respond to fire in a short span of time. In the case study, post-fire vegetation response in terms of phytomass recovery is noticeable just after the first year, although high and very high post-fire burn severity levels were prevalent. This rapid response is mostly a result of the adaptations that Mediterranean plant species have evolved as post-fire regeneration strategies. Significant regrowth was dependent on basal resprouting strategy, but epicormic resprouting was also important in cork oak-dominated formations. We also confirmed the increased presence of plant taxa that mainly respond as seeders, probably because the seed germinability is favored by heat shock. Moreover, in terms of vegetation types, the study confirms the higher resilience of semi-natural grasslands, which can positively affect the recovery of landscape connectivity, patterns, biodiversity, and identity value. Even though shrublands and woodlands showed to be less resilient than grasslands, they showed a significant capability to respond to the damage caused by the fire and, against expectations, the regeneration rate seems to be proportional to burn severity.
All the findings of this study show the importance of temporal resolution when assessing the short-term effects of a wildfire. This is especially true for fire-prone areas such as the Mediterranean Basin, where the vegetation has developed specific adaptations to respond to fire. In such areas, the post-fire burn severity is not enough to correctly estimate the actual magnitude of the impact, because burn severity levels are not necessarily related to the apparent loss of above-ground phytomass. In fact, the burn severity concept includes short- and long-term impacts in the post-fire environment and it also considers vegetation response processes [4,45,54]. In a Mediterranean context, the assessment of burn severity levels exclusively close to the fire extinction date can lead to misinterpretation of the damage the fire caused to ecosystems. Therefore, for example, some areas can be erroneously classified as having very high severity levels and, consequently, can draw more attention for possible recovery plans, while belowground phytomass is still alive and vegetation is ready to naturally recover. Conversely, at a glance, other areas could seem less damaged and not deserving of attention, but fire-resistant vegetation can be subjected to delayed mortality, plant species of conservation interest could disappear, or invasive species can be favored. Therefore, as also stated by Key 2006 [45] and Key and Benson 2006 [46], for the short-term assessment, it is important to monitor throughout the first year after a fire.
Moreover, the results obtained at the field scale show the relevance of a detailed analysis of flora and vegetation in addition to the remote sensing analysis. This is essential not only to assess the impact of fire on biodiversity, structure, and functions of ecosystems but also to promptly monitor the direction of the early stages of the vegetation dynamics. For example, as shown in the case study, plant communities of semi-natural grasslands used to feed livestock can be subjected to changes in species composition and richness, invasion of noxious species (e.g., P. aquilinum), and, consequently, loss of fodder value. Furthermore, species of conservation interest were not found again during the field surveys. Similarly, the relevance of field scale analyses can also be extended to the assessment of the effects of fire on soil properties, which can affect soil conservation and post-fire vegetation dynamics.
The findings of this study suggest further investigations and repeated monitoring activities in the Montiferru area to contribute to defining specific protocols to evaluate burn severity levels in Mediterranean environments, and to assess vegetation recovery over the medium and long term in order to better understand which factors can hamper or slow down the vegetation dynamics and, if necessary, identify those areas that really need restoration or conservation plans.

Author Contributions

Conceptualization, I.R. and G.F.; methodology, I.R. and G.F.; validation, I.R. and G.F.; formal analysis, I.R., G.F., D.C. and G.C.; investigation, I.R., G.F., D.C. and G.C.; resources, I.R., G.F. and G.C.; data curation, I.R., G.F., D.C. and G.C.; writing—original draft preparation, I.R. and G.F.; writing—review and editing, I.R., G.F., D.C. and G.C.; supervision, I.R. and G.F. All authors have read and agreed to the published version of the manuscript.

Funding

This research received no external funding.

Data Availability Statement

The data presented in this study are available on request from the corresponding author.

Acknowledgments

The authors would like to thank the three anonymous reviewers for their valuable and constructive comments.

Conflicts of Interest

The authors declare no conflict of interest.

References

  1. Nolè, A.; Rita, A.; Spatola, M.F.; Borghetti, M. Biogeographic variability in wildfire severity and post-fire vegetation recovery across the European forests via remote sensing-derived spectral metrics. Sci. Total Environ. 2022, 823, 153807. [Google Scholar] [CrossRef]
  2. Xofis, P.; Buckley, P.G.; Takos, I.; Mitchley, J. Long Term Post-Fire Vegetation Dynamics in North-East Mediterranean Ecosystems. The Case of Mount Athos Greece. Fire 2021, 4, 92. [Google Scholar] [CrossRef]
  3. Agbeshie, A.A.; Abugre, S.; Atta-Darkwa, T.; Awuah, R. A review of the effects of forest fire on soil properties. J. For. Res. 2022, 33, 1419–1441. [Google Scholar] [CrossRef]
  4. Veraverbeke, S.; Lhermitte, S.; Verstraeten, W.; Goossens, R. Assessing burn severity using satellite time series. In Modelling, Monitoring and Management of Forest Fires II; Perona, G., Brebbia, C.A., Eds.; WIT Press: Southampton, UK, 2010; Volume 137, pp. 107–118. [Google Scholar] [CrossRef] [Green Version]
  5. Koutsias, N.; Karteris, M. Classification analyses of vegetation for delineating forest fire fuel complexes in a Mediterranean test site using satellite remote sensing and GIS. Int. J. Remote Sens. 2002, 24, 3093–3104. [Google Scholar] [CrossRef]
  6. Pinto-Correia, T.; Vos, W. Multifunctionality in Mediterranean landscapes: Past and future. In The New Dimensions of the European Landscapes; Jongman, R.H.G., Ed.; Springer: Wageningen, The Netherlands, 2004; Volume 4, pp. 135–164. [Google Scholar]
  7. Rossetti, I.; Bagella, S.; Cappai, C.; Caria, M.C.; Lai, R.; Roggero, P.P.; Martins da Silva, P.; Sousa, J.P.; Querner, P.; Seddaiu, G. Isolated cork oak trees affect soil properties and biodiversity in a Mediterranean wooded grassland. Agric. Ecosyst. Environ. 2015, 202, 203–216. [Google Scholar] [CrossRef]
  8. Caballero, R. High nature value (HNV) grazing systems in Europe: A link between biodiversity and farm economics. Open Agric. J. 2007, 1, 1–19. [Google Scholar] [CrossRef] [Green Version]
  9. Council Directive 92/43/EEC. Official Journal of the European Communities. Available online: http://eur-lex.europa.eu/legal-content/EN/TXT/?uri=CELEX:31992L0043 (accessed on 20 August 2022).
  10. Ustaoglu, E.; Collier, M.J. Farmland abandonment in Europe: An overview of drivers, consequences, and assessment of the sustainability implications. Environ. Rev. 2018, 26, 396–416. [Google Scholar] [CrossRef]
  11. Rossetti, I.; Bagella, S. Mediterranean Quercus suber wooded grasslands risk disappearance: New evidences from Sardinia (Italy). For. Ecol. Manag. 2014, 329, 148–157. [Google Scholar] [CrossRef]
  12. Keenleyside, C.; Tucker, G.M. Farmland Abandonment in the EU: An Assessment of Trends and Prospects; Report Prepared for WWF; Institute for European Environmental Policy: London, UK, 2010; pp. 1–93. [Google Scholar]
  13. Halada, L.; Evans, D.; Romão, C.; Petersen, J.E. Which habitats of European importance depend on agricultural practices? Biodivers. Conserv. 2011, 20, 2365–2378. [Google Scholar] [CrossRef]
  14. Ostermann, O.P. The need for management of nature conservation sites designed under Natura 2000. J. App. Ecol. 1998, 35, 968–973. [Google Scholar] [CrossRef]
  15. Pérez-Cabello, F.; Echeverría, M.T.; Ibarra, P.; de la Riva, J. Effects of Fire on Vegetation, Soil and Hydrogeomorphological Behavior in Mediterranean Ecosystems. In Earth Observation of Wildland Fires in Mediterranean Ecosystems; Chuvieco, E., Ed.; Springer: Berlin/Heidelberg, Germany, 2009; pp. 111–128. [Google Scholar] [CrossRef]
  16. DeBano, L.F. The effect of fire on soil properties. In Proceedings, Management and Productivity of Western-Montane Forest Soils; U.S. Department of Agriculture, Forest Service, Intermountain Research Station: Ogden, UT, USA, 1990. [Google Scholar]
  17. Alarcon-Aguirre, G.; Miranda Fidhel, R.F.; Ramos Enciso, D.; Canahuire-Robles, R.; Rodriguez-Achata, L.; Garate-Quispe, J. Burn Severity Assessment Using Sentinel-1 SAR in the Southeast Peruvian Amazon, a Case Study of Madre de Dios. Fire 2022, 5, 94. [Google Scholar] [CrossRef]
  18. Rulli, M.C.; Offeddu, L.; Santini, M. Modeling post-fire water erosion mitigation strategies. Hydrol. Earth Syst. Sci. 2013, 17, 2323–2337. [Google Scholar] [CrossRef] [Green Version]
  19. Llorens, R.; Sobrino, J.A.; Cristina Fernández, C.; Fernández-Alonso, J.M.; Vega, J.A. A methodology to estimate forest fires burned areas and burn severity degrees using Sentinel-2 data. Application to the October 2017 fires in the Iberian Peninsula. Int. J. Appl. Earth Obs. Geoinf. 2021, 95, 1–9. [Google Scholar] [CrossRef]
  20. Wei, X.; Hayes, D.J.; Fraver, S.; Chen, G. Global pyrogenic carbon production during recent decades has created the potential for a large, long-term sink of atmospheric CO2. J. Geophys. Res. Biogeosci. 2018, 123, 3682–3696. [Google Scholar] [CrossRef]
  21. Gibson, R.K.; White, L.A.; Hislop, S.; Nolan, R.H.; Dorrough, J. The post-fire stability index; a new approach to monitoring post-fire recovery by satellite imagery. Remote Sens. Environ. 2022, 280, 113151. [Google Scholar] [CrossRef]
  22. Cruz, Ó.; García-Duro, J.; Riveiro, S.F.; García-García, C.; Casal, M.; Reyes, O. Fire Severity Drives the Natural Regeneration of Cytisus scoparius L. (Link) and Salix atrocinerea Brot. Communities and the Germinative Behaviour of These Species. Forests 2020, 11, 124. [Google Scholar] [CrossRef] [Green Version]
  23. de Villalobos, A.E.; Peláez, D.V.; Bóo, R.M.; Mayor, M.D.; Elia, O.R. Effect of high temperatures on seed germination of Prosopis caldenia Burk. J. Arid Environ. 2002, 52, 371–378. [Google Scholar] [CrossRef]
  24. Bekdouche, F.; Sahnoune, M.; Krouchi, F.; Achour, S.; Guemati, N.; Derridj, A. The contribution of legumes to post-fire regeneration of Quercus suber and Pinus halepensis forests in Northeastern Algeria. Rev. Ecol. 2011, 66, 29–42. [Google Scholar] [CrossRef]
  25. Burrows, G.E.; Chisnall, L.K. Buds buried in bark: The reason why Quercus suber (cork oak) is an excellent post-fire epicormic resprouter. Trees 2016, 30, 241–254. [Google Scholar] [CrossRef]
  26. Pausas, J.G. Resprouting of Quercus suber in NE Spain after fire. J. Veg. Sci. 1997, 8, 703–706. [Google Scholar] [CrossRef] [Green Version]
  27. McDowell, N.G.; Allen, C.D.; Anderson-Teixeira, K.; Aukema, B.H.; Bond-Lamberty, B.; Chini, L.; Clark, J.S.; Dietze, M.; Grossiord, C.; Hanbury-Brown, A.; et al. Pervasive shifts in forest dynamics in a changing world. Science 2020, 368, 9463. [Google Scholar] [CrossRef]
  28. de Rigo, D.; Libertà, G.; Houston Durrant, T.; Artés Vivancos, T.; San-Miguel-Ayanz, J. Forest Fire Danger Extremes in Europe Under Climate Change: Variability and Uncertainty; Publication Office of the European Union: Luxemburg, 2017. [Google Scholar]
  29. Pinna, M.S.; Loi, M.C.; Calderisi, G.; Fenu, G. Extremes Rainfall Events on Riparian Flora and Vegetation in the Mediterranean Basin: A Challenging but Completely Unexplored Theme. Water 2022, 14, 817. [Google Scholar] [CrossRef]
  30. Hrelja, I.; Šestak, I.; Delač, D.; Pereira, P.; Bogunović, I. Soil Chemical Properties and Trace Elements after Wildfire in Mediterranean Croatia: Effect of Severity, Vegetation Type and Time-Since-Fire. Agronomy 2022, 12, 1515. [Google Scholar] [CrossRef]
  31. Hinojosa, M.B.; Parra, A.; Laudicina, V.A.; Moreno, J.M. Post-fire soil functionality and microbial community structure in a Mediterranean shrubland subjected to experimental drought. Sci. Total Environ. 2016, 573, 1178–1189. [Google Scholar] [CrossRef]
  32. Tessler, N.; Wittenberg, L.; Greenbaum, N. Vegetation cover and species richness after recurrent forest fires in the Eastern Mediterranean ecosystem of Mount Carmel, Israel. Sci. Total Environ. 2016, 572, 1395–1402. [Google Scholar] [CrossRef]
  33. Gower, K.; Fontaine, J.B.; Birnbaum, C.; Enright, N.J. Sequential Disturbance Effects of Hailstorm and Fire on Vegetation in a Mediterranean-Type Ecosystem. Ecosystem 2015, 18, 1121–1134. [Google Scholar] [CrossRef] [Green Version]
  34. Batllori, E.; Ackerly, D.D.; Moritz, M.A. A minimal model of fire-vegetation feedbacks and disturbance stochasticity generates alternative stable states in grassland–shrubland–woodland systems. Environ. Res. Lett. 2015, 10, 034018. [Google Scholar] [CrossRef]
  35. Kelly, L.T.; Giljohann, K.M.; Duane, A.; Aquilué, N.; Archibald, S.; Batllori, E.; Bennett, A.F.; Buckland, S.T.; Canelles, Q.; Clarke, M.F.; et al. Fire and biodiversity in the Anthropocene. Science 2020, 370, eabb0355. [Google Scholar] [CrossRef]
  36. Le Breton, T.D.; Lyons, M.B.; Nolan, R.H.; Penman, T.; Williamson, G.J.; Ooi, M.K. Megafire-induced interval squeeze threatens vegetation at landscape scales. Front. Ecol. Environ. 2022, 20, 327–334. [Google Scholar] [CrossRef]
  37. Legge, S.; Rumpff, L.; Woinarski, J.C.; Whiterod, N.S.; Ward, M.; Southwell, D.G.; Scheele, B.C.; Nimmo, D.G.; Lintermans, M.; Geyle, H.M.; et al. The conservation impacts of ecological disturbance: Time-bound estimates of population loss and recovery for fauna affected by the 2019–2020 Australian megafires. Glob. Ecol. Biogeogr. 2022, 31, 2085–2104. [Google Scholar] [CrossRef]
  38. Bertomeu, M.; Pineda, J.; Pulido, F. Managing Wildfire Risk in Mosaic Landscapes: A Case Study of the Upper Gata River Catchment in Sierra de Gata, Spain. Land 2022, 11, 465. [Google Scholar] [CrossRef]
  39. Mancilla-Ruiz, D.; Barrera, F.d.l.; González, S.; Huaico, A. The Effects of a Megafire on Ecosystem Services and the Pace of Landscape Recovery. Land 2021, 10, 1388. [Google Scholar] [CrossRef]
  40. Duane, A.; Piqué, M.; Castellnou, M.; Brotons, L. Predictive modelling of fire occurrences from different fire spread patterns in Mediterranean landscapes. Int. J. Wildland Fire 2015, 24, 407–418. [Google Scholar] [CrossRef]
  41. Alcaras, E.; Costantino, D.; Guastaferro, F.; Parente, C.; Pepe, M. Normalized Burn Ratio Plus (NBR+): A New Index for Sentinel-2 Imagery. Remote Sens. 2022, 14, 1727. [Google Scholar] [CrossRef]
  42. Guz, J.; Sangermano, F.; Kulakowski, D. The Influence of Burn Severity on Post-Fire Spectral Recovery of Three Fires in the Southern Rocky Mountains. Remote Sens. 2022, 14, 1363. [Google Scholar] [CrossRef]
  43. Miller, J.D.; Knapp, E.E.; Key, C.H.; Skinner, C.N.; Isbell, C.J.; Creasy, R.M.; Sherlock, J.W. Calibration and validation of the relative differenced Normalized Burn Ratio (RdNBR) to three measures of fire severity in the Sierra Nevada and Klamath Mountains, California, USA. Remote Sens. Environ. 2009, 113, 645–656. [Google Scholar] [CrossRef]
  44. Giglio, L.; Randerson, J.T.; van der Werf, G.R. Analysis of daily, monthly, and annual burned area using the fourth-generation global fire emissions database (GFED4). J. Geophys. Res. Biogeosci. 2013, 118, 317–328. [Google Scholar] [CrossRef] [Green Version]
  45. Key, C.H. Ecological and sampling constraints on defining landscape fire severity. Fire Ecol. 2006, 2, 34–59. [Google Scholar] [CrossRef]
  46. Key, C.H.; Benson, N.C. Landscape Assessment (LA) Sampling and Analysis Methods. In FIREMON: Fire Effects Monitoring and Inventory System; USDA Forest Service, Rocky Mountain Research Station: Ogden, UT, USA, 2006. [Google Scholar]
  47. Stewart, J.A.E.; van Mantgem, P.J.; Young, D.J.N.; Shive, K.L.; Preisler, H.K.; Das, A.J.; Stephenson, N.L.; Keeley, J.E.; Safford, H.D.; Wright, M.C.; et al. Effects of postfire climate and seed availability on postfire conifer regeneration. Ecol. Appl. 2021, 31, e02280. [Google Scholar] [CrossRef]
  48. Yan, H.; Liu, G. Fire’s Effects on Grassland Restoration and Biodiversity Conservation. Sustainability 2021, 13, 12016. [Google Scholar] [CrossRef]
  49. Meneses, B.M. Vegetation Recovery Patterns in Burned Areas Assessed with Landsat 8 OLI Imagery and Environmental Biophysical Data. Fire 2021, 4, 76. [Google Scholar] [CrossRef]
  50. Bright, B.C.; Hudak, A.T.; Kennedy, R.E.; Braaten, J.D.; Khalyani, A.H. Examining post-fire vegetation recovery with Landsat time series analysis in three western North American forest types. Fire Ecol. 2019, 15, 8. [Google Scholar] [CrossRef] [Green Version]
  51. Li, X.; Zhang, H.; Yang, G.; Ding, Y.; Zhao, J. Post-Fire Vegetation Succession and Surface Energy Fluxes Derived from Remote Sensing. Remote Sens. 2018, 10, 1000. [Google Scholar] [CrossRef] [Green Version]
  52. Vicente-Serrano, S.M.; Pérez-Cabello, F.; Lasanta, T. Pinus halepensis regeneration after a wildfire in a semiarid environment: Assessment using multitemporal Landsat images. Int. J. Wildland Fire 2011, 20, 195–208. [Google Scholar] [CrossRef]
  53. Meira-Neto, J.A.A.; Clemente, A.; Oliveira, G.; Nunes, A.; Correia, O. Post-fire and post-quarry rehabilitation successions in Mediterranean-like ecosystems: Implications for ecological restoration. Ecol. Eng. 2011, 37, 1132–1139. [Google Scholar] [CrossRef]
  54. Lentile, L.B.; Morgan, P.; Hudak, A.T.; Bobbitt, M.J.; Lewis, S.A.; Smith, A.M.S.; Robichaud, P.R. Post-Fire Burn Severity and Vegetation Response Following Eight Large Wildfires Across the Western United States. Fire Ecol. 2007, 3, 91–108. [Google Scholar] [CrossRef]
  55. Driscoll, D.; Armenteras, D.; Bennett, A.; Clarke, M.; Doherty, T.; Haslem, A.; Kelly, L.; Sato, C.; Sitters, H.; Bell, K.; et al. How fire interacts with habitat loss and fragmentation. Biol. Rev. 2021, 96, 976–998. [Google Scholar] [CrossRef]
  56. Butler, A.; Sarlöv-Herlin, I.; Knez, I.; Ångman, E.; Sang, Å.O.; Åkerskog, A. Landscape identity, before and after a forest fire. Landsc. Res. 2018, 43, 878–889. [Google Scholar] [CrossRef]
  57. Linley, G.D.; Jolly, C.J.; Doherty, T.S.; Geary, W.L.; Armenteras, D.; Belcher, C.M.; Bliege Bird, R.; Duane, A.; Fletcher, M.-S.; Giorgis, M.A.; et al. What do you mean, ‘megafire’? Glob. Ecol. Biogeogr. 2022, 31, 1906–1922. [Google Scholar] [CrossRef]
  58. San-Miguel-Ayanz, J.; Durrant, T.; Boca, R.; Maianti, P.; Libertá, G.; Artés-Vivancos, T.; Oom, D.; Branco, A.; de Rigo, D.; Ferrari, D.; et al. Forest Fires in Europe, Middle East and North Africa 2021; Publications Office of the European Union: Luxembourg, 2022; pp. 40–49. [Google Scholar] [CrossRef]
  59. Carmignani, L.; Oggiano, G.; Funedda, A.; Conti, P.; Pasci, S.; Barca, S. Carta Geologica della Sardegna; Litografia Artistica Cartografica: Florence, Italy, 2008. [Google Scholar]
  60. Rivas-Martínez, S.; Rivas-Saenz, S. Worldwide bioclimatic classification system. Glob. Geobot. 2011, 1, 1–634. [Google Scholar] [CrossRef]
  61. Regione Autonoma della Sardegna (RAS). Available online: https://www.sardegnageoportale.it/ (accessed on 20 August 2022).
  62. European Forest Fire Information System (EFFIS). Available online: https://effis.jrc.ec.europa.eu/about-effis/technical-background/rapid-damage-assessment (accessed on 20 August 2022).
  63. QGIS Development Team. QGIS Geographic Information System. Open Source Geospatial Foundation Project. 2022. Available online: http://qgis.osgeo.org (accessed on 18 July 2019).
  64. Congedo, L. Semi-Automatic Classification Plugin: A Python tool for the download and processing of remote sensing images in QGIS. J. Open Source Softw. 2021, 6, 1–6. [Google Scholar] [CrossRef]
  65. JASP, version 0.16.3; University of Amsterdam: Amsterdam, The Netherlands, 2022.
  66. Biondi, E.; Blasi, C.; Burrascano, S.; Casavecchia, S.; Copiz, R.; Del Vico, E.; Galdenzi, D.; Gigante, D.; Lasen, C.; Spampinato, G.; et al. Manuale Italiano di Interpretazione degli Habitat della Direttiva 92/43/CEE. Società Botanica Italiana. Ministero dell’Ambiente e della Tutela del Territorio e del Mare. 2009. Available online: http://vnr.unipg.it/habitat/ (accessed on 25 August 2022).
  67. Dimitrakopoulos, A.P. Mediterranean fuel models and potential fire behaviour in Greece. Int. J. Wildland Fire. 2002, 11, 127–130. [Google Scholar] [CrossRef]
  68. Dimitrakopoulos, A.P. A statistical classification of Mediterranean species based on their flammability components. Int. J. Wildland Fire 2001, 10, 113–118. [Google Scholar] [CrossRef]
  69. Fares, S.; Bajocco, S.; Salvati, L.; Camarretta, N.; Dupuy, J.L.; Xanthopoulos, G.; Guijarro, M.; Madrigal, J.; Hernando, C.; Corona, P. Characterizing potential wildland fire fuel in live vegetation in the Mediterranean region. Ann. For. Sci. 2017, 74, 1–14. [Google Scholar] [CrossRef] [Green Version]
  70. Aalde, H.; Gonzalez, P.; Gytarsky, M.; Krug, T.; Kurz, W.A.; Lasco, R.D.; Martino, D.L.; McConkey, B.G.; Ogle, S.; Paustian, K.; et al. Chapter 2: Generic methodologies applicable to multiple land-use categories. In IPCC Guidelines for National Greenhouse Gas Inventories: Agriculture, Forestry and Other Land Use; National Greenhouse Gas Inventories Programme; Buendia, L., Miwa, K., Ngara, T., Tanabe, K., Eds.; Institute for Global Environmental Strategies (IGES): Hayama, Japan, 2006; Volume 4, pp. 1–59. [Google Scholar]
  71. Stavi, I. Wildfires in Grasslands and Shrublands: A Review of Impacts on Vegetation, Soil, Hydrology, and Geomorphology. Water 2019, 11, 1042. [Google Scholar] [CrossRef] [Green Version]
  72. Varela, E.; Robles-Cruz, A.B. Ecosystem services and socio-economic benefits of Mediterranean grasslands. In Ecosystem Services and Socio-Economic Benefits of Mediterranean Grasslands, Option Méditerranéennes 114; Kyriazopoulos, A., Lόpez-Francos, A., Porqueddu, C., Sklavou, P., Eds.; CHIEAM: Zaragoza, Spain, 2016; pp. 29–42. [Google Scholar]
  73. Robbins, Z.J.; Loudermilk, E.L.; Reilly, M.J.; O’Brien, J.J.; Jones, K.; Gerstle, C.T.; Scheller, R.M. Delayed fire mortality has long-term ecological effects across the Southern Appalachian landscape. Ecosphere 2022, 13, 1–11. [Google Scholar] [CrossRef]
  74. Kolden, C.A.; Lutz, J.A.; Key, C.H.; Kane, J.T.; van Wagtendonk, J.W. Mapped versus actual burned area within wildfire perimeters: Characterizing the unburned. For. Ecol. Manag. 2012, 286, 38–47. [Google Scholar] [CrossRef]
  75. Pausas, J.G.; Vallejo, V.R. The role of fire in European Mediterranean ecosystems. In Remote Sensing of Large Wildfires; Chuvieco, E., Ed.; Springer: Berlin/Heidelberg, Germany, 1999; pp. 3–16. [Google Scholar] [CrossRef]
  76. Kefi, M.; Yoshino, K.; Setiawan, Y.; Zayani, K.; Boufaroua, M. Assessment of the effects of vegetation on soil erosion risk by water: A case of study of the Batta watershed in Tunisia. Environ. Earth Sci. 2011, 64, 707–719. [Google Scholar] [CrossRef]
  77. Deák, B.; Valkó, O.; Török, P.; Végvári, Z.; Härtel, T.; Schmotzer, A.; Kapocsi, I.; Tóthmérész, B. Grassland fires in Hungary—Experiences of nature conservationists on the effects of fire on biodiversity. Appl. Ecol. Environ. Res. 2014, 12, 267–283. [Google Scholar] [CrossRef]
  78. Castro, H.; Freitas, H. Above-ground biomass and productivity in the Montado: From herbaceous to shrub dominated communities. J. Arid Environ. 2009, 73, 506–511. [Google Scholar] [CrossRef] [Green Version]
  79. Škornik, S.; Vidrih, M.; Kaligarič, M. The effect of grazing pressure on species richness, composition and productivity in North Adriatic Karst pastures. Plant Biosyst. 2010, 144, 355–364. [Google Scholar] [CrossRef]
  80. Bolton, D.K.; Coops, C.N.; Hermosilla, T.; Wulder, M.A.; White, J.C. Assessing variability in post-fire forest structure along gradients of productivity in the Canadian boreal using multi-source remote sensing. J. Biogeogr. 2017, 44, 1294–1305. [Google Scholar] [CrossRef]
  81. White, J.C.; Saarinen, N.; Kankare, V.; Wulder, M.A.; Hermosilla, T.; Coops, N.C.; Pickell, P.D.; Holopainen, M.; Hyyppä, J.; Vastaranta, M. Confirmation of post-harvest spectral recovery from Landsat time series using measures of forest cover and height derived from airborne laser scanning data. Remote Sens. Environ. 2018, 216, 262–275. [Google Scholar] [CrossRef]
  82. Alcañiz, M.; Outeiro, L.; Francos, M.; Úbeda, X. Effects of prescribed fires on soil properties: A review. Sci. Total. Environ. 2018, 613, 944–957. [Google Scholar] [CrossRef] [PubMed]
  83. Heydari, M.; Rostamy, A.; Najafi, F.; Dey, D.C. Effect of fire severity on physical and biochemical soil properties in Zagros oak (Quercus brantii Lindl.) forests in Iran. J. For. Res. 2017, 28, 95–104. [Google Scholar] [CrossRef]
  84. Weninger, T.; Filipović, V.; Mešić, M.; Clothier, B.; Filipović, L. Estimating the extent of fire induced soil water repellency in Mediterranean environment. Geoderma 2019, 338, 187–196. [Google Scholar] [CrossRef]
  85. Hobley, E.U.; Brereton, A.J.; Wilson, B. Forest burning affects quality and quantity of soil organic matter. Sci. Total Environ. 2017, 575, 41–49. [Google Scholar] [CrossRef]
  86. Hinojosa, M.B.; Albert-Belda, E.; Gómez-Muñoz, B.; Moreno, J.M. High fire frequency reduces soil fertility underneath woody plant canopies of Mediterranean ecosystems. Sci. Total Environ. 2021, 752, 141877. [Google Scholar] [CrossRef]
  87. Moya, D.; González-De Vega, S.; Lozano, E.; García-Orenes, F.; Mataix-Solera, J.; Lucas-Borja, M.E.; de Las, H.J. The burn severity and plant recovery relationship affect the biological and chemical soil properties of Pinus halepensis Mill. stands in the short and mid-terms after wildfire. J. Environ. Manage. 2019, 235, 250–256. [Google Scholar] [CrossRef]
  88. Piñol, J.; Terradas, J.; Lloret, F. Climate warming, wildfire hazard and wildfire occurrence in coastal Eastern Spain. Clim. Change 1998, 38, 345–357. [Google Scholar] [CrossRef]
  89. Thomas, P.; Garcia-Marti, X. Response of European yews to climate change: A review. For. Syst. 2015, 24, eR01. [Google Scholar] [CrossRef] [Green Version]
  90. González-Rabanal, F.; Casal, M. Effect of high temperatures and ash on germination of ten species from gorse shrubland. Vegetatio 1995, 116, 123–131. [Google Scholar] [CrossRef]
  91. Herránz, J.M.; Ferrandis, P.; Martínez-Sánchez, J.J. Influence of heat on seed germination of seven Mediterranean Leguminosae. Plant. Ecol. 1998, 136, 95–103. [Google Scholar] [CrossRef]
  92. Kazanci, D.; Tavşanoğlu, C. Heat shock-stimulated germination in Mediterranean Basin plants in relation to growth form, dormancy type and distributional range. Folia Geobot. 2019, 54, 85–98. [Google Scholar] [CrossRef]
  93. Fernández-Santos, B.; Martínez, C.; García, J.A.; Puerto, A. Postfire regeneration in Cytisus oromediterraneus: Sources of variation and morphology of the below-ground parts. Acta Oecol. 2004, 26, 149–156. [Google Scholar] [CrossRef]
  94. Alonso-Amelot, M.E.; Castillo, U.; Smith, B.L.; Lauren, D.R. Bracken ptaquiloside in milk. Nature 1996, 382, 587. [Google Scholar] [CrossRef] [PubMed]
  95. Evans, I.A.; Jones, R.S.; Mainwaring-Burton, R. Passage of Bracken Fern Toxicity into Milk. Nature 1972, 237, 107–108. [Google Scholar] [CrossRef]
  96. de Silva, Ú.S.R.D.; Matos, D.M. The invasion of Pteridium aquilinum and the impoverishment of the seed bank in fire prone areas of Brazilian Atlantic Forest. Biodivers. Conserv. 2006, 15, 3035–3043. [Google Scholar] [CrossRef]
  97. Snow, C.S.R.; Marrs, R.H. Restoration of Calluna heathland on a bracken Pteridium-infested site in North West England. Biol. Conserv. 1997, 81, 35–42. [Google Scholar] [CrossRef]
  98. Bacchetta, G.; Farris, E.; Fenu, G.; Filigheddu, R.; Mattana, E.; Mulè, P. Contributo alla conoscenza dei boschi a Laurus nobilis L. della Sardegna, habitat prioritario ai sensi della Direttiva 92/43/CEE. Fitosociologia 2007, 44 (Suppl. 2), 239–244. [Google Scholar]
  99. Farris, E.; Fenu, G.; Bacchetta, G. Mediterranean Taxus baccata woodlands in Sardinia: A characterization of the EU priority habitat 9580. Phytocoenologia 2012, 41, 231–246. [Google Scholar] [CrossRef]
Figure 1. Location of the study area. (a) Location of Sardinia region (Italy). (b) Focus map of the region with the location of the study area. The image superimposed on the map shows in false colors (based on NIR, red, and green bands) a detail of the area struck by the megafire. (c) A map of land use types in the study area. The reference system is WGS84–UTM.
Land 11 02328 g001
Figure 2. Post-fire burn severity (dNBRpre-post) in the study area. (a) Map of burn severity levels. The histogram in the map shows the percentage distribution of severity levels in the total burned area. The reference system is WGS84–UTM. (b) Percentage distribution of severity levels among grasslands (GL), shrublands (SL), and woodlands (WL). (c) Percentage distribution of severity levels within the vegetation types.
Land 11 02328 g002
Figure 3. Boxplot of dNBRpre-post values in burned and unburned grasslands (GL), shrublands (SL), and woodlands (WL). The boxes show the interquartile range, horizontal bars show median values, and vertical bars show the top and bottom 25% quartiles.
Land 11 02328 g003
Figure 4. Burn severity one year after the fire (dNBRpre-1yr). (a) Map of burn severity levels. The histogram in the map shows the percentage distribution of severity levels in the total burned area. The reference system is WGS84–UTM. (b) Percentage distribution of severity levels among grasslands (GL), shrublands (SL), and woodlands (WL). (c) Percentage distribution of severity levels within the vegetation types.
Land 11 02328 g004
Figure 5. Spectral recovery levels one year after the fire (dNBRpost-1yr). (a) Map of recovery levels. The histogram in the map shows the percentage distribution of recovery levels in the total burned area. The reference system is WGS84–UTM. (b) Percentage distribution of recovery levels among grasslands (GL), shrublands (SL), and woodlands (WL). (c) Percentage distribution of recovery levels within the vegetation types.
Land 11 02328 g005
Figure 6. Boxplots of (a) dNBRpre-1yr and (b) dNBRpost-1yr values in burned and unburned grasslands (GL), shrublands (SL,) and woodlands (WL). The boxes show the interquartile range, horizontal bars show median values, and vertical bars show the top and bottom 25% quartiles.
Land 11 02328 g006
Figure 7. Scatterplots of dNBRpre-post and dNBRpost-1yr correlations for (a) grasslands, (b) shrublands, and (c) woodlands.
Land 11 02328 g007
Figure 8. Boxplots of percent coverage, Heightresprouts, and Heighttotal. (a) Boxplot of percent coverage in burned and unburned grasslands (GL), shrublands (SL), and woodlands (WL). (b) Boxplot of Heightresprouts and (c) Heighttotal in burned vegetation. (d) Boxplot of Heighttotal in unburned vegetation. The boxes show the interquartile range, horizontal bars show median values, and vertical bars show the top and bottom 25% quartiles.
Land 11 02328 g008
Figure 9. Comparison between average height (a) and coverage (b) in the different types of burned and unburned vegetation.
Land 11 02328 g009
Figure 10. Comparison between number (a) and coverage (b) of structural plant species and number (c) and coverage (d) of other plant species in the different types of burned and unburned vegetation.
Land 11 02328 g010
Table 1. Burn severity levels proposed by the EFFIS.
dNBR RangeSeverity Level
dNBR < 100Unburned/Very low
101 ≤ dNBR ≤ 255Low
256 ≤ dNBR ≤ 410Moderate
411 ≤ dNBR ≤ 660High
dNBR > 660Very high
Table 2. Classification of dNBRpost-1yr ranges as recovery levels.
dNBRpost-1yr RangeRecovery Level
dNBR > −100Unrecovered/Very low
−101 ≤ dNBR ≤ −255Low
−256 ≤ dNBR ≤ −410Moderate
−411 ≤ dNBR ≤ −660High
dNBR < −660Very high
Table 3. Dunn’s post hoc comparison for dNBRpre-post values in the burned area.
ComparisonzWiWjpholm
Grasslands–Shrublands−37.9423935.9816670.540<0.001
Grasslands–Woodlands−40.1433935.9817043.029<0.001
Shrublands–Woodlands−4.1166670.5407043.029<0.001
z = z-score; Wi and Wj = mean rank sums; pholm = p-value Holm corrected.
Table 4. Dunn’s post hoc comparison for dNBRpre-1yr and dNBRpost-1yr in the burned area.
VariableComparisonzWiWjpholm
dNBRpre-1yrGrasslands–Shrublands−20.4371062.8761995.223<0.001
Grasslands–Woodlands−32.6931062.8762589.406<0.001
Shrublands–Woodlands−14.1041995.2232589.406<0.001
dNBRpost-1yrGrasslands–Shrublands−16.2991410.8292154.415<0.001
Grasslands–Woodlands−15.8141410.8292149.233<0.001
Shrublands–Woodlands0.1232154.4152149.2330.451
z = z-score; Wi and Wj = mean rank sums; pholm = p-value Holm corrected.
Table 5. Median values of percent coverage, the height of resprouts, and the total height of vegetation. Values in brackets indicate median absolute deviations. N = number of plots.
ConditionVegetationCoverHeightresprouts (cm)Heighttotal (cm)N
BurnedGrasslands100.0% (0.0)80.0 (20.0)80.0 (20.0)41
Shrublands80.0% (10.0)80.0 (10.0)145.0 (23.8)65
Woodlands85.0% (15.0)60.0 (20.0)272.5 (65.0)39
UnburnedGrasslands90.0% (7.5)25.0 (15.0)25.0 (15.0)16
Shrublands82.5% (7.5)300.0 (50.0)300.0 (50.0)8
Woodlands100.0% (0.0)1600.0 (100.0)1600.0 (100.0)26
Table 6. Dunn’s post hoc comparison for vegetation cover, Heightresprouts, and Heighttotal in the burned area.
VariableComparisonzWiWjpholm
CoverGrasslands–Shrublands7.611114.11051.262<0.001
Grasslands–Woodlands5.194114.11066.013<0.001
Shrublands–Woodlands−1.75951.26266.0130.039
Grasslands–Shrublands0.41579.40275.9620.339
HeightresproutsGrasslands–Woodlands1.94479.40261.3330.078
Shrublands–Woodlands1.73875.96261.3330.082
Grasslands–Shrublands−4.22633.34168.715<0.001
HeighttotalGrasslands–Woodlands−9.42633.341121.833<0.001
Shrublands–Woodlands−6.24868.715121.833<0.001
z = z-score; Wi and Wj = mean rank sums; pholm = p-value Holm corrected.
Table 7. Spearman’s rank correlation coefficients (rho).
CorrelationSpearman’s rho
Cover–dNBRpre-1yr−0.708 ***
Cover–dNBRpost-1yr−0.694 ***
Heigthresprouts–dNBRpre-1yr0.042
Heigthresprouts–dNBRpost-1yr−0.017
Heigthtotal–dNBRpre-1yr0.383 ***
Heigthtotal–dNBRpost-1yr0.331 ***
*** p < 0.001.
Publisher’s Note: MDPI stays neutral with regard to jurisdictional claims in published maps and institutional affiliations.

