Article

Ecological Niche Modelling and Potential Distribution of Artemisia sieberi in the Iranian Steppe Vegetation

by
Hamidreza Mirdavoudi
1,*,
Darush Ghorbanian
2,
Sedigheh Zarekia
3,
Javad Miri Soleiman
4,
Mashaalaah Ghonchepur
5,
Eileen Mac Sweeney
6 and
Andrea Mastinu
6,*
1
Forests and Rangelands Research Department, Markazi Agricultural and Natural Resources Research and Education Center, AREEO, Arak 38135, Iran
2
Forests and Rangelands Research Department, Semnan Agricultural and Natural Resources Research and Education Center, AREEO, Semnan 35131, Iran
3
Forests and Rangelands Research Department, Yazd Agricultural and Natural Resources Research and Education Center, AREEO, Yazd 89158, Iran
4
Forests and Rangelands Research Department, North Khorasan Agricultural and Natural Resources Research and Education Center, AREEO, Bojnord 94714, Iran
5
Forests and Rangelands Research Department, Kerman Agricultural and Natural Resources Research and Education Center, AREEO, Kerman 78514, Iran
6
Department of Molecular and Translational Medicine, Division of Pharmacology, University of Brescia, Viale Europa 11, 25123 Brescia, Italy
*
Authors to whom correspondence should be addressed.
Land 2022, 11(12), 2315; https://doi.org/10.3390/land11122315
Submission received: 26 November 2022 / Revised: 12 December 2022 / Accepted: 13 December 2022 / Published: 16 December 2022

Abstract

:
Artemisia sieberi Besser occurs in many parts of the Irano-Turanian floristic region, which is mostly distributed throughout the Iranian plateau, especially in Iran. This study aimed to identify the effect of the soil and topography variables on A. sieberi distribution. We used canopy cover data to fit models using generalized additive models (GAMs). The results showed that the response pattern of A. sieberi along with the gradient of soil clay, soil saturation moisture, soil nitrogen and soil acidity followed the monotonic increase model, and its canopy cover percentage augmented by increasing the values of the factors. Conversely, the A. sieberi canopy cover percentage decreased by increasing the amount of soil sand, bare soil and the geographic aspect. The A. sieberi responses are in contrast to the niche theory. The relationship between the species response pattern and the gradients of soil silt, soil salinity, lime percentage, organic carbon, altitude, land slope, litter, gravel percentage, stone percentage, mean annual precipitation and mean annual temperature followed a unimodal model (consistent with the niche theory). The optimal growth limits for these factors were 32%, 1.75 ds/m, 35%, 1.3%, 2000 m, 43%, 10%, 32%, 250 mm and 15 °C, respectively. Our results highlight that environmental factors, such as soil texture, amount of soil lime, mean annual precipitation, altitude and land slope, had quantifiable effects on the performance of A. sieberi. Our findings could provide useful information for improvement, restoration and conservation programs. However, a further comprehension of the species–environment relationship is needed to predict the effects of climate change on the species habitat.

1. Introduction

Artemisia sieberi Besser (Asteraceae) is a shrubby aromatic plant distributed in Palestine, Syria, Iraq, Afghanistan, Pakistan, Central Asia and Iran (in the Irano-Turanian floristic region) [1,2]. It occurs in many arid and semiarid rangelands of Iran (from the Alborz mountains southern slopes in the north to the Saharo-Sindian floristic region boundary in the south and from the Zagros Mountains eastern slopes in the west to the east of Iran). More than 25,423,578 hectares of vegetation types of the Iranian natural resources (about 33.9%) are characterized by dominant and subdominant A. sieberi, which are mostly distributed throughout central Iran [3]. This species grows on different soil types, and it has a vast ecological distribution. A. sieberi is used for animal feeding, and because of its healing properties, it is also used as a medicinal plant [4,5]. Unfortunately, in recent years, disturbances such as grazing, land use changes and climate changes have caused the destruction of A. sieberi habitats. These threats have led to the destruction of vegetation, loss of biological diversity and erosion of the soil in many rangelands of Iran [6]. Destroyed rangelands are an important topic; in particular, conservation and rehabilitation of rangelands, monitoring of the vegetation dynamics and determination of suitable plant species that can be planted in areas with different environmental conditions should be considered [5]. Abiotic factors are one of the main components of the environmental niche [7,8]. Indeed, they have a major impact on the distribution and performance of plant species. In ecology, the geographical distribution of a species is predicted by quantifying the relationship between the species and the environment. On this basis, multiple hypotheses can be formulated in relation to the control of environmental factors that influence the distribution of the species [9]. It is crucial to understand the effects of the soil and topographic factors on the distribution of plants and vegetation restoration to improve the fragile ecosystems of damaged land. Knowledge of Artemisia response to environmental variables, and modeling of Artemisia occurrence, is essential for using this species in the reclamation of arid and semi-arid lands. For the species niche modeling, many analytical approaches can be used to answer the fundamental question ‘what are the environmental factors controlling the species performance and distribution?’ [10]. Canonical correspondence analysis and generalized additive models are among the methods most used for analyzing the reaction of plant species to environmental factors [11,12]. Generalized additive models [13,14], a powerful extension of GLM, are increasingly used for species modelling [15,16,17,18,19] because they do not assume any general shape of the response prior to the estimation [20].
In Iran, several studies have been conducted to investigate the factors that affect the distribution of A. sieberi as a result of environmental changes [5,21,22,23,24,25,26,27]. Jalili and colleagues studied the A. sieberi habitats in Iran and recognized important ecological differences in the functional characteristics of diploids and polyploids [28]. Mousaei Sanjerehei and Rundel determined that the most significant factors influencing the distribution of A. sieberi in Iran were annual precipitation and annual mean temperature [29]. In this research, we studied the role of the soil and topography in the function of A. sieberi in the Irano-Turanian floristic region of Iran. The following question was discussed: What are the responses and ecological requirements of Artemisia sieberi regarding some of the environmental variables?

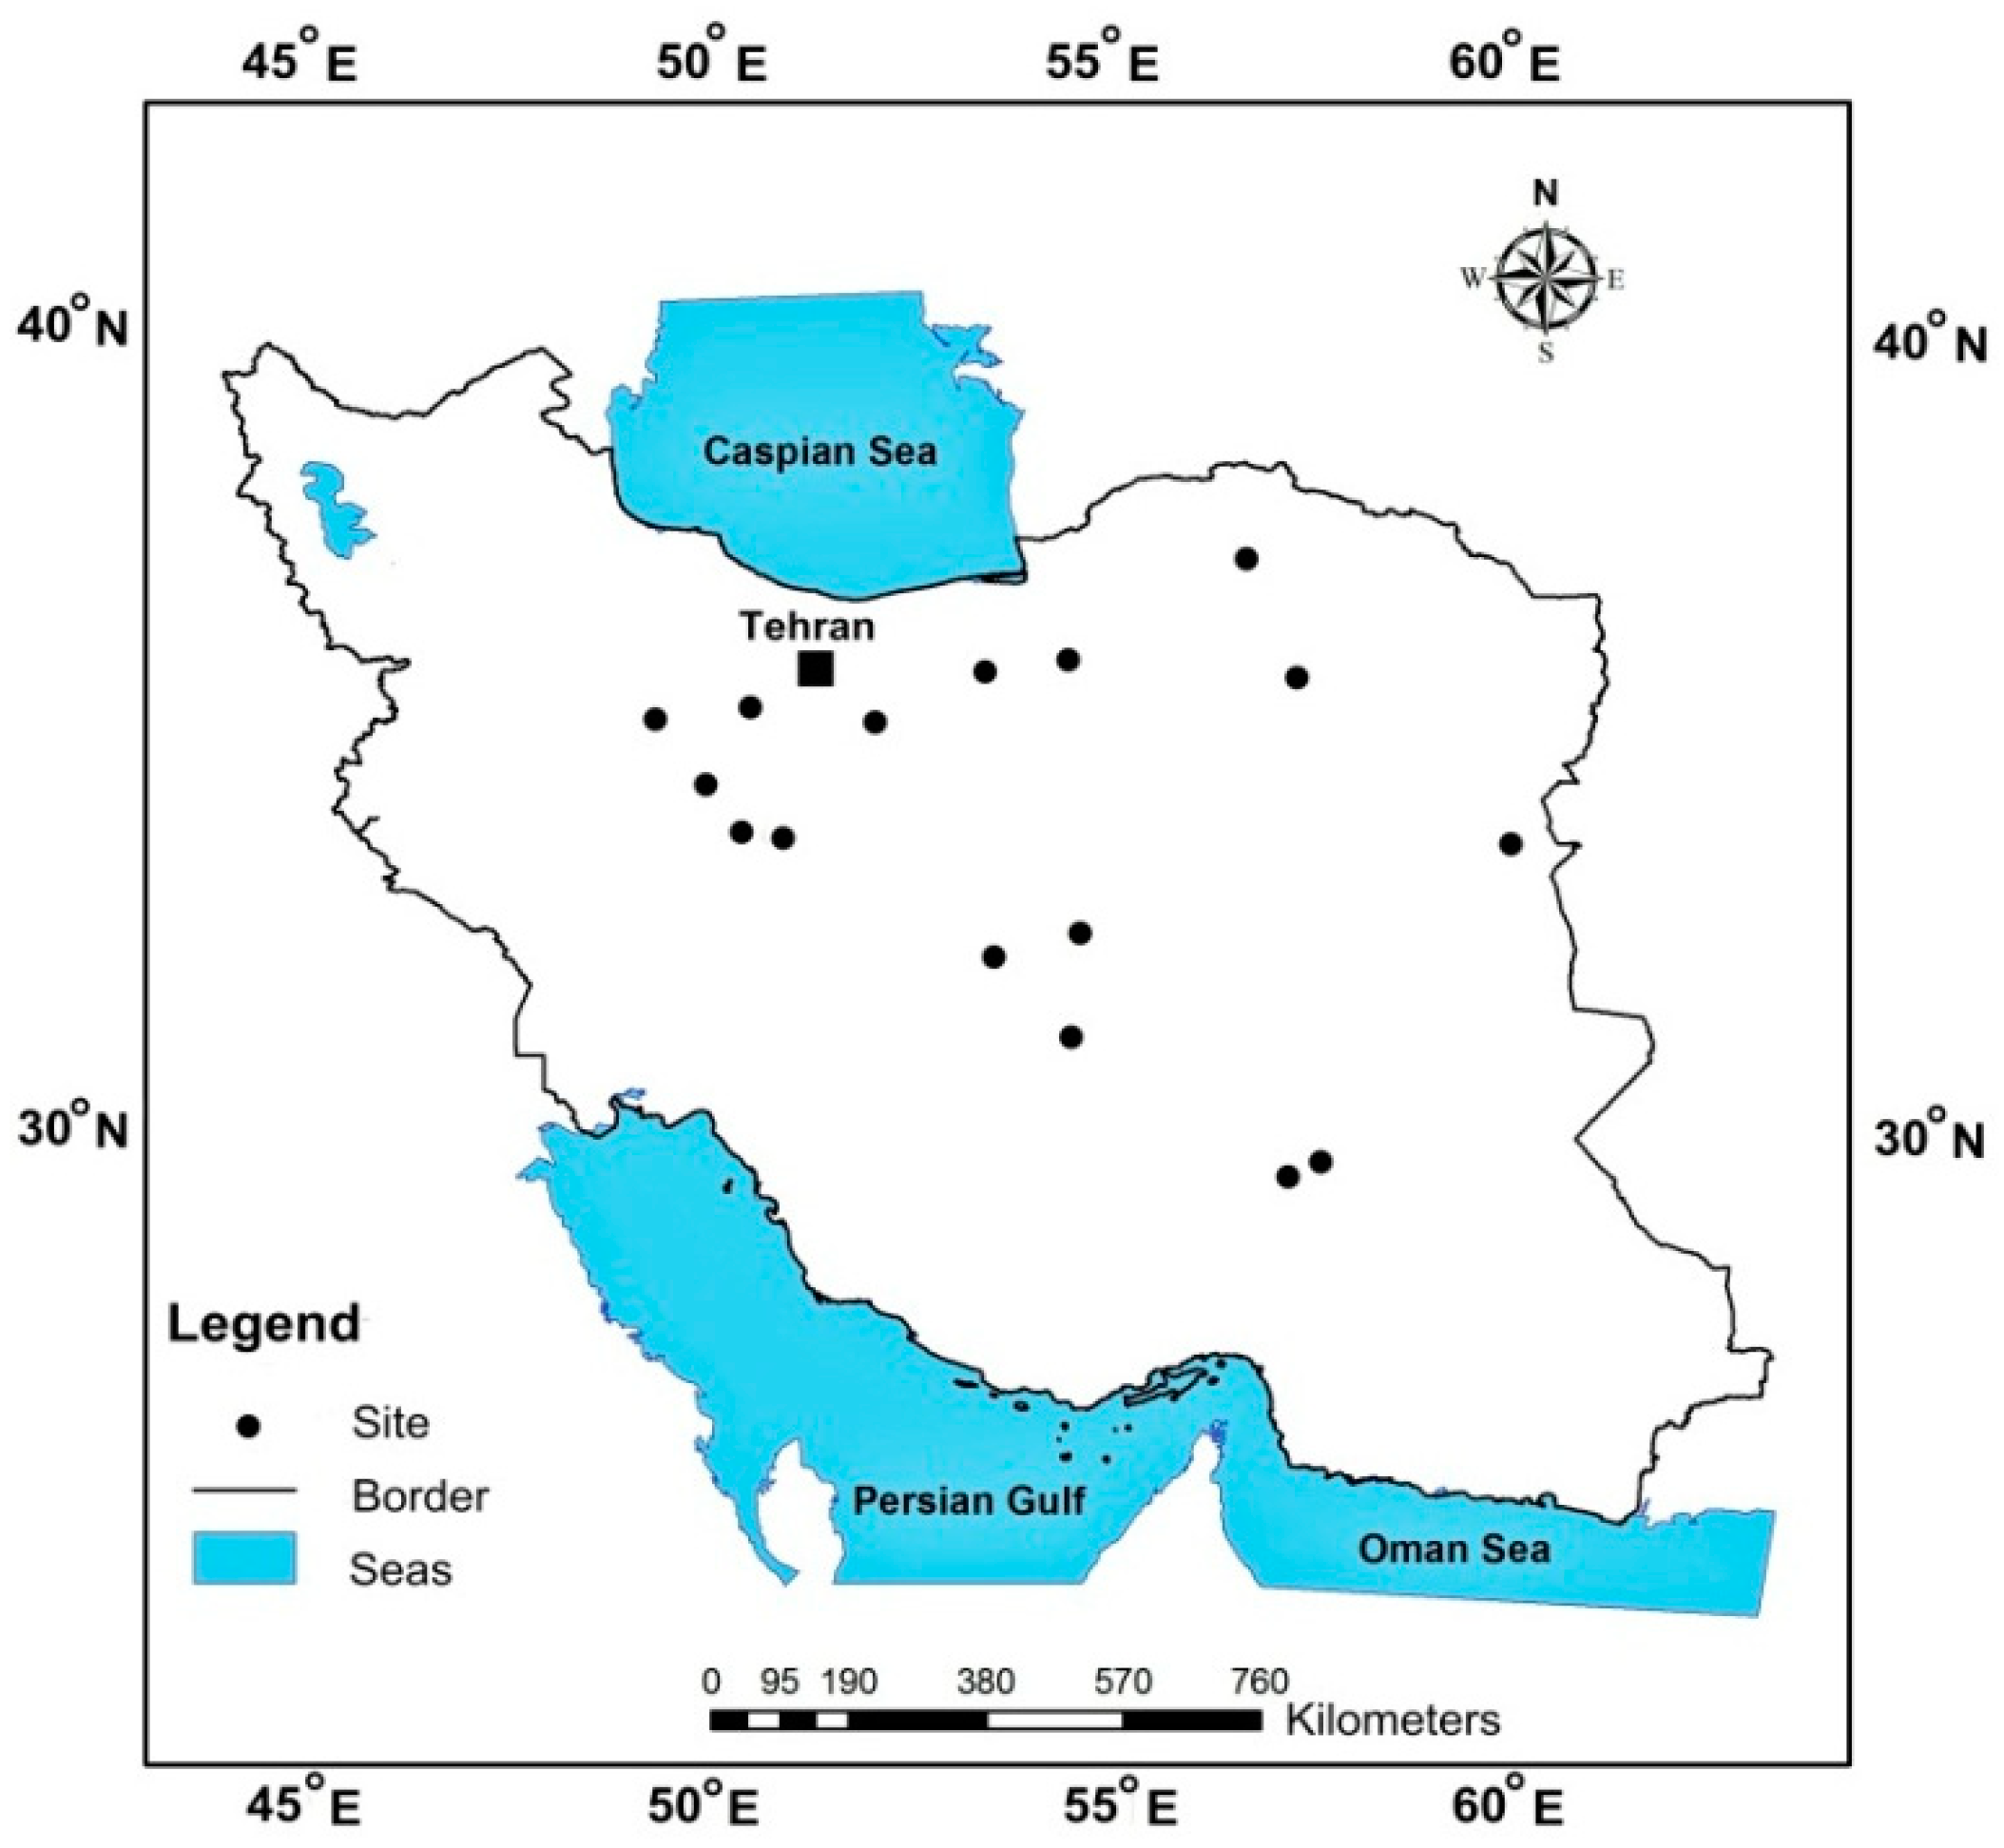
2. Materials and Methods
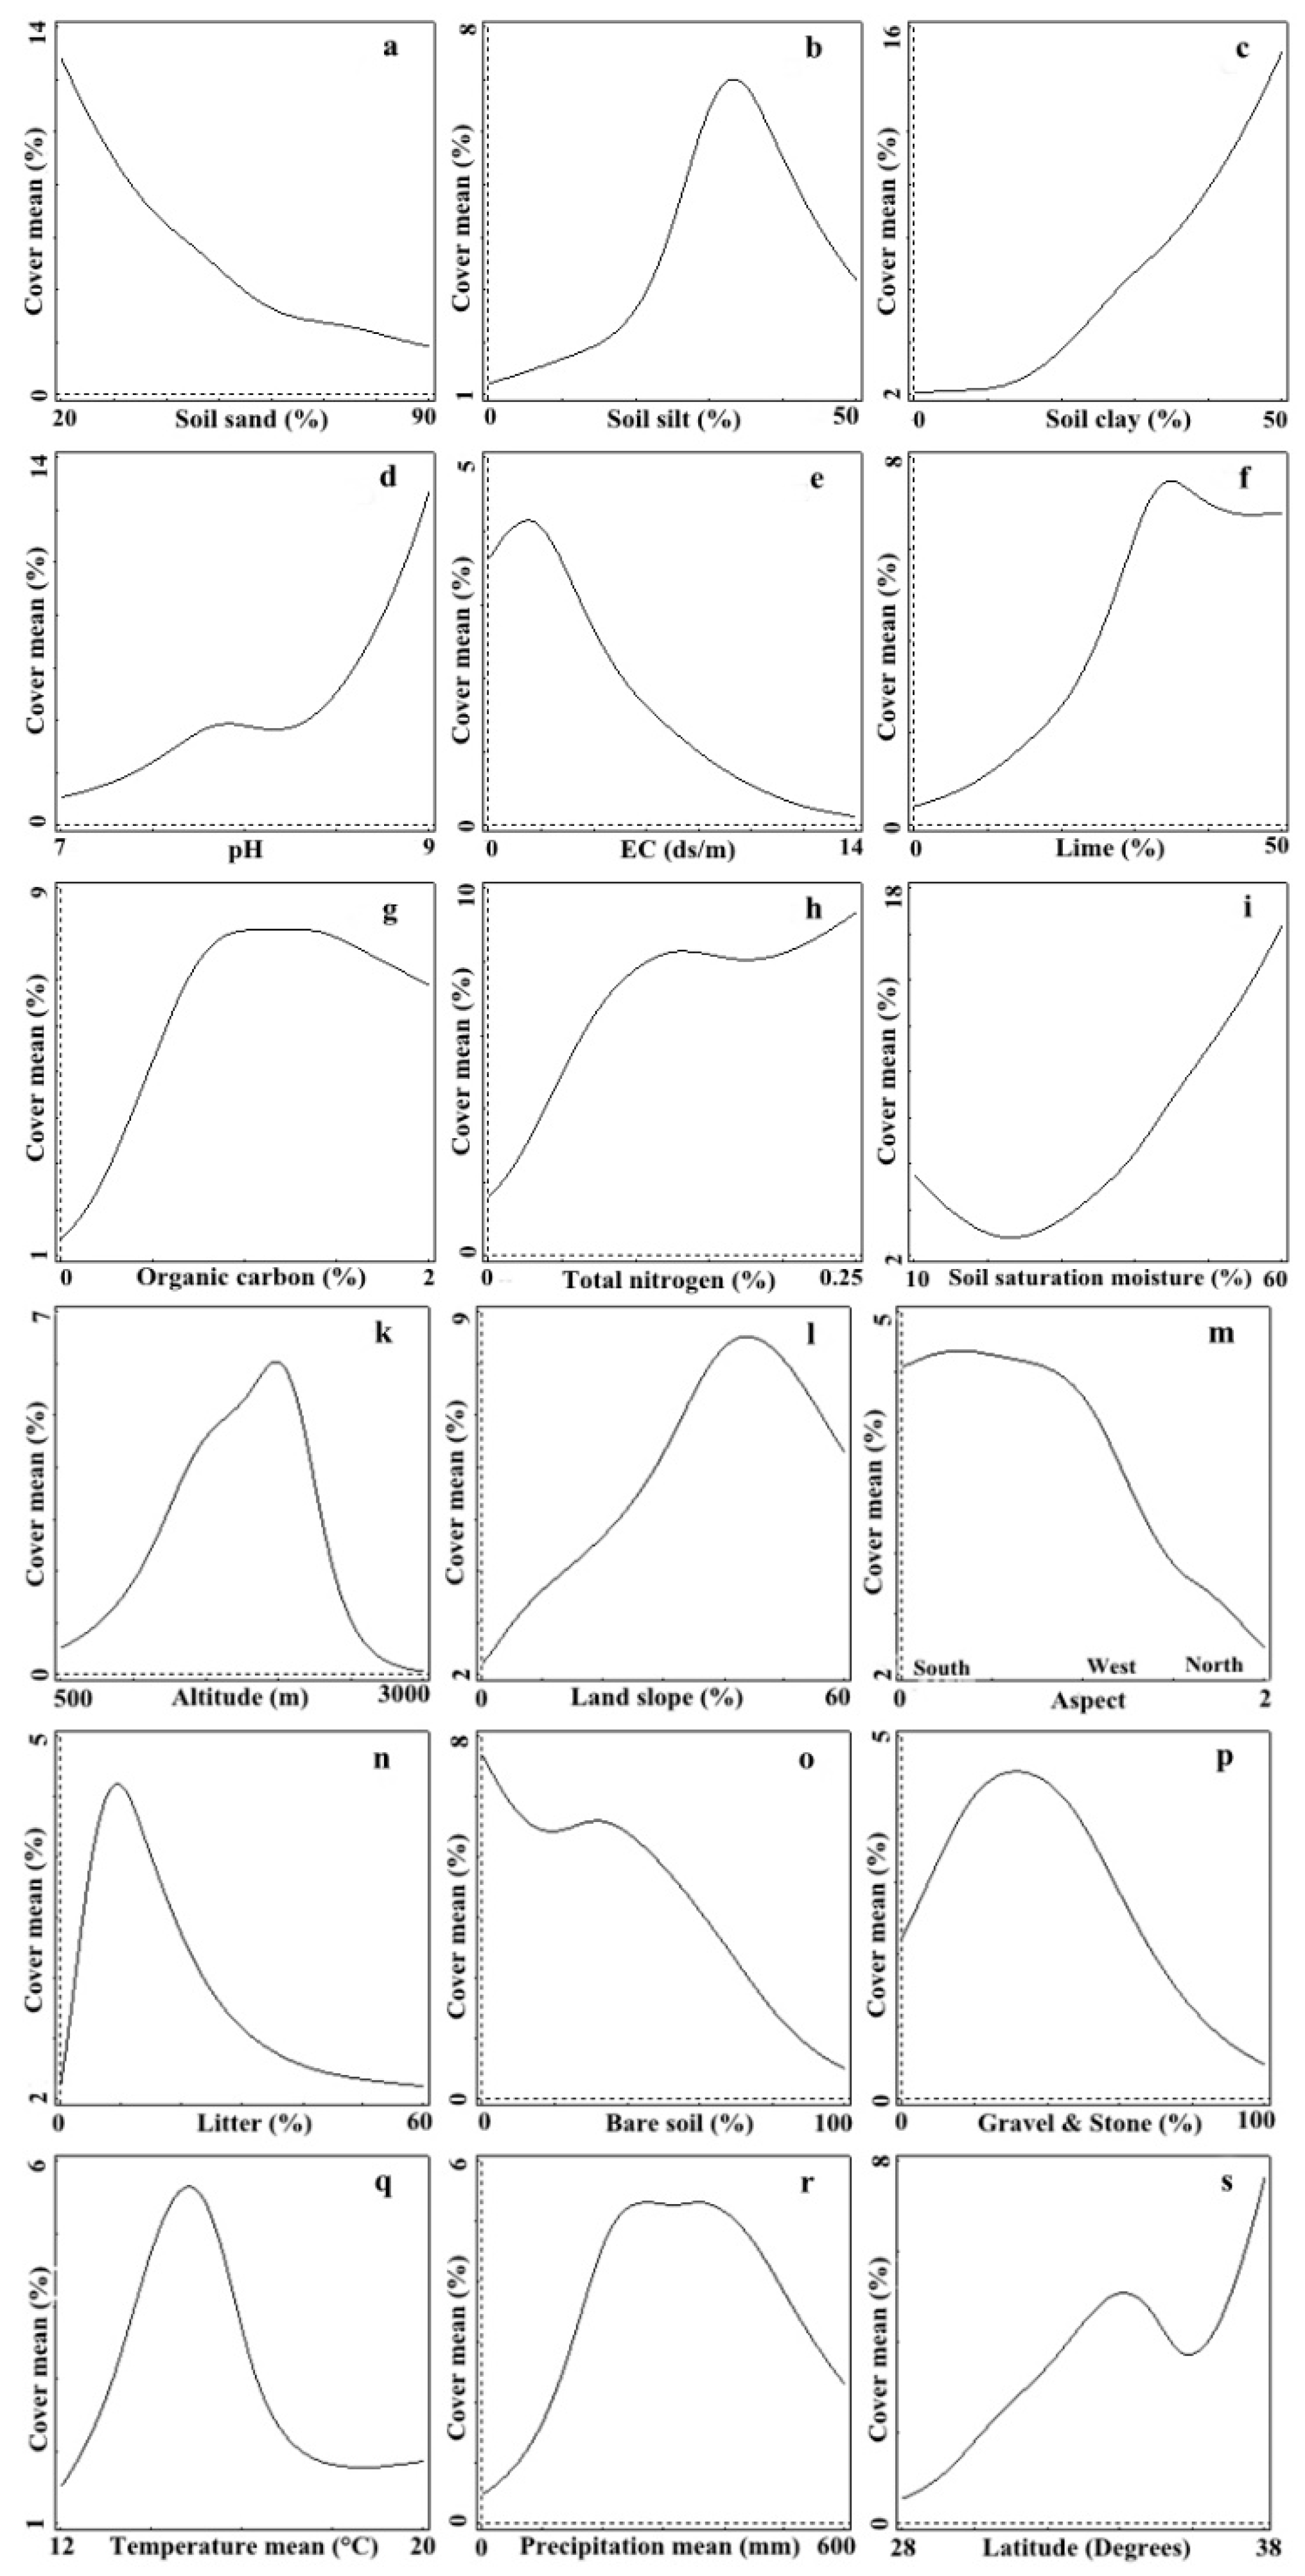
Sixteen research sites, which presented different vegetation types of A. sieberi [30], were selected in Iran to have the maximum range of changes in altitude and geographical dispersion (29°23′–37°16′ N, 49°35′–60°05′ E). The range of altitude was between 560 m a.s.l. in Zirkooh Ghayenat (south Khorasan province) and 3000 m a.s.l in the mountainous areas of Hossein Abad Rain (Kerman province) (Figure 1).
A systematic-random method was used for the vegetation sampling [31,32]. Thirty sampling plots were positioned along five transects (6 sampling plots, with a random starting point, were placed in each transect) so that samples were collected in the range of the A. sieberi distribution in each site (480 sampling plots in total) during 2018 to 2020. The geographical coordinates of the plot locations were recorded using the Global Positioning System (GPS). The number of individuals per plot was evaluated and a visual estimation of each plot was performed to determine the vascular plant density and the canopy cover percentage. Additionally, stone and gravel percentage, bare soil percentage and litter percentage were estimated in each plot. The minimal area of the sampling plots was calculated for each sampling site and was selected to be 25 m2 [33]. Vascular plants were identified using the Flora Iranica [34] and Flora of Iran [35].
The topographic characteristics (altitude, land slope percentage and geographical direction) of each plot were investigated after the analysis of the sampling network in each site. Four directions (90, 180, 270, 360 degrees) were used to register the geographical direction [36]. Then, the equation of Beers et al. [37] was used to enter the geographical direction in the analysis (Equation (1)).
A′ = Cos (45 − A) + 1
where A′ is the converted value of direction and A is the azimuth of aspect in degrees, measured clockwise from north. The influence of the soil on the A. sieberi distribution was evaluated by sampling the soil to the root depth of the plant (0–30 cm above the soil surface) in each plot (a total of 480 samples). The soil sample of each plot was taken in three replications (composite sample).
The soil’s physical and chemical properties were measured. In particular, soil texture was determined through the hydrometer method [38], EC was measured using the saturated extract and EC meter [39], pH was established using the saturated mud and pH meter [40], TNV% was calculated through the titration method, organic carbon% was measured through the Walkley-Black method [41], total nitrogen was evaluated using the Kjeldahl method, and soil saturation moisture (%) was determined by drying saturated mud inside the oven [42].
Prior to data analysis, spatial autocorrelation of plots was performed using the Mantel test [43] with PC-ORD 4.17 software [44].
The A. sieberi response to environmental factors changes was predicted using the generalized additive model (GAM) (Equation (2)) [36]. The canopy cover percentage measurement is easier when the species habitat is less degraded, because of the high correlation between the species yield and canopy cover percentage (Pearson correlation = 0.856, p = 0.000). This factor was measured as a response variable [45,46].
g ( μ ) = α + j = 1 p f j ( X j )
where fj is unknown and smooth functions and Xj are predictive variables. Using the advanced scatter plot smoothing techniques, fj is evaluated from the data. Log link function analysis and Poisson error distribution were used to fit the generalized additive model (they entered the model individually to avoid an over-fitting of the predictive variables).
Smooth terms were fitted using a cubic spline smoother with three degrees of freedom, and a quasi-Poisson distribution was used for the Poisson [8,47].
The variables that influenced the A. sieberi performance were classified through the Akaike information criterion (AIC) [48]. The models showing higher parsimony (lower Akaike information criterion, AIC), when compared to the null model, were selected [8]; the smaller the AIC value was, the more appropriate the proposed model for fitting the species response curve (Equations (3) and (4)) [49].
R M S E = i = 1 n ( Q i Q ^ i ) 2 n
AIC= nln (RMSE) + 2p
where RMSE is the root-mean-square deviation, n is the number of observations, Q i is the observed value, Q ^ i is the fitted value, and p is the number of model variables. Canoco software version 4.5 [50] was used for data analysis.

3. Results

Table 1 illustrates the average values of the environmental factors studied in the habitats.
Table 2 illustrates that most of the studied variables had a significant effect on the A. sieberi canopy cover percentage (p < 0.01), as shown by the generalized additive model with Poisson error distribution.
The A. sieberi response curve to each of the effective environmental variables was evaluated (Figure 2).
The A. sieberi unimodal response to the soil silt (Figure 2b), altitude (Figure 2k), land slope (Figure 2l), gravel and stone (Figure 2p), litter (Figure 2n), temperature (Figure 2q) and precipitation gradient (Figure 2r) spanned its central borders, respectively from 1.6 to 43% (optimum 32%), 560 to 2788 m (optimum 2000 m), 0 to 60% (optimum 43% (on south-facing slopes)), 0 to 97% (optimum 32%), 0 to 54% (optimum 10%), 12 to 19.7 °C (optimum 15 °C) and 78.9 to 600 mm (optimum 250 mm). Increases in the amount of these factors, more than the optimum, resulted in a reduction of the A. sieberi canopy cover percentage. The species’ performance augmented up to a soil salinity concentration of 1.75 ds/m; the canopy cover percentage decreased with further increases in the soil salinity (ranging between 0.09 and 12.8 ds/m). Therefore, A. sieberi is distributed in soils with relatively low salinity. The A. sieberi’s response to the soil lime percentage almost followed the asymmetric unimodal (Figure 2f): the plant performance initially increased slowly and then rapidly, approaching an exponential growth rate. However, when the amount of soil lime increases (more than 35%, ranging between 1.7 and 48.7%), the A. sieberi canopy cover percentage decreases until it stabilizes at a certain value.
Considering the soil organic carbon gradient, A. sieberi had its maximum response at 1%; increases in the organic carbon percentage from 0.02 to about 1.3% increased the species canopy cover percentage; an organic carbon percentage higher than 1.3% reduced the species distribution and presence (Figure 2g). According to the data of the A. sieberi response to the pH, this species is distributed in alkaline soils (following the positive exponential model).
The soil sand percentage showed a negative exponential trend (Figure 2a): as the soil sand value becomes larger, the A. sieberi performance approaches zero. Conversely, the soil clay and soil saturation moisture gradients showed a positive exponential trend (Figure 2c,i): increases in these factors increased the canopy cover percentage of the studied species. Considering the bare soil gradient, the A. sieberi response curve showed an almost negative linear trend: A. sieberi had the lowest performance with the highest percentage of bare soil (Figure 2o).
The A. sieberi’s response to the total nitrogen percentage almost followed the monotonic increase model, and the canopy cover percentage increased with increasing values of nitrogen (Figure 2h). In mountainous areas, changes in the geographical direction of the slope also affected the performance of the studied species; in particular, the A. sieberi performance reached its highest value in the southern facing slopes (Figure 2m), while the lowest performance was observed in the north facing slopes.
The species’ response to changes in latitude was bimodal. Increases in latitude up to 35° resulted in an increased canopy cover percentage, while increases in latitude from 35° to 36° led to a reduction of the canopy cover percentage; however, further increases in latitude increased the canopy cover percentage. The lower limit of the species’ presence was observed at latitude 28° (Figure 2s).

4. Discussion

The determination of the species response to the studied environmental factors represents one of the basic issues in ecology. Response curves allow the estimation of the species optimum and the niche width (tolerance) [51,52,53,54,55]. Statistical models play an important role in this regard [56]. Aremisia sieberi belongs to the steppe vegetation of Iran and is important in terms of forage production and medicinal properties [5,26,57]. However, the A. sieberi habitats are at risk due to the extra exploitation of these ecosystems during the past decades [58]. In this research, the GAM model was used to investigate the A. sieberi response to gradients of different environmental factors. The studied species’ ecological needs were also studied.
In the studied habitats, A. sieberi has a significant yield; this aspect is highlighted by the average dry forage production, which is 66 kg per hectare. The forage production differences are due to both the habitat potential and the presence of disturbances, such as livestock grazing; this issue has also been mentioned by Khosravi Mashizi and Sharafatmandrad [58].
As reported also by other researchers [5,26,59], the data of this study showed that the A. sieberi performance was significantly affected by 18 variables, which were soil texture, lime, mean annual precipitation, altitude and land slope.
The A. sieberi response to the main environmental factors that affected the plant performance was exponential or unimodal; specifically, the response curves were mostly asymmetric unimodal.
According to the soil texture response curves, A. sieberi was found in areas that were characterized by a high soil clay percentage. This soil textural class causes the production of meso- and micro-porosities; indeed, these areas present the greatest amount of plant available water. As reported by other researchers [60,61], A. sieberi needs relatively more water compared to other species. Additionally, the lowest performance of A. sieberi was recorded in areas with the highest soil sand percentage and lower water retention [5].
Soil texture has an important function in the plants distribution and is involved in the soil humidity percentage, water holding capacity, plant elements availability and plant ventilation and rooting [62,63,64].
A. sieberi showed a positive exponential response to the soil acidity gradient, therefore, it has a strongly alkaline ecological niche. Piri Sahragard and Zare Chahouki [26] reported that A. sieberi is more compatible with soils characterized by a higher pH; moreover, soil acidity has a major role in the control of nutrients solubility [65]. Consequently, the pH level could be considered an important factor for the species distribution in the area. Our results illustrated that A. sieberi followed an asymmetric unimodal model in response to soil salinity. A low salinity rate (1.75 ds/m) caused significant abundance of A. sieberi. However, a higher soil salinity level caused an increased soil osmotic pressure (osmotic stress). This led to a reduction in the plant yield due to a lower water absorption and reduced plant metabolism; ultimately, the enzyme activity was also inhibited (ion toxicity). The studied areas presented a strongly different soil lime content (1.7–48.7%), and the A. sieberi response to the level of lime followed an asymmetric hump-shaped curve (the optimum was at 35%). The data of our study showed that A. sieberi tolerates various lime concentrations, although has a higher distribution in soils with a relatively high lime percentage, as reported also by Hosseini et al. [5]. Hence, A. sieberi is positively correlated with the soil lime percentage. It can be deduced that A. sieberi is a calcicole plant, because lime increases soil alkalinity. The soil lime content also decreases the growth of plants that need acidic soil [66]. The soil lime content is also a source of calcium and magnesium and is related to higher water retention [67,68]. All these aspects influence the distribution of A. sieberi in the studied region. A. sieberi’s response to the soil nitrogen percentage almost followed the monotonic increase model: the plant performance initially increased rapidly and then augmented slowly. A high soil nitrogen percentage (the optimum was at 0.25%) is related to increased soil microorganism activity, litter decomposition and plant growth and is considered a fertility indicator [69]. An increased soil organic carbon content (the optimum was at 1.3%) causes the formation of larger aggregates in the soil; the higher soil structure stability and increased number of large pores derived lead to an increased permeability coefficient and reduced erosion, as illustrated also by Lado et al. [70].
Considering A. sieberi’s response to the land slope percentage, the data of our study showed that plant performance was higher in the southern moderate slopes in mountainous areas. Davis et al. [71] illustrated that slopes have an average correlation with the species composition. The reason for the decreased presence of A. sieberi on slopes higher than 43% seems to be the reduction of the establishment of A. sieberi seeds due to an increased percentage of bare soil, stone and water erosion; this was also confirmed by other researchers such as Alavi et al. [72]. The soil’s porosity in the moderate slopes is increased and more seeds are exposed to moisture; consequently, a higher number of seeds germinate, leading to increased reproduction [73]. According to the data about the performance of A. sieberi in response to altitude changes, this species was more present in the middle altitudes (about 2000 m). Hosseini et al. [5] illustrated that the optimum altitude was about 2300 m in the Poshtkouh area (local study), in central Iran. The increased presence of A. sieberi in the middle altitudes could be due to a combination of factors, such as adequate ecological factors and high levels of species turnover. As discussed also by other authors [74,75,76], this highlights the importance of the balance between communities and environment.
The highest canopy cover percentage was observed in the south aspects (south, southwest and southeast). Moreover, the studied plant distribution was also affected by the geographical direction due to the amount of plant available water and light [77]. As stated by other authors [19,78,79,80,81], the A. sieberi distribution was influenced by terrain and climate-related factors. It seems that A. sieberi is a xerophyte and helliophyta species.
In addition, the A. sieberi maximum response was recorded with the highest soil saturation moisture percentage (≥60%). The texture and structure of the soil influence this factor and affect the pore size distribution of the soil, soil water storage and plant available water [82,83]. The response of the studied species to the soil saturation moisture percentage is similar to the response given to the soil clay percentage.
A decreased permeability (decreased soil moisture storage) and soil erosion could affect the low A. sieberi presence and canopy cover percentage recorded in the areas with the highest percentage of bare soil. As reported by other researchers such as Carcey Hincz and Diaz Aguilar [29], Wassie et al. [84] and Laris and Wardell [85], this influences the germination deficiency and vegetation establishment.
The A. sieberi growth decreased with a high stone and gravel percentage (>30%), which characterizes the Zagros Mountains [67].
With an increasing amount of litter up to 10%, the abundance of A. sieberi increased; a further increase in the litter amount led to a decreased presence of this species. It seems that the early life stages of this species may benefit from a low amount of litter; indeed, with medium and high litter amounts the frequency of A. sieberi decreased, which may be due to reduced germination. This was in accordance with the results of a previous study on other plant species [86].
The relationship between A. sieberi performance and mean annual temperature followed a hump shape: the minimum temperature was 12 °C and the maximum was 19.7 °C (the optimum was at 15 °C), which may suggest an adaptation to a narrow climate niche (stenothermal); this was also reported by other researchers [87,88].
The probability of A. sieberi presence in the Iranian steppe vegetation, with an annual precipitation of about 200–400 mm, was the highest. Canopy cover and presence of the species dramatically decreased with an annual precipitation higher than 400 mm or lower than 200 mm. Sanjerehei and Rundel (2017) [87] and Amiri et al. [27] also reported a decrease in the A. sieberi yield with increasing precipitation.
The increase of latitude up to 34° resulted in an increased canopy cover percentage, while increases in latitude from 34° to 36° led to a canopy cover reduction; however, further increases in latitude increased the A. sieberi canopy cover percentage. The lower limit of the species’ presence was observed at 28° of latitude. In general, A. sieberi tended to grow at the middle latitude (34–35°) and middle-lower altitude (1700–2200 m) with middle lower precipitation (200–400 mm) and middle temperatures (14–16°). However, this species also had a higher yield at a higher latitude (38°) with lower altitudes in the Iranian steppe vegetation. These data are in accordance with the results of a previous study [3]. The species’ response to changes in latitude was bimodal. This model shows that a superior competitor has displaced this species from its optimum in a certain range of environmental conditions [89]. However, the nature of the environmental process, which may link indirect variables to direct variables, can affect the ecological relationship [12]. Therefore, it seems that the use of indirect predictors with a known relationship to direct variables that affect plant performance is often not suitable for statistical modeling. In conclusion, environmental variations (precipitation, temperature, sunlight, etc.) resulting from latitudinal gradients had a great influence on the spatial distribution of A. sieberi in the studied areas.

5. Conclusions

The potential plant species response to environmental variables changes can be predicted based on the species distribution, using niche models. Consequently, adequate species habitats can be defined; this has been increasingly used by natural resource managers to plan biodiversity conservation management, to assess climate impact and for land use activities. Because of the importance of the presence of A. sieberi in the steppe vegetation of Iran [26,88], up to date knowledge of its distribution is necessary for the ecosystem management planning. According to our results, the distribution of A. sieberi is described by the GAM and a reduction in abundance and performance of the studied species is explained by the constraints of environmental factors. The response of A. sieberi to environmental factors can be used to explain abiotic limitations, range management, conservation, improvement and restoration of degraded habitats of A. sieberi. We concluded that environmental factors, specifically soil texture, soil lime amount, mean annual precipitation, altitude and land slope, had quantifiable effects on the performance of A. sieberi. An improved understanding of these species-environment relationships in the context of natural climatic fluctuations will also aid in better prediction of the effects of climate change on the species habitats. In addition, due to the contribution of biotic interactions, interaction between variables and extreme environmental stress to the species response shape, it seems that further studies are needed to develop modeling approaches that consider these factors in relation to the species distribution. These findings will be used to complete the quantification of its ecology and the risk of anthropogenic activities.

Author Contributions

Conceptualization, H.M.; methodology, D.G., S.Z. and J.M.S.; formal analysis, D.G., S.Z., J.M.S. and M.G.; investigation, H.M., D.G., S.Z., J.M.S. and M.G.; data curation, E.M.S.; writing—original draft preparation, H.M.; writing—review and editing, A.M.; supervision, A.M.; funding acquisition, A.M. All authors have read and agreed to the published version of the manuscript.

Funding

This research received no external funding.

Data Availability Statement

The data will be made available upon request to the corresponding authors.

Conflicts of Interest

The authors declare no conflict of interest.

References

  1. Podlech, D. Artemisia. In Flora Iranica, Compositae, VI-Anthemideae, Akademische Druck-u; Rechinger, K.H., Ed.; Verlagsanstalt: Graz, Austria, 1986; Volume 158, pp. 159–223. [Google Scholar]
  2. Mahboubi, M. Artemisia sieberi Besser essential oil and treatment of fungal infections. Biomed. Pharmacother. 2017, 89, 1422–1430. [Google Scholar] [CrossRef] [PubMed]
  3. Jalili, A. Ecology, Evolution and Biogeography of Artemisia L.; Research Institute of Forests and Rangelands: Tehran, Iran, 2016; p. 493. [Google Scholar]
  4. Nigam, M.; Atanassova, M.; Mishra, A.P.; Pezzani, R.; Devkota, H.P.; Plygun, S.; Salehi, B.; Setzer, W.N.; Sharifi-Rad, J. Bioactive Compounds and Health Benefits of Artemisia Species. Nat. Prod. Commun. 2019, 14, 1–17. [Google Scholar] [CrossRef] [Green Version]
  5. Hosseini, S.; Kappas, M.; Chahouki, M.A.Z.; Gerold, G.; Erasmi, S.; Emam, A.R. Modelling potential habitats for Artemisia sieberi and Artemisia aucheri in Poshtkouh area, central Iran using the maximum entropy model and geostatistics. Ecol. Inform. 2013, 18, 61–68. [Google Scholar] [CrossRef]
  6. Akhani, H.; Mahdavi, P.; Noroozi, J.; Zarrinpour, V. Vegetation patterns of the Irano-Turanian steppe along a 3000 m al-titudinal gradient in the Alborz Mountains of Northern Iran. Folia. Geobot. 2013, 48, 229–255. [Google Scholar] [CrossRef]
  7. Whittaker, R.H. Direct Gradient Analysis. Handbook of Vegetation Science 5: Ordination and Classification of Communities; Whittaker, R.H., Ed.; Junk Publishers: Hague, The Netherlands, 1973; pp. 19–50. [Google Scholar]
  8. Traoré, S.; Zerbo, L.; Schmidt, M.; Thiombiano, L. Acacia communities and species responses to soil and climate gradients in the Sudano-Sahelian zone of West Africa. J. Arid. Environ. 2012, 87, 144–152. [Google Scholar] [CrossRef]
  9. Gogina, M. Investigation of Interrelations between Sediment and Near-Bottom Environmental Parameters and Macrozoobenthic Distribution Patterns for the Baltic Sea. Ph.D. Thesis, Ernst Moritz Arndt University of Greifswald, Greifswald, Germany, 2010. [Google Scholar]
  10. Moisen, G.G.; Frescino, T.S. Comparing five modelling techniques for predicting forest characteristics. Ecol. Model. 2002, 157, 209–225. [Google Scholar] [CrossRef] [Green Version]
  11. Cajo, J.F.; Ter Braak, C. Canonical Correspondence Analysis: A New Eigenvector Technique for Multivariate Direct Gradient Analysis. Ecology 1986, 67, 1167–1179. [Google Scholar] [CrossRef] [Green Version]
  12. Austin, M.; Belbin, L.; Meyers, J.; Doherty, M.; Luoto, M. Evaluation of statistical models used for predicting plant species distributions: Role of artificial data and theory. Ecol. Model. 2006, 199, 197–216. [Google Scholar] [CrossRef]
  13. Hastie, T.; Tibshirani, R. Generalised Additive Models; Chapman and Hall: London, UK, 1990. [Google Scholar]
  14. Kosicki, J.Z. Generalised Additive Models and Random Forest Approach as effective methods for predictive species density and functional species richness. Environ. Ecol. Stat. 2020, 27, 273–292. [Google Scholar] [CrossRef]
  15. Yee, T.W.; Mitchell, N.D. Generalized additive models in plant ecology. J. Veg. Sci. 1991, 2, 587–602. [Google Scholar] [CrossRef]
  16. Austin, M.P. The potential contribution of vegetation ecology to biodiversity research. Ecography 1999, 22, 465–484. [Google Scholar] [CrossRef]
  17. Guisan, A.; Zimmermann, N.E. Predictive habitat distribution models in ecology. Ecol. Model. 2000, 135, 147–186. [Google Scholar] [CrossRef]
  18. Leathwick, J.R.; Whitehead, D. Soil and atmospheric water deficits and the distributions of New Zealand’s indigenous tree species. Funct. Ecol. 2001, 15, 233–242. [Google Scholar]
  19. Vetaas, O.R.; Grytnes, J.A. Distribution of vascular plant species richness and endemic richness along the Himalayan elevation gradient in Nepal. Glob. Ecol. Biogeogr. 2002, 11, 291–301. [Google Scholar] [CrossRef]
  20. Austin, M.P.; Meyers, J.A. Current approaches to modelling the environmental niche of eucalypts: Implication for management of forest biodiversity. For. Ecol. Manag. 1996, 85, 95–106. [Google Scholar] [CrossRef]
  21. Azarnivand, H.; Jafari, M.; Moghaddam, M.R.; Jalili, A.; Zare Chahouki, M.A. Investigation on environmental variables affecting habitat distribution of A. sieberi and A. aucheri in rangelands of Vardavard, Garmsar and Semnan. Iran. J. Nat. Resour. 2006, 56, 93–99. [Google Scholar]
  22. Yaghmaei, L.; Soltani Koupaei, S.; Khodagholami, M. Effect of climatic factors on distribution of Artemisia sieberi and Artemisia aucheri in Isfahan province using multivariate statistical methods. Water Soil Sci. 2008, 12, 359–371. [Google Scholar]
  23. Abdollahi, J.; Naderi, H. Soil and topographical variation influencing the growing factors of Artemisia sieberi in steppic rangeland, Nodoushan-Yazd. Watershed Manag. Res. Pajouhesh Sazandegi 2011, 97, 52–62. [Google Scholar]
  24. Sahragard, H.P.; Ajorlo, M.; Karami, P. Modeling habitat suitability of range plant species using random forest method in arid mountainous rangelands. J. Mt. Sci. 2018, 15, 2159–2171. [Google Scholar] [CrossRef]
  25. Chahouki, M.A.Z.; Azarnivand, H.; Jafari, M.; Tavili, A. Multivariate statistical methods as a tool for model-based prediction of vegetation types. Russ. J. Ecol. 2010, 41, 84–94. [Google Scholar] [CrossRef]
  26. Piri Sahragard, H.; Zare Chahouki, M.A. Modeling of Artemisia sieberi Besser habitat distribution using maximum entropy method in desert rangelands. J. Rangel. Sci. 2016, 6, 93–101. [Google Scholar]
  27. Amiri, M.; Tarkesh, M.; Jafari, R.; Jetschke, G. Bioclimatic variables from precipitation and temperature records vs. remote sensing-based bioclimatic variables: Which side can perform better in species distribution modeling? Ecol. Inform. 2020, 57, 101060. [Google Scholar] [CrossRef]
  28. Jalili, A.; Rabie, M.; Azarnivand, H.; Hodgson, J.G.; Arzani, H.; Jamzad, Z.; Asri, Y.; Hamzehee, B.; Ghasemi, F.; Hejazi, S.H.; et al. Distribution and ecological consequences of ploidy variation in Artemisia sieberi in Iran. Acta. Oecologica 2013, 53, 95–101. [Google Scholar] [CrossRef]
  29. Mousaei Sanjerehei, M.; Rundel, P.W. The Impact of Climate Change on Habitat Suitability for Artemisia sieberi and Artemisia aucheri (Asteraceae), a Modeling Approach. Pol. J. Ecol. 2017, 65, 97–109. [Google Scholar]
  30. Khodagholi, M.; Saboohi, R.; Esfahani, E.Z. A comparison of vegetative climate of Artemisia sieberi Besser and Artemisia aucheri Boiss in Iran. Arch. Meteorol. Geophys. Bioclimatol. Ser. B 2021, 146, 921–939. [Google Scholar] [CrossRef]
  31. Krebs, C.J. Ecological Methodology, 2nd ed.; Addison Wesley Longman: Menlo Park, CA, USA, 1999; p. 620. [Google Scholar]
  32. Arzani, H.; Abedi, M. Rangeland Assessment: Vegetation Measurement, 2nd ed.; University of Tehran: Tehran, Iran, 2015. [Google Scholar]
  33. Küchler, A.W.; Mueller-Dombois, D.; Ellenberg, H. Aims and Methods of Vegetation Ecology. Geogr. Rev. 1976, 66, 114. [Google Scholar] [CrossRef]
  34. Iranica, F.; Druck-u, A.; Rechinger, K.H. (Eds.) Flora Iranica: Facts and Figures and a List of Publications by k.h. Rechinger on Iran and Adjacent Areas; Verlagsanstalt: Graz, Austria, 2015; Volume 181. [Google Scholar]
  35. Research Institute of Forests and Rangelands. Flora of Iran; Assadi, M., Ed.; Research Institute of Forests and Rangelands: Tehran, Iran, 2019; Volume 149, Available online: https://irannature.areeo.ac.ir/article_119036.html?lang=en (accessed on 25 November 2022).
  36. Palmer, M.W. Putting Things in Even Better Order: The Advantages of Canonical Correspondence Analysis. Ecology 1993, 74, 2215–2230. [Google Scholar] [CrossRef]
  37. Beers, T.W.; Dress, P.E.; Wensel, L.C. Aspect trans-formation in site productivity research. J. For. Res. 1966, 64, 691–692. [Google Scholar]
  38. Bouyoucos, G.J. Hydrometer Method Improved for Making Particle Size Analyses of Soils. Agron. J. 1962, 54, 464–465. [Google Scholar] [CrossRef]
  39. Black, C.A.; Evans, D.D.; Dinauer, R.C. Methods of Soil Analysis; American Society of Agronomy: Madison, NC, USA, 1965. [Google Scholar]
  40. McLean, E.; Ph, S.; Requirement, L. Methods of Soil Analysis: Part 2; Chemical and Microbiological Properties: Agronomy Monographs, 1982; pp. 199–224. Available online: https://acsess.onlinelibrary.wiley.com/doi/book/10.2134/agronmonogr9.2.2ed (accessed on 25 November 2022).
  41. Walkley, A.; Black, I.A. Estimation of soil organic carbon by the chromic acid titration method. Soil Sci. 1934, 37, 29–38. [Google Scholar] [CrossRef]
  42. Ryan, J.G.; Estefan, G.; Rashid, A. Soil and Plant Analysis Laboratory Manual; ICARDA: Aleppo, Syria, 2002. [Google Scholar]
  43. Mantel, N. The detection of disease clustering and a generalized regression approach. Cancer Res. 1967, 27, 209–220. [Google Scholar] [PubMed]
  44. McCune, B.; Mefford, M.J. Multivariate Analysis of Ecological Data, version 4.17; MjM Software; Gleneden, OR, USA, 1999. Available online: https://www.scirp.org/(S(351jmbntvnsjt1aadkposzje))/reference/ReferencesPapers.aspx?ReferenceID=551732 (accessed on 25 November 2022).
  45. Smilauer, P.; Leps, J. Multivariate Analysis of Ecological Data Using CANOCO 5, 2nd ed.; Cambridge University: Cambridge, UK, 2014. [Google Scholar]
  46. Akaike, H. A new look at the statistical model identification. IEEE Trans. Autom. Control 1974, 19, 716–723. [Google Scholar] [CrossRef]
  47. Dawson, C.W.; Abrahart, R.J.; See, L.M. HydroTest: A web-based toolbox of evaluation metrics for the standardized assessment of hydrological forecasts. Environ. Model. Softw. 2007, 22, 1034–1052. [Google Scholar] [CrossRef] [Green Version]
  48. ter Braak, C.J.F.; Smilauer, P. Canoco, Reference Manual and CanoDraw for Windows User’s Guide: Software for Canonical Community Ordination, version 4.5; Microcomputer Power: Ithaca, Greece, 2002. [Google Scholar]
  49. Gaston, K.J.; Blackburn, T.M. A Critique for Macroecology. Oikos 1999, 84, 353. [Google Scholar] [CrossRef]
  50. Toner, M.; Keddy, P. River hydrology and riparian wetlands: A predictive model for ecological assembly. Ecol. Appl. 1997, 7, 236–246. [Google Scholar] [CrossRef]
  51. Wiser, S.K.; Peet, R.K.; White, P.S. Prediction of rare-plant occurrence: A southern Appalachian example. Ecol. Appl. 1998, 8, 909–920. [Google Scholar] [CrossRef]
  52. Witkowski, E.T.F.; Lamont, B. Does the rare Banksia goodii have inferior vegetative, reproductive or ecological attributes compared with its widespread co-occurring relative B. gardneri? J. Biogeogr. 1997, 24, 469–482. [Google Scholar] [CrossRef]
  53. Olden, J.D.; Jacksona, D.A. Comparison of statistical approaches for modelling fish species distributions. Freshw. Biol. 2002, 47, 1–20. [Google Scholar] [CrossRef] [Green Version]
  54. Bagheri, R.; Chaichi, M.R.; Mohseni-Saravi, M.; Amin, G.R.; Zahedi, G. Grazing affects essential of compositions of Artemisis sieberi Besser. Pak. J. Biol. Sci. 2007, 5, 810–813. [Google Scholar] [CrossRef]
  55. Khosravi Mashizi, A.; Sharafatmandrad, M. Assessing Impact of Anthropogenic Disturbances on Forage Production in Arid and Semiarid Rangelands. J. Rangel. Sci. 2019, 9, 234–245. [Google Scholar]
  56. Vereecken, H.; Diels, J.; Van Orshoven, J.; Feyen, J.; Bouma, J. Functional evaluation of pedotransfer functions for the estimtion of soil hydraulic properties. Soil Sci. Soc. Am. J. 1992, 56, 1371–1379. [Google Scholar] [CrossRef]
  57. Aryanpour, H.; Shorafa, M. Cultivation impact on soil available water in different soil textures using pore size distribution. J. Soil Manag. Sustain. Prod. 2013, 3, 131–148. [Google Scholar]
  58. Wahba, S.A.; Abdel Rahman, S.I.; Cairo, M.Y.T.; Matyn, M.A. Soil moisture, salinity, water use efficiency and sunflower growth as influenced by irrigation bitumen mulch and plant density. Soil Technol. 1990, 3, 33–44. [Google Scholar] [CrossRef]
  59. Rangel, T.F.L.V.B.; Diniz-Filho, J.A.F.; Bini, L.M. Towards an integrated computational tool water use efficiency and sun-flower growth as influenced by irrigation bitumen mulch and plant density. Soil Technol. 2006, 3, 33–44. [Google Scholar]
  60. Moradi, P.; Aghajanloo, F.; Moosavi, A.; Monfared, H.; Khalafi, J.; Taghiloo, M.; Khoshzaman, T.; Shojaee, M.; Mastinu, A. Anthropic Effects on the Biodiversity of the Habitats of Ferula gummosa. Sustainability 2021, 13, 7874. [Google Scholar] [CrossRef]
  61. Janisova, M. Vegetation-environment relationship in dry calcareous grassland. Ekológia-Bratisl 2005, 24, 25–44. [Google Scholar]
  62. Mahmodi, S.; Hakymian, M. Fundamental of Soil Science; Tehran University: Tehran, Iran, 2007. [Google Scholar]
  63. Mohtashamnia, S.; Zahedi, G.H.; Arzani, H. An investigation on synecology of semi-steppe vegetation in relation to edaphic and physiographical factors (case study: Eghlid rangelands of Fars). J. Agric. Nat. Resour. 2008, 14, 111–123. [Google Scholar]
  64. Mseddi, K.; Al-Shammari, A.; Sharif, H.; Chaieb, M. Plant diversity and relationships with environmental factors after rangeland exclosure in arid Tunisia. Turk. J. Bot. 2016, 40, 287–297. [Google Scholar] [CrossRef]
  65. Brahim, N.; Blavet, D.; Gallali, T.; Bernoux, M. Application of structural equation modeling for assessing relationships between organic carbon and soil properties in semiarid Mediterranean region. Int. J. Environ. Sci. Technol. 2011, 8, 305–320. [Google Scholar] [CrossRef] [Green Version]
  66. Lado, M.; Paz, A.; Ben-Hur, M. Organic Matter and Aggregate-Size Interactions in Saturated Hydraulic Conductivity. Soil Sci. Soc. Am. J. 2004, 68, 234–242. [Google Scholar] [CrossRef]
  67. Davies, K.W.; Bates, J.D.; Miller, R.F. Vegetation Characteristics Across Part of the Wyoming Big Sagebrush Alliance. Rangel. Ecol. Manag. 2006, 59, 567–575. [Google Scholar] [CrossRef]
  68. Alavi, S.J.; Nouri, Z.; Zahedi Amiri, G.H. The response curve of beech tree (Fagus orientalis lipsky.) in relation to enviromental variables using generalized additive model in Khayroud forest, Nowshahr. J. Wood For. Sci. Technol. 2017, 24, 29–42. [Google Scholar]
  69. Rahimi, A. Autecology of Onobrychis Chorassanica Bunge. In Khorasan Razavi Province. Master’s Thesis, Ferdowsi University of Mashhad, Mashad, Iran, 1999. [Google Scholar]
  70. Balent, G.; Stafford Smith, D.M. Conceptual model for evaluating the consequences of management practices on the use of pastoral resources. In Proceedings of the fourth International Rangeland Congress, Montpellier, France, 22–26 April 1991; pp. 1158–1164. [Google Scholar]
  71. Wang, G.; Zhou, G.; Yang, L.; Li, Z. Distribution, species diversity and life-form spectra of plant communities along an altitudinal gradient in the northern slopes of Qilianshan Mountains, Gansu, China. Plant Ecol. 2002, 165, 169–181. [Google Scholar] [CrossRef]
  72. Grytnes, J.A. Ecological interpretations of the mid-domain effect. Ecol. Lett. 2003, 6, 883–888. [Google Scholar] [CrossRef]
  73. Moghaddam, M.R. Ecology of Terrestrial Plants; Tehran University: Tehran, Iran, 2005. [Google Scholar]
  74. Chaplygin, V.A.; Rajput, V.D.; Mandzhieva, S.S.; Minkina, T.M.; Nevidomskaya, D.G.; Nazarenko, O.G.; Kalinitchenko, V.P.; Singh, R.; Maksimov, A.Y.; Popova, V.A. Comparison of Heavy Metal Content in Artemisia austriaca in Various Impact Zones. ACS Omega 2020, 5, 23393–23400. [Google Scholar] [CrossRef] [PubMed]
  75. Mark, A.F.; Dickinson, K.J.M.; Hofstede, R.G.M. Alpine vegetation, plant distribution, life forms, and environments in a humid New Zealand region: Oceanic and tropical high mountain affinities. Arct. Antarct. Alp. Res. 2018, 32, 240–254. [Google Scholar] [CrossRef]
  76. Ranjbar, A.; Vali, A.; Mokarram, M.; Taripanah, F. Investigating variations of vegetation: Climatic, geological substrate, and topographic factors-a case study of Kharestan area, Fars Province, Iran. Arab. J. Geosci. 2020, 13, 597–614. [Google Scholar] [CrossRef]
  77. Zare, M.; Mohammady, M.; Pradhan, B. Modeling the effect of land use and climate change scenarios on future soil loss rate in Kasilian watershed of northern Iran. Environ. Earth Sci. 2017, 76, 305. [Google Scholar] [CrossRef]
  78. Childs, E.C. The Use of Soil Moisture Characteristics in Soil Studies. Soil Sci. 1940, 50, 239–252. [Google Scholar] [CrossRef]
  79. Vogel, H.J. A numerical experiment on pore size, pore connectivity, water retention, permeability, and solute transport using network models. Eur. J. Soil Sci. 2000, 51, 99–105. [Google Scholar] [CrossRef]
  80. Carcey Hincz, P.A.; Diaz Aguilar, I. Impact of Grazing on Soil Mesofauna Diversity and Community Composition in Deciduous Forested Rangelands of Northwest Alberta. Available online: https://open.alberta.ca/dataset/303a7691-a457-4b7e-a32b-f39b034060ec/resource/1883d8df-abe6-4848-a1bb-ba6d46cc6f66 (accessed on 7 April 2016).
  81. Wassie, A.; Sterck, F.J.; Teketay, D.; Bongers, F. Effects of livestock exclusion on tree regeneration in church forests of Ethiopia. For. Ecol. Manag. 2009, 257, 765–772. [Google Scholar] [CrossRef]
  82. Laris, P.; Wardell, D.A. Good, bad or ‘necessary evil’? Reinterpreting the colonial durning experiment in savanna landscapes of West Africa. Geogr. J. 2006, 172, 271–290. [Google Scholar] [CrossRef]
  83. Olliff-yang, R.L.; Case, E.J. The effects of leaf litter on germination in the serpentin endemic Boechera constancei. Madroño 2018, 65, 159–167. [Google Scholar]
  84. Bakåsmoen, H. Endemic Alpine Plant Facing Local Extinction in Context of Climate and Landuse Change in Hardanger, Norway, Nich Modeling of Artemisis Norvegica Fr. Master’s Thesis, University of Bergen, Bergen, Norway, 2021; p. 102. [Google Scholar]
  85. Austin, M. Spatial prediction of species distribution: An interface between ecological theory and statistical modelling. Ecol. Model. 2002, 157, 101–118. [Google Scholar] [CrossRef]
  86. Osborne, P.; Alonso, J.; Bryant, R. Modelling landscape-scale habitat use using GIS and remote sensing: A case study with great bustards. J. Appl. Ecol. 2001, 38, 458–471. [Google Scholar] [CrossRef] [Green Version]
  87. Gustafson, E.J.; Lietz, S.M.; Wright, J.L. Predicting the spatial distribution of aspen growth potential in the upper Great Lakes region. For. Sci. 2003, 49, 499–508. [Google Scholar]
  88. Holloway, G.J.; Griffiths, G.H.; Richardson, P. Conservation strategy maps: A tool to facilitate biodiversity action planning illustrated using the heath fritillary butterfly. J. Appl. Ecol. 2003, 40, 413–421. [Google Scholar] [CrossRef]
  89. Cabeza, M.; Araújo, M.B.; Wilson, R.J.; Thomas, C.D.; Cowley, M.J.R.; Moilanen, A. Combining probabilities of occurrence with spatial reserve design. J. Appl. Ecol. 2004, 41, 252–262. [Google Scholar] [CrossRef]
Figure 1. Location of studied sites in Iran.
Land 11 02315 g001
Figure 2. A. sieberi responses along the gradient of environmental factors.
Land 11 02315 g002
Table 1. The average values of the environmental factors in the A. sieberi habitats.
Environmental FactorsMean ± Stdev.Environmental FactorsMean ± Stdev.
Sand (%)63.6 ± 12.8Altitude (m)1796.6 ± 525.7
Silt (%)20.6 ± 8.7Aspect (converted value of azimuth)1.07 ± 0.75
Clay (%)17.1 ± 7.5Slope (%)11.4 ± 9.3
EC (dsm-1)2.4 ± 3.9Bare soil (%)45.4 ± 29.1
pH7.9 ± 0.3Stone and gravel (%)33.1 ± 22.2
Lime (%)21.8 ± 8.6Litter (%)5.4 ± 5.3
Organic carbon (%)0.32 ± 0.3Mean annual temperature (°C)15.3 ± 1.7
Total nitrogen (%)0.03 ± 0.3Mean annual precipitation (mm)185.7 ± 90.3
Soil saturation moisture (%)27.7 ± 6.7Latitude (Decimal degrees)33.69 ± 2.68
Table 2. The results of the generalized additive model for each of the significant explanatory variables.
Environmental VariableF *P *AIC ValueEnvironmental VariableF *P *AIC Value
Sand (%)18.90.0000 **1840.3Altitude (m)44.50.0000 **1590.4
Silt (%)87.20.0000 **1262.3Aspect4.20.0001 **2066.8
Clay (%)23.20.0000 **1812.4Slope (%)24.10.0000 **1754.8
pH6.60.0003 **2035.7Bare soil (%)19.20.0000 **1847.2
EC (dsm-1)11.50.0000 **1966.2Stone and gravel (%)3.10.027 *2095
Lime percentage (%)80.80.0000 **1296.4Litter (%)6.40.0003 **2034.8
Organic carbon (%)24.30.0000 **1771.4Mean annual temperature (°C)52.40.0000 **2178.9
Total nitrogen (%)24.50.0000 **1761.6Mean annual precipitation (mm)125.70.0000 **1572.6
Soil saturation moisture (%)16.10.0000 **1769.3Latitude (Decimal degrees)170.0000 **2594.3
* Significance at the 5% level. ** Significance at the 1% level.
Publisher’s Note: MDPI stays neutral with regard to jurisdictional claims in published maps and institutional affiliations.

