
Does Rural Operation System Reform Enhance Agricultural Output? Evidence from Sichuan Province


1
Bank of China Sichuan Branch, Chengdu 610015, China
2
College of Economics, Sichuan Agricultural University, Chengdu 611130, China
*
Authors to whom correspondence should be addressed.
Land 2022, 11(12), 2285; https://doi.org/10.3390/land11122285
Submission received: 17 November 2022
/
Revised: 9 December 2022
/
Accepted: 9 December 2022
/
Published: 13 December 2022
(This article belongs to the Special Issue Rural Land Use Transformation and Agricultural Sustainable Development)
Abstract
:Rural operation system reform is vital in promoting rural revitalisation and agricultural and rural modernisation in China. Based on the sample data of 153 counties in Sichuan Province from 2012 to 2020, this paper constructs a PSM-DID evaluation model to analyse the effectiveness of rural operation system reform on agricultural development from the perspective of policy action mechanism, variable differentiation and other aspects. The results show that: (1) rural operation system reform has significantly boosted the economic development of the counties implementing the pilot reform of the rural operation system; (2) rural operation system reform mainly has two components: rural land system reform and agriculture organisation innovation; both have an impact on county economic and social development, but the degrees of impact are different; (3) the effectiveness of the rural operation system reform policy has a specific time lag. The results of this paper enrich the effectiveness evaluation of the reform policy on economic development and have policy implications for further promotion of agricultural and rural reform in China.
1. Introduction
Despite limited natural resources, China has largely been able to meet its growing demand for food through its agricultural production. With nearly twenty percent of the world’s population but only five percent of the world’s fresh water and eight percent of its arable land, China met ninety-five percent of its food demand in 2015 [1]. This marvellous achievement is a result of proper reform in the agricultural sector to encourage food production. For example, the first Chinese rural reform, the household responsibility system (HRS), which was implemented from 1978 to 1984, dismantled the people’s communes and contracted arable land to individual households, mainly based on the number of people and labourers in the household. Farmers’ autonomy in production and operation was guaranteed, and these market-based reforms provided some of the most compelling evidence of the power of market incentives since the 1970s in the Chinese agriculture sector. The Chinese agricultural sector increased the production of nearly every commodity while releasing millions of labourers, which fuelled growth in non-farm sectors [2]. Despite the significant impact of rural reforms, several challenges necessitated immediate remedies. For instance, the land ownership remained collective, but its control and income rights belonged to individuals under the HRS in China who had some contract renewal issues. The government today struggles with what to do when this contract period expires and, thus, calls for policies and measures from scholars to improve the agricultural sector.
In 2017, China launched the multidimensional Rural Revitalization Development Strategy, which requires China to harness lessons from its past development and policymaking. Deepening agricultural and rural reform is the key to revitalising Chinese rural areas. Since 2012, China has coordinated and promoted significant reforms in rural contracted land, such as the “separation of three rights policies”, the collective property rights system and the residential base system, and explored and formed many pilot experiences and institutional achievements. As a typical agricultural province in China, Sichuan has initiated many national agricultural and rural pilot reforms. Since 2012, Sichuan Province has made reform of the rural operation system a critical task in promoting the high-quality development of its agricultural sector and rural dwellers’ (mainly farmers) welfare. Moreover, the province has carried out pilot reforms in farmland tenure, collective property rights and agricultural socialised services to improve agriculture. Therefore, using Sichuan as an analytical lens is of much interest.
Numerous studies have examined factors contributing to China’s agricultural growth, such as rural institutional innovation [3], technological change [4], market reform, trade liberalisation and investment in agriculture [5]. With the continuous deepening of the reform, it is necessary to scientifically evaluate the link between the reform of the rural operation system on agricultural growth, especially in food production, sum up the reform experiences and find room to improve the institutional environment governing land, labour, and capital.
Rural operation system reform is of great significance to adjustment and optimisation of rural production relations and development of agricultural productivity, but many factors and resources constrain it. It is necessary to objectively analyse the impact of the reform and its policy transmission mechanism. Given this, based on the practice of rural operation system reform in Sichuan Province, this paper aims to test the effectiveness of the rural operation system reform on rural economic development by using propensity score matching (PSM-DID) and county-level statistical data of Sichuan Province from 2012 to 2020. The marginal contribution of this paper lies in the following: first, this paper takes Sichuan, a typical agricultural province and a significant reform and innovation province in western China, as a research case. Compared with the existing research, which mainly focuses on rural families, this study is at the county level. It is more representative and referential to discuss the effectiveness of agricultural and rural reform within a relatively moderate range. Second, this paper focuses on the main contents of the reform and innovation of Sichuan’s agricultural operation system in the past decade, namely the reform of the agricultural land market and the reform of the agricultural enterprise organisation. It uses the PSM-DID method to conduct an empirical analysis of agricultural and rural reform issues to compare the effectiveness of agricultural and rural reform policies in different reform pilot counties, which enriches the research paradigm of the endogenous issue of reform efficiency because national reform assessments are mostly based on county-level responses. From our analysis, we find that there is a positive link between rural operation system reform and county-level economic development, and rural land system reform and agriculture organisation innovation both have an impact on county-level economic development, but the degrees of impact are different
The rest of the paper is organised as follows. Section 2 reviews the literature and develops the research hypothesis. Section 3 describes the study area’s rural reform history and reality and presents the data sources, econometric methods, and descriptive statistics. Section 4 presents the results of the PSM-DID model. Section 5 concludes.
2. Literature Review and Hypothesis Development
2.1. Literature Review
2.1.1. Overview of the Impact of Rural Land System Reform on Agricultural Output
Because land is the most important agricultural production factor, rural land system reform significantly impacts agricultural output. The choice of land system is an important issue concerning farmers’ livelihood, agricultural development, and social stability. Based on systematically reviewing the evolution of land system reform in China, the researcher reviewed the critical problems of the rural land system in China and analysed the necessity, significance, and measures of deepening the reform of the land system and finally revealed the internal mechanism of land system reform promoting rural revitalisation [6]. Based on the data of 30 provinces from 2000 to 2017, the authors found the national average land use efficiency is low, and the provinces that transfer land in are more efficient in land use than the ones with a land transfer out, which further illustrates the seriousness of agricultural land tension in China. Moreover, this result testifies that increasing agricultural arable land can bring about a scale effect, which increases the output of unit land, while the outflow of the land reduces the income of agricultural workers [7]. Based on 2010–2015 official surveys by the Ministry of Agriculture, the study applied the DID method to reveal how China’s latest land titling reform affected the land rental market [8]. The land titling reform led to an increase in land transferred to agricultural enterprises and cooperatives, explains the incentives of land transfer, analyses the influencing factors of farmers’ decision on land transfer and then measures the income effects of land transfer and identifies the primary sources of income effects utilising open-access data collected through the China Family Panel Studies [9]. Their findings suggest that optimising the incentive role of China’s existing rural land property system can help the orderly flow of rural land resources, increasing rural household income.
2.1.2. Overview of the Impact of Agricultural Organization Innovation on Agricultural Output
The traditional household responsibility system has been challenging to adapt to the needs of Chinese economic growth, and the organisational model of agricultural development needs innovation to improve productivity and meet the requirements of modern agriculture. With an extensive panel dataset of farm households in China during 2010–2011, the study [10] found that smaller farms utilise more labour and non-labour inputs per mu and benefit from a higher labour effort. Moreover, smaller farms concentrate more on grain output and cash costs while focusing less on family labour input costs to maximise value-added margins rather than profits. By investigating the impact of mechanisation services on farm productivity in northern China, one finding proved that mechanisation services improved farm productivity through substituting labour [8]. However, they may generate a less positive impact on farms that do not have self-owned capital equipment. Organisation institution in agriculture is one of the domains with drastic innovations in China. Mapping the emergence and evolution of various agricultural organisations in China since 1978, the authors analysed the development status and the trend of the agricultural organisation system based on statistical yearbooks. They concluded that other organisations’ innovation would continue and sustain for a long time in China [11]. Due to the weakness of agricultural social organisations, the government should take the initiative to facilitate social service organisations to effectively improve the efficiency of both sides and ensure the driving force of agricultural social organisations. Agricultural extension service is the foundation of sustainable agricultural development. They analysed the influence of agricultural extension services on sustainable agricultural development and constructed an evaluation system for sustainable agricultural development from the four dimensions of agricultural environment, society, economy, and agricultural extension service [12]. Taking three national modern agriculture demonstration zones in Suzhou in Jiangsu Province as a case study, they discussed the main factors affecting sustainable agricultural development [13].
2.1.3. Overview of the Mechanism of Rural Operation System Reform on Agricultural Output Improvement
The reform of the rural operation system is highly systematic and comprehensive. Scholars at home and abroad have conducted systematic research from the perspective of Marxist political economy, the utility evaluation theory of Western economics and the element restriction theory of new institutional economics. According to the Marxist political economy theory [14], the material productive forces of a society develop to a particular stage and contradict the existing production relationship or property relationship in which they have been moving, and only reforming the production relationship can eliminate the shackles that restrict the development of productivity. Decollectivisation improved total factor productivity and accounted for about half of the output growth during 1978–1984. The adjustment in state procurement prices also contributed positively to output growth. Its impact came mainly from the responses in input use [15]. According to the new institutional economics, the constraints of reform on economic behaviour are affected by production factors, which need to be supported and guaranteed in the transmission process. The allocation efficiency of land resources and the low efficiency of agricultural production are the deep-seated contradictions that restrict rural development [16]. One study found that eliminating land reallocations increased off-farm labour and household per capita net income by 7% and 6.5%, respectively. However, this came at the cost of a 6% reduction in total agricultural output and a significant jump in intra-village income inequality [17]. The land transaction mechanism is imperfect, making it challenging to concentrate land resources, becoming an essential factor restricting agricultural development. According to the resource allocation theory of Western economics, the key to ensuring the priority development of the market economy by optimising the allocation of resources lies in establishing safeguard measures conducive to optimal allocation of public and social resources. Focusing on China’s rural revitalisation campaign, they demonstrated how the state, as the creator and regulator of land rights and property titles, facilitates landscape change by relaxing regulations over the lease of rural land and creating market institutions that favour land transfers to organised capital [18].
2.2. Research Hypothesis
To sum up, it is found that the rural operation system reform is of great significance to adjustment and optimisation of rural production relations and development of agricultural productivity, but many factors and resources constrain it. It is necessary to objectively analyse the impact of the reform and its policy transmission mechanism. Given this, based on the practice of rural operation system reform in Sichuan Province, this paper tests the effectiveness of rural operation system reform on rural economic development by using propensity score matching (PSM-DID) and county-level statistical data of Sichuan Province from 2012 to 2020. The following research hypotheses are proposed:
Hypothesis 1.
Compared with the non-pilot counties, the counties carrying out the pilot reform of the rural operation system have effectively increased the total grain output.
Hypothesis 2.
Compared with the non-pilot counties, the counties carrying out the pilot reform of the rural operation system have effectively increased the gross output value of agriculture, forestry, animal husbandry and fishery.
Hypothesis 3.
Compared with the non-pilot counties, the counties carrying out the pilot reform of the rural operation system have effectively increased the per capita income of farmers.
3. Materials and Methods
3.1. Study Area’s Rural Reform History and Reality
3.1.1. Overall Characteristics of Rural Operation System Reform and Agricultural Development in Sichuan Province in the Last Decade
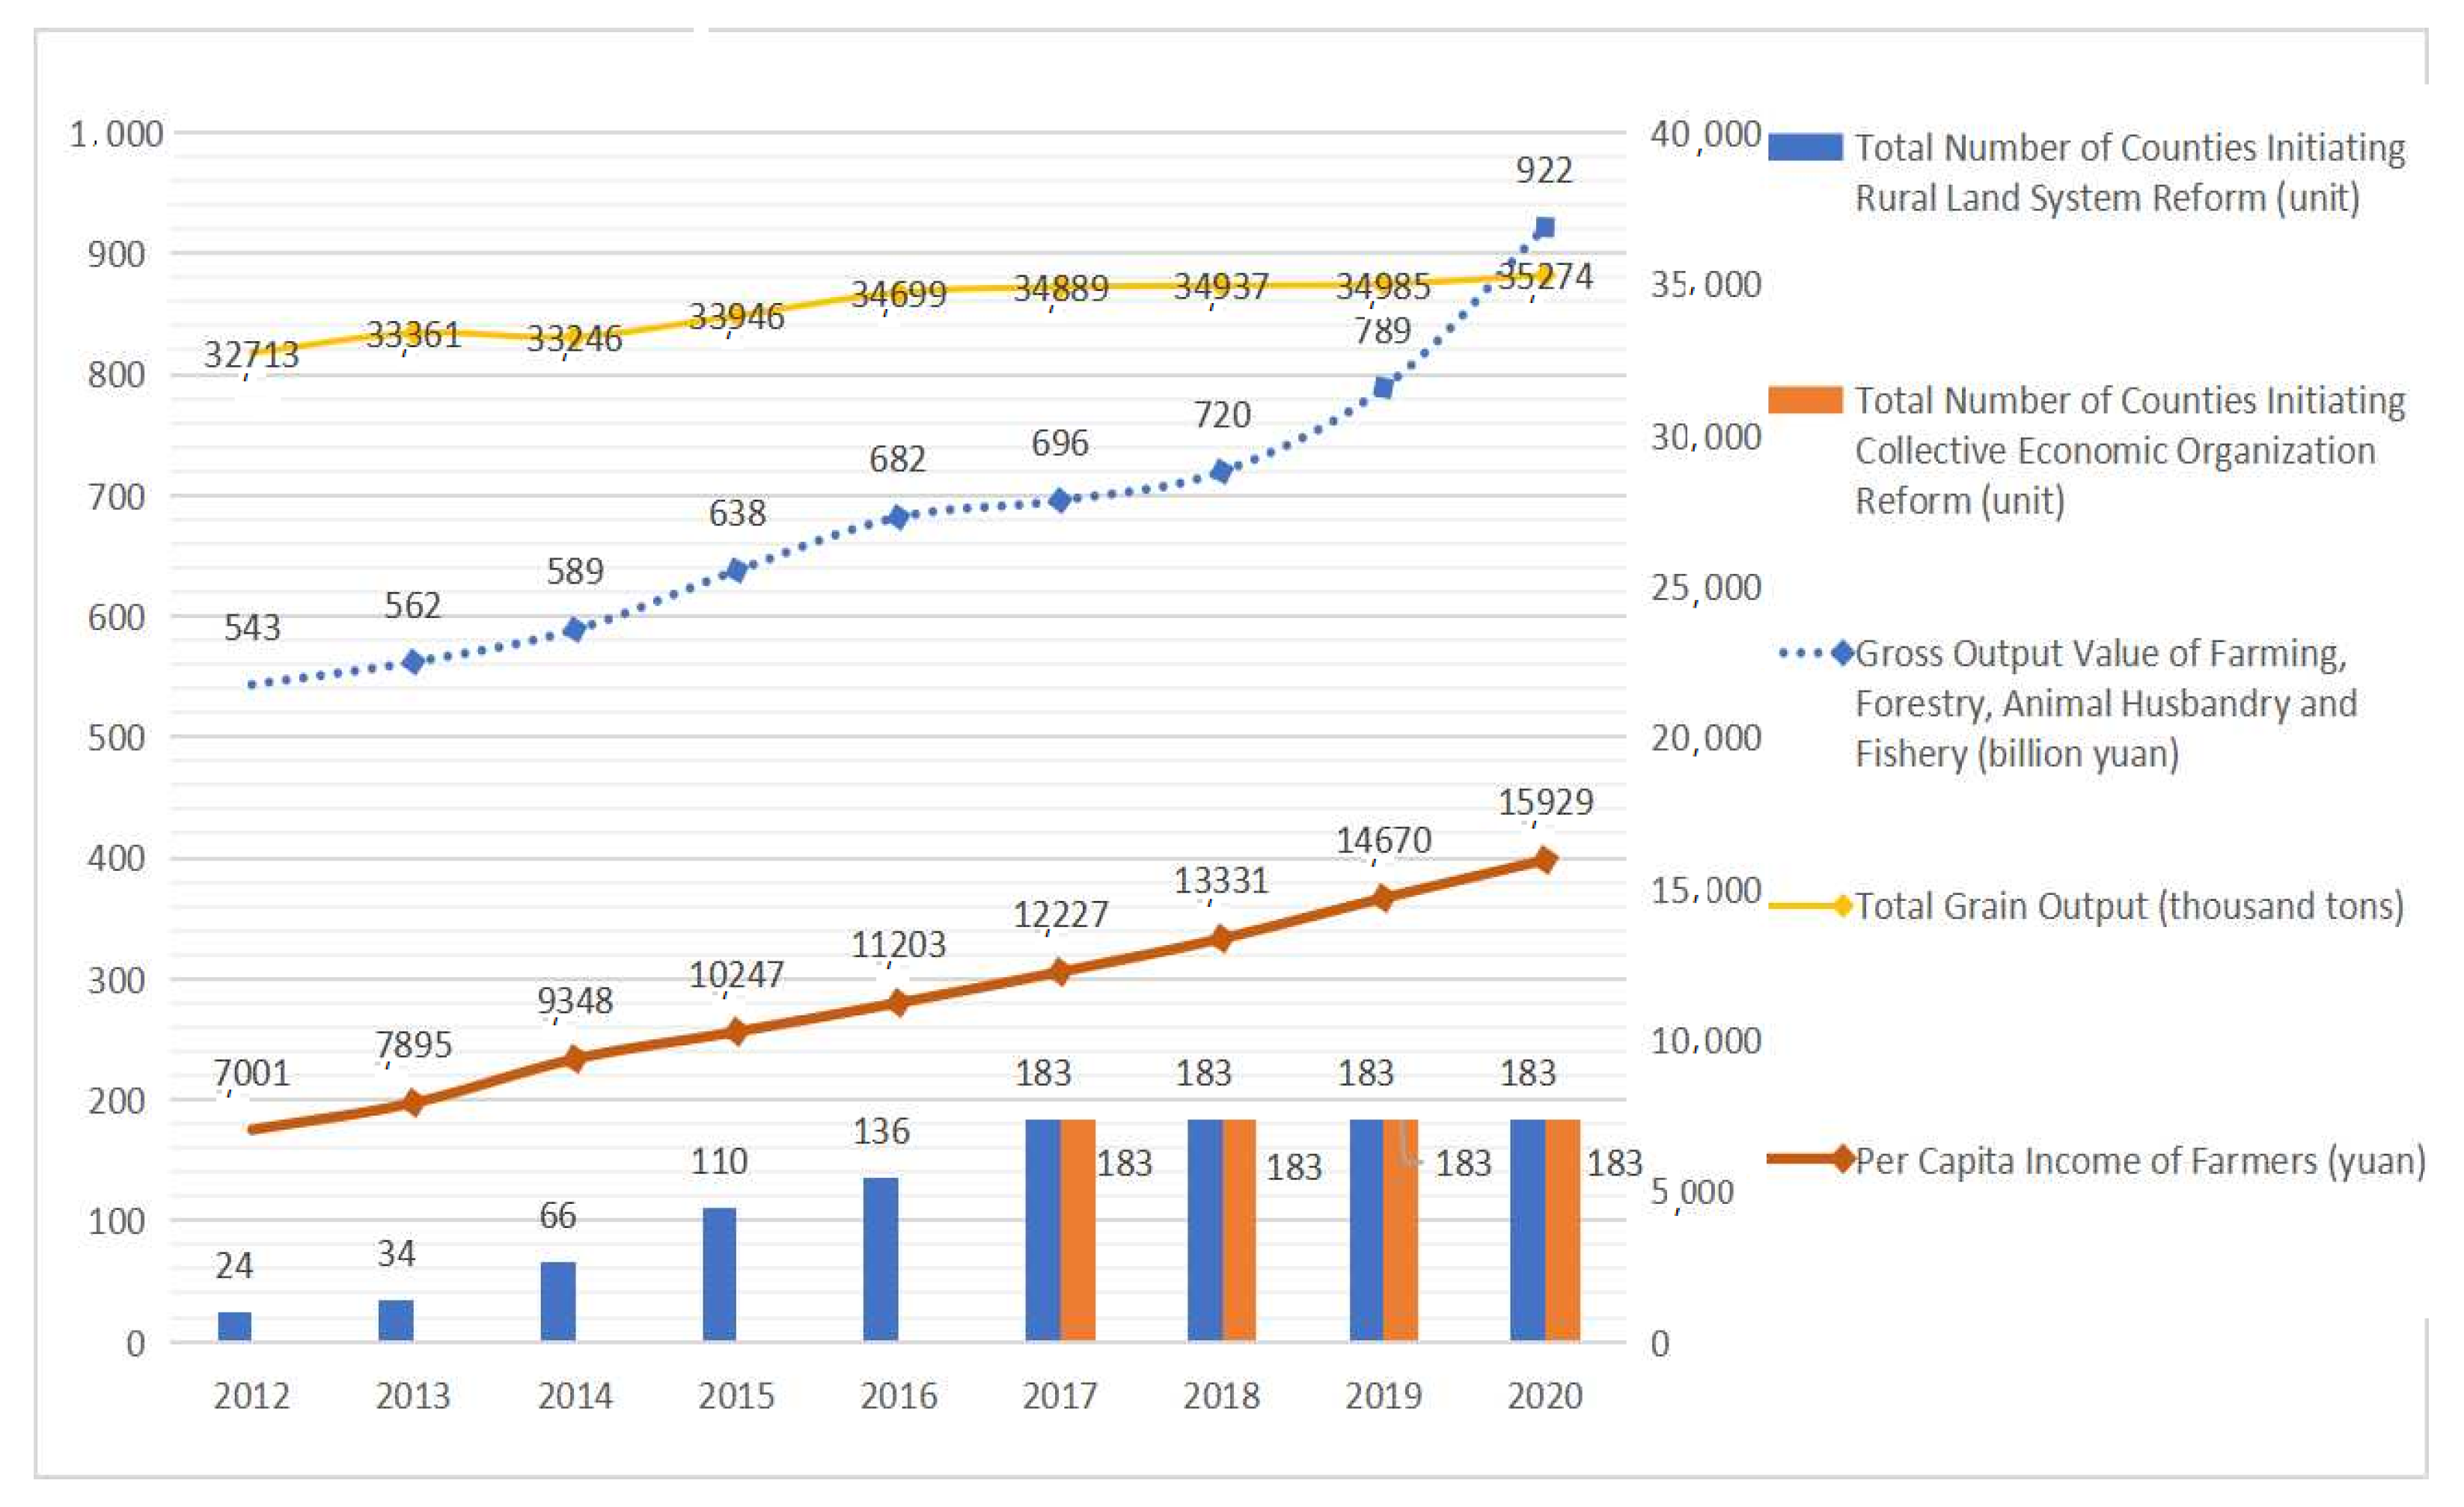
As a typical agricultural province in China, Sichuan is endowed with rich agriculture, forestry, animal husbandry and fishery resources and has a good foundation for rural reform. In the past decade, Sichuan has carried out active and powerful exploration of rural land system reform and agriculture organisation innovation. Figure 1 reports the relationship between the number of counties in Sichuan that initiated the rural land and rural collective economic organisations reform and the total grain output, the gross output value of farming, forestry, animal husbandry and fishery and the per capita income of farmers in that year. As shown in Figure 1, with the deepening of the rural land system reform and agricultural organisation reform, the gross output value of agriculture, forestry, animal husbandry and fishery and the per capita income of farmers continued to rise. In contrast, the total grain output showed a steady increase.
Due to the diverse natural and geographical environment, uneven distribution of agricultural resources and different levels of economic and social development of the province, the Sichuan Provincial Government has divided 183 counties into four types: main urban areas, key development zones, main agricultural producing counties and key ecological function counties. At the same time, the implementation progress of rural reform in the whole province also shows the characteristics of unbalance.
3.1.2. The Rural Land System Reform in Sichuan
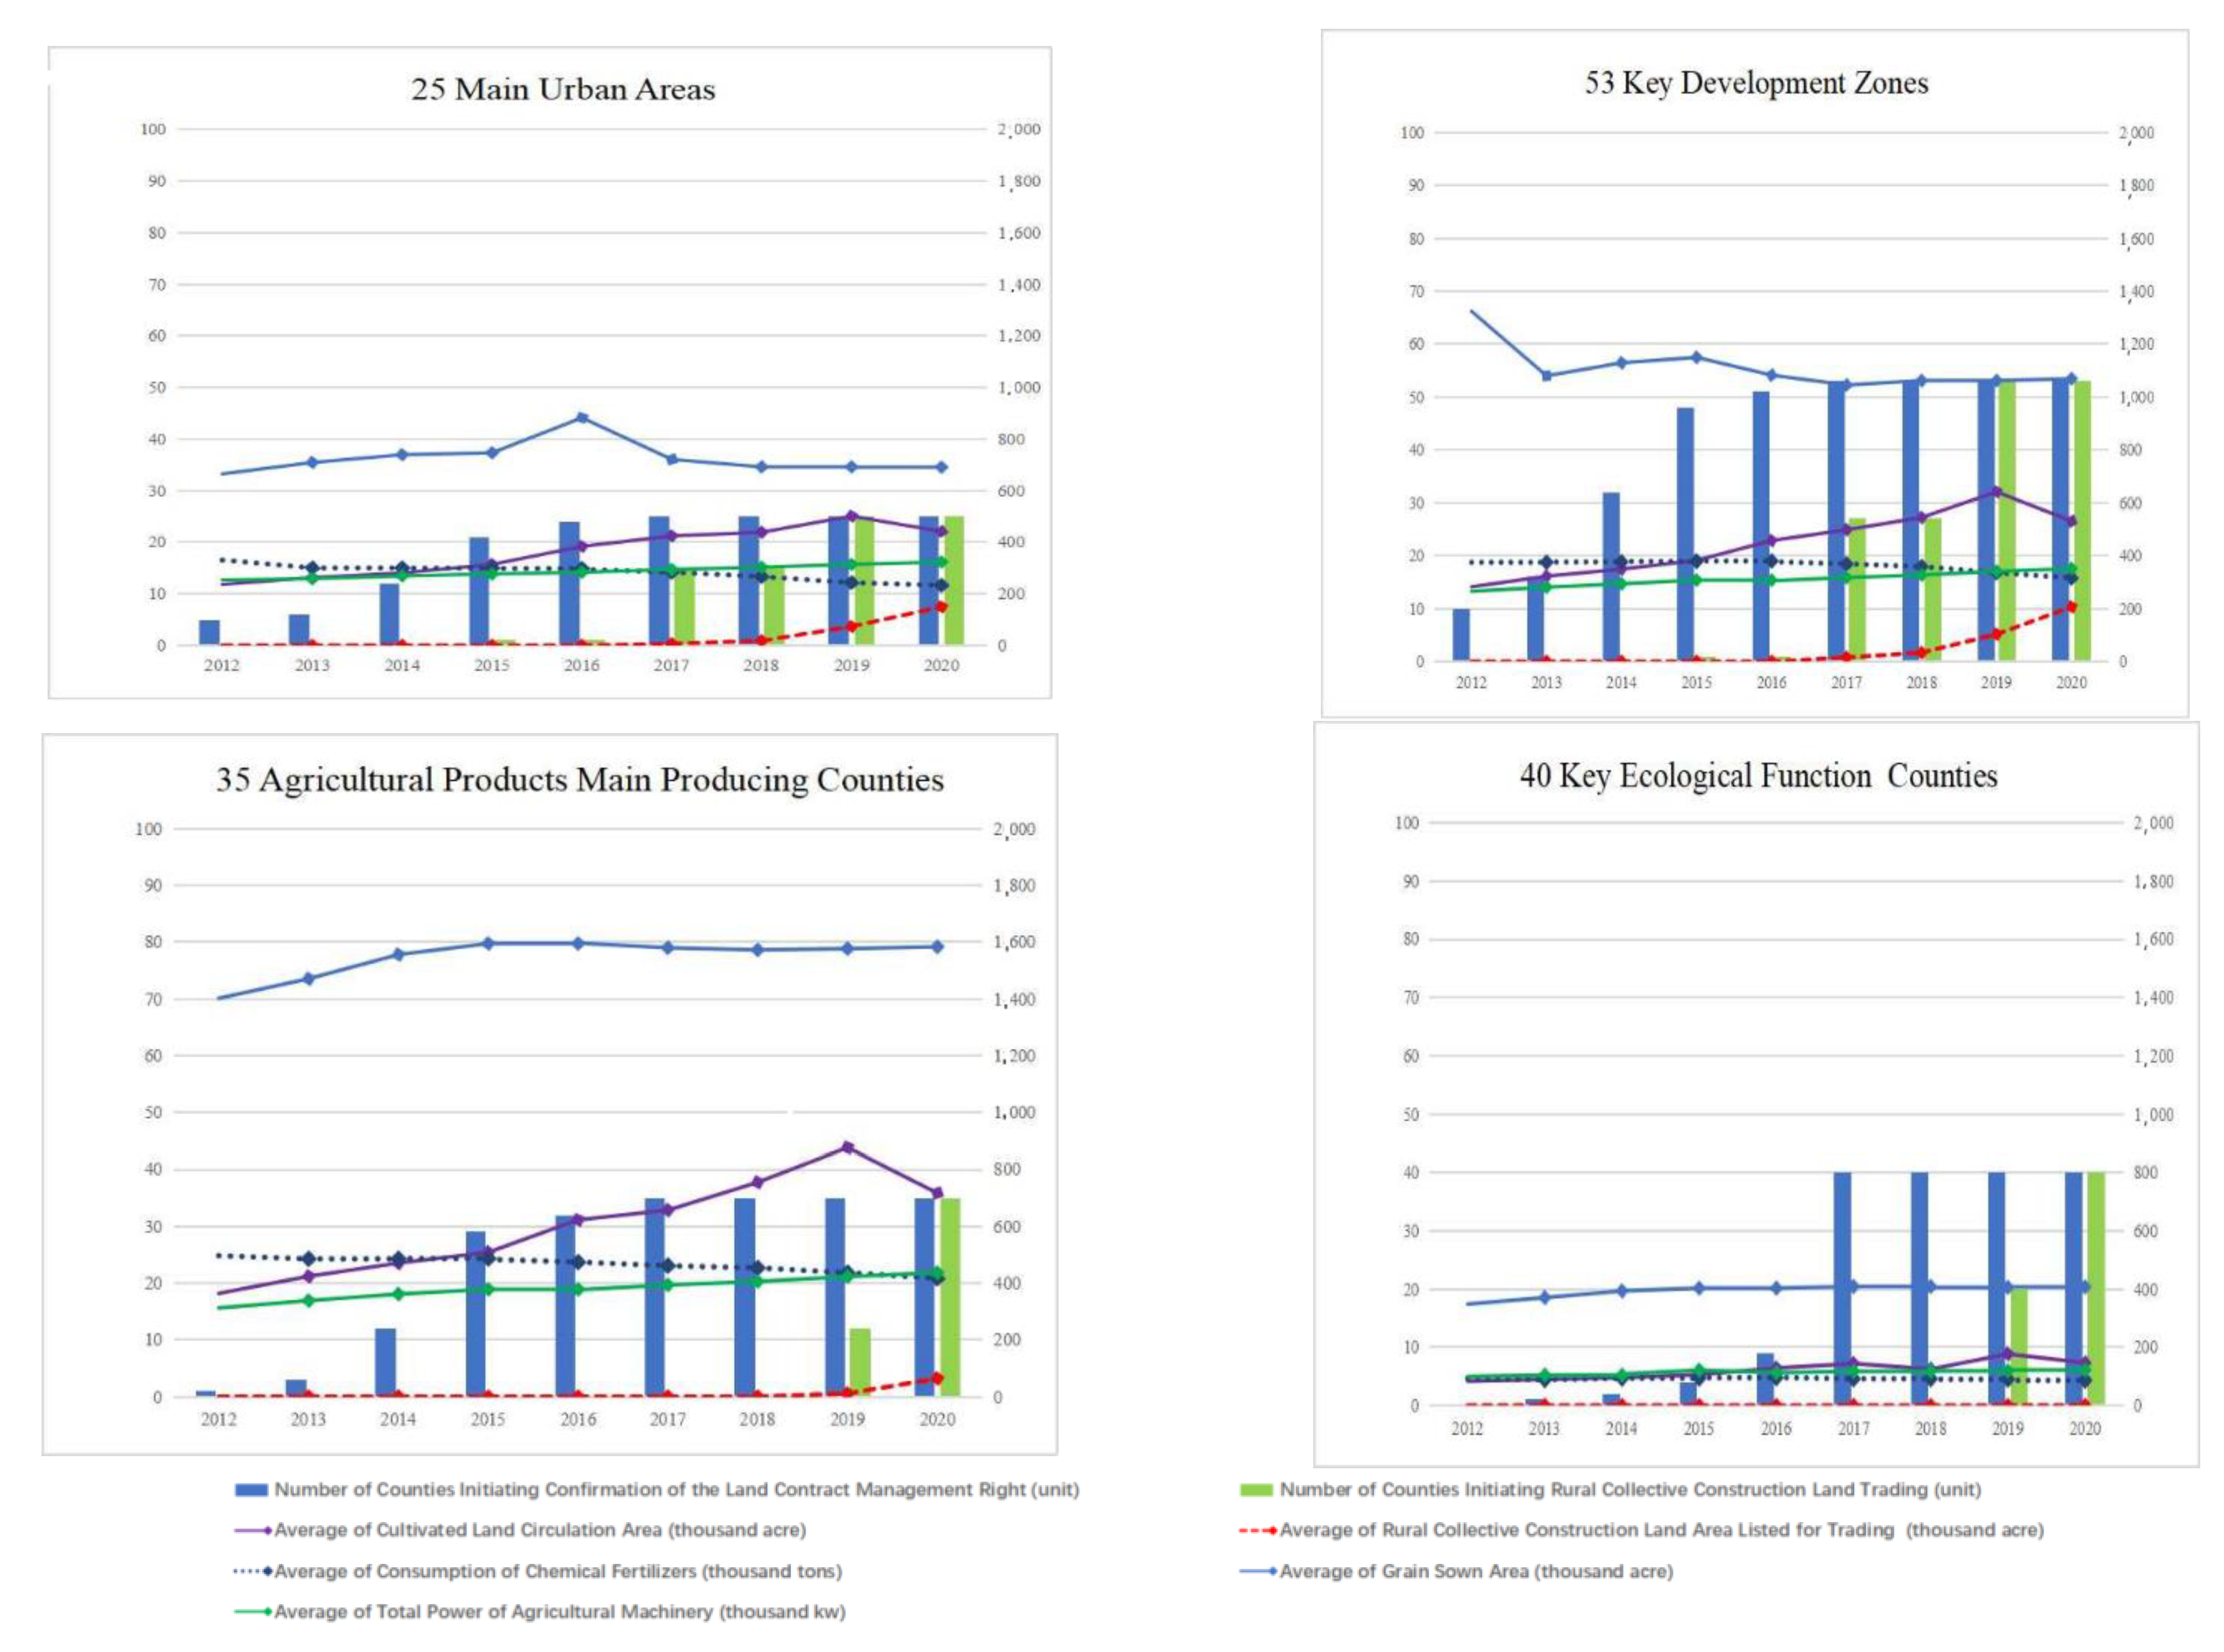
Sichuan is one of China’s first provinces to reform the farmland tenure system. In 2008, Sichuan launched the pilot project for confirmation, registration, and certification of contractual land management rights in Chengdu. In 2013, Sichuan launched the reform of collective construction land trading in Luxian County and Pixian County. The achievement of those reforms was promoted throughout the province later. Figure 2 reports the average value changes of arable land circulation area (circulation), collective construction land area listed for trading (trade), grain sown area (sown), the total power of agricultural machinery (power) and consumption of chemical fertilisers (fertiliser) in 4 categories of counties after land system reform from 2012 to 2020. As seen in Figure 2, in promoting rural land system reform, four categories of counties have completed the confirmation, registration and certification of farmland contractual management rights and launched the reform of collective construction land trading. The arable land circulation area (circulation) steadily increased from 2012 to 2019 but fell slightly in 2020. The collective construction land area listed for trading (trade) grew rapidly in the later reform period, and the total power of agricultural machinery (power) generally increased but varied in magnitude. Consumption of chemical fertilisers (fertiliser) showed a decreasing trend in varying degrees, while the sown area of grain (sown) showed a mixed rise and fall.
Among them, the reform of confirmation, registration and certification of land contracted management rights and reform of collective construction land trading in 25 main urban areas were progressing rapidly. Arable land circulation area (circulation) and total power of agricultural machinery (power) showed an overall upward trend, while consumption of chemical fertilisers (fertilisers) declined continuously. Grain sown area (sown) slowly declined after peaking in 2016. The collective construction land area listed for trading (trade) has grown rapidly after 2019. The average value ranked second among the four categories of counties, indicating that, although the main urban areas had relatively few agricultural resources, their rural marketisation was relatively high. The average of various indicators in the 53 key development zones was slightly higher than that in the main urban areas, and the average collective construction land area listed for trading (trade) was the highest in four categories of counties. Except for the grain sown area (sown), the trend of other indicators was similar to that in the main urban areas. The grain sown area (sown) showed a stable trend after a slight decline in 2013. Grain sown area (sown) of the 35 agricultural products’ main producing counties was relatively stable. Various indicators except the collective construction land area listed for trading (trade) were the highest, consistent with their agricultural function positioning. The trend of various indicators was similar to that of key development zones and main urban areas. In 40 key ecological function counties, the progress of confirmation, registration and certification of farmland contractual management rights and the reform of collective construction land trading was the slowest. Various indicators ranked last among the four categories of counties, with little change in the overall trend.
3.1.3. The Initial Achievement in Reform and Innovation of Agricultural Organizations
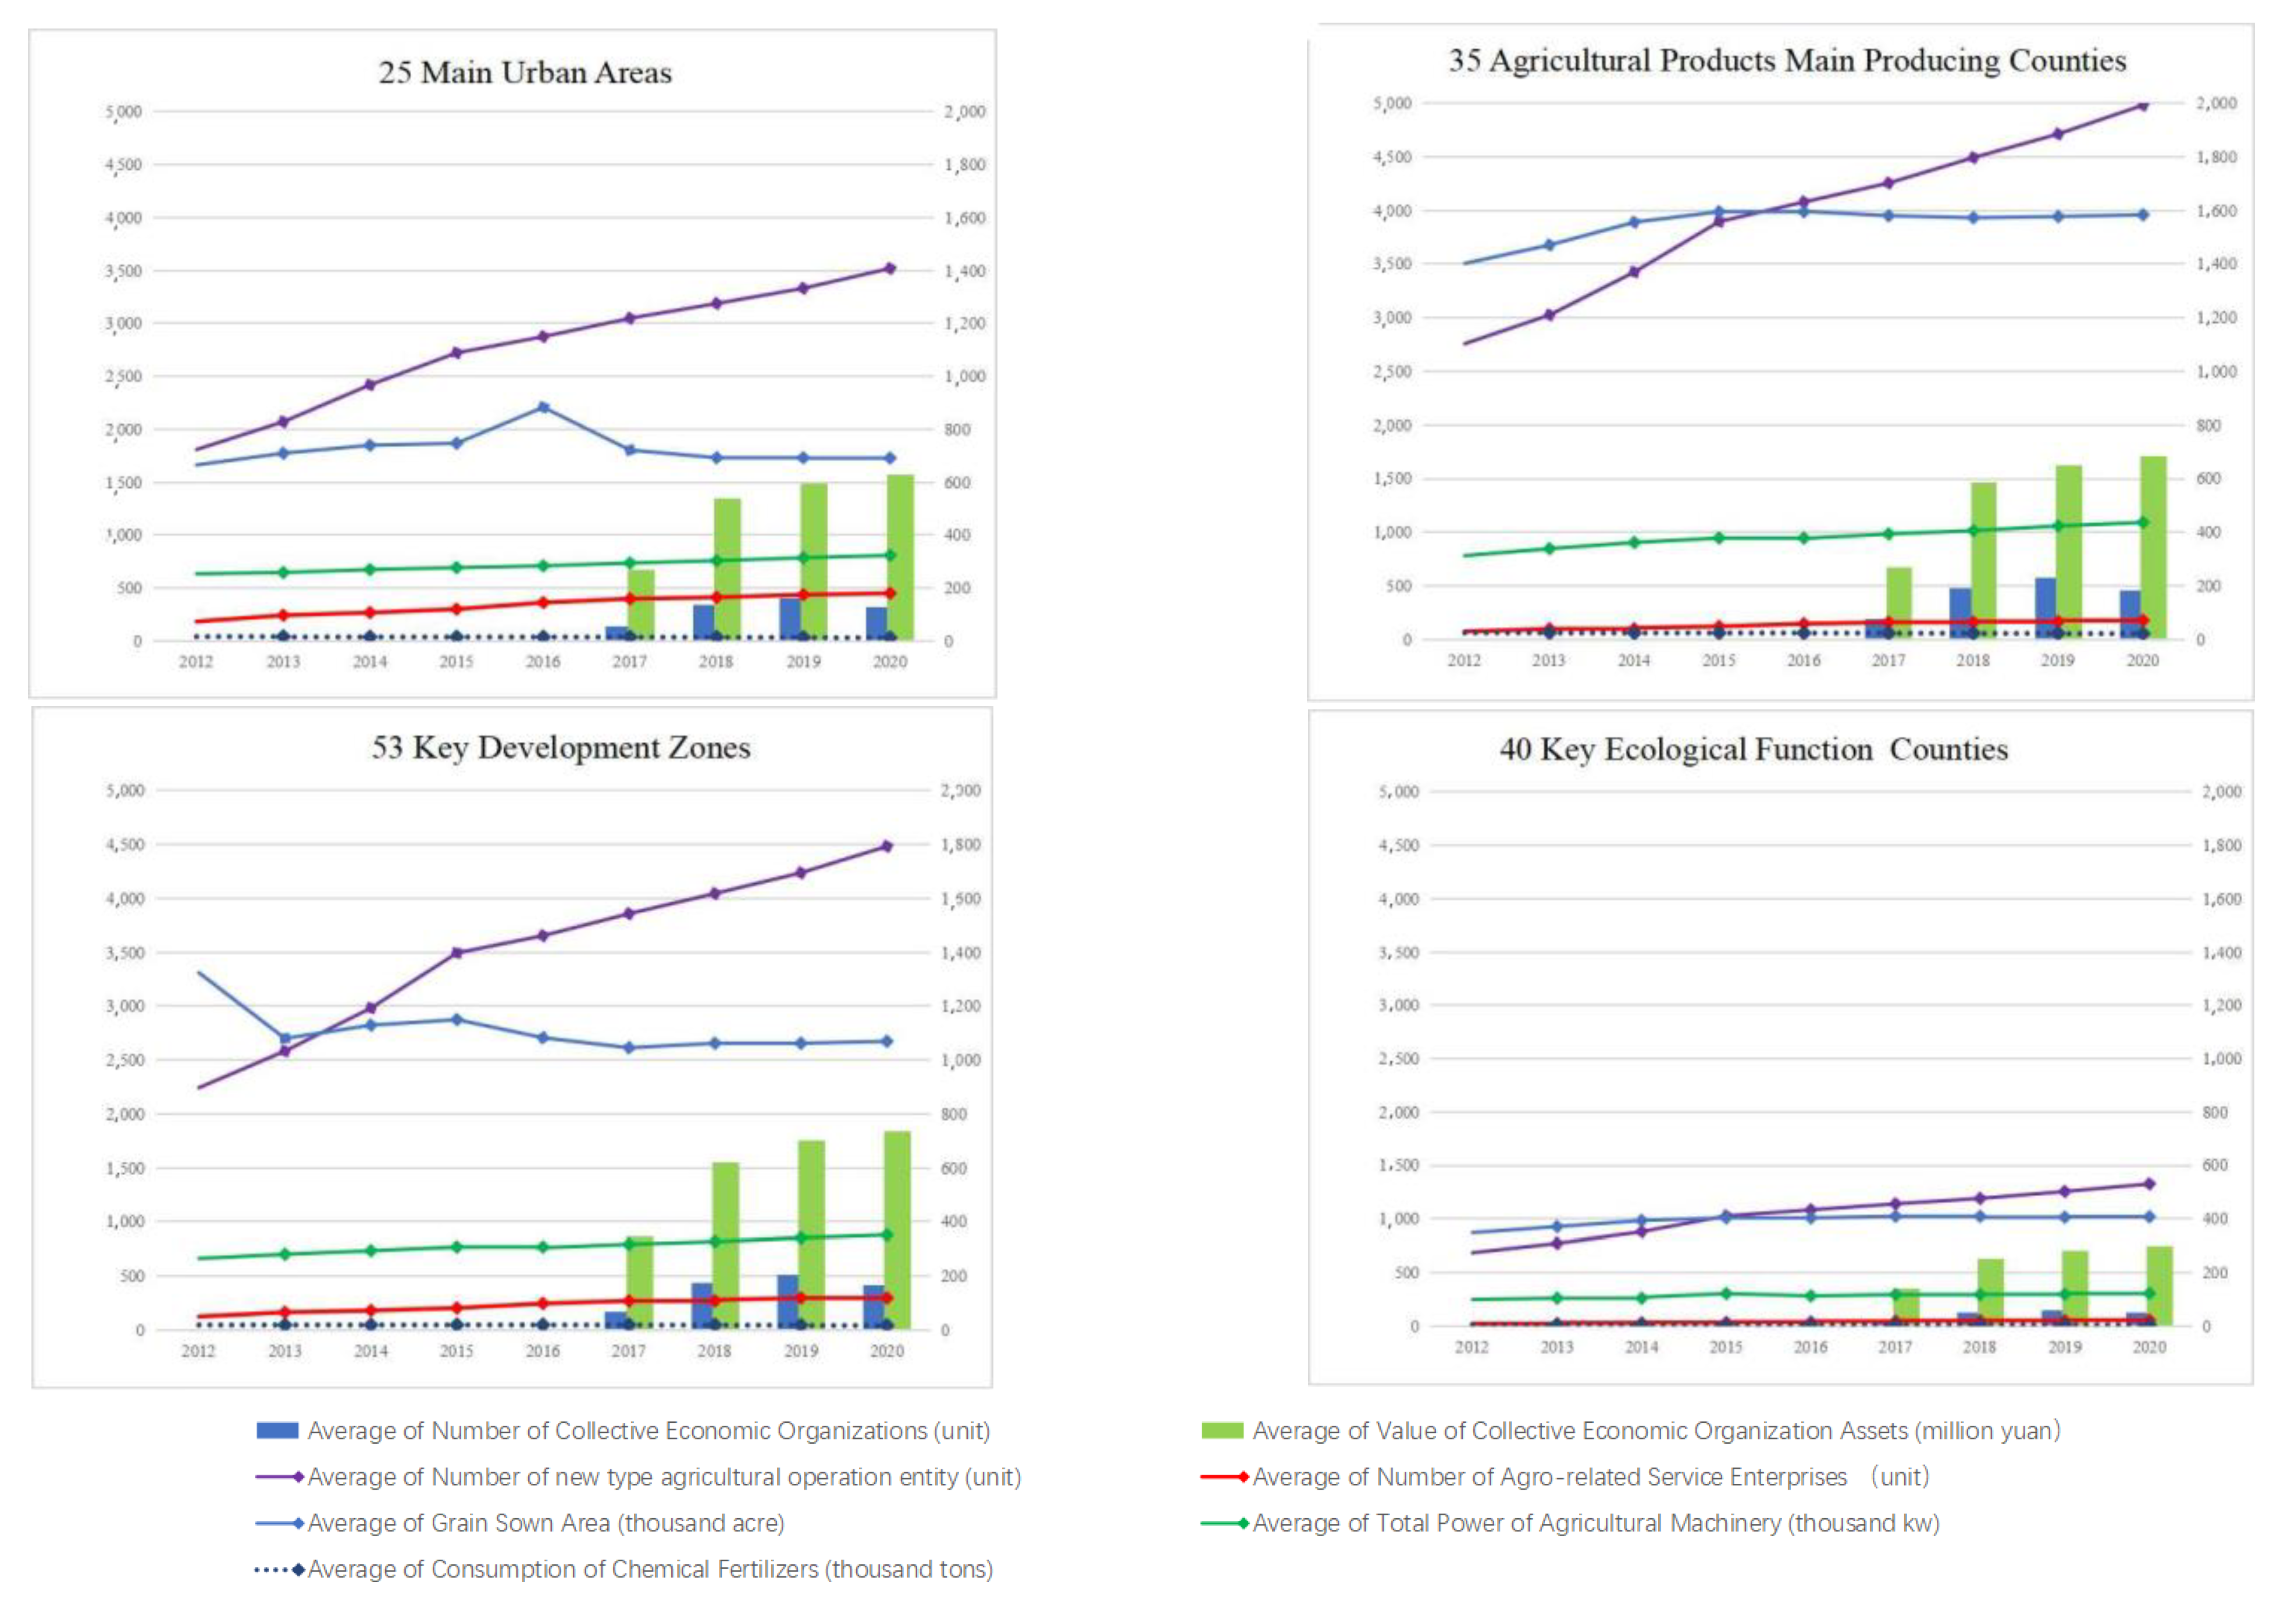
Since 2017, Sichuan Province has comprehensively started reforming collective economic organisations. In the past five years, the reform of collective economic organisations has completed the phased tasks of liquidation and capital verification of collective assets, confirmation of members, quantification of collective asset shares and registration, code issuance and certification of rural collective economic organisations. The total collective assets of the villages are CNY 239.78 billion, the collective land area is 32.07 million hectares and the total income of rural collective economic organisations is CNY 14.09 billion. The reform of collective economic organisations has injected new vitality into the rural economy, promoted development of agricultural organisations, such as new types of agricultural operation entities and agro-related service enterprises, and further enriched the agricultural operation organisation system. Figure 3 reports the changes in the number of collective economic organisations (organization), the value of collective economic organisations’ assets (asset), the number of new type agricultural operation entities (entity), the number of agro-related service enterprises (enterprise), grain sown area (grain), the total power of agricultural machinery (power) and consumption of chemical fertilisers (fertiliser) before and after the provincial reform of collective economic organisations launched in 2017. As can be seen from Figure 3, after the reform of collective economic organisations across the province began in 2017, the number of collective economic organisations (organization) and value of collective economic organisations’ assets (asset) in all counties began to grow rapidly. In 2019, Sichuan began to adjust the township administration, which also adjusted the number of collective economic organisations (organization), but the value of collective economic organisations’ assets (asset) kept growing. At the same time, the number of new type agricultural operation entities (entity) and the number of agro-related service enterprises (enterprise) increased to varying degrees, the total power of agricultural machinery (power) showed an upward trend, grain sown area (sown) maintained stable and consumption of chemical fertilisers (fertiliser) was decreasing year by year.
In the agricultural organisation system of 25 main urban areas, the average number of new type agricultural operation entities (entity) and collective economic organisations (organization) can only rank third among the four categories of counties. However, the average number of agro-related service enterprises (enterprises) is the highest, indicating that the agricultural marketisation degree of the main urban areas is the highest among the four categories of counties. The average performance of all indicators in 53 key development zones and 35 agricultural products in main producing counties is relatively close. The average number of agro-related service enterprises (enterprises) in key development zones is larger than in agricultural products’ main producing counties. The average number of new type agricultural operation entities (entity), the total power of agricultural machinery (power) and the consumption of chemical fertilisers (fertiliser) in agricultural products’ main producing counties are higher than those in key development zones. The average value of various indicators in 40 key ecological function counties is the lowest.
3.2. Data Sources and Definition of Variables
3.2.1. Data Sources
This paper selected 183 counties of Sichuan Province for the sample from 2012–2020. Furthermore, the sample data are preliminarily processed: (1) samples with a large number of abnormal values and missing data were excluded; (2) continuous variable was winsorised by 1%; (3) counties established after 2012 were removed from the sample; (4) urban districts with an urbanisation rate of 85% and above and animal husbandry counties with an urbanisation rate of 25% and below were excluded. Finally, a sample of 15 classification indicators and 1377 items in 153 counties was obtained from the complete sample data across the province. The above data are from Sichuan Statistical Yearbook, Sichuan Agricultural Yearbook, China County Statistical Yearbook, China Rural Revitalization Survey Database (CRSD), China Rural Database (CCNG) and other professional statistical databases.
3.2.2. Definition of Variables
Dependent variables: In this paper, we included three dependent variables: Grain (the total production of cereals, beans, and tuber crops), value (the Gross output value of agriculture, including the value of Farming, Forestry, and Animal Husbandry and Fishery), and Income (the per capita income of farmers). These three variables can effectively represent the level of rural economic development and can be used to analyse the impact of Rural Operation System Reform on agricultural development and farmers’ income.
Independent variables: In this paper, we set the independent variables as grouped dummy variables, time dummy variables, and double difference variables. (1)rural land system reform is essential to Rural Operation System Reform. The land contractual management right’s confirmation, registration and certification is the core work of the rural land system reform in the past decade, and it also affects the innovation and development of agricultural organisations. Therefore, based on whether or not to launch the pilot program for the confirmation, registration and certification of the land contractual management right, the counties that carried out the pilot program as the treated group and counties that did not carry out the pilot program were taken as the control group. (2) Since the certification rate of contractual land management right in Sichuan was more than 75% in 2015, Sichuan launched the pilot reform program of the rural collective assets joint-stock cooperative system this year. The Rural Operation System Reform was significantly strengthened. We identified 2015 as the policy impact node, and ” before policy” and ” after policy” were distinguished by constructing dummy variables. (3) The difference in the difference variable is constructed by the interaction term of the two dummy variables.
Control variables: We include a core set of six variables as control variables: circulation (the area of arable land for which land use rights are transferred to other farmers or economic organisations), trade (collective construction land listed for trading), organization (the number of collective economic organisations), asset (the value of collective economic organisations’ assets), entity (the number of new types agricultural business entities), enterprises (number of agro-related service enterprises). In addition, three variables that affect agricultural output are controlled: sown (grain sown area), power (total power of agricultural machinery) and fertilisers (consumption of chemical fertilisers). See Table 1 for details.
3.3. Empirical Model
Based on the PSM-DID model [19], this paper uses the PSM method to match the samples of the post-reform treated group and the pre-reform control group. The successfully matched samples are then assessed by the DID method on the impact produced by the implementation effect of the reform policy.
(1) PSM model. Following the model construction approach [20], is the incremental change in the effectiveness of rural operation system reform in county during period . is the incremental change in effectiveness in period of a given county starting rural operation system reform in period , is the incremental change of effectiveness in period of the same county without starting rural operation system reform in period .
The impact of rural operation system reform on the economic development of county is the average treatment effect of the independent variable in the treated group, which can be expressed as:
In Equation (1), represents the mean of the counterfactuals, namely the average economic development results of the county in the control group without starting rural operation system reform during period. Since the mean of the counterfactual is not observable in reality, we use the matching method [21] to introduce control variables to estimate the mean of the counterfactual. Thus, the effectiveness of agricultural and rural reforms can be set as follows:
In Equation (2), is the average economic development results of the county after agricultural and rural reforms during period, is the average economic development results of the control group county during period and is a time vector of control variables.
In order to estimate the propensity score values of the control variables, we use the Nearest-Neighbor approach [22] to estimate the propensity scores of the control variables in two different types of counties in treated and control groups using a Logit model. Then, the mean of the effectiveness of agricultural and rural reform in counties under the PSM model can be transformed into:
In Equation (3), P is the scoring tendency of county under the impact of the control variable and the propensity score result that the PSM model needs to calculate and test.
(2) DID model. In this paper, a double difference fixed effect model is used to capture the implementation effects of rural operation system reform and its impact on county economic development following the methods [23,24]:
In Equations (4)–(6), Grain is the total grain output, Value is the gross output value of farming, forestry, animal husbandry and fishery, and Income is the per capita income of farmers. Group indicates grouping dummy variables, the treated group is 1 and the control group is 0. Policy indicates dummy variables of time, with 2015 as the policy node, 1 represents the period 2015–2020 and 0 represents the period 2012–2015. Control refers to a series of control variables mentioned above. Controlling for variables that vary over time and individuals was completed by adding time-fixed effects and county-level individual fixed effects. is the county-level individual fixed effect, is the time-fixed effect, is the stochastic disturbances. The coefficient β1 measures the impact of the deepening of rural operation system reform on the level of rural economic development. β1 > 0 indicates that the rural operation system reform has a positive impact on the rural economic development of county , β1 < 0 indicates a negative impact and β1 = 0 means no significant impact.
4. Results and Discussions of Empirical Analysis
4.1. Descriptive Statistics
Table 2 reports the descriptive statistical characteristics of the main variables of 153 sample counties selected in this paper. It can be seen that the three dependent variables and the nine control variables showed different degrees of leptokurtic and positive skew in distribution patterns, indicating that the gap between the maximum and minimum values of the sample was large, the proportion of samples with smaller values was relatively large and the sample means were more affected by the maximum value. The three independent variables showed platykurtic and negative skew, and more dummy variables were assigned to 1. Among the dependent variables, the sample mean of total grain output (grain) is 210.2 thousand tons, and the sample standard deviation is 17.76. The sample mean of the gross output value of farming, forestry, animal husbandry and fishery (value) is CNY 25.1 billion, and the sample standard deviation is 18.39. The sample mean of per capita income of farmers (income) is CNY 1.28 thousand, and the sample standard deviation is 0.47. Weak leptokurtic and positive skew in distribution indicate that, although there are some differences in the development level of agriculture, rural area and farmers among counties, most of them are relatively close. Among the control variables, the sample distribution of arable land circulation area (circulation), number of new type agricultural operation entities (entity), number of agro-related service enterprises (enterprise), the total power of agricultural machinery (power) and consumption of chemical fertilisers (fertiliser) are similar to the dependent variables. The sample standard deviation is less than the sample mean, and the skewness and kurtosis of the sample distribution are relatively close. It shows some differences between the progress of rural operation system reform and agricultural factor input, but most are relatively close. In contrast, the distribution of collective construction land area listed for trading (trade), the number of collective economic organisations (organization), the value of collective economic organisations’ assets (asset) and grain sown area (sown) are different. The sample standard deviation of these four control variables is greater than their sample mean, showing a significantly leptokurtic and positive skew.
4.2. PSM Matching Results
This paper uses propensity score matching (PSM) to construct an artificial control group by matching each treated unit with a non-treated unit. The control variables are stepwise regressed using a Logit model through the mean value of incremental change in the effectiveness of rural operation system reform (YT) to select the control variables that significantly affect the dependent variables (YT) and obtain the propensity scores. According to the selected variables, we carry out one-to-one matching between the samples of the treated group before the rural operation reform and the control group and test whether there is a significant deviation between the treated and control groups. If the absolute value of the deviation is less than 10%, it indicates the deviation after matching is slight, the matching effect is good and the control variables are valid. If the absolute value of the deviation is greater than 10%, it indicates that the deviation after matching is significant, the matching effect is not ideal and the selected control variables are ineffective. Based on the analysis of the test results of the PSM method in Table 3, there are significant differences in the propensity scores of the matching results of the control variables of the treated and control groups. After matching, the absolute values of the average deviations of the five variables, namely collective construction land area listed for trading (trade), the value of collective economic organisations’ assets (value), number of new type agricultural operation entities (entity), the total power of agricultural machinery (power) and consumption of chemical fertilisers (fertiliser), are greater than 10%, which does not meet the matching rules of the PSM method and should be removed from the variables. After matching, the absolute values of the average deviations of the four variables of arable land circulation area (circulation), number of collective economic organisations (organization), number of agro-related service enterprises (enterprise) and grain sown area (grain) are all less than 10%. The t statistics show no significant differences, indicating that these four variables are evenly distributed in the treated and control groups, meeting the homogeneity test requirements in statistical significance. The PSM-DID model’s control constraints are more effective and statistically significant for describing and analysing reform matters.
4.3. DID Test Results
Double difference tests are carried out on the matched circulation area (circulation), number of collective economic organisations (organization), number of agro-related service enterprises (enterprise) and grain sown area (grain) with the dependent variables and DID variables. DID benchmark regression analysis is used to judge the effectiveness of the policies of rural operation system reform and their impact on the county’s economic development. In Table 4, columns (1) and (2) represent the results with total grain output (grain) as the dependent variable, and columns (3) and (4) represent the results with the gross output value of farming, forestry, animal husbandry and fishery (value) as the dependent variable and columns (5) and (6) represent the results with the per capita income of farmers (income) as the dependent variable. According to the research design of this paper, the counties that carried out the confirmation, registration and certification of farmland contractual management rights are the treated group, and 2015 is the policy impact year for the in-depth promotion of rural operation system reform. As seen from Table 4, the rural operation system reform has increased the total grain output (grain) at the significance level of 1%, with an average yield increase effect of 15.1039. According to Table 2, the sample mean of the total grain output (grain) is 210.20, so the rural operation system reform has improved the sample mean by 7.19% (15.1039/210.20).
Similarly, the reform has increased the gross output value of farming, forestry, animal husbandry and fishery (value) at the significance level of 1%, with an average yield increase effect of 0.1447, increasing the sample mean by 5.77%, and has increased the per capita income of farmers (income) at the significance level of 1%, with an average yield increase effect of 2.7886, improving the sample mean by 21.75%. The results of the above regression analysis show that hypotheses 1, 2 and 3 are true. At the same significance level, the deepening of the rural operation system reform has the most significant impact on the per capita income of farmers (income).
The results obtained reflect that those agricultural reforms contribute positively to the development of farm productivity and help in the revitalisation of Chinese rural areas. Thus, as reforms are put in place, they curb many issues bombarding the growth of the agricultural sector, hence improving its development. The study agrees with Cheng et al. [25], who showed that implementing land system reforms could stimulate farmers’ enthusiasm, initiative, and creativity due to a reduction in land conflicts, leading to promotion of intensive agricultural activity participation and agricultural production increment. Theoretically, the results also affirm the Marxist political economy theory [14], which specifies that establishing reforms in agricultural production can eliminate the shackles that restrict productivity development.
From the perspective of the effect of control variables, total grain output (grain) is most significantly affected by grain sown area (sown), and the average treatment effect was 0.4880 at the 1% significance level. At the significance level of 5%, grain is affected by organization and enterprise. The impact of organization is positive, and the impact of enterprise is negative. The significance level affected by arable land circulation area (circulation) is 10%, and the average treatment effect is 0.5386. At the significance level of 1%, the gross output value of farming, forestry, animal husbandry and fishery (value) is affected by all four matched control variables. The most significant impact is enterprise, with an average treatment effect of 0.0048, followed by sown, organization and the negative impact of circulation. Per capita income of farmers (income) is affected by enterprise and organization at the significance level of 1%, and the average treatment effect of enterprise is the largest. Income is negatively affected by circulation at a 5% significance level and not significantly affected by sown. As seen from the above analysis results, the control variables (number of collective economic organisations and number of agro-related service enterprises) that are closely related to the innovation of agricultural organisations play a greater role in promoting agricultural production and farmers’ income than the control variable (arable land circulation area), relating to farmland reform. This phenomenon is consistent with the changing trend in the dependent variables in Figure 1.
4.4. PSM-DID Regression Results
In order to verify the effectiveness of the PSM method on the propensity score of control variables in the treated group and reduce the impact of double error bias on the implementation of rural operation system reform policies, this paper uses the PSM-DID model proposed by (Heckman et al., 1997) to compare the effectiveness of the reform policies in the treated group and the control group. From the test results in Table 5, the treated group that carried out rural operation system reform has brought a significant policy effect on the total grain output, the gross output value of farming, forestry, animal husbandry and fishery and per capita income of farmers at the significance level of 1%. The increase in the sample average is 6.34%, 5.15% and 14.69%, respectively, of which the policy effect on the per capita income of farmers is the strongest. The results are consistent with the results in Table 4, which indicates that the PSM method is effective, and the impact of control variables on the reform results is consistent at an acceptable significance level, meeting the expected setting effects of hypotheses 1, 2 and 3.
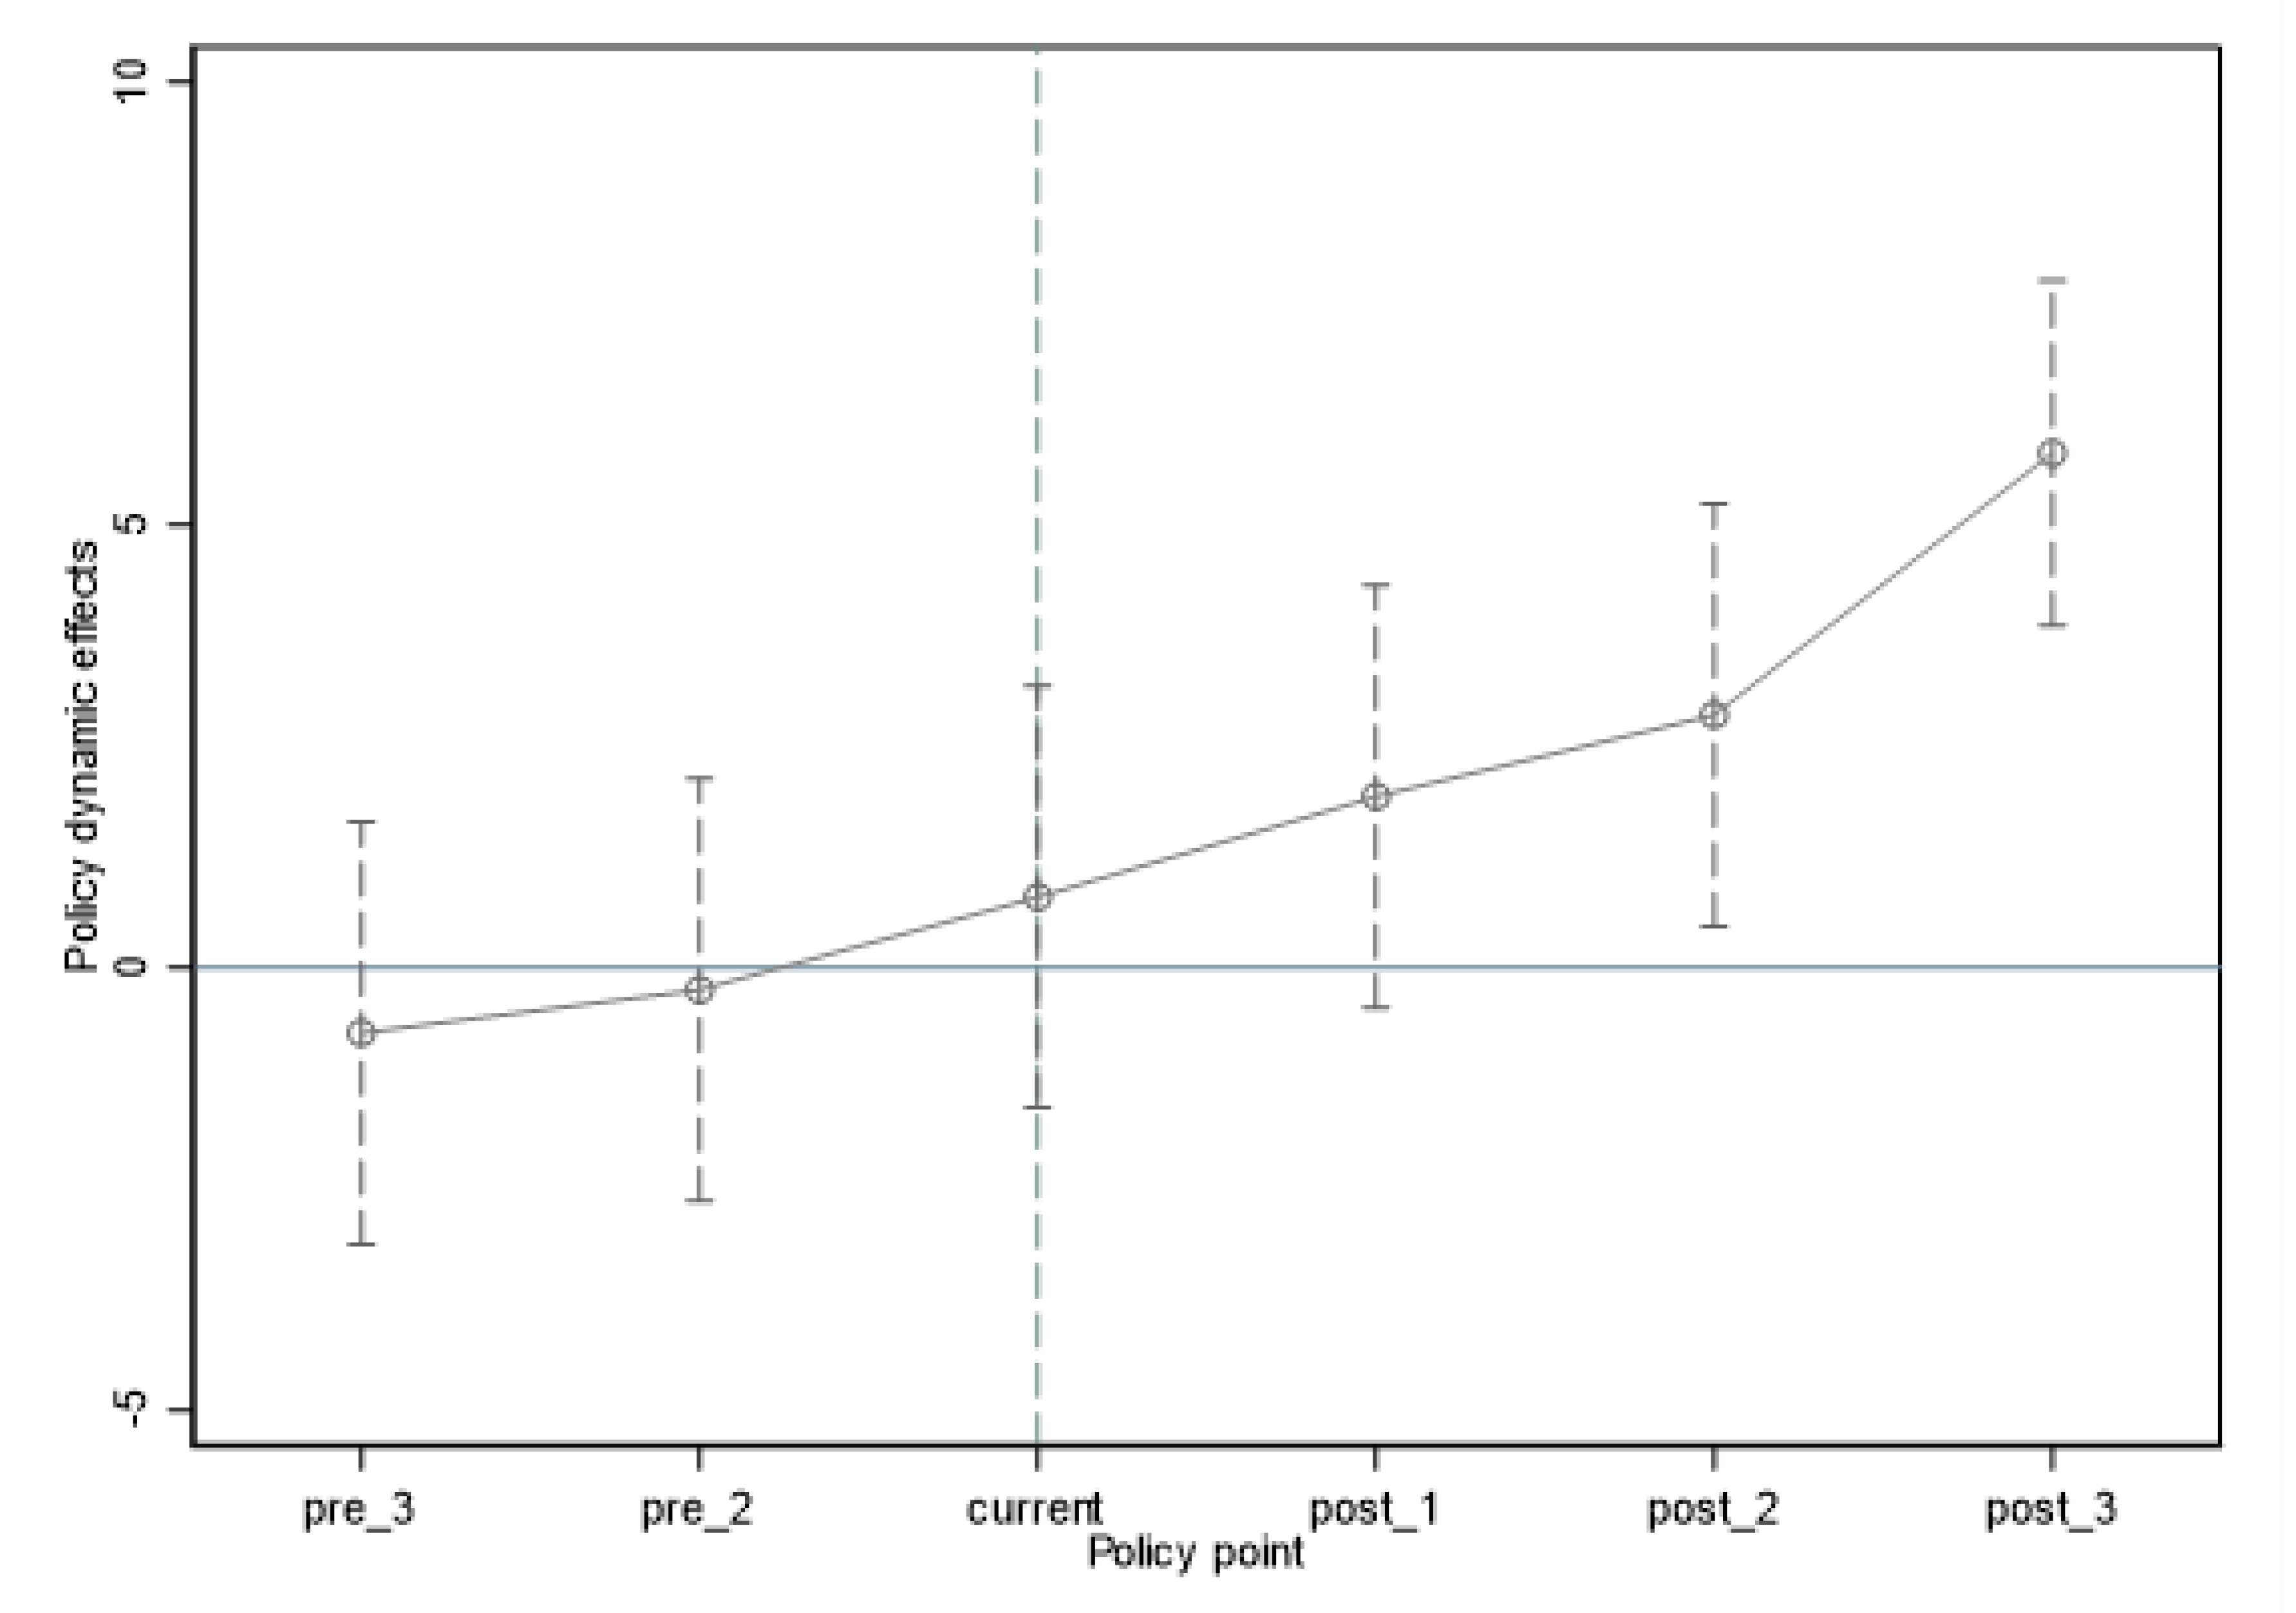
4.5. Parallel Trend Test of PSM-DID Model
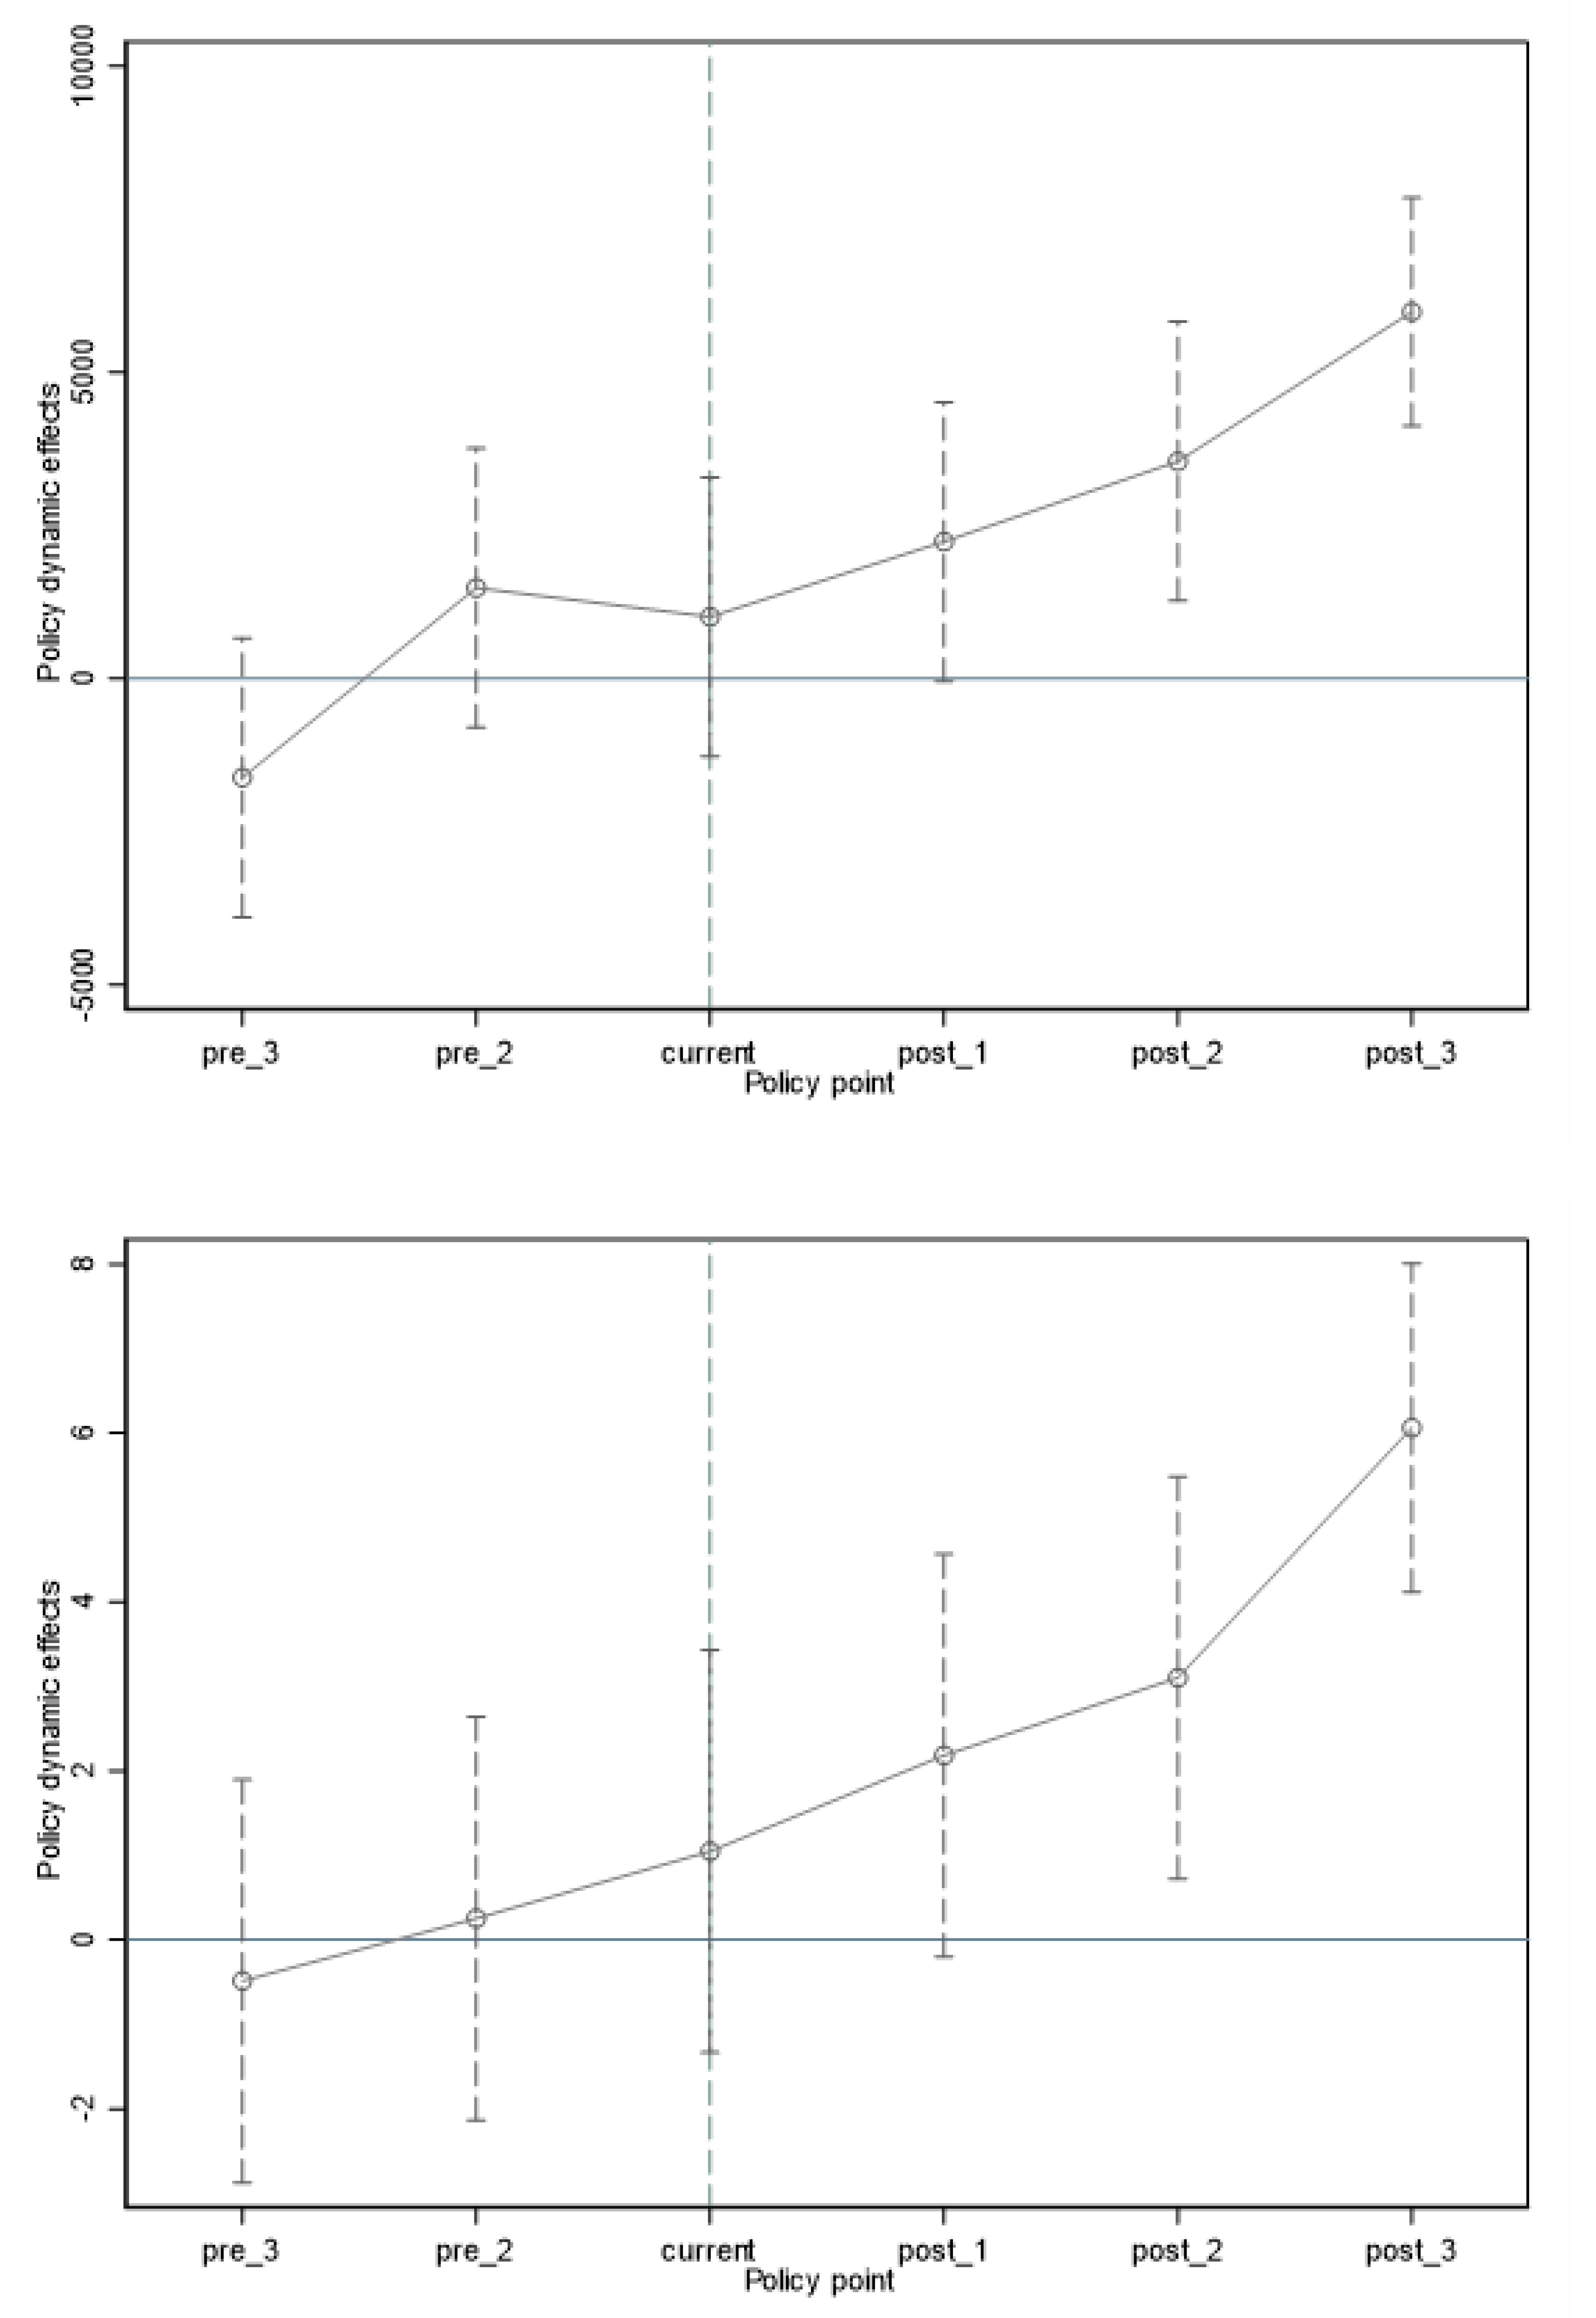
The parallel trend assumption is critical to ensure the internal validity of DID models. This paper refers to the parallel trend assumption requirements by literature [26,27]. That is, without the influence of external factors, the dependent variables of the treated group and the control group should follow the same trend. In this paper, the observation coefficient is set by the same trend, and test the interaction coefficient to judge whether the two groups of samples have the comparability of policy effects. Taking 2012 as the base year and 2015 as the year of reform policy impact, we draw the parallel trend distribution plot of the interaction coefficient under a 95% confidence interval (Figure 4). Through parallel trend test, it is found that the reform of the rural operation system has an impact effect on total grain output (grain), the gross output value of farming, forestry, animal husbandry and fishery (value) and per capita income of farmers (income). Among them, the policy impact on total grain output (grain) was relatively gentle in the early stage after the reform and increased significantly two years later. The policy impact effect on the gross output value of farming, forestry, animal husbandry and fishery (value) is the same as total grain output (grain), and the marginal effect is more obvious later. The policy impact on the per capita income of farmers (income) fluctuates, and the policy effect has an inflexion point in the comparison between the treated group and the control group, indicating that the change in per capita income of farmers (income) is more sensitive to the impact of external policies.
4.6. Discussion
The implementation or amendment of reforms to impact agricultural food production in order to curtail food insecurity is a good sign of economic growth. As China is seeking avenues to innovate and structuralise its economic growth pathways through proper farming techniques, it is necessary to scientifically evaluate the link between the reform of the rural operation system on agricultural growth (e.g., food production) and finding room to improve the institutional environment governing land, labour, and capital. Using county-level statistical data of Sichuan Province from 2012 to 2020, the aim was to test the effectiveness of rural operation system reform on rural economic development through agricultural output enhancement.
The results obtained reflect those agricultural reforms contribute positively to the development of farm productivity and help in the revitalisation of Chinese rural areas. Thus, as reforms are put in place, it curbs many issues bombarding the growth of the agricultural sector, hence improving its development. The study’s results have revealed that rural operation system reform is of great significance to adjustment and optimisation of rural production relations and development of agricultural productivity. The study agrees with Cheng et al. [27], who showed that implementing land system reforms could stimulate farmers’ enthusiasm, initiative and creativity due to the reduction in land conflicts, leading to promotion of intensive agricultural activity participation and agricultural production increment. Theoretically, the results also affirm the Marxist political economy theory [14], which specifies that establishing reforms in agricultural production can eliminate the shackles that restrict productivity development.
The study has some limitations as well. First, we only focused on one of China’s reforms, i.e., rural operation system reforms, and how they impact China’s agricultural output. However, other reforms to boost China’s agricultural output exist. Future studies can consider the effect of other reforms, such as rural fiscal and financial reform on China’s agricultural output. Second, the study is narrowed or focused on a province (Sichuan) in China; however, we believe that the discussed topic could be examined on the example of several provinces. Therefore, we encourage forthcoming studies to include many provinces to see if the conclusions may be different or similar to our current study.
5. Conclusions and Policy Implications
This paper conducts an empirical study on the impact of a reform of the rural operation system on rural economic development in 153 counties in Sichuan Province based on the PSM-DID model. The following conclusions can be drawn: first, the rural operation system reform has significantly boosted the economic development of the pilot counties. The counties carrying out the pilot projects will be able to obtain a high policy transmission effect. Second, the rural operating system reform mainly has two components: rural land system reform and agriculture organisation innovation. Both impact the economic development of county territory, but the degree of impact is different. Third, the rural operation system reform has a relatively noticeable impact on the increase in the total grain output, the increase in the total value of agriculture, forestry, animal husbandry and fishery and the increase in per capita income of rural residents. However, the effect of the reform has a specific time lag.
Given the above conclusions, the policy implications can be identified as follows: first, the positive impact of rural operation system reform on agricultural output growth indicates that the implementation of the rural operation system reform needs to be accelerated. Particularly, to release and improve rural productivity and agricultural output capacity further, rural land system reform and rural collective property rights system reform acceleration should be a priority. Second, the coordination of the reform policy of the rural operation system still needs to be strengthened. It is necessary to fully implement the rural revitalisation strategy, coordinate promotion of agricultural and rural reforms, fully release the reform dividend, and promote joint development of all counties in the province. This means training programs to equip the coordinating team to ensure proper managerial skills are needed. Third, support for the rural operation system reform should be strengthened to provide a more solid guarantee for rural economic development regarding land, talent, capital, and technology.
Author Contributions
Conceptualisation, A.R. and M.A.T.; methodology, A.R.; software, A.R.; validation, A.R.; formal analysis, A.R.; writing—original draft preparation, A.R. and X.S.; writing—review and editing, X.S. and M.A.T.; visualisation, A.R.; supervision, X.S. and M.A.T.; project administration, X.S.; funding acquisition, X.S. All authors have read and agreed to the published version of the manuscript.
Funding
This research was funded by the Provincial Social Science Fund of Sichuan, grant number: SC21JJ005. Martinson Ankrah Twumasi also wants to appreciate the fund received by the National Social Science of China, grant number: 20AJY011.
Institutional Review Board Statement
Not applicable.
Informed Consent Statement
Not applicable.
Data Availability Statement
The author may provide raw data if necessary.
Acknowledgments
We thank Jiang Yuansheng of Sichuan Agricultural University, College of Economics and Duan Sheng for their suggestions in Chinese writing. We would also like to thank the anonymous referees for their incisive comments.
Conflicts of Interest
The authors declare no conflict of interest.
References
- Huang, J.; Yang, G. Understanding recent challenges and new food policy in China. Glob. Food Secur. 2017, 12, 119–126. [Google Scholar] [CrossRef]
- Lohmar, B.; Gale, H.F., Jr.; Tuan, F.C.; Hansen, J.M. China’s ongoing agricultural modernization. US Department of Agriculture, Economic Research Service, Economic Information Bulletin, 2009. 51. Available online: https://www.ers.usda.gov/webdocs/publications/44377/eib-51.pdf?v=0 (accessed on 16 November 2022).
- Fan, S. Production and productivity growth in Chinese agriculture: New measurement and evidence. Food Policy 1997, 22, 213–228. [Google Scholar] [CrossRef]
- Fusuo, Z.; Xinping, C.; Peter, V. Chinese agriculture: An experiment for the world. Nature 2013, 497, 33–35. [Google Scholar]
- Huang, J.; Rozelle, S. China’s 40 Years of Agricultural Development and Reform; Garnaut, R., Song, L., Fang, C., Garnaut, R., Song, L., Fang, C., Eds.; ANU Press: Canberra, Australia, 2018; pp. 487–506. [Google Scholar]
- Zhou, Y.; Li, X.; Liu, Y. Rural land system reforms in China: History, issues, measures, and prospects. Land Use Policy 2020, 91, 104330. [Google Scholar] [CrossRef]
- Fei, R.; Lin, Z.; Chunga, J. How land transfer affects agricultural land use efficiency: Evidence from China’s agricultural sector. Land Use Policy 2021, 103, 105300. [Google Scholar] [CrossRef]
- Yi, Q.; Chen, M.; Sheng, Y.; Huang, J. Mechanization services, farm productivity and institutional innovation in China. China Agric. Econ. Rev. 2019, 11, 536–554. [Google Scholar]
- Peng, K.; Yang, C.; Chen, Y. Land transfer in rural China: Incentives, influencing factors and income effects. Appl. Econ. 2020, 52, 5477–5490. [Google Scholar] [CrossRef]
- Cheng, S.; Zheng, Z.; Henneberry, S. Farm size and use of inputs: Explanations for the inverse productivity relationship. China Agric. Econ. Rev. 2019, 11, 336–354. [Google Scholar] [CrossRef]
- Huang, Z.; Liang, Q. Agricultural organizations and the role of farmer cooperatives in China since 1978: Past and future. China Agric. Econ. Rev. 2018, 10, 48–64. [Google Scholar] [CrossRef]
- Spielman, D.J.; von Grebmer, K. Public-private partnerships in international agricultural research: An analysis of constraints. J. Technol. Transf. 2006, 31, 291–300. [Google Scholar] [CrossRef]
- Wang, Z.; Wang, J.; Zhang, G.; Wang, Z. Evaluation of agricultural extension service for sustainable agricultural development using a hybrid entropy and TOPSIS method. Sustainability 2021, 13, 347. [Google Scholar] [CrossRef]
- Marx, K. Theories of Surplus Value Part I; Aakar Books Aakar: Delhi, India, 2020. [Google Scholar]
- Lin, J.Y. Rural Reforms and Agricultural Growth in China. Am. Econ. Rev. 1992, 82, 34–51. [Google Scholar]
- Kan, K. Creating land markets for rural revitalization: Land transfer, property rights and gentrification in China. J. Rural. Stud. 2021, 81, 68–77. [Google Scholar] [CrossRef]
- Zhao, X. Land and labor allocation under communal tenure: Theory and evidence from China. J. Dev. Econ. 2020, 147, 102526. [Google Scholar] [CrossRef]
- Wang, S.; Tan, S.; Yang, S.; Lin, Q.; Zhang, L. Urban-biased land development policy and the urban-rural income gap: Evidence from Hubei Province, China. Land Use Policy 2019, 87, 104066. [Google Scholar] [CrossRef]
- Heckman, J.J.; Ichimura, H.; Todd, P.E. Matching as an econometric evaluation estimator: Evidence from evaluating a job training programme. Rev. Econ. Stud. 1997, 64, 605–654. [Google Scholar] [CrossRef]
- Thompson, P.; Cowton, C.J. Bringing the environment into bank lending: Implications for environmental reporting. Br. Account. Rev. 2004, 36, 197–218. [Google Scholar] [CrossRef]
- Rosenbaum, P.R.; Rubin, D.B. The central role of the propensity score in observational studies for causal effects. Biometrika 1983, 70, 41–55. [Google Scholar] [CrossRef]
- Green, M.C.; Leberg, P.L. Sociality among foraging Ardeidae: Does plumage coloration influence nearest-neighbor spacing? Am. Midl. Nat. 2006, 156, 344–352. [Google Scholar] [CrossRef]
- Ward, D.; Zurbruegg, R. Law, politics and life insurance consumption in Asia. Geneva Pap. Risk Insur. Issues Pract. 2002, 27, 395–412. [Google Scholar] [CrossRef]
- Whitby, K.J.; Bledsoe, T. The impact of policy voting on the electoral fortunes of Senate incumbents. West. Political Q. 1986, 39, 690–700. [Google Scholar] [CrossRef]
- Cheng, W.; Xu, Y.; Zhou, N.; He, Z.; Zhang, L. How did land titling affect China’s rural land rental market? Size, composition and efficiency. Land Use Policy 2019, 82, 609–619. [Google Scholar] [CrossRef]
- Yue, L. BRI’s Effects on Foreign Investments: DID Test Based on China’s Greenfield Investments in 2005–2016. China Econ. 2022, 17, 12–23. [Google Scholar]
- Liu, Q.; Qiu, L.D. Intermediate input imports and innovations: Evidence from Chinese firms’ patent filings. J. Int. Econ. 2016, 103, 166–183. [Google Scholar] [CrossRef]
Figure 1.
Rural reform and the trend of agricultural growth in Sichuan since 2012. Note: 1. The number of counties initiating the rural land system reform, the number of counties initiating the collective economic organisation reform and the gross output value of farming, forestry, animal husbandry and fishery on the left axis. 2. Total grain output and per capita income of farmers on the right axis.

Figure 2.
Trends of indicators in promoting rural land system reform in 4 categories of counties. Note: 1. The number of counties initiating confirmation of the land contract management right, the number of counties initiating rural collective construction land trading, arable land circulation area, collective construction land area listed for trading and chemical fertiliser consumption are on the left axis. 2. Grain sown area and total power of agricultural machinery are on the right axis.

Figure 3.
Trends of indicators before and after the reform of rural collective economic organizations in 4 categories of counties. Note: 1. Number of collective economic organisations, the value of collective economic organisations’ assets and the number of new types of agricultural operation entities are on the left axis. 2. Number of agro-related service enterprises, grain sown area, the total power of agricultural machinery and consumption of chemical fertilisers are on the right axis.

Figure 4.
Dynamic effect diagram of parallel trend of PSM-DID model.


Table 1.
Variable names and definitions.
| Type | Name | Symbol | Description | Unit |
|---|---|---|---|---|
| Dependent variables | Total grain output | Grain | Total production of cereals, beans and tuber crops | thousand tons |
| The gross output value of agriculture | Value | The gross output value of farming, forestry, animal husbandry, fisheries | CNY billion | |
| Per capita income of farmers | Income | Average total annual income per farmer | CNY thousand | |
| Independent variables | Grouping dummy variables | Group | 1 represents a county that had started the program in the treated group’s confirmation, registration and certification of the land contractual management right. 0 represents a county that had not started the program, the control group | |
| Time dummy variables | Policy | In 2015, the reform of the rural operation system was significantly strengthened. 1 represents the period 2015–2020, 0 represents the period 2012–2015 | ||
| The difference in difference (DID) variables | Group × Policy | If Group = 1 and Policy = 1, then Group × Policy = 1; otherwise, Group × Policy = 0 | ||
| Control variables | Arable land in circulation | Circulation | The area of arable land where the use rights are transferred to other farmers or economic organisations | thousand areas |
| Collective construction land listed for trading | Trade | The area of rural collective construction land that completed the transaction | thousand areas | |
| Number of collective economic organisations | Organisation | The number of economic organisations that collectively owned land and implemented a two-tier management system based on family contract management and a combination of unification and division | unit | |
| Value of collective economic organisations’ assets | Asset | The value of the rural collective economic organisation after the evaluation and confirmation by the rural collective” three capita” supervision office | CNY billion | |
| Number of new type agricultural operation entities | Entity | Total number of leading specialised households, family farms, farmers’ cooperatives and leading agricultural enterprises | unit | |
| Number of agro-related service enterprises | Enterprise | Number of agro-related service enterprises with an annual output value of over CNY 100,000 or per capita income of over CNY 50,000 | unit | |
| Grain sown area | Sown | Actual area sown or transplanted with grain crops | million areas | |
| Total power of agricultural machinery | Power | The total power of various power machines mainly used in agriculture, forestry, animal husbandry and fishery production | thousand kw | |
| Consumption of chemical fertilisers | Fertiliser | Quantity of chemical fertiliser used for agricultural production, including nitrogen fertiliser, phosphorus fertiliser, potassium fertiliser and compound fertiliser | million tons |
Note: among the grouping dummy variables, the counties that started the reform program in the year’s second half were not in the treated group.
Table 2.
Descriptive statistics.
| Type | Variable | Obs | Mean | Std. Dev. | Min | Median | Max | Skewness | Kurtosis |
|---|---|---|---|---|---|---|---|---|---|
| Dependent variables | Grain | 1377 | 210.20 | 177.62 | 0.00 | 175.32 | 834.14 | 0.99 | 0.55 |
| Value | 1377 | 2.51 | 1.84 | 0.14 | 2.15 | 9.91 | 1.05 | 1.07 | |
| Income | 1377 | 12.82 | 4.72 | 3.20 | 12.29 | 39.65 | 0.93 | 2.15 | |
| Independent variables | Group | 1377 | 0.68 | 0.47 | 0 | 1 | 1 | −0.75 | −1.44 |
| Policy | 1377 | 0.56 | 0.50 | 0 | 1 | 1 | −0.22 | −1.95 | |
| Group ×Policy | 1377 | 0.53 | 0.50 | 0 | 1 | 1 | −0.12 | −1.99 | |
| Control variables | Circulation | 1377 | 19.15 | 17.91 | 0.02 | 15.05 | 112.38 | 1.46 | 2.27 |
| Trade | 1377 | 1.01 | 3.62 | 0.00 | 0.00 | 75.96 | 9.08 | 145.41 | |
| Organisation | 1377 | 0.14 | 0.22 | 0.00 | 0.00 | 1.20 | 1.83 | 3.11 | |
| Asset | 1377 | 0.53 | 0.86 | 0.00 | 0.00 | 6.23 | 2.16 | 6.14 | |
| Entity | 1377 | 2.85 | 1.92 | 0.18 | 2.61 | 10.38 | 0.87 | 0.61 | |
| Enterprise | 1377 | 0.07 | 0.07 | 0.00 | 0.05 | 0.43 | 1.86 | 4.64 | |
| Sown | 1377 | 0.96 | 0.97 | 0.00 | 0.76 | 20.84 | 7.01 | 130.36 | |
| Power | 1377 | 2.71 | 1.76 | 0.10 | 2.40 | 9.90 | 1.05 | 1.20 | |
| Fertiliser | 1377 | 15.13 | 13.50 | 0.03 | 11.69 | 85.40 | 1.48 | 2.95 |
Table 3.
Comparison of sample characteristics of PSM matching effects for treated and control groups.
Table 3.
Comparison of sample characteristics of PSM matching effects for treated and control groups.
| Variables | Matching Status | Treated | Untreated | Deviation (%) | Reduction in Deviation (%) | t Value | p Value |
|---|---|---|---|---|---|---|---|
| Circulation | Before | 22.243 | 0.728 | 148.40% | 95.41% | 13.479 | 0 |
| After | 0.850 | 0.903 | −6.81% | −0.193 | 0.849 | ||
| Trade | Before | 4.995 | 0.520 | 71.85% | 45.63% | 6.033 | 0 |
| After | 0.282 | 0.685 | −39.06% | −1.034 | 0.316 | ||
| Organisation | Before | 0.317 | 0.043 | 180.59% | 73.90% | 16.051 | 0 |
| After | 0.043 | 0.050 | −7.13% | −1.247 | 0.225 | ||
| Asset | Before | 1.509 | 0.159 | 195.76% | 86.90% | 14.437 | 0 |
| After | 0.322 | 0.216 | 25.65% | 0.679 | 0.505 | ||
| Entity | Before | 3.442 | 0.473 | 179.74% | 73.78% | 15.977 | 0 |
| After | 0.466 | 0.540 | −47.13% | −1.247 | 0.225 | ||
| Enterprise | Before | 0.091 | 0.006 | 150.18% | 97.94% | 13.303 | 0 |
| After | 0.009 | 0.010 | −3.10% | −0.082 | 0.936 | ||
| Sown | Before | 1.156 | 0.846 | 30.10% | 68.00% | 4.01 | 0 |
| After | 1.186 | 1.287 | −9.60% | −1.18 | 0.24 | ||
| Power | Before | 3.016 | 2.204 | 51.30% | 51.80% | 7 | 0 |
| After | 2.996 | 3.388 | −24.80% | −2.71 | 0.007 | ||
| Fertiliser | Before | 19.083 | 13.487 | 39.90% | 16.80% | 5.49 | 0 |
| After | 18.875 | 25.413 | −46.60% | −4.88 | 0 |
Table 4.
Results of the DID benchmark regression analysis of rural reform.
| (1) | (2) | (3) | (4) | (5) | (6) | |
|---|---|---|---|---|---|---|
| Grain | Grain | Value | Value | Income | Income | |
| Group × Policy | 16.2393 *** | 15.1039 *** | 0.4767 *** | 0.1447 *** | 5.7946 *** | 2.7886 *** |
| (4.39) | (4.31) | (18.94) | (6.01) | (31.92) | (20.76) | |
| Circulation | 0.5386 * | −0.0166 *** | −0.0331 ** | |||
| (1.71) | (−5.50) | (−1.97) | ||||
| Organisation | 0.0263 ** | 0.0009 *** | 0.0046 *** | |||
| (2.47) | (11.90) | (11.36) | ||||
| Enterprises | −0.1474 ** | 0.0048 *** | 0.0735 *** | |||
| (−2.56) | (9.99) | (27.24) | ||||
| Sown | 0.4880 *** | 0.0009 *** | −0.0005 | |||
| (16.89) | (2.98) | (−0.30) | ||||
| constant | 199.2341 *** | 135.1046 *** | 2.0538 *** | 1.1789 *** | 8.9099 *** | 5.4914 *** |
| (74.46) | (11.97) | (101.63) | (11.40) | (61.12) | (9.52) | |
| N | 1377 | 1377 | 1377 | 1377 | 1377 | 1377 |
| Adj. R2 | 0.9600 | 0.9691 | 0.9264 | 0.9547 | 0.6153 | 0.8584 |
Note: the values in brackets are t values, and *, ** and *** represent significance levels of 10%, 5% and 1%, respectively.
Table 5.
Results of the PSM-DID analysis of rural agricultural reform.
| (1) | (2) | (3) | (4) | (5) | (6) | |
|---|---|---|---|---|---|---|
| Grain | Grain | Value | Value | Income | Income | |
| Group × Policy | 16.6142 *** | 13.3233 *** | 0.9227 *** | 0.1292 *** | 5.2062 *** | 1.8842 *** |
| (4.41) | (3.61) | (3.51) | (4.60) | (24.54) | (13.67) | |
| Circulation | −0.0432 | −0.0167 *** | −0.0270 * | |||
| (−0.12) | (−5.08) | (−1.67) | ||||
| Organisation | 0.0441 *** | 0.0008 *** | 0.0047 *** | |||
| (3.29) | (10.00) | (11.54) | ||||
| Enterprises | −0.3012 *** | 0.0048 *** | 0.0754 *** | |||
| (−4.26) | (9.24) | (29.31) | ||||
| Sown | 0.4276 *** | 0.0008 *** | −0.0011 | |||
| (15.03) | (2.75) | (−0.73) | ||||
| constant | 207.6263 *** | 150.7591 *** | 1.7984 *** | 1.4898 *** | 9.5752 *** | 5.7415 *** |
| (69.86) | (10.25) | (9.21) | (10.80) | (53.23) | (8.47) | |
| N | 1198 | 1198 | 1198 | 1198 | 1198 | 1198 |
| Adj. R2 | 0.9621 | 0.9703 | 0.0824 | 0.9512 | 0.5373 | 0.8650 |
Note: the values in brackets are t values, and * and *** represent significance levels of 10% and 1%, respectively.
Publisher’s Note: MDPI stays neutral with regard to jurisdictional claims in published maps and institutional affiliations. |
© 2022 by the authors. Licensee MDPI, Basel, Switzerland. This article is an open access article distributed under the terms and conditions of the Creative Commons Attribution (CC BY) license (https://creativecommons.org/licenses/by/4.0/).
Share and Cite
MDPI and ACS Style
Rui, A.; Shishun, X.; Ankrah Twumasi, M. Does Rural Operation System Reform Enhance Agricultural Output? Evidence from Sichuan Province. Land 2022, 11, 2285. https://doi.org/10.3390/land11122285
AMA Style
Rui A, Shishun X, Ankrah Twumasi M. Does Rural Operation System Reform Enhance Agricultural Output? Evidence from Sichuan Province. Land. 2022; 11(12):2285. https://doi.org/10.3390/land11122285
Chicago/Turabian StyleRui, Ai, Xiao Shishun, and Martinson Ankrah Twumasi. 2022. "Does Rural Operation System Reform Enhance Agricultural Output? Evidence from Sichuan Province" Land 11, no. 12: 2285. https://doi.org/10.3390/land11122285
Note that from the first issue of 2016, this journal uses article numbers instead of page numbers. See further details here.