
Ecosystem Service Values as Related to Land Use and Land Cover Changes in Ethiopia: A Review
 ,
,
Abstract
:1. Introduction
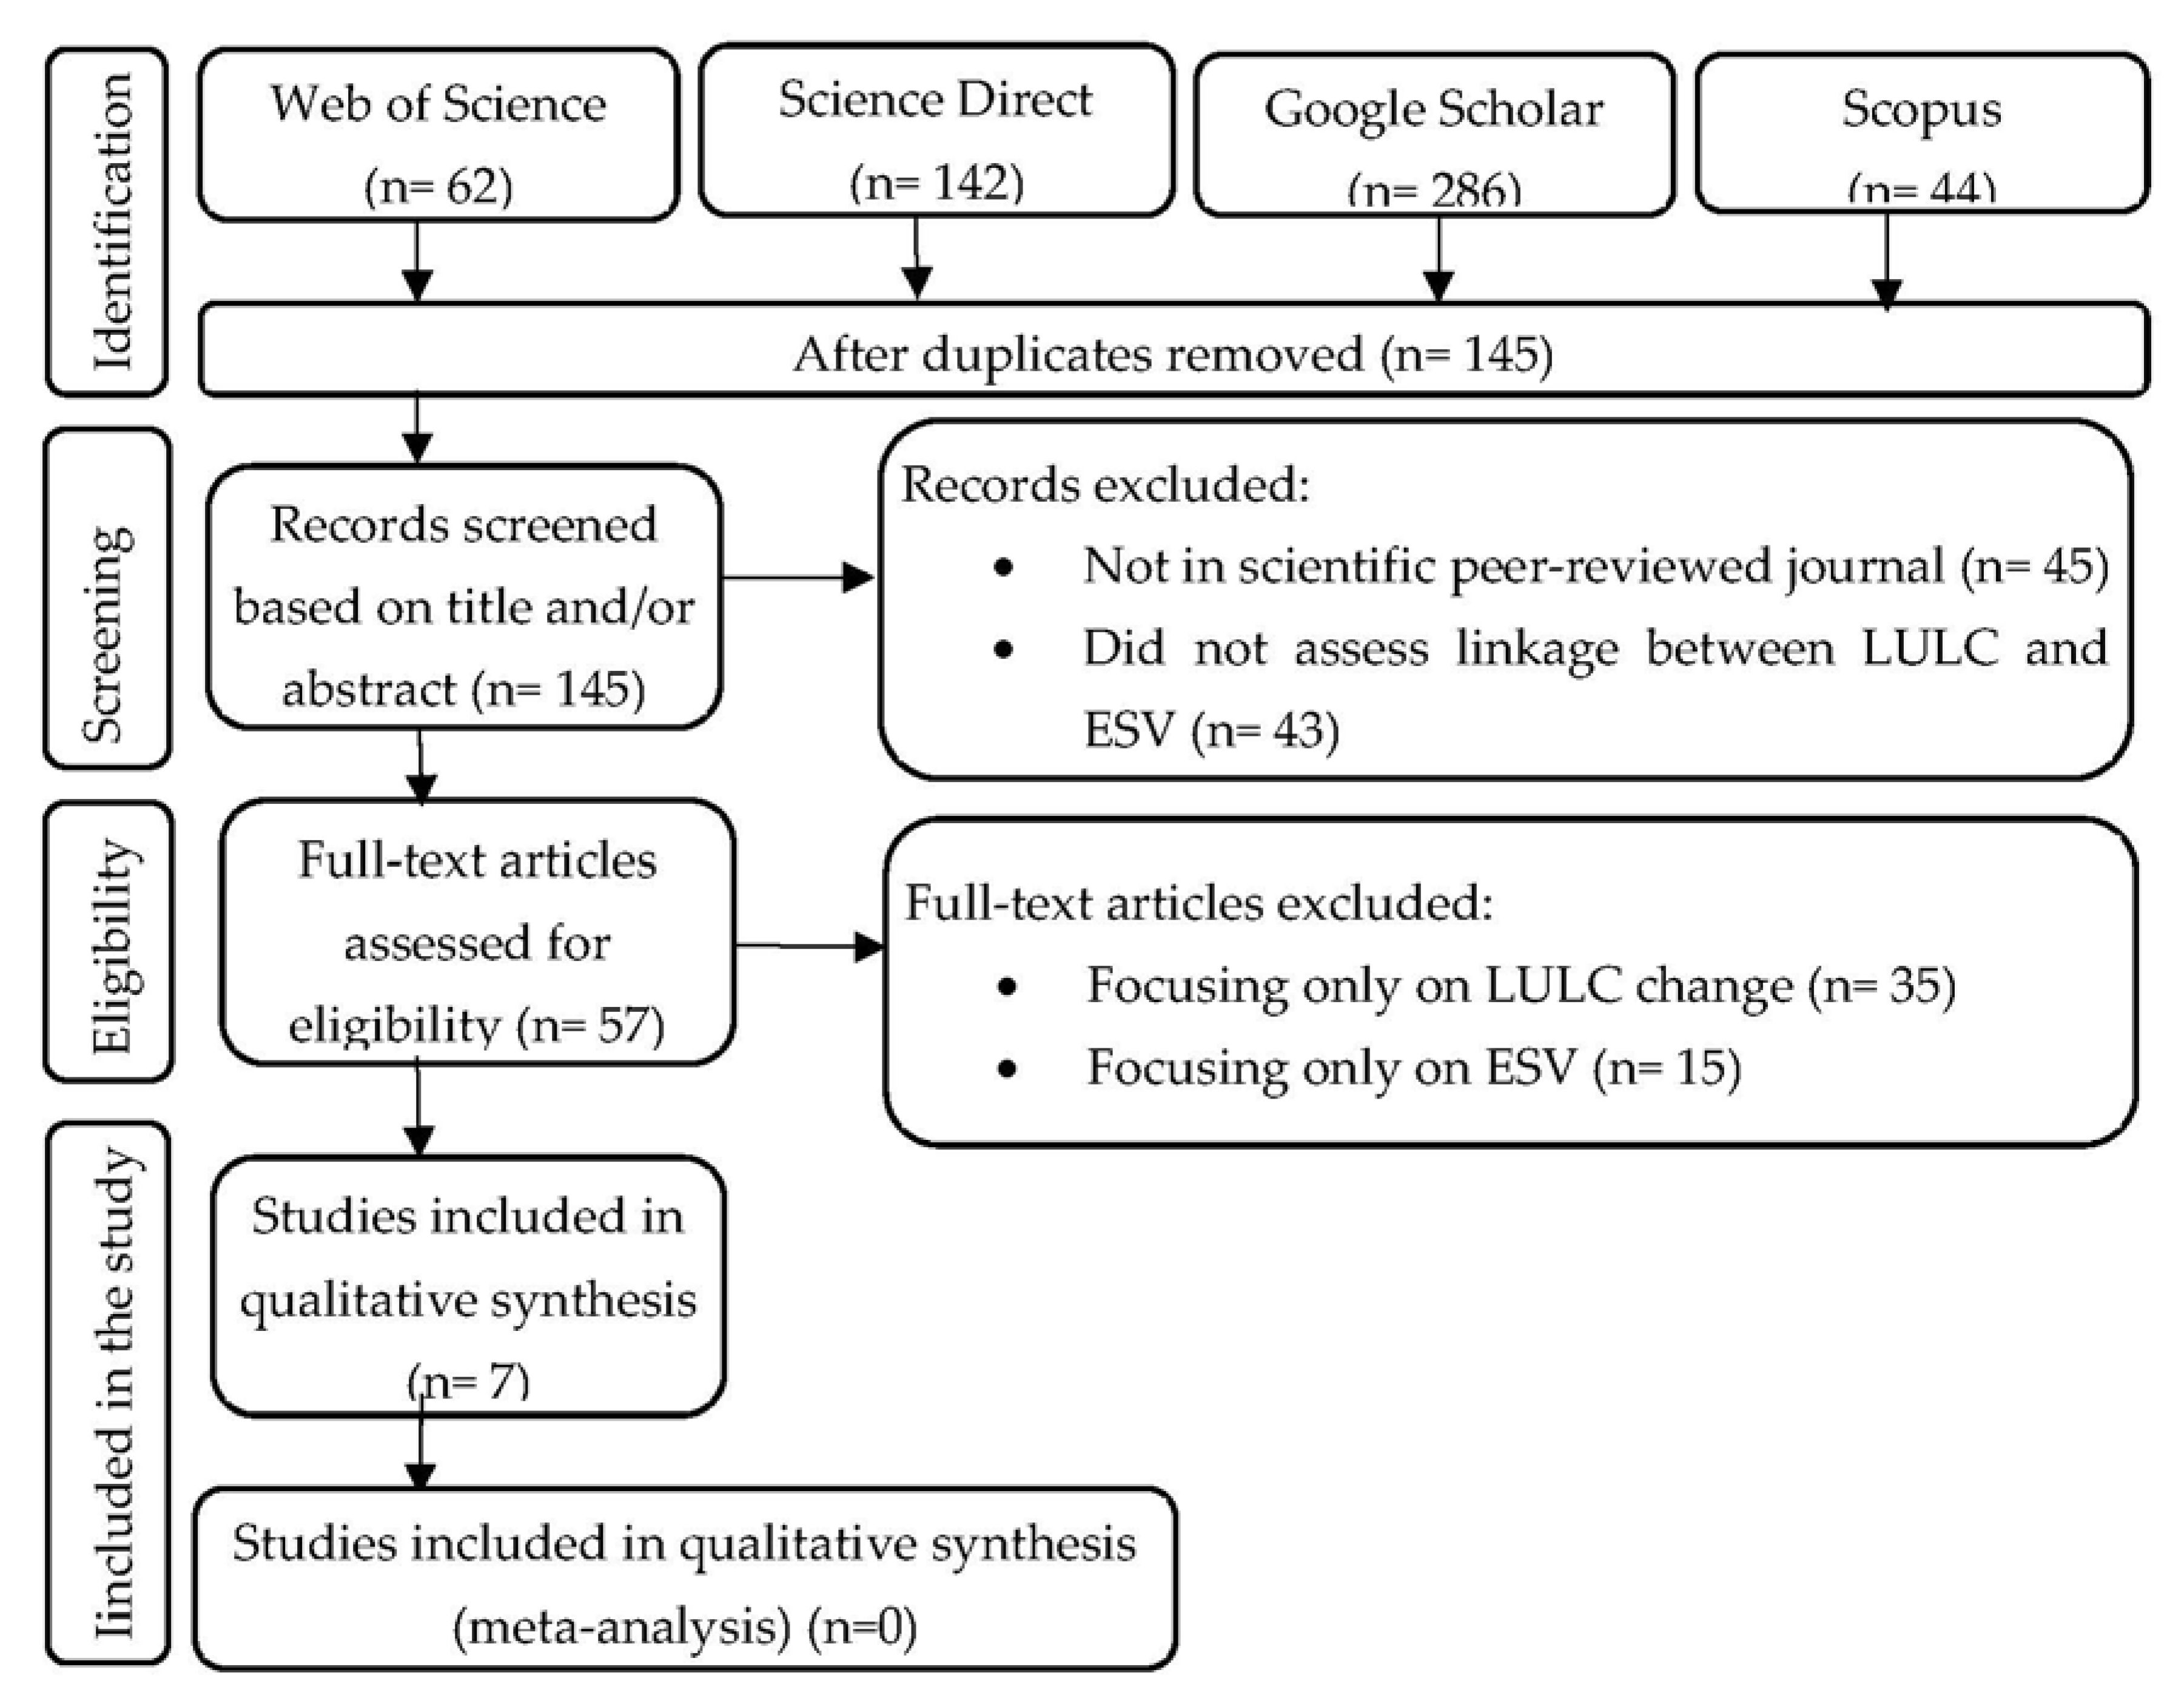
2. Method
3. Ecosystem Service Value and Land Use/Land Cover
3.1. Land Use/Land Cover
3.2. Ecosystem Service Value
4. Quantification Approaches of ESV and LULC Change
4.1. Evaluation of LULC Changes
4.2. Ecosystem Service Valuation
4.3. Driving Factors to Changes in LULC and ESV
5. Reviewed Studies from Ethiopia
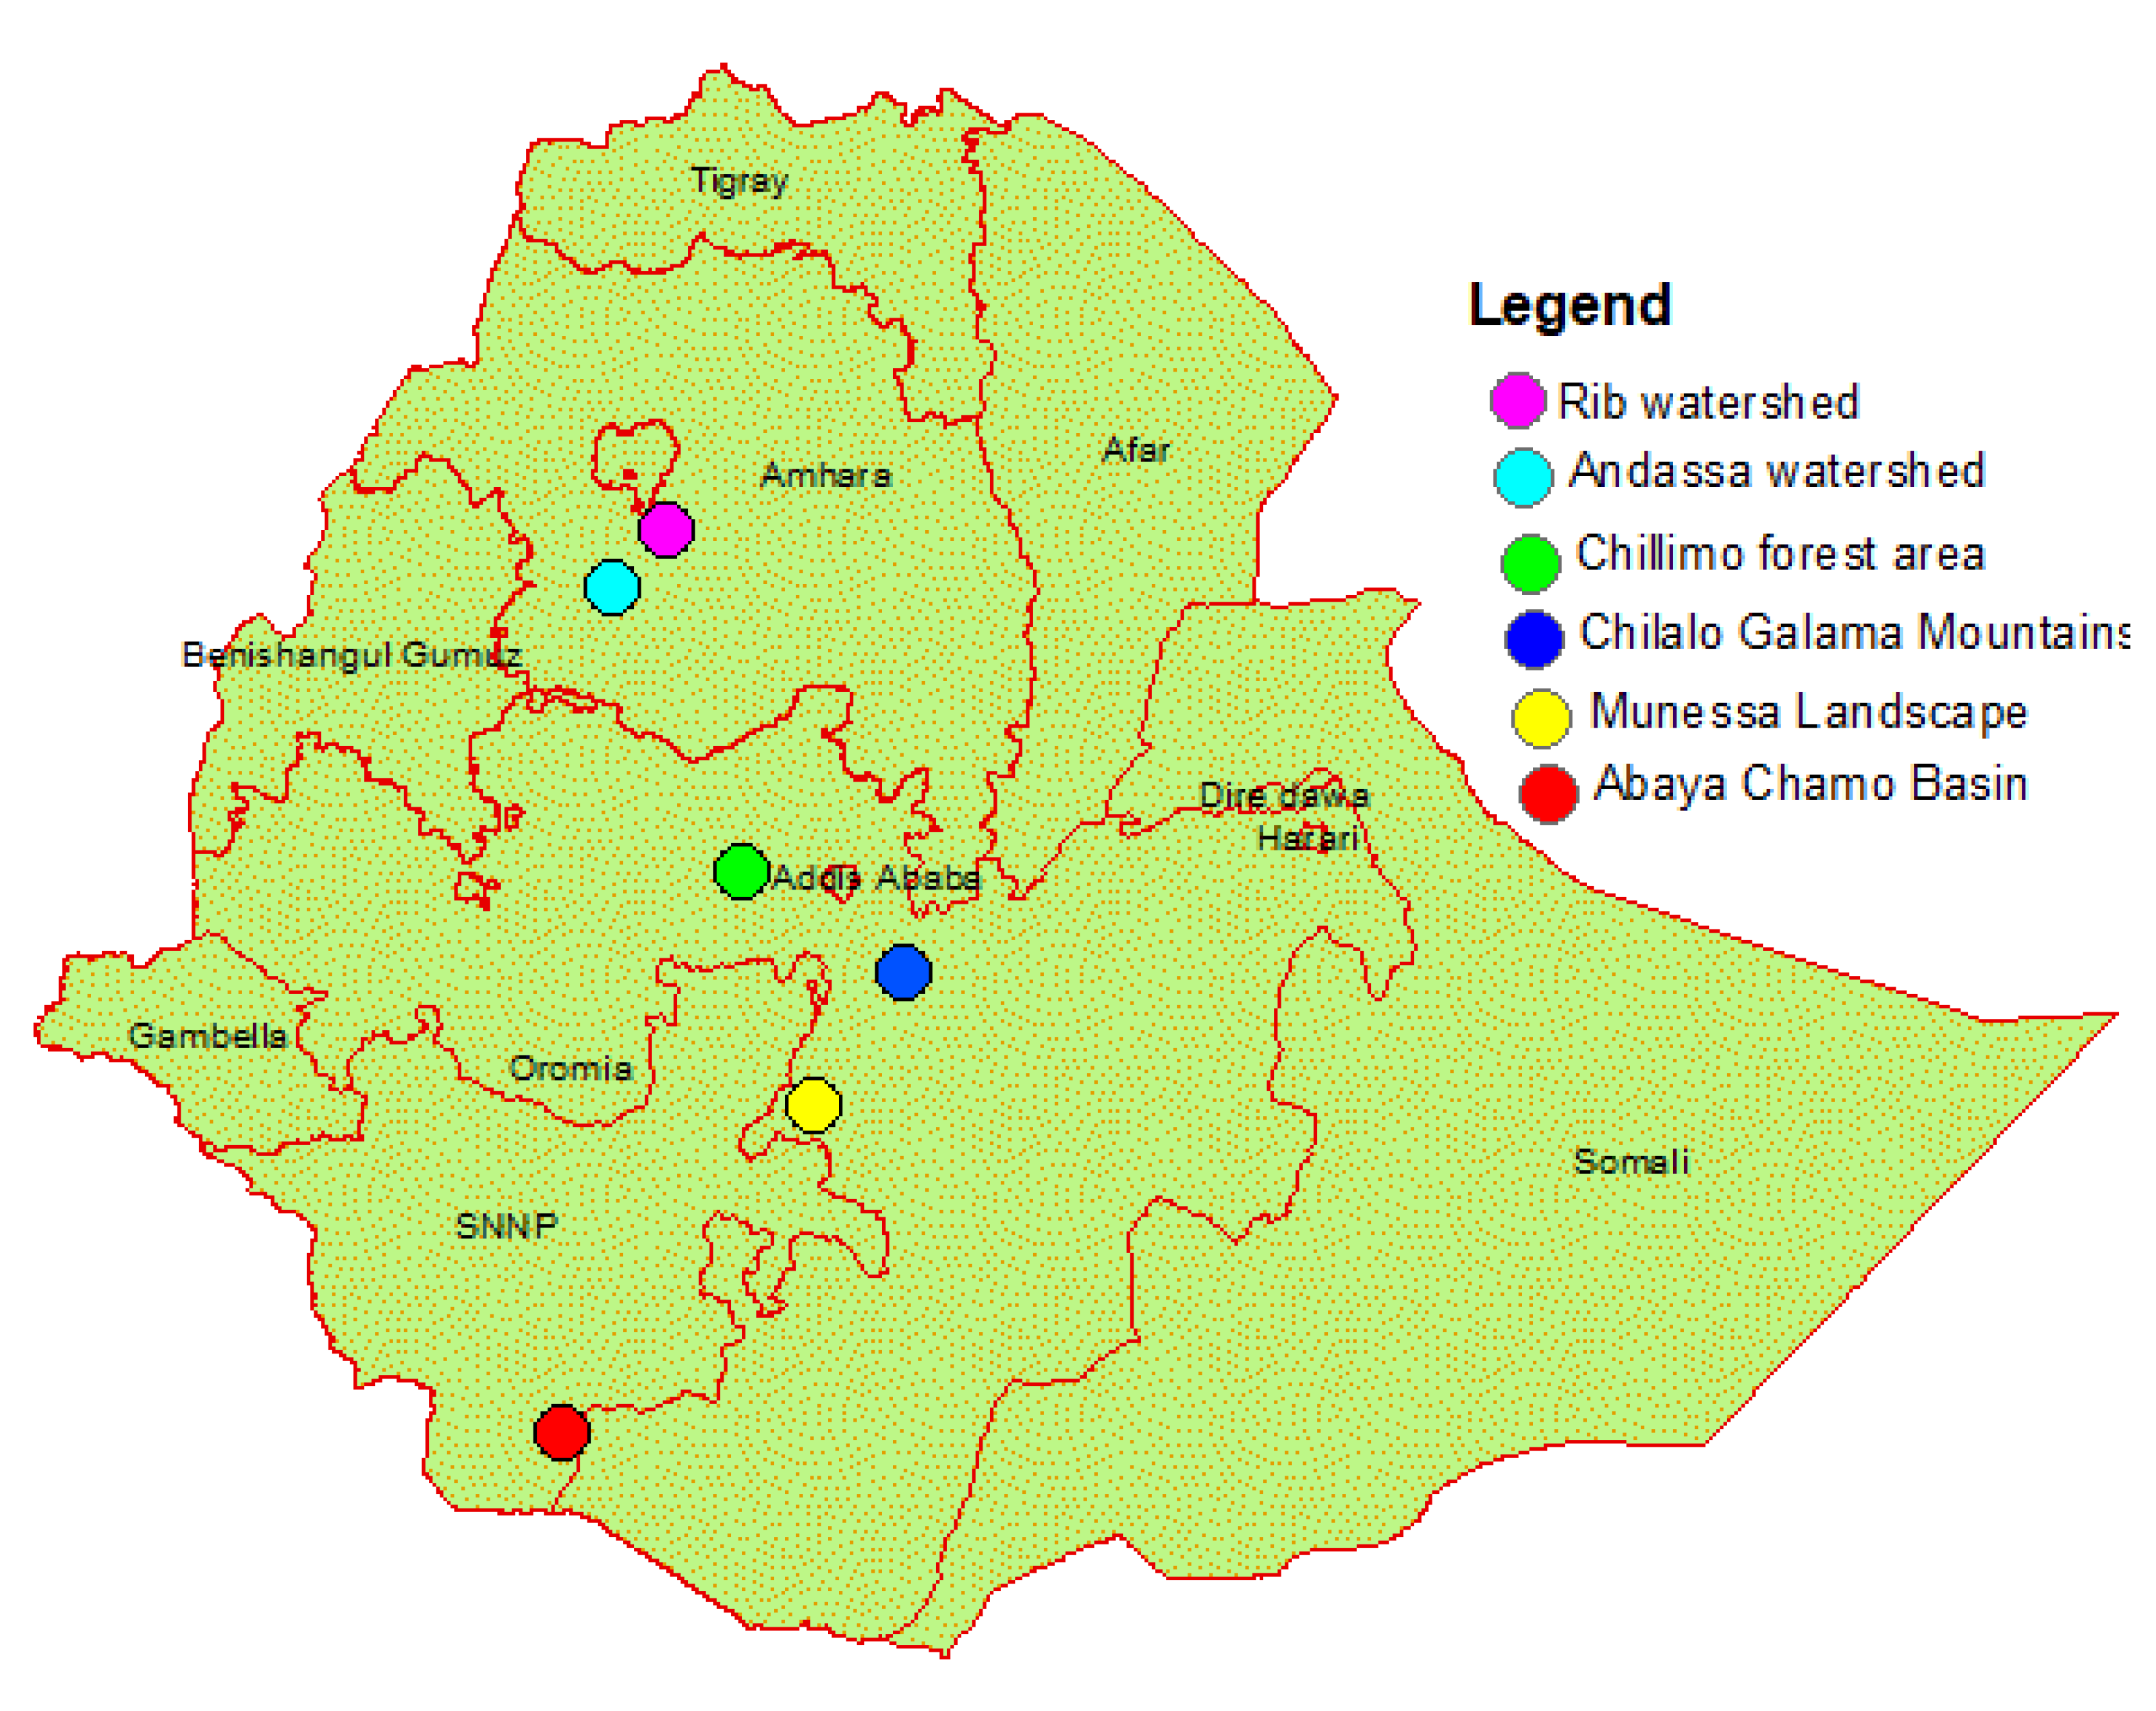
5.1. Geographical Location of the Selected Studies
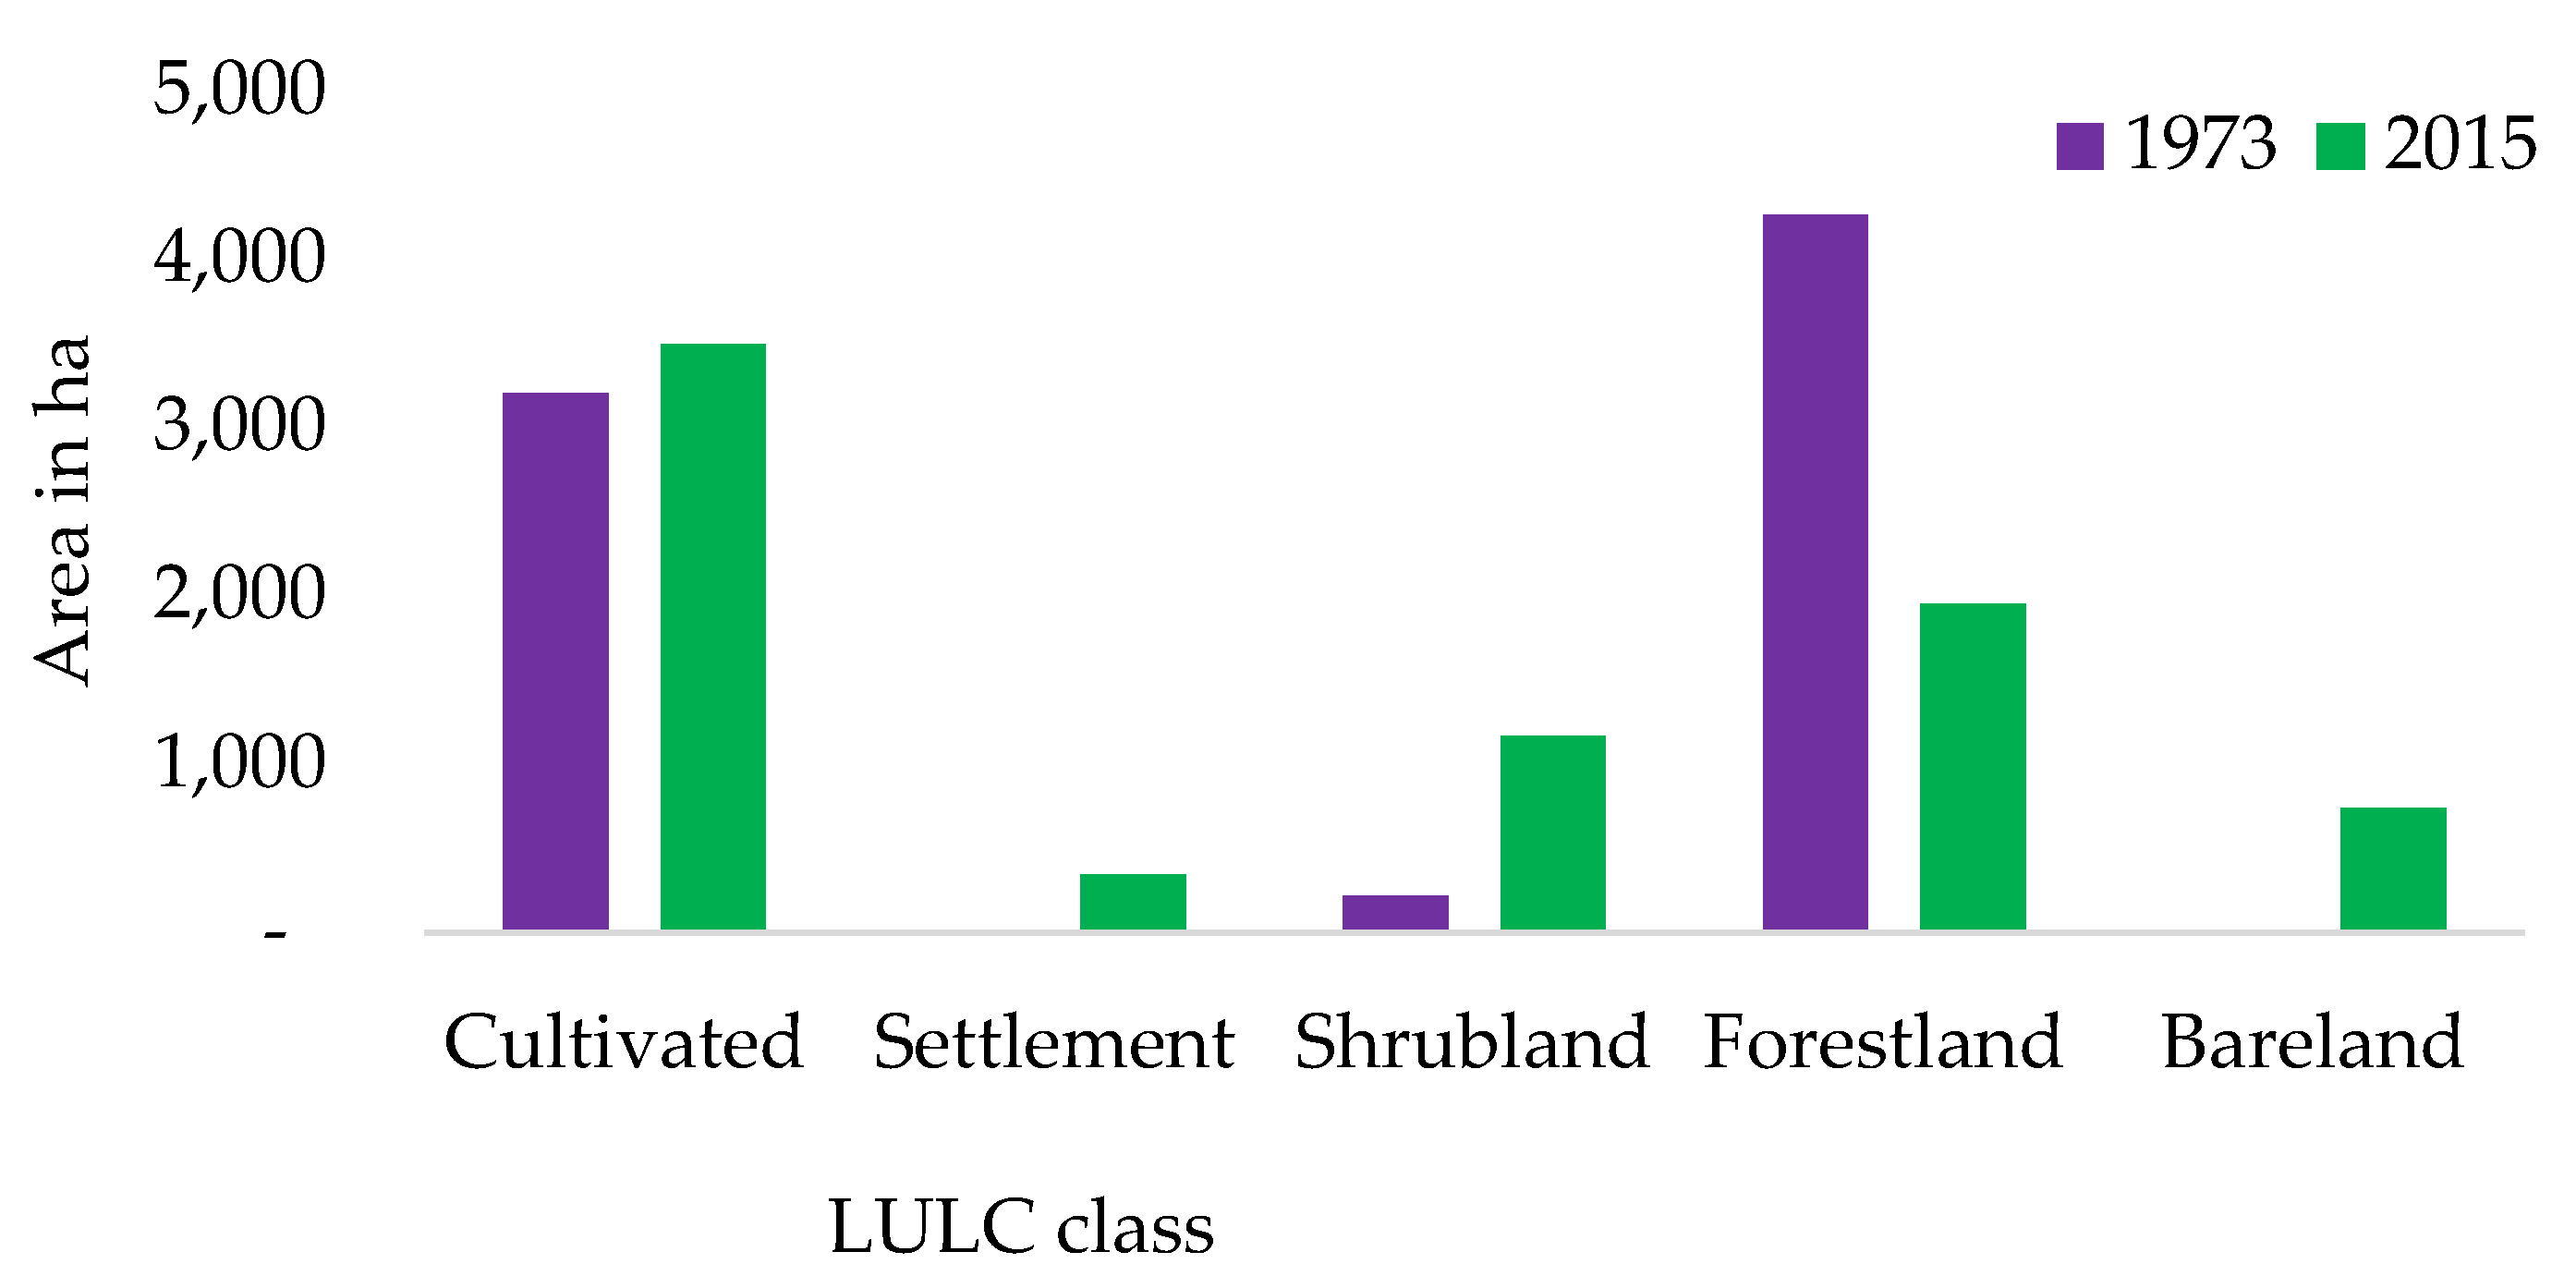
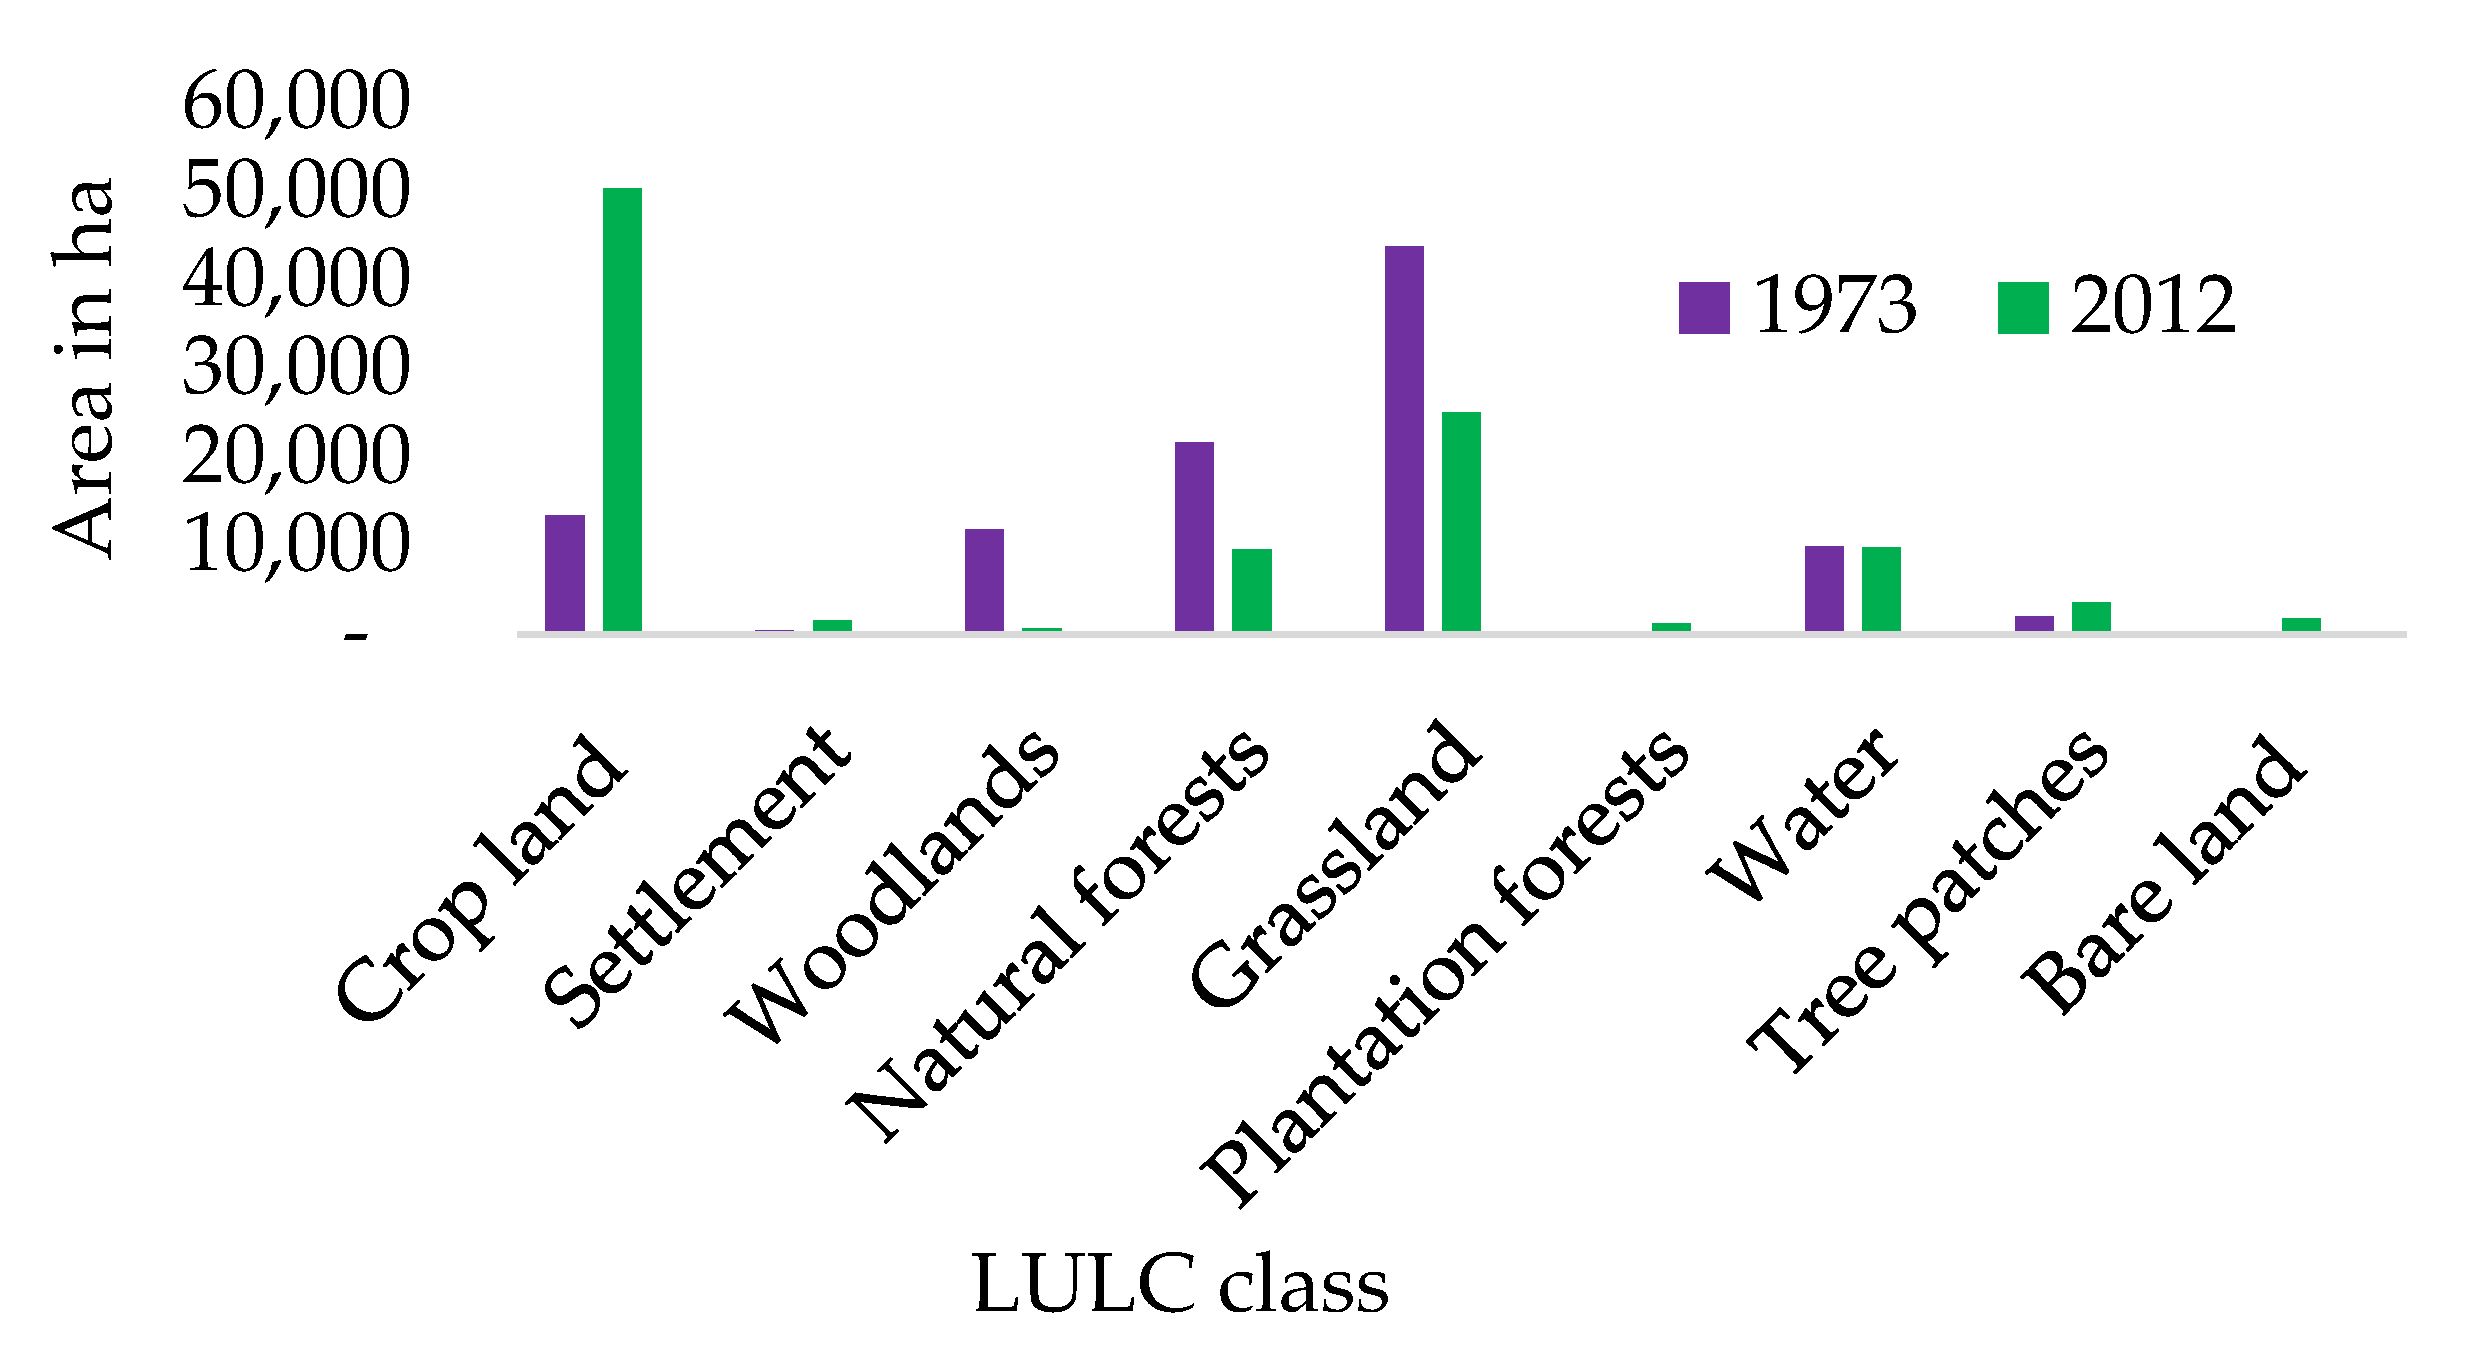
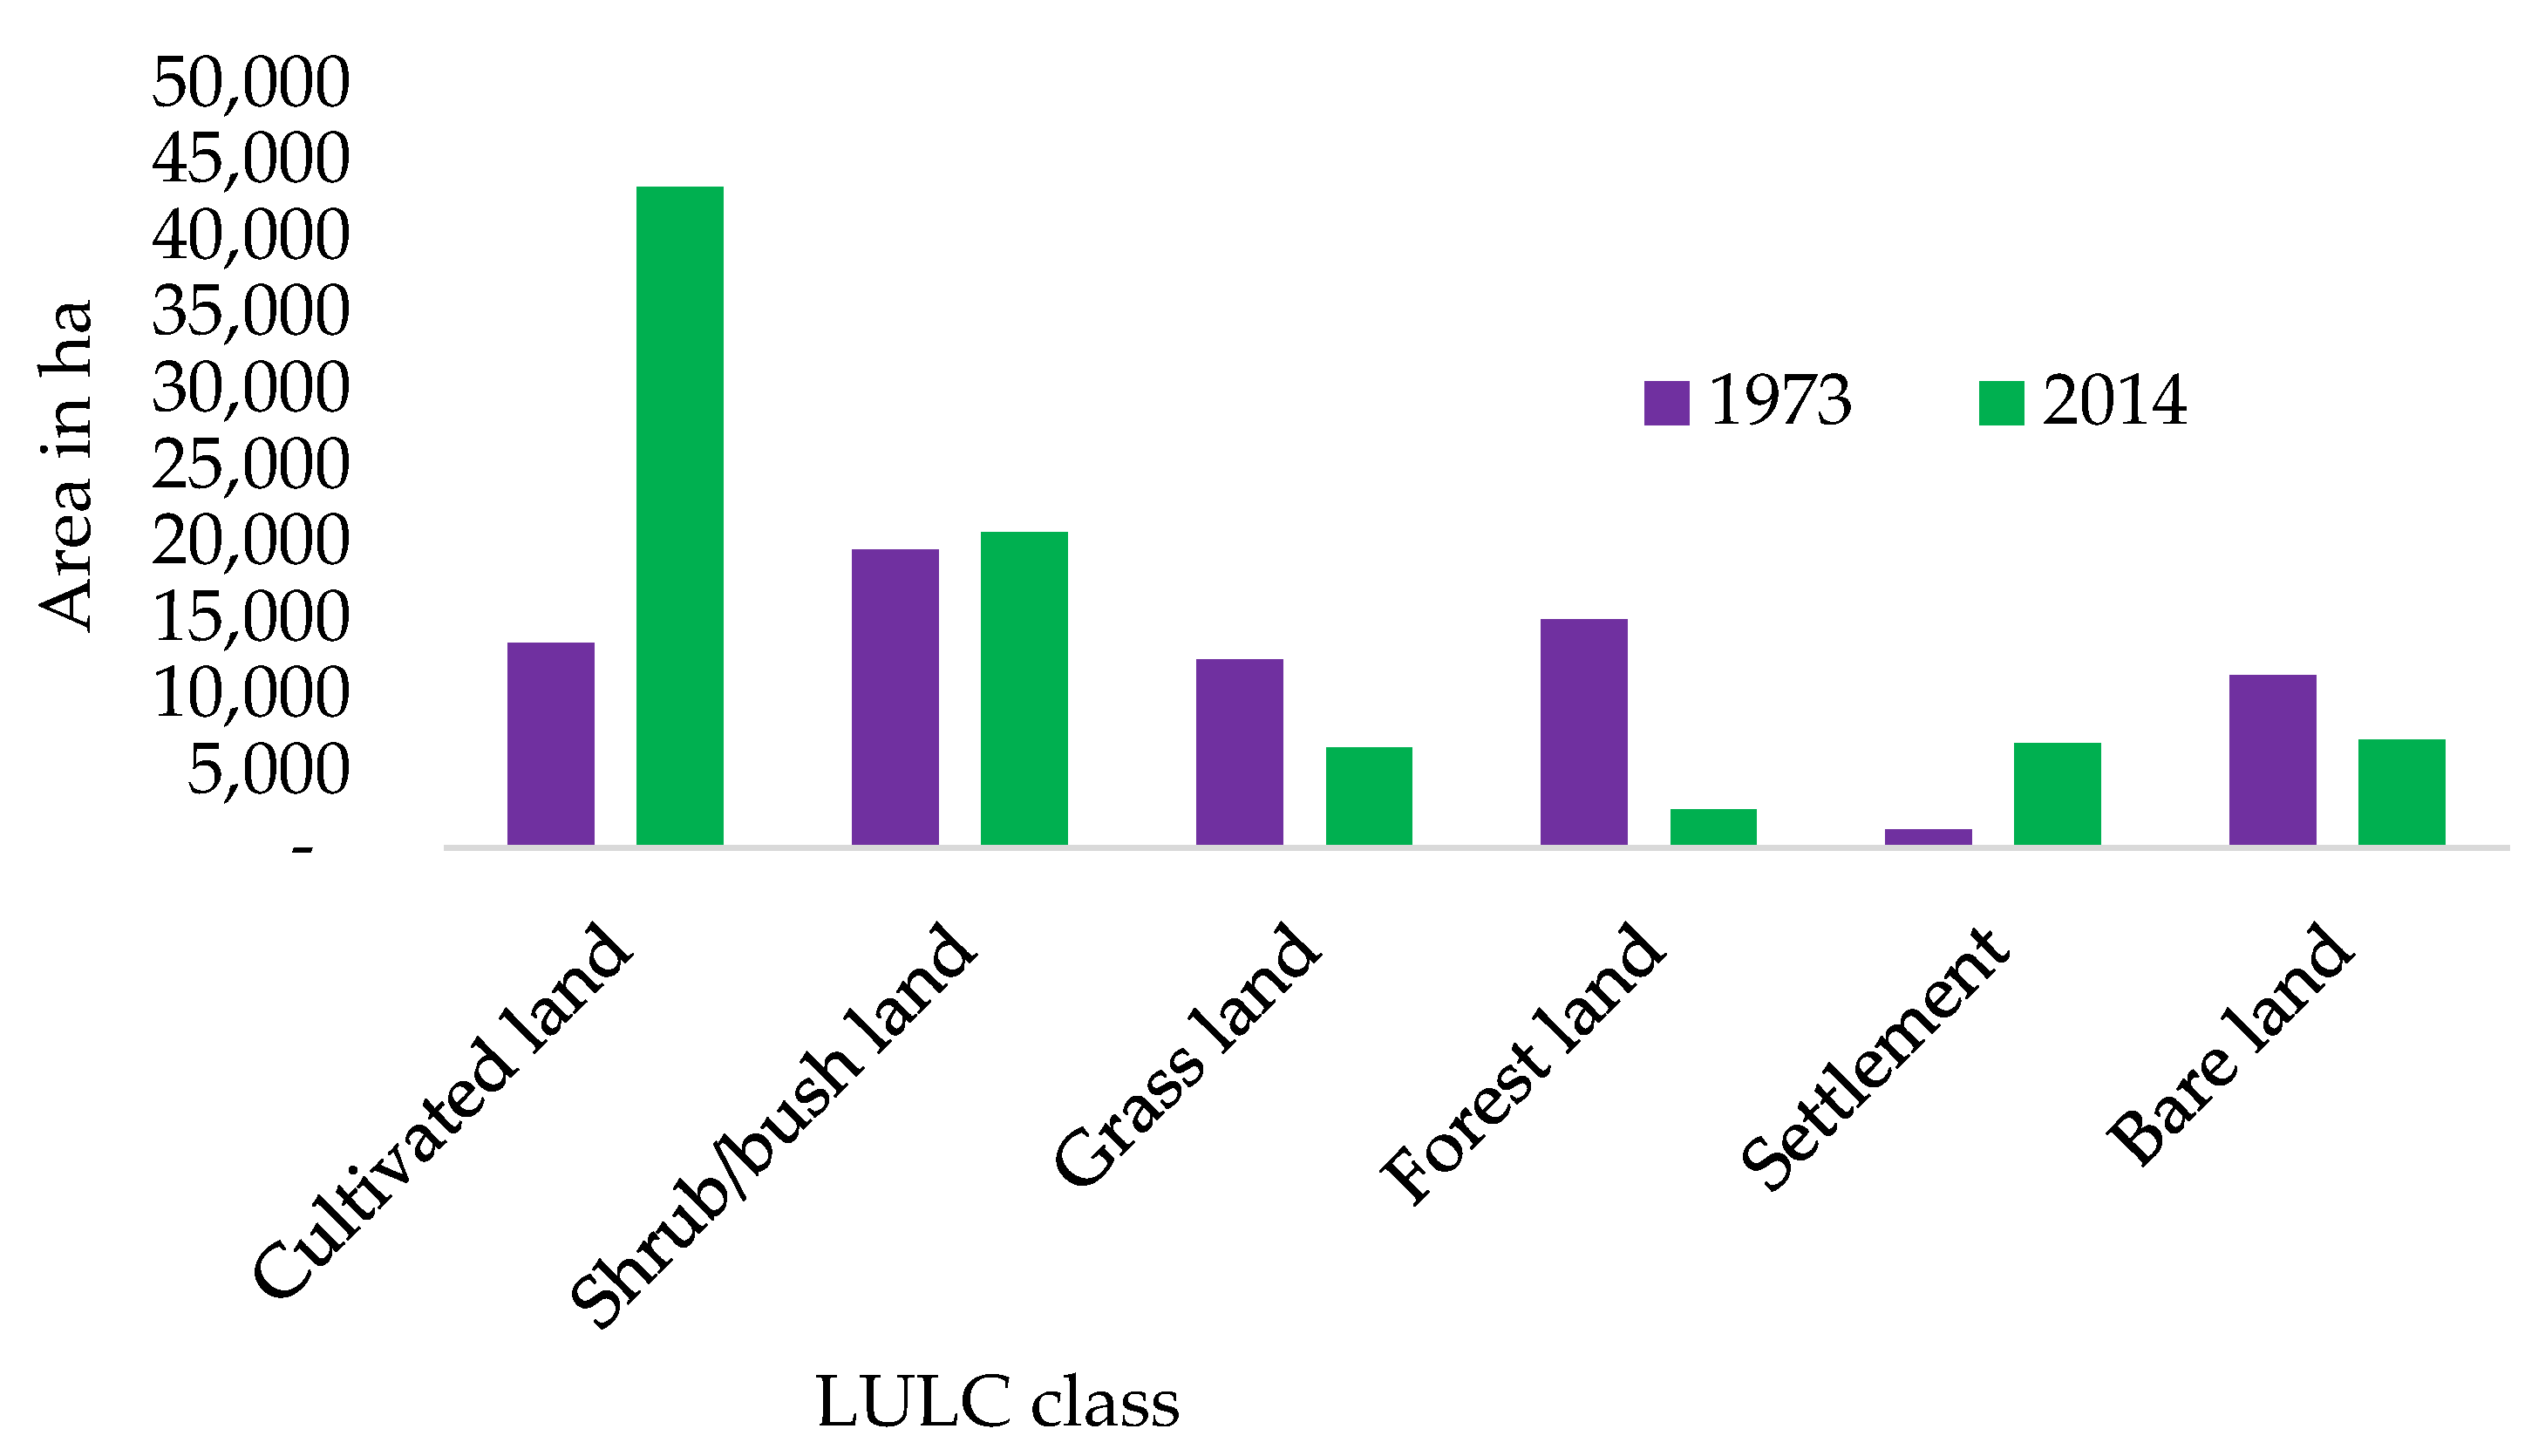
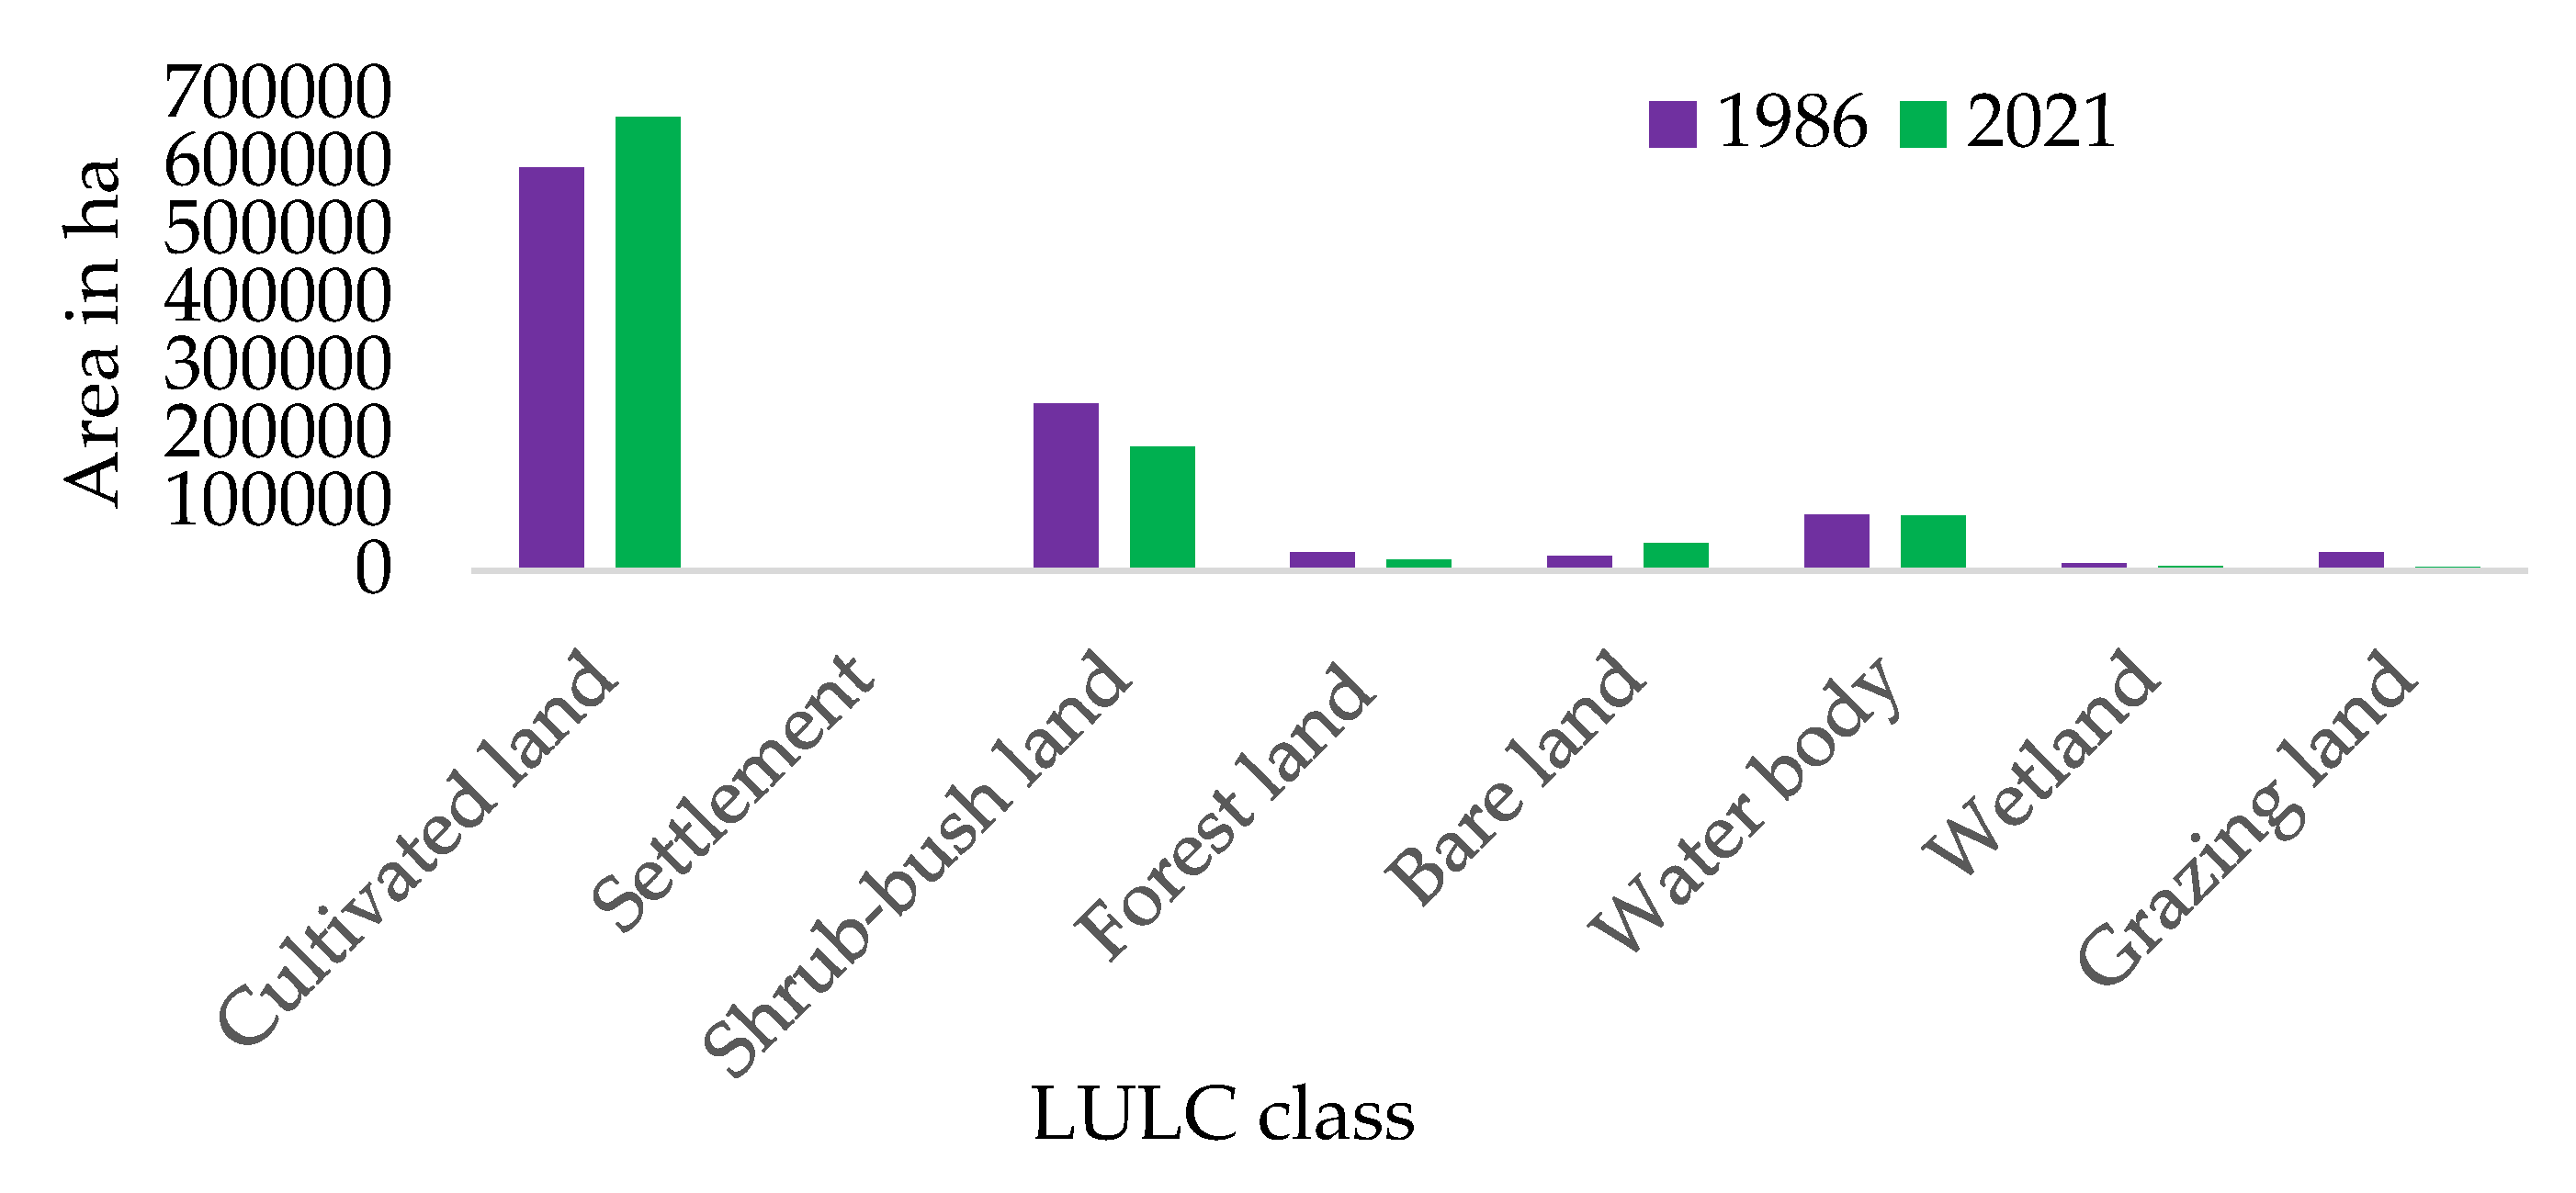
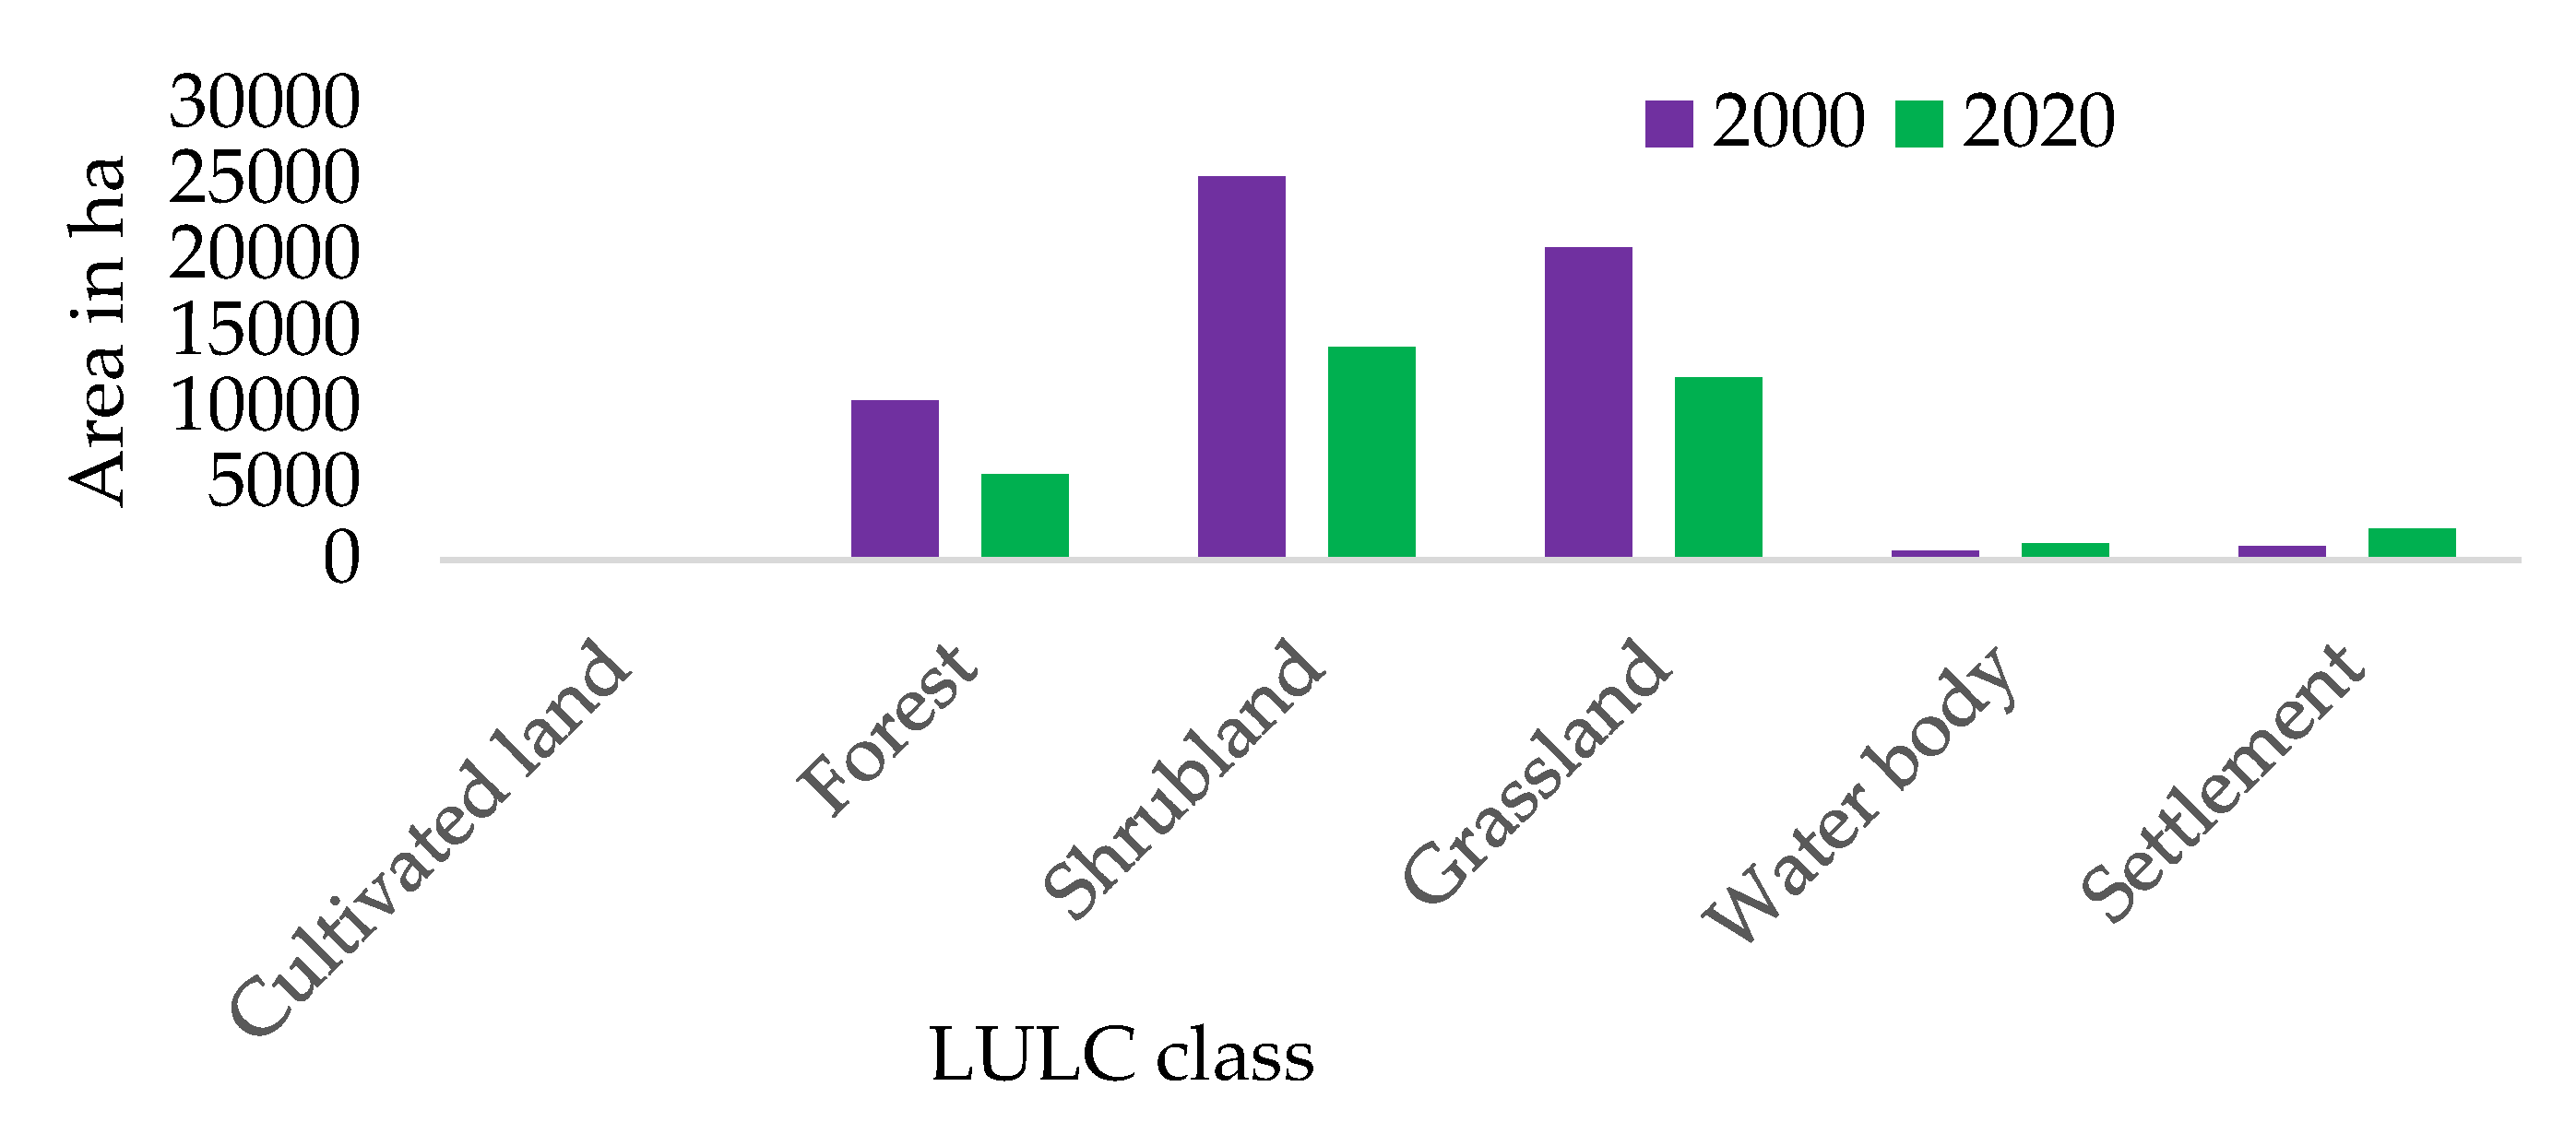
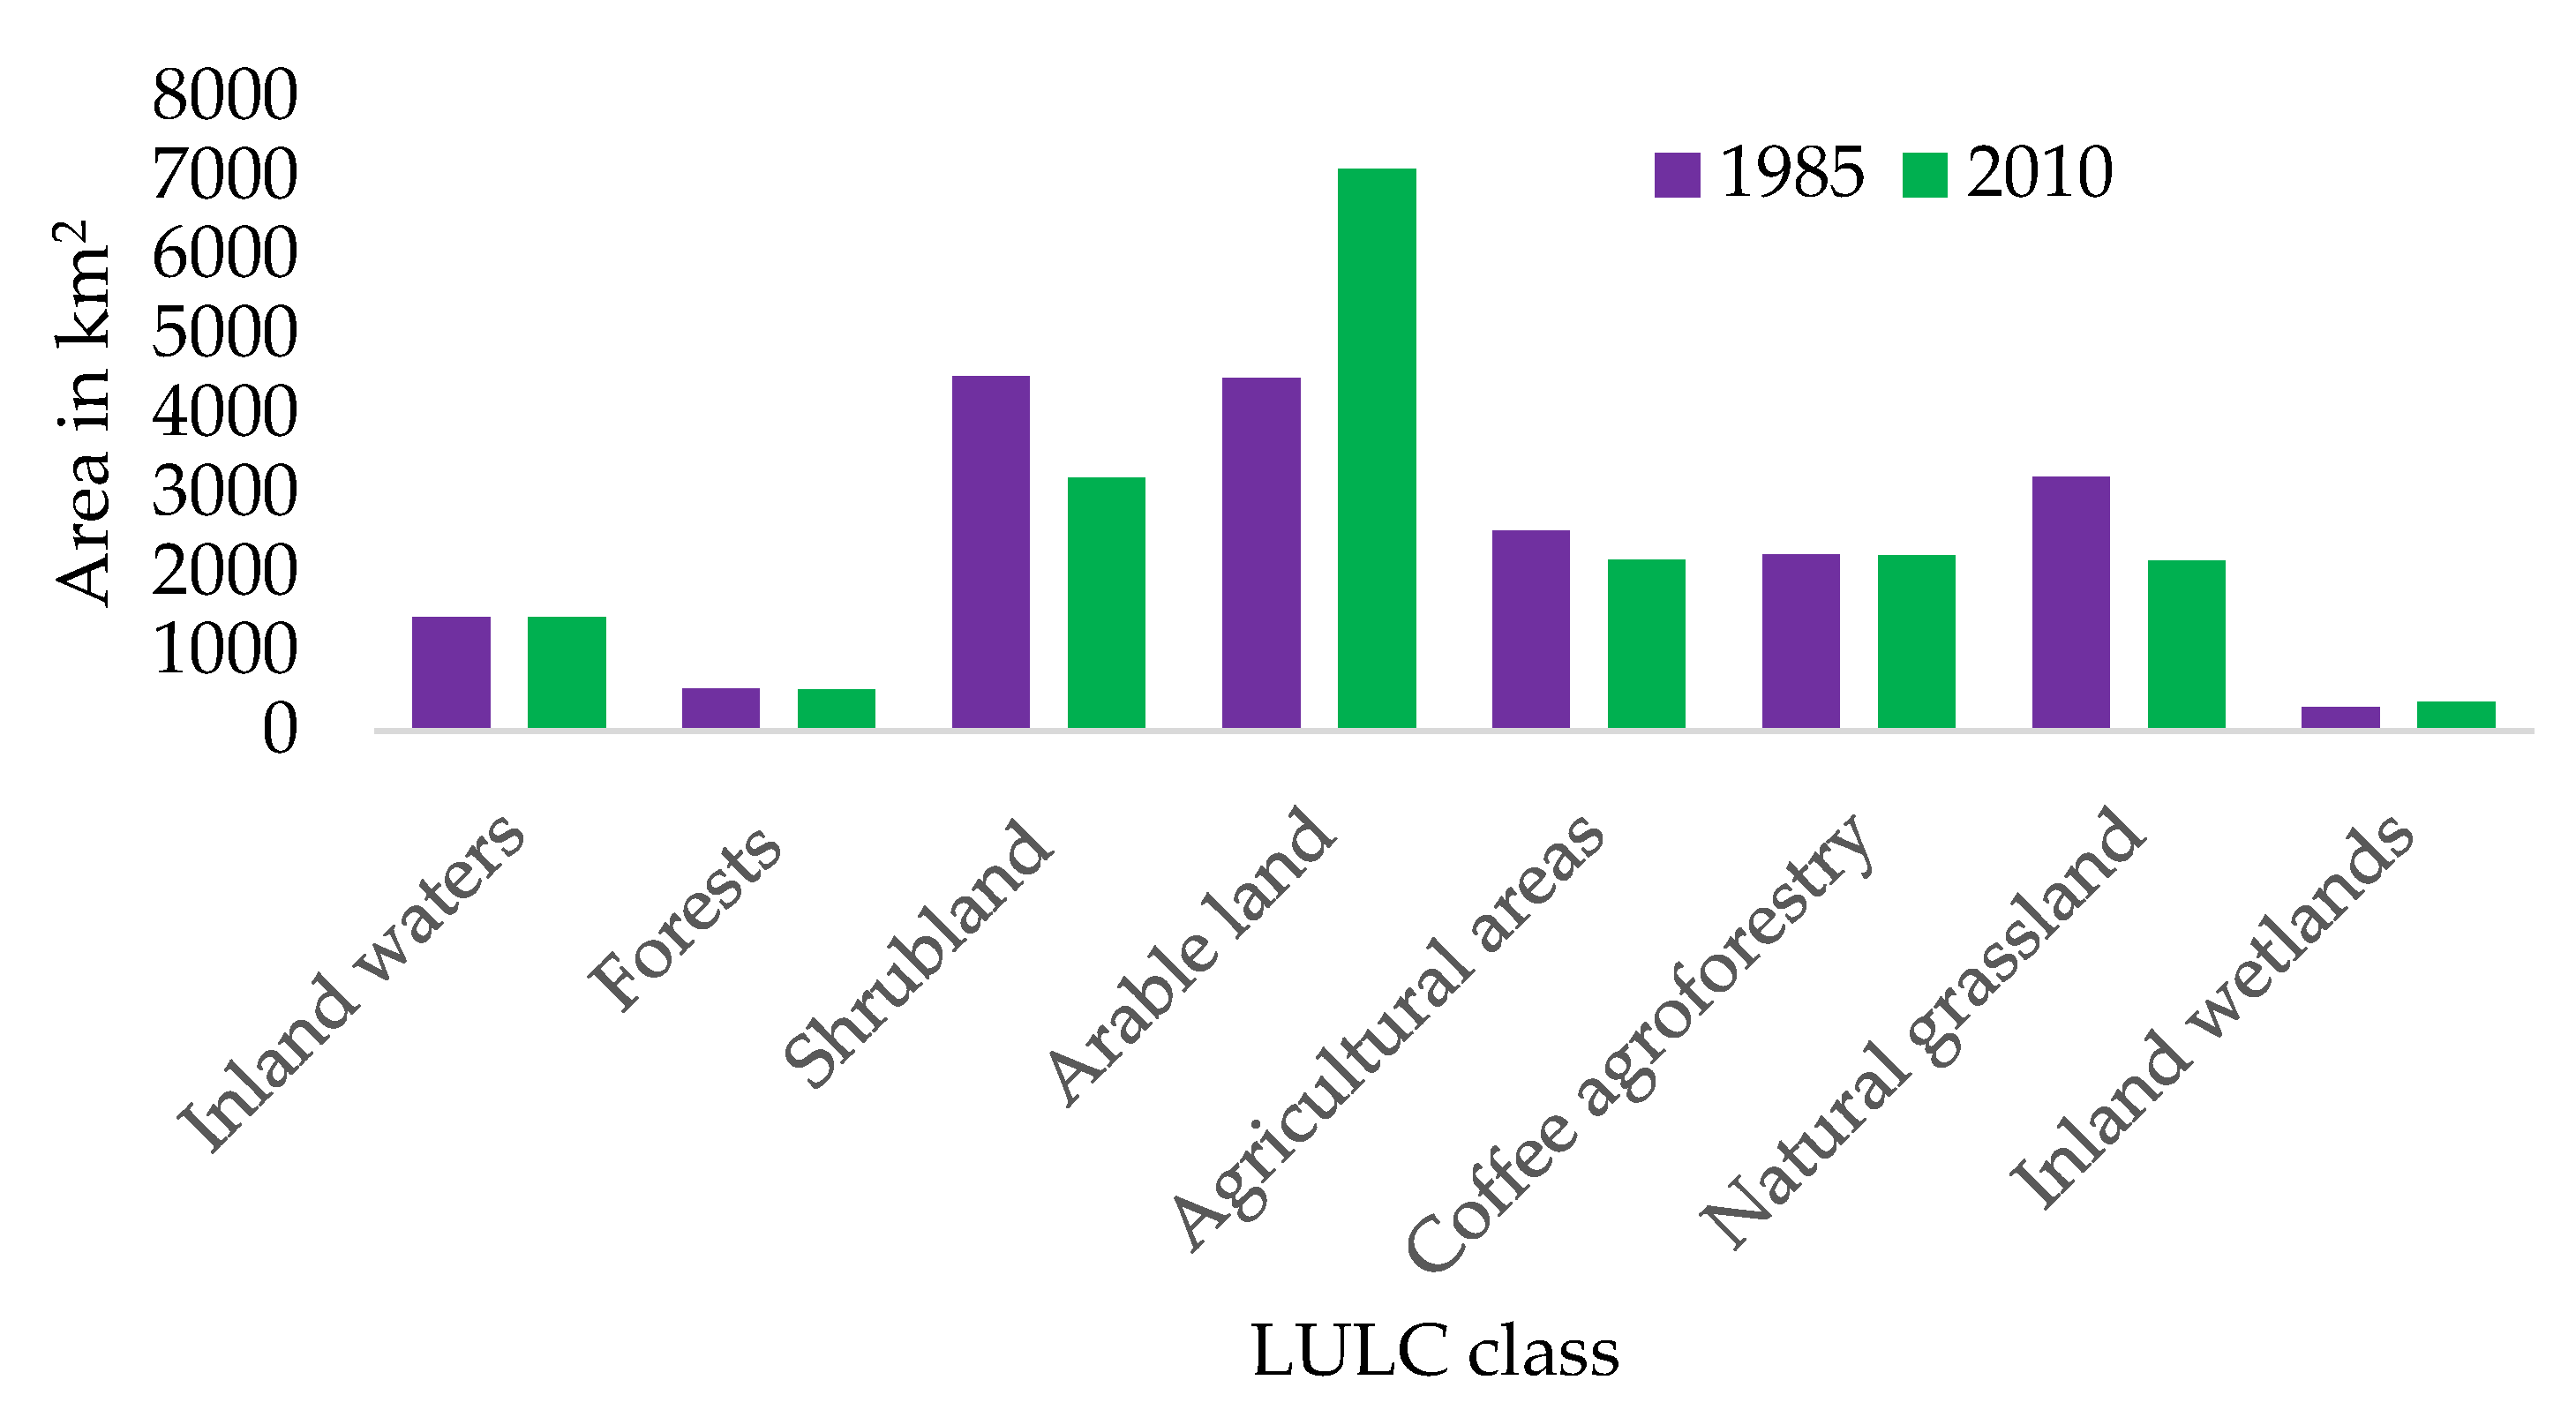
5.2. Changes in LULC
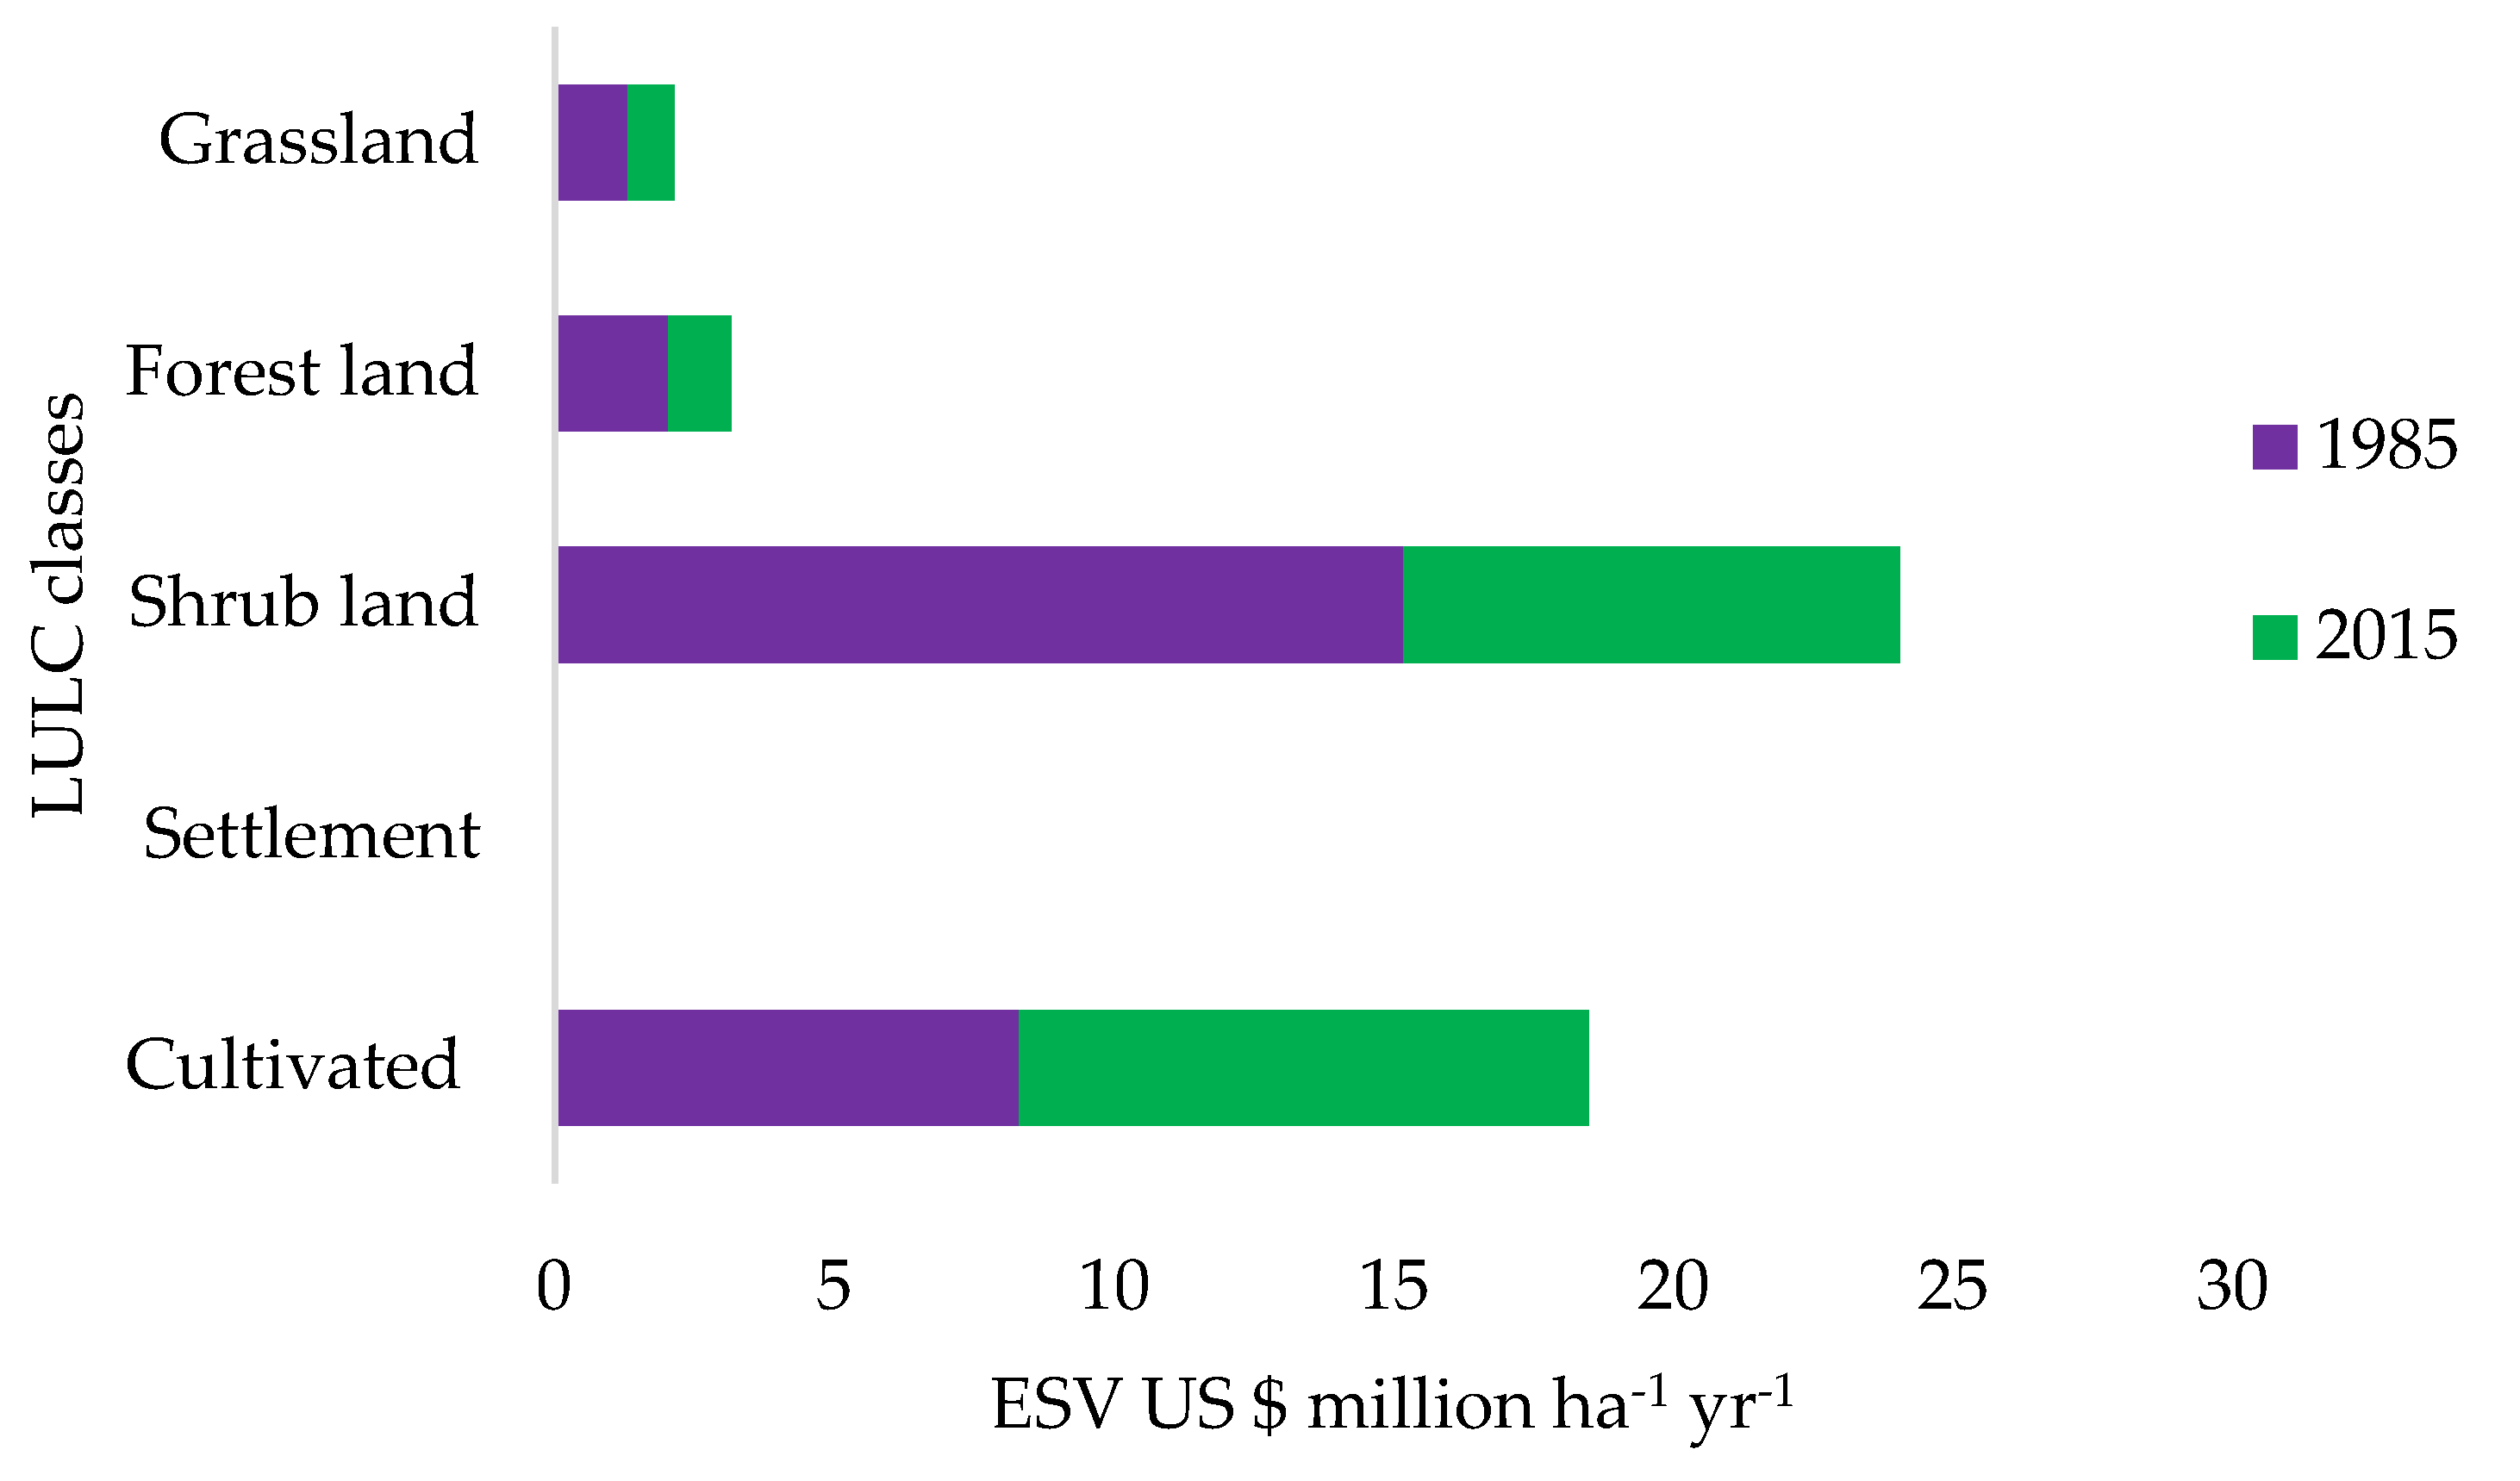
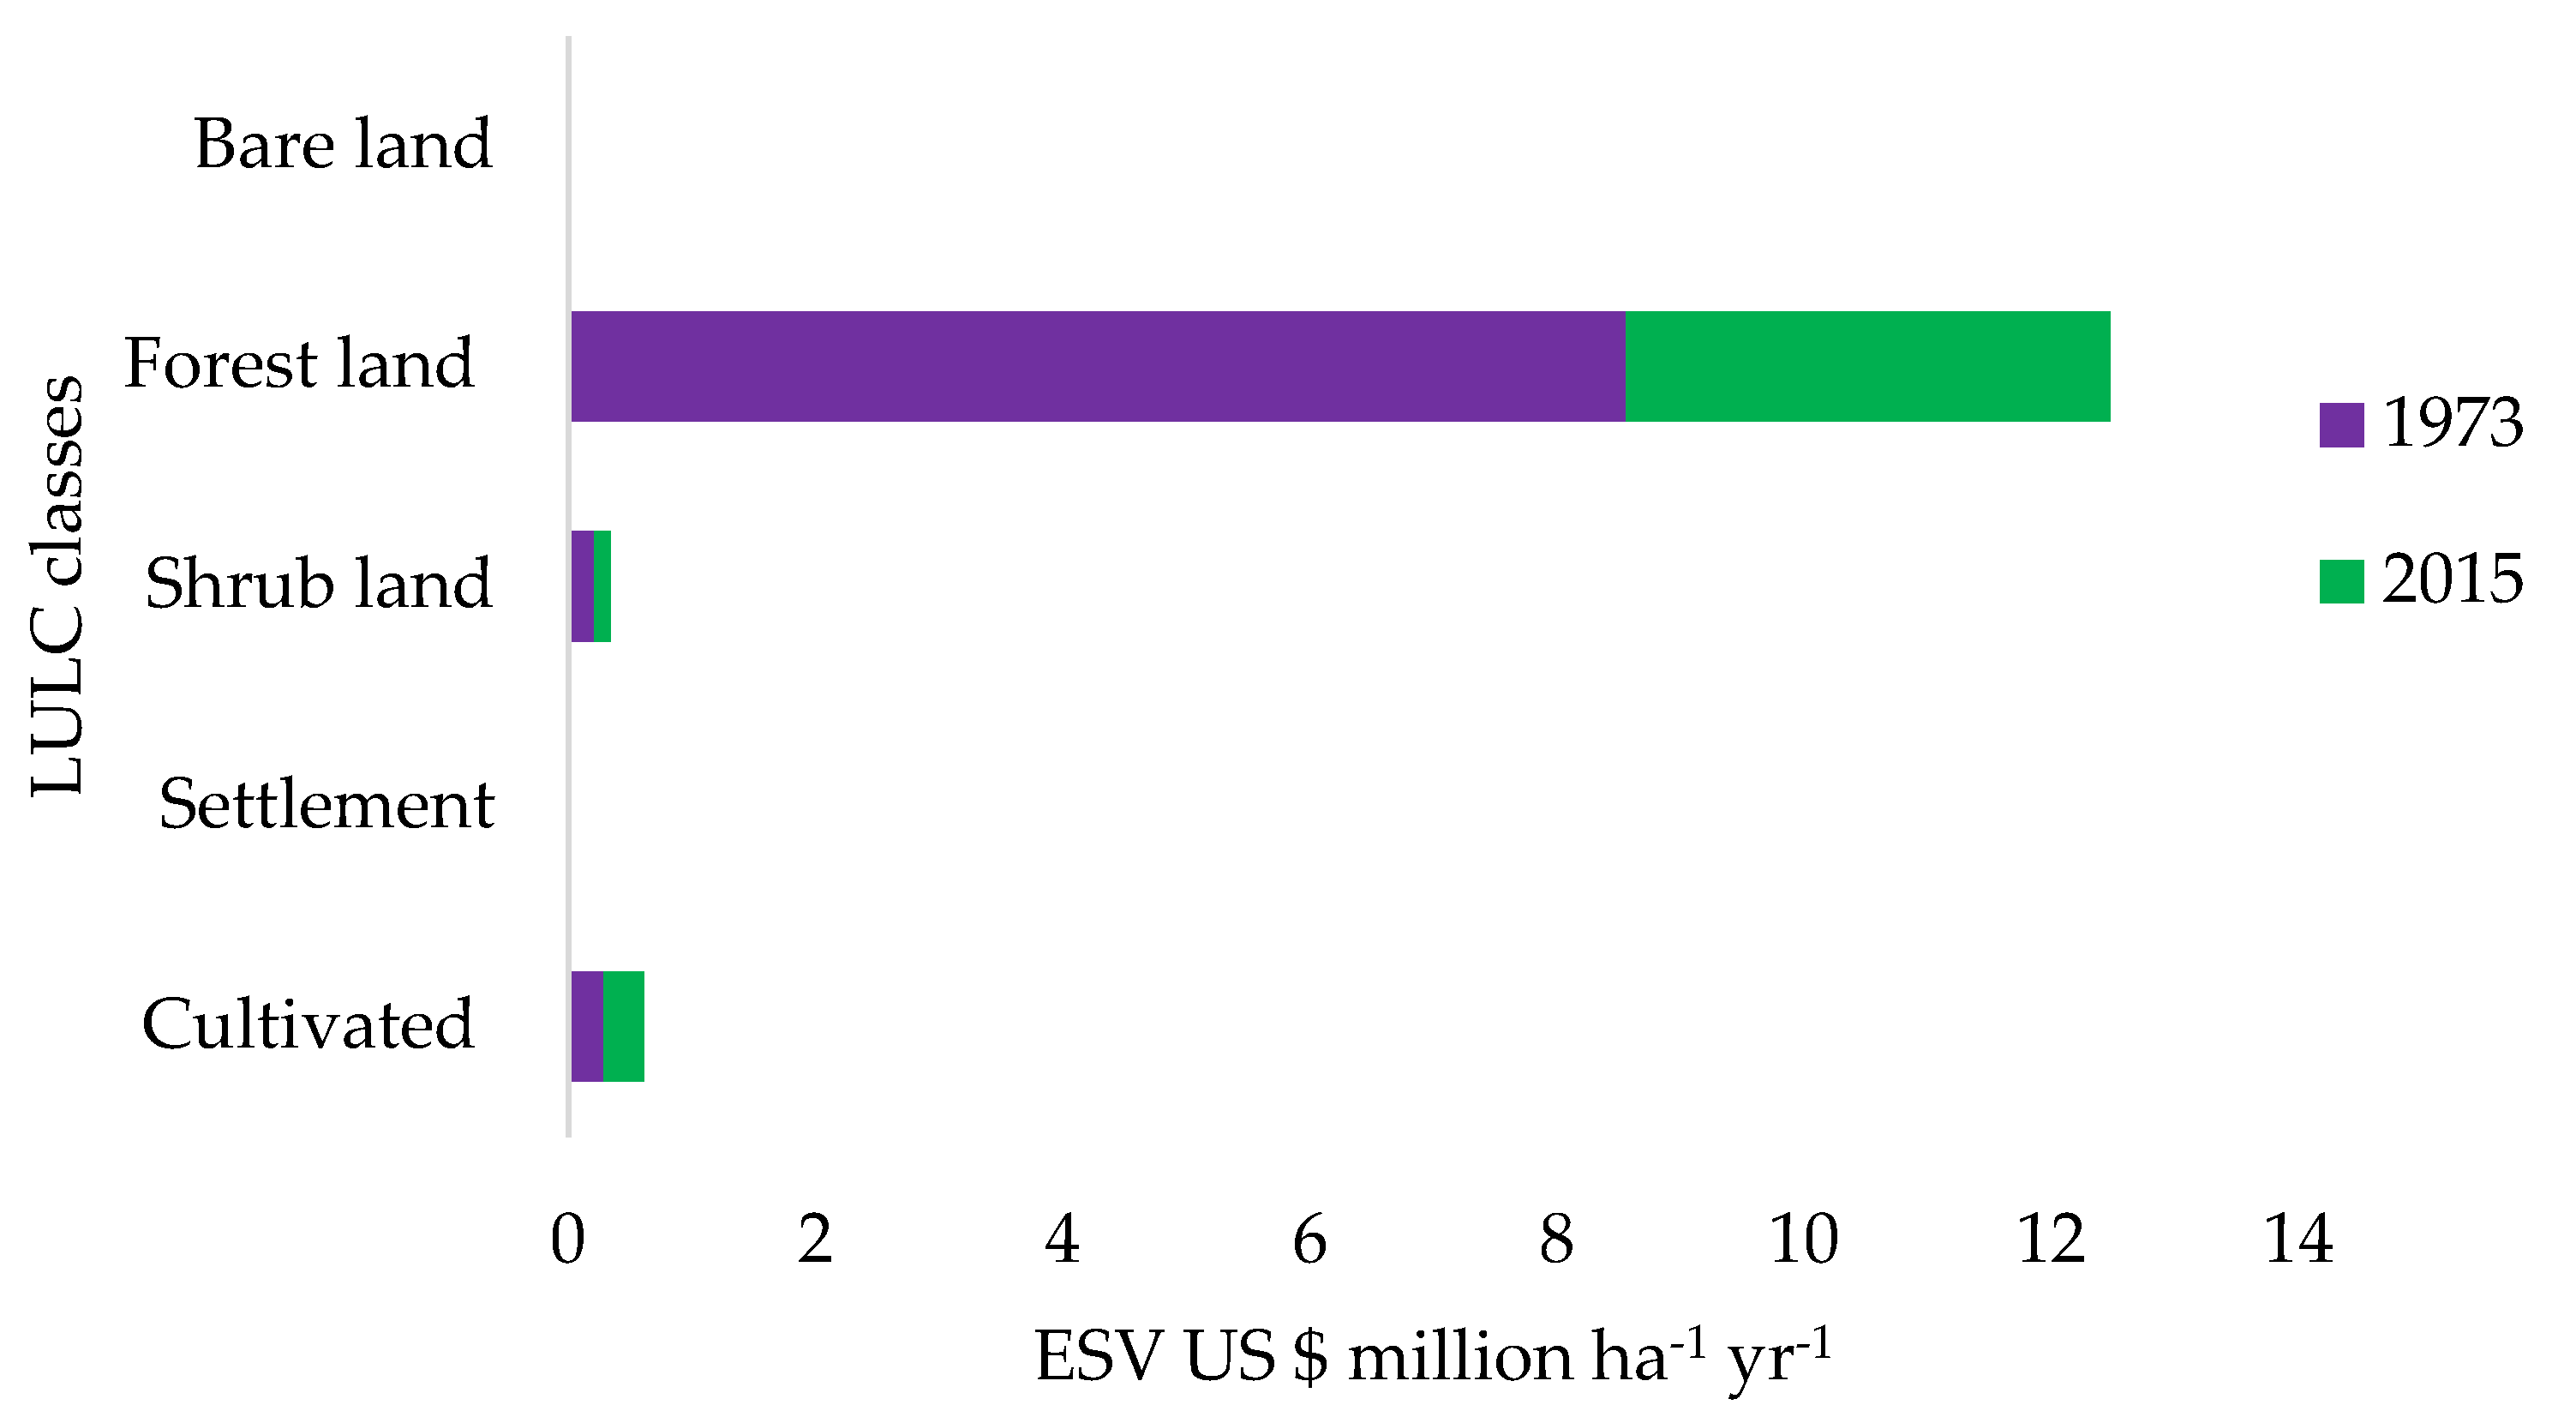
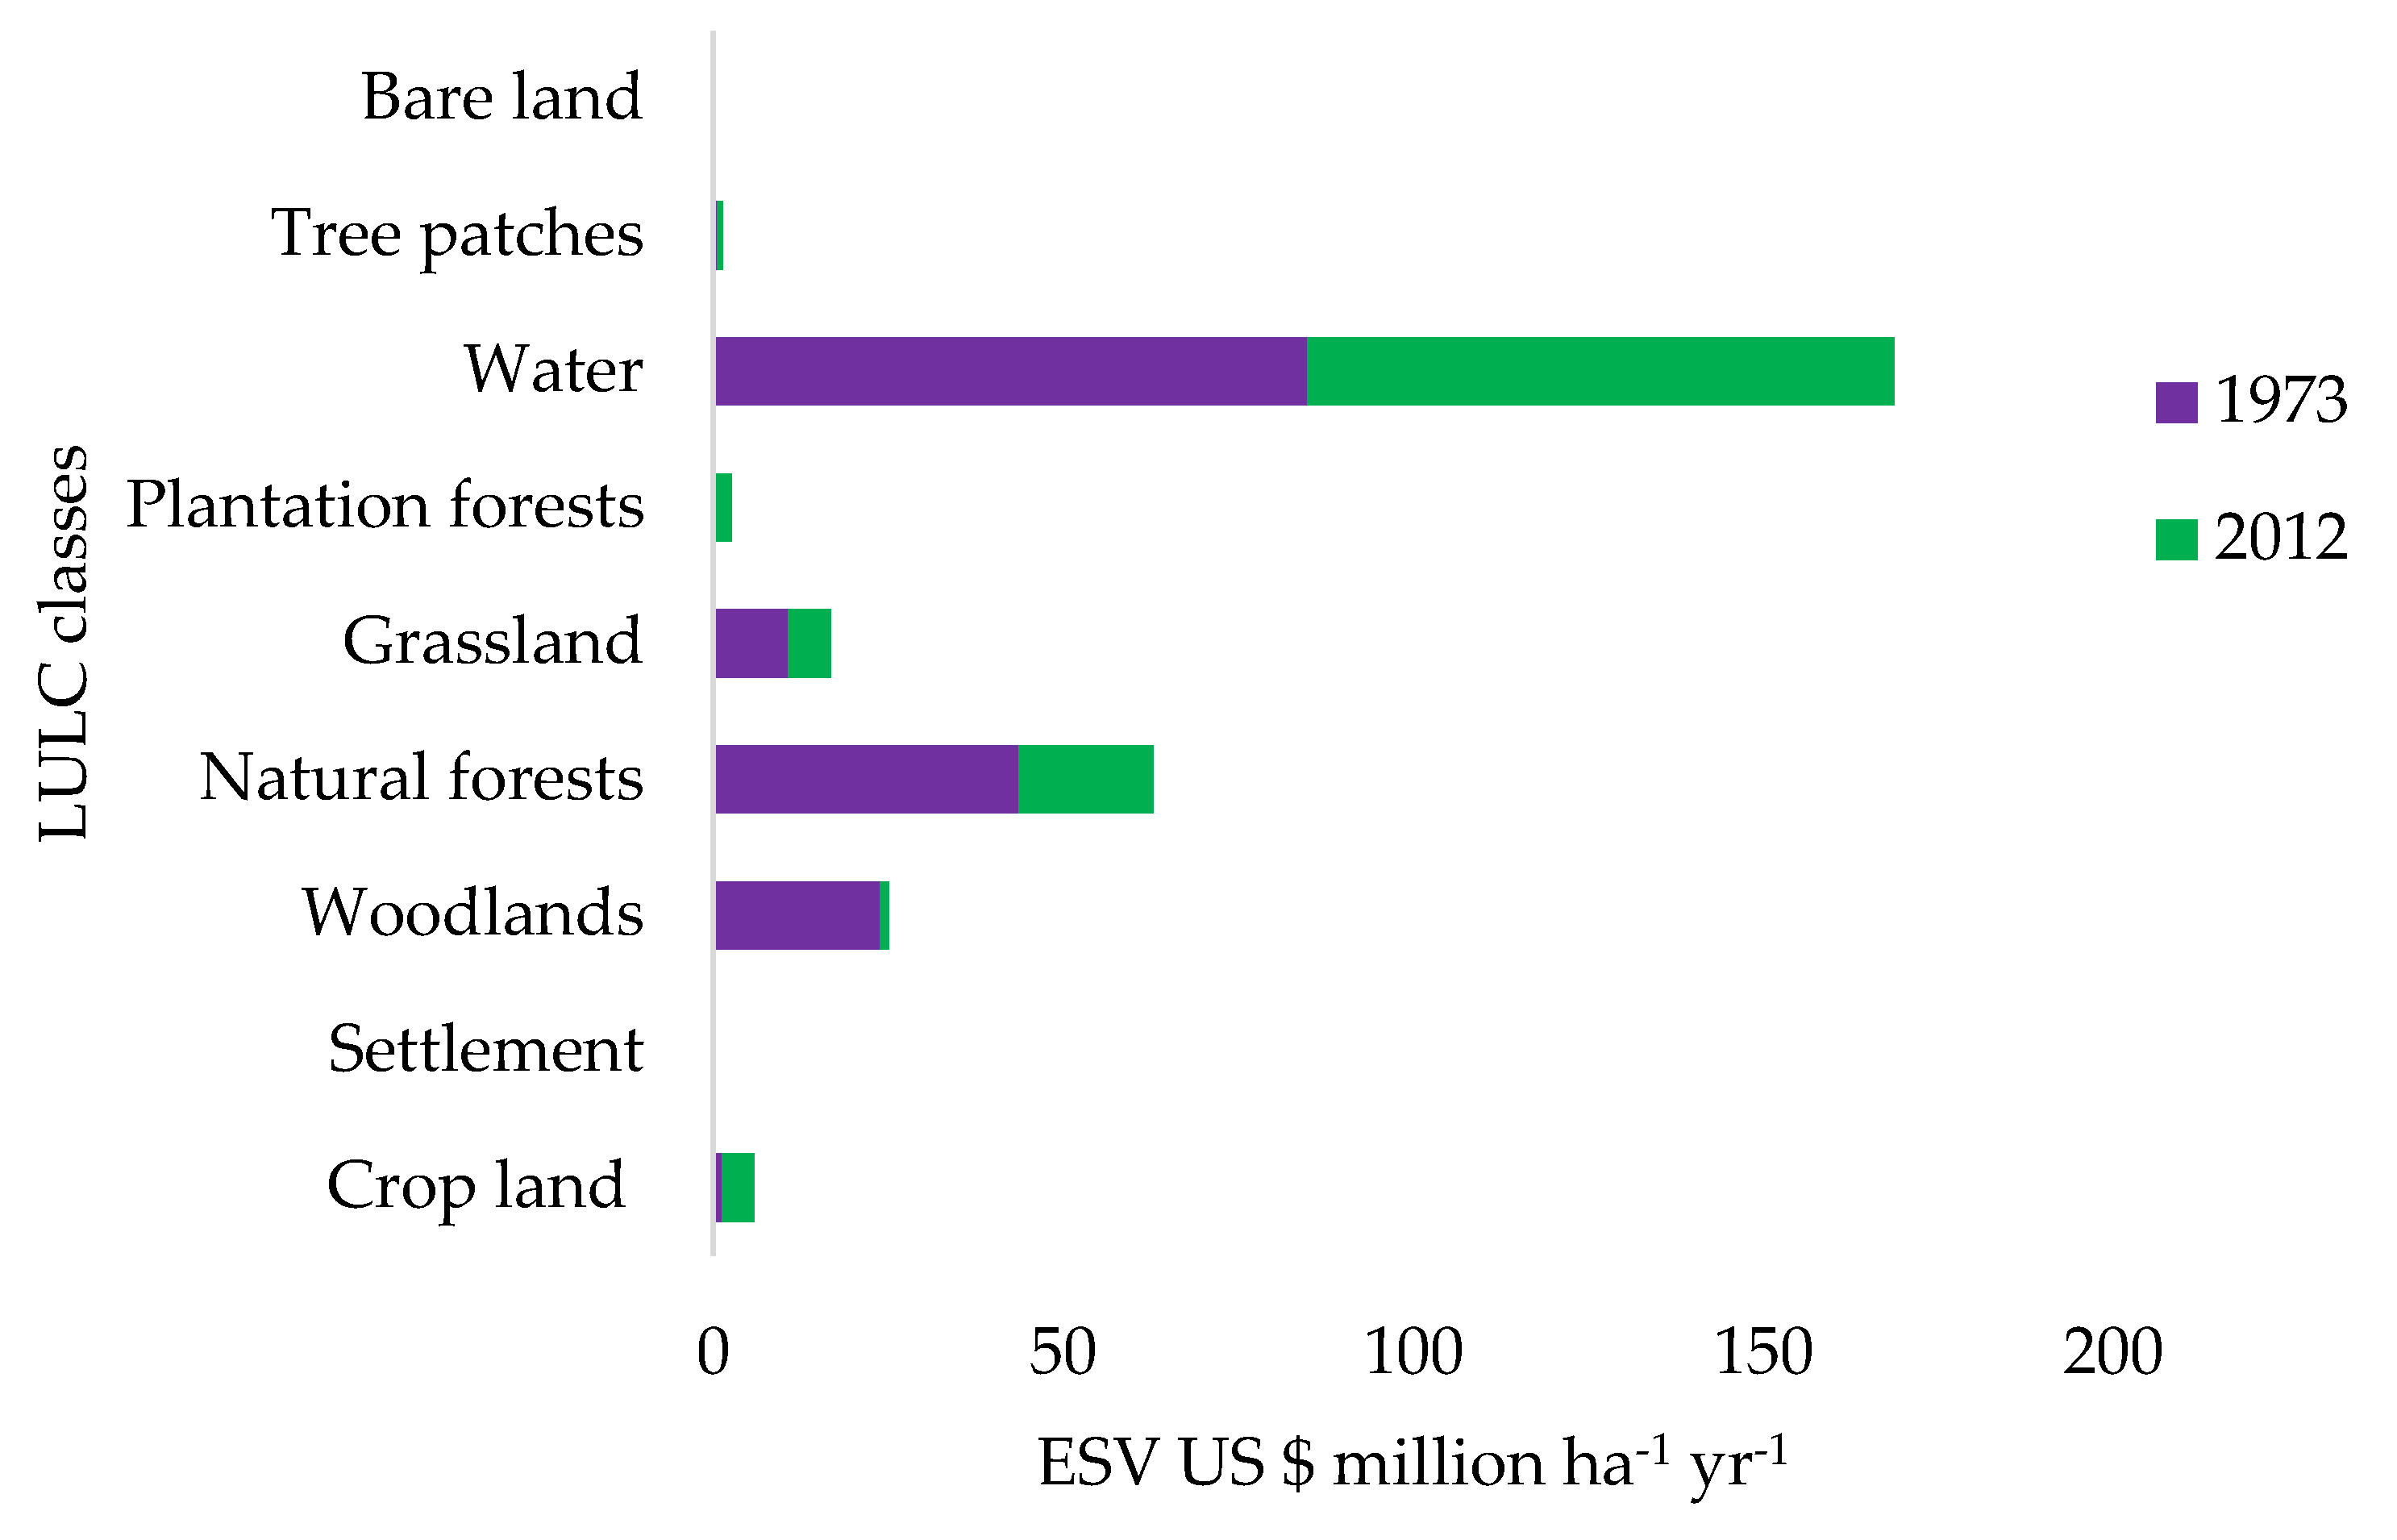
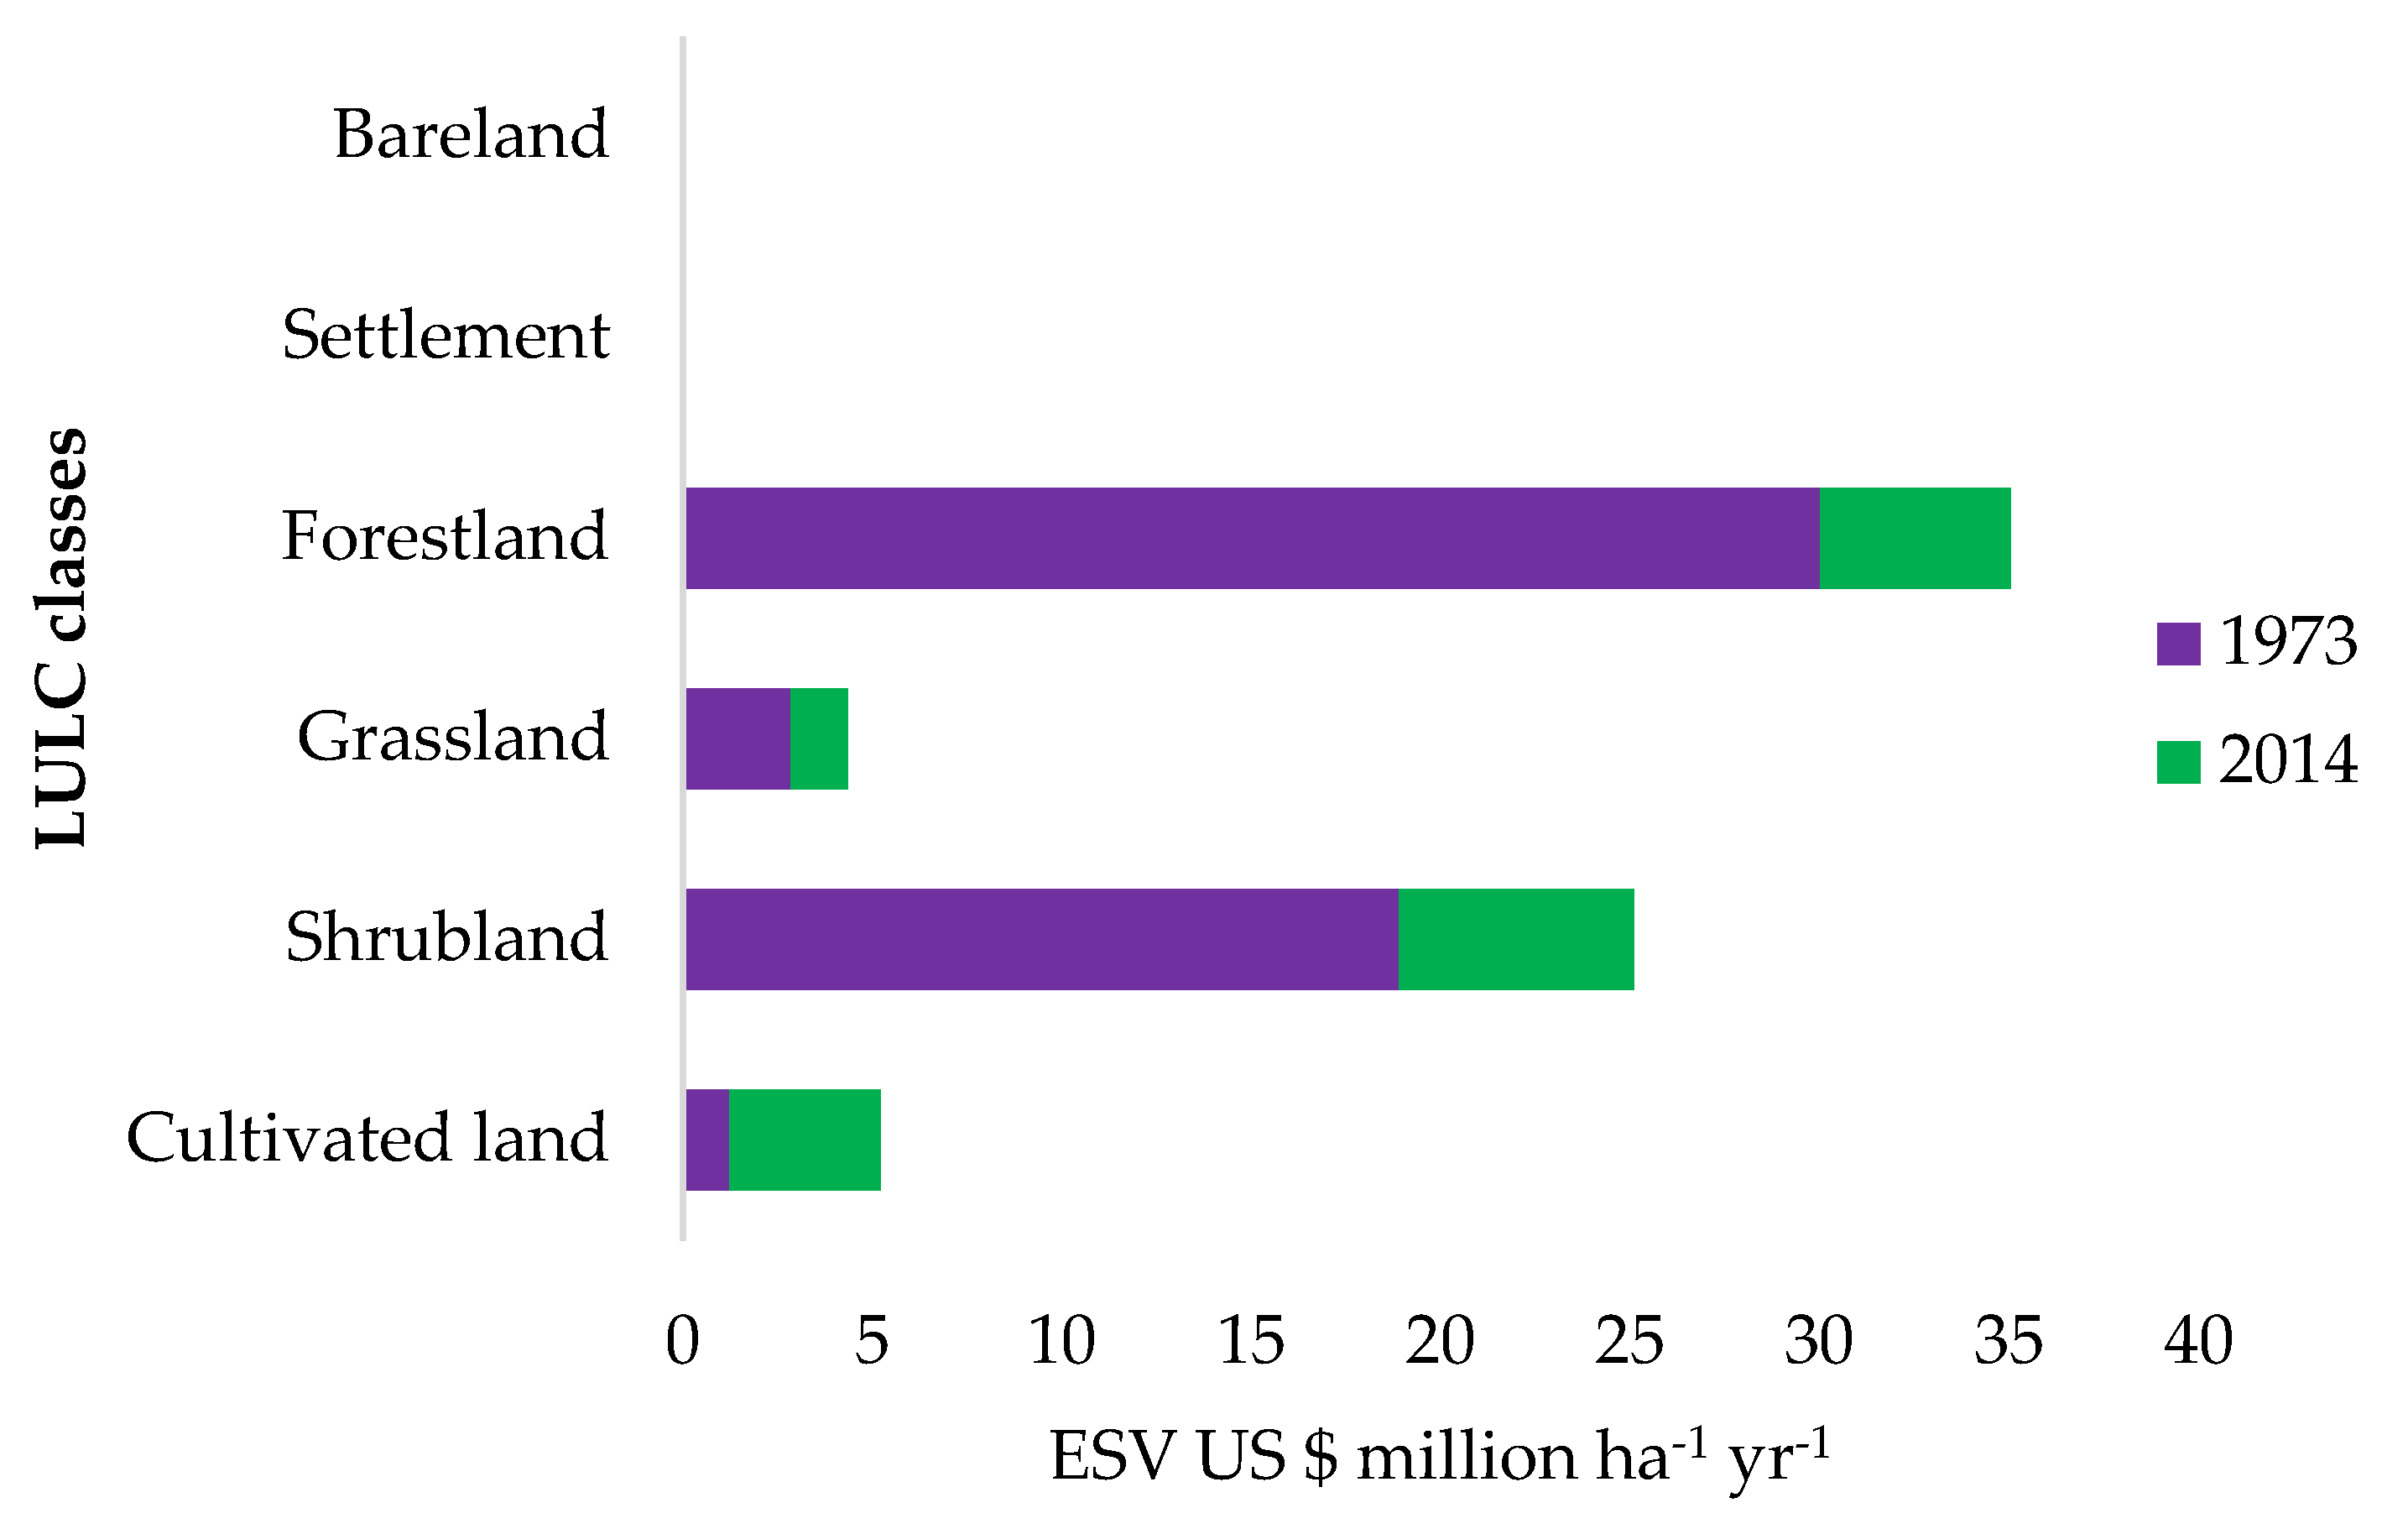
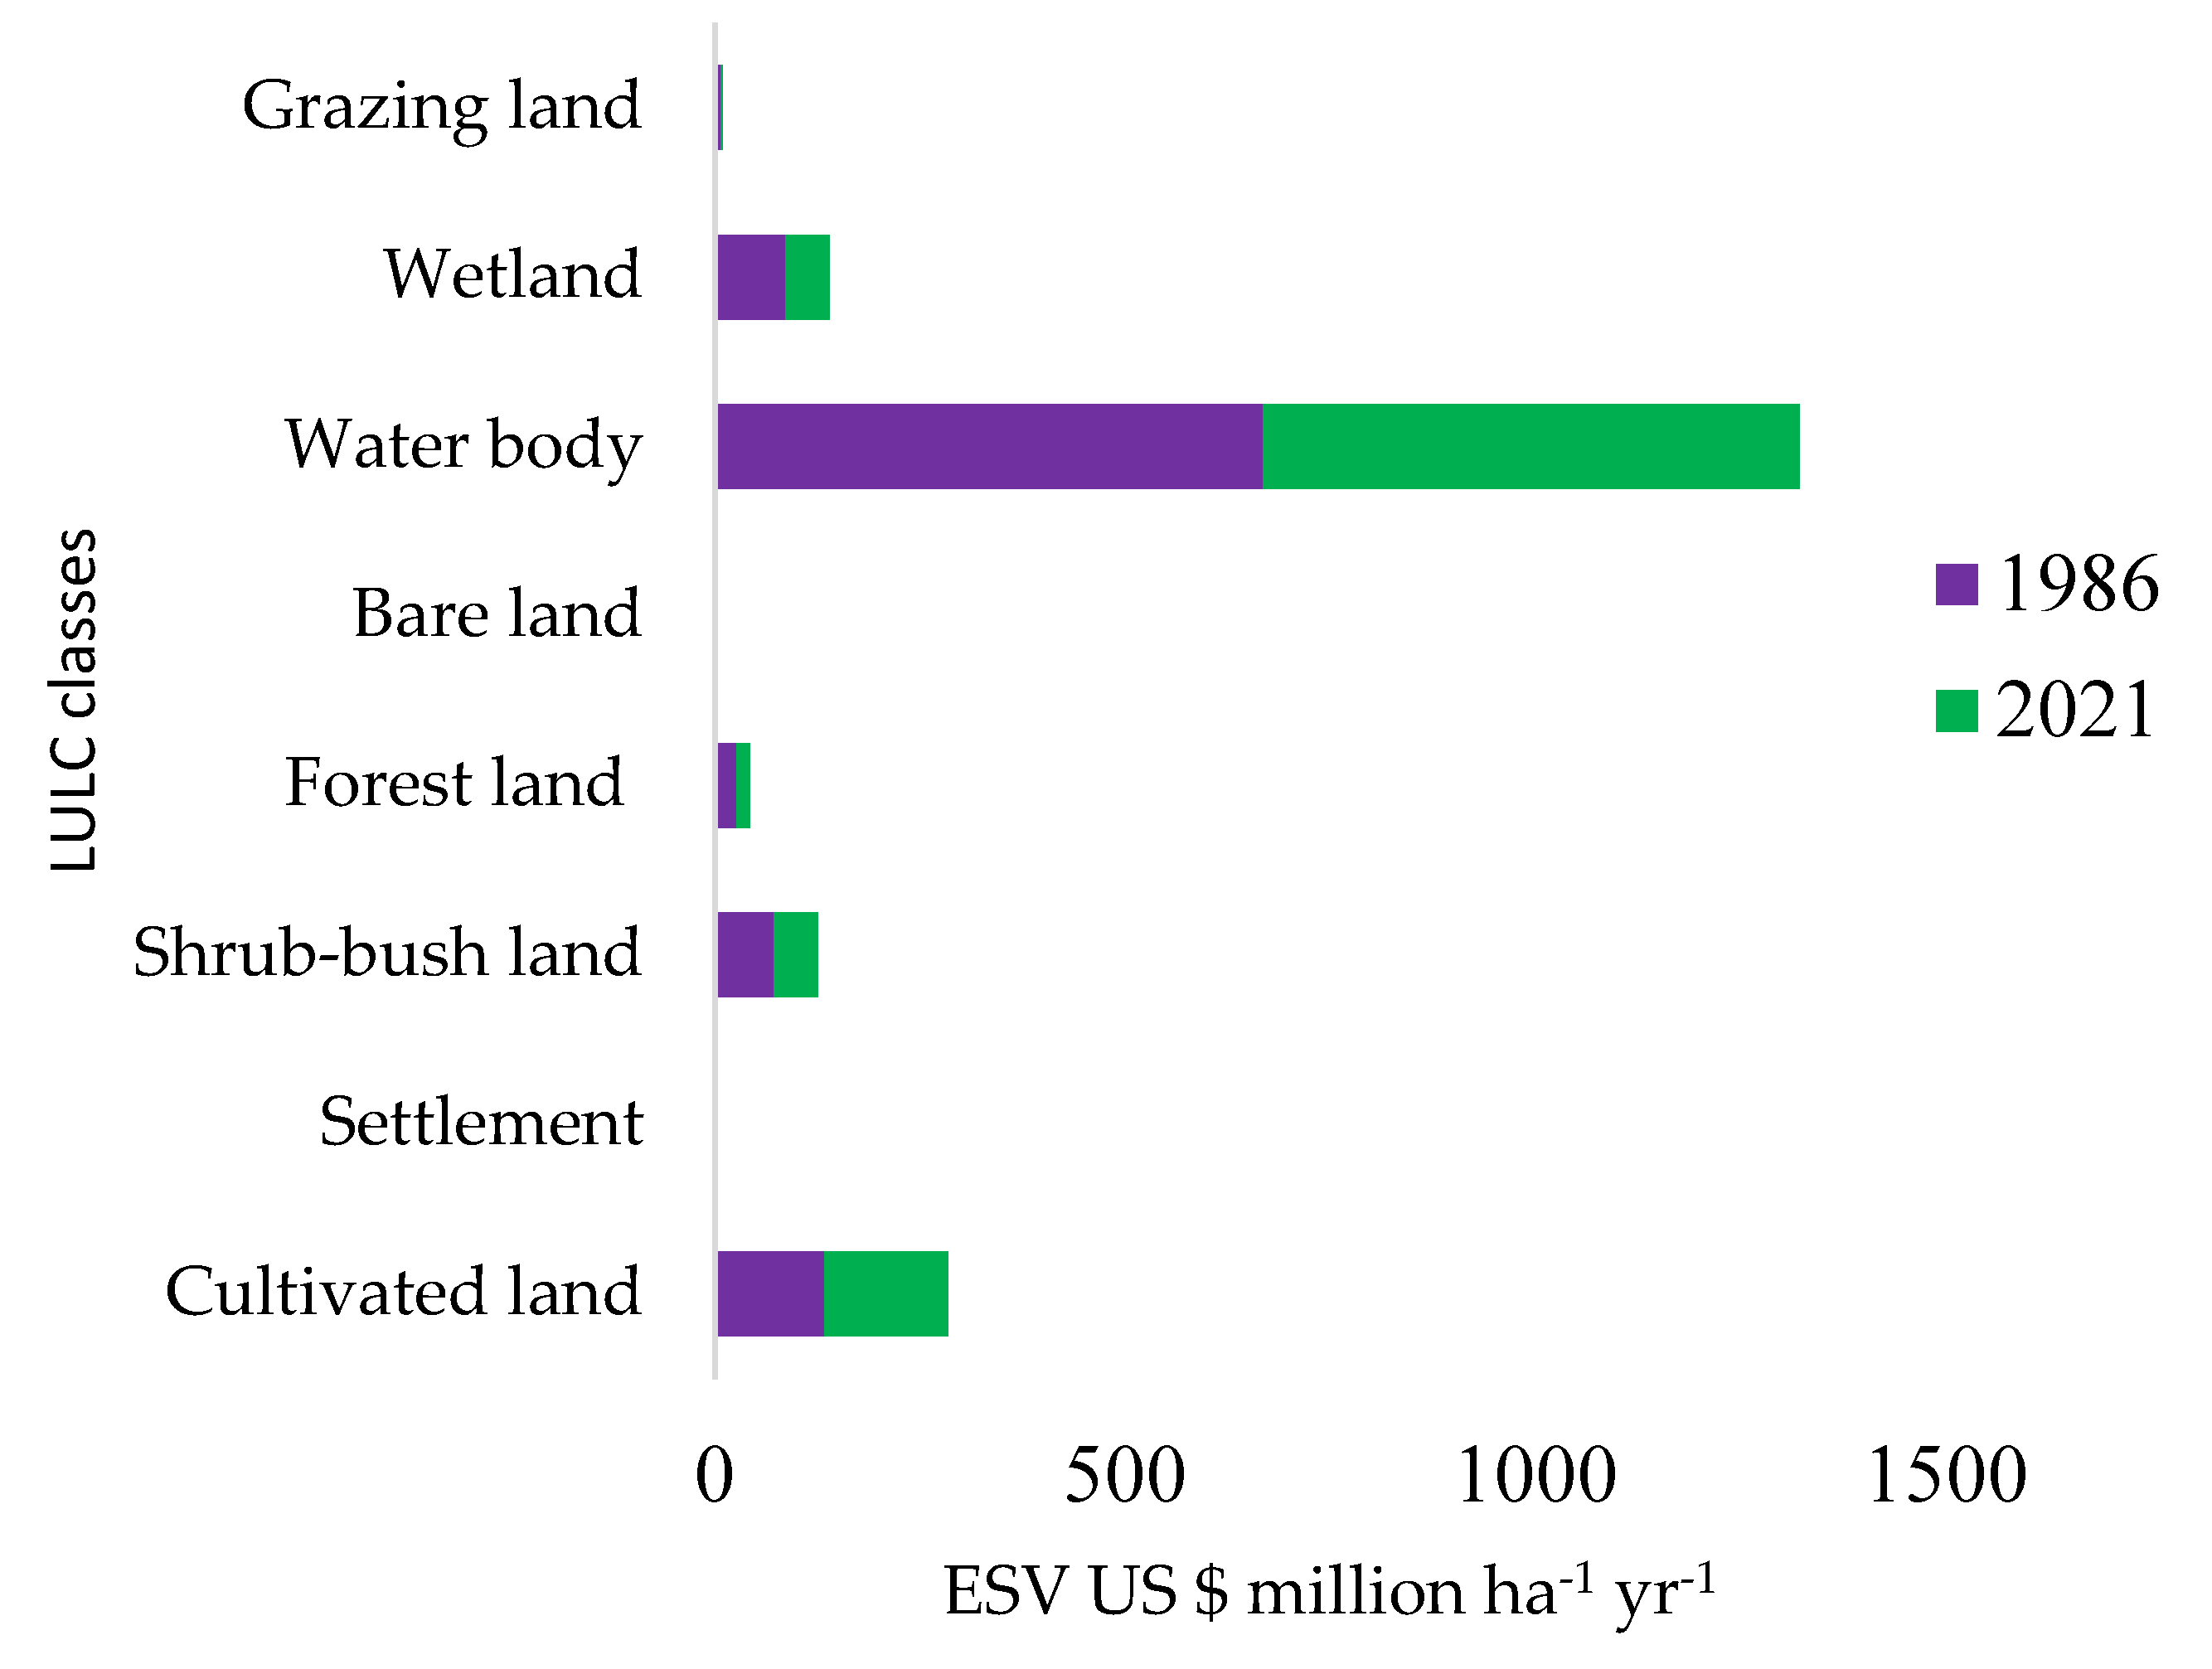
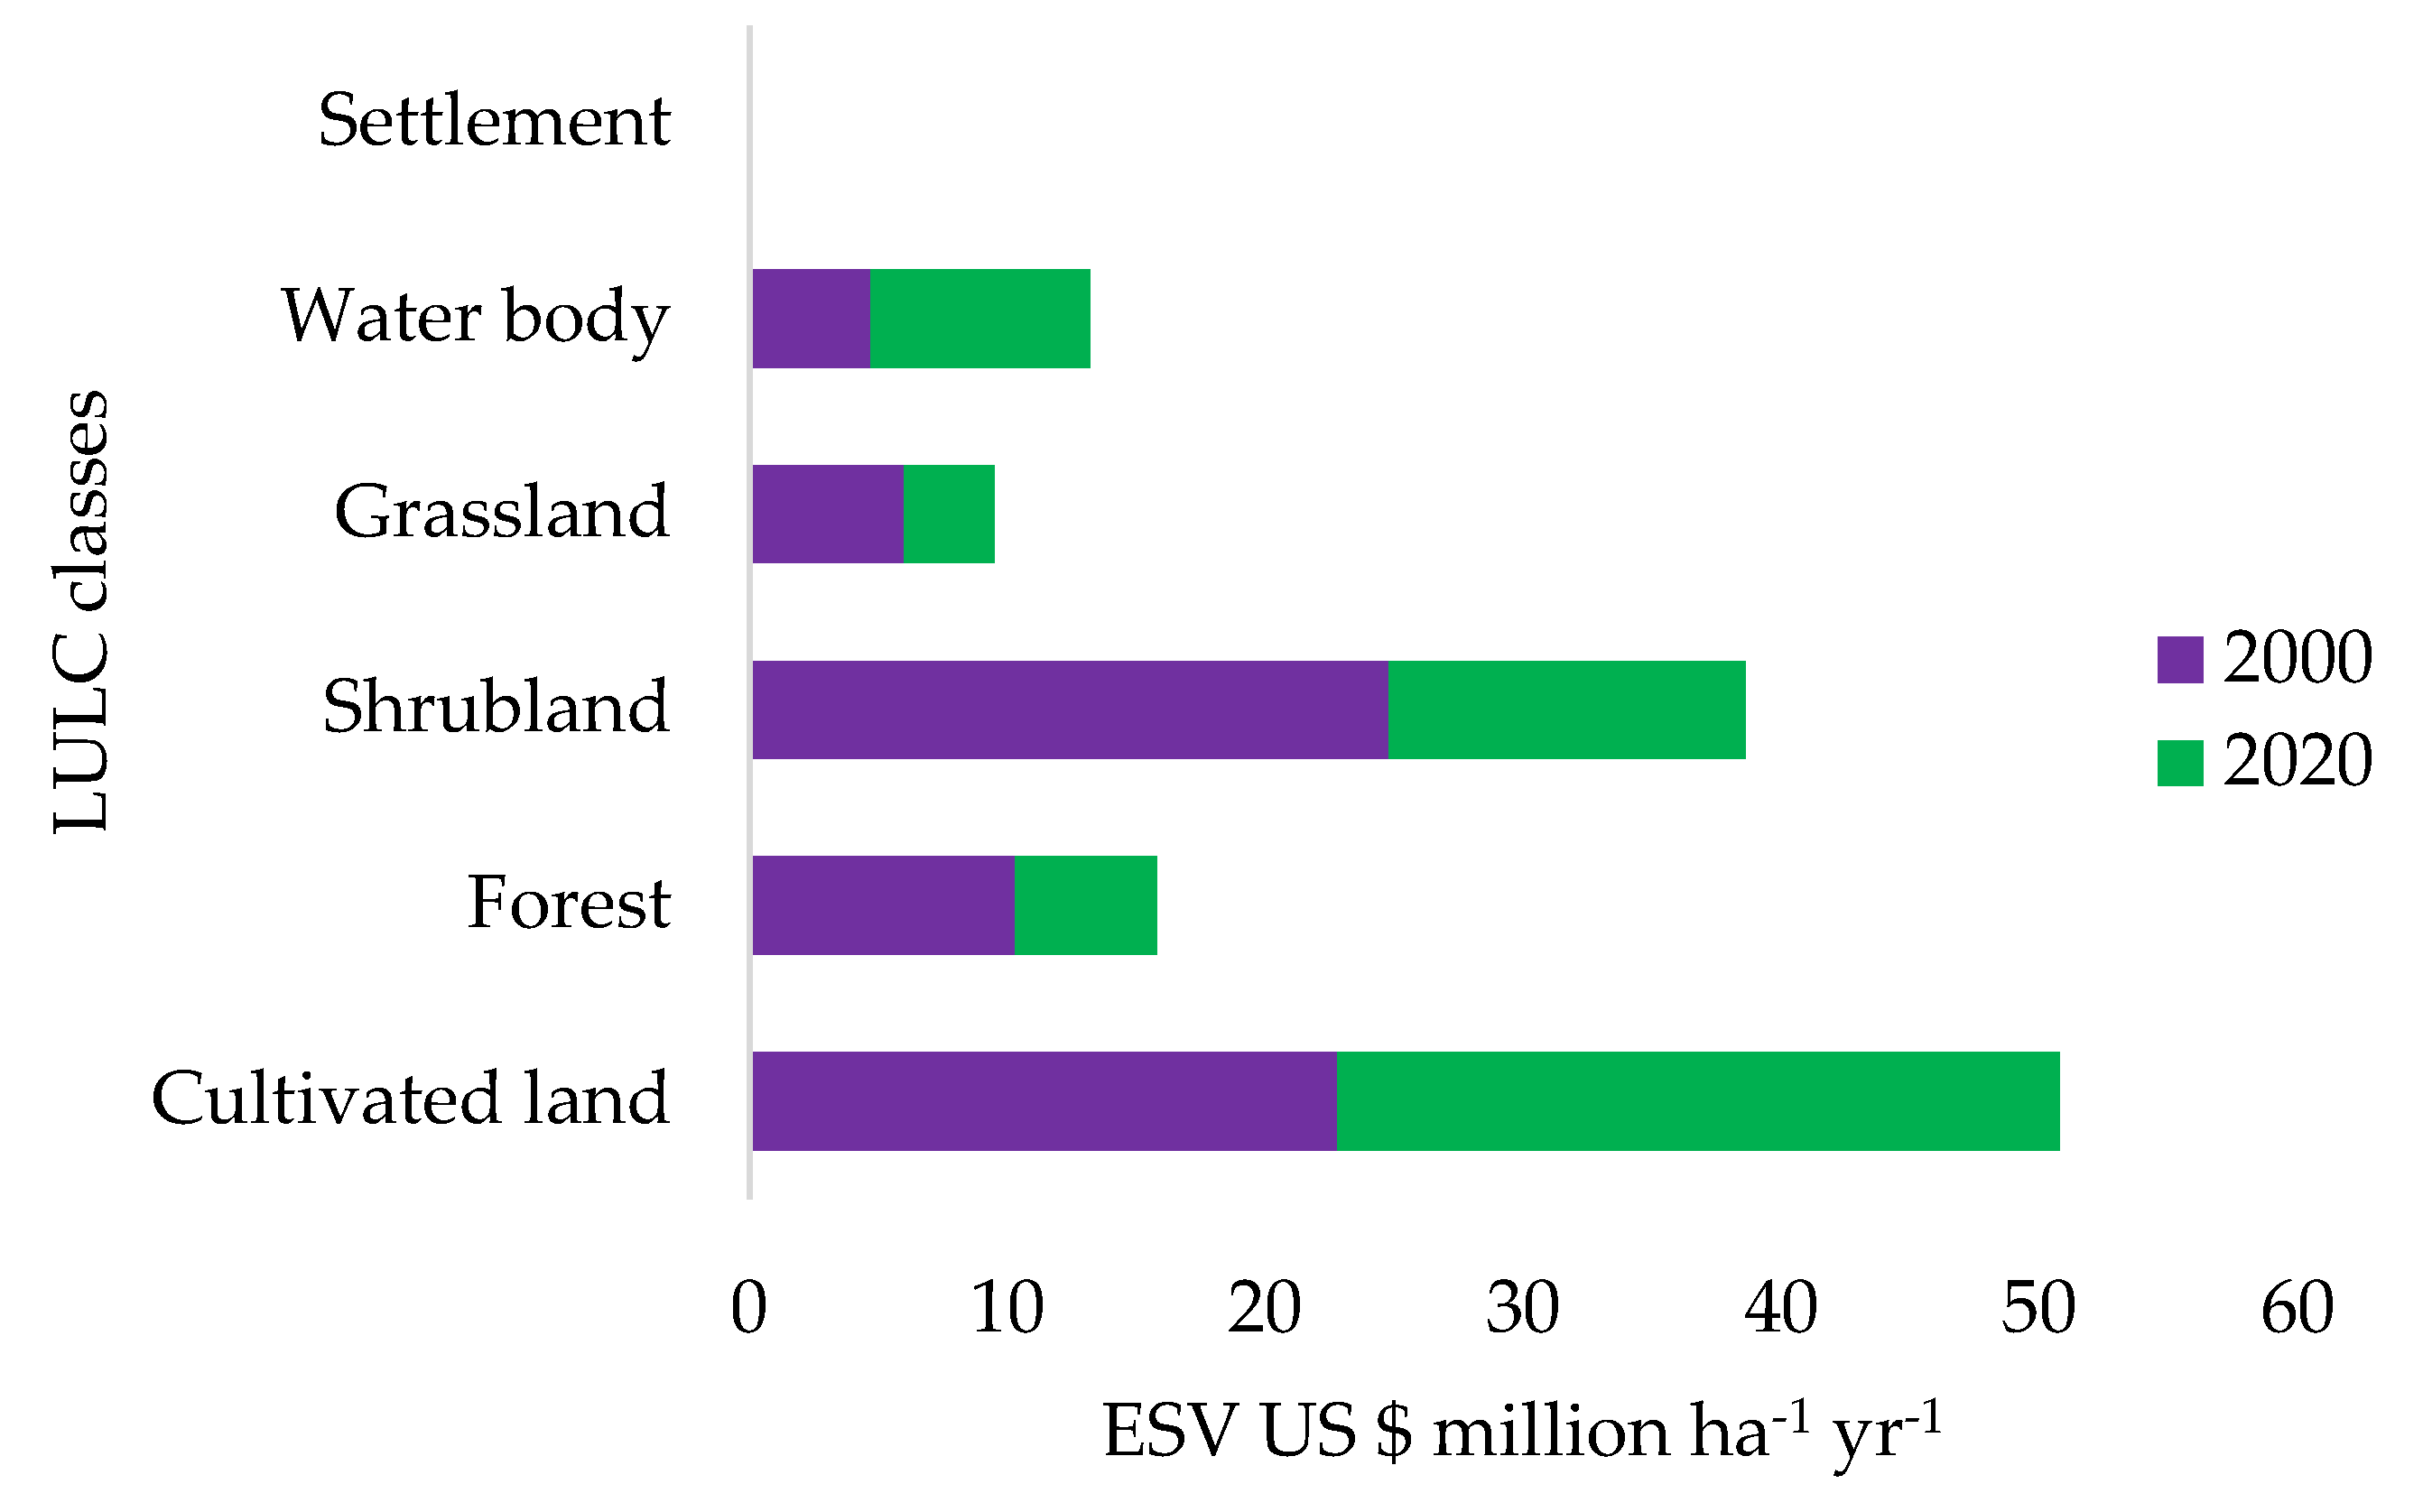
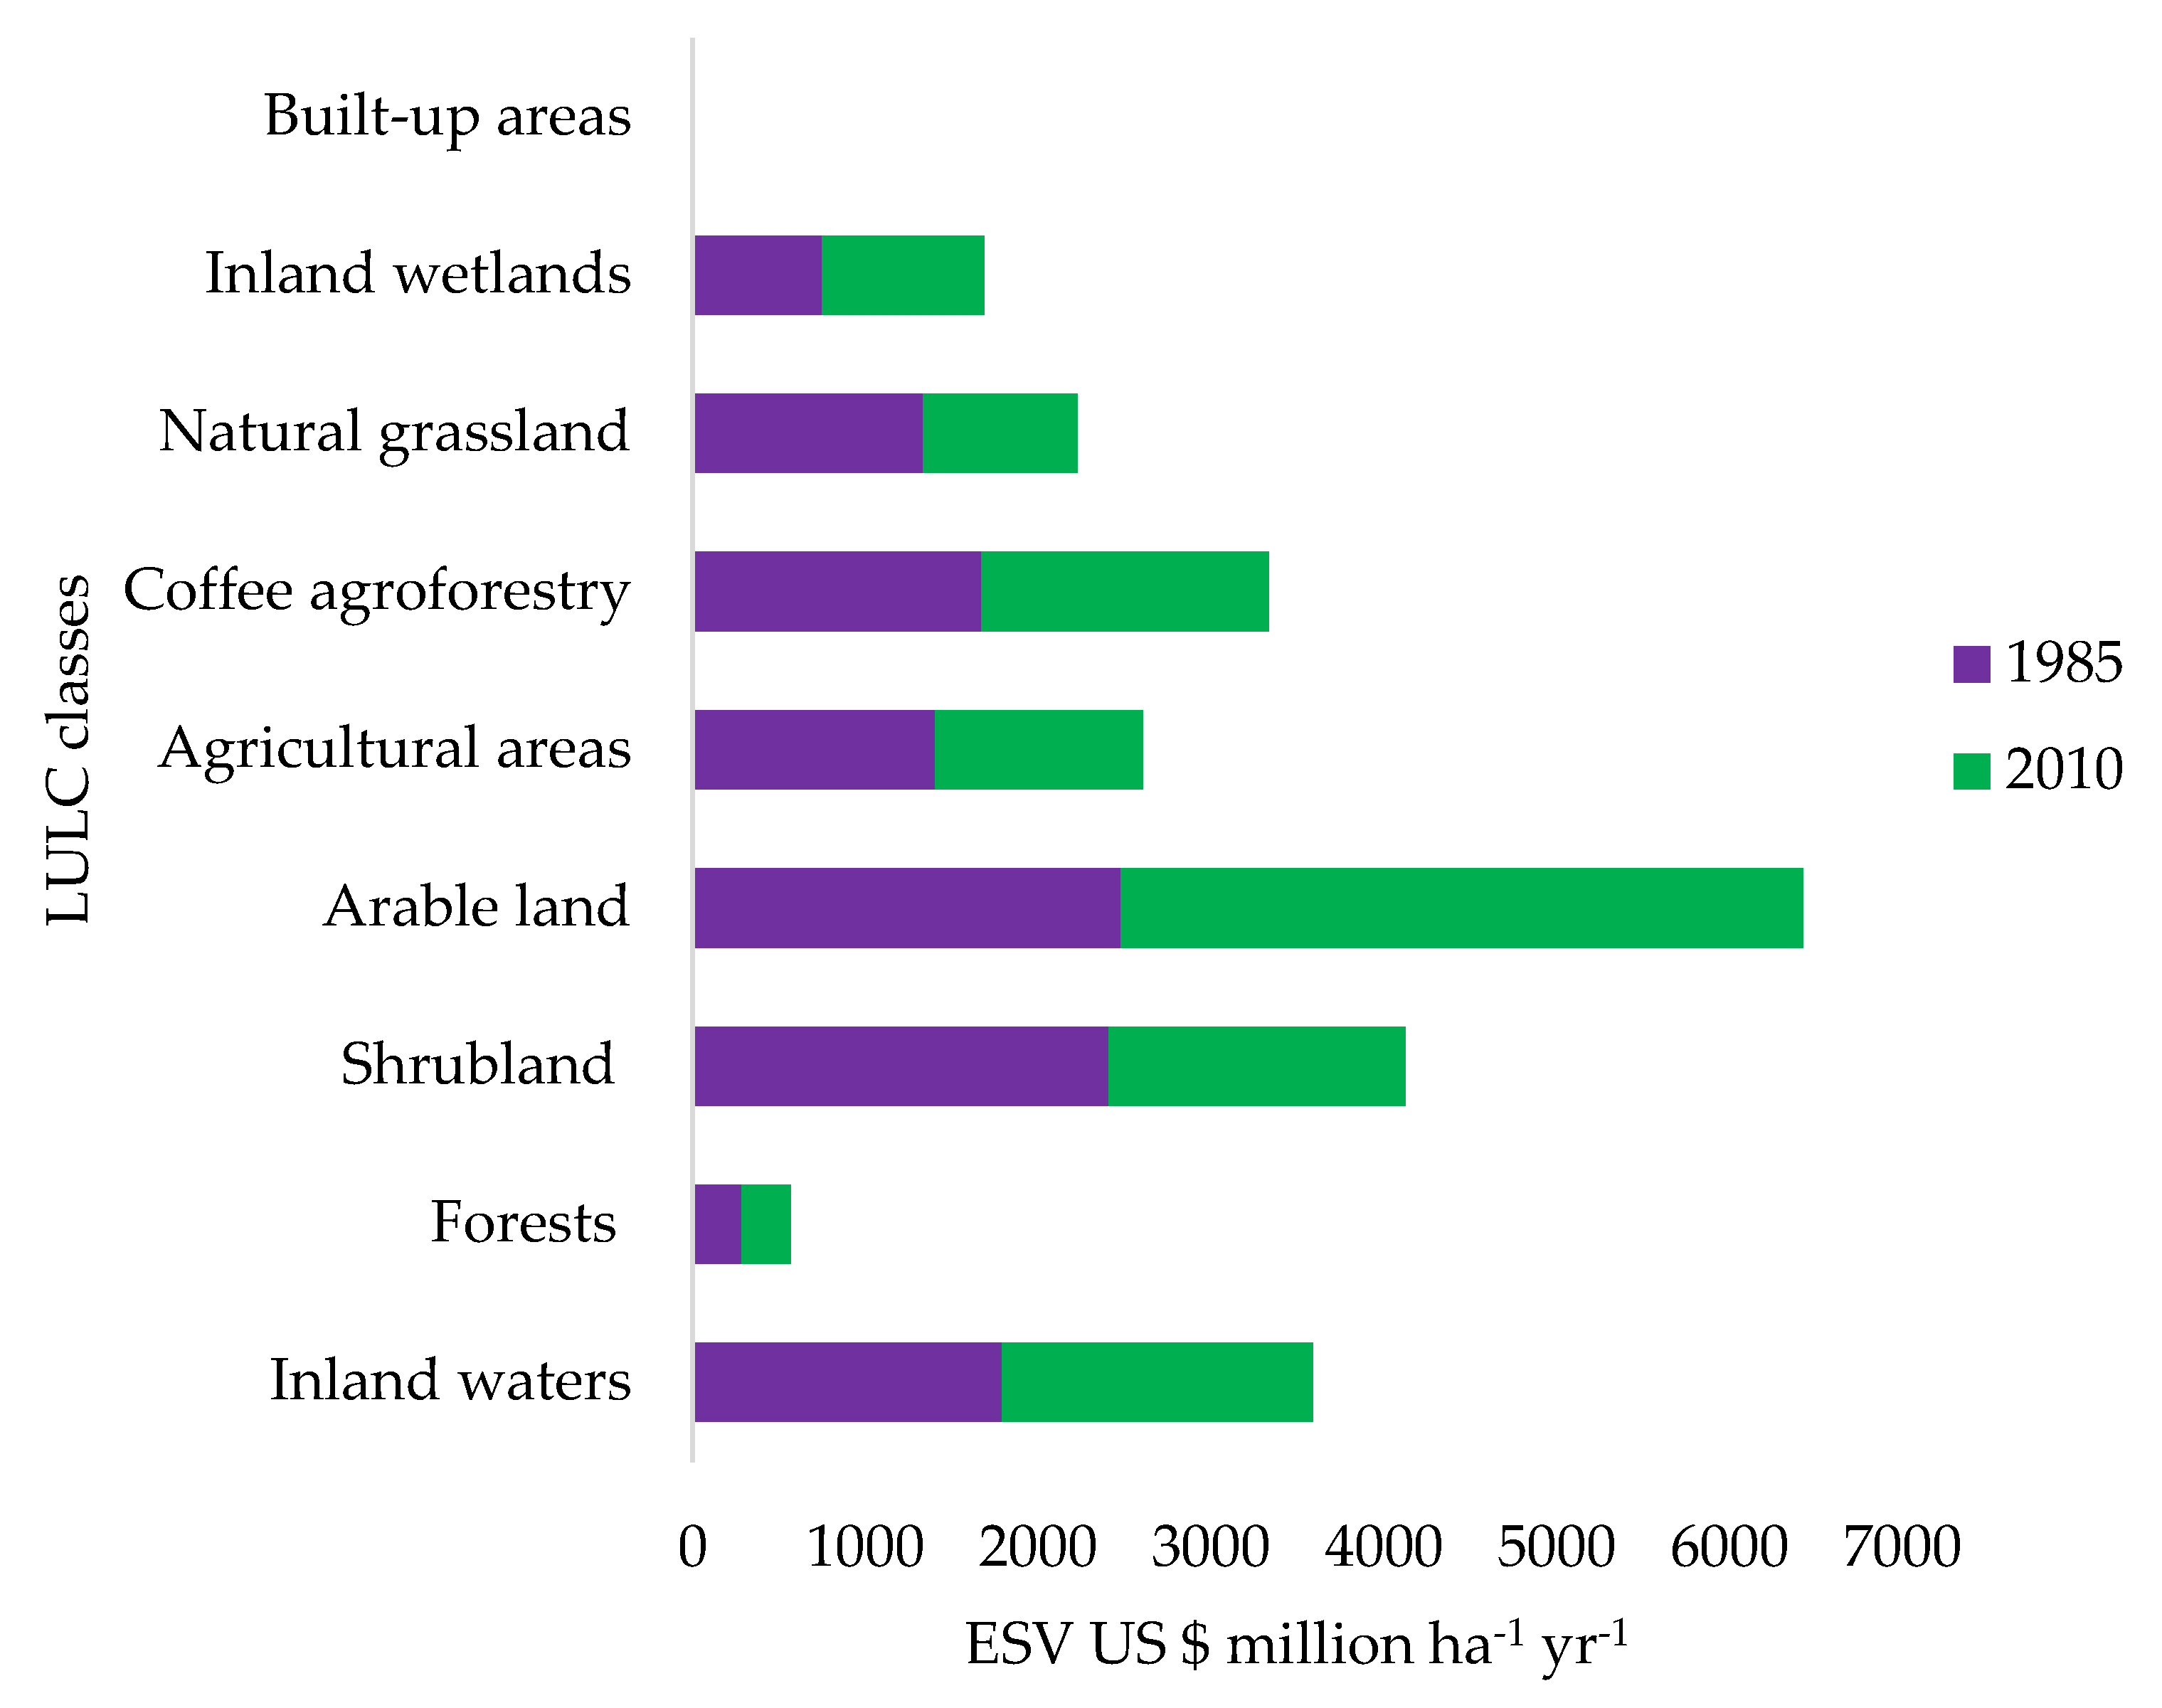
5.3. Ecosystem Service Value Changes
6. Discussion
7. Conclusions
Supplementary Materials
Author Contributions
Funding
Data Availability Statement
Conflicts of Interest
References
- Kindu, M.; Schneider, T.; Teketay, D.; Knoke, T. Changes of ecosystem service values in response to land use/land cover dynamics in Munessa-Shashemene landscape of the Ethiopian highlands. Sci. Total Environ. 2016, 547, 137–147. [Google Scholar] [CrossRef] [PubMed]
- Sutton, P.C.; Anderson, S.J.; Costanza, R.; Kubiszewski, I. The ecological economics of land degradation: Impacts on ecosystem service values. Ecol. Econ. 2016, 129, 182–192. [Google Scholar] [CrossRef]
- Costanza, R.; De Groot, R.; Braat, L.; Kubiszewski, I.; Fioramonti, L.; Sutton, P.; Farber, S.; Grasso, M. Twenty years of ecosystem services: How far have we come and how far do we still need to go? Ecosyst. Serv. 2017, 28, 1–16. [Google Scholar] [CrossRef]
- Kubiszewski, I.; Costanza, R.; Anderson, S.; Sutton, P. The future value of ecosystem services: Global scenarios and national implications. Ecosyst. Serv. 2017, 26, 289–301. [Google Scholar] [CrossRef]
- Tolessa, T.; Senbeta, F.; Kidane, M. The impact of land use/land cover change on ecosystem services in the central highlands of Ethiopia. Ecosyst. Serv. 2017, 23, 47–54. [Google Scholar] [CrossRef]
- Arowolo, A.O.; Deng, X.; Olatunji, O.A.; Obayelu, A.E. Assessing changes in the value of ecosystem services in response to land use/land cover dynamics in Nigeria. Sci. Total Environ. 2018, 636, 597–609. [Google Scholar] [CrossRef] [PubMed]
- Biedemariam, M.; Hadgu, K.M.; Fenta, A.A.; Aynekulu, E.; Gebrehiwot, K.; Birhane, E. Landscape level rehabilitation for improved agricultural productivity and ecosystem services in Abreha-We-Atsibeha, northern Ethiopia. J. Drylands 2017, 7, 633–643. [Google Scholar]
- Mekuria, W.; Veldkamp, E.; Corre, M.D.; Haile, M. Restoration of ecosystem carbon stocks following exclosure establishment in communal grazing lands in Tigray, Ethiopia. Soil Sci. Soc. Am. J. 2011, 75, 246–256. [Google Scholar] [CrossRef]
- Gashaw, T.; Tulu, T.; Argaw, M.; Worqlul, A.W.; Tolessa, T.; Kindu, M. Estimating the impacts of land use/land cover changes on Ecosystem Service Values: The case of the Andassa watershed in the Upper Blue Nile basin of Ethiopia. Ecosyst. Serv. 2018, 31, 219–228. [Google Scholar] [CrossRef]
- Mekuria, W.; Wondie, M.; Amare, T.; Wubet, A.; Feyisa, T.; Yitaferu, B. Restoration of degraded landscapes for ecosystem services in North-Western Ethiopia. Heliyon 2018, 4, e00764. [Google Scholar] [CrossRef] [Green Version]
- Nikodinoska, N.; Paletto, A.; Pastorella, F.; Granvik, M.; Franzese, P.P. Assessing, valuing and mapping ecosystem services at city level: The case of Uppsala (Sweden). Ecol. Model. 2018, 368, 411–424. [Google Scholar] [CrossRef]
- Wang, Y.; Dai, E.; Yin, L.; Ma, L. Land use/land cover change and the effects on ecosystem services in the Hengduan Mountain region, China. Ecosyst. Serv. 2018, 34, 55–67. [Google Scholar] [CrossRef]
- Sauter, I. The Effect of Land Use Change on Ecosystem Services in a Mountainous Region; Department of Environmental System Sciences Zuric, Research Unit Landscape Dynamics: WSL Birmensdorf, Switzerland, 2018. [Google Scholar]
- Arunyawat, S.; Shrestha, R.P. Assessing Land Use Change and Its Impact on Ecosystem Services in Northern Thailand. Sustainability 2016, 8, 768. [Google Scholar] [CrossRef] [Green Version]
- Zhu, S.; Huang, J.; Zhao, Y. Coupling coordination analysis of ecosystem services and urban development of resource-based cities: A case study of Tangshan city. Ecol. Indic. 2022, 136, 108706. [Google Scholar] [CrossRef]
- Sahle, M.; Saito, O.; Furst, C.; Demissew, S.; Yeshitela, K. Future land use management effects on ecosystem services under different scenarios in the Wabe River catchment of Gurage Mountain chain landscape, Ethiopia. Sustain. Sci. 2018, 14, 175–190. [Google Scholar] [CrossRef]
- Yi, H.; Guneralp, B.; Filippi, A.M.; Kreuter, U.P.; Guneralp, I. Impacts of land change on ecosystem services in the San Antonio River basin, Texas, from 1984 to 2010. Ecol. Econ. 2017, 135, 125–135. [Google Scholar] [CrossRef]
- Forster, J.; Barkmann, J.; Fricke, R.; Hotes, S.; Kleyer, M.; Kobbe, S.; Kubler, D.; Rumbaur, C.; Siegmund-Schultze, M.; Seppelt, R.; et al. Assessing ecosystem services for informing land use decisions: A problem-oriented approach. Ecol. Soc. 2015, 20, 31. [Google Scholar] [CrossRef] [Green Version]
- Moher, D.; Liberati, A.; Tetzlaff, J.; Altman, D.G.; Group, T.P. Preferred Reporting Items for Systematic Reviews and Meta-Analysis: The PRISMA statement (Reprinted from annals of internal medicine). Phys. Ther. 2009, 89, 873–880. [Google Scholar] [CrossRef]
- Han, H.; Yang, C.; Song, J. Scenario Simulation and the Prediction of Land Use and Land Cover Change in Beijing, China. Sustainability 2015, 7, 4260–4279. [Google Scholar] [CrossRef] [Green Version]
- Rawat, J.S.; Kumar, M. Monitoring land use/cover change using remote sensing and GIS techniques: A case study of Hawalbagh block, district Almora, Uttarakhand, India. Egypt. J. Remote Sens. Space Sci. 2015, 18, 77–84. [Google Scholar] [CrossRef] [Green Version]
- GFOI. Integration of Remote Sensing and Ground-Based Observations for Estimation of Emissions and Removals of Greenhouse Gases in Forests: Methods and Guidance from the Global Forest Observations Initiative, 2nd ed.; Food and Agriculture Organization: Rome, Italy, 2016. [Google Scholar]
- Lambin, E.F.; Geist, H.; Lepers, E. Dynamics of land use and land cover change in tropical regions. Annu. Rev. Environ. Resour. 2003, 28, 205–241. [Google Scholar] [CrossRef]
- Wu, X.; Wang, S.; Fu, B.; Zhu, Y. Land use optimization based on ecosystem services assessment: A case study in the Yanhe watershed. Land Use Policy 2018, 72, 303–312. [Google Scholar] [CrossRef]
- Hamza, I.A.; Iyela, A. Land use pattern, climate change, and its implication for food security in Ethiopia: A Review. Ethiop. J. Environ. Stud. Manag. 2012, 5, 26–31. [Google Scholar] [CrossRef]
- Tesfaw, A.T.; Pfaff, A.; Golden Kroner, R.E.; Qin, S.; Medeiros, R.; Mascia, M.B. Land-use and land-cover change shape the sustainability and impacts of protected areas. Proc. Natl. Acad. Sci. USA 2018, 115, 2084–2089. [Google Scholar] [CrossRef] [Green Version]
- Kleemann, J.; Baysal, G.; Bulley, H.N.N.; Furst, C. Assessing driving forces of land use and land cover change by a mixed-method approach in north-eastern Ghana, West Africa. J. Environ. Manag. 2017, 196, 411–442. [Google Scholar] [CrossRef]
- Chang, Y.; Hou, K.; Li, X.; Zhang, Y.; Chen, P. Review of Land use and Land Cover Change research progress. IOP Conf. Ser. Earth Environ. Sci. 2018, 113, 012087. [Google Scholar] [CrossRef]
- Haregeweyn, N.; Tesfaye, S.; Tsunekawa, A.; Tsubo, M.; Meshesha, D.; Ago, E.; Elias, A. Dynamics of land use and land cover and its effects on hydrologic responses: Case study of the Gilgel Tekeze catchment in the higlands of Northern Ethiopia. Environ. Monit. Assess. 2015, 187, 4090. [Google Scholar] [CrossRef] [PubMed]
- Maitima, J.M.; Mugatha, S.M.; Reid, R.S.; Gachimbi, L.N.; Majule, A.; Lyaruu, H.; Pomery, D.; Mathai, S.; Mugisha, S. The linkages between land use change, land degradation and biodiversity across East Africa. Afr. J. Environ. Sci. Technol. 2009, 3, 310–325. [Google Scholar]
- Yirsaw, E.; Wu, W.; Shi, X.; Temesgen, H.; Bekele, B. Land use/land cover change modeling and the prediction of subsequent change in ecosystem service values in a coastal area of China, the Su-Xi-Chang region. Sustainability 2017, 9, 1204. [Google Scholar] [CrossRef] [Green Version]
- Kates, R.W.; Torrie, R. Global Change in Local Places. Environ. Sci. Policy Sustain. Dev. 1998, 40, 5–6. [Google Scholar] [CrossRef]
- Perman, R.; Ma, Y.; McGilvray, J.; Common, M. Natural Resource and Environmental Economics, 3rd ed.; Pearson Education Limited: London, UK, 2003. [Google Scholar]
- United Nations (UN). Convention on Biological Diversity (CBD): Text of the Convention UNCED (United Nations Conference on Environment and Development); World Submit for Sustainable Development; United Nations: New York, NY, USA, 1992. [Google Scholar]
- Costanza, R.; d’Arge, R.; de Groot, R.; Farber, S.; Grasso, M.; Hannon, B.; Limburg, K.; Naeem, S.; O’Neill, R.V.; Paruelo, J.; et al. The value of the world’s ecosystem services and natural capital. Nature 1997, 387, 253–260. [Google Scholar] [CrossRef]
- Burkhard, B.; Maes, J. (Eds.) Mapping Ecosystem Services; Pensoft Publishers: Sofia, Bulgaria, 2017; p. 374. [Google Scholar]
- TEEB (The Economics of Ecosystems and Biodiversity). TEEB Synhesis Report: Mainstreaming the Economics of Ecosystems; UNEP: Geneva, Switzerland, 2010. [Google Scholar]
- Dunford, R.; Harrison, P.; Smith, A.; Dick, J.; Barton, D.N.; Martin-Lopez, B.; Kelemen, E.; Jacobs, S.; Saarikoski, H.; Turkelboom, F.; et al. Integrating methods for ecosystem service assessment: Experiences from real world situations. Ecosyst. Serv. 2018, 29, 499–514. [Google Scholar] [CrossRef]
- Bartkowski, B. Are diverse ecosystem services more valuable? Economic value of biodiversity as result of uncertainty and spatial interactions in ecosystem service provision. Ecosyst. Serv. 2017, 24, 50–57. [Google Scholar] [CrossRef]
- Costanza, R.; de Groot, R.; Sutton, P.; van der Ploeg, S.; Anderson, S.J.; Kubiszewski, I.; Farber, S.; Turner, R.K. Changes in the global value of ecosystem services. Glob. Environ. Change 2014, 26, 152–158. [Google Scholar] [CrossRef]
- Lagbas, A.J. Social valuation of regulating and cultural ecosystem services of Arroceros Forest Park: A man-made forest in the city of Manila, Philippines. J. Urban Manag. 2019, 8, 159–177. [Google Scholar] [CrossRef]
- Potschin, M.B.; Haines-Young, R.H. Ecosystem services: Exploring a geographical perspective. Prog. Phys. Geogr. 2011, 35, 575–594. [Google Scholar] [CrossRef]
- MEA (Millennium Ecosystem Assessment). Ecosystems and Human Wellbeing: Current State and Trends; Island Press: Washington, DC, USA, 2005; Volume 1. [Google Scholar]
- Gundimeda, H.; Markandya, A.; Bassi, A.M. TEEBAgriFood methodology: An overview of evaluation and valuation methods and tools. In TEEB for Agriculture; Food: Scientific and Economic Foundations; UN Environment: Geneva, Switzerland, 2018; Chapter 7; pp. 247–295. [Google Scholar]
- Chaudhary, S.; Tshering, D.; Phuntsho, T.; Uddin, K.; Shakya, B.; Chettri, N. Impact of land cover change on a mountain ecosystem and its services: Case study from the Phobjikha valley, Bhutan. Ecosyst. Health Sustain. 2017, 3, 1393314. [Google Scholar] [CrossRef] [Green Version]
- Montoya-Tangarife, C.; de la Barrera, F.; Salazar, A.; Inostroza, L. Monitoring the effects of land cover change on the supply of ecosystem services in urban region: A study of Santiago-Valparaiso, Chile. PLoS ONE 2017, 12, e0188117. [Google Scholar] [CrossRef] [Green Version]
- Lemessa, D.; Woldeyes, F.; Maryo, M.; Tessema, M.; Didita, M. (Eds.) National Ecosystem Assessment of Ethiopia: Syntheses of the Status of Biodiversity and Ecosystem Services, and Scenarios of Change; Ethiopian Biodiversity Institute: Addis Ababa, Ethiopia, 2022. [Google Scholar]
- Crespin, S.J.; Simonetti, J.A. Loss of ecosystem services and the decapitalization of nature in El Salvador. Ecosyst. Serv. 2016, 17, 5–13. [Google Scholar] [CrossRef]
- Hassan, M.M. Monitoring land use/cover change, urban growth dynamics and landscape pattern analysis in five fastest urbanized cities in bangladesh. Remote Sens. Appl. Soc. Environ. 2017, 7, 69–83. [Google Scholar] [CrossRef]
- Harrison, P.A.; Dunford, R.; Barton, D.N.; Kelemen, E.; Martin-Lopez, B.; Norton, L.; Termansen, M.; Saarikoski, H.; Hendriks, K.; Gómez-Baggethun, E.; et al. Selecting methods for ecosystem service assessment: A decision tree approach. Ecosyst. Serv. 2018, 29, 481–498. [Google Scholar] [CrossRef] [Green Version]
- Alarcon, G.G.; de Freitas, L.A.; dos, S.; da Fountoura, G.O.; de Macedo, C.X.; Riberio, D.C. The challenges of implementing a legal framework for payment for ecosystem services in Santa Catarina. Braz. J. Nat. Conserv. 2016, 2, 132–136. [Google Scholar] [CrossRef]
- Johnston, R.J.; Rolfe, J.; Rosenberger, R.S.; Brouwer, R. (Eds.) Benefit Transfer of Environmental and Resource Values; A Guide for Researchers and Practitioners; Springer Science+Business Media: Drodrecht, The Netherlands, 2015. [Google Scholar]
- Cabral, P.; Feger, C.; Levrel, H.; Chambolle, M.; Basque, D. Assessing the impact of land cover changes on ecosystem service: A first stp toward integrative planning in Bordeaux, France. Ecosyst. Serv. 2016, 22, 318–327. [Google Scholar] [CrossRef] [Green Version]
- Kreuter, U.P.; Harris, H.G.; Matlock, M.D.; Lacey, R.E. Change in ecosystem services values in the san antonio area, Texas. Ecol. Econ. 2001, 39, 333–346. [Google Scholar] [CrossRef]
- Li, R.Q.; Dong, M.; Cui, J.Y.; Zhang, L.L.; Cui, Q.G.; He, W.M. Quantification of the impact of land-use changes on ecosystem services: A case study in Pingbian County, China. Environ. Monit. Assess. 2007, 128, 503–510. [Google Scholar] [CrossRef]
- Tolessa, T.; Senbeta, T.T.; Abebe, T. Land use/land cover analysis and ecosystem services valuation in the central highlands of Ethiopia. For. Trees Livelihoods 2017, 26, 111–123. [Google Scholar] [CrossRef]
- Quintas-Soriano, C.; Castro, A.J.; Castro, H.; García-Llorente, M. Impacts of land use change on ecosystem services and implications for human well-being in Spanish drylands. Land Use Policy 2016, 54, 534–548. [Google Scholar] [CrossRef]
- Camacho, W.; Ruiz-Luna, A.; Bertanga-Robles, A.C. Effects of Land Use on Ecosystem Services Value Provided by Coastal Wettlands: Recent and Future Landscape Scenarios. J. Coast. Zone Manag. 2016, 19, 418. [Google Scholar]
- Duraisamy, V.; Bendapudi, R.; Jadhav, A. Identifying hotspots in land use land cover change and the drivers in a semi-arid region of India. Environ. Monit. Assess. 2018, 190, 535. [Google Scholar] [CrossRef] [Green Version]
- Anaya-Romero, M.; Unoz-Rojas, M.; Ibanez, B.; Maranon, T. Evaluation of forest ecosystem services in Mediterranean areas. A regional case study in South Spain. Ecosyst. Serv. 2016, 20, 82–90. [Google Scholar] [CrossRef]
- Wang, Y.; Gao, J.; Wang, J.; Qiu, J.; Bond-Lamberty, B. Value assessment of ecosystem services in nature reserves in Ningxia, China: A response to ecological restoration. PLoS ONE 2014, 9, e89174. [Google Scholar] [CrossRef]
- Lin, X.; Xu, M.; Cao, C.; Singh, R.P.; Chen, W.; Ju, H. Land use/land cover changes and their influence on the ecosystem in Chengdu City, China during the period of 1992–2018. Sustainability 2018, 10, 3580. [Google Scholar] [CrossRef] [Green Version]
- Rai, R.; Zhang, Y.; Paudel, B.; Acharya, B.K.; Basnet, L. Land use and land cover dynamics and assessing the ecosystem service values in the trans-boundary Gandaki River Basin, Central Himalayas. Sustainability 2018, 10, 3052. [Google Scholar] [CrossRef]
- Locatelli, B.; Lavorel, S.; Sloan, S.; Tappeiner, U.; Geneletti, D. Characteristic trajectories of ecosystem services in mountains. Front. Ecol. Environ. 2017, 15, 150–159. [Google Scholar] [CrossRef]
- Polasky, S.; Nelson, E.; Pennington, D.; Johnson, K.A. The impact of land use change pn ecosystem services, biodiversity and returns to landowners: A case study in the state of Minnesota. Environ. Resour. Econ. 2011, 48, 219–242. [Google Scholar] [CrossRef]
- Adhikari, S.; Adhikari, A.; Weaver, D.K.; Bekkerman, A.; Menalled, F.D. Impacts of Agricultural Management Systems on Biodiversity and Ecosystem Services in Highly Simplified Dryland Landscapes. Sustainability 2019, 11, 3223. [Google Scholar] [CrossRef] [Green Version]
- Nelson, E.J.; Kareiva, P.; Ruckelshaus, M.; Arkema, K.; Geller, G.; Girvetz, E.; Goodrich, D.; Matzek, V.; Pinsky, M.; Reid, W. Climate change’s impact on key ecosystem services and the human well-being they support in the US. Front. Ecol. Environ. 2013, 11, 483–493. [Google Scholar] [CrossRef] [Green Version]
- Sintayehu, D.W. Impact of climate change on biodiversity and associated key ecosystem services in Africa: A systemic review. Ecosyst. Health Sustain. 2018, 4, 225–239. [Google Scholar] [CrossRef] [Green Version]
- Dagnew, D.C.; Guzman, C.D.; Zegeye, A.D.; Akal, A.T.; Moges, M.A.; Tebebu, T.Y.; Mekuria, W.; Ayana, E.K.; Tilahun, S.A.; Steenhuis, T.S. Sediment loss patterns in the sub-humid Ethiopian highlands. Land Degrad. Dev. 2017, 28, 1795–1805. [Google Scholar] [CrossRef]
- Mekuria, W.; Langan, S.; Noble, A.; Johnston, R. Soil restoration after seven years of exclosure management in northwestern Ethiopia. Land Degrad. Dev. 2017, 28, 1287–1297. [Google Scholar] [CrossRef]
- Biratu, A.A.; Bedadi, B.; Gebrehiwet, S.G.; Melesse, A.M.; Nebi, T.H.; Abera, W.; Tamene, L.; Egeru, A. Ecosystem service valuation along landscape transformation in Central Ethiopia. Land 2022, 11, 500. [Google Scholar] [CrossRef]
- Anley, M.A.; Minale, A.S.; Haregeweyn, N.; Gashaw, T. Assessing the impacts of land use/cover changes on ecosystem service values in Rib watershed, Upper Blue Nile Basin, Ethiopia. Trees For. People 2022, 7, 100212. [Google Scholar] [CrossRef]
- Woldeyohannes, A.; Cotter, M.; Biru, W.; Kelboro, G. Assessing changes in ecosystem service values over 1985–2050 in response to land use and land cover dynamics in Abaya-Chamo Basin, Southern Ethiopia. Land 2020, 9, 37. [Google Scholar] [CrossRef]
- Dube, A.K.; Fawole, W.O.; Govindasamy, R.; Ozkan, B. Agricultural development led industrialization in Ethiopia: Structural break analysis. Int. J. Agric. For. Life Sci. 2019, 3, 193–201. [Google Scholar]
- Guush, B.; Mekidm, D.; Minten, B.; Seneshaw, T. The Rapid but from a Low Base Uptake of Agricultural Mechanization in Ethiopia: Patterns, Implications and Challenges; International Food Policy Research Institute: Washington, DC, USA, 2017. [Google Scholar]
- Government of the Federal Democratic Republic of Ethiopia. Rural Development Policy; Ministry of Agriculture and Natural Resources: Addis Ababa, Ethiopia; pp. 1–74.
- DeFries, R.S.; Rudel, T.; Uriarte, M.; Hansen, M. Deforestation driven by urban population growth and agricultural trade in the twenty-first century. Nat. Geosci. 2010, 3, 178–181. [Google Scholar] [CrossRef]
- Duguma, L.A.; Atela, J.; Minang, P.A.; Ayana, A.N.; Gizachew, B.; Nzyoka, J.M.; Bernard, F. Deforestation and forest degradation as an environmental behavior: Unpacking realities shaping community actions. Land 2019, 8, 26. [Google Scholar] [CrossRef] [Green Version]
- Woldie, T.M.; Birhane, E. Enhancing climate-smart forest management in Sub-Saharan Africa. In Climate Smart Agriculture: Enhancing Resilient Agricultural Systems, Landscapes, and Livelihoods in Ethiopia and Beyond; Hadgu, K.M., Bishaw, B., Liyma, M., Birhane, E., Negussie, A., Davis, C.M., Bernart, B., Eds.; World Agroforestry (ICRAF): Nairobi, Kenya, 2019. [Google Scholar]
- Degife, A.W.; Mauser, W. Socio-economic and environmental impacts of large-scale agricultural investment in Gambella region, Ethiopia. J. US-China Public Adm. 2018, 14, 183–197. [Google Scholar]
- Song, W.; Deng, X. Land use/land cover change and ecosystem service provision in China. Sci. Total Environ. 2017, 15, 705–719. [Google Scholar] [CrossRef]


| Study Area of the Reviewed Paper | Region of the Study Area | Climatic Zone | Temporal Aspects |
|---|---|---|---|
| Andassa watershed in the Upper Blue Nile Basin of Ethiopia | Amhara regional state of Ethiopia | Highly sub-tropical (85.2%) with a small portion of temperate climate (14.8%) | 1985 to 2015 |
| Munessa-Shashemene landscape of the Ethiopian highlands | Oromia National Regional State of Ethiopia | Tropical dry Afromontane forest | 1973 to 2012 |
| Toke Kutaye district of West Shewa | Oromia National Regional State of Ethiopia | Part of the Central Highlands of Ethiopia | 1973 to 2014 |
| Rib watershed in the Upper Blue Nile Basin | Amhara regional state of Ethiopia, which stretches from mount Guna to the Eastern shore of lake Tana | Sub-tropical (64.4%), temperate (33.6%), alpine (2%) | 2000 to 2020 |
| Abay-Chamo basin in Southern Ethiopia | Southern Nations, Nationalities and Peoples’ (SNNP) Region and, to a lesser extent, in the Oromia Region of Ethiopia | Humid climate in the mountainous highlands and a hot semiarid tropical climate in the lowlands | 1985 to 2010 |
| Chillimo forest area in Central highlands of Ethiopia | Oromia National Regional State of Ethiopia | Dry Afromontane forest | 1973 to 2015 |
| Chilalo-Galama Mountains | Oromia National Regional State of Ethiopia | Humid and sub-humid in the highlands and semiarid at some part of the study area | 1986 to 2021 |
Publisher’s Note: MDPI stays neutral with regard to jurisdictional claims in published maps and institutional affiliations. |
© 2022 by the authors. Licensee MDPI, Basel, Switzerland. This article is an open access article distributed under the terms and conditions of the Creative Commons Attribution (CC BY) license (https://creativecommons.org/licenses/by/4.0/).
Share and Cite
Biedemariam, M.; Birhane, E.; Demissie, B.; Tadesse, T.; Gebresamuel, G.; Habtu, S. Ecosystem Service Values as Related to Land Use and Land Cover Changes in Ethiopia: A Review. Land 2022, 11, 2212. https://doi.org/10.3390/land11122212
Biedemariam M, Birhane E, Demissie B, Tadesse T, Gebresamuel G, Habtu S. Ecosystem Service Values as Related to Land Use and Land Cover Changes in Ethiopia: A Review. Land. 2022; 11(12):2212. https://doi.org/10.3390/land11122212
Chicago/Turabian StyleBiedemariam, Muluberhan, Emiru Birhane, Biadgilgn Demissie, Tewodros Tadesse, Girmay Gebresamuel, and Solomon Habtu. 2022. "Ecosystem Service Values as Related to Land Use and Land Cover Changes in Ethiopia: A Review" Land 11, no. 12: 2212. https://doi.org/10.3390/land11122212