1. Introduction
The drastic processes of regional land use transition have profoundly modified the structure and function of ecosystems and spawned a suite of environmental problems, such as pollution, land degradation, and the loss of biodiversity [
1,
2,
3,
4,
5]. Land use transition refers to those changes in the temporal sequence of national/regional land use patterns (including dominant and recessive patterns) during a certain period that are promoted by socio-economic development [
6,
7,
8]. This land use pattern is representative of land use functions, so the transformation of major land use functioning (i.e., the production, living, and ecological function) can be treated as the main characteristic of land use transition [
9]. Accordingly, the quantitative and spatial structure changes in land use can reflect the corresponding conversions among the three land use functions [
10]. Given the optimization goal of the “production-living-ecological spaces” (PLES)—which entails intensive production space, livable living space, and beautiful ecological space—put forward by the government of China in 2012, its mode of development dominated by the focus on the expanding construction land will switch to one emphasizing more coupled, coordinated, and sustainable development [
11,
12,
13]. Actually, this optimization goal aligns well with the transition goal of land use functions, which enables both theoretical research and the empirical study of land use transition to become more closely integrated with the rational layout and optimal allocation of PLES [
10,
14].
The PLES concept is not merely a division of regional space, but it actually represents explicit functions. Accordingly, an imbalance within the PLES can reflect chaos in space (disorderly state) and this is now one of the main drivers of environmental pollution and ecological degradation [
15,
16]. For example, the urban expansion based on the occupation of ecological space has severely impacted the eco-environment in a negative way [
17,
18,
19]. As such, analyzing the eco-environmental effects caused by land use transition from the perspective of the PLES may foster a better coordination of the socio-economic development and eco-environment protection. Many scholars recognize that land use transition has played an important role in resulting ecological changes, which is directly related to the development of the economy and society, as well as the optimization of environment and human well-being [
20,
21,
22]. Contemporary studies of eco-environmental effects caused by land use transition can be divided into two main domains: (1) those that analyze the effects of single environmental elements, such as the water environment [
23], soil environment [
24], atmospheric environment [
25], and climatic hazards [
26], etc.; and (2) those in which the researcher constructs various indices to gauge ecosystem quality based on the land use cover change, by relying on methods and tools such as a valuation of ecosystem services [
27,
28], landscape ecological risk index [
29,
30,
31], eco-environmental quality index [
32,
33,
34], and habitat quality index [
35,
36], etc. Among them, according to the ecological differences of land use types, the eco-environmental quality assessment evaluates the ecological quality of place by assigning values to its secondary land use types, thereby trying to express the impact on the environmental quality arising from changes in the quantitative structure of land use caused by land use transition [
5]. The evaluation of landscape ecological risk, however, analyzes how changes in land use spatial structure may affect regional ecological risk via the use of landscape pattern indices. Previous researchers focused on the eco-environment quality or landscape ecological risk from a single perspective, but rarely are both aspects combined. Furthermore, a regional ecosystem, irrespective of its size (area), is always part of a larger system or influenced by another nearby; hence, the overall situation of a specific ecosystem depends not only on its own attributes but also external interference from one or more other ecosystems or unpredictable factors [
37,
38].
Based on these considerations, here we try to combine eco-environmental quality and landscape ecological risk to theoretically analyze the eco-environmental effects more comprehensively, and to explore differences in the spatial distribution of eco-environmental quality and landscape ecological risk, which are generally lacking in the literature. In addition, guided by existing relevant studies, we sought to construct a comprehensive theoretical analysis framework, in order to provide a new and timely research framework for future ecological environment research on land use transition. Guided by theoretical analysis, the empirical study of typical regions as represented by Guangxi was carried out here. Guangxi has a relatively fragile eco-environment because of its inner complex terrain, especially when viewed under the influence of accelerated urbanization and industrialization processes in recent years. Thus, the aim of this work is to provide more scientific references for the improved coordination of regional land use and environmental protection.
2. Theoretical Analysis Framework of Eco-Environmental Effects of Land Use Transition
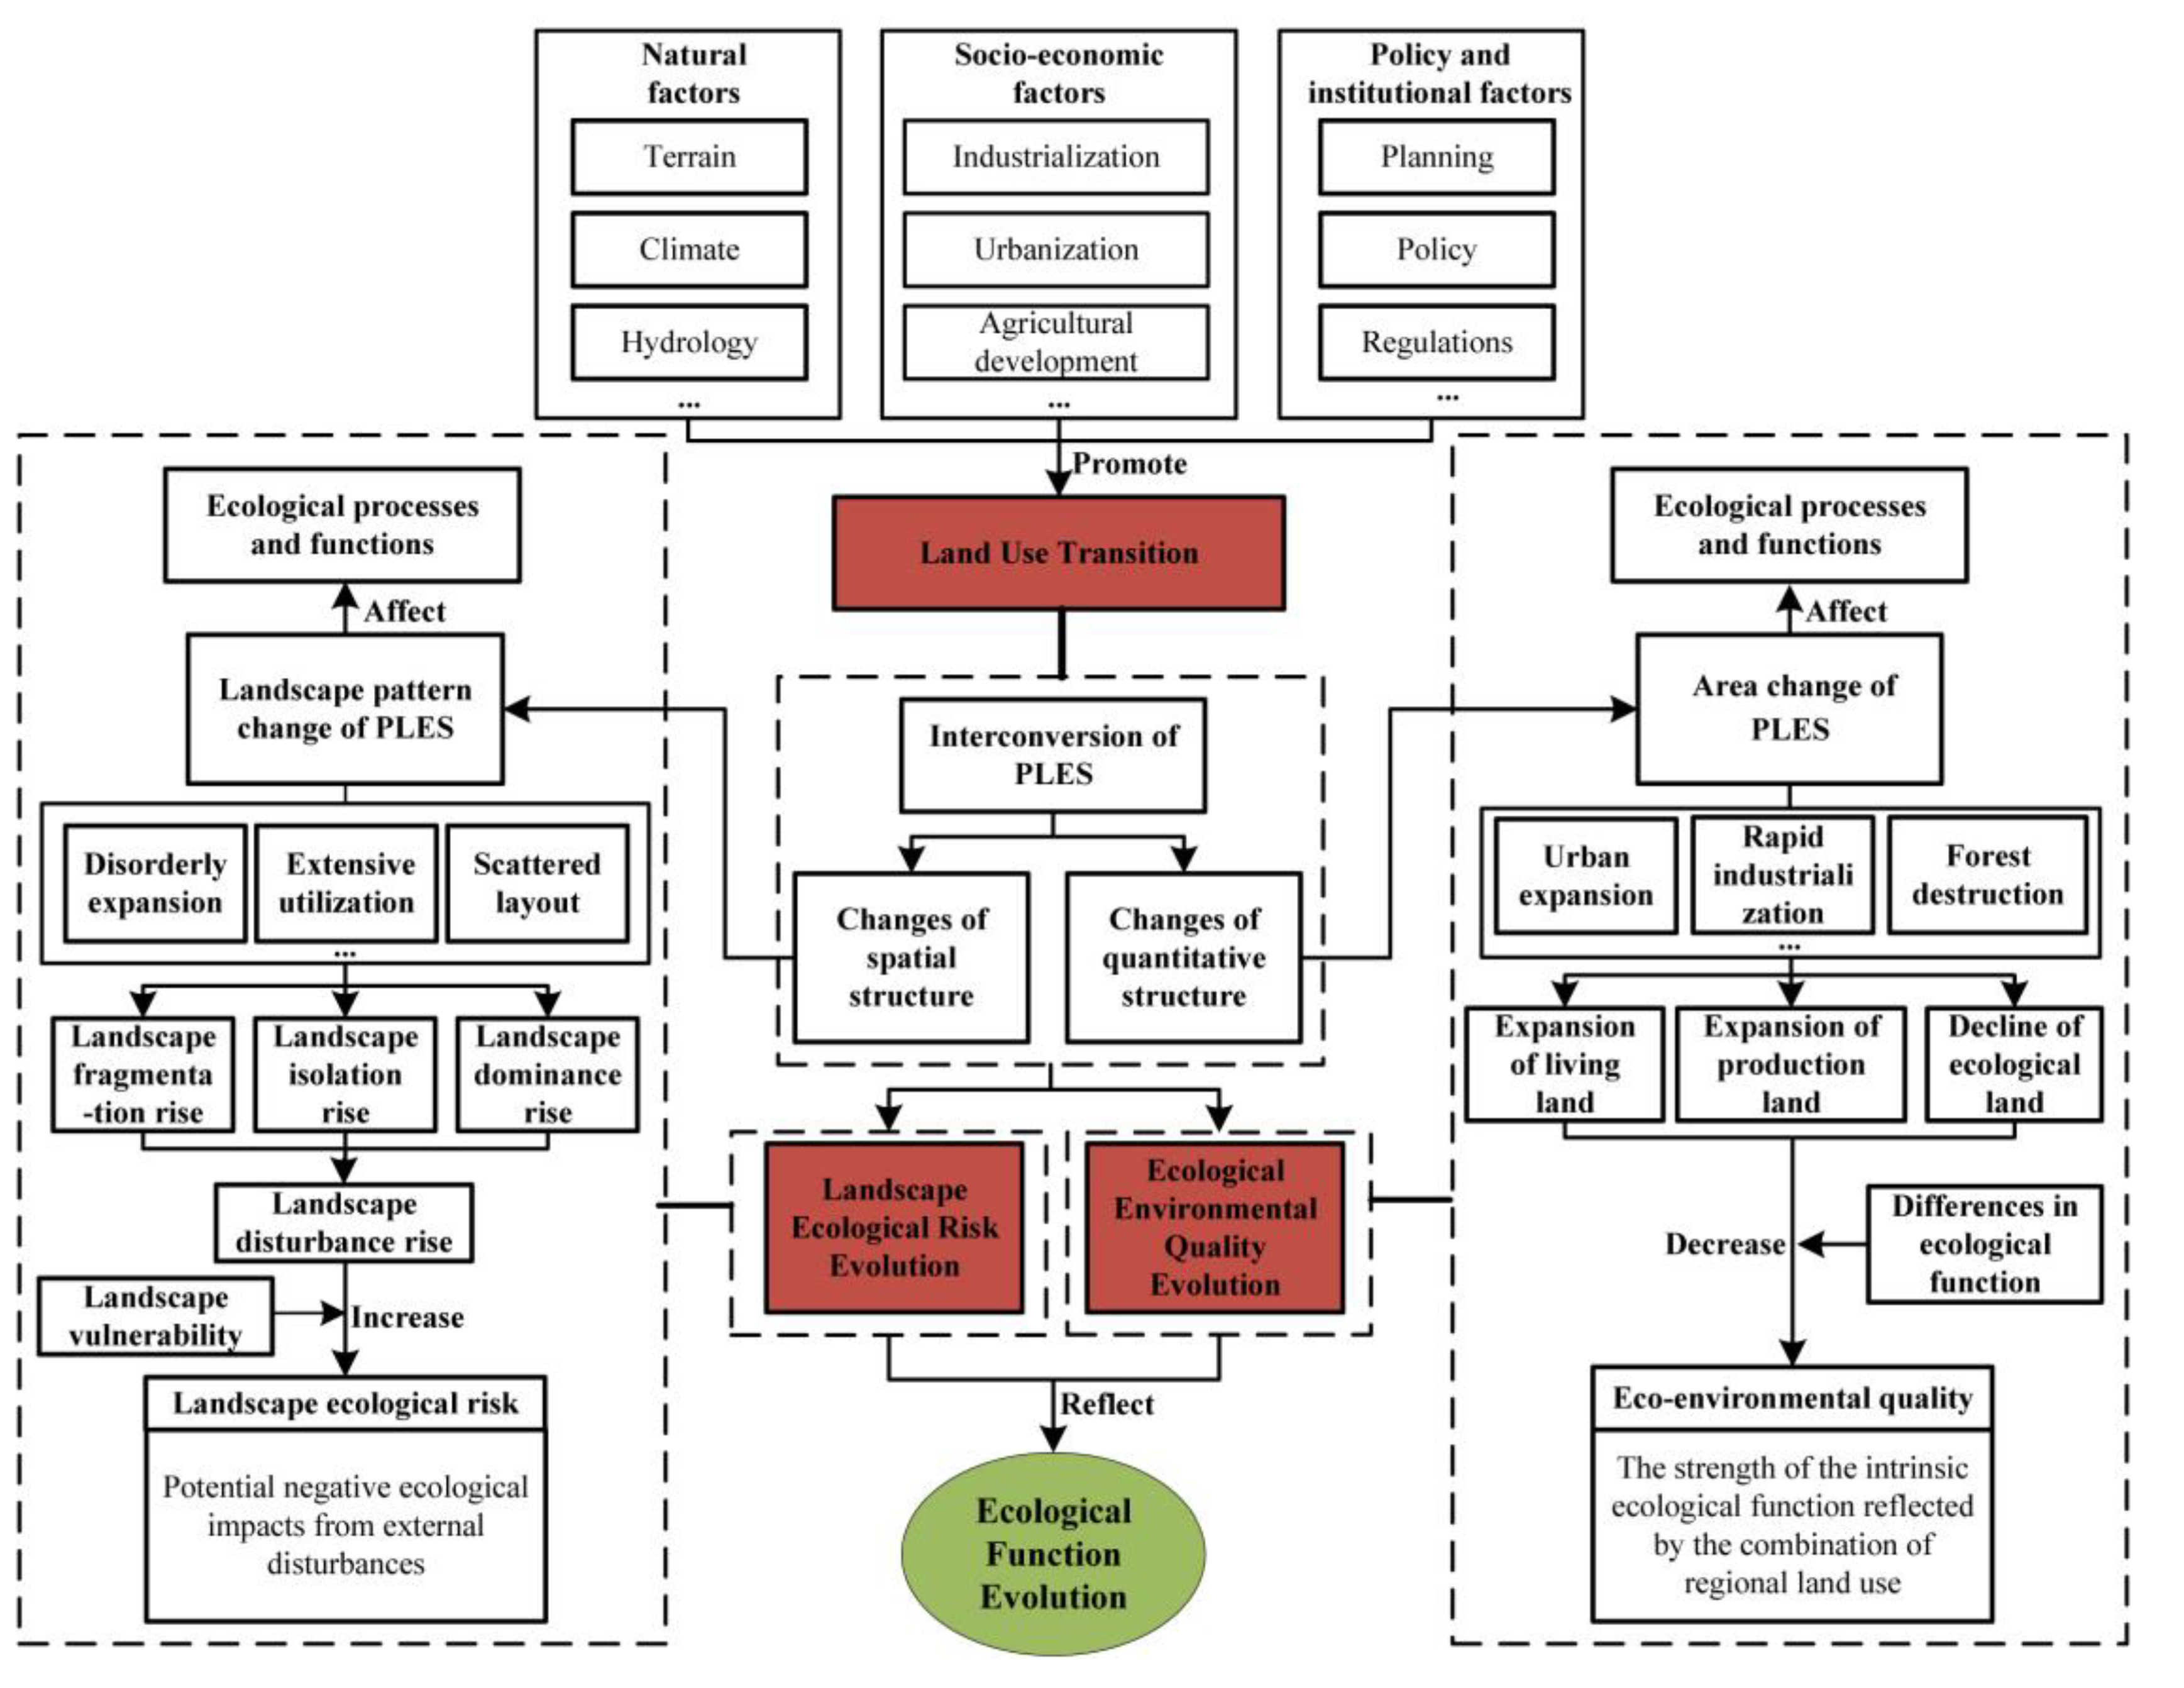
Regional land use is profoundly modified by the combination of natural, socio-economic, and policy–institutional factors (
Figure 1) [
39]. Due to conversions between different land use types, the quantitative and spatial structures of land use are constantly changing. Among them, quantitative structural changes can further affect the composition of the PLES in a region, while the changes in spatial structure can further affect the landscape pattern. Therefore, the eco-environmental effects that result from regional land use transition can be expressed via these two aspects; i.e., changes to land use area and changes to landscape pattern from the viewpoint of PLES.
The rapid land use transition that is accelerated by urbanization and industrialization continues to lead to the expansion of living and production space at the expense of ecological space, which in tandem work to degrade ecosystem structure and drive the decline in ecological functions, thereby eventually reducing the eco-environmental quality of the region. Each particular land use type harbors different strengths of ecological functions; for example, forest, grassland, and water bodies are distinguished by more ecological functions than construction land in terms of climate regulation, hydrological regulation, soil conservation, etc. [
40,
41,
42,
43,
44]. The quantitative structural change in PLES is essentially a redistribution of production, living, and ecological functions, which will inevitably shape the overall ecological functions and processes of the region of interest. Therefore, by analyzing the changed area under each land use type, we can reliably measure and infer the influence of land use transition upon eco-environmental quality; that is, the power of intrinsic ecological functioning.
Moreover, along with the process of transfers in and out between land use types, the spatial patterns of land use landscapes are also apt to change dramatically, which will also affect ecological functions and processes. The landscape is composed of heterogeneous elements, whose spatial patterning is formed by the long-term interaction of several ecological and non-ecological processes, which can jointly modify pivotal ecological functions, such as population dynamics, hydrological processes, nutrient cycling, and biodiversity maintenance. The degradation or destruction of essential structures in the landscape may thus have a fatal impact on the regional ecological environment [
45,
46,
47,
48,
49]. Therefore, landscape ecological risk can be used to measure and infer the impact on the ecological environment from the landscape pattern’s changes as caused by variation in land use spatial structure. More specifically, the ecological risk facing a landscape can be evaluated via the external disturbances it is prone to as well as its inherent vulnerability, whereby landscape disturbance refers to the extent of external interference on a landscape pattern, while landscape vulnerability indicates the respective fragility of different landscape ecosystems [
50]. The higher the landscape ecological risk is, the more likely that landscape is to be impaired by external disturbance; the greater is the probability of negative ecosystem impacts and losses; and the larger the degradation of the processes and functions of its ecosystems [
51]. With the rapid advancement of industrialization and urbanization, the disorderly and extensive expansion of land use types and their scattered distribution, especially with respect to rural housing land, will lead to greater landscape fragmentation, isolation, and dominance, which in turn would augment the landscape ecological risk.
3. Data Collection and Methods
3.1. Study Area
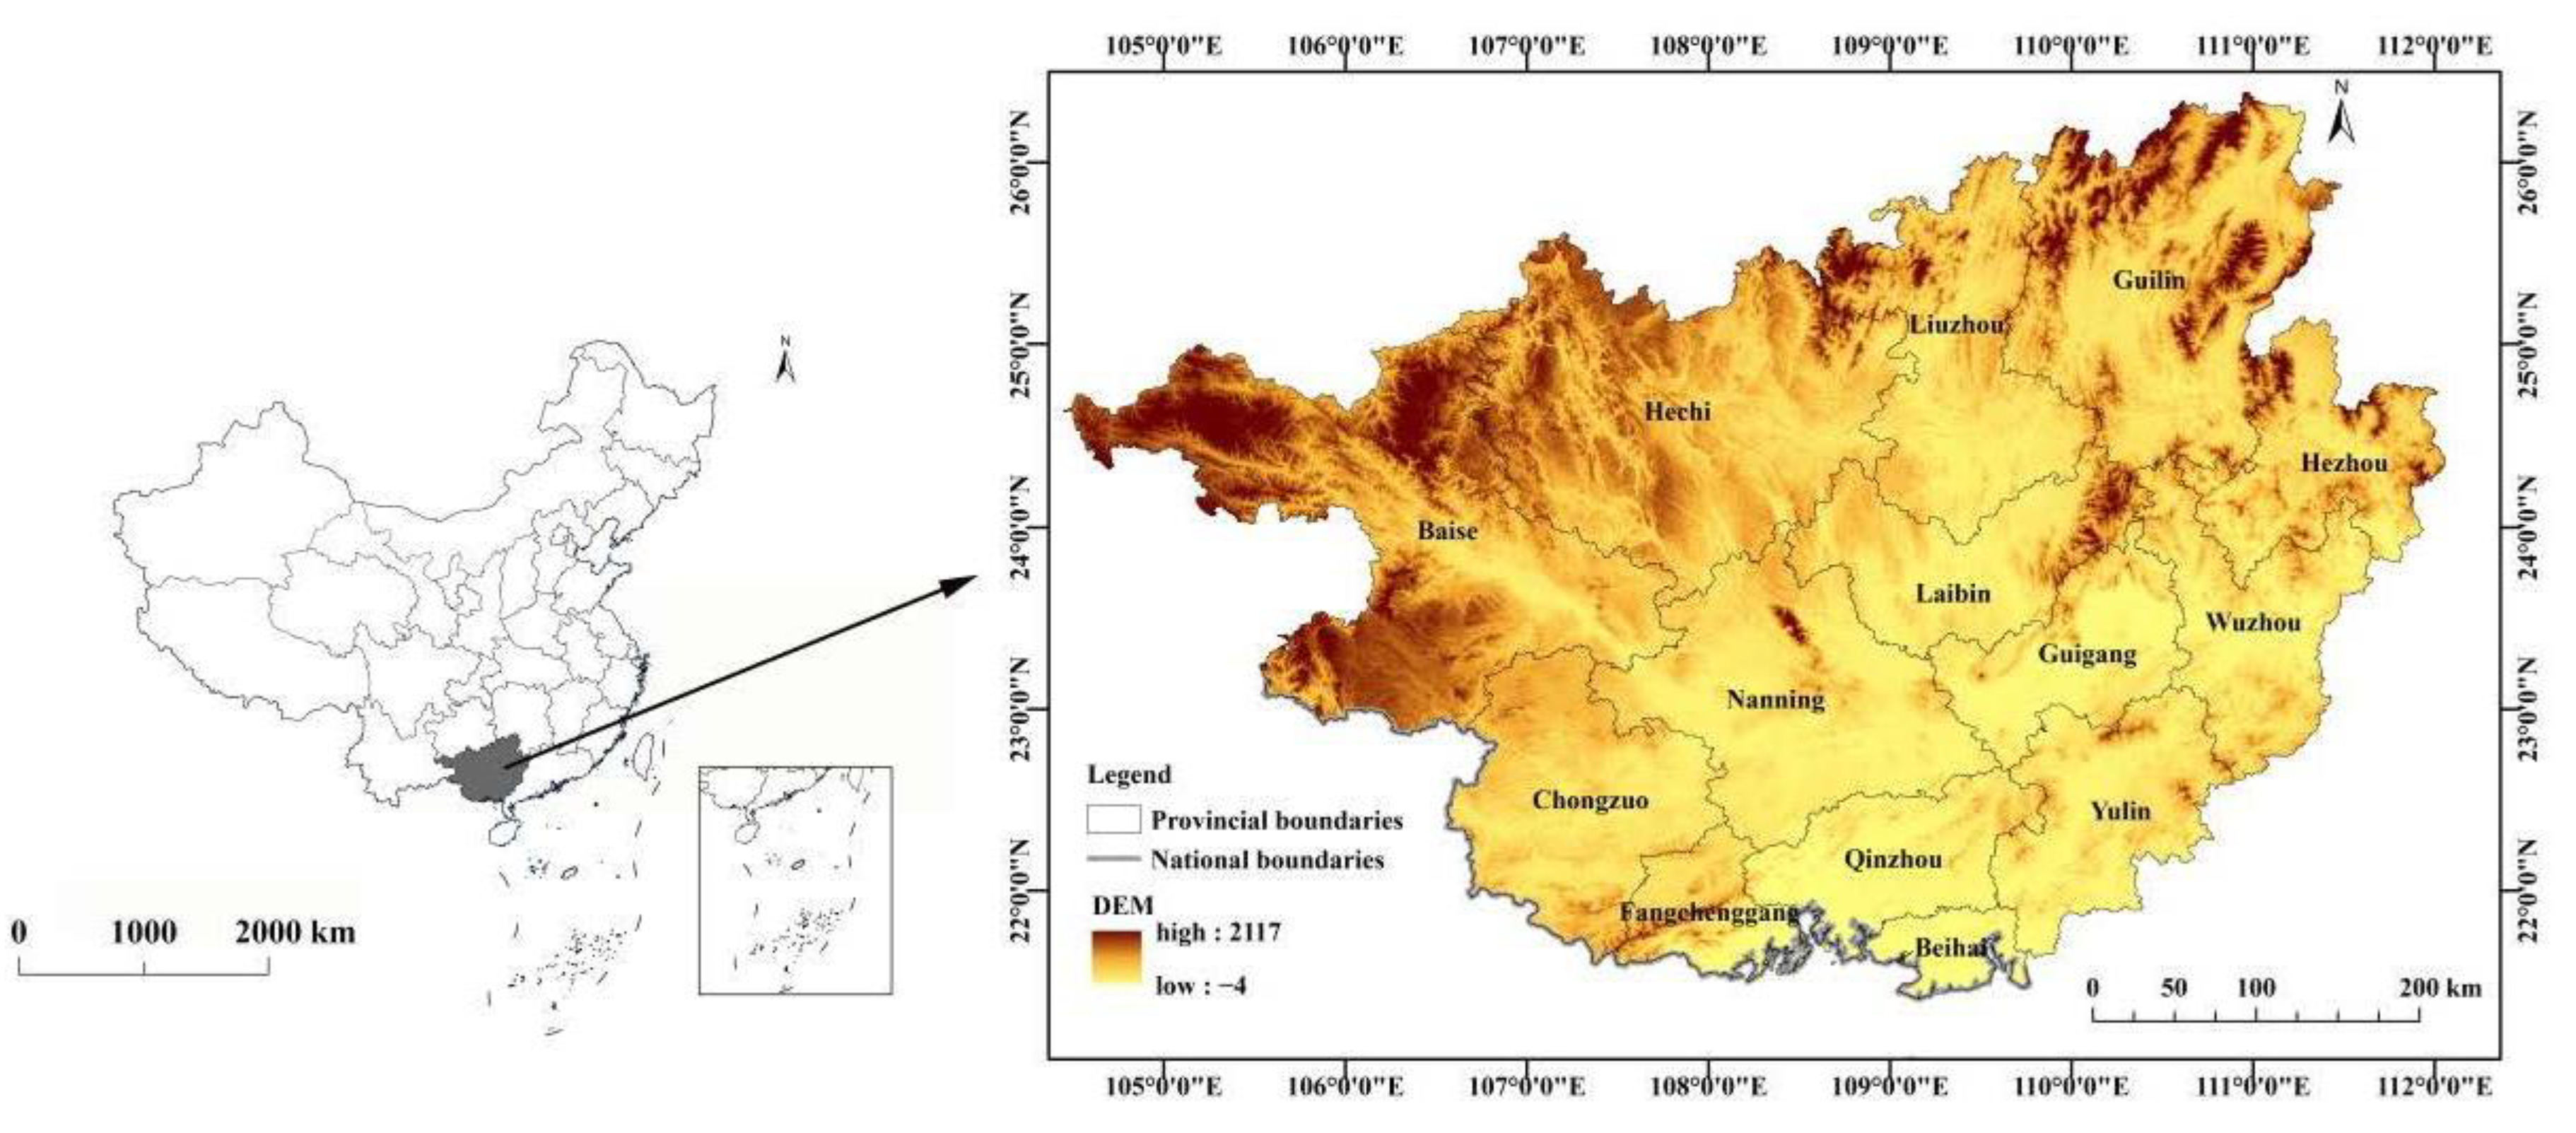
Guangxi, situated in the southwest of China (
Figure 2), is the major settlement of the Zhuang ethnic minority [
52]. It is the most convenient corridor to access the South China Sea from southwestern China, having rich biological resources and excellent seaports, and a ca. 1500 km long coastline. The topography of Guangxi is very complex, with its central and southern areas covered by plains and hills, whose surrounding areas are covered with mountains and plateaus. The ecological environment is very fragile in Guangxi, as exemplified by its serious stone desertification and soil erosion problems [
53]. In recent years, given the accelerated urbanization and industrialization in Guangxi, construction land has encroached substantially on agricultural land, forested land, and water bodies, causing great harm to its regional eco-environmental quality and security [
54].
3.2. Data Collection
The land use data sets were obtained from the Resource and Environment Science Data Center of the Chinese Academy of Sciences (CAS), among which the Landsat TM satellite images in 1990, 2000, and 2010 were acquired in September 1990, August 2000, and May 2010, respectively, and the Landsat OLI satellite images in 2018 were acquired in September 2018, all having a 30 m spatial resolution. The average positional error of those data was estimated to be <50 m (about two pixels), according to geometric image correction and georeferencing. In addition, the average interpretation accuracy was about 91%, as confirmed by an outdoor investigation and an examination of randomly sampled data [
55].
Following the standard land resource classification system issued by the CAS, the land use types in Guangxi were classified into 6 primary and 25 secondary categories. Further, the secondary categories of land use types were reclassified by PLES (
Table 1). To further investigate and discuss the impacts of land use transition on regional eco-environmental quality, ecological attribute factors were applied to express the strength in the ecological functioning of secondary land use types, by drawing on recent studies [
56,
57] (as shown in the last column of
Table 1).
3.3. Methods
3.3.1. Eco-Environmental Quality Index
According to the ecological attribute factors and proportion of each land use type, the eco-environmental quality index (
EQI) can be calculated as follows [
58]:
where
Ai and
A represent the area of land use type
i and the total, respectively;
Fi is the corresponding ecological attribute factor of land use type
i.
3.3.2. Landscape Ecological Risk Index
By using the landscape ecological risk index (
ERI), the impact of changes in spatial land use structure on regional ecological functions and processes was analyzed. Firstly, the landscape disturbance index (
Si) was calculated through a weighted calculation of three landscape pattern indices, which reflects the degree of external disturbance to landscape pattern. Its calculation equation is as follows:
where
Si denotes the landscape disturbance index;
a,
b, and
c denote the weights of the three landscape indices, being 0.5, 0.3, and 0.2, respectively [
46];
Ci denotes the landscape fragmentation index;
Ni denotes the landscape isolation index; and
Di denotes the landscape dominance index.
To calculate the indices of landscape fragmentation, landscape isolation, and landscape dominance, these equations were used [
59]:
where
ni is the number of patches of landscape
i;
TAi is the total area of the landscape
i;
TA is the total area; and
Qi is the proportion for the number of
i patches among the total number of quadrats. Likewise,
Mi is the proportion for the number of
i patches out of the total quadrats, and
Li is the proportion for the pooled area of
i patches of the total quadrats.
Secondly, to convey the resistance of different landscapes to external disturbances, corresponding landscape vulnerability indices were assigned to different landscapes, this conducted according to the two studies [
33,
60]. The values for the subcategories of PLES (
Table 1) were assigned as follows: other ecological land is 6, water ecological land is 5, agricultural production land is 4, grass ecological land is 3, forest ecological land is 2, urban and rural living land and industrial and mining production land are 1. To obtain the landscape vulnerability index (
Pi) of each subcategory, data normalization was used.
Finally,
ERI was calculated as follows:
where
Aki denotes the area of landscape
i in the risk cell
k, while
Ak denotes the total area of the risk cell
k.
3.3.3. Spatial Expression of EQI and ERI
According to the principle of landscape ecology, the grid area should be about 2–5 times the average patch area in a given study area [
61]. Therefore, we used a square grid of 3 km
2 × 3 km
2 for equidistant sampling, in order to spatialize the ecological quality and landscape ecological risk. Finally, in this way, ca. 27,000 sample areas were obtained. The
EQI and
ERI of each sample area were assigned to its center point, and then the relevant parameters of
EQI and
ERI were calculated by the semi-variance analysis method, using this formula:
where
γ(
h) denotes the semi-covariance;
h is the distance of the samples;
Z(
xi + h) and
Z(
xi) respectively denote
EQI and
ERT at
xi + h and
xi; and
n(h) denotes the number of sample pairs within the distance
h.
The spatial analysis model in GS+ software was used to fit the semi-covariance function to obtain the corresponding parameters. Next, the Kriging interpolation method was used to spatially interpolate the EQI and ERI across the sampled areas, to obtain the spatial distribution of EQI and ERI for the whole study area.
3.3.4. Ecological Contribution of Major Types of Land Use Transition
The degree of contribution from a change in a certain land use type
i to the regional change in
EQI was calculated this way:
where
LEI denotes the ecological contribution of a land use transition;
LEi+1 and
LEi are the eco-environmental quality indices of land use type
i at the end and beginning of a certain period, respectively;
LA is the area of that land use change; and
TA is the total area of the region.
3.3.5. Bivariate Global/Local Moran’s I
The characteristics of spatial correlation and dependence between two geographical elements can be measured by the bivariate Moran’s I, which can take two forms. Using the bivariate global Moran’s I, we can explore the global spatial correlation and significance of different variables while the bivariate local Moran’s I can be used to explore local spatial correlation characteristics [
62,
63]. Although both
EQI and
ERI are calculated based on land use data, they reflect the regional ecological environment from two different aspects; hence, there are certain differences in their spatial distribution. To explore this spatial differentiation, we used the bivariate global/local Moran’s I to analyze the spatial correlation of
EQI and
ERI in detail. The bivariate global Moran’s I was calculated as follows:
where the
I is the value of the bivariate Moran’s I;
wij denotes the spatial weight matrix;
xi and
xj denote the attribute values of the first variable of the spatial unit
i and
j, respectively;
is the mean attribute value of the second variable; and
n is the total number of spatial units.
The bivariate local Moran’s I was then calculated:
where:
denotes the value of attribute
k of unit
i; the
denotes the value of attribute
l of unit
j; the
and
are the average values of attributes
k and
l, respectively; the
represents the weight coefficient matrix;
and
correspond to the variance of attributes
k and
l, respectively; and
n is the number of geo-spatial grid units.
4. Results
4.1. Characteristics of Land Use Transitions Based on the PLES
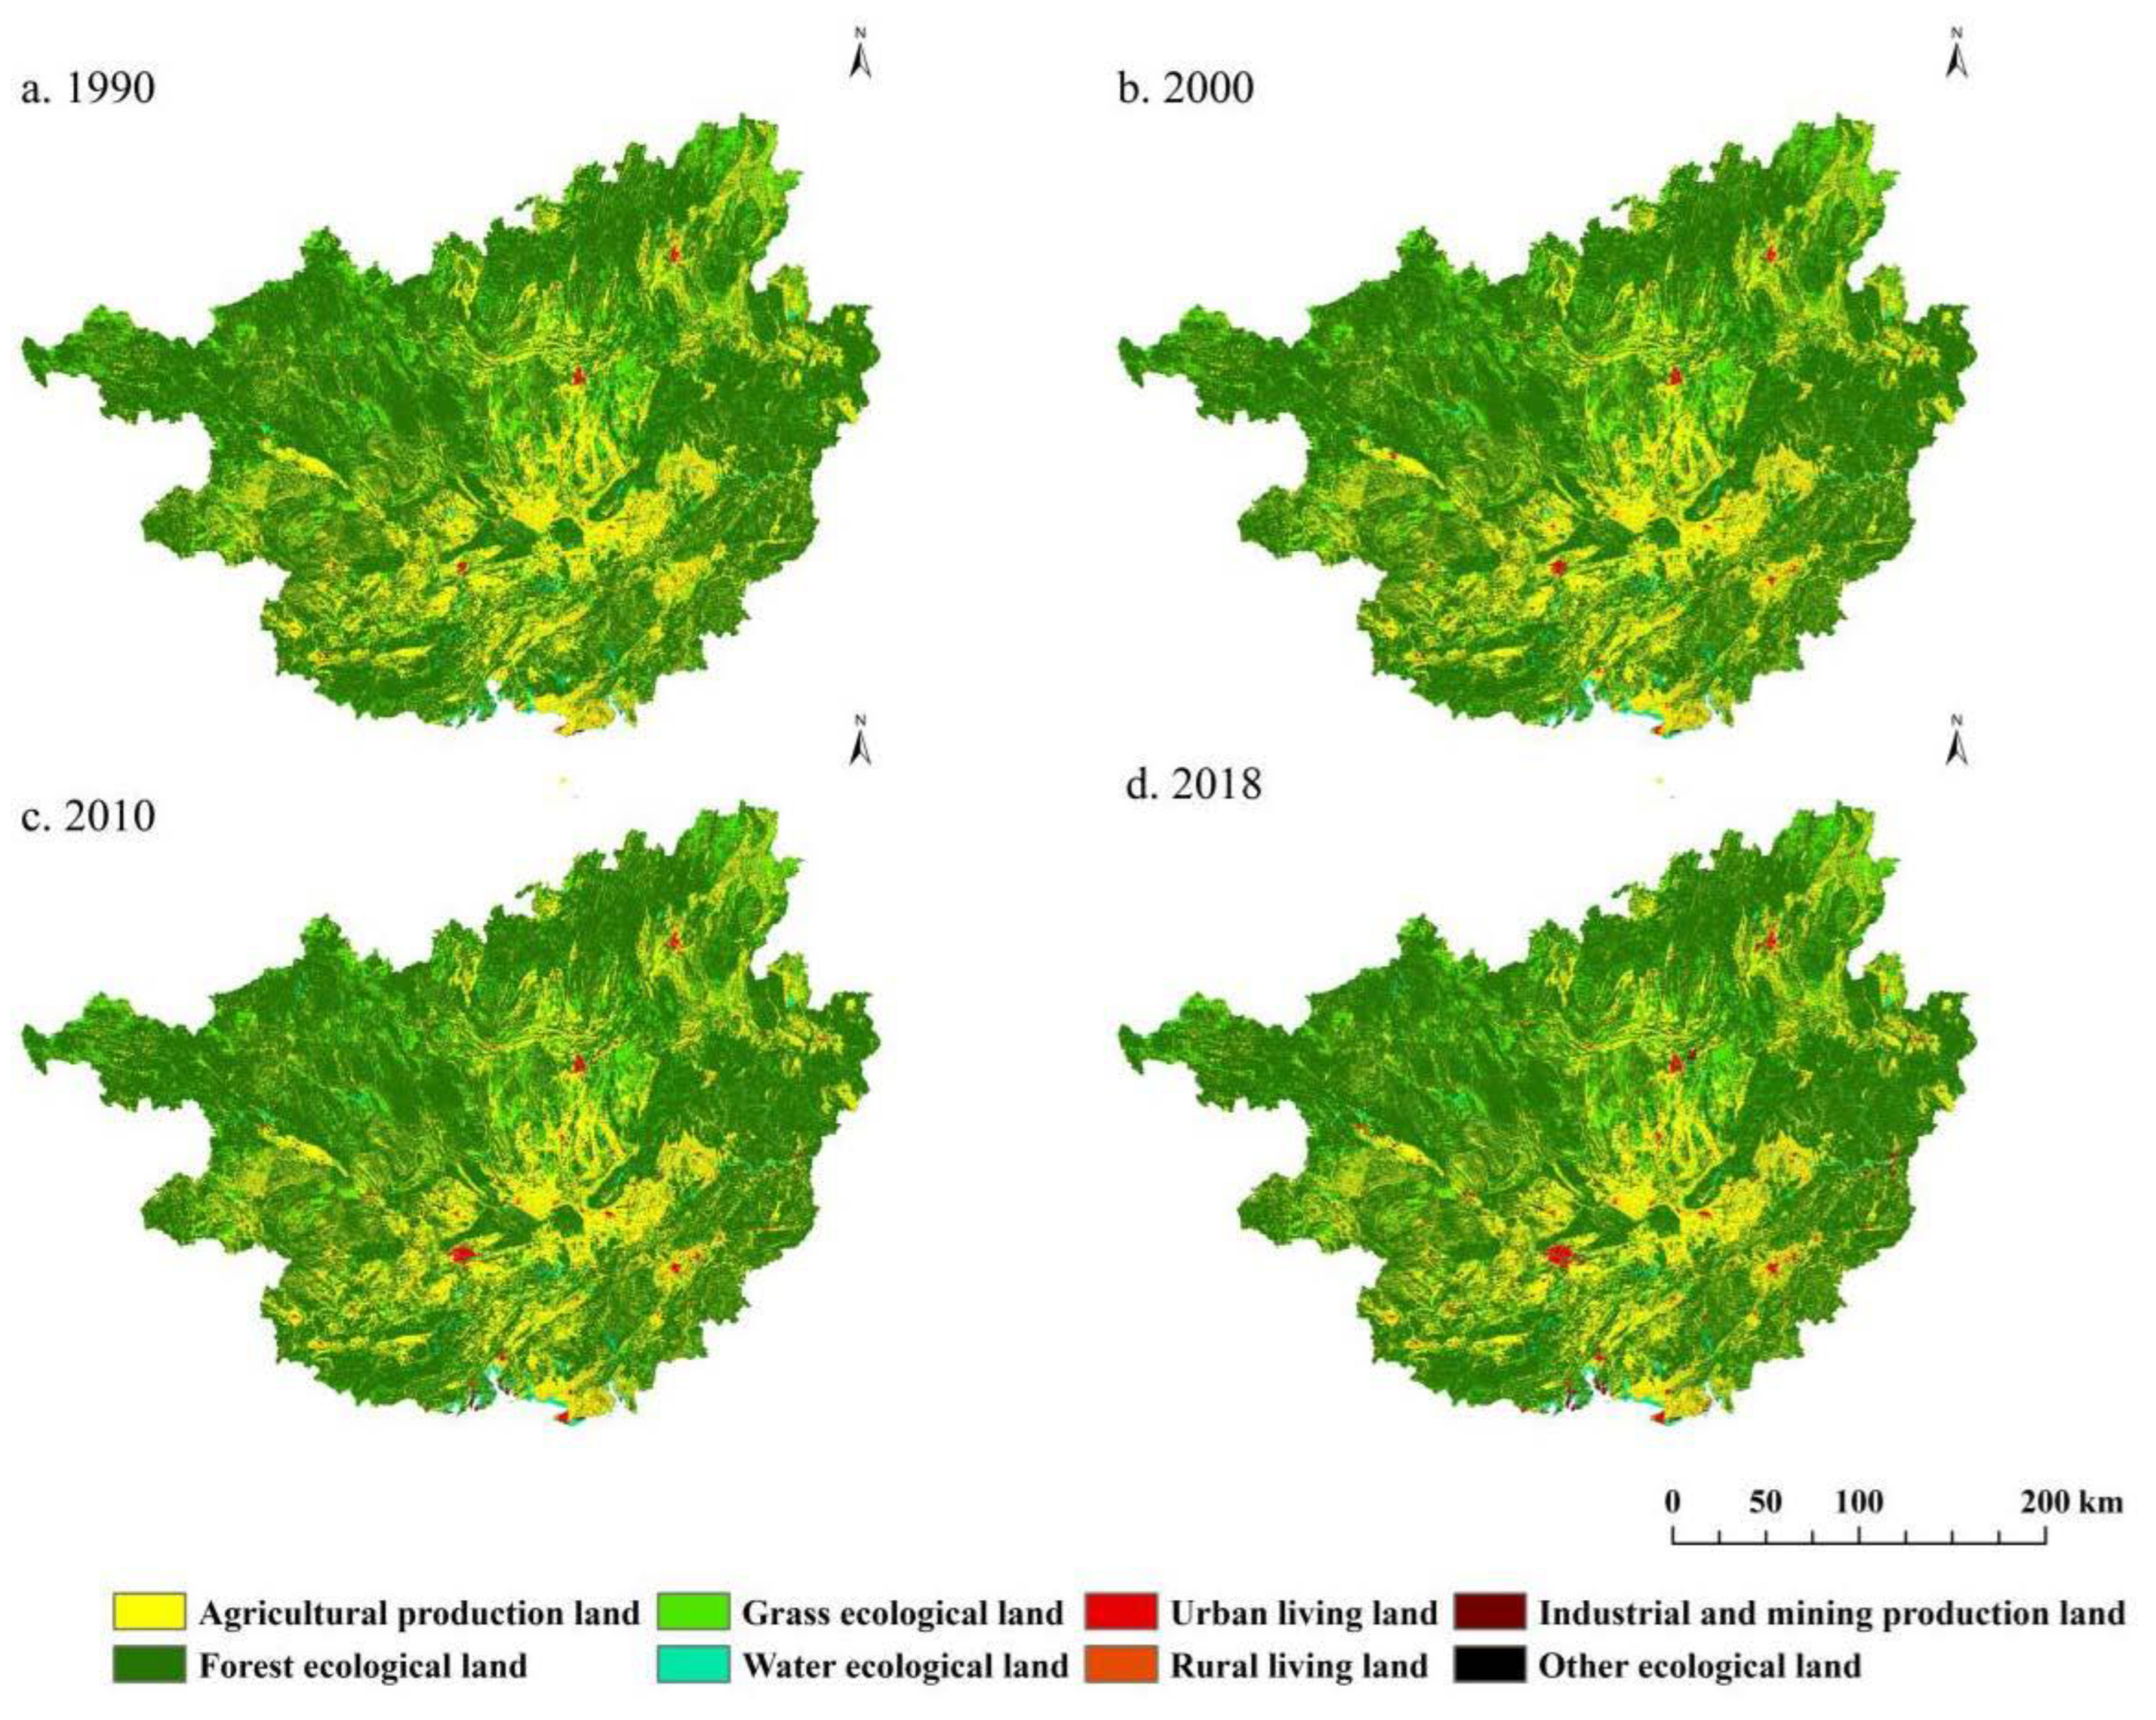
Despite the contraction of ecological space area from 1990 to 2018, the PLES of Guangxi was still dominated by ecological space in 2018, this accounting for about 75.96% of the total area, or about 180,016.73 km
2 (
Table 2,
Figure 3). Specifically, the ecological space was dominated by forest and grass ecological land, whose areas had been decreasing continuously, for a total reduction of 1498.96 km
2. Meanwhile, the production space was expanding largely due to the rapid expansion of industrial and mining production land. The living space only constituted a small part of the total PLES. The urban living land expanded by 811.99 km
2, while the interannual change in rural living land was relatively small.
In order to find out the direction and quantity of interconversion between different land use types, the land use transfer matrix was obtained by superposition analysis in ArcGIS Pro, based on the land use data of the four time periods (
Table 3). During 1990–2018, transfers in and out of agricultural productive land and forest ecological land were quite frequent. The net transfer of grass ecological land to forest ecological land mitigated the latter’s declining trend over time. By contrast, urban living land and industrial and mining production land underwent sharp growth in area, this mainly sourced from the agricultural production land and forest ecological land. In general, under the promotion of industrialization and urbanization, the production space and living space in Guangxi were constantly encroaching upon ecological space. Although various land consolidation projects and forest protection policies were implemented to maintain the stability of farmland and forest, both still tended to significantly decrease over time.
4.2. Eco-Environmental Effects Caused by Land Use Transition
4.2.1. Spatio-Temporal Characteristics of Eco-Environmental Quality’s Distribution
The
EQI of Guangxi was calculated and then classified into five categories: the low-quality zone (
EQI <= 0.43), medium-low-quality zone (0.43 <
EQI <= 0.54), medium-quality zone (0.54 <
EQI <= 0.63), medium-high-quality zone (0.63 <
EQI <= 0.70), and high-quality zone (
EQI > 0.70) (
Table 4). The average
EQI values were 0.6442, 0.6428, 0.6421, and 0.6406 in 1990, 2000, 2010, and 2018, respectively, thus revealing a trend of continuous deterioration, in which the
EQI decreased markedly during 1990–2000 and 2010–2018, whereas it was more stable in the 2000–2010 interval. More than 60% of Guangxi’s total area consisted of high- and medium-high-quality zones. In general, the areas of medium, medium-low and low zones featured a rising trend; the area corresponding to the high-quality zone demonstrated a continual downward trend, while the medium-high-quality zone remained relatively stable over time.
As seen in
Table 5, the area of degraded eco-environment quality zones reached up to 9494.87 km
2 during 1990–2018, while the area of improved zones amounted to just 1758.37 km
2; that is, the former is about 5.4 times greater than the latter. In parallel, those transfers mainly occurred between adjacent zones, while the ones across two or more zones were relatively rare. The areas of high- and medium-high-quality zones that degraded into the low-quality zone were significantly larger than the interconversions that occurred between other zones, reaching up to 3158.26 km
2 and 2992.54 km
2, respectively.
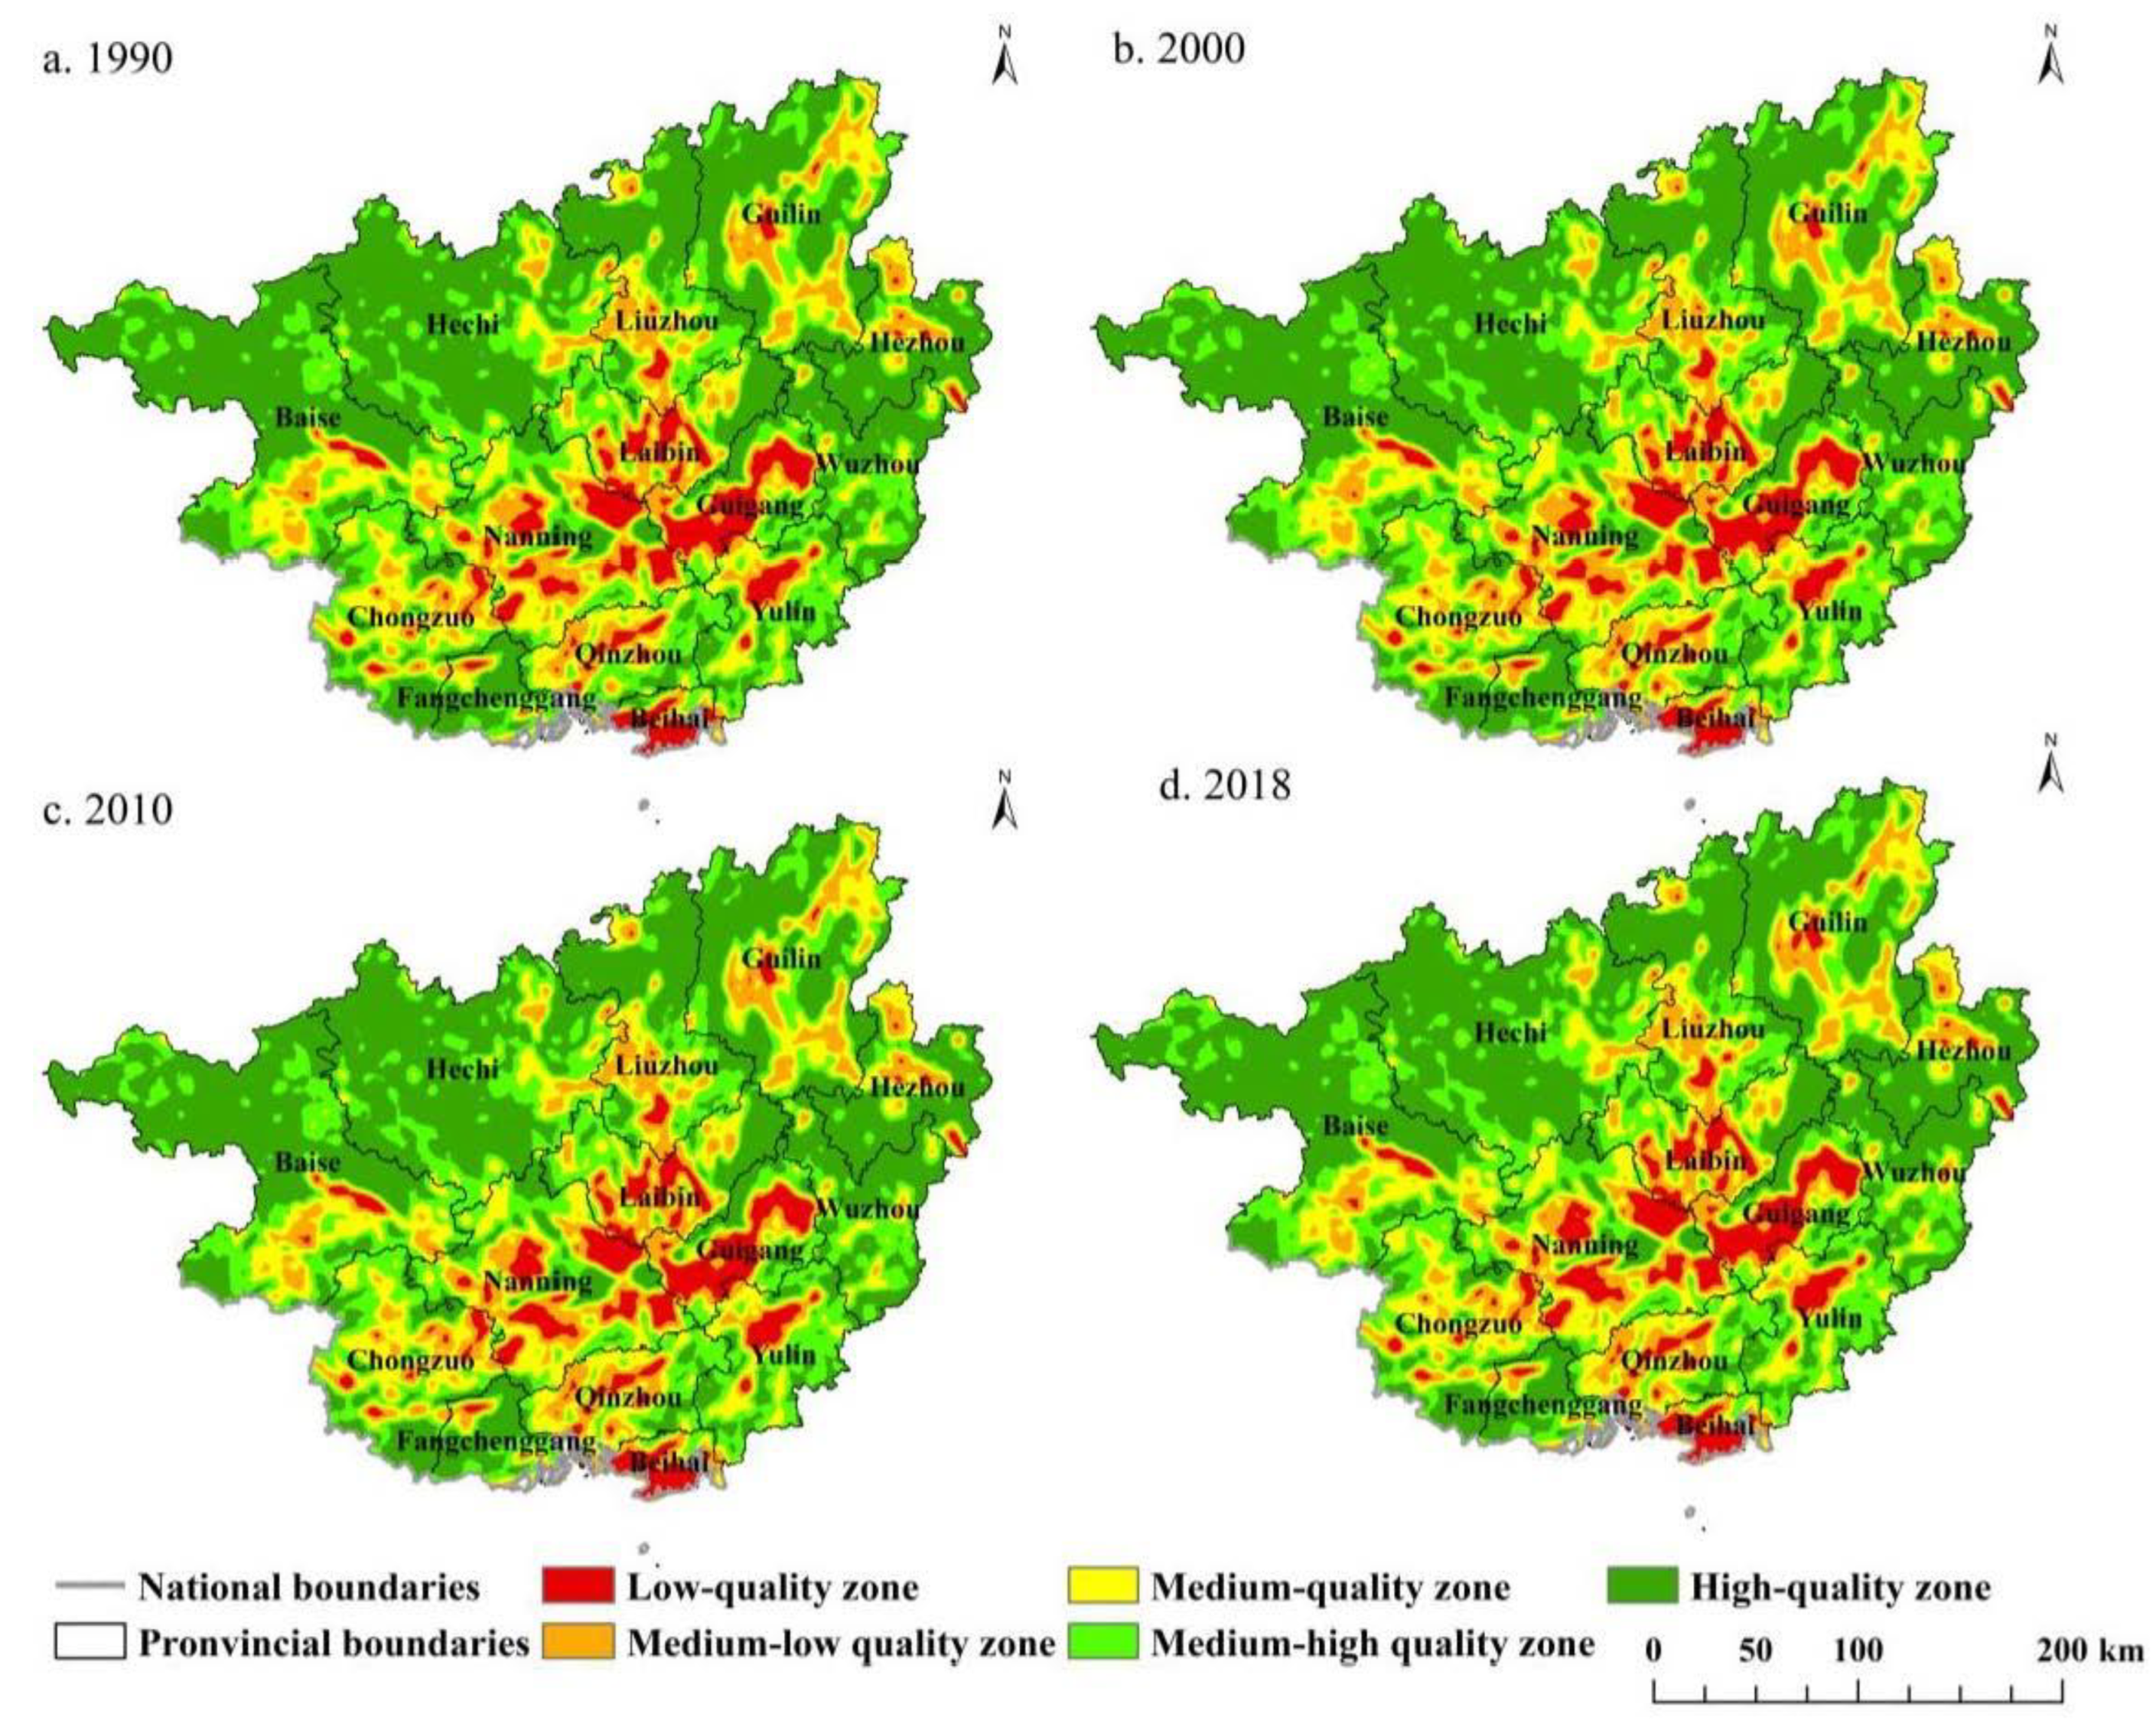
Examining the distribution of eco-environmental quality revealed that the high- and medium-quality zones were mostly situated in the mountainous and hilly regions of the north, east, and southwest of Guangxi (
Figure 4). These regions were mostly covered with forest and grass on steep and complicated terrain, which restricted the sprawl of cities and the scale of industries; hence, ecosystem function and structure was more intact there and a high eco-environmental quality maintained, but their areas were shrinking in size. The medium-quality and medium-low-quality zones were mostly located in the southwest and northeast of Guangxi, and often distributed in the suburban areas of cities and rural parts, and their areas were slowly increasing. The low-quality zone was mostly located in the center of Guangxi, such as in Beihai, Nanning, Laibin, and Guigang city, and gradually extending outward into the surrounding region due to the relatively flat topography, which is suitable for urban and industrial development. It is noteworthy that although its area was small overall, the low-quality zone was expanding very quickly.
4.2.2. Eco-Environmental Quality Effects Caused by Land Use Transition
To examine the impact of land use transition upon eco-environmental quality, the respective contribution of major types of land use transition resulting in changes to the
EQI were analyzed (
Table 6). During 1990–2010, the encroachment of forest ecological land and grass ecological land by agricultural production land was the main reason for the deterioration of eco-environment quality. Conversely, the process of returning farmland to forest promoted the optimization of eco-environment quality. During 2010–2018, the encroachment by industrial and mining production land upon forest ecological land, grass ecological land, and agricultural production land became the main driver of the deteriorating eco-environment quality. The conversions of grass ecological land to forest ecological land and that of agricultural production land to ecological land were the primary reasons for why eco-environment quality was optimized in that period. In general, during 1990–2018, the degree of eco-environmental quality’s deterioration surpassed its improvement in Guangxi. The rapid transformation of ecological space to production space contributed the most to diminished regional ecological environment quality.
4.2.3. Landscape Ecological Risk Effects Caused by Land Use Transition
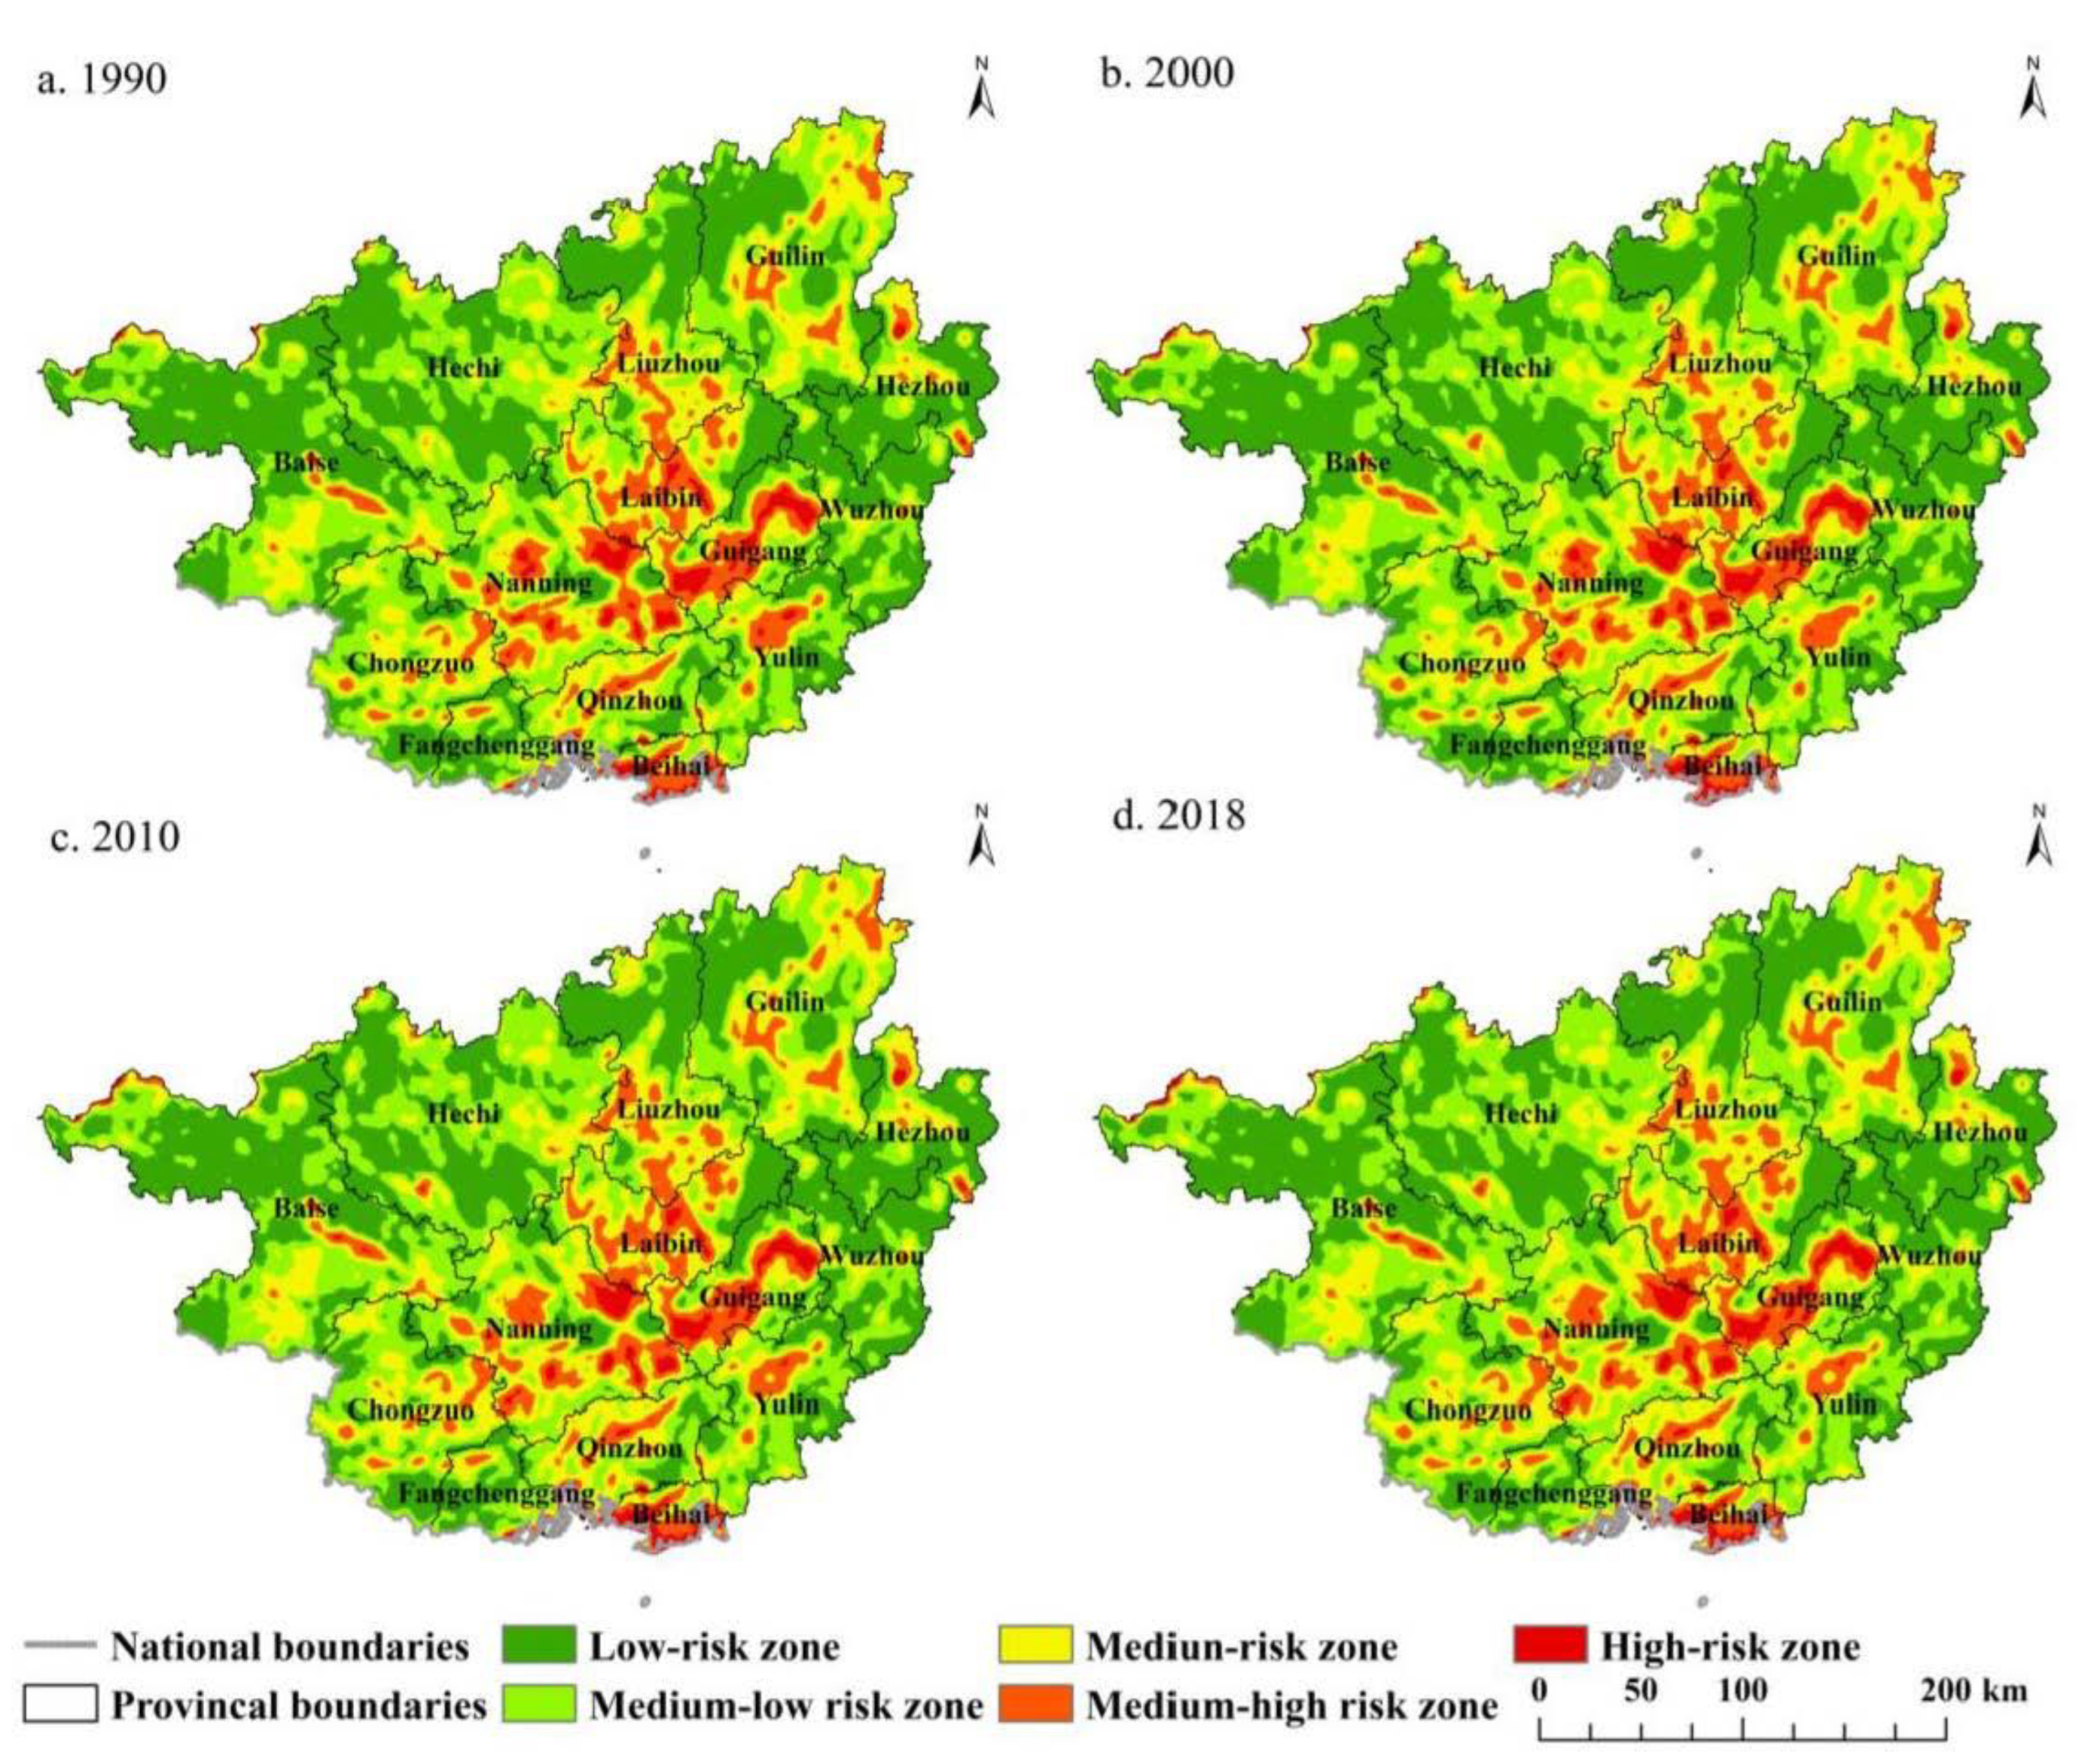
The
ERIs of Guangxi were calculated according to Formula (6). These values were then classified into five categories based on the natural breakpoint method: low-risk zone (
ERI <= 0.20), medium-low-risk zone (0.20 <
ERI <= 0.26), medium-risk zone (0.26 <
ERI <= 0.33), medium-high-risk zone (0.33 <
ERI <= 0.40), and high-risk zone (
ERI > 0.40) (
Table 7). The average
ERI values in 1990, 2000, 2010, and 2018 were 0.2396, 0.2413, 0.2428, and 0.2440, respectively, showing that the overall landscape ecological risk in Guangxi had a continuous increasing trend. Against the background of rapid urbanization and industrialization, the frequent transfer in and out of land use types led to the severe fragmentation of the prior landscape pattern and intensified the landscape ecological risk. Yet, it is encouraging to note that the
ERI’s upward trend was gradually abating.
In Guangxi, the low-, medium-low and medium-risk zones were predominant, both in terms of size and proportion, these comprising more than 85% of its total area during each period. Among them, the area proportion corresponding to the low-risk zone was the largest in 1990, 2000, and 2010, while that for the medium-low-risk zone was largest in 2018. In terms of the changing trend of each zone from 1990 to 2018, except for the low-risk zone, all other four zones were expanding, while the total area of the low-risk zone shrunk by 6845.72 km2 over the last 28 years.
According to the derived transfer matrix of landscape ecological risk zones (
Table 8), the increased area of landscape ecological risk exceeded the amount of area where it decreased. To be specific, during 1990–2018, the area in which the risk rose totaled 8555.68 km
2, while it fell in just 3920.19 km
2. The interconversions between the low-risk and medium-low-risk zones; the medium-low-risk and medium-risk zones; and the medium-risk and medium-high-risk zones were the major transfer types found.
In terms of its spatial distribution, the
ERI was high in central and southern Guangxi and low in its surroundings; i.e., the
ERI showed a gradual trend of increasing from the surroundings towards the central and southern regions (
Figure 5). In addition, high- and medium-high-risk zones were annexing the small and scattered regions nearby while expanding outward, to form contiguous, large medium-high- and high-risk zones.
By comparing
Figure 5 with
Figure 3, analyzed in
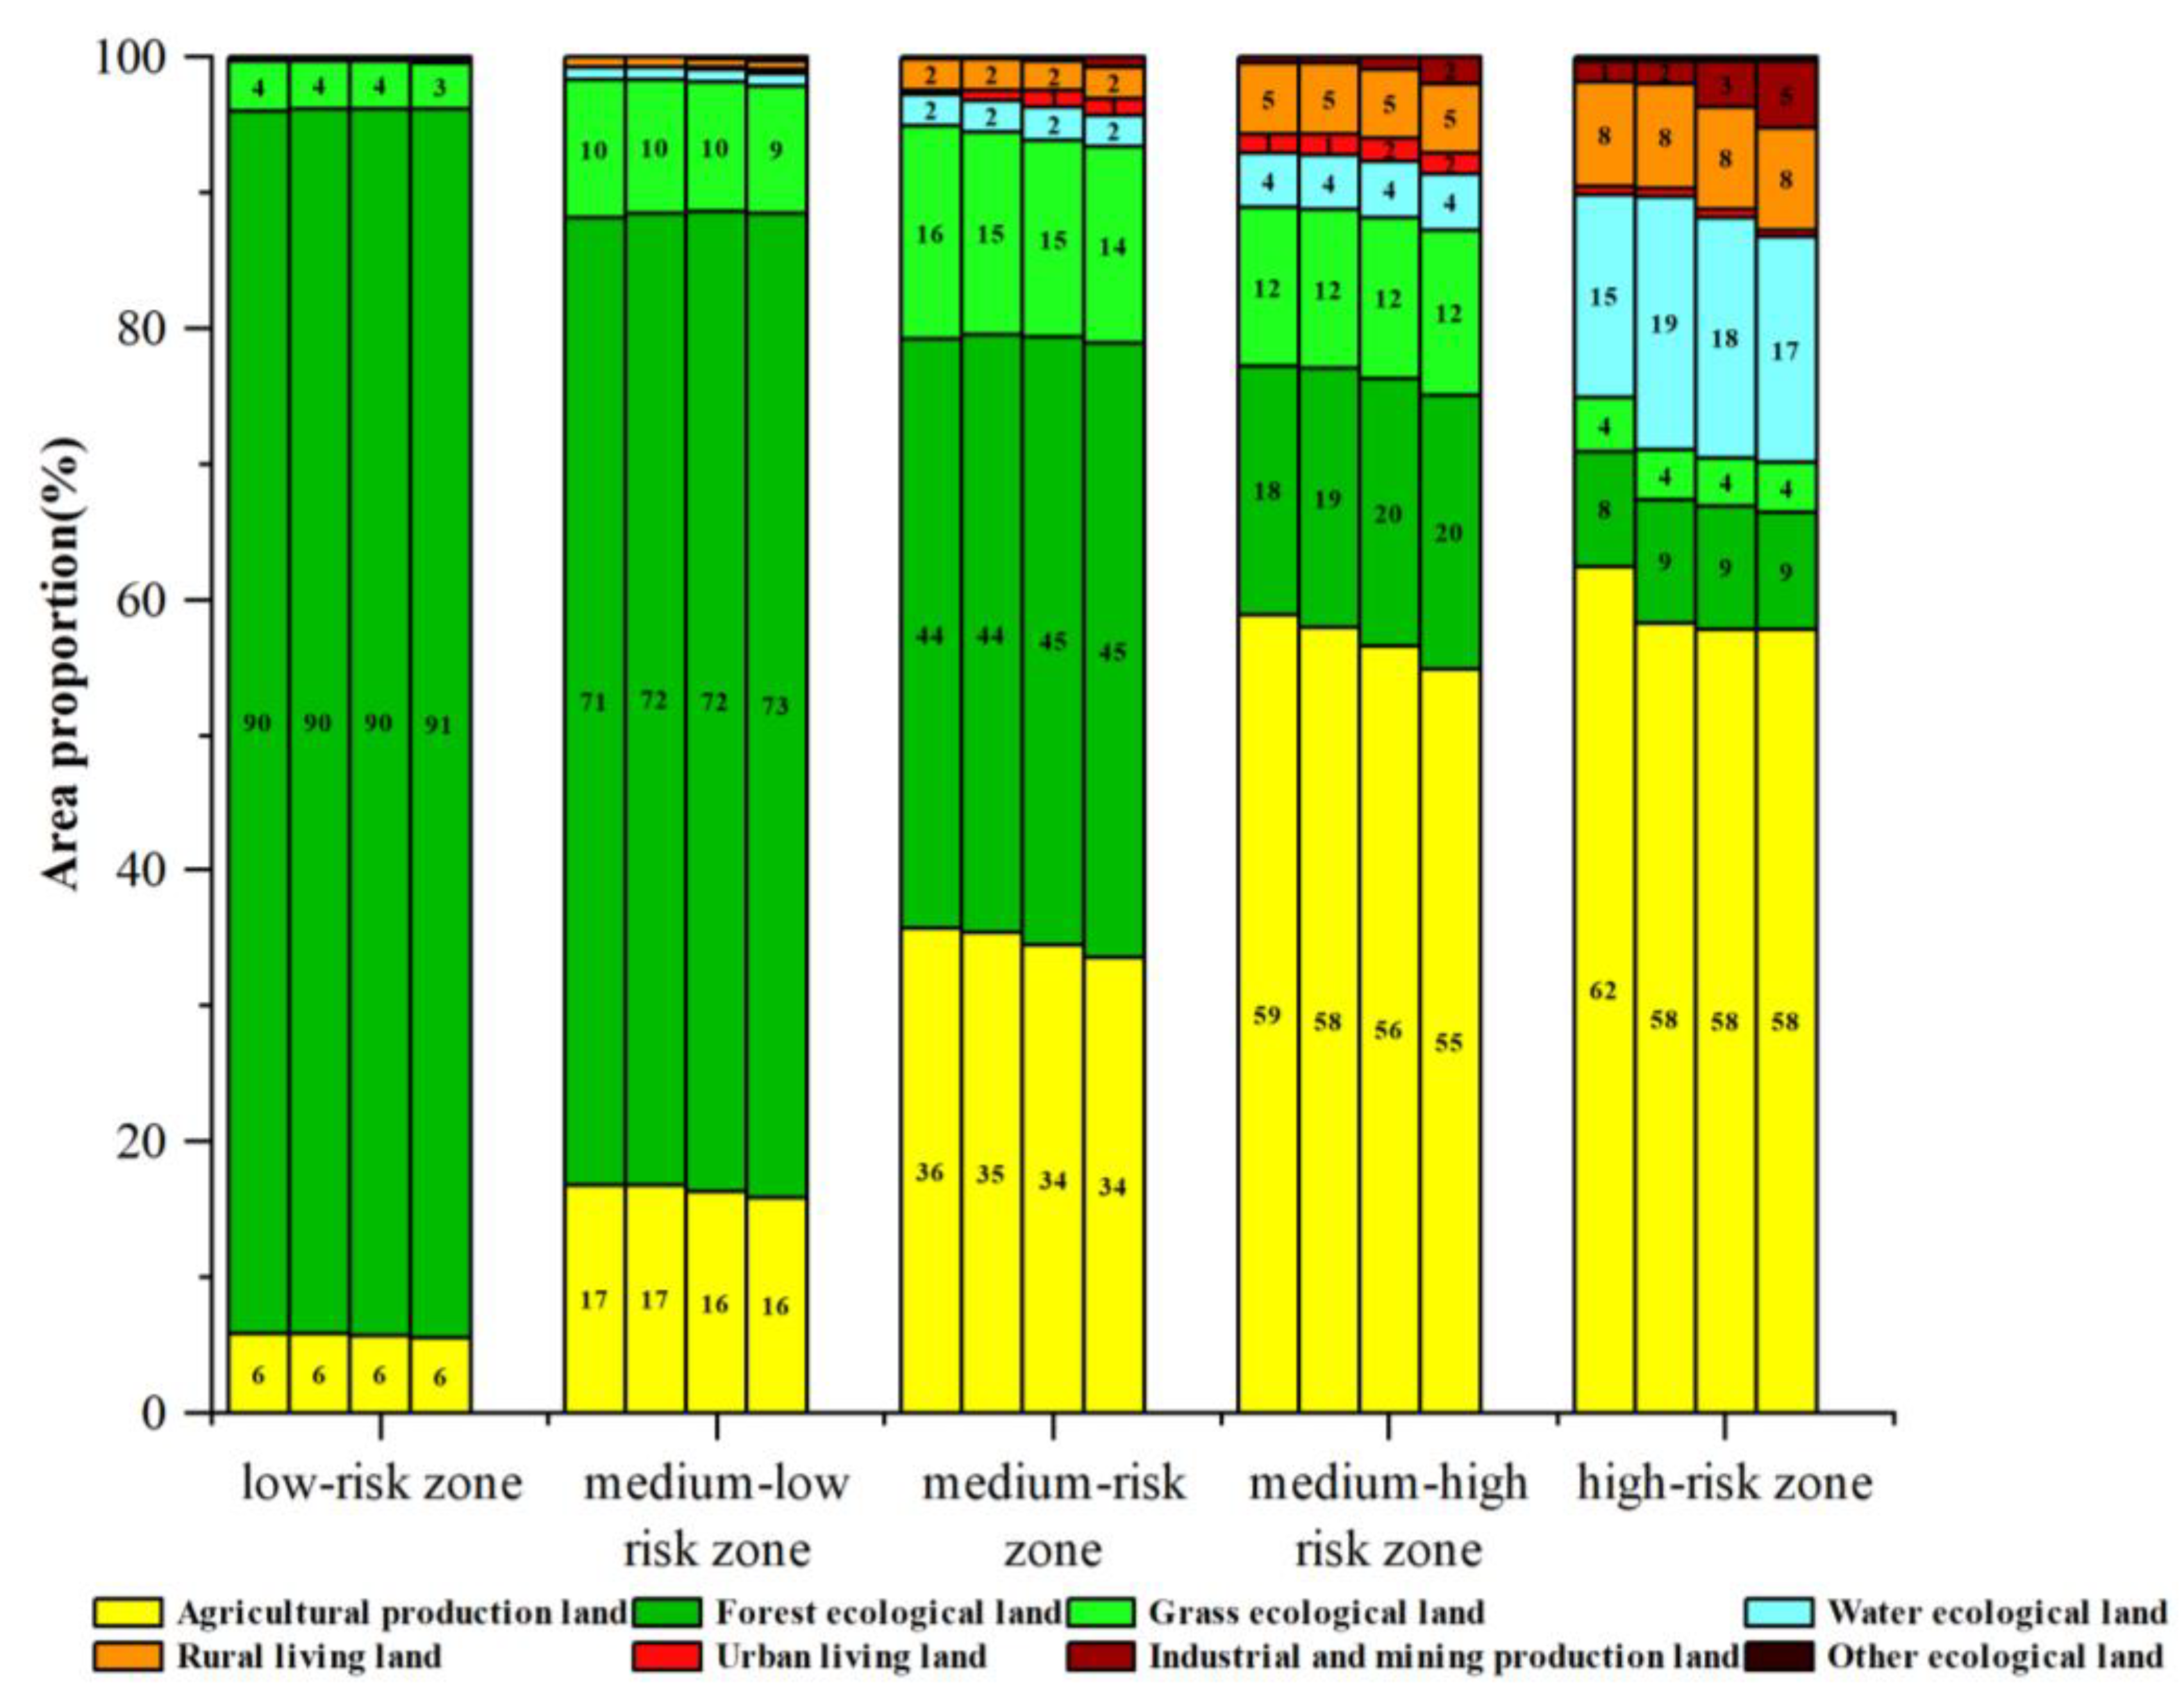
Section 3.1, we can see that the spatial distribution between ecological risk and PLES are closely related. Then, to uncover the detailed relations between the two, the distribution of the PLES in different landscape ecological risk zones was examined (
Figure 6). The low-risk zone was mainly composed of forest ecological land, this mostly distributed in the areas with limited human activities such as mountainous areas, so the landscape pattern was less affected and its ecological risk was relatively low. The medium-low- and medium-risk zones consisted chiefly of forest ecological land, grass ecological land, and agricultural production land, among which the proportion of forest ecological land was the highest, followed by agricultural production land, and finally grass ecological land. The medium-high- and high-risk zones primarily entailed agricultural production land, which accounted for more than 55% of their area; because agricultural production land was mostly located in the rural areas, it was prone to displacement and fragmentation by other land use types. In addition, about 15% of the high-risk zone was occupied by water ecological land, mainly because of its scattered spatial distribution and high susceptibility to human activities; hence, its landscape ecological risk was very high. Three types of construction land were found predominately distributed in medium-, medium-high- and high-risk zones. Specifically, the proportion of rural living land occurring within medium-high- and high-risk zones exceeded that of urban living land, as the former had a more scattered layout, and incurred severe fragmentation and isolation. To the contrary, the urban living land showed a trend of continuous conversion to the medium-risk zone as a consequence of the significant decrease of its own landscape fragmentation and isolation, indicating that its landscape pattern was gradually optimizing.
4.3. Comprehensive Eco-Environmental Effects Caused by Land Use Transition
4.3.1. Spatio-Temporal Evolution of Comprehensive Eco-Environmental Effects
By overlaying the spatial distribution of eco-environmental quality and landscape ecological risk, the proportion of each landscape ecological risk zone in the corresponding eco-environment quality zone was obtained (
Table 9). During 1990–2018, except for the low-quality zone, the landscape ecological risk of all zones tended to rise, and the area of increased landscape ecological risk zones was significantly larger than that of the decreased ones; furthermore, the landscape ecological risk of the low-quality zone tended to decline, with the area proportion of medium-low risk rising by 1.41%. With the advancement of land consolidation projects, urbanization, and industrialization, the degree of fragmentation to urban–rural living land as well as industrial and mining production land has been alleviated, which led to the optimization of Guangxi’s landscape pattern, and therefore its exposure to less landscape ecological risk. In general, with an improving eco-environmental quality, the overall landscape ecological risk tended to decrease in tandem.
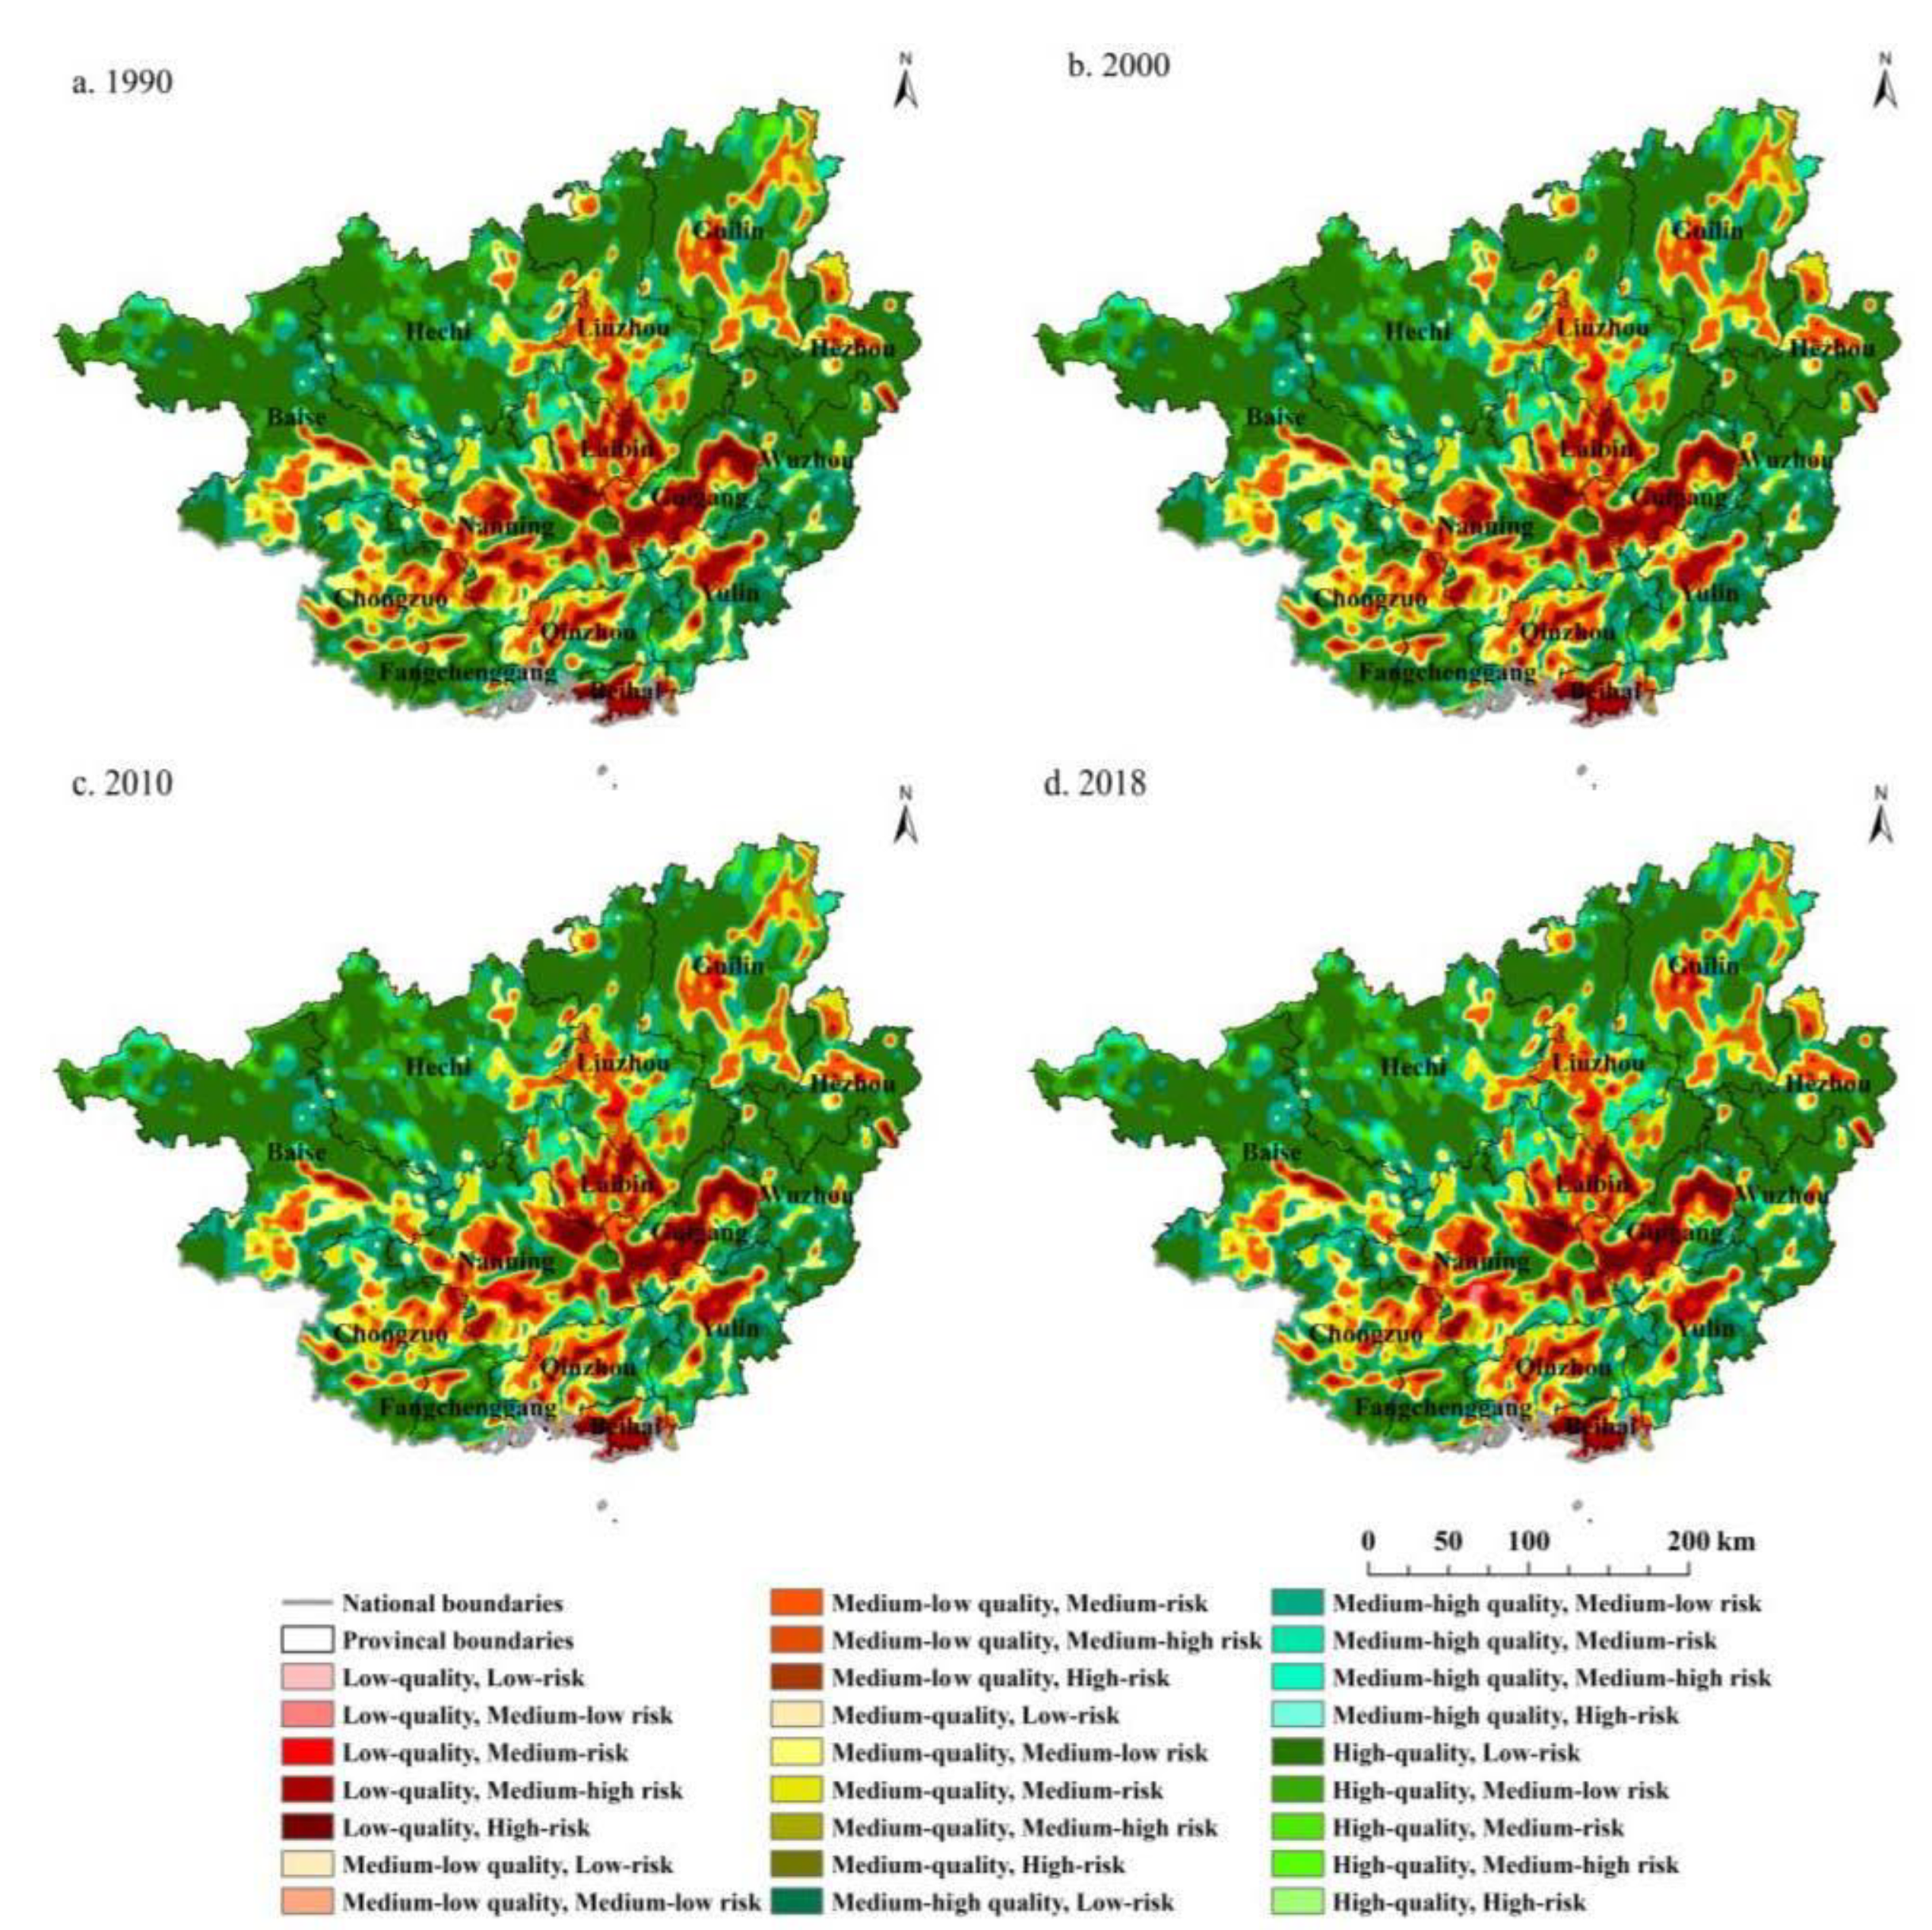
The overlay of the spatial distribution of ecological quality and landscape ecological risk is shown in
Figure 7. As the both production and living space expanded in area, the ecological space was continuously encroached upon, which drove further increases in the total area of the low-quality zone and decreases in that of the high-quality zone. Moreover, accompanied by the enlargement of living and production land, the tiny fragmented patches reduced resulting in a decrease in landscape ecological risk in the low-quality zone too. In contrast to that, the fragmentation of the high-quality zone, namely areas of forest and grass ecological land, and its landscape ecological risk were increasing because of the encroachment from production and living spaces. In short, as both urbanization and industrialization advanced forward, human activities had a more profound impact on the ecological environment, resulting in the deterioration of ecological quality and greater ecological risk in the landscape.
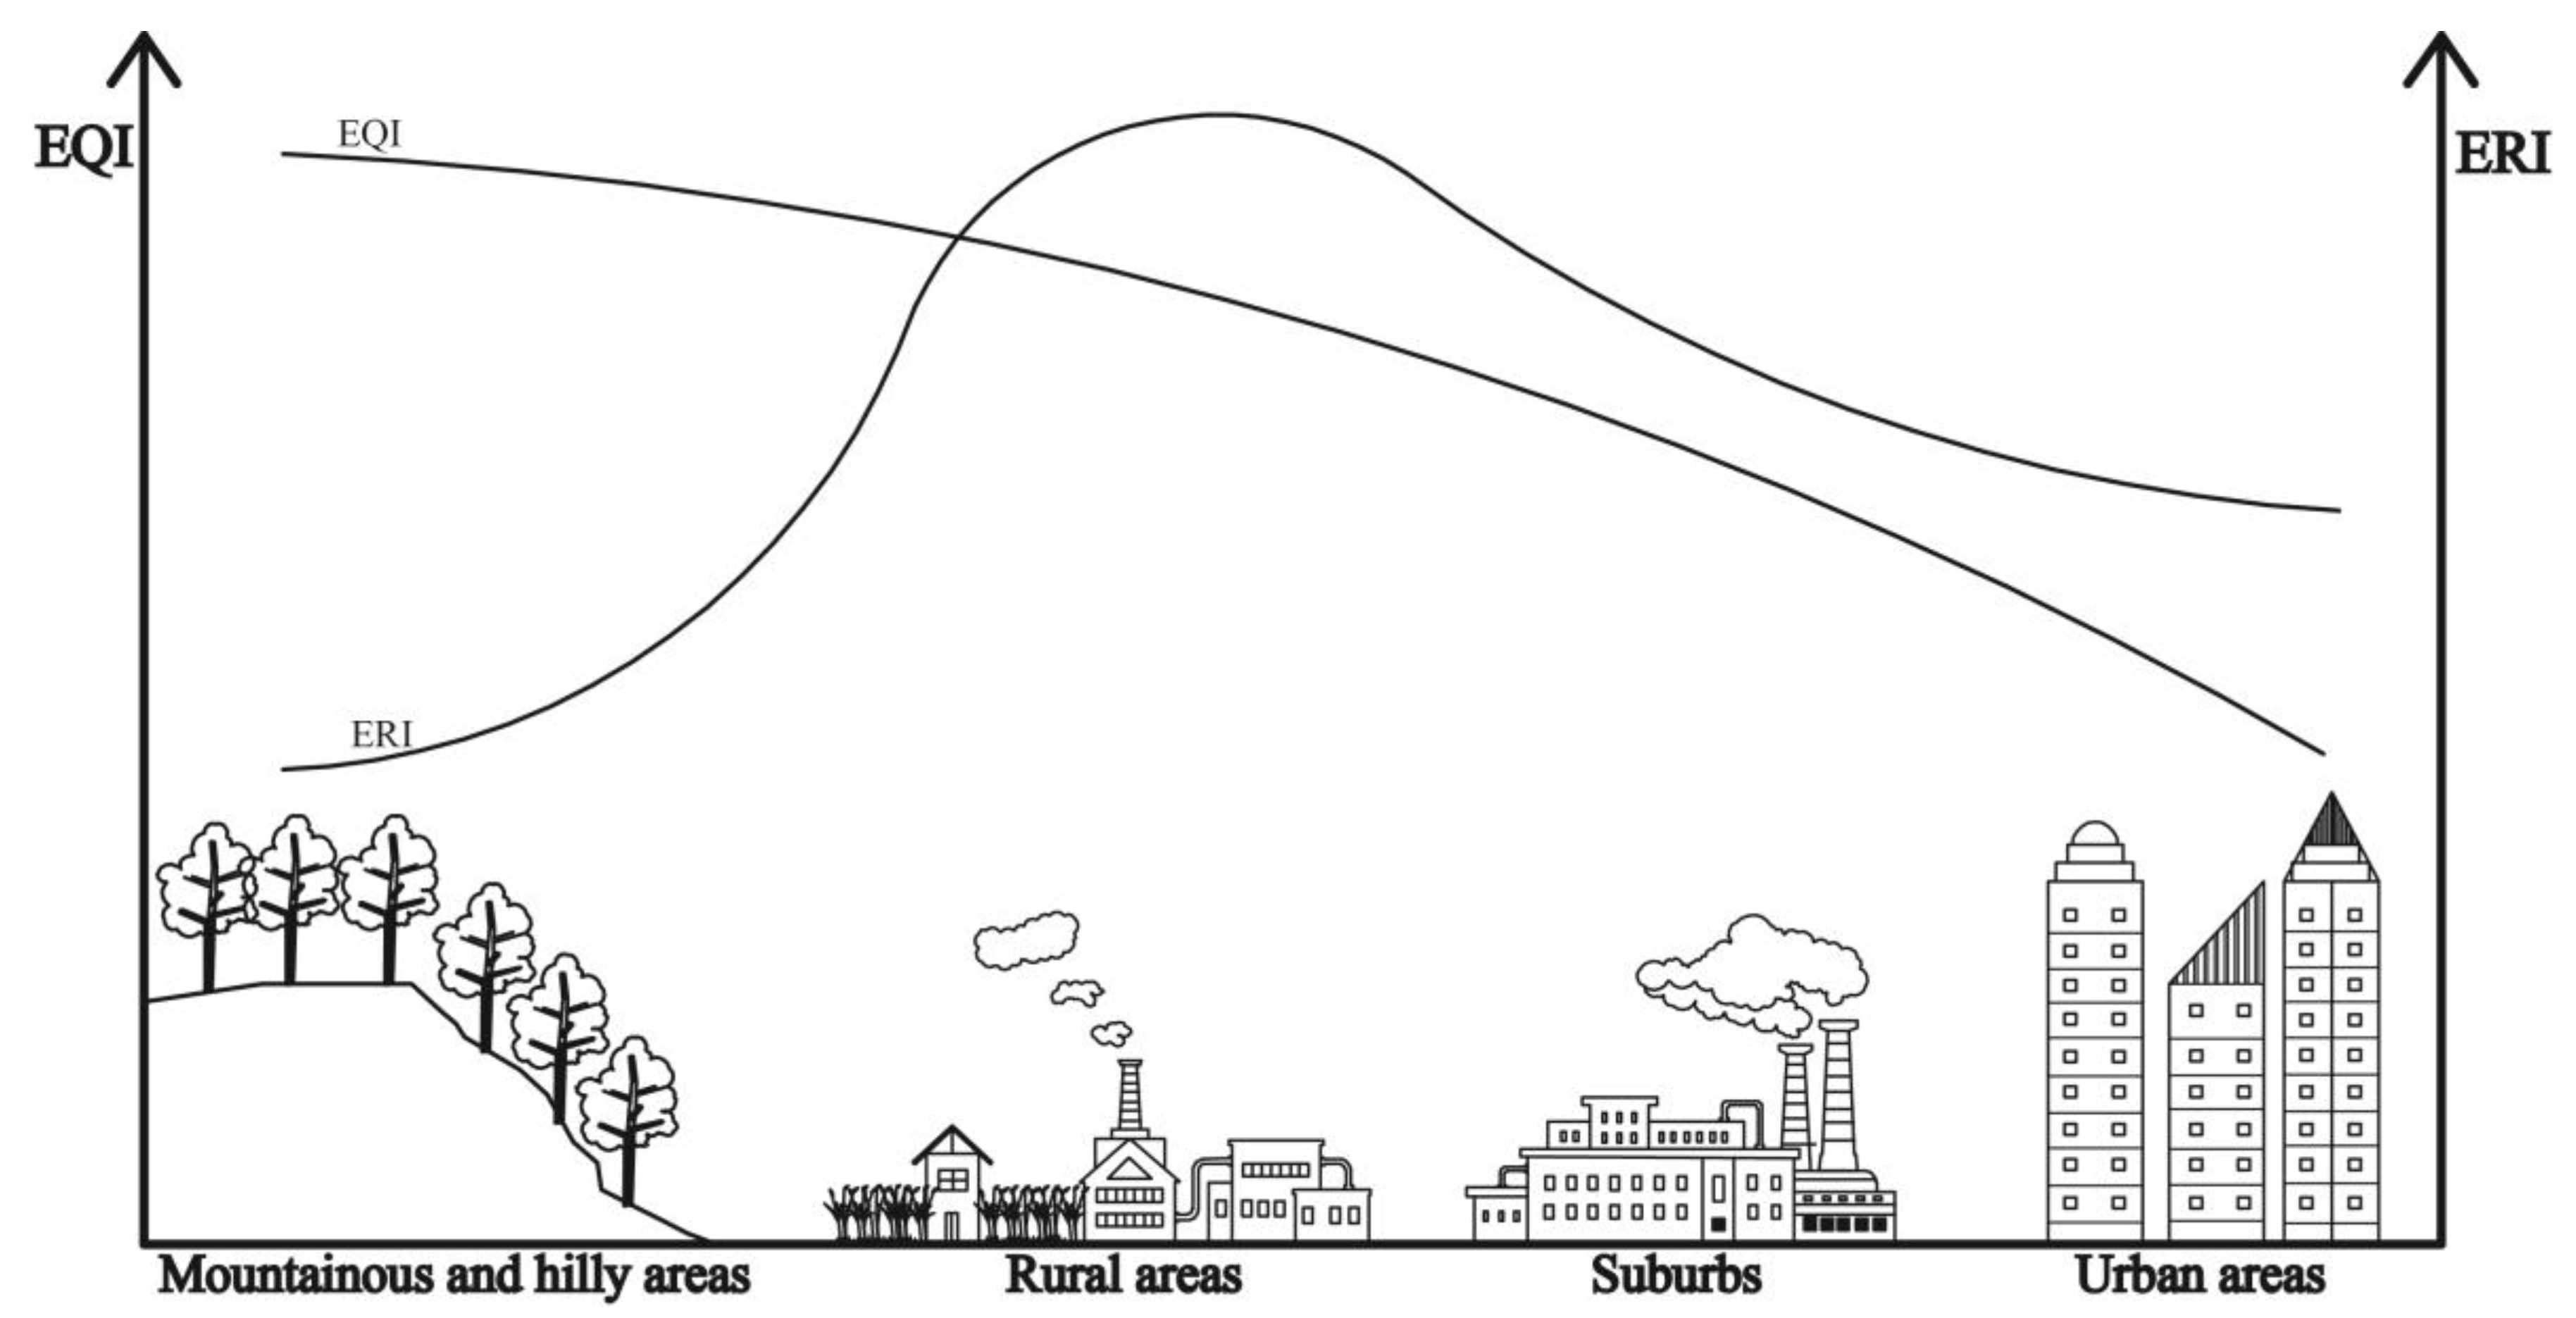
Except for the provincial-scale analysis of comprehensive eco-environmental effects in Guangxi, the eco-environmental effects at small regional scales, such as those at urban and rural scales, are also worth exploring. As depicted in
Figure 8, when moving from the remote forest ecological land barely unaffected by human activities to the rural areas—dominated by agricultural land and rural construction land—into the suburban and urban regions, the landscape ecological risk increased at first and then decreased, whereas over the same gradient the eco-environmental quality continually declined (also see
Figure 6).
4.3.2. Spatial Correlation of Eco-Environment Quality and Landscape Ecological Risk
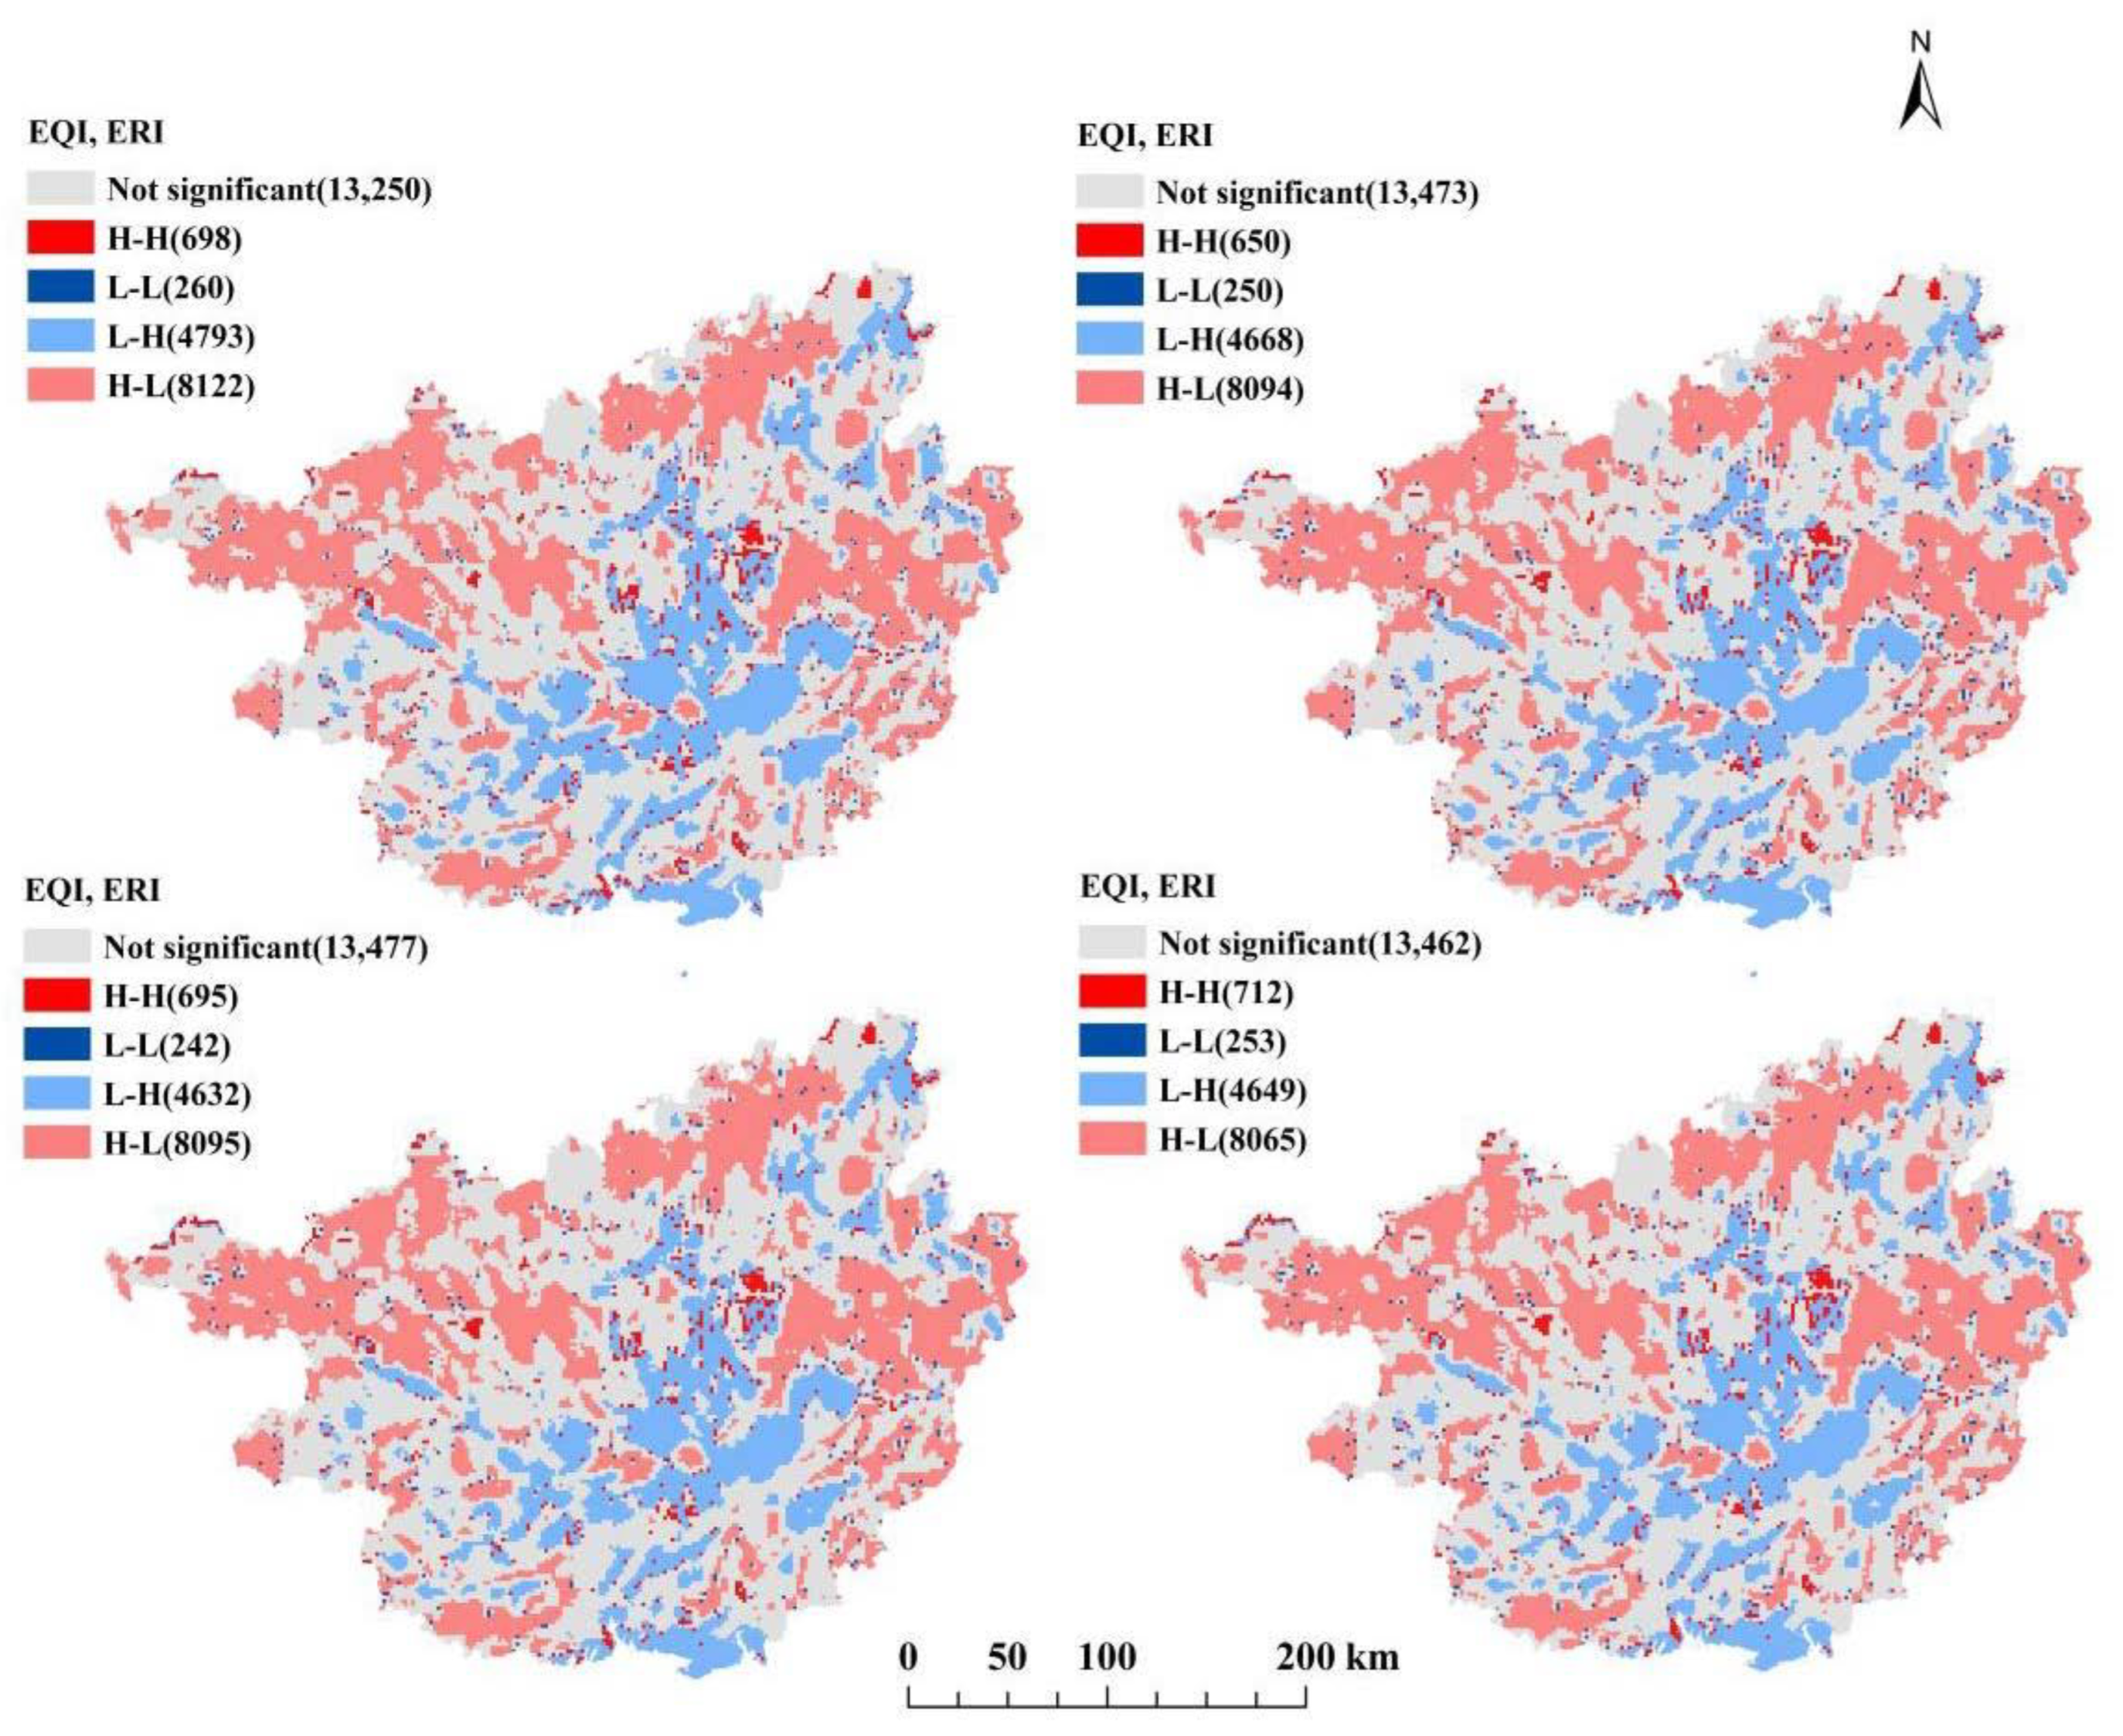
The bivariate global Moran’s I of eco-environmental quality and landscape ecological risk of Guangxi in 4 periods were −0.606, −0.595, −0.585, and −0.585, respectively, with p values less than 0.01 and z-scores less than −2.58, which indicated that the eco-environmental quality and landscape ecological risk showed a significant negative spatial correlation. Meanwhile, the absolute value of the bivariate global Moran’s I showed a decreasing trend, which indicates that the negative spatial correlation was weakening, and it was mainly caused by the decrease in the landscape ecological risk of three types of construction land, and the increase in forest and grass ecological land. According to the results of a bivariate LISA clustering analysis of eco-environmental quality and landscape ecological risk, the high-low, i.e., high eco-environmental quality and low landscape ecological risk, and low-high, i.e., low eco-environmental quality and high landscape ecological risk, were the two major clustering types in Guangxi (
Figure 9). The high-low clustering was mostly distributed in the north, east and west of Guangxi as it was mainly covered by mountainous natural forest, where it was not easily disturbed or damaged by human activities. On the contrary, the type of low-high clustering was mostly concentrated in the middle and south of Guangxi where there were mainly suburban and rural areas, and these places were covered with scattered rural settlements, small-scale industries and quantities of farmland with low eco-environmental quality and high landscape ecological risk among all the land use types. By comparing the four clustering maps during 1990–2018, we can clearly find that the overall grid numbers of high-low and low-high clustering showed a decreasing trend, signifying that the negative spatial correlation was weakening. Meanwhile, the grid numbers of high-high and low-low clustering mainly showed increase and decrease tendencies, respectively.
5. Discussion
In the process of rapid urbanization and industrialization, land use transition in Guangxi has triggered the frequent influx and efflux of PLES, which has led to significant changes in both quantitative and spatial structures of land use and further influenced the regional ecological environment in these two aspects. In terms of
EQI, the rapid expansion of living space and industrial and mining production land in Guangxi has caused the low-quality zone to spread and led to the deterioration of the overall
EQI in the region. This result is similar to findings reported in some recent studies, which show that the expansion of construction land and the contraction of ecological land are inevitable when trying to promote regional development in certain regions [
10,
58]. However, in other particular regions, by controlling the expansion of construction land and strengthening the protection of ecological land, the government has made the
EQI of the region stable or even increased it in the process of development [
5,
64]. In terms of the
ERI, in those regions undergoing fast economic development, due to their excellent ecological foundation and mature urban development patterns, the
ERI may tend to decline with more urbanization and industrialization, as demonstrated in several existing studies [
65,
66]. In addition, based on existing research, we analyzed the spatial correlation between
EQI’ and
ERI’ distribution via spatial superposition analysis and the bivariate Moran’s I—which has received less attention than it deserves in contemporary research—in order to further explore their spatial associations.
The mountainous and hilly regions in Guangxi constitute almost 70% of its total area and are prone to ecological issues, namely soil and water losses and rocky desertification; hence, its ecological environment is relatively fragile [
27]. In the past 28 years, Guangxi has undergone a drastic land use transition process, one accompanied by changing dynamics of PLES and a reshaping of its landscape pattern, which has further affected the regional ecological environment. Therefore, how to increase regional eco-environmental quality while also lowering ecological risk, by coordinating the structure and layout of the PLES during the rapid developing process, warrants in-depth study in the future. Urban living land and the industrial and mining production land were the two fastest expanding land use types during 1990–2018. Therefore, they need to be strictly controlled by the red line of the urban and town development boundary in the spatial planning of national land in the future, to avoid the massive external expansion of those two land use types, while internally improving the degree of land agglomeration and intensifying the level of land use. Rural land, especially its agricultural land, should strictly comply with the red line of basic farmland protection under the context of promoting the national rural vitalization strategy. In addition to that, efforts should be made to optimize the structural and layout of rural housing land and farmland to reduce the degree of landscape fragmentation via comprehensive land consolidation. Regarding ecological land, it is of great importance to restrict human activities there, such as deforestation, by referring to the red line of ecological protection, and to continue implementing ecological protection policies; for example, the “returning farmland to forest” policy should be used, in order to stabilize the regional eco-environmental quality and reduce the external landscape ecological risk as much as possible.
The process of changing from one land use type to another does not occur by following a certain rule; rather, it frequently happens in a chaotic manner, making it difficult to predict the future degree of transition in terms of its quantity and structure. So, in order to determine the inner relationships among land use transition, eco-environmental quality, landscape ecological risk, and their interactions, a research framework that addresses the comprehensive ecological effects of land use transition was designed and applied here on the basis of existing relevant studies. Its major characteristic advantage is that it enables more detailed and comprehensive analyses and inferences when compared with other approaches previously used. However, we should note the influencing variables and driving processes were not examined in detail here. In the future, it is vital to perform an in-depth investigation of the internal mechanism(s) of land use transition that influences eco-environmental by integrating economic, social, natural, and other pertinent factors. In addition, the modification of research techniques to more accurately represent the eco-environmental effects generated by the land use transition requires greater exploration. For example, obtaining higher precision remote sensing data and using the moving window method to assess the ERI can yield higher precision in the findings. Moreover, it is worth exploring how to construct a robust model that can include both quantitative aspects and the spatial structural transformation of land use to better measure the ecological effects of land use transition in a more comprehensive way.
6. Conclusions
From the viewpoint of PLES, the characteristics of the land use transition in Guangxi were first analyzed in this paper, and then both the single and comprehensive eco-environmental effects caused by land use transition were examined. The key results are as follows:
(1) Ecological space dominated the PLES of Guangxi, corresponding to ca. 75% of its total area; however, the ecological space kept shrinking during 1990–2018. The living space and production space increased substantially at the expense of the massive occupation of agricultural production land and forest and grass ecological land. Although various land consolidation projects and forest protection policies were implemented to maintain the stability of farmland and forest land, both still showed a significant decreasing tendency.
(2) Guangxi’s overall eco-environmental quality was relatively high, with high-, medium-high- and medium-quality zones as its major types, these together accounting for about 60% of Guangxi’s total area. Its spatial pattern of eco-environment quality is best described as “low in the center and south, high in the surroundings”. Yet, eco-environmental quality featured a significant downward tendency, this characterized by the contraction of its high-quality zone while the low-quality zone kept increasing. In general, the eco-environmental quality’s degree of deterioration surpassed that of its improvement in Guangxi during 1990–2018.
(3) Contrary to eco-environmental quality, Guangxi’s landscape ecological risk was at a relatively low level, with the low-, medium-low-, and medium-risk zones being its major types. The high-risk zone was mainly concentrated in the central and southern regions of Guangxi, especially the rural areas and margins of cities and towns. The low-risk zone was mainly concentrated in the eastern, western, and northern areas especially the remote mountainous and hilly regions. The urban area chiefly constituted the medium-low-risk zone. Except for the low-risk zone, the other zones exhibited a continuous increasing trend, one mainly characterized by greater risk to ecological space.
(4) At the spatial scale of the whole of Guangxi, human activities in its eco-environment resulted in diminished eco-environmental quality coupled with augmented landscape ecological risk in Guangxi. However, at the urban–rural scale, from the remote areas mainly covered by forest to the rural areas mostly characterized by rural housing land and farmland, and finally to urban areas with lots of construction land, the eco-environmental quality showed trends of gradual decline, whereas landscape ecological risk presented a tendency of initially declining and then rising. The bivariate global Moran’s I indicated that the spatial distributions of the above two components (quality and risk) are distinguished by a significant negative spatial correlation. However, the significance declined slowly over time, largely due to the sharp decline of urban landscape ecological risk and the expansion of ecological space.
(5) Most notably, the disordered occupation and cutting of agricultural production land and forest and grass ecological land by urban living land and industrial and mining production land not only led to a lower overall eco-environment quality, but also greater landscape ecological risk; this can be understood as the essence of the ecological environment effects of the land use transition in Guangxi. In accordance with the requirements of the “three zones and three lines” in the spatial planning of national land, we should strictly protect both the ecological space and agricultural production space, and improve overall landscape connectivity and concentration while reducing fragmentation.


