Article

Integrated Multi-Level Assessment of Ecosystem Services (ES): The Case of the Casal del Marmo Agricultural Park Area in Rome (Italy)

by
Davide Marino
1,
Giampiero Mazzocchi
2,*,
Davide Pellegrino
3 and
Veridiana Barucci
4,†
1
Department of Biosciences and Territory, University of Molise, 86090 Pesche, Italy
2
Council for Agricultural Research and the Analysis of Agricultural Economic, 00187 Rome, Italy
3
Agriconsulting, 00189 Rome, Italy
4
Sustainable Development Foundation, 00198 Rome, Italy
*
Author to whom correspondence should be addressed.
Currently no longer in the foundation.
Land 2022, 11(11), 2055; https://doi.org/10.3390/land11112055
Submission received: 15 September 2022 / Revised: 3 November 2022 / Accepted: 12 November 2022 / Published: 16 November 2022
(This article belongs to the Special Issue Agriculture in Urban Food Systems: Models and Practices)

Abstract

:
The aim of this study was to investigate the role of the ES assessment within a “place-based policy-mix model” for urban planning testing and integrating three ES assessment methodologies: (1) mapping and assessment, (2) expert-based evaluation and (3) social perception. The results indicate that (1) mapping assessment provides higher values to the regulating ecosystem services, (2) expert-based evaluation provides slightly lower values to the regulating ecosystem services and (3) social perception highlights the importance of cultural ES but tends to underestimate other ecosystem functions. These three methodologies translate into sectorial and nondialoguing policies for which decisions are made on partial and nonintegrated information. In order to design integrated policies with a view to the sustainability of the local food system, our results indicate that the planning of urban and peri-urban agricultural areas should rely on tools capable of integrating both spatial mapping methods and human-based assessment methodologies.

1. Introduction

According to United Nations prospects, in 2020, 56% of the world’s population lived in urban settlements. While in 1990, this ratio was almost perfectly inverted, the outlook for 2050 foresees that the population living in urban areas will achieve 68%, with a total population of close to 10 billion individuals [1]. This trend is likely to expand, and the urban density will grow. In Europe, in 2020, three-fourths of the population lived in urban areas, while in 2050, the ratio of the urban population to the total EU population is expected to reach 83% [2]. In this context, it is crucial to maintain, recreate and/or enhance natural and semi-natural ecosystems producing regulating, supporting, provisioning and cultural (e.g., recreation opportunities) ecosystem services (ES) [3]. As ES can be positively and negatively affected by land use change [4], their assessment and analysis can be useful in urban planning, especially when a plan or a project can have a significant impact or when alternative choices can have very different effects on ES [5], for example, in situations where co-use seems to be impossible (e.g., housing development vs. nature conservation) or when two or more desired ES either cannot be delivered at the desired magnitude or strongly inhibit each other, e.g., agriculture vs. flood control. The topic of ES evaluation-driven choices is strictly linked to the increased presence of urban and peri-urban agriculture (UPA) discourses in the debate on urban planning [6]. UPA is emerging as an element of urban planning policies and practices, and it is increasingly recognized as a key practice concerning sustainability, particularly of food systems [7]. Furthermore, Wilhelm and Smith recognize that UPA can represent a mechanism for preserving and protecting sensitive natural ecosystems and their associated ES [8]. As recognized, the incorporation of agri-ecosystems into cities represents a significant paradigm shift in urban planning and design [9,10], and its success will require a sufficiently broad inquiry from the scientific community that addresses existing (e.g., environmental) concerns [11]. However, despite “a groundswell of interest” [12], little is known about the cumulative impact of UPA on the provision of ES. Furthermore, the disparity of methods to quantify ecosystem services has brought their lack of application when it comes to land management, economic and policy decisions [13]. Against this backdrop, urban food policies (UFPs) increasingly consider UPA as a strategic asset for tackling challenges ranging from food production to biodiversity and landscape, climate-resilient cities to recreational and training objectives, and nutrition to circularity of production [14,15,16]. In the city of Rome, many food-related topics have emerged over the last decade, seeking to re-engage citizens and reignite the debate on sustainable, healthy and local food, including multifunctional urban and peri-urban agriculture projects [17,18]. Despite the discourse on UPA undergoing large momentum within the Rome Food Policy Council, it has still not been stated which methodological areas for UPA will be chosen and based on which ES evaluations. For this reason, the objective of this research was to identify and test different ES evaluation methodologies to provide the most realistic information for the planning of UPA. Given the relevance of UPA in Rome, the test was performed on a city agricultural park, with the aim of testing a multicriteria method versus a single-method scenario.

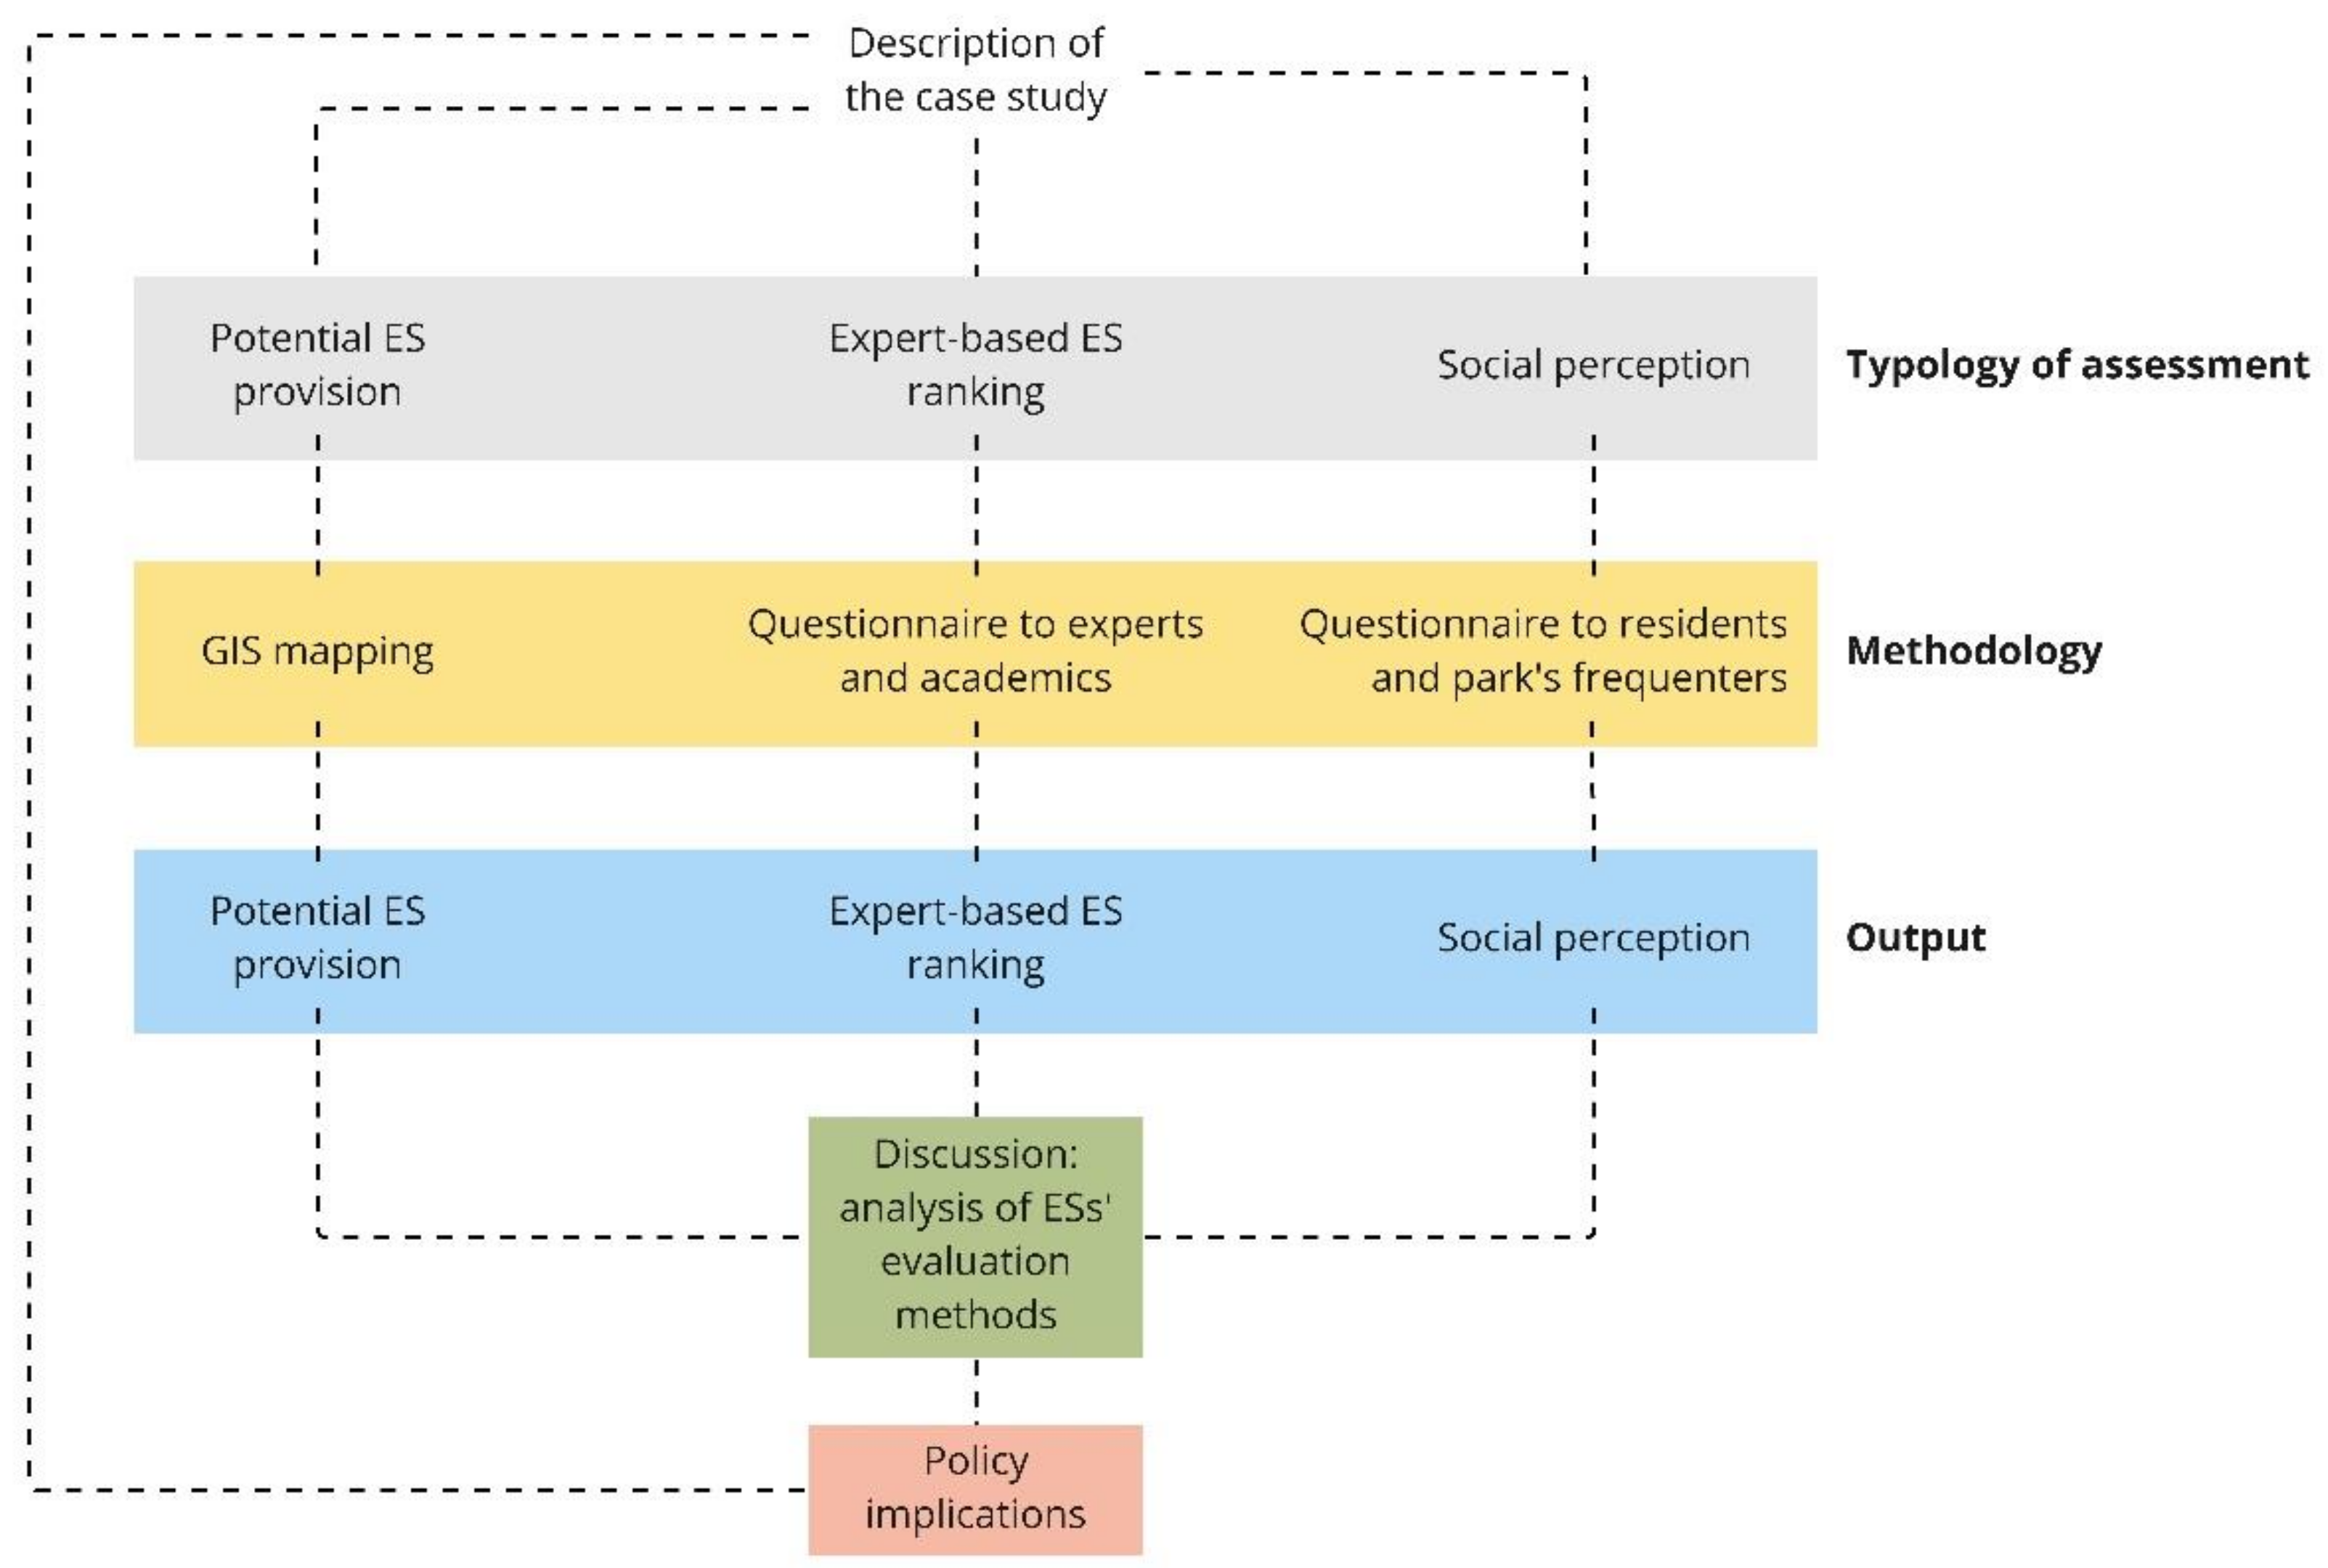
2. The Research Design

In order to contribute to the discussion on urban planning, particularly regarding the planning of agricultural urban areas, in this research, we investigated the role of multiple approaches to ES assessment testing and integrated three different techniques for assessing ES in the area of Casal del Marmo Agricultural Park (CMAP) in the city of Rome (see Figure 1). Our approach combined three different assessment levels to define and select the main ES:
  • Mapping and assessment of the potential ES provision according to MAES approach [19].
  • ES ranking and evaluation through an expert-based analysis.
  • ES ranking and evaluation based on residents’ perception.
For the context analysis, we referred to the existing literature on the Casal del Marmo Agricultural Park area and the regulatory plan of the city of Rome for this area. To assess the ES provided by the agricultural park, we adopted an approach based on the European Union (EU) initiative for Mapping and Assessment of Ecosystems and their Services (MAES) that utilizes Corine land cover/land Use classes from 0 to 3 [20]. As for the expert-based analysis and the residents’ perception analysis, two different questionnaires were used to collect data on the ES associated with the agricultural park, and an ES ranking was consequently performed. The details of the methodologies utilized are shown in the paragraph 3.2 (see Supplementary Materials).

3. Materials and Methods

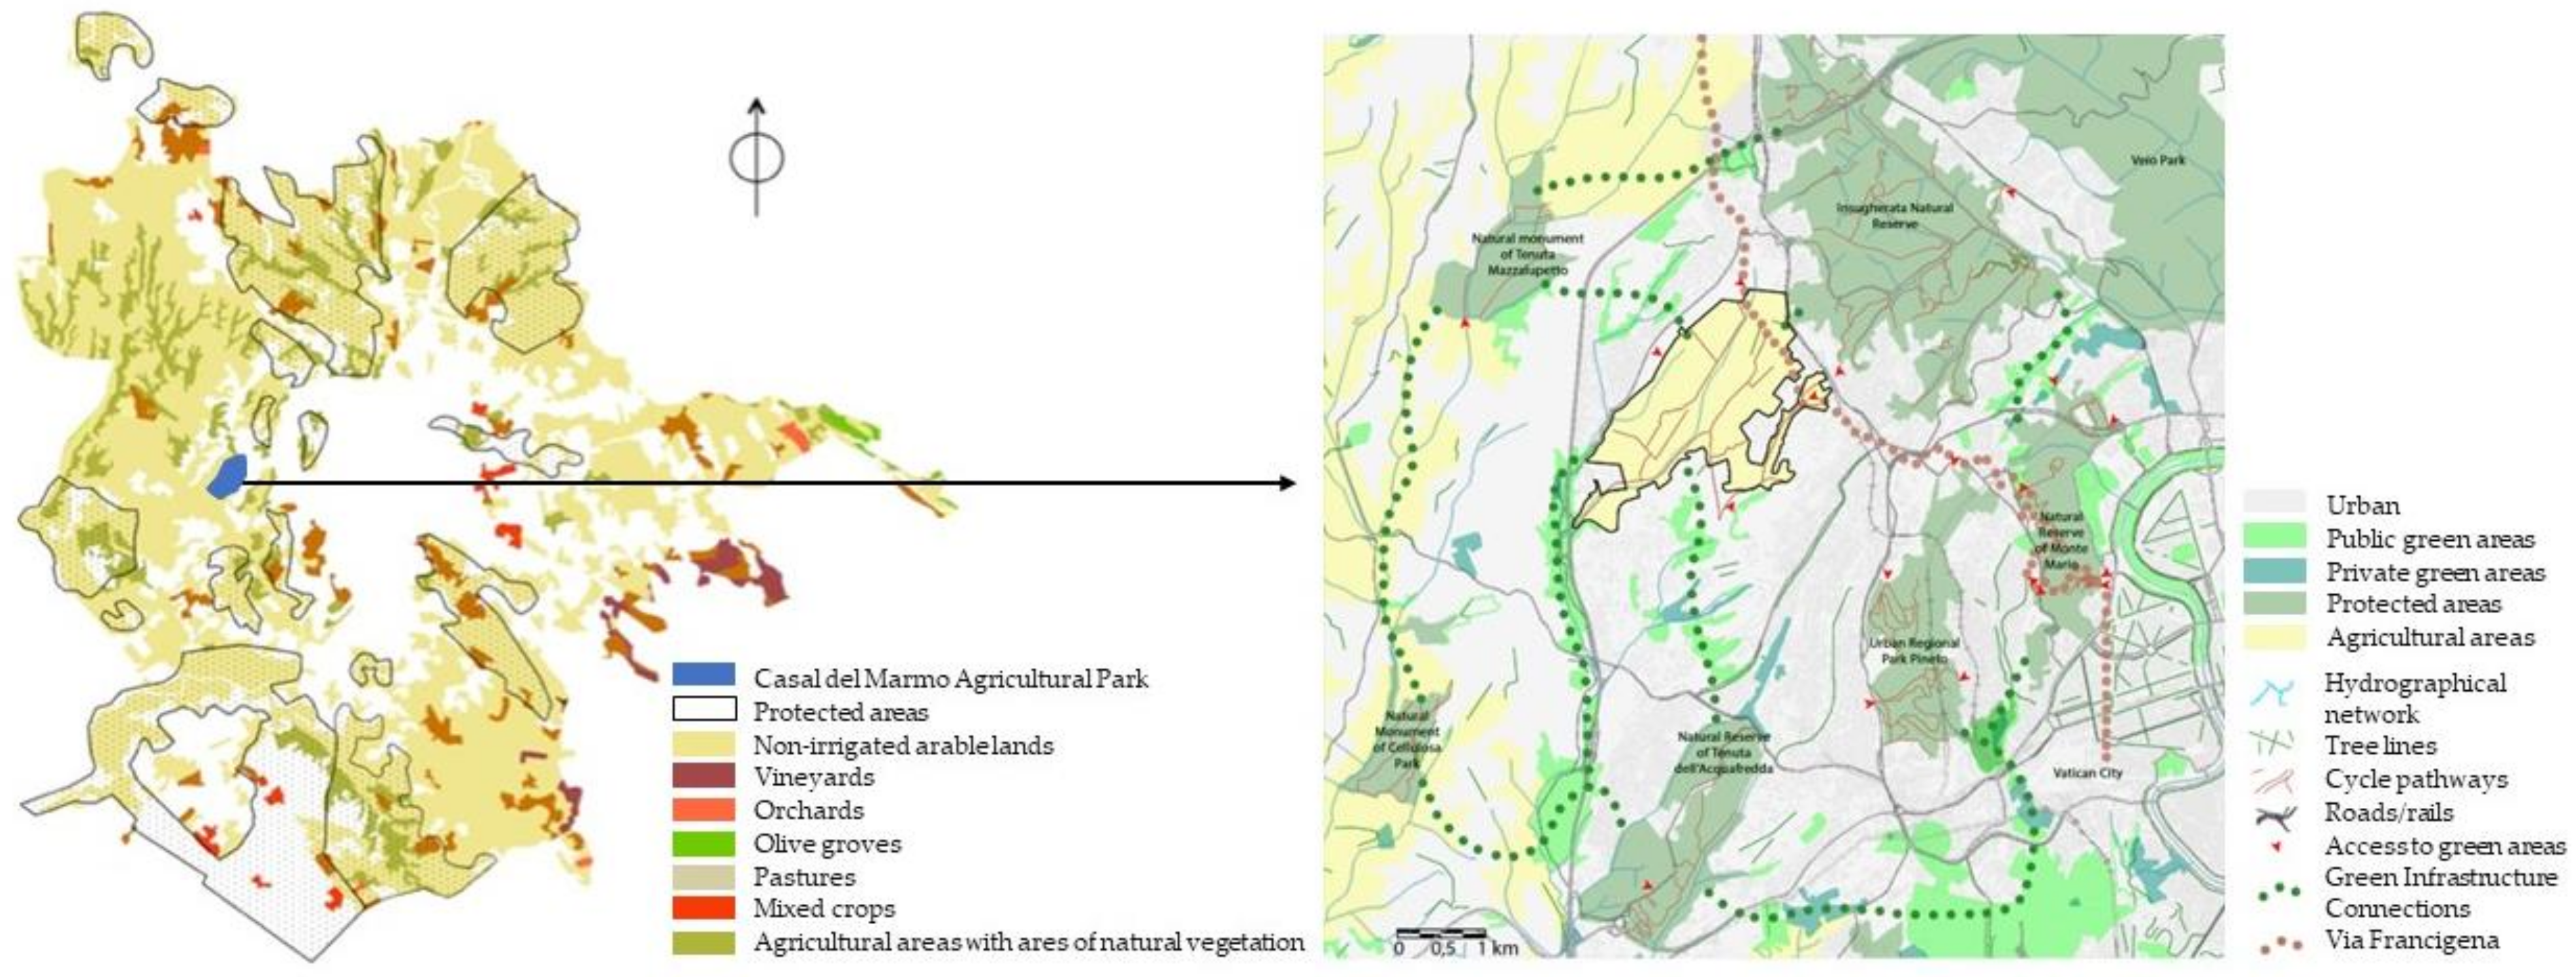
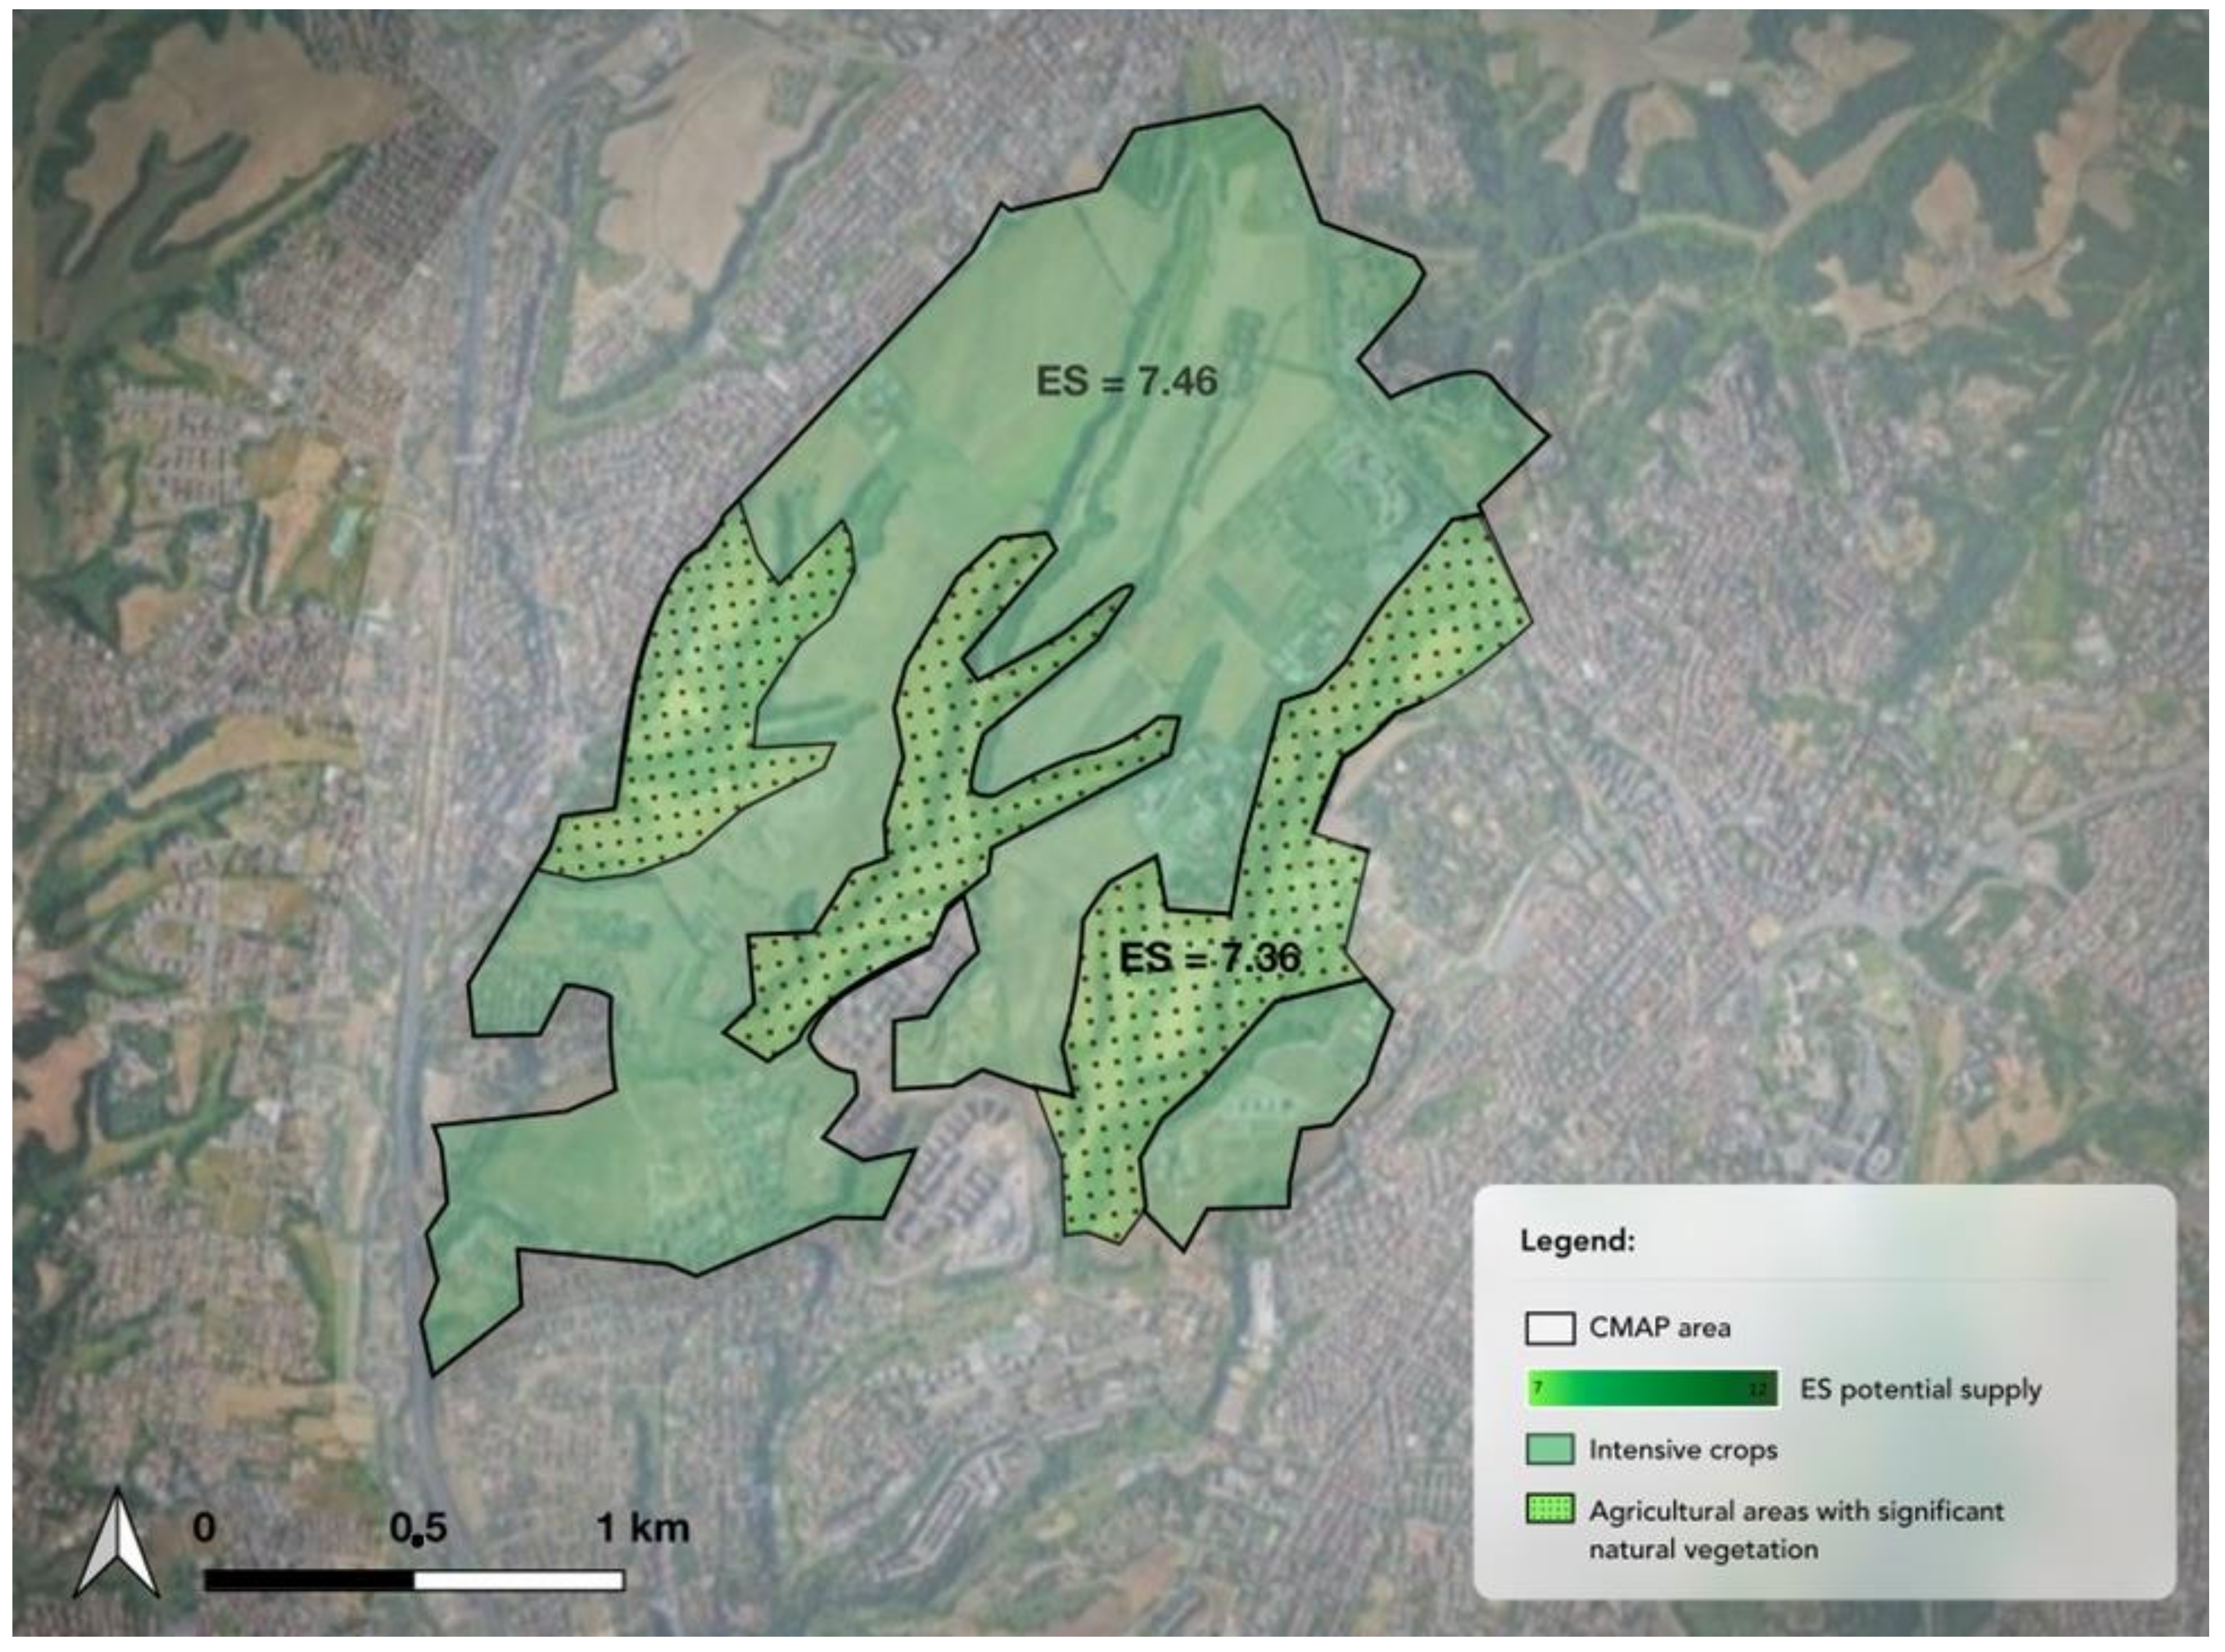
3.1. Description of the Study Area and Planning Context

The Casal del Marmo Agricultural Park (CMAP) is one of the most important of Rome’s agricultural parks, as noted by the Provincial Land Master Plan (PTPG). The CMAP is a complex agroecosystem that represents one of the main remaining portions of the traditional Roman countryside (“agro romano”) before the rapid expansion and intensive urbanization of Rome [21,22]. It is situated in the northwest of the Metropolitan City of Rome, within the so-called “GRA”, the main ring road surrounding the city, in a neighborhood with an especially high population density. The CMAP measures 604 hectares, 74% of which are covered by “nonirrigated arable land”, while the remaining 26% consists of “land principally occupied by agriculture, with significant areas of natural vegetation” (respectively, Corine Land Cover classes 2.1.1 and 2.4.3 [23]). It must be clarified that the Corine classification, for some classes, reaches the 5th level of study. In the study area, the class 2.1.1.1. “Arable land in nonirrigated areas” is present. However, the methodology adopted in this research relies on that deriving from the LIFE + Making Good Natura project (see Section 3.2.1), which reaches the 3rd level. For this reason, in the text, we used the wording 2.1.1 “Intensive crops”.
CMAP also includes several archaeological sites, nineteenth-century buildings and some relevant public infrastructure, such as a hospital, a high school, a juvenile prison and an ex-mental hospital. It is also surrounded by other large green areas that are now protected as a natural reserve or nature park, included in Roma Natura, the regional authority in charge of managing natural protected areas in the municipality of Rome, (approximately 16,000 ha, mainly used for farming activities). In Figure 2, the different “patterns” (i.e., urban, public green areas, private green areas and agricultural areas) and “pathways” have been highlighted, defined as both linear elements of the ecological network (hydrological network and tree lines) and roadways for people (cycle paths, railway, roads and accesses to green areas) as well as potential connections between major green spaces. In the urban pattern, there are still unsealed areas, classified as protected areas or public or private agricultural areas. These are surrounded by a variety of private and public green remnants (urban gardens, playgrounds, etc.).

3.2. ES Assessing Methods

Approaches using ES value comparisons are well-known and widely used in the literature [24], especially with respect to evaluations using land use analysis (GIS mapping) and expert evaluation (bullet points 1 and 2). In our research, we added social perception to these two types of analysis through a methodology described below (see Section 3.2.3). Furthermore, the three methodologies were compared using an adapted framework from Mapping and Assessment of Ecosystems and their Services (MAES), a program launched by the European Commission with the aim of improving and promoting evaluation methods [25]. Particularly, the framework was adapted in order to provide a sound set of comparison elements:
  • Resource needed/costs: costs related to each methodology;
  • Preconditions/needs: skills, activities, previous information and ex-ante analysis needed to carry out the methodology;
  • Output/products: typology of output and related considerations deriving from each methodology;
  • Results: insights from the results’ analysis, providing considerations deriving from the research.

3.2.1. The Analysis of the ES (Potential Provision)

The MAES initiative intends to map ecosystem services to control and monitor the state of the environment, an action that supports the recognition of the role of ecosystems that planning and decision-making processes must consider. The mapping work is also valid to explain environmental problems by locating them in space and to help define the economic value of the ES. In addition to this, the maps on ES potential supply are acknowledged communication tools among the stakeholders involved in managing ecosystems, capable of providing help for the implementation of decisions to safeguard, protect and control the supply of the ES. The methodology for the analysis was based on the potential provision of ES in the CMAP from different land uses. This approach has been developed in several studies and research projects (e.g., LIFE + Making Good Natura—Making public good provision the core business of Natura 2000 [26,27,28]) inspired by Costanza and his team’s studies [29,30]. The shapefile with the boundaries of the CMAP and one containing the land cover [31] were overlaid. According to the classification of the EU CORINE project, the CMAP area was obtained with the selection of all the non artificial polygons contained or intersecting the perimeter of the CMAP. Taking the third level of detail as a reference from the Corine Land Cover (CLC), a relevance class was attributed to each land use class (3—very relevant, 2—moderately relevant, 1—with some relevance and 0—no significant relevance) [26]. This class was determined considering: (a) previous similar assessments [32,33], (b) expert opinions, (c) function density, (d) potential distance from demand and (e) intrinsic biodiversity [27]. This approach has been tested and applied in published studies [34,35]. The final result was a matrix that showed the ES provided by the individual Corine land cover classes and the related map.

3.2.2. Expert-Based Analysis

A group of national and international experts, ranging from researchers, architects, planners, engineers, agronomists, economists and local committees and public administrators, were surveyed in 2015 over a 3-day workshop for collaborative planning of the CMAP, held in Rome. The representativeness of the experts was inherent in the type of persons invited, in line with stakeholder engagement methodologies. Indeed, the workshop was organized by the European project TURAS (Transitioning towards Urban Resilience and Sustainability) and focused on creating sustainable and resilient cities and financed by the EU Seventh Framework Programme. A total of 29 questionnaires were collected and analyzed. The questionnaire was designed to identify and qualitatively evaluate the main ES provided by the CMAP area. It was structured based on the survey instruments in the Toolkit for Ecosystem Service Site-based Assessment (TESSA) [36], which was modified to include the local context and the features of this specific urban area. The experts were asked to score the importance—from 0 to 3—of the ES provided in the CMAP area. The list of ES (see Figure 2) was adapted to the CMAP context from different classification proposals [37,38]. Then, respondents were asked to draw the number of the corresponding ES within a circle on a map of the area where they believed the ES was provided. Finally, they indicated actions to be taken in the next 10 years to improve each ES within the CMAP area.

3.2.3. Residents’ Perception

During the TURAS workshop, thirty residents and daily visitors to the CMAP were interviewed. The significance of the interviewees with respect to knowledge of the ES offered by the CMAP was enhanced by the fact that the survey was carried out during a stakeholder engagement operation within the European-funded project TURAS. The residents’ selection was carried out taking into account gender, age, education, occupation and income in order to define a representative sample of the local population. However, due to the heterogeneity of the residents in terms of knowledge and interests for this relatively small area of the city of Rome, any sample (even larger) would produce a biased estimation. The questionnaire was aimed to assess the ES and the main ecosystem disservices related to the CMAP area. The questionnaire was structured based on the SolVES methodology [39], which allows for evaluating and mapping the social values attached to natural and semi-natural ecosystems. Each interviewee was asked to allocate 100 points among the 12 social and cultural values associated with the CMAP area. They could allocate all the points on just a value or assign them differently among the listed values. However, the final amount for all the points allocated had to total 100. The choice to use social and cultural values is explained by the fact that residents may not be aware or have a poor understanding of other types of ES, such as regulating ones. Therefore, in order to have more aware answers and on which all residents could express a judgment, the list of ES was slightly different.

4. Results

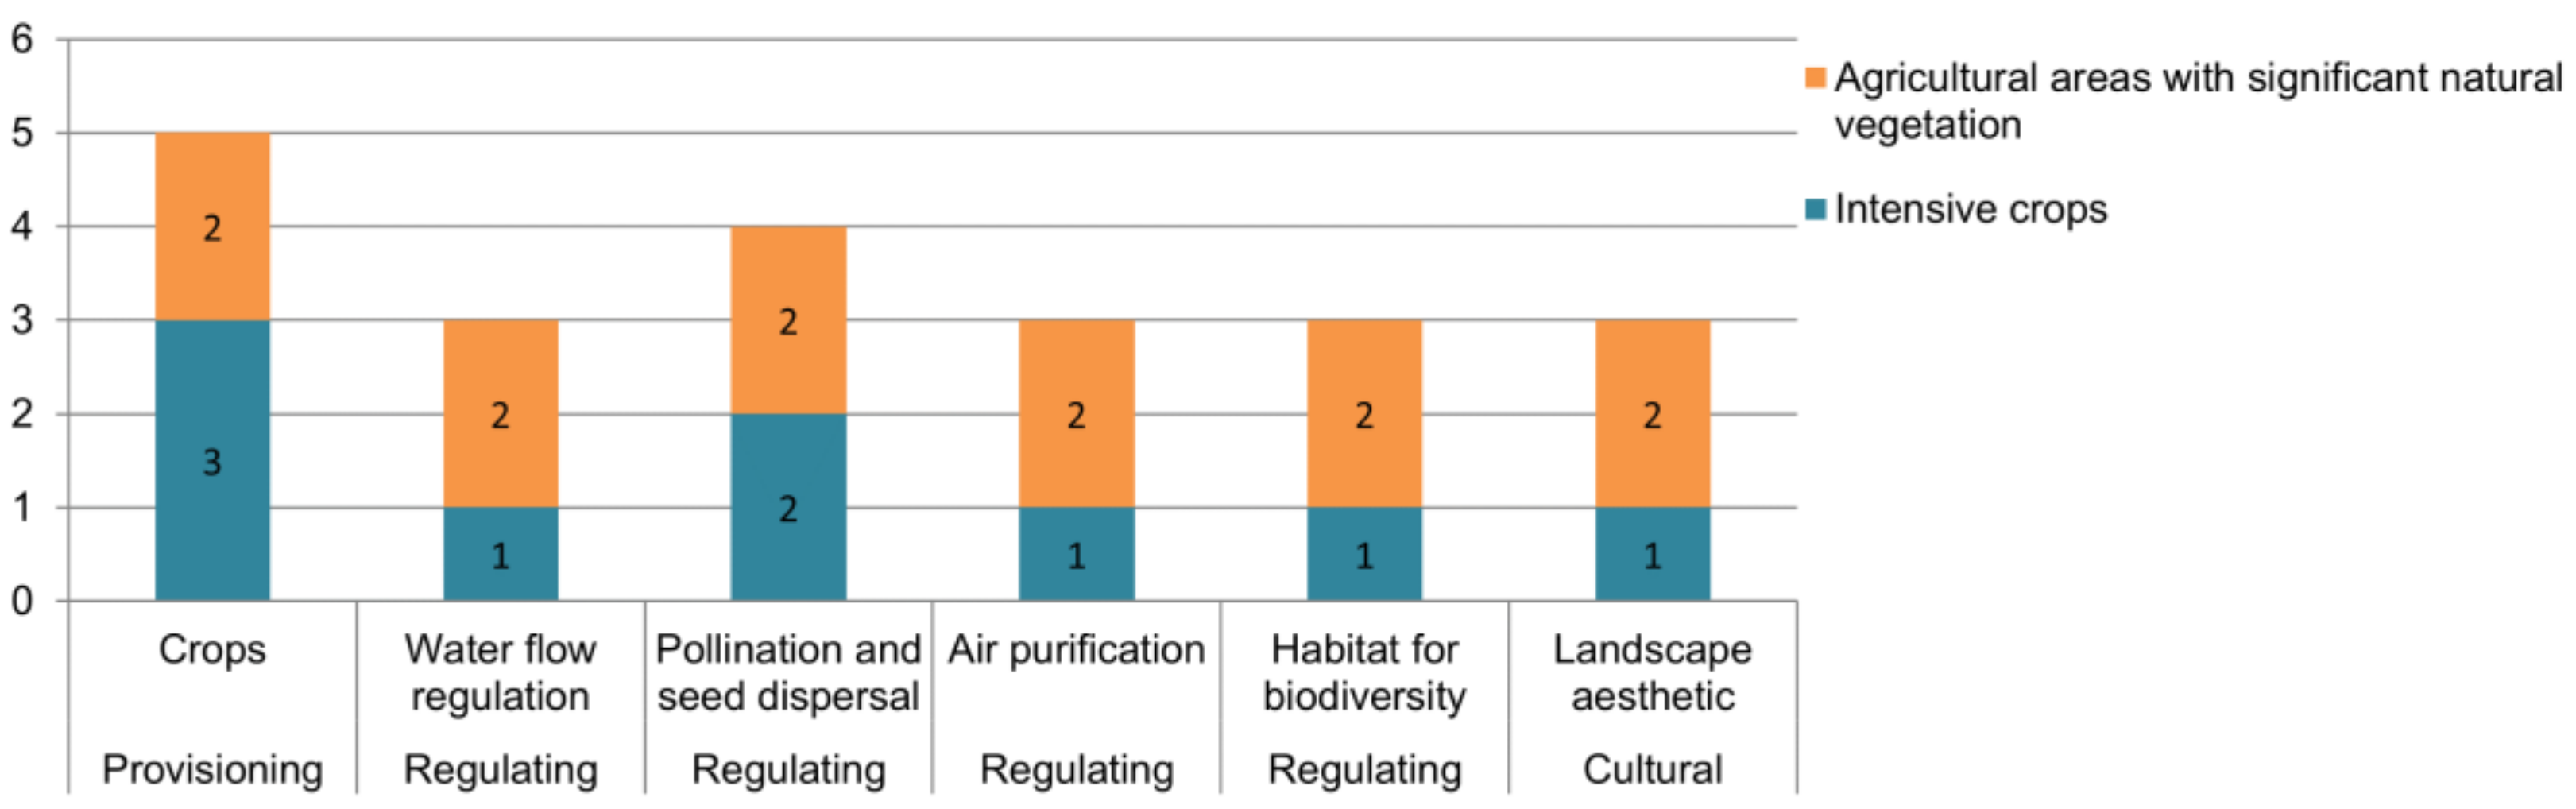
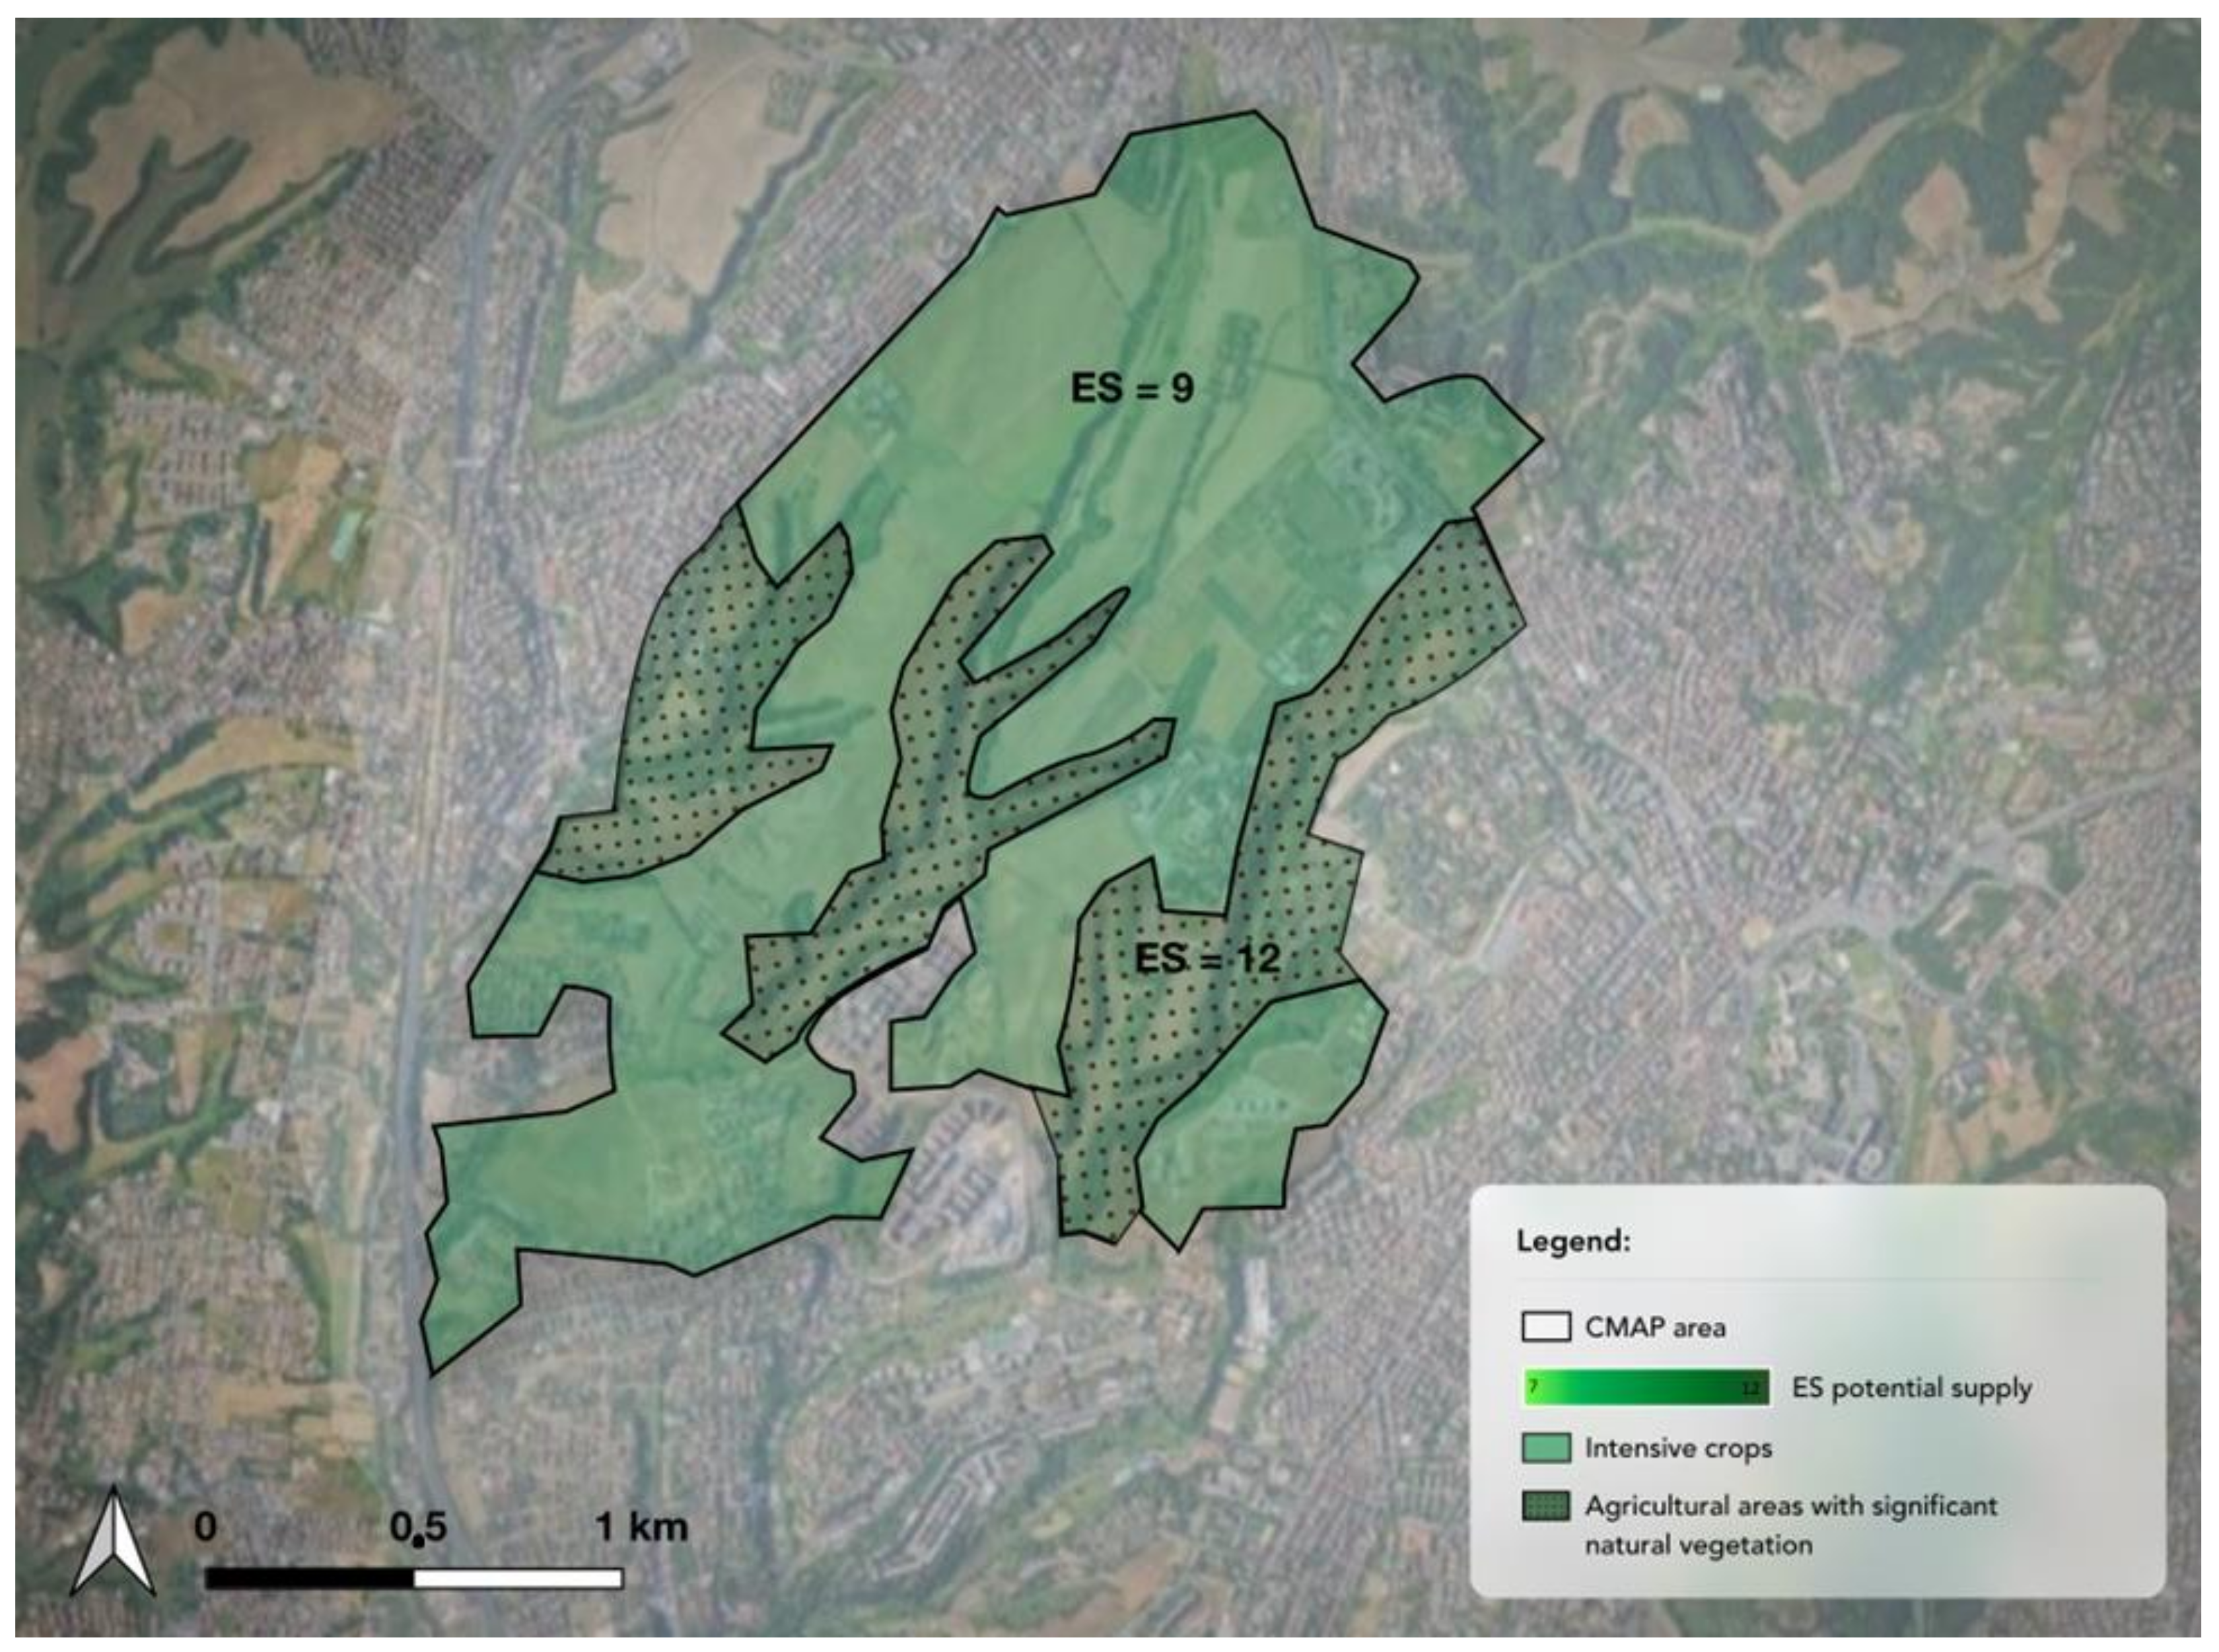
4.1. Mapping and Assessing ES (Potential Provision)

The spatial distribution of the six overall priority ES is shown in Figure 3. Globally, “agricultural areas with significant natural vegetation” potentially provide a total value of 12, being more balanced in respect to “intensive crops” (total ES value: 9) in its anthropic and natural components.
The regulating ES were those most valued through the mapping and evaluation methodology. Indeed, four of the six ES that achieved the highest values refer to regulating services (Figure 4).

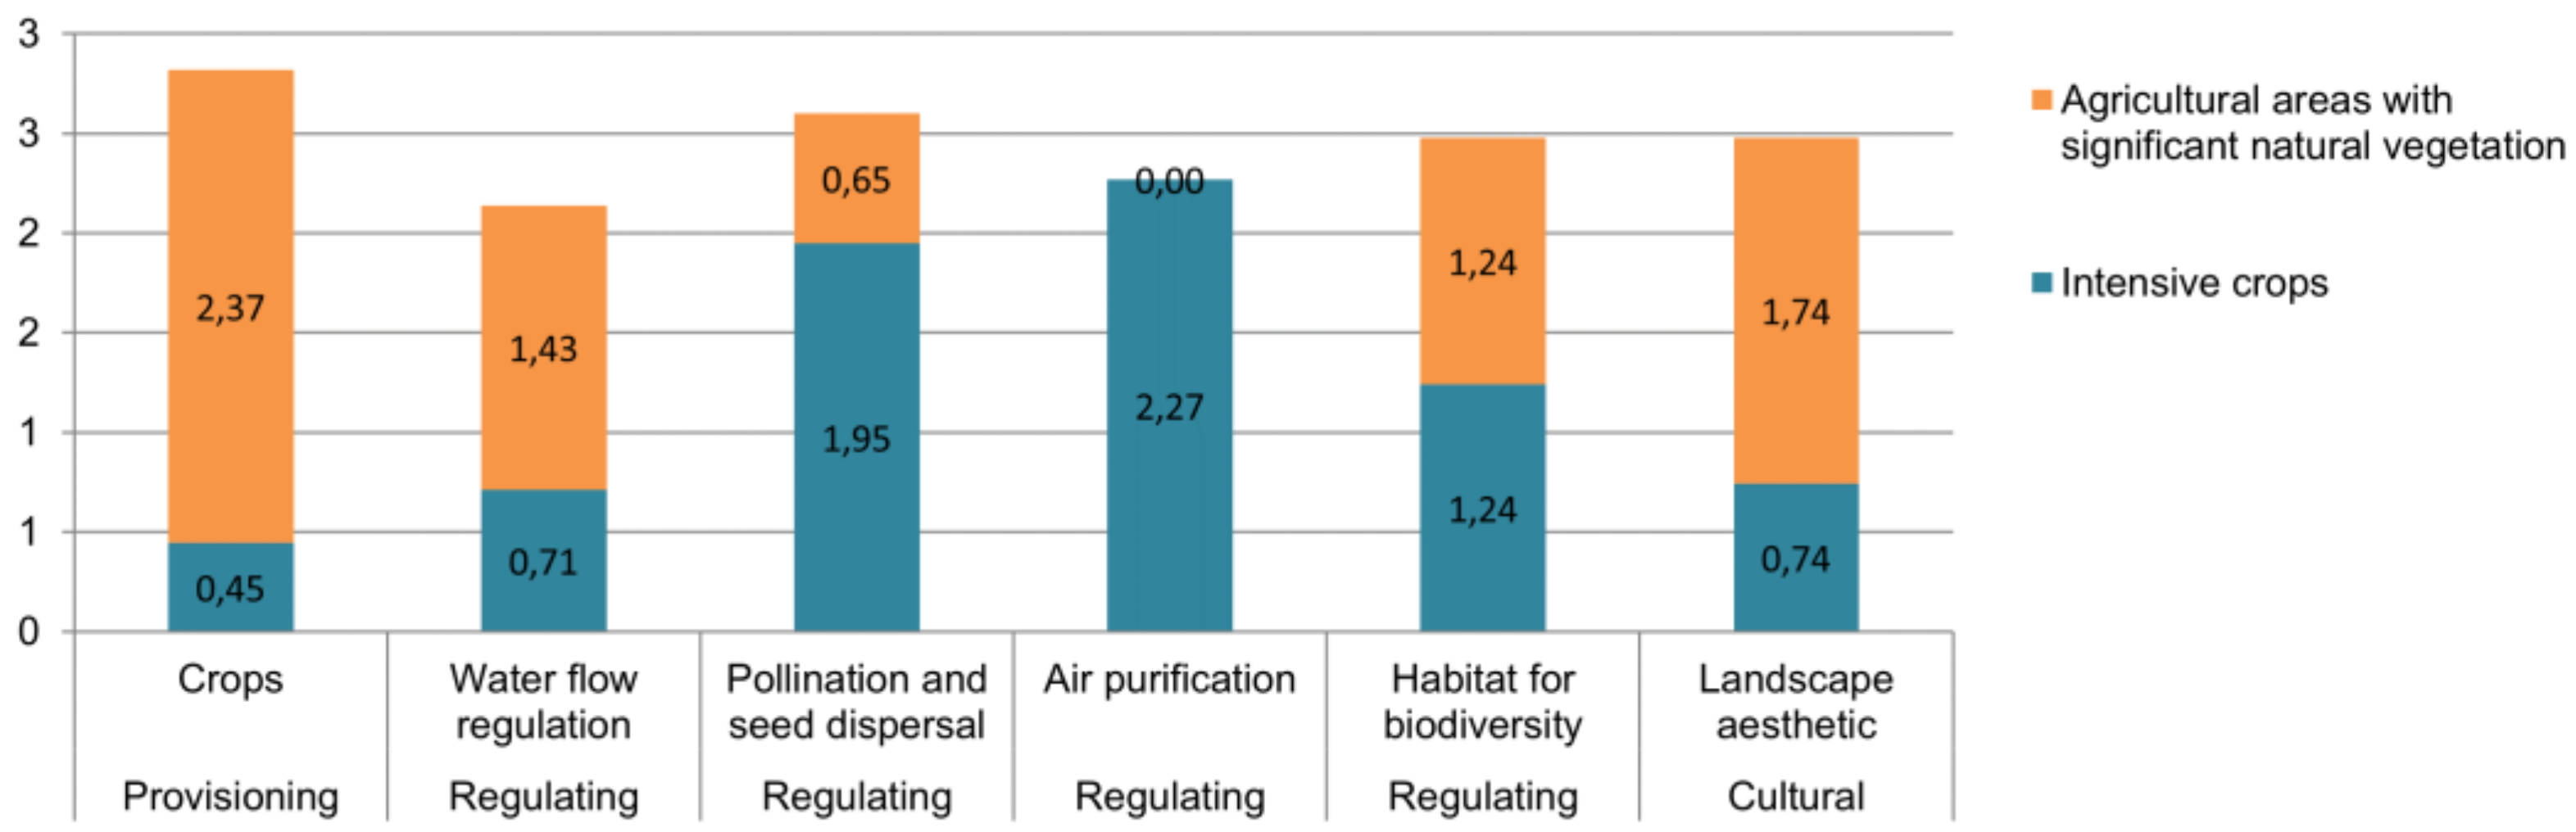
4.2. Expert-Based Analysis

An analysis of the data shows that the ES assigned by the panel of experts were divided between the two different land uses. However, 84% of the ES were provided by “crops”, especially “intensive crops”. The ecosystem functions of regulation and maintenance were mainly provided by agricultural areas with the presence of natural spaces. The cultural ES were rated to a lesser extent by the panel experts. Only “landscape aesthetic” was present in the list of the priority ECs.
Figure 5 shows that from the expert-based analysis, the key priority in this field was the growth of agricultural and leisure activities as well as the protection of landscape features within the metropolitan area; this is especially evident when looking at the ES “landscape aesthetics”, which experts rate higher for the area of the park with intensive crops (Figure 6). This means that the perception of the landscape and the natural features become greater in the presence of activities that highlight the characteristics of the rural landscape as an identity factor. In fact, the agro romano, with natural and agricultural elements that characterize it, offers precisely this type of perception in which farming is mixed with the natural landscape features, in an important connection between natural and cultural capital.

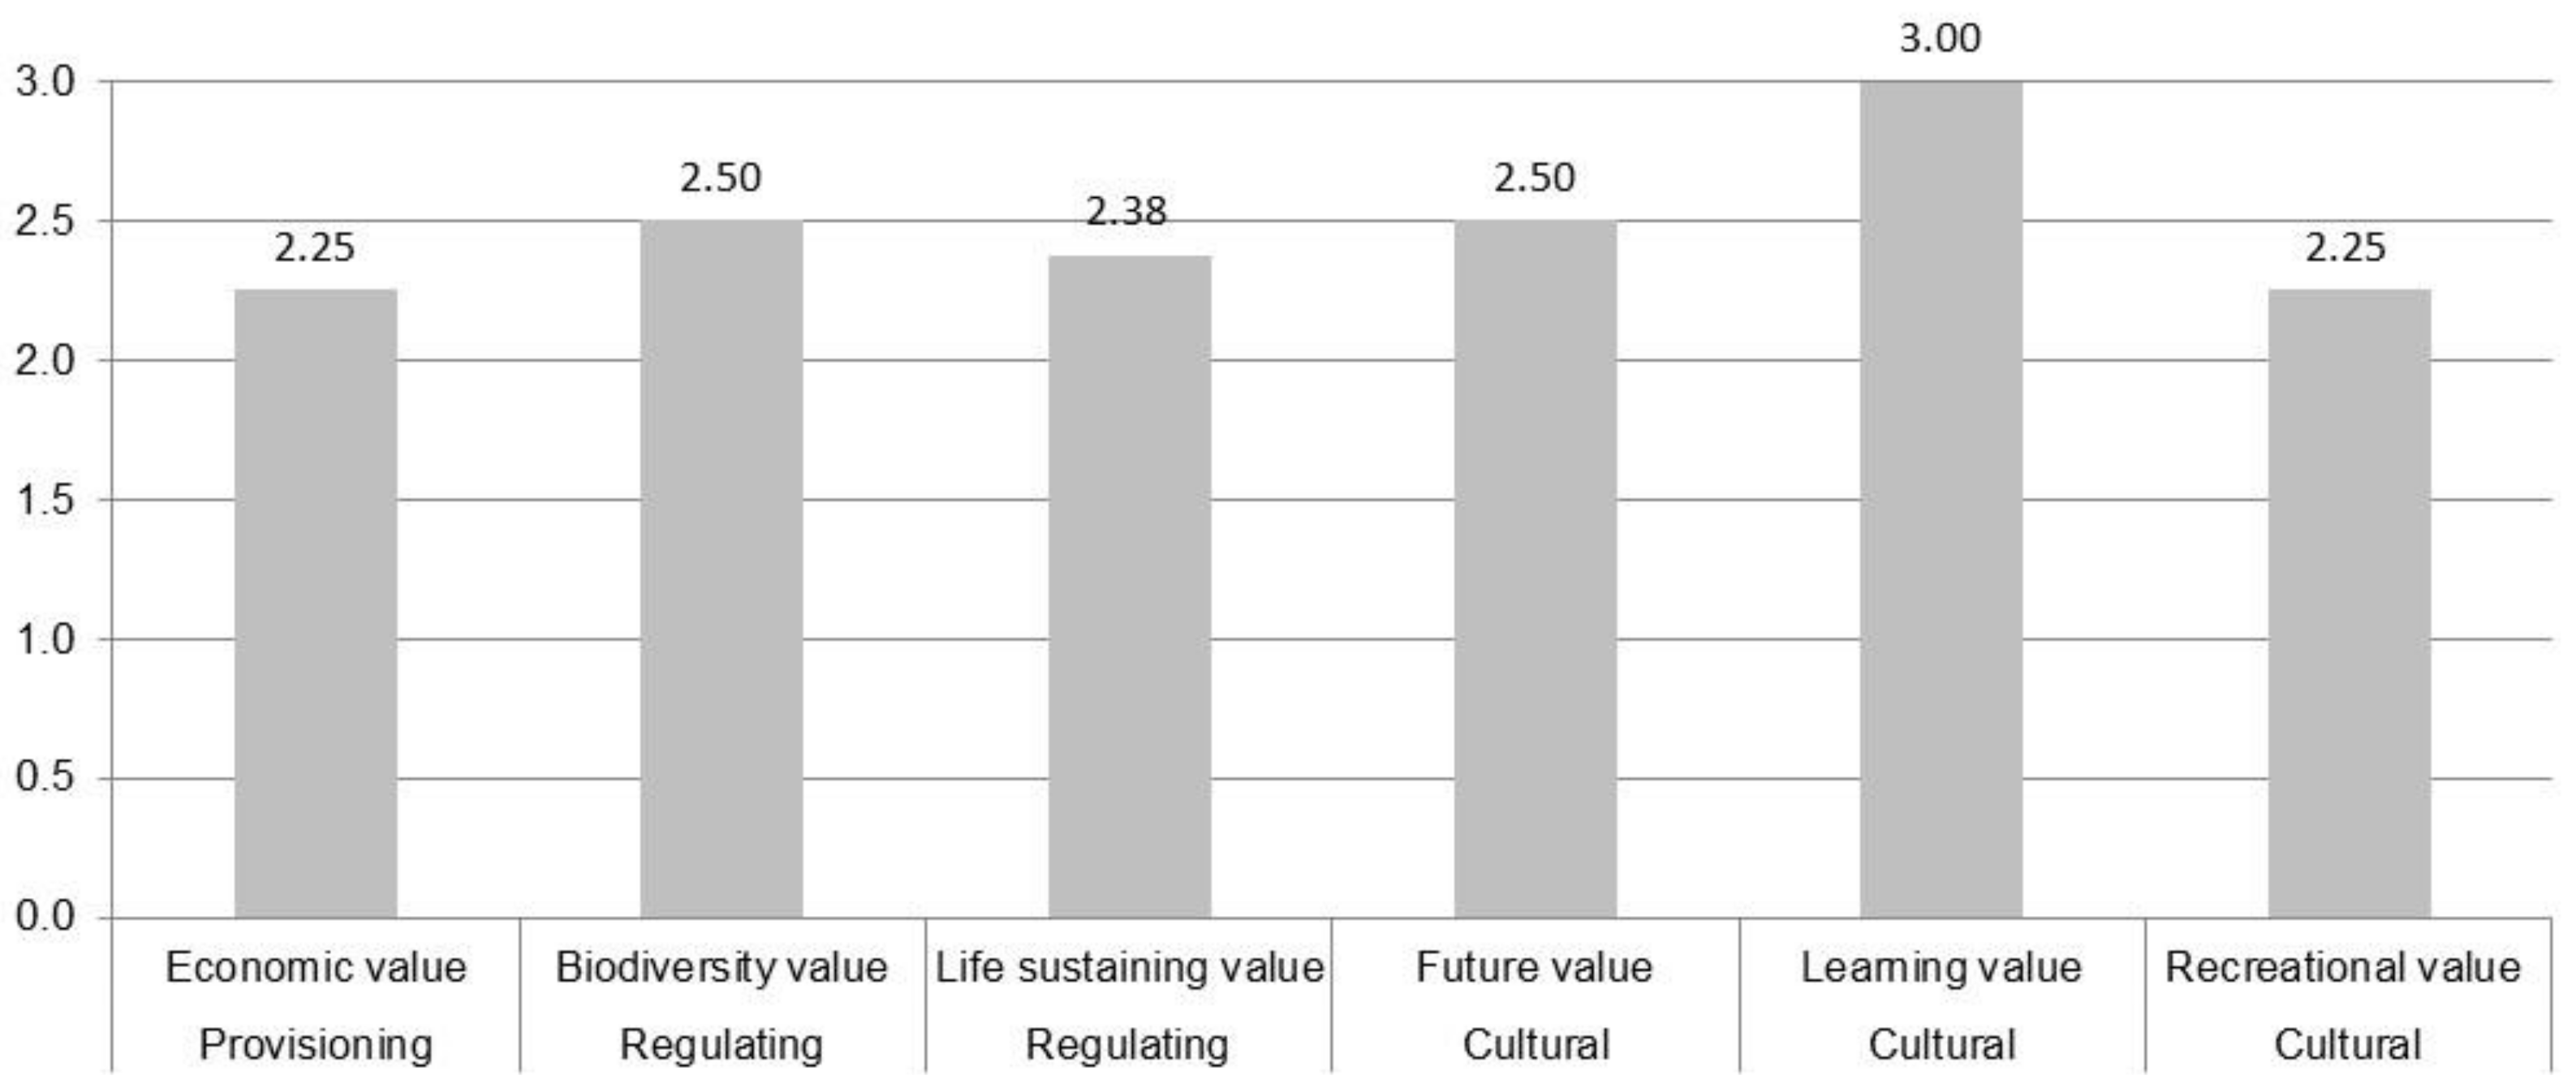
4.3. Residents’ Perception

The residents predominantly ranked the cultural ES (CES). In fact, out of the six most ranked ES, three belonged to the domain of CES: “future value” (“I value CMAP area because it is a resource for future generations”), “learning value” (“I value CMAP area because we can learn about the environment through scientific observation or experimentation”) and “recreational value” (“I value CMAP area because it provides a place for my outdoor recreation activities”). In this case, unlike the GIS analysis and the one based on the expert evaluation, a differentiation was not provided on the basis of the Corine land use classes (Figure 7). This choice was made already in the questionnaire-setting phase, since the main objective was to investigate the perception of the residents on the value of the ES associated with the entire area.

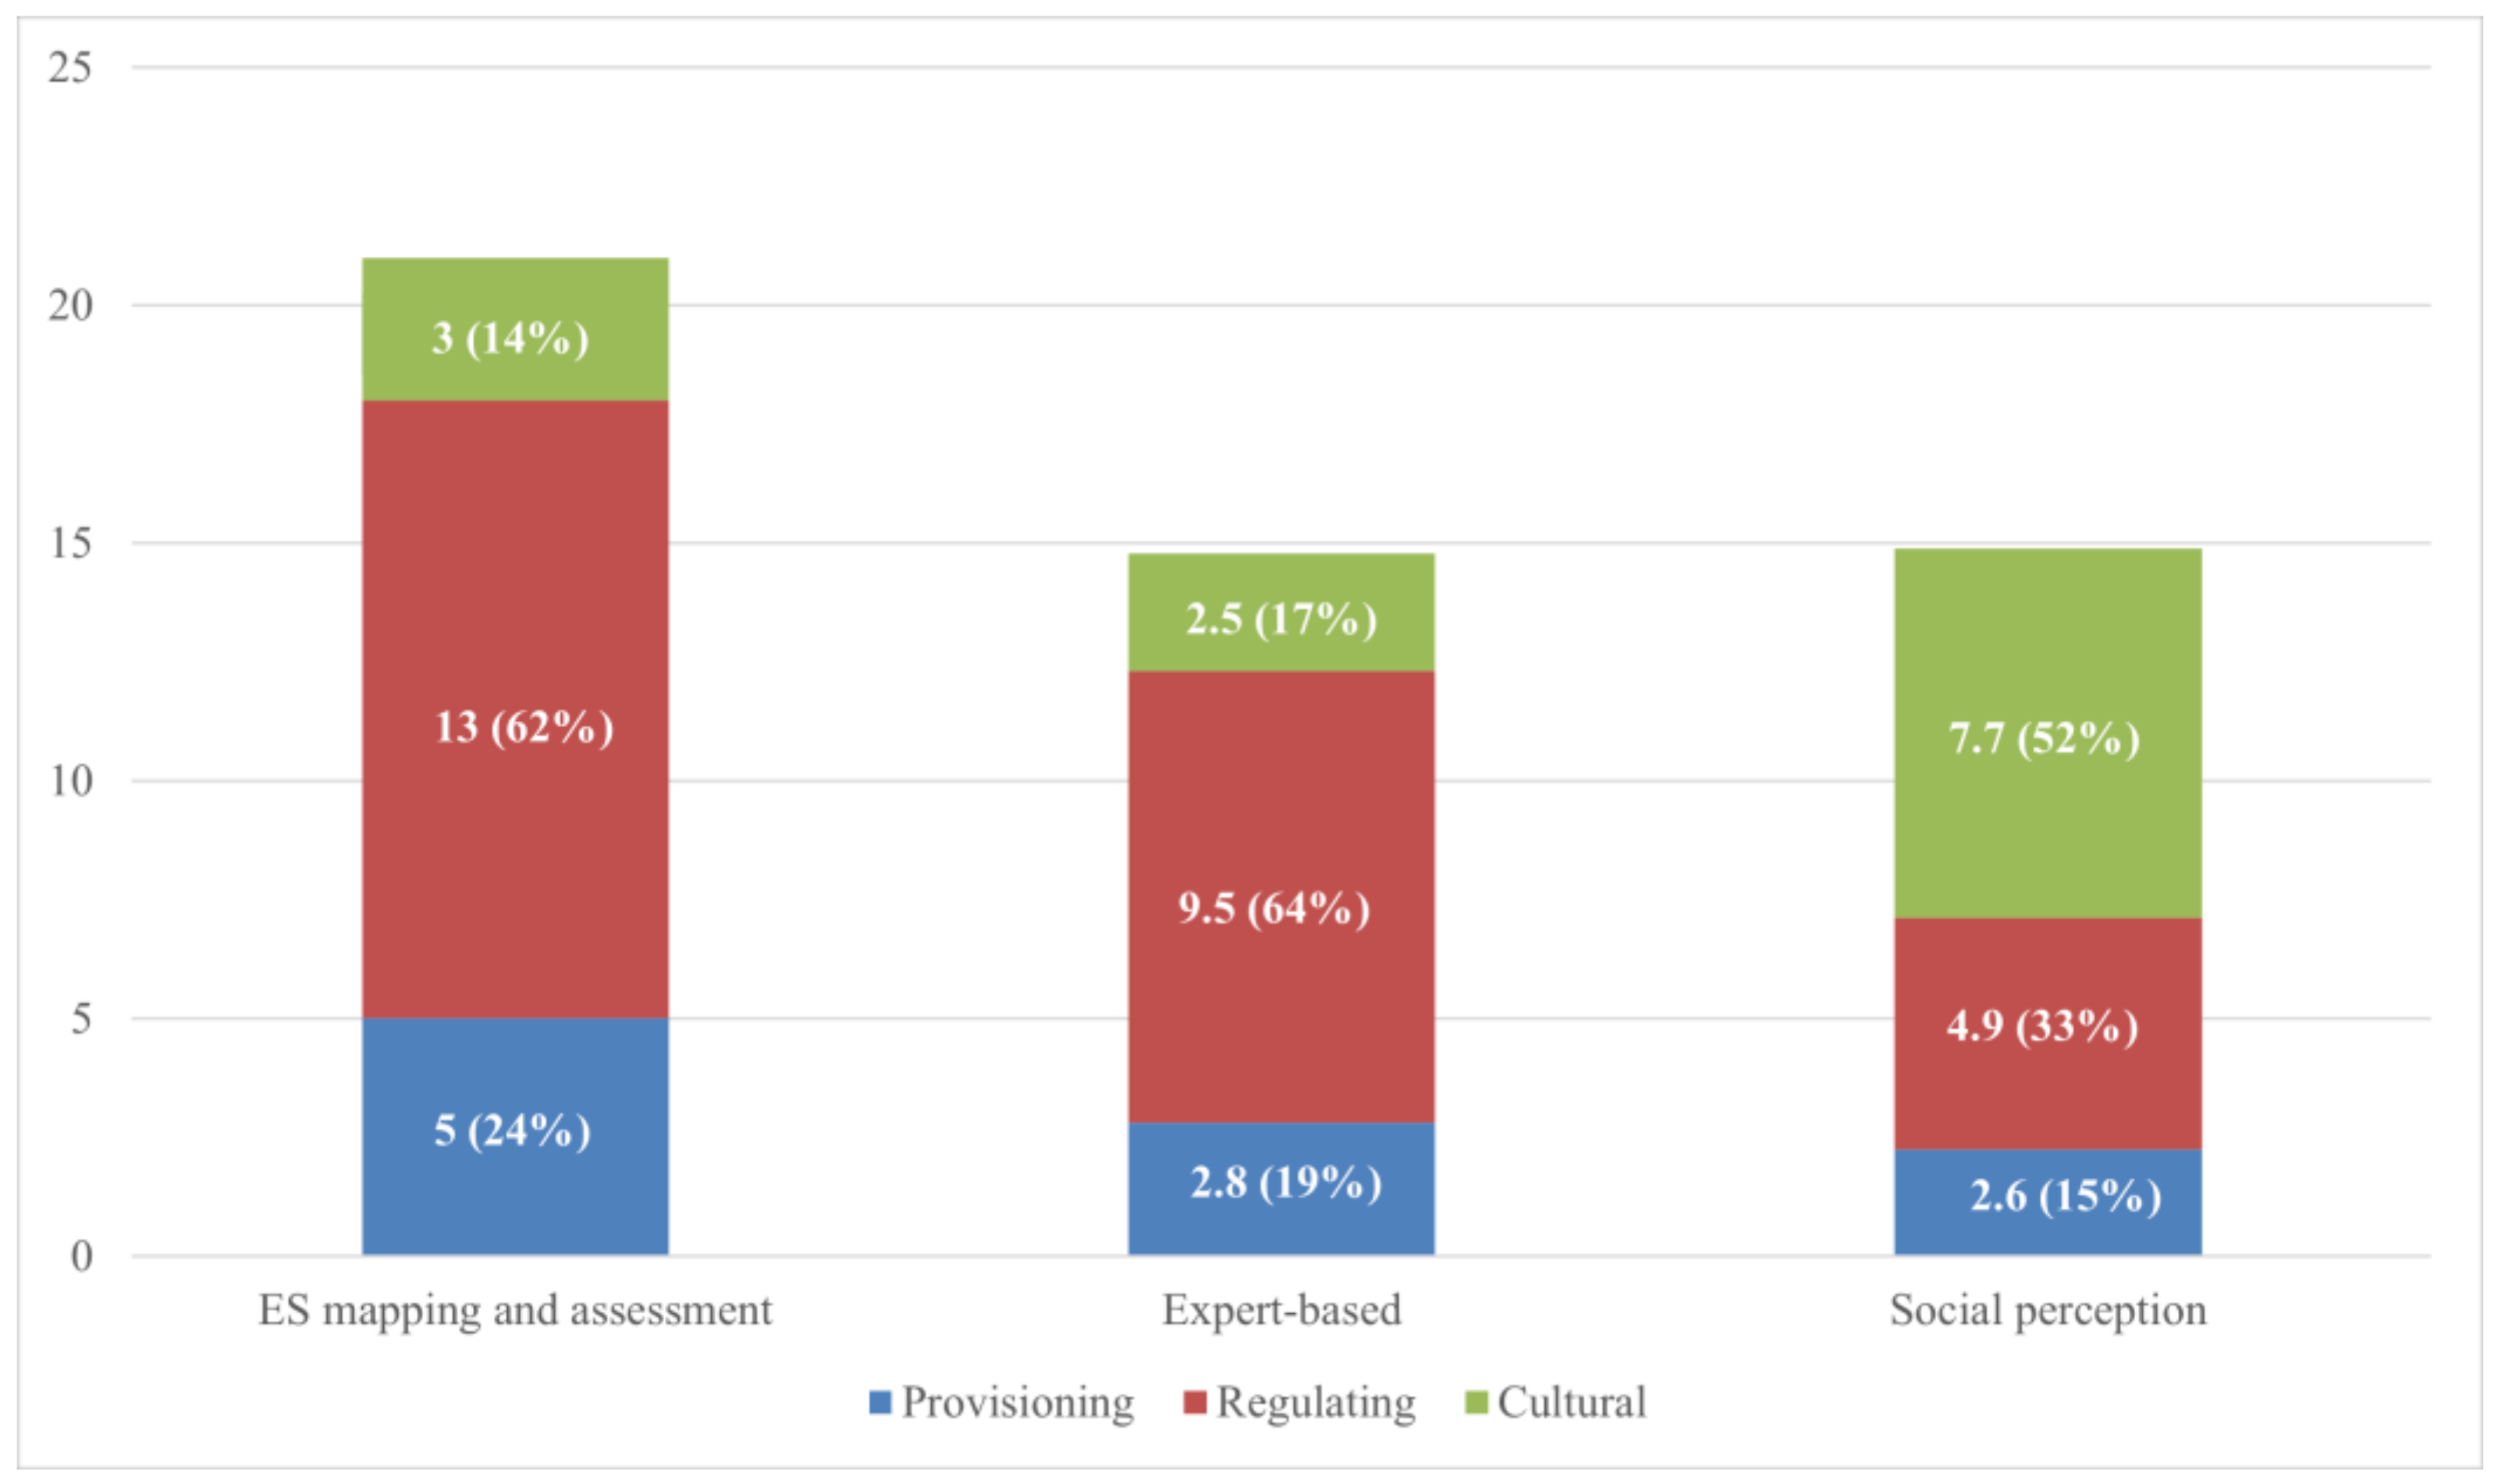
4.4. Overall Results

While the previous paragraphs showed the scores obtained by the most ranked ES per each assessment method, here, the results were combined to allow for a comparison. To this aim, merging the values derived from the three evaluation methods, it is possible to report the overall results (Table 1). The latter evidence that the total value of the six priority ES through GIS mapping and assessment was the highest (21; see Figure 4). The total value derived from the social perception was 14.9, while the total value assigned by the experts to the six ES considered by them as priorities was slightly lower (14.8).
The aggregate values per ES category (provisioning, regulating and cultural) assessed through the three methodologies show some insight (Figure 8). The evaluations of the experts and the assessment through mapping predominantly assigned the highest values to regulating ES. In contrast, they assigned lower values to the cultural ES. It is also interesting to note that experts and mapping methods assigned very similar relative values for the three categories of ES; however, experts expressed higher absolute values. This can be explained by the fact that the direct perception of the characteristics of the CMAP area played a significant role in the assignment of values by experts. This perceptual aspect is, however, absent in the evaluation through mapping, which instead, although proportionally very similar to the expert evaluation, expressed lower absolute values. In this context, the other relevant data are the perception of the ES provided by the CMAP area expressed by the residents, as other studies have already shown [23]. In fact, residents tended to assign a very high value to the cultural ES, while for the regulating and provisioning services, they provided the lowest values, also in comparison to the other two methodologies. This could be explained by the fact that residents, probably in the absence of knowledge and informational tools for an integrated analysis of the ES offered by the park, tend to valorize those for which they had a direct perception and from which they directly benefited [40,41].

5. Discussion

The aim of this research was twofold: to investigate the intrinsic features of three different evaluation methodologies that are usually used in the field of ES quantification and to seek an approach for urban planning that overcomes and integrates different methodologies that separately may have deficits and biases.

5.1. ES Values Evaluation

Comparing the results, it is possible to draw some considerations concerning the combination and complementarity between the different methodologies, which can be used for strengthening the assessment of ES in urban areas [42]. In fact, while the residents’ perception highlighted the importance of cultural ES, it underestimated the ecosystem functions that are more difficult to observe without specific technical–scientific knowledge. This entails that promoting a more active and aware citizenship as well as strengthening residents’ perception concerning local ES is crucial for planning, managing and maintaining different elements of urban green infrastructures [43], especially in the case of a lack of public financial resources. Participatory mapping allows for the identification of areas and specific elements that provide a particular ES. Combined with conservation areas and environmental restoring areas, the overlapping of information allows to define ES hotspots [44]. This method is also useful for describing and analyzing stakeholders’ perceptions on ES by creating a collective vision for landscape planning and design. This helps to understand the social and cultural features of local communities, including the diversity of sources of knowledge, human relationships and values systems [45]. The expert evaluation tended to provide higher values to the regulating ecosystem, probably because the knowledge available to the panel of experts allows for recognizing the functions that can be inferred from the environmental and agricultural characteristics of the area. However, the results show that the experts’ evaluation of cultural ES tended to be lower than for residents. At the same time, the expert evaluation allows for greater objectivity of the evaluation and the enhancement of ES that might have been overlooked or underestimated by residents and visitors. The discourse can be replicated and takes on an even greater entity in the case of evaluation via GIS mapping. In fact, they grasp the importance of the regulating ES but assign lower values to cultural ES. An analysis of the different ES assessment methods is presented in Table 2, where a comparison was conducted using five criteria: resource needed and costs, precondition and needs, outputs, results and added value.
Table 2 provides evidence of the methodological value of the research, drawn from the results of the three different evaluations. In fact, the application of the three models and the relative results obtained allow us to understand how each of them favors or limits the acknowledgement of the value of certain categories of ES. Each of the three methodologies contains a certain added value and their integration in the tools of territorial planning is necessary for an integrated and comprehensive ES assessment of a given area.

5.2. Policy Implications

On the evidence obtained from this study, each methodology presents both success factors and critical elements for the evaluation of the ES (Table 2). For example, as emerged during the debate session of the international conference “How to Achieve the SDGs through Local Action”, the overestimation of cultural ES by residents can be an indication of a bias in the evaluation of “invisible” ES (provisioning and regulating). At the same time, tools based on technologies with little relevance to human interpretation factors, tend to underestimate cultural services and to provide a more detailed estimate of “invisible” ES [46], regardless of their actual direct enjoyment by the population. Consequently, UPA planning models based on just one of the three methodologies risk being incomplete and do not represent the full range of ES provided by an agricultural park, an urban green area or a peri-urban agricultural area [47]. Territorial governance models based solely on one methodology have led to scenarios in which individual policies acting on the same territory have been carried out independently of each other, producing biases deriving from partial evaluations [48,49]. This type of approach can be referred to as “stand-alone policies”, characterized by policies, measures or market instruments that do not involve dialogue and, therefore, risk triggering a series of risks: competition for the use of resources (land), overlapping of contrasting measures and tools, lack of coordination, lack of integration between intensive and extensive agricultural models, uncertainties, and absence of a vision of the area in the broader perspective of the local agri-food system (Figure 9). In the “place-based policy-mix” model, the three methodologies were considered for their intrinsic characteristics and compared to obtain a completer and more integrated picture of the study area. While this approach can be more demanding, time consuming and expensive in terms of financial and human resources, economies of scale can be applied in the use of the three methodologies [50]. These multiscale and multifactor assessments can then be considered within a coordinated and pluralistic policy mix, which considers the fact that each methodology can provide detailed indications for each category of ES. Regarding the integration of ES in the strategic environmental assessment of spatial planning [23,51], this entails greater integration of policy tools, greater coordination between the actors responsible for their application, greater understanding by the beneficiaries and safety on the future of the area, and better integration between agricultural models, especially in Mediterranean areas characterized by strong landscape fragmentation [52].
In the context of the city of Rome, where the CMAP is located, the results of the research evidence several implications. Indeed, several discourses around the role of UPA have developed recently, concomitantly with the momentum given by the Municipal Resolution through which a food policy for the city of Rome was adopted. Among the twelve objectives settled, indeed, the UPA is a transversal element, consistent with the scope and relevance of agriculture within the city’s borders (see Section 3.1) [17]. Nevertheless, in the framework of the Food Policy Council, the debate often revolves around issues of the definition of areas to devote to UPA and the criteria to define them. Against this backdrop, a place-based policy-mix scenario can represent a valid approach to overcome the biases that could occur when a single method is adopted. In particular, the authors argue that the institutionalization of the food policy and the resources mobilized are two factors that aim to better plan UPA in the city of Rome. Indeed, a multicriteria approach, such as the one carried out through the place-based policy-mix approach, can overcome the normative vacuum of the evaluation of ES in urban and peri-urban agriculture plots, thus contributing to defining UPA zoning and its valorization consistently with the urban food policy goals.

6. Conclusions

In urban planning, the approach proposed in this article allows to integrate different types of knowledge and to make stakeholders more aware of the benefits provided by urban ecosystems, especially by agricultural areas. These areas within or adjacent to the city, as the case study of the CMAP demonstrates, are fundamental for reconnecting the fragments of ecosystems produced by the urbanization processes and constitute a new starting point for the environmental and socioeconomic improvement of urban areas [16]. The proposed model “place-based policy-mix” was based on the evidence that urban agriculture planning models relying on just one of the three ES assessing methodologies risk being incomplete and not reflecting the full range of ES provided by a complex area, such as an urban or peri-urban agricultural area. Furthermore, the research findings are coherent with Milcu et al., when they state that because of the complexity of urban ecosystems, it is suggested that a multidisciplinary approach should be used to evaluate ES [30,31].

6.1. Research Limitations

Nevertheless, the research contains some limits, both methodological and regarding the site object of the case study. From a methodological perspective, despite the representativeness of the experts being guaranteed by the principles and activities of the TURAS project, a different composition of invited individuals could have implied slight differences in the results of the methodology based on the evaluation of the experts. However, this bias was partially resolved thanks to the balance between the different disciplines covered by the experts (see Section 3.2.2) and, in the case of the residents, the ability to intercept regular visitors to the agricultural park and the adjacent food market. The latter factor ensured that interviewees had direct and ongoing knowledge of the site (see Section 3.2.3). Furthermore, a possible issue that might arise from a decision-making viewpoint is how to assign priorities to the different ecosystem services ranked according to the three methodologies. However, different solutions could be adopted to assign different levels of priority and usability to the available evaluation methodologies, such as expert focus groups [53] and multicriteria decision analysis [54]. From the point of view of the case study, the limits of the research are, on the one hand, the limited transferability of the results to other agricultural areas; on the other hand, the two land uses analyzed in this study generally provide less cultural ES than more natural ecosystems, for example, forests, wetlands and natural pastures. However, in the partial balancing of this weakness, the position of the CMAP within the urban mosaic of the city of Rome increases the usability and, therefore, the ability to also have perception of cultural ES.

6.2. Suggestions for Further Research

In order to improve the sustainability of urban planning, the understanding and evaluation of ES is a first move toward increasing the awareness of the value of agricultural urban areas within urban populations. Without knowledge of the variables affecting the quantity and importance of ecosystem resources, as noted by Nelson et al. [55], it is impossible to devise strategies, benefits or payment systems that will maximize their provision.
Together with an ES assessment, it is therefore important to define new ways of management starting from a political and social negotiation [4]. This means, for example, promoting private–public partnerships for new green jobs as well as following social cohesion objectives together with NGOs and other local associations. In turn, this implies the definition and implementation of new models of agreement, where the provision of ES is explicitly acknowledged in order to promote more flexible urban planning tools and leave more room to local green economy initiatives (e.g., landscape agreements), which consist of agreements and contracts among local communities and public institutions, or payment for ecosystem services (PES), which are voluntary transactions where at least one “buyer” acquires a well-defined environmental service from at least one provider (“seller”).

Supplementary Materials

The following supporting information can be downloaded at: https://www.mdpi.com/article/10.3390/land11112017/s1, Supplementary Material S1: ES list for each assessment method; Supplementary Material S2: Questionnaire used in experts-based analysis; Supplementary Material S3: Questionnaire used in residents’ perception analysis.

Author Contributions

Conceptualization, D.P. and D.M.; methodology, D.M., D.P. and G.M.; formal analysis, G.M., D.P. and V.B.; investigation, D.P.; writing—original draft preparation, D.P. and G.M.; writing—review and editing, G.M.; visualization, V.B.; supervision, D.M. All authors have read and agreed to the published version of the manuscript.

Funding

This research received no external funding.

Data Availability Statement

The data presented in this study are available on request from the corresponding author. The data are not publicly available due to privacy matters on questionnaires responses.

Conflicts of Interest

The authors declare no conflict of interest.

References

  1. United Nations, Department of Economic and Social Affairs, Population Division. World Urbanization Prospects: The 2018 Revision, (ST/ESA/SER.A/420); United Nations: New York, NY, USA, 2019. [Google Scholar]
  2. EEA. The European Environment—State and Outlook 2015: Synthesis Report; European Environment Agency: Copenhagen, Denmark, 2015. [Google Scholar]
  3. Millennium Ecosystem Assessment (MA). Ecosystems and Human Well-Being: Synthesis; Island Press: Washington, DC, USA, 2005; Volume 155, p. 40. [Google Scholar]
  4. Carpenter, S.R.; Mooney, H.A.; Agard, J.; Capistrano, D.; DeFries, R.S.; Diaz, S.; Dietz, T.; Duraiappah, A.K.; Oteng-Yeboah, A.; Pereira, H.M.; et al. Science for managing ES: Beyond the millennium ecosystem assessment. Proc. Natl. Acad. Sci. USA 2009, 106, 1305–1312. [Google Scholar] [CrossRef] [PubMed] [Green Version]
  5. Bagstad, K.J.; Semmens, D.J.; Waage, S.; Winthrop, R. A comparative assessment of decision-support tools for ES quantification and valuation. Ecosyst. Serv. 2013, 5, 27–39. [Google Scholar] [CrossRef]
  6. Brinkley, C. Evaluating the benefits of Peri-Urban Agriculture. J. Plan Lit. 2012, 27, 259–269. [Google Scholar] [CrossRef] [Green Version]
  7. Cinà, G. Aree Agricole Periurbane: Lavori in Corso; INU edizioni: Rome, Italy, 2016; Urbanistica informazioni. [Google Scholar]
  8. Costanza, R.; D’Arge, R.; De Groot, R.; Farber, S.; Grasso, M.; Hannon, B.; Limburg, K.; Naeem, S.; O’Neill, R.V.; Paruelo, J.; et al. The values of the world’s ES and natural capital. Nature 1997, 387, 253–260. [Google Scholar] [CrossRef]
  9. Wilhelm, J.A.; Smith, R.G. ES and land sparing potential of urban and peri-urban agriculture: A review. Renew. Agric. Food Syst. 2017, 33, 481–494. [Google Scholar] [CrossRef]
  10. Clinton, N.; Stuhlmacher, M.; Miles, A.; Uludere, N.; Wagner, M.; Georgescu, M.; Herwig, C.; Gong, P. A Global Geospatial ES Estimate of Urban Agriculture. Earth’s Future 2018, 6, 40–60. [Google Scholar] [CrossRef]
  11. Doron, G. Urban agriculture: Small, medium, large. Archit. Des. 2005, 75, 52–59. [Google Scholar] [CrossRef]
  12. Plieninger, T.; Dijks, S.; Oteros-Rozas, E.; Bieling, C. Assessing, mapping, and quantifying cultural ES at community level. Land Use Policy 2013, 33, 118–129. [Google Scholar] [CrossRef] [Green Version]
  13. Whitfield, J. Seeds of an edible city architecture. Nature 2009, 459, 914–915. [Google Scholar] [CrossRef] [Green Version]
  14. European Commission. Mapping and Assessment of Ecosystems and Their Services: An analytical Framework for Ecosystem Assessments under Action 5 of the EU Biodiversity Strategy to 2020; Discussion Paper, Technical Report; European Commission: Brussels, Belgium, 2013. [Google Scholar]
  15. Succhiarelli, C. Passaggio a nord ovest—Risanamento ambientale e realizzazione di un’area naturalistica a Casal del Marmo; Dipartimento alle Politiche della Programmazione e Pianificazione del Territorio—Roma Capitale: Rome, Italy, 2002. [Google Scholar]
  16. Municipality of Rome. The Casal del Marmo Agricultural Park: An Implementation Hypothesis; Ecomed: Rome, Italy, 2014. [Google Scholar]
  17. Suškevičs, M.; Roche, P.K. Evaluating Ecosystem Services Capacity: Guidelines and Recommendations for Cooking an Ecosystem Service and Ecosystem Disservice Capacity Matrix; Imagine Biodiversa 3, “Cookbook” Series n°1; INRAe: Paris, France, 2020. [Google Scholar]
  18. European Commission. MEANS Collection—Evaluation of Socio-Economic Programmes; European Commission: Brussels, Belgium, 1999; ISBN 92-828-6626-2 CX-10-99-000-EN-C. [Google Scholar]
  19. Schirpke, U.; Scolozzi, R.; De Marco, C. Analysis of Ecosystem Services in the Pilot Sites. Part 2: Analysis of the Pilot Sites; Report of the Making good Natura project (LIFE+11 ENV/IT/000168); EURAC Research: Bolzano, Italy, 2013; p. 93. [Google Scholar]
  20. Schirpke, U.; Scolozzi, R.; De Marco, C. Application of the Demonstrative Model of Qualitative and Quantitative Evaluation of Ecosystem Services in the Pilot Sites. Part 1: Quantification of Ecosystem Services; Report of the Making Good Natura Project (LIFE+11 ENV/IT/000168); EURAC Research: Bolzano, Italy, 2015; p. 116. [Google Scholar]
  21. Gaglioppa, P.; Marino, D. (Eds.) Manual for the Valuation of ES and Implementation of PES Schemes in Agricultural and Forest Systems—Application of the Governance Model “Making Good Natura” in Natura 2000 Sites and Other Areas; CURSA: Rome, Italy, 2016. [Google Scholar]
  22. Costanza, R.; de Groot, R.; Sutton, P.; van der Ploeg, S.; Anderson, S.J.; Kubiszewski, I.; Farber, S.; Turner, R.K. Changes in the global value of ES. Glob. Environ. Chang. 2014, 26, 152–158. [Google Scholar] [CrossRef]
  23. Corine Land Cover. Available online: https://land.copernicus.eu/pan-european/corine-land-cover/clc2018 (accessed on 15 May 2020).
  24. Bastian, O. The role of biodiversity in supporting ES in Natura 2000 sites. Ecol. Indic. 2013, 24, 12–22. [Google Scholar] [CrossRef]
  25. Bastian, O.; Haase, D.; Grunewald, K. Ecosystem properties, potentials and services—The EPPS conceptual framework and an urban application example. Ecol. Indic. 2012, 21, 7–16. [Google Scholar] [CrossRef]
  26. ISPRA. Consumo di Suolo, Dinamiche Territoriali e Servizi Ecosistemici; ISPRA: Rome, Italy, 2016; Rapporti 248/2016; ISBN 978-88-448-0776-4. [Google Scholar]
  27. Marino, D.; Palmieri, M.; Marucci, A.; Tufano, M. Comparison between Demand and Supply of Some Ecosystem Services in National Parks: A Spatial Analysis Conducted Using Italian Case Studies. Conservation 2021, 1, 36–57. [Google Scholar] [CrossRef]
  28. Peh, K.S.H.; Balmford, A.; Bradbury, R.B.; Brown, C.; Butchart, S.H.; Hughes, F.M.; Stattersfield, A.; Thomas, D.H.L.; Walpole, M.; Bayliss, J.; et al. TESSA: A toolkit for rapid assessment of ES at sites of biodiversity conservation importance. Ecosyst. Serv. 2013, 5, 51–57. [Google Scholar] [CrossRef] [Green Version]
  29. Kandziora, M.; Burkhard, B.; Müller, F. Interactions of ecosystem properties, ecosystem integrity and ecosystem service indicators—A theoretical matrix exercise. Ecol. Indic. 2013, 28, 54–78. [Google Scholar] [CrossRef]
  30. Milcu, A.I.; Hanspach, J.; Abson, D.; Fischer, J. Cultural ES: A literature review and prospects for future research. Ecol. Soc. 2013, 18, 44. [Google Scholar] [CrossRef] [Green Version]
  31. Sherrouse, B.C.; Clement, J.M.; Semmens, D.J. A GIS application for assessing, mapping, and quantifying the social values of ES. Appl. Geogr. 2011, 31, 748–760. [Google Scholar] [CrossRef]
  32. Bertram, C.; Rehdanz, K. Preferences for cultural urban ES: Comparing attitudes, perception, and use. Ecosyst. Serv. 2015, 12, 187–199. [Google Scholar] [CrossRef]
  33. Asah, S.T.; Guerry, A.D.; Blahna, D.J.; Lawler, J.J. Perception, acquisition and use of ES: Human behavior, and ecosystem management and policy implications. Ecosyst. Serv. 2014, 10, 180–186. [Google Scholar] [CrossRef]
  34. Dunford, R.; Harrison, P.; Smith, A.; Dick, J.; Barton, D.N.; Martín-López, B.; Kelemen, E.; Jacobs, S.; Saarikoski, H.; Turkelboom, F.; et al. Integrating methods for ecosystem service assessment: Experiences from real world situations. Ecosyst. Serv. 2018, 29, 499–514. [Google Scholar] [CrossRef]
  35. Copas, R.; Philips, I. Green Infrastructure—An Integrated Approach to Land Use; Landscape Institute Position Statements: London, UK, 2013. [Google Scholar]
  36. Darvill, R.; Lindo, Z. Quantifying and mapping ecosystem service use across stakeholder groups: Implications for conservation with priorities for cultural values. Ecosyst. Serv. 2014, 13, 153–161. [Google Scholar] [CrossRef]
  37. García-Nieto, A.P.; Quintas-Soriano, C.; García-Llorente, M.; Palomo, I.; Montes, C.; Martín-López, B. Collaborative mapping of ES: The role of stakeholders’ profiles. Ecosyst. Serv. 2014, 13, 141–152. [Google Scholar] [CrossRef]
  38. Brown, G.; Montag, J.M.; Lyon, K. Public Participation GIS: A Method for Identifying ES. Soc. Nat. Res. 2012, 25, 633–651. [Google Scholar] [CrossRef]
  39. Scholes, R.; Reyers, B.; Biggs, R.; Spierenburg, M.J.; Duriappah, A. Multi-scale and cross-scale assessments of social-ecological systems and their ES. Curr. Opin. Environ. Sustain. 2013, 5, 16–25. [Google Scholar] [CrossRef]
  40. Colavitti, A.M.; Floris, A.; Serra, S. Urban Standards and ES: The Evolution of the Services Planning in Italy from Theory to Practice. Sustainability 2020, 12, 2434. [Google Scholar] [CrossRef] [Green Version]
  41. Geneletti, D. Reasons and options for integrating ES in strategic environmental assessment of spatial planning. Int. J. Biodivers. Sci. Ecosyst. Serv. Manag. 2011, 7, 143–149. [Google Scholar] [CrossRef] [Green Version]
  42. Salvati, L.; Munafo, M.; Gargiulo Morelli, V.; Sabbi, A. Low-density settlements and land use changes in a Mediterranean urban region. Landsc. Urban Plan. 2012, 105, 43–52. [Google Scholar] [CrossRef]
  43. Kopperoinen, L.; Itkonen, P.; Niemelä, J. Using expert knowledge in combining green infrastructure and ecosystem services in land use planning: An insight into a new place-based methodology. Landsc. Ecol. 2014, 29, 1361–1375. [Google Scholar] [CrossRef]
  44. Langemeyer, J.; Gòmez-Baggethun, E.; Haase, D.; Scheuer, S.; Elmqvist, T. Bridging the gap between ecosystem service assessments and land-use planning through Multi-Criteria Decision Analysis (MCDA). Environ. Sci. Policy 2016, 62, 45–56. [Google Scholar] [CrossRef]
  45. Nelson, E.; Mendoza, G.; Regetz, J.; Polasky, S.; Tallis, H.; Cameron, D.; Chan, K.M.A.; Daily, G.C.; Goldstein, J.; Kareiva, P.M.; et al. Modeling multiple ES, biodiversity conservation, commodity production, and trade-offs at landscape scales. Front. Ecol. Environ. 2009, 7, 4–11. [Google Scholar] [CrossRef]
  46. European Environment Agency (EAA). Updated CLC Illustrated Nomenclature Guidelines. 2019. Available online: https://land.copernicus.eu/user-corner/technical-library/corine-land-cover-nomenclature-guidelines/docs/pdf/CLC2018_Nomenclature_illustrated_guide_20190510.pdf (accessed on 15 October 2022).
  47. Hanna, D.E.L.; Tomscha, S.A.; Dallaire, C.O.; Bennett, E.M. A review of riverine ecosystem service quantification: Research gaps and recommendations. J. Appl. Ecol. 2018, 55, 1299–1311. [Google Scholar] [CrossRef]
  48. Felipe-Lucia, M.R.; Martín-López, B.; Lavorel, S.; Berraquero-Díaz, L.; Escalera-Reyes, J.; Comín, F.A. Ecosystem services flows: Why stakeholders’ power relationships matter. PLoS ONE 2015, 10, e0132232. [Google Scholar] [CrossRef] [Green Version]
  49. Gould, R.K.; Ardoin, N.M.; Woodside, U.; Satterfield, T.; Hannahs, N.; Daily, G.C. The forest has a story: Cultural ecosystem services in Kona, Hawai’i. Ecol. Soc. 2014, 19, 55. [Google Scholar] [CrossRef]
  50. Logsdon, R.A.; Chaubey, I. A quantitative approach to evaluating ecosystem services. Ecol. Model. 2013, 257, 57–65. [Google Scholar] [CrossRef]
  51. Mansfield, B.; Mendes, W. Municipal Food Strategies and Integrated Approaches to Urban Agriculture: Exploring Three Cases from the Global North. Int. Plan. Stud. 2012, 18, 37–60. [Google Scholar] [CrossRef]
  52. McClintock, N.; Wooten, H.; Harper Brown, A. Toward a Food Policy “First Step” in Oakland, California: A Food Policy Council’s Efforts To Promote Urban Agriculture Zoning. J. Agric. Food Syst. Community Dev. 2012, 2, 15–42. [Google Scholar] [CrossRef] [Green Version]
  53. Prové, C.; de Krom, M.; Dessein, J. Politics of scale in urban agriculture governance: A transatlantic comparison of food policy councils. J. Rural Stud. 2019, 68, 171–181. [Google Scholar] [CrossRef]
  54. Mazzocchi, G.; Marino, D. Rome, a policy without politics: The participatory process for a metropolitan scale food policy. Int. J. Environ. Res. Public Health 2020, 17, 479. [Google Scholar] [CrossRef] [Green Version]
  55. Minotti, B.; Cimini, A.; D’Amico, G.; Marino, D.; Mazzocchi, G.; Tarra, S. Food Policy Processes in the City of Rome: A Perspective on Policy Integration and Governance Innovation. Front. Sustain. Food Syst. 2022, 5, 786799. [Google Scholar] [CrossRef]
Figure 1. Research design (source: authors’ elaboration).
Land 11 02055 g001
Figure 2. Land uses and protected areas in the Municipality of Rome, scale 1:100,000 (Source: Cavallo et al. (2014), using data from Corine Land Cover, 2006) (Left). Land use and paths surrounding CMAP (Right).
Land 11 02055 g002
Figure 3. List of the six most ranked ES through mapping and assessment.
Land 11 02055 g003
Figure 4. CMAP area: ES mapping and assessment.
Land 11 02055 g004
Figure 5. List of the six most ranked ES by experts on a Likert scale from 0 to 3.
Land 11 02055 g005
Figure 6. CMAP area: ES participatory mapping of the main ES.
Land 11 02055 g006
Figure 7. While previously the scores obtained by the most ranked ES per each assessment method were shown, here, the results are combined to allow for a comparison. The values of the six most ranked ES by residents on a Likert scale from 0 to 3.
Land 11 02055 g007
Figure 8. Aggregated values assigned to each ES category (provisioning, regulating and cultural) by the three evaluation methodologies considered in the study.
Land 11 02055 g008
Figure 9. Comparison of the “stand-alone policies” scenario and the “place-based Policy-mix” model.
Land 11 02055 g009
Table 1. Six most ranked ES values per methodology. The columns identify the category and typology of ES, the methodology used for their assessment and the value scored.
ES CategoryESMethodValue
ProvisioningCropsES mapping and assessment5
RegulatingWater flow regulationES mapping and assessment3
RegulatingPollination and seed dispersalES mapping and assessment4
RegulatingAir purificationES mapping and assessment3
RegulatingHabitat for biodiversityES mapping and assessment3
CulturalLandscape aestheticES mapping and assessment3
Total ES Value through ES mapping21
ProvisioningCropsExpert-based2.82
RegulatingWater flow regulationExpert-based2.14
RegulatingPollination and seed dispersalExpert-based2.6
RegulatingAir purificationExpert-based2.27
RegulatingHabitat for biodiversityExpert-based2.48
CulturalLandscape aestheticExpert-based2.48
Total ES Value through expert-based assessment14.79
ProvisioningEconomic valueSocial perception2.25
RegulatingBiodiversity valueSocial perception2.5
RegulatingLife sustaining valueSocial perception2.38
CulturalFuture valueSocial perception2.5
CulturalLearning valueSocial perception3
CulturalRecreational valueSocial perception2.25
Total ES Value through social perception assessment14.87
Table 2. Analysis of ES evaluation methods. The columns represent the three methodologies tested, and the rows identify the domains that were chosen for their transversal evaluation.
ES Mapping and AssessmentExpert-Based AssessmentSocial Perception
Resource needed/costsSoftware and technical skills;
Low costs of application (no field work required)
High costs of application: field work is requiredHigh costs of application: field work is required
Precondition/needsAn ex-ante and/or direct knowledge of the site is not requiredGathering of the panel of experts;
Guaranteeing a balanced representativeness of experts from different fields
Administration of questionnaires to a large number of individuals;
Construction of a sampling plan
OutputGIS mapping;
Highly technical language and graphical output, with the risk of not being understood by residents and policy makers
ESs ranking;
Qualitative evaluation of the site’s ecological interrelations
ES ranking
ResultsObjective evaluation based on informatic tools;
A direct perception of the site is missing;
Underestimation of cultural ES
More comprehensive evaluations of the ecosystem functions of the site;
Direct perception (can be both positive and negative according to experts’ preparation and background);
Ability to directly further examine ecosystem functions;
Underestimation of cultural ES
Involvement of the citizens in policy making;
Underestimation of Regulating ES;
Correct estimation of Cultural ES;
Partial evaluation;
Lack of scientific and technical assessment
Added valueMapping of large areas, compared to expert- and social-based evaluationSpecific environmental and landscape scientific backgroundStratified and “historical” knowledge of the area
Publisher’s Note: MDPI stays neutral with regard to jurisdictional claims in published maps and institutional affiliations.

