Article

Urban Avian Conservation Planning Using Species Functional Traits and Habitat Suitability Mapping

by
Andrew Tim Man Chin
1,2,*,
Jonathan Leo William Ruppert
1,2,
Namrata Shrestha
1,3 and
Marie-Josée Fortin
2
1
Toronto and Region Conservation Authority, 101 Exchange Ave, Vaughan, ON L4K 5R6, Canada
2
Department of Ecology and Evolutionary Biology, University of Toronto, 25 Willcocks St, Toronto, ON M5S 3B2, Canada
3
School of the Environment, University of Toronto, 149 College St, Toronto, ON M5T 1P5, Canada
*
Author to whom correspondence should be addressed.
Land 2022, 11(10), 1831; https://doi.org/10.3390/land11101831
Submission received: 2 September 2022 / Revised: 26 September 2022 / Accepted: 14 October 2022 / Published: 18 October 2022
(This article belongs to the Section Landscape Ecology)

Abstract

:
Urbanization adversely impacts biodiversity by reducing the quantity and quality of natural habitat areas. Additionally, the quality of natural habitat depends on its bio-physical characteristics (e.g., natural cover, impervious surfaces, urban tree canopy) as well as the functional traits of species inhabiting them (e.g., breeding/foraging habitat requirements). To better plan conservation of regional biodiversity in urbanized landscapes, it is therefore critical to assess the relationship between the landscape and the response of key Functional Trait Groups (FTGs) of species. To identify different FTGs of 116 avian species in the urbanized landscape of the Toronto region (Canada), we conducted a Functional Trait Analysis (FTA) using RLQ-fourth corner analysis. We focused on four species traits (diet, foraging, nesting, and territoriality) to identify the FTGs and their association with natural cover and landscape characteristics (landcover types, patch quality, habitat connectivity). Then, to predict FTG presence in relation to the landscape characteristics, we performed a Habitat Suitability Analysis (HSA). From this analysis, we found 21 avian FTGs with different habitat suitability values that correspond to forested patches and wetlands. The HSA for tree canopy, forest insectivore, and ground-nesting birds (or FTGs) have higher suitability values within forest patches, while aerial insectivores have higher suitability values in older residential neighborhoods indicating the value of the urban tree canopy. This methodological approach shows that by mapping habitat suitability by FTG one can identify strategic conservation areas that target multiple species, shifting efforts from a single species to a community-based functional focus. Our study highlights the conservation value of remnant and/or restored habitat patches in near urban and urban landscapes that help to maximize the persistence of regional avian biodiversity.

1. Introduction

Biodiversity in urban landscapes is affected by habitat loss and fragmentation, reducing habitat quantity, quality, and connectivity between patches [1,2]. In cities, land use change through the conversion of natural landcover to various human uses tend to be dominated by impervious landcover types (roads, residential areas) [3,4]. To support growing human populations, urbanization is expected to intensify by 2050 globally, where up to 67.2% of the world’s population is expected to live in cities [5]. One approach to mitigate land use impacts on biodiversity is to intensify development within city cores, thus reducing the negative consequences of sprawling land use change [6]. This raises challenges within urban cores where development and community needs must be met without compromising ecosystem health and urban biodiversity. For this, an integrated and strategic approach is needed at the policy, planning, and practice levels to ensure that remnant habitat patches and critical connectivity corridors in urbanized landscapes are conserved and/or restored for species persistence.
Cities have many potential opportunities to support biodiversity [7,8]. Indeed, various types of constructed living green infrastructure (e.g., green roofs, naturalized ponds) in urban landscapes have been linked to increases in biodiversity compared to conventional grey infrastructure [9]. In particular, urban forests including street and backyard trees have also been identified as potential habitat for species depending on their composition and quality [10]. Conversely, urban forests and ponds have the potential to facilitate exotic invasive species that compromise habitat quality in natural areas as well as surrounding landscapes. In particular, there is an increased need for continued active management to ensure that urban forests provide appropriate habitat conditions to support biodiversity conservation [11]. Furthermore, the quality of urban forest varies greatly, especially in built-up portions of the urbanized landscape, where the ability of tree canopy to function as breeding habitat could diminish [12]. Therefore, though there are indications that various types of living green infrastructure in urban landscapes could potentially support habitat function and biodiversity, their overall contribution for habitat conservation remains ambiguous and challenging when incorporating elements of green infrastructure in conservation planning.
Managers and planners are often asked to assess the benefits of conservation and restoration for groups of species that can represent hundreds of species. Here, we propose using functional trait groups (FTGs) of species that reflect species having similar biological needs and responses to external environmental factors and landcover types [13]. In terms of ecological relevance, FTGs represent species that share similar environmental needs and requirements across space [14]. Further, certain functional traits (e.g., urban forest canopy-nesters, omnivores [15,16]) are found to be more adapted to an urban environment and associated with green infrastructure with foraging and/or breeding behaviours [17]. However, the urban environment can also be associated with negative effects on other functional traits indicating the need for less urbanized natural environments in order to provide diverse habitat types [18]. A functional trait approach [19] can help planners and managers by providing information on the species composition of the FTGs and their response to landscape characteristics for managing and conserving many species and the functional roles they have in the environment.
The main objective of this study is to produce habitat suitability maps of functional groups of avian species (FTGs) in the Toronto region (Canada) using a Habitat Suitability Analysis (HSA). With the strength of such FTG habitat suitability maps, conservation planning could then prioritize areas to maintain avian diversity in urban landscapes. Altogether, this framework provides information that can facilitate conservation planning by identifying areas that will maintain functional avian groups rather than having to deal with the complexity of each species separately.

2. Materials and Methods
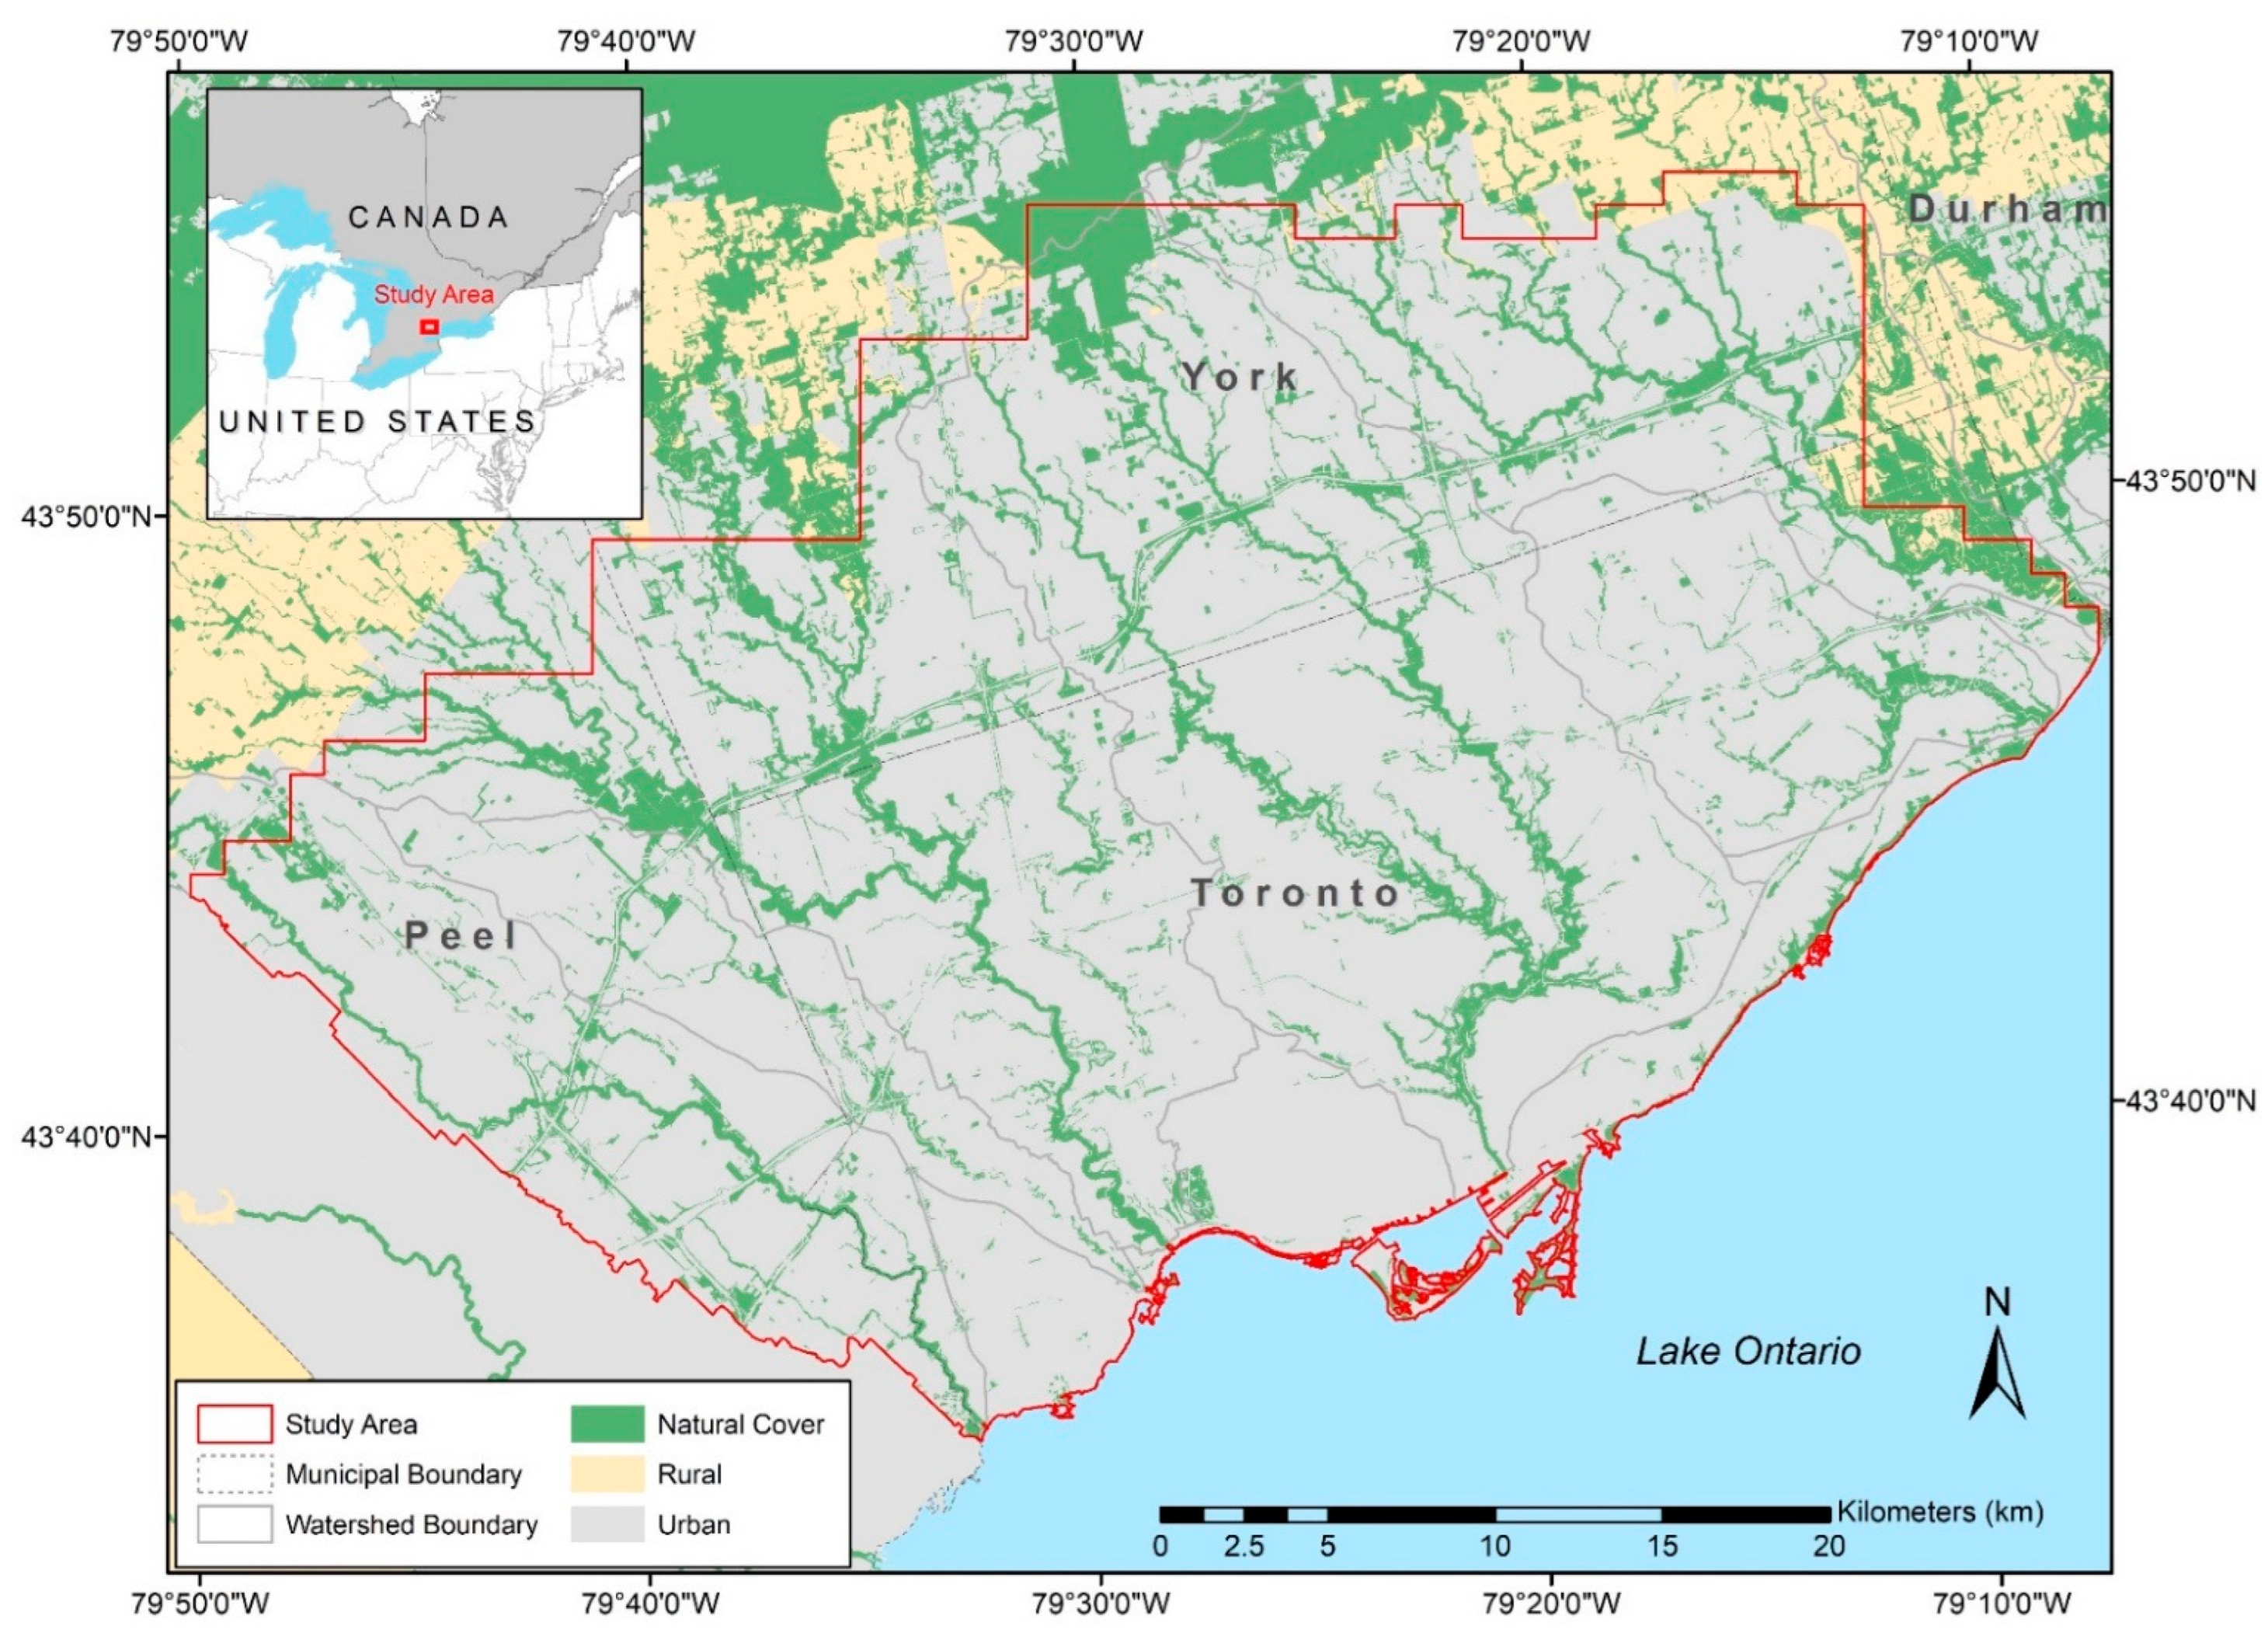
2.1. Study Area

The study area encompasses the urban portions of the Toronto region (43°42′00″ N, 79°24′58″ W; ~1300 km2) including the City of Toronto and partially within the regional municipalities of Peel and York (Ontario, Canada; Figure 1). The Toronto region with a population of 4 million is ideal for this study given that remnant urban habitat is under threat with habitat loss and degradation due to stressors related to ongoing urbanization [20]. The Toronto region is the largest urban region in Canada and has one of the fastest growing populations with a 9.4% growth in distant suburban areas from 2016 to 2021 [21]. The urban extent of this study is bordered by the surrounding Greenbelt, a network of protected agricultural and natural areas in South-Central Ontario [22]. Here, the watersheds in the study region consist of more than 50% urbanized area [23]. However, there remains a network of natural areas, predominantly located within valley and stream corridors of watersheds, which is intertwined with various land uses, such as remnant natural cover (e.g., forest, wetlands, meadows) and other living green infrastructure (e.g., street and backyard trees, parkettes, naturalized ponds) across the landscape. In contrast, the built portion of the study area is dominated by impervious land cover (e.g., roadways, residential, industrial), with smaller pockets that have a more expanded presence of living green infrastructure (e.g., older low-density residential with high urban forest canopy).

2.2. Avian Species Data

Avian species inventory records collected by Toronto and Region Conservation Authority (hereafter TRCA) in natural areas from 2010–2017 were used in this study [24]. Inventory data collection were completed during the breeding season (early June to mid-July). The methodology to identify confirmed or possible breeding birds followed a standardized protocol [25] (Supplementary Material). As these points represent presence-only records, we generated pseudo absences to contrast unsampled areas using a 500 m buffer around species presence data points and generated a set of random pseudo-absence points spaced with a minimum distance of at least 1 km between each other (Supplementary Material). A total of 149 pseudo-absence points was generated using this method that maximized this buffer space. Altogether, there were 11,090 presences accounting for 116 species within the Toronto region.

2.3. Landscape Characteristics Data

We assessed landscape characteristics around the species presence and pseudo-absence points by quantifying the landscape variables representing landcover types, patch quality, habitat connectivity, ELC (Ecological Land Classification) vegetation communities, and urban tree canopy (Supplementary Material). Landcover data were derived from TRCA orthophotography imagery in 2012 aligning with the species data into 20 classes (Supplementary Material; Table S1). First, natural cover feature classes were distinguished as four types: beach/bluff, forest, meadow, and wetland (Supplementary Material; Table S1). Second, where field data of vegetation communities were available throughout the study area, they were classified using a modified Ecological Land Classification System (ELC) developed by the Ontario Ministry of Natural Resources [26]. Data have been collected since 2001 by TRCA using standardized field-based protocol to survey the vegetation communities into vector data [24]. We used the ELC broadest scale of 16 classifications of vegetation communities (Supplementary Material; Table S1). Lastly, the amount of urban tree canopy was derived using the City of Toronto [27], Region of York [28], and Region of Peel [29] assessment of urban forest canopy cover and summarized at a 10 m cell resolution.

2.3.1. Patch Quality

Patch quality was quantified by measuring the total amount of habitat, maximum patch size, and perimeter-area ratio for each landcover type (beach/bluff, forest, meadow, wetland) at a specific grid or buffer point (Habitat Suitability Analysis: 100 m grid (aligns with connectivity raster data—see Section 2.3.2; Functional Trait Analysis: 500 m buffer around a species point—see Section 2.4.1). The total amount of habitat available is considered the total area of patches at a given point for each habitat type. The maximum patch size was the largest patch of each habitat type at a given point. The perimeter-area ratio for each habitat type quantified potential fragmentation of patches, where higher perimeter-area ratios indicated more edges or linear features. Patch quality data were compiled using ArcGIS 10.4.1 [30].

2.3.2. Habitat Connectivity

To determine local and regional connectivity between both forest and wetland patches, we conducted a connectivity assessment for the region using a graph theoretical approach. The degree of connectivity can influence the response of FTGs to surrounding landscape characteristics around patches and the resulting habitat suitability [31,32]. For example, mobility across roads may be less likely due to a potential increased threat of mortality, but movement across habitat and for breeding may be hindered by edge effects and fragmentation [33].
To identify local connectivity, we used cost-weighted distance derived from Linkage Pathways tool in the ArcGIS Linkage Mapper Toolkit [34] to create two models for the habitat connectivity types (forest-forest, wetland-wetland connectivity) to represent the relevant habitat types used for foraging or breeding opportunities. The cost-weighted distance accounts for the impediment to movement based on the resistance values (Supplementary Material) and least-cost paths between habitat patches, and finally combined into a least-cost corridor map.

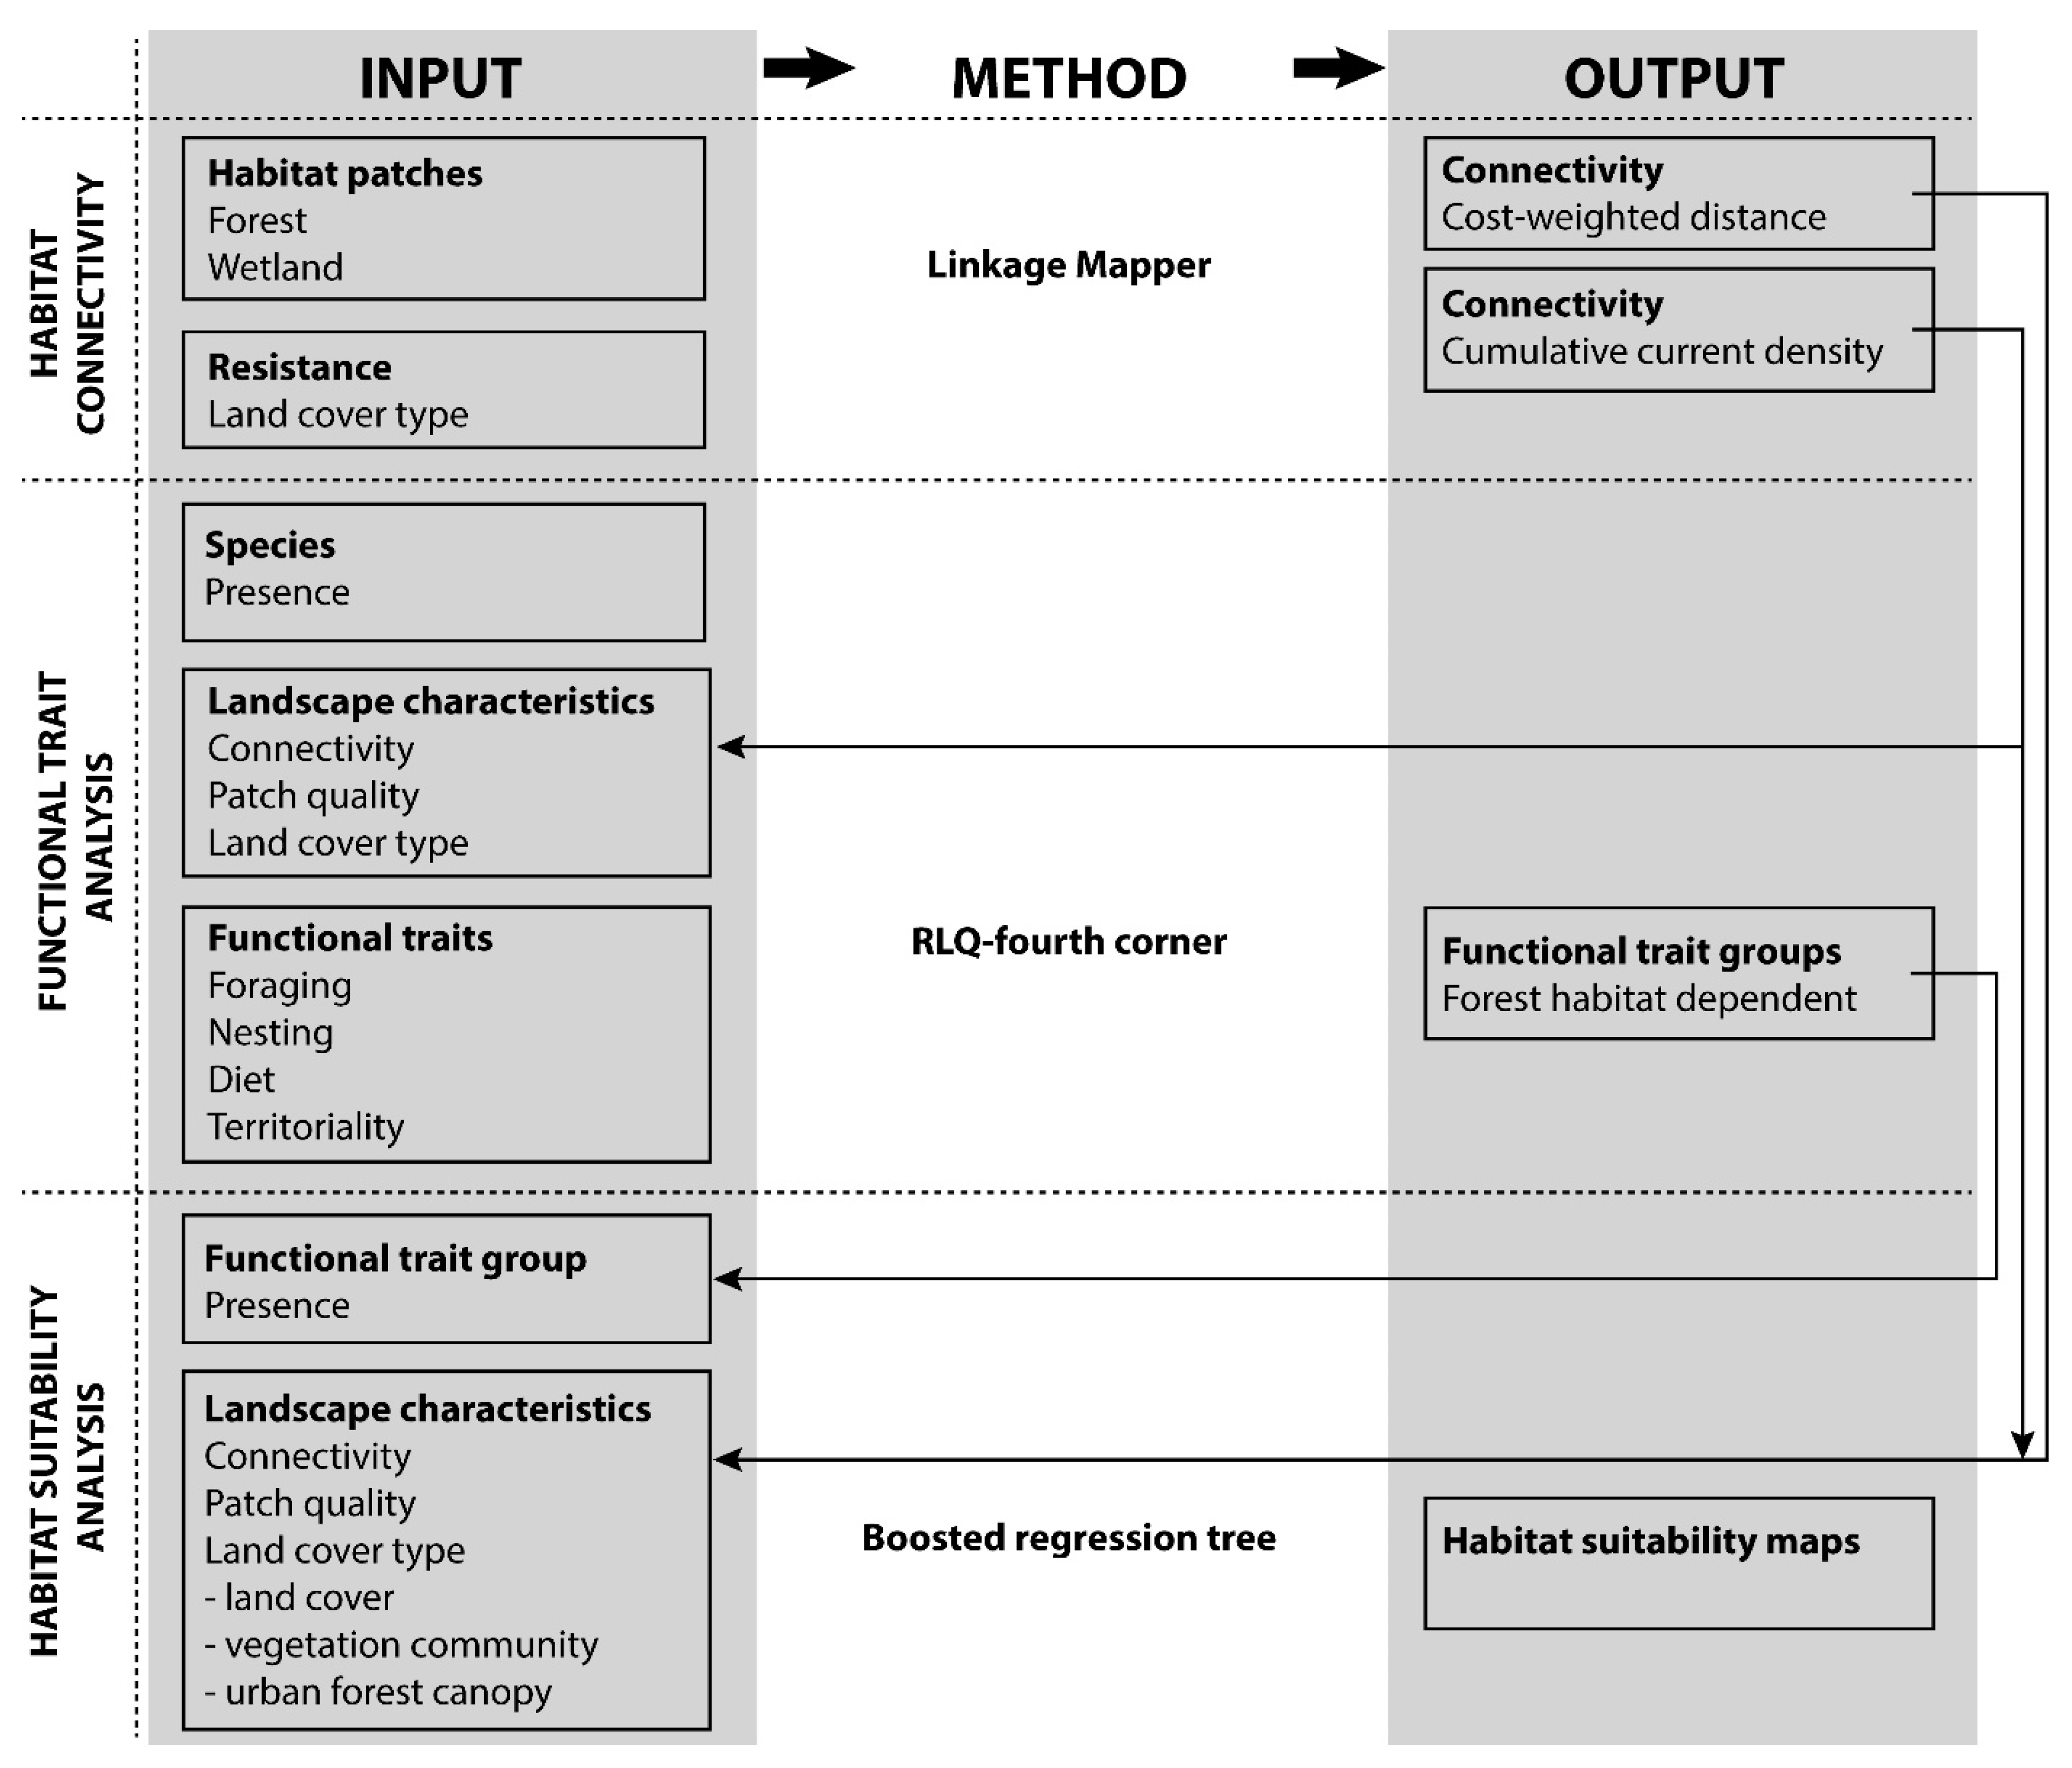
2.4. Methodological Approach

2.4.1. Functional Trait Analysis/RLQ-Fourth Corner

We identified avian FTGs by assessing which functional traits are sensitive to habitat quality (land cover, patch quality) and the landscape configuration of habitat patches (connectivity; Figure 2). Specifically, we selected FTGs that are associated with the urban forest canopy for foraging or nesting habitat. These potentially sensitive FTGs to the urban forest canopy were used in the habitat suitability analysis (Figure 2; Supplementary Material).
To determine species functional traits (Supplementary Material, Table S2) and their respective habitat requirements [35], we conducted a literature review. We complemented knowledge about species habitat requirements with expert-based information available from TRCA reports [24]. We retained 24 functional traits and grouped them into broader categories relating to foraging location, diet, nesting location, and restricted breeding territoriality (Supplementary Material; Table S2). Additionally, to assess how sensitive particular species traits are to changes in land cover, we used an RLQ-Fourth Corner analysis to determine significant associations of traits to these landscape characteristics (Figure 2) [19].
To conduct the Functional Trait Analysis (FTA), presences and pseudo-absence points were used in relation to the landscape characteristics within a 500 m buffer (total habitat, largest habitat patch, perimeter-area ratio of the largest habitat patch, total amount of land cover types, habitat connectivity; Supplementary Material) for a total of 31 landscape characteristic variables in the RLQ-fourth corner analysis (Supplementary Material; Table S1). Generally, a 500 m radius characterizes the habitat quality that may determine habitat preference at a fine-scale for avian species in an urban setting [36]. We adjusted the probability values (p < 0.05) from the trait-environment relationships using the false discovery rate (FDR) Benjamini and Hochberg procedure [19].
To find FTGs from the trait-environment relationship identified by the RLQ-fourth corner analysis [19], we used a Ward’s hierarchical clustering algorithm [37]. The response of FTGs to forest landscape characteristics was determined by the trait relationship in the RLQ-fourth corner analysis. The FTA was assessed using the R package ‘ade4’ [38].

2.4.2. Habitat Suitability Analysis (HSA)

We assessed habitat suitability for the FTGs that were likely associated with urban forest canopy using a Boosted Regression Tree (BRT) analysis (Figure 2) [39]. BRT can model non-linear patterns and almost any type of predictor variables (e.g., different numeric scales, quantitative, qualitative) while also modelling interactions between variables [39]. BRT improves predictive performance by minimizing the loss function after each step, thereby focusing on reducing the proportion of unexplained variance of the final model. BRT calculates the relative influence of predictor variables (scaled from 0 to 100) by assessing the number of times a predictor is selected for splitting, weighted by the squared improvement to the model and averaged across all trees (n > 1000 trees) [40]. Important predictor variables have a higher relative influence indicating that the predictor has a stronger influence on the response (probability of occurrence).
We compared the BRT models to predict the presence of FTGs in 100 m grids in relation to land cover types, urban forest canopy, vegetation communities (Ecological Land Classification (ELC)), patch quality (largest patch size and perimeter-area ratio), and connectivity (pinch point and cost-weighted distance). The urban forest canopy, vegetation communities, and land cover types were 500 m radius moving windows across 100 m grids to assess the total amount, and patch quality was based on the average (Supplementary Material). The BRT analyses were performed with the R packages ‘gbm’ and ‘dismo’, and spatially predicted with ‘raster’ [41,42,43].

2.4.3. Combining Trait-Based and Habitat Suitability Analysis

Avian FTGs that were derived from RLQ-fourth corner analysis [19] were used to determine functional traits that have strong and significant associations with landscape characteristics based on habitat quality (land cover, patch quality) and habitat connectivity (Supplementary Material, Figure 2 and Figure S1). We then selected FTGs that could be associated with the urban forest canopy for foraging or nesting habitat relating to forests (Supplementary Material, Figure S1): aerial insectivores (n = 197 individuals), forest canopy (n = 567 individuals), forest insectivores (n = 171 individuals), and ground-nesting (n = 75 individuals). These potentially sensitive FTGs associated with urban forest canopy were used in the HSA through the application of BRT analysis [39]. Given that the number of individuals vary among FTGs and that affects the probability of occurrence for habitat suitability using BRTs, we compared the HSA maps based on quantile distribution across the study extent. Low habitat suitability is from 0–40 quantile distribution, medium habitat suitability is from 41–80, and high habitat suitability is from 81–100.
Figure 2. Methodological approach for deriving functional trait groups from species presence, species trait, and landscape characteristic (including habitat connectivity [34]) using a functional trait analysis (RLQ-fourth corner [19]). These functional trait groups were used to predict habitat suitability using boosted regression trees [39] across the study area.
Land 11 01831 g002

3. Results

3.1. Functional Trait Analysis/RLQ-Fourth Corner

The functional trait analysis determined there were 21 functional trait groups (FTGs) where each group comprises of species with similar relationships between traits and environmental variables (land cover, patch quality, and connectivity; Supplementary Material, Figure S1). Six FTGs were associated with forest habitat (Supplementary Material, Figure S1). Four groups (aerial insectivores, forest canopy, forest insectivores, ground-nesting) had sufficient sample sizes (n ≥ 75 individuals) to generate more than 1000 trees using boosted regression trees (BRTs) to prevent overfitting of data for the habitat suitability analysis (HSA) with landscape characteristics to predict species occurrence (see Section 3.2).
Aerial foraging traits were positively associated with urban land uses (commercial and industrial areas or transportation; Supplementary Material, Figure S2), but had a negative association with wetland connectivity, despite species with the aerial foraging trait being strongly associated with wetland habitat. Traits associated with forest habitat, such as arboreal-foraging species or canopy-nesting species, were found to be positively associated with aspects of patch quality, such as total forest habitat or maximum patch size, respectively, or the connectivity of patches (forest or wetland; Supplementary Material, Figure S2). In contrast, forest habitat traits were negatively associated with open habitat types, such as total amount of meadow habitat or land use types (airports, hydro corridors, transportation, industrial, institutional, or recreational areas; Supplementary Material, Figure S2).

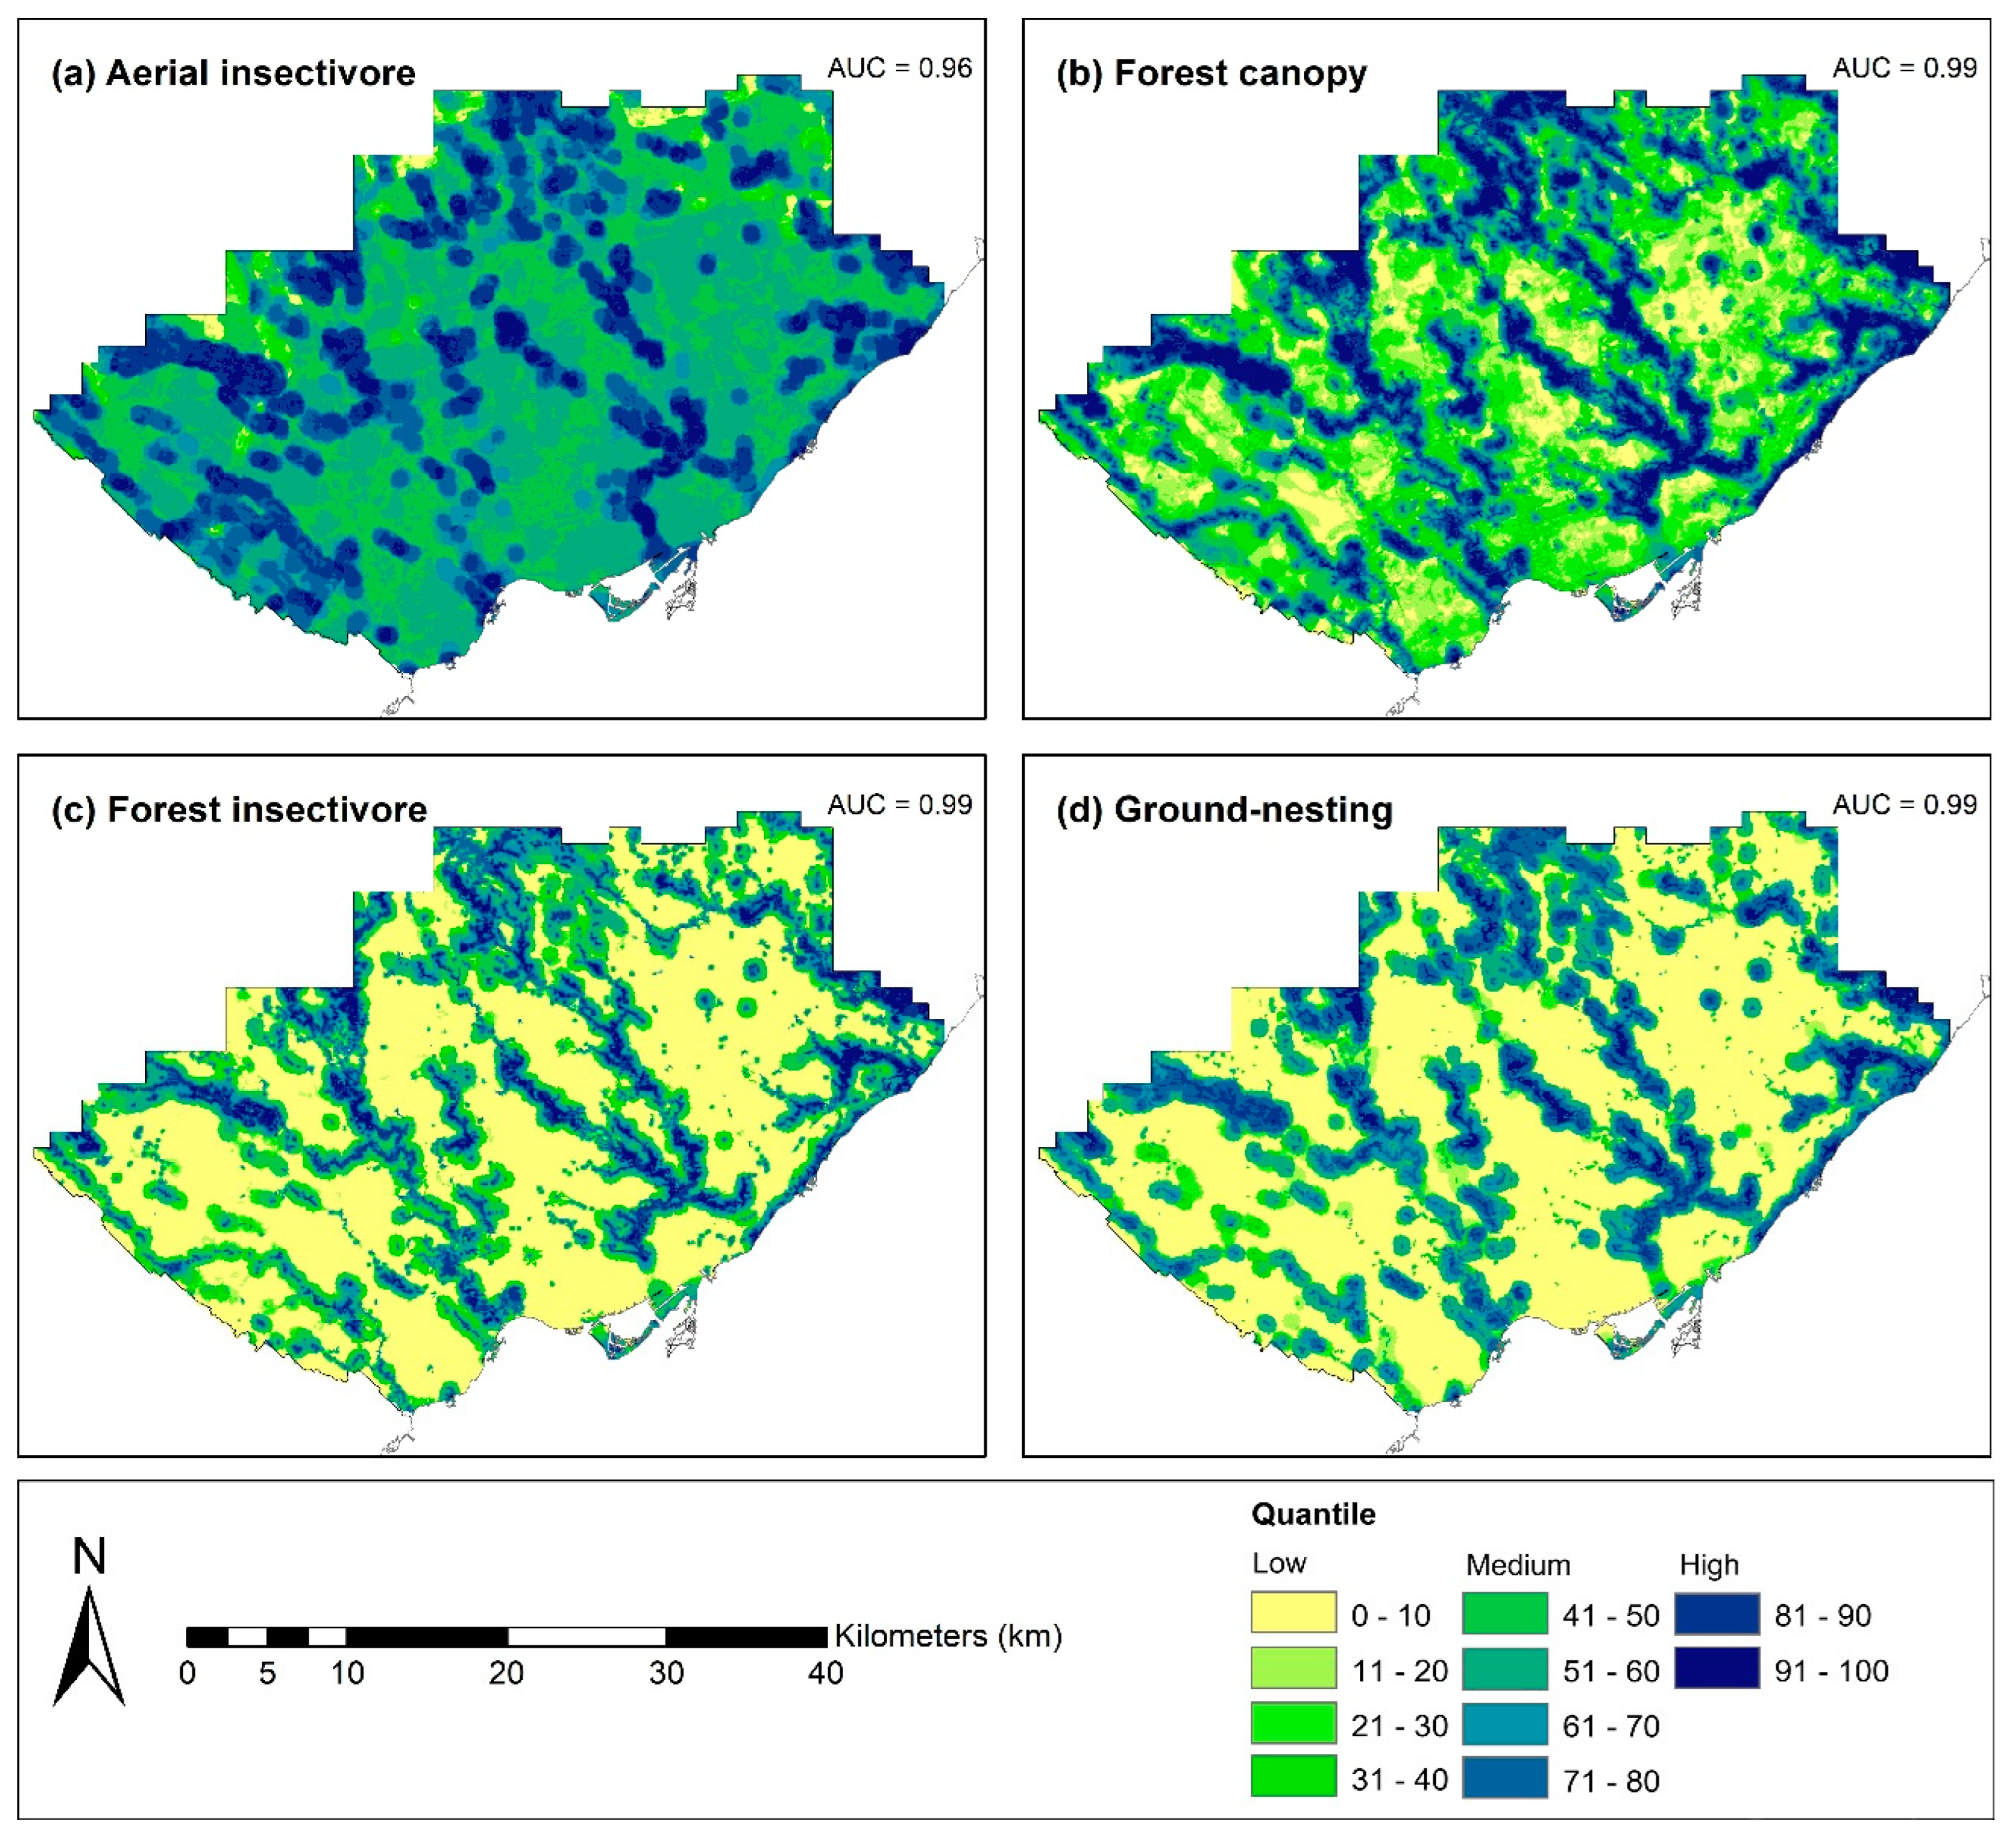
3.2. Habitat Suitability Analysis

We compared the habitat suitability for aerial insectivores, forest canopy, forest insectivores, and ground-nesting FTGs (see Section 3.1) and their response to landscape characteristics (i.e., land cover), patch quality, and habitat connectivity. Overall, all FTGs were highly influenced by natural cover ranging from 35.9 to 59.6% of the relative contribution to occurrence (Table 1). Ground-nesting was the most influenced by the urban forest canopy (4.9% of relative contribution to occurrence), followed by forest canopy at 1.0% (Table 1). Overall, the ground-nesting species group was mostly influenced (35.9% relative contribution to occurrence) by the vegetation community of mixed forests, whereas aerial insectivores had a relative contribution to occurrence of 1.1% by marsh (Table 1). Additionally, aerial insectivores, forest canopy, and forest insectivore FTGs were influenced by anthropogenic landcover such as low/medium-density residential or commercial property ranging from 1.1 to 4.4% (Table 1). In contrast, neither aerial insectivores nor forest canopy birds were influenced by the urban forest canopy (Table 1).
Connectivity influenced certain FTGs and the relationship varied if it was due to the pinch point (regional) or cost-weighted distance (local) connectivity. Both regional and local connectivity were similarly important for aerial insectivores and forest insectivores (Table 1). Furthermore, forest canopy and forest insectivores were FTGs where local forest connectivity was the most important predictor (44.1–59.6% relative contribution to occurrence; Table 1). By contrast, regional connectivity was partially important for aerial insectivore, forest insectivore, and ground-nesting FTGs (Table 1). Additionally, aerial insectivores were the only FTG influenced by local and regional wetland connectivity (Table 1).
Patch quality was an important predictor for the ground-nesting and aerial insectivore FTGs. Comparing ground-nesting to all other FTGs, the maximum patch size of forests was one of the most important predictors (26.9% relative contribution to occurrence; Table 1), whereas other FTGs ranged from 1.0 to 2.3% for patch size (Table 1). In addition, the amount of meadow edges affected the aerial insectivore FTG (Table 1).
Lastly, HSA patterns across the landscape were context specific, depending on the FTG. Spatially, aerial insectivores have medium suitability (ranging from 41–80) representing 54.5% of the study area. Aerial insectivores also had a highly suitable core area (ranging from 81–100) representing 19.2% of the study area (Figure 3). The ground-nesting group is the most limited (in the study area) for habitat suitability with very restricted highly suitable area representing only 5.4% of the study area (Figure 3). Forest insectivores have narrow patches of highly suitable habitat (7.9% of the study area) in contrast to the larger core patches for the forest canopy FTG (representing 18.1% of the study area; Figure 3).

4. Discussion

In urbanized landscapes, there is a wide range of heterogeneity in land cover types ranging from natural cover to built-up urban areas. Embedded in built-up areas is various living green infrastructure (e.g., street/backyard trees, parkettes, naturalized ponds) that can still provide habitat function, albeit at differing levels, for a variety of avian species. Given the diversity of habitat types, imperfect sampling in natural areas, it may be difficult to capture key relationships that support species of interest. We addressed this challenge by demonstrating that a functional trait analysis can be used to derive distinct FTGs (here 21 in total) representing a wide diversity of species in the Toronto region. Then, combining the FTGs with habitat suitability mapping, we propose that areas with higher suitability values should be prioritized for conservation management planning in urban landscapes. Here, we were able to focus on four FTGs that strongly relate to forest habitat, which included aerial insectivores, forest canopy, forest insectivores, and ground-nesting birds. These four FTGs also serve as examples of how species in each of these groups (with similar functional traits) and highly suitable habitat can be targeted for conservation efforts together to ensure their long-term persistence.
Generally, aerial insectivores can be considered the most urban-adapted FTG in our study given that most aerial insectivores have nests associated with human-built structures [44]. Then, they are the only FTG associated with forested habitat, but could breed outside of natural areas (e.g., tree swallows (Tachycineta bicolor), purple martins (Progne subis), barn swallows (Hirundo rustica), chimney swifts (Chaetura pelagica)). Despite some aerial insectivore species associated with human-built structures, we find that forest and wetland habitat types are still necessary for their persistence. For example, habitat connectivity is an important factor for insectivorous birds and therefore the habitat spatial configuration, such as proximity between potential breeding and foraging opportunities, should be considered [45]. An aerial insectivore diet would require associated riparian and wetland habitat that would support prey, which are influenced by the abundance of flying insects and therefore affect the quality of diet [46]. As such, aquatic habitat quality is also important to support the prey community. Overall, we find that aerial insectivore species that will use urban areas for breeding, depend on the nearby potential forested habitat available in terms of quality and quantity, as well as connectivity.
Forest canopy species (e.g., scarlet tanager (Piranga olivacea), American redstart (Setophaga ruticilla), red-eyed vireo (Vireo olivaceus)) and forest insectivore species (e.g., alder flycatcher (Empidonax alnorum), willow flycatcher (Empidonax traillii), eastern kingbird (Tyrannus tyrannus)) in our study area were mostly associated with a specific forested habitat (deciduous forest canopy). Throughout the study area, deciduous (Carolinian) forest canopy is the dominant natural habitat available such that particular conservation and restoration considerations should be made for the native deciduous trees [11]. Further, the structural density of forest stands could affect the overall community composition [47], thus the functional diversity of vegetation community may change and also affect habitat suitability for forest canopy and forest insectivore avian FTGs. Of note, is that the density and structural complexity of patches were not considered in this study, so while we find that forest canopy and forest insectivore groups are associated with deciduous forest patches, a finer level of assessment may be able useful to distinguish higher versus lower suitable habitat based on characteristics of patches (e.g., community composition, native species).
Forest insectivore birds (e.g., great crested flycatcher (Myiarchus crinitus), alder flycatcher (Empidonax alnorum), willow flycatcher (Empidonax traillii)) were associated with forested areas within riparian habitat around streams and swamps. Their prey source will be linked to the habitat quality of stream networks as well as swamp catchments [48]. For example, applying pesticides, which may be associated with certain types of urban and rural land uses, could impact water quality and therefore negatively affect the persistence of this FTG [49]. Moreover, water quality, flow, erosion, and temperature tend to deteriorate as the imperviousness of hydrological catchments increase (or as catchments become more urbanized) which can impact the aquatic and riparian health [50,51]. As forest insectivores tend to have ranges associated with riparian habitat, this reduces the amount of habitat available and highlights the need to maintain and improve hydrological catchment quality by reducing imperviousness for the provisioning of foraging opportunities.
Lastly, ground-nesting birds (e.g., mourning warbler (Geothlypis philadelphia) and wood thrush (Hylocichla mustelina)) in forests were positively associated with larger and more connected forested areas, which likely reflects a lower level of human activities. This is supported by evidence that ground-nesters tend to be more sensitive to changes in the forest habitat at a finer spatial scale (e.g., location of trail, off-leash dog areas, accessibility to human activity) that can disrupt breeding activity and subsequent survival or reproduction [52]. Further, these stressors will be related to the patch size, where this FTG consists of core-sensitive species that are negatively affected by habitat fragmentation [53]. While we did not specifically account for various human activities that could occur in these habitat patches (e.g., off-leash dog areas or recreational areas), overall patch size and connectivity act as proxies for these stressors. Larger and well connected patches tend to have lower accessibility for human use and further away from higher population densities [54,55]. Thus, the ground-nesting FTG identifies the need to maintain larger, more connected forest patches as part of natural cover conservation plans to maintain their persistence.

5. Limitations & Future Steps

There were limitations in our study that could be improved with more resources and data. In particular, the type of data, location of data collection, and orthophotography data for environmental variables can constrain the analysis and results from this study. First, species inventory data is collected as presence-only and therefore pseudo-absences were generated to fill this void in the landscape. Pseudo-absences should be considered carefully as it could lead to biases in the models [56]. To mitigate this bias, we selected a buffer model to generate pseudo-absences as it is related to biological realism for the avian species such as edge effects from surrounding influence of land use around natural patches that may impact habitat suitability [57,58]. Second, the focus on natural patches was contrasted by the buffer analysis to account for urban areas that were not sampled in the built portions of the landscape. Additional data in the built portions would provide greater distinction between the habitat suitability gradient from natural to urban areas. This was evident with the aerial insectivore FTG. However, sampling for bird species in urban areas would provide a stronger depiction of habitat suitability in these urban areas, which may be missed. Third, we used landcover data derived from orthophotography and that represented a high-level assessment of the natural cover complemented with some detailed field assessment of vegetation community types. Furthermore, other ground data that reflect the quality of the natural cover could affect the habitat suitability of avian species, namely trail networks that can negatively impact some FTGs such as ground-nesting species. By incorporating these detailed data, we may find that the habitat patches indicating higher suitability may in fact have lower suitability.
Creating habitat suitability maps was intended to aid in identifying highly functional ecological areas in increasingly urbanized areas in our study region. Such information could be used with a prioritization framework such as MARXAN to solve the minimum-set problem to include a certain amount of features (e.g., areas with high habitat suitability) for the smallest possible cost to conservation targets (e.g., ecological representation) for its reserve selection to ensure biodiversity and natural cover are maximized [59]. By using FTGs in this process, the reserve selection process is considering numerous species within each FTG group for conservation. Furthermore, with ongoing development in urban areas to convert natural areas to human-dominated land uses, such land use changes can be assessed on future habitat suitability. By accounting for landcover changes under future scenarios and using current information we can then determine which areas will potentially undergo habitat suitability changes under future connectivity, patch quality, and land cover. Altogether, understanding the habitat suitability of FTGs, we can manage current conservation priorities in urban landscapes and prioritize areas for conservation and restoration under future threats for multiple species.

6. Conclusions

We demonstrate that the functional trait approach is useful in an urban environment to guide conservation planning. Given that species have different habitat needs and requirements, this approach considers specific FTGs which simplifies management actions in an urban context by using similar responses of a group of species instead of a single species. As a result, spatial differences in habitat suitability of FTGs are expected in a heterogenous landscape and prioritizing certain areas of overlap for conservation is possible. Our results highlight that consideration for the urban forest canopy should be given as a method to improve habitat quality through tree planting and urban canopy enhancement efforts as any loss of natural habitat would greatly affect habitat availability in future development and through the loss of habitat connectivity. Thus, the urban forest canopy could reduce the resistance across the landscape and mitigate the effects of connectivity loss due to intensifying development. Ultimately, our study demonstrates that the conservation of remnant habitat in cities would be necessary to ensure future species persistence.
Overall, cities can also provide habitat for certain species with functional traits that are more adapted to an urban environment, whereas others will undoubtedly require more naturalized landscapes. Current planning practices in many large cities have begun encouraging green infrastructure creation and enhancements, such as improving urban forest canopy, providing permeable surfaces into designs, providing green roofs, among other natural types of infrastructure. By using the FTG approach, we can simultaneously consider multiple species habitat needs and assess the potential benefits of green infrastructure as potential habitat supporting biodiversity. Altogether, the restoration, enhancement, and conservation of all types of habitats within urban ecosystems rely on strategic prioritization that should be considered alongside future development for the continued persistence of both urban-adapted and non-adapted species. The approach outlined in this study provides one way to account for the complexity of avian species habitat needs, which can help planning efforts achieve future biodiversity targets.

Supplementary Materials

The following supporting information can be downloaded at: https://www.mdpi.com/article/10.3390/land11101831/s1, Table S1. Predictors used for the RLQ-fourth corner (functional trait analysis) and boosted regression tree (habitat suitability analysis) within 100-m grids across the jurisdiction of the TRCA. Landcover and patch quality predictors are calculated as moving windows with a 500-m radius. Table S2. List of avian functional traits (n = 24) to determine the trait-environment relationship of sensitive functional trait groups. Table S3. Resistance values for avian species based on habitat dependency (forest-forest, wetland-wetland) in 100-m grids. Resistance will vary according to their individual tendency to move between habitat, which will affect the overall metapopulation persistence. Table S4. Species list of avian species (n = 116) within the Toronto region, Canada between 2010 and 2017 using species inventory. The resulting RLQ-fourth corner analysis using the species and their response based on functional traits to landscape characteristics (patch quality, habitat connectivity, and land cover type) derived 21 functional trait groups (Groups A-U). Table S5. Correlation matrix (Pearson’s r) of 31 variables with code numbers: total habitat of (1) beach/bluff, (2) forest, (3) meadow, (4) wetland; maximum patch size of (5) beach/bluff, (6) forest, (7) meadow, (8) wetland; mean edge of (9) beach/bluff, (10) forest, (11) meadow, (12) wetland; land cover type (13) airport, (14) cemetery, (15) commercial, (16) conservation area, (17) residential—estate, (18) farm, (19) golf course, (20) hydro corridor, (21) industrial area, (22) institutional, (23) natural, (24) open space, (25) park, (26) recreation, (27) residential – high density, (28) residential—low/medium density, (29) road, (30) regional pinchpoint connectivity – forest, (31) regional pinchpoint connectivity—wetland. Correlations of r > 0.7 are indicated in bold and shaded red. Figure S1. A dendrogram of the species (n = 116) associated in functional trait groups (n = 21) from the RLQ-fourth corner analysis. Each colored group is a functional trait group derived from clustering. The four key functional trait groups from this analysis are groups F (ground-nesting), M (aerial insectivore), O (forest canopy), and K (forest insectivore). Two functional trait groups P (bark forager) and U (forest carnivore) are forest-related but were not included to complete a habitat suitability analysis due to sample size. Figure S2. Associations from the RLQ-fourth corner analysis based on individual birds (n = 11,089) and pseudoabsences (n = 149) and avian functional traits (foraging location, diet, nesting location, and territoriality; n = 24 traits) in relation to landscape characteristics. Green indicates a positive association and red indicates a negative association. References [24,25,30,32,34,39,60] are cited in the supplementary materials.

Author Contributions

A.T.M.C. compiled data, completed analysis, and tested the models. J.L.W.R. helped conceptualize the study approach and supervised the analysis. N.S. and M.-J.F. outlined and supervised the findings of this work. All authors contributed to the final manuscript. All authors have read and agreed to the published version of the manuscript.

Funding

ATMC was provided funding through Mitacs (IT11565) and TRCA. M-JF acknowledges the funding of an NSERC Discovery Grant and of the Canada Research Chair in Spatial Ecology.

Institutional Review Board Statement

Not applicable.

Informed Consent Statement

Not applicable.

Data Availability Statement

The data presented in this study are available on request from the corresponding author. Additionally, all data layers can be requested from Toronto and Region Conservation Authority through a data sharing agreement.

Acknowledgments

We would like to thank Toronto and Region Conservation Authority (TRCA) for providing data for this analysis and the Region of Peel, York, and the City of Toronto for supporting ongoing TRCA’s data collection efforts. This study would not have been possible without their effort and dedication. We are thankful for the expert opinion provided by Paul Prior and Sue Hayes for the functional traits.

Conflicts of Interest

The authors declare no conflict of interest.

References

  1. Liu, Z.; He, C.; Wu, J. The Relationship between Habitat Loss and Fragmentation during Urbanization: An Empirical Evaluation from 16 World Cities. PLoS ONE 2016, 11, 1–17. [Google Scholar] [CrossRef] [Green Version]
  2. Scolozzi, R.; Geneletti, D. A Multi-Scale Qualitative Approach to Assess the Impact of Urbanization on Natural Habitats and Their Connectivity. Environ. Impact Assess. Rev. 2012, 36, 9–22. [Google Scholar] [CrossRef]
  3. Johnson, M.T.J.; Munshi-South, J. Evolution of Life in Urban Environments. Science 2017, 358, eaam8327. [Google Scholar] [CrossRef] [Green Version]
  4. Turrini, T.; Knop, E. A Landscape Ecology Approach Identifies Important Drivers of Urban Biodiversity. Glob. Chang. Biol. 2015, 21, 1652–1667. [Google Scholar] [CrossRef]
  5. UN-DESA. World Urbanization Prospects: The 2018 Revision (ST/ESA/SER.A/420); UN-DESA: New York, NY, USA, 2019. [Google Scholar]
  6. Xu, C.; Haase, D.; Pauleit, S. The Impact of Different Urban Dynamics on Green Space Availability: A Multiple Scenario Modeling Approach for the Region of Munich, Germany. Ecol. Indic. 2018, 93, 1–12. [Google Scholar] [CrossRef]
  7. Aronson, M.F.J.; Lepczyk, C.A.; Evans, K.L.; Goddard, M.A.; Lerman, S.B.; MacIvor, J.S.; Nilon, C.H.; Vargo, T. Biodiversity in the City: Key Challenges for Urban Green Space Management. Front. Ecol. Environ. 2017, 15, 189–196. [Google Scholar] [CrossRef] [Green Version]
  8. Kowarik, I. Novel Urban Ecosystems, Biodiversity, and Conservation. Environ. Pollut. 2011, 159, 1974–1983. [Google Scholar] [CrossRef]
  9. Filazzola, A.; Shrestha, N.; MacIvor, J.S. The Contribution of Constructed Green Infrastructure to Urban Biodiversity: A Synthesis and Meta-Analysis. J. Appl. Ecol. 2019, 56, 2131–2143. [Google Scholar] [CrossRef]
  10. Fernández-Juricic, E. Bird Community Composition Patterns in Urban Parks of Madrid: The Role of Age, Size and Isolation. Ecol. Res. 2000, 15, 373–383. [Google Scholar] [CrossRef]
  11. Almas, A.D.; Conway, T.M. The Role of Native Species in Urban Forest Planning and Practice: A Case Study of Carolinian Canada. Urban For. Urban Green. 2016, 17, 54–62. [Google Scholar] [CrossRef]
  12. Shoffner, A.; Wilson, A.M.; Tang, W.; Gagné, S.A. The Relative Effects of Forest Amount, Forest Configuration, and Urban Matrix Quality on Forest Breeding Birds. Sci. Rep. 2018, 8, 17140. [Google Scholar] [CrossRef] [PubMed] [Green Version]
  13. Mouillot, D.; Graham, N.A.J.; Villéger, S.; Mason, N.W.H.; Bellwood, D.R. A Functional Approach Reveals Community Responses to Disturbances. Trends Ecol. Evol. 2013, 28, 167–177. [Google Scholar] [CrossRef]
  14. Volaire, F.; Gleason, S.M.; Delzon, S. What Do You Mean “Functional” in Ecology? Patterns versus Processes. Ecol. Evol. 2020, 10, 11875–11885. [Google Scholar] [CrossRef]
  15. Croci, S.; Butet, A.; Clergeau, P. Does Urbanization Filter Birds on the Basis of Their Biological Traits? Condor 2008, 110, 223–240. [Google Scholar] [CrossRef]
  16. Lerman, S.B.; Nislow, K.H.; Nowak, D.J.; DeStefano, S.; King, D.I.; Jones-Farrand, D.T. Using Urban Forest Assessment Tools to Model Bird Habitat Potential. Landsc. Urban Plan. 2014, 122, 29–40. [Google Scholar] [CrossRef] [Green Version]
  17. Oliveira, J.M.; Segurado, P.; Santos, J.M.; Teixeira, A.; Ferreira, M.T.; Cortes, R.V. Modelling Stream-Fish Functional Traits in Reference Conditions: Regional and Local Environmental Correlates. PLoS ONE 2012, 7, e45787. [Google Scholar] [CrossRef] [PubMed]
  18. Devictor, V.; Julliard, R.; Clavel, J.; Jiguet, F.; Lee, A.; Couvet, D. Functional Biotic Homogenization of Bird Communities in Disturbed Landscapes. Glob. Ecol. Biogeogr. 2008, 17, 252–261. [Google Scholar] [CrossRef]
  19. Dray, S.; Choler, P.; Dolédec, S.; Peres-Neto, P.R.; Thuiller, W.; Pavoine, S.; ter Braak, C.J.F. Combining the Fourth-Corner and the RLQ Methods for Assessing Trait Responses to Environmental Variation. Ecology 2014, 95, 14–21. [Google Scholar] [CrossRef] [Green Version]
  20. Cartwright, L.A.; Hayes, S.; Tozer, D.C.; Clayton, D.; Burns, M.A.; Lewis, D.; Gaetz, N.; Shrestha, N. Assessing Terrestrial Wildlife Populations in the Toronto and Region Area of Concern. J. Great Lakes Res. 2021, 47, 273–282. [Google Scholar] [CrossRef]
  21. Statistics Canada. Canada’s Large Urban Centres Continue to Grow and Spread. 2022. Available online: https://www150.statcan.gc.ca/n1/daily-quotidien/220209/dq220209b-eng.htm (accessed on 1 September 2022).
  22. Ontario Ministry of Municipal Affairs and Housing (OMMAH) Greenbelt Plan (2017). 2017. Available online: https://files.ontario.ca/greenbelt-plan-2017-en.pdf (accessed on 1 September 2022).
  23. Toronto and Region Conservation Authority. Toronto and Region Watersheds: Report Card 2018; Toronto and Region Conservation Authority: Downsview, ON, Canada, 2018. [Google Scholar]
  24. Toronto and Region Conservation Authority. Scoring and Ranking TRCA’s Vegetation Communities, Flora, and Fauna Species; Toronto and Region Conservation Authority: Downsview, ON, Canada, 2017. [Google Scholar]
  25. Cadman, M.D.; Sutherland, D.A.; Beck, G.G.; Lepage, D.; Couturier, A.R. Atlas of the Breeding Birds of Ontario, 2001–2005; Bird Studies Canada, Environment Canada, Ontario Field Ornithologists, Ontario Ministry of Natural Resources, and Ontario Nature: Toronto, ON, Canada, 2007. [Google Scholar]
  26. Lee, H.T.; Bakowsky, W.D.; Riley, J.; Bowles, J.; Puddister, M.; Uhlig, P.; McMurray, S. Ecological Land Classification for Southern Ontario: First Approximation and Its Application; Ontario Ministry of Natural Resources, Southcentral Science Section: North Bay, ON, Canada, 1998. [Google Scholar]
  27. City of Toronto Forest and Land Cover-City of Toronto Open Data Portal. 2018. Available online: https://open.toronto.ca/dataset/forest-and-land-cover/ (accessed on 14 September 2018).
  28. Timmins, T.; Sawka, M. 2021 York Region Canopy Cover Assessment Technical Report; Toronto and Region Conservation Authority: Vaughan, ON, Canada, 2022. [Google Scholar]
  29. Soverel, N.; Dranga, S.; Blackwell, B.A. An Assessment of Urban Tree Canopy Cover in Peel Region 2015; B.A. Blackwell & Associates Ltd.: North Vancouver, BC, Canada, 2017. [Google Scholar]
  30. ESRI. ArcGIS, Version 10.4.1; Environmental Systems Research Institute: Redlands, CA, USA, 2015.
  31. Tremblay, M.A.; St. Clair, C.C. Permeability of a Heterogeneous Urban Landscape to the Movements of Forest Songbirds. J. Appl. Ecol. 2011, 48, 679–688. [Google Scholar] [CrossRef]
  32. Grafius, D.R.; Corstanje, R.; Siriwardena, G.M.; Plummer, K.E.; Harris, J.A. A Bird’s Eye View: Using Circuit Theory to Study Urban Landscape Connectivity for Birds. Landsc. Ecol. 2017, 32, 1771–1787. [Google Scholar] [CrossRef] [Green Version]
  33. Marzluff, J.M.; DeLap, J.H.; Oleyar, M.D.; Whittaker, K.A.; Gardner, B. Breeding Dispersal by Birds in a Dynamic Urban Ecosystem. PLoS ONE 2016, 11, 1–20. [Google Scholar] [CrossRef] [Green Version]
  34. McRae, B.; Kavanagh, D. Linkage Mapper Connectivity Analysis Software; The Nature Conservancy: Seattle, WA, USA, 2011. [Google Scholar]
  35. DeGraaf, R.M.; Tilghman, N.G.; Anderson, S.H. Foraging Guilds of North American Birds. Environ. Manage. 1985, 9, 493–536. [Google Scholar] [CrossRef]
  36. Ferenc, M.; Sedláček, O.; Fuchs, R. How to Improve Urban Greenspace for Woodland Birds: Site and Local-Scale Determinants of Bird Species Richness. Urban Ecosyst. 2014, 17, 625–640. [Google Scholar] [CrossRef]
  37. Murtagh, F.; Legendre, P. Ward’s Hierarchical Agglomerative Clustering Method: Which Algorithms Implement Ward’s Criterion? J. Classif. 2014, 31, 274–295. [Google Scholar] [CrossRef] [Green Version]
  38. Dray, S.; Dufour, A.-B. The Ade4 Package: Implementing the Duality Diagram for Ecologists. J. Stat. Softw. 2007, 22, 1–20. [Google Scholar] [CrossRef] [Green Version]
  39. Elith, J.; Graham, C.H.; Anderson, R.P.; Dudík, M.; Ferrier, S.; Guisan, A.; Hijmans, R.J.; Huettmann, F.; Leathwick, J.R.; Lehmann, A.; et al. Novel Methods Improve Prediction of Species’ Distributions from Occurrence Data. Ecography. 2006, 29, 129–151. [Google Scholar] [CrossRef] [Green Version]
  40. Elith, J.; Leathwick, J.R.; Hastie, T. A Working Guide to Boosted Regression Trees. J. Anim. Ecol. 2008, 77, 802–813. [Google Scholar] [CrossRef]
  41. Greenwell, B.; Boehmke, B.; Cunningham, J.; GBM Developers. Gbm: Generalized Boosted Regression Models; R Package Version 2.1.8.1. 2020. Available online: https://CRAN.R-project.org/package=gbm (accessed on 1 September 2022).
  42. Hijmans, R.J.; Steven, P.; Leathwick, J.; Elith, J. Dismo: Species Distribution Modeling; R Package Version 1.3-9. 2017. Available online: https://CRAN.R-project.org/package=dismo (accessed on 1 September 2022).
  43. Hijmans, R.J. Raster: Geographic Data Analysis and Modeling; R Package Version 3.6-3. 2020. Available online: https://CRAN.R-project.org/package=raster (accessed on 1 September 2022).
  44. Møller, A.P.; Diaz, M.; Flensted-Jensen, E.; Grim, T.; Ibáñez-Álamo, J.D.; Jokimäki, J.; Mänd, R.; Markó, G.; Tryjanowski, P. High Urban Population Density of Birds Reflects Their Timing of Urbanization. Oecologia 2012, 170, 867–875. [Google Scholar] [CrossRef]
  45. Evens, R.; Beenaerts, N.; Neyens, T.; Witters, N.; Smeets, K.; Artois, T. Proximity of Breeding and Foraging Areas Affects Foraging Effort of a Crepuscular, Insectivorous Bird. Sci. Rep. 2018, 8, 3008. [Google Scholar] [CrossRef]
  46. Razeng, E.; Watson, D.M. Nutritional Composition of the Preferred Prey of Insectivorous Birds: Popularity Reflects Quality. J. Avian Biol. 2015, 46, 89–96. [Google Scholar] [CrossRef]
  47. Ares, A.; Neill, A.R.; Puettmann, K.J. Understory Abundance, Species Diversity and Functional Attribute Response to Thinning in Coniferous Stands. For. Ecol. Manage. 2010, 260, 1104–1113. [Google Scholar] [CrossRef]
  48. Whitaker, D.M.; Carroll, A.L.; Montevecchi, W.A. Elevated Numbers of Flying Insects and Insectivorous Birds in Riparian Buffer Strips. Can. J. Zool. 2000, 78, 740–747. [Google Scholar] [CrossRef]
  49. Hallmann, C.A.; Foppen, R.P.B.; Van Turnhout, C.A.M.; De Kroon, H.; Jongejans, E. Declines in Insectivorous Birds Are Associated with High Neonicotinoid Concentrations. Nature 2014, 511, 341–343. [Google Scholar] [CrossRef] [PubMed]
  50. Environment Canada. How Much Habitat Is Enough? 3rd ed.; Environment Canada: Toronto, ON, Canada, 2013.
  51. Schueler, T.R. The Importance of Imperviousness. Watershed Prot. Tech. 1994, 1, 100–111. [Google Scholar]
  52. Miller, S.G.; Knight, R.L.; Miller, C.K. Influence of Recreational Trails on Breeding Bird Communities. Ecol. Appl. 1998, 8, 162–169. [Google Scholar] [CrossRef]
  53. Keyser, A.J.; Hill, G.E.; Soehren, E.C. Effects of Forest Fragment Size, Nest Density, and Proximity to Edge on the Risk of Predation to Ground-Nesting Passerine Birds. Conserv. Biol. 1998, 12, 986–994. [Google Scholar] [CrossRef]
  54. Lepczyk, C.A.; Aronson, M.F.J.; Evans, K.L.; Goddard, M.A.; Lerman, S.B.; Macivor, J.S. Biodiversity in the City: Fundamental Questions for Understanding the Ecology of Urban Green Spaces for Biodiversity Conservation. Bioscience 2017, 67, 799–807. [Google Scholar] [CrossRef] [Green Version]
  55. Thompson, B. Recreational Trails Reduce the Density of Ground-Dwelling Birds in Protected Areas. Environ. Manage. 2015, 55, 1181–1190. [Google Scholar] [CrossRef]
  56. Hazen, E.L.; Abrahms, B.; Brodie, S.; Carroll, G.; Welch, H.; Bograd, S.J. Where Did They Not Go? Considerations for Generating Pseudo-Absences for Telemetry-Based Habitat Models. Mov. Ecol. 2021, 9, 5. [Google Scholar] [CrossRef]
  57. Blair, R.R.B. Land Use and Avian Species Diversity along an Urban Gradient. Ecol. Appl. 1996, 6, 506–519. [Google Scholar] [CrossRef]
  58. Zurita, G.; Pe’er, G.; Bellocq, M.I.; Hansbauer, M.M. Edge Effects and Their Influence on Habitat Suitability Calculations: A Continuous Approach Applied to Birds of the Atlantic Forest. J. Appl. Ecol. 2012, 49, 503–512. [Google Scholar] [CrossRef]
  59. Possingham, H.; Ball, I.; Andelman, S. Mathematical Methods for Identifying Representative Reserve Network. In Quantitative Methods for Conservation Biology; Springer: New York, NY, USA, 2000; pp. 291–306. [Google Scholar]
  60. Dray, S.; Legendre, P. Testing the Species Traits Environment Relationships: The Fourth-Corner Problem Revisited. Ecology 2008, 89, 3400–3412. [Google Scholar] [CrossRef] [PubMed]
Figure 1. Study extent of the urban portion of the Toronto region (Canada) within the jurisdiction of Toronto and Region Conservation Authority (TRCA).
Land 11 01831 g001
Figure 3. Habitat suitability analysis in the Toronto region within the existing urban portions using boosted regression trees based on the quantile distribution of probability of occurrence for avian forest functional trait groups.
Land 11 01831 g003
Table 1. Relative influence on the probability of occurrence of predictor variables ≥1% in the boosted regression tree models for habitat suitability for functional trait groups. C = connectivity, P = maximum patch size, E = edge amount (perimeter-to-area ratio), LC = land cover.
Functional Trait GroupVariableRelative Influence
Aerial insectivoreLC_marsh39.7
LC_deciduous17.4
C_local_forest5.5
LC_swamp5.2
LC_beach4.7
LC_residential_lowmed4.4
LC_woodland3.1
C_regional_forest2.3
LC_savannah2.1
E_meadow2.0
LC_thicket1.7
C_local_wetland1.6
P_wetland1.2
LC_commercial1.1
P_forest1.0
Forest canopyC_local_forest44.1
LC_deciduous41.6
LC_marsh2.6
LC_residential_lowmed1.9
P_forest1.3
LC_urbanforest1.0
Forest insectivoreC_ local_forest59.6
LC_deciduous18.6
LC_swamp4.7
C_regional_forest3.7
LC_marsh3.0
LC_residential_lowmed2.3
P_forest2.3
LC_mixedforest1.9
Ground-nestingLC_mixedforest35.9
P_forest26.9
C_local_forest22.5
LC_urbanforest4.9
C_regional_forest3.5
LC_deciduous2.5
LC_swamp1.0
Publisher’s Note: MDPI stays neutral with regard to jurisdictional claims in published maps and institutional affiliations.

